c s a s s c c s - fisheries and oceans...
TRANSCRIPT
ISSN 1499-3848 (Printed)© Her Majesty the Queen in Right of Canada, 2003
© Sa majesté la Reine, Chef du Canada, 2003
C S A SCanadian Science Advisory Secretariat
S C C SSecrétariat canadien de consultation scientifique
Research Document 2003/051 Document de recherche 2003/051
Not to be cited withoutpermission of the authors *
Ne pas citer sansautorisation des auteurs *
Indicators and ‘response’ points formanagement of Fraser River eulachon:A comparison and discussion withrecommendations.
Revue des indicateurs potentiels et despoints de réponse pour la gestion del’eulakane du fleuve Fraser.
D. E. Hay, K.C. West and A. D. Anderson
Fisheries and Oceans CanadaBiological Sciences Branch
Nanaimo, British Columbia V9R 5K6
* This series documents the scientific basis for theevaluation of fisheries resources in Canada. As such,it addresses the issues of the day in the time framesrequired and the documents it contains are notintended as definitive statements on the subjectsaddressed but rather as progress reports on ongoinginvestigations.
* La présente série documente les bases scientifiquesdes évaluations des ressources halieutiques du Canada. Elle traite des problèmes courants selon les échéanciersdictés. Les documents qu’elle contient ne doivent pasêtre considérés comme des énoncés définitifs sur lessujets traités, mais plutôt comme des rapports d’étapesur les études en cours.
Research documents are produced in the officiallanguage in which they are provided to theSecretariat.
This document is available on the Internet at:
Les documents de recherche sont publiés dans la langueofficielle utilisée dans le manuscrit envoyé au Secrétariat.
Ce document est disponible sur l’Internet à:
http://www.dfo-mpo.gc.ca/csas/

ii
ABSTRACT
This report reviews potential indicators and response points for the management of eulachons(Thaleichthys pacificus) in the Fraser River. Concern for the conservation of eulachons in theFraser River peaked in 1994, following poor returns in First Nations and commercial fisheries. This concern prompted field research to estimate spawning biomass and the introduction of fishingclosures and other restrictions. Future management and fisheries require explicit managementplans based on objective criteria - or 'indicators' and ‘response points’ about the status ofspawning stock biomass and fisheries. The main indicator is the spawning stock biomass (SSB)estimated annually (since 1995) from egg and larval surveys. With such a short time series, wewere not able to develop quantitatively explicit response points based on population dynamicmodels. Instead, for the SSB and other indicators defined in this paper, we propose and defineseveral 'response' points that we suggest are both precautionary and biologically realistic. Forinstance, as a response point for the SSB indicator, we explain why a SSB of less than 150tonnes, for 2 consecutive years, could be a response point for conservation. Another indicator isan offshore index of abundance of eulachons estimated during annual shrimp trawl surveys inMay. Offshore biomass estimates include two cohorts from the Fraser and Columbia Rivers. Anoffshore biomass estimate of less than 1000 tonnes in offshore waters could be a response pointfor concern about Fraser River eulachon fisheries. Another indicator is catch data from ColumbiaRiver fisheries. Columbia River eulachon spawn mainly in January and February, about fourmonths earlier than Fraser River eulachons. In most years, a cumulative annual catch of less than500 tonnes in the Columbia could be cause for conservation concern, and therefore a responsepoint, for the spawning run in the Fraser River. Test fishery data, collected for seven years since1995 provides a potential response point that may be useful for 'in-season' managementdecisions. The utility of these test fishery data as an indictor, however, remains to bedemonstrated. The comparison of test fishery catches with SSB estimates is promising but yet notconvincing. Nevertheless, we discuss some potential response points related to test fishery data. We suggest that there are no firm biological criteria, or sufficient biological information to set a'biological' quota, but the long term catch history of the Fraser has often seen catches in excess ofseveral hundred tonnes. We do not recommend such catch levels be set at the present time butpoint out that annual catch levels in the commercial fishery since 1980 have been about 20 tonnes,for a total removal of about 30 tonnes. The combined removals from other sources (First Nationsand recreational catches) may have been another 10 tonnes (although this last estimate is veryrough). Therefore under normal conditions the Fraser River probably has a spawning biomass ofabout 500-1000 tonnes so removal of 30 tonnes would constitute an annual catch rate about threeto six percent. We suggest that such a removal is sustainable. An unresolved issue, beyond thescope of the present paper, is the potential removal of Fraser River eulachons as bycatch inoffshore trawl fisheries.

iii
RÉSUMÉ
Ce rapport comporte une revue des indicateurs potentiels et des points de réponse pour la gestionde l’eulakane (Thaleichthys pacificus) du fleuve Fraser. Les préoccupations que suscitait laconservation de ce stock ont atteint un pic en 1994 à la lumière des faibles prises autochtones etcommerciales. Cela a entraîné des recherches sur le terrain en vue d’estimer la biomasse desreproducteurs et l’introduction de restrictions incluant la fermeture de pêcheries. La gestion futuredes pêches requiert des plans explicites de gestion reposant sur des critères objectifs - ou desindicateurs et des points de réponse quant à l’état de la biomasse du stock reproducteur et despêches. L’indicateur principal est la biomasse du stock reproducteur (BSS), estimée annuellementdepuis 1995 par le biais de relevés des oeufs et des larves. Avec une série chronologique dedonnées aussi courte, il nous a été impossible d’établir des points de réponse explicites au planquantitatif reposant sur des modèles de la dynamique des populations. Au lieu de cela, nousproposons et définissons, pour la BSS et les autres indicateurs définis dans la présente étude,plusieurs points de réponse que nous considérons comme pratiques et prudents au planbiologique. Par exemple, comme point de réponse pour l’indicateur de la BSS, nous expliquonspourquoi une BSS de moins de 150 tonnes pendant deux années consécutives pourrait être unpoint de réponse pour la conservation. Un autre indicateur est un indice de l’abondance hauturièrede l’eulakane, telle qu’estimée lors des relevés annuels de la crevette au chalut effectués en mai.Les estimations de la biomasse hauturière d’eulakane incluent deux cohortes des fleuves Fraseret Columbia. Une estimation de la biomasse hauturière de moins de 1 000 tonnes pourrait être unpoint de réponse soulevant des préoccupations à l’endroit des pêches de l’eulakane dans leFraser. Les données sur les prises dans le fleuve Columbia sont un autre indicateur. L’eulakanedu Columbia fraye principalement en janvier et en février, soit environ quatre mois avantl’eulakane du Fraser. Pour la plupart des années, des prises annuelles cumulatives de moins de500 tonnes dans le Columbia pourraient être une source de préoccupations à l’endroit de laconservation et donc servir de point de réponse pour la montaison dans le Fraser. Les donnéesdes pêches expérimentales, collectées pendant sept années depuis 1995, constituent un point deréponse potentiel qui pourrait être utile pour prendre des décisions de gestion en saison. L’utilitéde ces données comme indicateur reste toutefois à démontrer. La comparaison des prises issuesdes pêches expérimentales et des estimations de la BSS est prometteuse mais n’est pas encoreprobante. Néanmoins, nous discutons de quelques points de réponse potentiels liés aux donnéessur les pêches expérimentales. Nous suggérons qu’il n’y ait aucun critère biologique ferme ousuffisamment de données biologiques pour fixer un quota « biologique », mais l’historique desprises dans le Fraser révèle qu’elles ont souvent dépassé plusieurs centaines de tonnes. Nous nerecommandons pas que de tels niveaux de prises soient établis à ce moment-ci mais noussoulignons que les niveaux annuels des prises commerciales depuis 1980 ont atteint environ20 tonnes, ce qui a donné des ponctions totales d’environ 30 tonnes. Les ponctions combinéesd’autres sources (prises autochtones et récréatives) peuvent représenter un autre 10 tonnes(quoique cette dernière estimation soit très approximative). Par conséquent, dans des conditionsnormales, le Fraser abrite probablement une biomasse de reproducteurs d’environ 500 à1 000 tonnes, de sorte que des ponctions de 30 tonnes représenteraient un taux annuel decapture d’environ 3 à 6 %. Nous sommes d’avis que ce niveau de prises est durable. Une questionnon résolue, hors de la portée de la présente étude, est la récolte potentielle d’eulakane du Frasercomme prises accessoires des pêches hauturières au chalut.
1
INTRODUCTION
In recent years the terms 'indicators' and 'reference points' have acquired specific meaningin the context of fisheries management, both within Canada and other nations. WithinFisheries and Oceans Canada, these terms refer to the implementation of 'ObjectiveBased Fisheries Management Plans' (OBFM) and Integrated Fishery Management Plans(IFMP). The requirement for the development of such plans for eulachons (Thaleichthyspacificus) led to the preparation of this report. In this report we apply the term 'indicator' todata or observations related to the state of population abundance of eulachons, either inthe river or the sea. Indicators may consist of a range of values, usually a time series. Within this range of indicators, we identify specific 'response points' (RP) as specific pointsor observations that provide a basis for a decision about fisheries management, such asthe opening of a fishery. We point out, however, that the available data for commenting onFraser River eulachon abundance is limited, so we cannot compute specific RP's basedon population dynamics or statistical models. Instead, we attempt to provide responsepoints based on simple biological criteria, that we call 'judgmental' response points (orresponse point's). While such response point's may lack the statistical rigor, they are notarbitrary and are based both on our best understanding of the biology and history ofeulachon fisheries in the Fraser. Therefore, the response point's should be bothprecautionary and biologically realistic.
The objectives of this report are to describe each potential indicator and then definespecific response points, some of which have already have been applied to Fraser Rivereulachon management but not yet formally described. We compare the independentindicators for as many years as possible. These indicators include; (1) sixty-two years ofannual commercial catch data for the Fraser and Columbia River eulachon fisheries from1941-2002, (2) estimates of spawning stock biomass (SSB) from egg and larval surveys,made annually since 1995; (3) indices of eulachon abundance in offshore waters based onincidental capture of eulachons in annual shrimp surveys conducted since 1973; (4) datafrom an experimental test fishery conducted since 1995 in the Fraser River. We brieflyexamine the relationship of some environmental data to the indicators. Also, we considerthe preliminary results of genetic analyses of offshore eulachons stocks that indicates theriver origin of offshore eulachons.
From these analyses we comment on the efficacy of the indicators and suggestrecommendations for management of Fraser River eulachons. The report begins with abrief description of eulachon life history and eulachon fisheries in the Fraser River. Thenwe describe and compare the indicators and response point. We conclude the report withcomments regarding an annual fishing quota, and make recommendations for futureresearch and management.

2
Eulachon life history
The biology of eulachons was reviewed by Hay and McCarter (2000) in a report thatincluded summaries of known and new information, so we present only a brief overviewhere. Eulachons are members of the smelt family (Osmeridae) and are distributed fromthe southern Bering Sea to northern California, although no spawning runs have beenobserved in California for more than 20 years (Hay and McCarter 2000). Eulachons spawnduring the late winter and spring. The earliest spawning occurs in the Columbia River (thelargest run in the world), in January and February, and the latest in the Fraser (perhapsthe second largest) in April and May. Most populations in northern rivers in BC spawn inMarch and April. There is no clear geographic pattern of spawning times with latitude.
Water temperatures of spawning rivers vary widely, with spawning occurring in the FraserRiver at temperatures exceeding 6 or 7 oC whereas temperatures in northern rivers, whichsometimes are ice-covered during spawning, are much lower. Also, there is little incommon among many of the rivers, with some being small and clear (i.e. the KemanoRiver in northern BC) and others being large and turbid (i.e. the Fraser). What most riversdo have in common, however, is that they mainly have spring freshettes, and drainsnowpacks or glaciers. For instance, there are no regular eulachons runs in rivers thatdrain coastal islands or peninsulas, that mainly have fall freshettes following rains inNovember and December.
Fraser River eulachons are semelparous (die after spawning) with most living for threeyears before spawning and dying (Hay and McCarter 2000). Probably some spawn at agetwo and others at age four or five. At lower latitudes, like southern BC (49o-54o) post-spawning mortality seems to be the rule, although there may be some iteroparity (survivespawning) at higher latitudes, in Alaska. The evidence for semelparity in the Fraser, andother BC rivers, is strong. In the Fraser, and many other rivers, post-spawning mortalitycan be directly observed by floating and beached carcasses of spent fish. Also, we haveconfirmed that eulachons resorb teeth during spawning, and all Fraser fish we haveexamined (thousands) have evidence of substantial tooth loss. Further, we find onlyeulachon with well-developed teeth in the sea, and we also have examined thousands ofthese fish. Finally, the size (standard length) of eulachons in the river constitutes thelargest group of eulachons we see, and they are distinctly larger than marine-capturedeulachons. If any survived spawning, we would expect, but do not, see a few very largemarine eulachons, consistent with size distributions in rivers.
Eulachon fisheries in the Fraser River
A small commercial fishery for eulachons has occurred in the Fraser River since the earlypart of the twentieth century. This is the only river to support a commercial fishery foreulachons in BC, though previously, in the late 1800's and early 1900's, the Nass River, innorthern BC, supported a large commercial fishery. The only other regularly occurringcommercial fishery, on the Pacific Coast, for eulachons is in the Columbia River. In otherparts of BC, eulachons are fished by First Nations in most of the 14 rivers that supportregular runs (Hay and McCarter 2000). Eulachons also are captured as bycatch inoffshore trawl fisheries (Hay et al 1998, 1999). Eulachon stocks declined sharply in theFraser River in 1994. Concerns about the apparently low spawning biomass led to

3
research investigations to estimate spawning biomass and spawning locations and theintroduction of regulations. Rumors of impending management change for eulachons inthe Fraser River prompted a sharp increase in the number of fishers in 1996 to more than70 from an average of 22. The commercial fishery was closed for eulachon in 1997because of the inability to control effort, participation and, to ensure catches stayed withinthe recommended quota. In 1998, a limited entry license regime was initiated in thecommercial eulachon fishery, but due to conservation concerns no fishery took place. There are presently 16 holders of a special commercial eulachon license (ZU) that allowscommercial harvest by gillnet. Each license is held by an individual, who must designate aharvest vessel each year. The designated vessel must be eligible for a commercialvessel-based license. The gillnet may have a maximum length of 275 m and a mesh sizeof between 25 and 50 mm. The license holder is required to hail their catch and otherfishing information within 24 hours of a fishery opening. In addition, the license holder isresponsible by condition of license to provide fish slips reporting landings and value, andlogbooks reporting location (within the Fraser River), effort and catch.
In most years, the fishery has occurred in the lower Fraser River- or in Pacific FisheriesManagement Areas (PFMA) 29-7, 29-9 to 17 which includes all tidal waters below theMission Bridge. Prior to 1995, the commercial eulachon fishery in the Fraser River wasnot restricted to holders of special licenses and fishing times (6 days per week). In 1995the fishery was cut back to 3 days per week with voluntary weekly hails and a mandatorylog book program was started. The commercial fishery in the Fraser River was closed in1997 and remained closed for a five year period reopening in 2002. The commercialfishery in 2002 had a 6 hour opening on May 2.
Recreational fishery catches are not reported on either river. In the Columbia River therecreational catch may be substantial, rivaling the commercial fishery (G. Bargmann, pers.comm). On the Fraser River, the size of the recreational catch is uncertain, but it also maybe substantial. Fishing is in tidal waters, by gillnet (less than 7.5 m in length with a meshsize greater than 25 mm and less than 50 mm) or dipnet. The daily limit has varieddepending on conservation concerns. Recreational fishing was closed from 1998-2000. Itre-opened in 2002, with a daily limit of 5 kg/day between April 2 and May 16, with fishingonly during daylight hours. Then due to increased in-season estimates of abundance fromthe test fishery, the daily limit was increased to 20 kg per day effective May 17. Thehistoric recreational catch limit is 20 kg per day with a possession limit of 40 kg.
There also is a distinct First Nations eulachon fishery in the Fraser River for food, socialand ceremonial purposes. This fishery is managed through a communal Aboriginal fishinglicense which indicates the location, gear and species being harvested. Fishing is by driftgillnet (less than 275 m in length and mesh size between 25 and 50 mm mesh size), setnet or dipnet and harvest opportunities are provided through consultation between theFirst Nations and the Department of Fisheries. The First Nations catch of fish for food,social and ceremonial purposed is monitored and catch data are available for recentyears. Total catches in recent years are small. We suspect that the combined FirstNations and recreational fishery remove about of 10 tonnes annually.

4
METHODS
Indicators and data
As sources of indicators, we collected, examined and analyzed data that were directlyrelated or potentially related to eulachon abundance in the Fraser River. To determine theefficacy of data sets as indicators, and to develop response point's, we examined thetemporal variation in each indicator and when possible, compared temporal trends amongdifferent indicators.
1. Indicator data from egg and larval survey estimates of SSB. The SSB is estimatedas the product of mean egg and larval (e+l) density (n/m3) and river discharge (m3/s) .Details for the estimation of SSB are presented by Hay et al (1997b, 2002) and the dataare summarized in Table 1 (adapted from Hay et al. 2002). For each of a number ofsampling sites on the river, the SSB was estimated as the biomass required to producethe observed e+l density. SSB estimates are made in the two-three months followingspawning. Therefore the value of the SSB estimates, as an 'after-the-fact' estimation ofabundance, has no direct application as an 'indicator' to management of the fishery in thesame year in which the SSB was made. The SSB estimates begin in 1995, and thereforethere are relatively few data points for comparison with other indicator series. Toinvestigate relative usage of different parts of the river for spawning, SSB estimates weremade for several different locations on the Fraser River (Fig. 1). Exact spawninglocations within the river appear to change among years but in general, SSB estimates arelowest in the most upstream locations, above most spawning locations, and greatest in themost downstream location.
For the purposes of the present paper we estimate the total SSB for the entire river, asthe sum of the production for the North and South Arms (Table 2).
2. Indicator data from offshore surveys and biological data of eulachon. Offshoreindices of eulachon abundance were estimated from analysis of bycatch in annual shrimptrawl research surveys conducted off the west coast of Vancouver Island since 1973(Boutillier et al. 1997, Rutherford 2002). The shrimp trawl survey design is based onsystematic sampling of the shrimp grounds with spatial analysis used to provide estimatesof shrimp abundance (Hay et al. 1997a). Eulachon are caught as by-catch in this surveyand the method used to estimate shrimp abundance has also been used to provide andindex of eulachon abundance in the surveyed area. The detailed survey methodology forassessing shrimp stocks is documented in Boutillier et al. (1998) and Martell et al. (2000). Methods of estimating the eulachon biomass index from the survey are described in Hayet al. (1997a). The biomass indices are shown separately for several areas off the westcoast of Vancouver Island: Statistical Areas 124, 125 and the combined areas of 121 and123 (Fig. 2). The later areas are not used as part of the time series index, because theyhave only been surveyed for a few of the last 30 years. The index is not completelyrepresented for both Areas 124 and 125 in all years, so these are treated as two separateindices (i.e. not summed or pooled).

5
Indices of eulachon biomass are available by DFO Statistical Areas (or Pacific FisheryManagement Areas, PFMA) 121/123 for years 1996 to 2002; for Areas 124 for years 1973to 2002, except for 1974, 1984, 1986; and for Area 125 for years 1973 to 2002 except for1974, 1984, 1986, 1989, and 1991 (Table 3).
Prior to 1999 the total catch weight of eulachon taken during the research surveys was theonly biological parameter recorded for eulachon. Commencing in 1999 eulachon werealso sampled for length and a sub-sample of the catch was counted and weighed toestimate an average number per kilogram. Then age composition (Table 4) wasestimated from length frequency analysis of data from all the tows within a managementarea Rutherford (2002).
Age determination from conventional scale or otolith analysis has been difficult becausetrawl-captured eulachons have no scales and otoliths have not been reliable (Hay andMcCarter 2000). In recent years, size mode analysis of the eulachon catches (Fig. 3) hasallowed a distinction between several putative age groups, and a separate biomassestimate of each age group (Tables 4). The size composition of eulachons from the seaconsists of two main modes, which we believe top represent age 1+ and age 2+respectively (Fig. 3). When observed during annual May-shrimp surveys, these eulachonswould be about 14 and 26 months of age respectively. The largest size modecorresponds to the size modes observed in spawning rivers. Although there are alwaystwo distinct modes each year, the size distributions change rapidly within years (fromgrowth) and they differ between years, indicating that there are substantial inter-annualdifferences in growth rate, perhaps in response to changing trophic conditions in the sea. From Table 5 we note that both the offshore biomass and the percentage of age 2+ fish,(from the 2000 cohort) in 2002 is unprecedented in the time series. It will be interesting tosee if this (apparently) exceptionally strong cohort appears in the Columbia and FraserRivers, as an exceptionally strong spawning run, in 2003)
3. Catches from the Fraser and Columbia Rivers as an indicator data. Catch datafrom commercial fisheries in the Fraser River (Ricker at al. 1954) and Columbia River(Anon. 1993) have been collected since the 1930's (Table 3). In the Columbia Riverannual trends in catch data probably are roughly representative of trends in abundance, atleast until the 1990's when catch restrictions were imposed (Hay and McCarter 2000). Inthe Fraser River, however, trends in catch data may vary widely from trends in abundance,probably for most of the last four decades. Instead catch data probably reflects manyfactors other than abundance, including limited markets, incomplete reporting of catch,changing spawning areas (Hay et al. 2002), and occasional suspensions of fishingimposed by the Department of Fisheries for conservation purposes (D. Stacey,pers.comm.). Further, changes in spawning habitat, related to nearshore industrialdevelopments, dredging, and pollution (i.e. Rogers et al. 1990) also may have affectedspawning distribution, and catches.
4. Fraser River test fishery data as a potential indicator. Systematic catches in theNew Westminster test fishery have been conducted in the Fraser River since 1995, except1999 (Table 6). The catches are made daily using identical gillnet gear (mesh size 3.18cm or 1.25 inches, 50 fathoms or 92 m long and 380 meshes deep, fished at the samelocation ( New Westminster), for the same duration (15 minutes), and at the same stage of

6
tide (low slack at New Westminster). All of the catch was sorted by sex, counted, weighedand a biological sample is taken for further analysis. Catch numbers are provided to DFOdaily with detailed datasheets submitted weekly.
5. Other data relevant to indicators and response points. (a) Following Hay et al1997a, who considered variation in the offshore index, and trends in Fraser and ColumbiaRiver catches, we also have used temperature data collected annually from the DFO-operated lighthouse at Amphitrite Point, near Barkley Sound, on the west coast ofVancouver Island. (b) We present brief summaries of preliminary genetic analyses on theriver origin (mainly Columbia and Fraser River eulachons) of samples taken in watersoffshore of the west coast of Vancouver Island.
Data analyses
Simple time series plots, scatterplots and correlation analyses were used to comparetemporal trends in different indicators, although there was only a short temporal durationfor some of the series. We compare and contrast the temporal data between Fraser andColumbia River catches. We also compare these catch data from each river with offshoreindices (~30-year time series from 1973-2002). We compare the between-year temporaltrends in the test fishery data with the SSB estimates. We compare the Fraser River SSB(8-year time series from 1995-2002) with offshore indices, and consider the effects ofmonthly changes in mean sea-surface temperature.
Although the utility of the test fishery data is still uncertain, we examine the 'within-season'or within-year changes in catch rate to determine if daily catch rates, especially during theearly part of the spawning period, could be useful as potential 'in-season' indicators. Weestimated the annual 'cumulative' test fishery catches (Table 7) in an attempt to identifyany specific response points applicable to in-season management (i.e. setting catch levelsor rates according to the apparent abundance as judged 'within the spawning season)'.
We used information from recently acquired but unpublished genetic analyses (T.Beacham, pers. comm.), on the composition, by river of origin, of eulachons taken fromwaters offshore of the west coast of Vancouver Island
RESULTS
Temporal trends in the indicators
1. Spawning stock biomass (SSB) in the Fraser River - variation in time and space. The surveys indicate that the spawning sites vary annually in the river: some years more isin upstream areas (Table 1). It follows that SSB estimates were usually lower in upstreamlocations, so the most complete SSB estimates are from downstream survey locations. The Fraser River divides into the north and south arms at New Westminster. Hay et al.(2002) showed that spawning was greater on the north side of the river. This presents aminor problem because the SSB must then represent a sum of the estimates from botharms, but the estimates of sampling error vary in each location. Therefore SSB estimatesused here are based on all samples combined for the south ('SARM') and north ('NARM')arms respectively (Table 2). A plot of the total Fraser River SSB shows substantial
7
variation between 1995 and 2002 (Fig. 4), with lowest years between 1997, 1998 and2000. The lowest year was 1997, with a SSB estimate of less than 80 tonnes.
As an indicator, a year with a low SSB (i.e., <150 tonnes) should not necessarily be causefor fisheries management action, such a closure or catch restriction, in the next year. Weunderstand that in most years, there are at least three eulachon cohorts present in thepopulation. We also know that osmerid species such a eulachons are subject toconsiderable interannual fluctuations. Therefore, we suggest that a SSB estimate < 150tonnes would be cause for management caution, not alarm. Using the example of a trafficlight, where a green light signals an advance, a yellow light signals an advance but slowerand with caution and a red light signals a full stop, then a single year with a low SSB couldbe seen as a yellow indicator. Two sequential years with a low SSB, however, wouldrepresent a red light - a full stoppage of all removals.
2. Annual variation in Columbia and Fraser River catches. In 1994 the apparentabundance of eulachons in the Fraser River was lower than most previous years (anobservation first made by commercial fishers who brought this to the attention of Fisheriesand Oceans, in a series of meetings). The commercial eulachon fishery was closed in theFraser River for a five year period 1997-2001 inclusive. Compared to the 1940's and1950's Fraser River catches declined in the 1960's and 1970's and remained lowthroughout the 1980's and 1990's (Fig. 5A). In contrast to the Fraser, Columbia Rivercatches remained high throughout the 1970's and 1980's (Fig 5B). There were someyears, such as 1983, when Columbia River catches were low (Table 3) and also someperiods of fluctuations throughout the time series. Explanations for the low 1983 catchhave included negative impacts of ash in spawning areas following the 1983 Mount St.Helen volcanic eruption (Hay et al 1997a). There also was a strong el Nino event in thesame year, however, so it is difficult to rule out explanations associated with the marineenvironment. Given the variation in Fraser River commercial catch data, it is unlikely thatthey are useful as an indicator of past trends in abundance. On the other hand, therelative magnitude of catches in the 1940's and 1950's may provide an approximateresponse point for determining present and future catch levels. Specifically, catch levelsfor much of the 1980's and 1990s was about 20 tonnes and this appeared to be sustainedover several decades.
3. Annual and spatial variation in offshore biomass indices. From 1973 to 1993 theeulachon index in Statistical Areas 124 and 125 was variable and without trend. From1994 to 1999 eulachon abundance was at a low level in all the areas surveyed. Eulachonabundance increased sharply in most areas in 2000 and all areas were at record highlevels in 2002. The biomass index for Statistical Area 124 fluctuated between low levels(<100 tonnes) and nearly 2000 tonnes between 1973 and the early 1990's, when itdeclined sharply (Fig. 6A). It remained low though much of the 1990's but increasedsharply in 2000, and the increase has continued into 2002, to unprecedented high levels.The sharp decline in 1983 stands out as a year when offshore abundance may have beenaffected by the strong El Nino conditions. The offshore index in Statistical Area 125follows a roughly similar trend although the estimated biomass in most years between1973 and 1993 is lower (< 1000 t). Like Area 124, Area 125 (Fig. 6B) has increasedrecently, but the sharp increase did not occur until 2002.

8
4. Variation in age composition and origin of offshore eulachons. Approximate agedetermination of offshore eulachons started in 1999, based on the distinct size modesseen in length frequency data (Hay and McCarter. 2000). From this method, the size (orage) modes of offshore samples have been identified since 1999. From this approach, theestimated numbers and proportions of eulachons in the two main age categories wereestimates for all areas (Tables 4, 5). In most years, most of the eulachons are in the sizemode corresponding to eulachons ages at 2+ years. Because these fish were captured inMay, and because most probably hatched between March (in Columbia River) and April orMay (in Fraser River), most are between 24 and 27 months of age. Most eulachonsappear to spawn at age 3, so the larger size mode would correspond to the spawning fishin the next spring, following the survey. It follows that if reliable estimates of the relativeabundance of age 2+ eulachons can be estimated in year n, in offshore waters, this wouldbe a useful indicator of future spawning abundance in year n+1. The difficulty with suchan estimate however, is that we are uncertain of the origin, or destination of eulachonscaught in offshore waters. This uncertainty may be resolved with genetic analysis thatindicates the river origin of eulachon in offshore waters,
Preliminary analysis of offshore mixed-stock samples, based on comparisons of geneticsamples from most of the larger rivers in BC, indicates that eulachons on the west coast ofVancouver Island consist of approximately 60 percent Columbia River fish and 40 percentFraser River fish. These estimates, however, are preliminary and could change in otheryears or with further samples and analysis. The dissection of the offshore index toaccount for variation of age structure and river origin shows that the offshore index has thepotential to be both useful, and misleading. If the years with a high index consisted mainlyare age 1+ fish, then we may not expect to see any correspondence between the indexand SSB (or catches) in the next year in rivers. On the other hand, the systematiccollection of data on size (or age) and genetic composition could provide a precise andaccurate indicator for spawning abundance in the Fraser River, and perhaps other rivers.
5. Temporal trends in the test fishery data. The start and finish dates of the test fishingvary slightly among years, the duration of the test-fishing activity has included the mainspawning runs. In general, the earliest fishing days begin approximately in Julian Day 80(March 21) and extend about 9 weeks until Julian Day 143 (about May 23). Directcomparison of the catches among years indicates that (1) in some years catches occurearlier than others; (2) sometimes there appears to be several periods (or waves) of highcatches punctuated by periods with lower catches; (3) total (or cumulative) catches insome years are much greater than other years. The cumulative catch is compared amongall years in Fig. 7. No test fishery was conducted in 1999.

9
Comparison and contrast among the indicator data
1. Comparison of the Fraser and Columbia River catches. Although there is nosignificant correlation between Fraser River and Columbia River catches, we see thatwhen the Columbia River catches are high Fraser River catches often are low, (seesquare symbols in Fig. 8). Therefore, high catches in the Columbia (i.e. high SSB) do notprovide assurance that there would be high catches (i.e. SSB) in the Fraser River. Moreimportantly, however, in all years when Columbia River catches were low (<500 tonnes),indicated by the points to the left of the vertical dotted line in Fig 8., the Fraser Rivercatches also were low . Therefore, low catches in the Columbia River, where spawningand fishing occurs in January and February, may provide a rough but useful indicator ofyears with low SSB in the Fraser. For this reason, we suggest that catches less than 500tonnes in the Columbia River could serve as a useful response point for pre-season FraserRiver management. Of course, this would be subject to annual confirmation from U.S.sources that low catches are not a product of specific management restrictions.
2. Comparison of offshore surveys and Fraser and Columbia River catches. Hay etal. (1997) noted that the offshore biomass index was positively and significantly correlatedwith Columbia River catches (Fig 9A, B). The offshore biomass estimation techniquesused in the 1997 report have been modified slightly in recent years (as per Table 3) butthe positive covariance between the Columbia River and offshore indices remains,although only for the offshore biomass index from Statistical Area 124. There is, however,no apparent relationship between the offshore biomass indices and Fraser River catches(Fig. 10A, B). This precludes the use of the offshore biomass index as a direct predictor ofFraser River biomass. We caution, that this lack or correspondence (Fig.10) is based on acomparison of estimated offshore 'biomass' (which includes two separate age groups) andwhich is made at a time which is one or two years prior to the time when these same fishwould be able to spawn in the Fraser, if that were their ultimate spawning destination. Wealso reiterate that that the Fraser River catch data are not necessarily accurate. For thesereasons we cannot conclude that here is no meaningful relationship between the observedoffshore biomass and Fraser River SSB, but we can conclude the data are insufficient toallow us to use the offshore biomass as a direct pre-season indicator of Fraser River SSB. On the other hand, a correlation matrix between Columbia and Fraser River catches andthe offshore biomass index, indicates a significant positive relationship between offshorebiomass and the Columbia River (Table 8.)
3. Sea surface temperature and Fraser catches. Hay et al. (1997a) noted a significantnegative relationship between SST and Fraser River catches and this relationship isconfirmed here (Table 9). Specifically, Fraser River catches were higher when SST waslower. Probably this is spurious because in recent years there have been trends for SST toincrease and for eulachon biomass to decrease. Such trends may occur independently sothe significant correlation between these factors is not evidence of any functionalrelationship between these variables. There is no significant correlation between monthlySST and offshore biomass, or between SST and Columbia River catches (Table 9).
4. SSB and Offshore biomass. The offshore biomass also can be compared with themuch shorter data series of SSB, from egg and larval surveys (Fig. 11). There is noapparent covariance in the comparison of eight years of data, but the year 1996 is of

10
special interest. This year (1996) had an exceptionally large SSB estimate of about ~1900tonnes (Table 2) but the offshore biomass index was not exceptional. This indicates thatthe offshore biomass estimates may not always apply to Fraser River fish. There are someyears when the offshore biomass is low, and the Fraser appears to be relatively high, andvice versa. Nevertheless, the lack of a meaningful relationship may be more attributableto the inadequacies of the data, and when faced with insufficient information formanagement of the Fraser River, it is reassuring to know that eulachons are present inoffshore waters. We also note that in the years when the offshore biomass index was verylow (approximately between 1995 and 1999) the Fraser River catches also were low - withthe exception of 1996. Therefore very low estimates of offshore eulachon abundance (asobserved between 1995 and 1999 (excluding 1996) would be sufficient cause forrestricting catches on the Fraser. We suggest that an index of less than 500 tonnes (whichoccurs in 6 of the 27 years) would be sufficient to implement fishing restrictions - and wesuggest that this could be a response point. Such a point would be subject to revision, ifthe quantification methods for the offshore index were revised.
5. Comparison of the test fishery data with catch, offshore and SSB dataThe test fishery data (Table 2) is highly correlated with the total Fraser River SSB (r =0.962, p = 0.001) and with the SSB estimated for the South Arm (SARM) (Fig. 12). Theserelationship are based only on seven points, and the high significance is dependent onlyon the 1996 data point. We also compared the test fishery data and SSB estimates atother locations in the river. There are no significant relationships between the test fisherydata (cumulative annual totals) and other SSB estimates (from Table 2). The correlationcoefficients (r) and probability levels (p) are, for each area shown in Table 2 are as follows:
(i) Barnston Island r = -0.020 p = 0.920(ii) New Westminster r = 0.015 p = 0.992(iii) SARM r = 0.962 p = 0.001(iv) NARM r = 0.993 p = 0.007(v) Total r = 0.964 p = 0.001
Significant correlations occur only when the South Arm SSB data are included in theanalyses. If the 1996 test fishery data point is removed then none of the correlationsbetween the test fishery and the SSB are significant.
The test fishery occurs approximately at the New Westminster site (Fig. 1) but the year inthe which the high test fishery catches were made, most of the spawning occurred belowNew Westminster (Hay et al 2002). Therefore, while we do not necessarily challenge theapparent close relationship between the test fishery and the SSB, there are someuncertainties associated with data - but such concern about the apparent fine-scaledifference between the location of the test fishery and the apparent location of spawndeposition, may be unwarranted. Recent work in Alaska, that has examined eulachonmovements in spawning rivers using radio tags, has found that eulachons are very activeprior to spawning, and move extensively up- and down stream (Kitto 2002). Therefore ifthe same eulachons pre-spawning behaviour applies in the Fraser River, the specificlocations of the test fishery, relative to spawning sites, may be inconsequential.
The main value of the test -fishery data would be as an 'in-season' estimator whereby theresults of the survey would be immediately evaluated and incorporated into pre-

11
determined management schedules. Aside from the uncertain validity of such anapproach, the successful application depends on the temporal pattern of the data, as theyare being collected. Specifically, to be used successfully, the test fishery data must bedistributed in time so the earlier part of the data, is somehow indicative of the latter part. Asimple examination of the data in Tables 6 and 7 reveals that the test catches occur earlyin some years, and later in others (Fig. 13). In some years the catches tend to peak earlyand then slowly decline, and in other years, they begin slow and stop suddenly. In anattempt to further understand annual variation in the test fishery data, we examined dailyvariation in (i) tidal variation, and (ii) temporal patterns in Fraser River discharge (in m3/s),from Hope, (Hay et al. 2002).and (iii) variation in daily temperature as measured at the NWsite for a few of the years. We do not report these analyses here, however because therewere no clear relationships between one or more variables, and patterns of test fisherycatches. We suggest that the utilization of test fishery data should proceed cautiouslybecause we cannot confirm that the test fishery data varies with eulachon SSB. Weacknowledge the significant correlation relationship between the test fishery data and theSSB estimates (Fig. 12) but reiterate that the relationship consists only of seven pointsand the significance is dependent on a single data point.
From examination of the temporal relationship between test fishery relationship (Fig. 13), itseems clear that the SSB in the two lowest years (1997 and 1998) was too low to supportfisheries. In both years the cumulative test fishery catches were below 5000 pieces (Table7). Therefore, if test fishery data were to be used for in-season response point's, there aretwo which can be identified. One is that there should be a minimum catch level beforefisheries are considered, and this could be a cumulative catch of 5000 fish. From Table 7,such a catch failed to occur only in two years, 1997 and 1998. This could be regarded asan in-season response point that for a 'start' to a fishery, perhaps at a reduced scale. Asecond point, say 10000 fish, could be used to establish a point where fishing would occurup to some pre-determined point.
We caution against using the test fishery data as anything but a guide to (a) whetherfisheries open and (b) the dates on which they open and (c) perhaps some step-function,that related pre-determined catch ceilings to the amount of fish in the test fishery (i.e. 5000pieces is a start, and 10000 is fully open, with a total allowable catch (TAC) in place. Asuggested format is presented (Fig. 13) as the cumulative test fishery catch, for 6 years,relative to the day of the year (DOY). In two of the years, the cumulative catch did notreach 5000 pieces, so in such years, the fishery would not open and remain closed for theseason. While we suggest that the test-fishery data may be useful as a precautionaryindicator, the evidence that the test fishery results are related to SSB is not yet convincing.
12
DISCUSSION
Implementation of the OBFM and IFMP for eulachon
Since 1997 the commercial fishery for eulachon on the Fraser River has been changed toa limited entry fishery that currently has 16 licenses. With the application of aprecautionary approach, through the formulation and implementation of Objective BasedFishery Management (OBFM) and an Integrated Fisheries Management Plan (IFMP), thecommercial fishery could be closed if some combination of pre-season, or in-seasonindicators cannot rule out conservation concern. Using this approach the in-season NewWestminster test fishery could be a vital component for management of Fraser Rivereulachon fisheries. A problem with this approach, however, is that the test fishery datahave not yet been shown to be either reliable or sensitive to the wide range in SSB seenthrough egg and larval surveys. It is possible that the test fishery data is reasonablysensitive to low SSB conditions. Therefore setting a predetermined minimum level of testfishery catch (say 5000 pieces) before a partial opening and 10000 before a full opening,established such levels as 'reference' points. A logistical and ethical concern, however, isthat the fishing season is very short, only a few weeks in most years, so extensive delaysin achieving such a test-fishery-based response point is the time required to meet it. Iffishing operations are to proceed, it usually takes time and costs for fishers to prepare, soit would be unfair to announce openings without some form of earlier identification aboutthe likelihood of a fishery. For this reason we suggest that the different forms of responsepoint's be developed sequentially.
Integrated response points: suggestion for sequential implementation.
The first sequential (pre-season) response point: SSB in year n-1. The earliest 'pre-season' response point could actually be the SSB estimate from the previous year. In thissense, and given the three-year life cycle of eulachons (Hay et al 2002) we suggest thatfishery openings in any year would not be expected if the SSB in the previous two yearswas below a fixed 'response point. For the Fraser River, we suggest that this level be setat 150 tonnes. This is slightly greater that the approximate biomass estimates observedduring the lowest years of the 1990's (1997, 1998 and 2000- Table 2). Therefore if theSSB in two consecutive years was less than 150 tonnes, we suggest that no fishery wouldoccur in the next year, regardless of other indicators. This estimate could be available byabout October of each year.
The second sequential (pre-season) response point: offshore biomass. There is nodirect relationship between offshore biomass and Fraser River commercial catches (basedon the historical time series of catch data) but it would be unwarranted to dismiss theprobable connection between the abundance of eulachons in offshore marine waters andthe size of the Fraser River SSB. Indeed, the reason such an apparent relationship maynot appear to exist is that the offshore surveys if they encounter a mixture of ColumbiaRiver and Fraser River eulachons. Preliminary analyses of the genetics of mixed stock,from the lower east coast of Vancouver Island (Fig. 1) indicates they consist of about 60%Columbia River fish and 40% Fraser River fish (T. Beacham, pers. comm). Therefore, itfollows that if there is a change between these two populations, such that one is lower, thepercent composition of offshore eulachons may change. For instance, we observed a very
13
high SSB in the Fraser in 1996 (~1800 tonnes), but there was no correspondingabundance observed in offshore waters. Was this an error in the SSB estimates, or in theoffshore survey estimates? Clearly we cannot rule out error in either estimate but analternate explanation is that the in 1996 eulachons from the Columbia River were relativelyless abundant than in previous years, so the total biomass index would have been lower,because it consisted mainly of Fraser River fish. This is speculation but we point out theapparent negative correlation between SST and Fraser River eulachon commercial catchsuggests that the populations of each river may respond differently to environmentalchange. Even with these uncertainties, precautionary management should require someminimal level of eulachons in the offshore biomass index and we suggest that this level beset at 1000 tonnes. Based on the offshore time series, such a limit (i.e. reference point)would have warranted a fishery closure for all years between 1994 and 1999. With futurework, this limit could become more refined and explicit. Specifically, we advise that theestimation of age-specific numbers (and biomass), as per Table 3) will allow forpartitioning of the offshore biomass into two groups, age 1+ and 2+, of which the age 2+are the expected spawners in the next year. We also suggest that better estimates ofmixed stock composition through genetic analyses, could allow some partitioning of thebiomass that is expected to spawn in the Columbia and the Fraser. As a functionalreference point, this estimate is available in about June of each year.
The third sequential (pre-season) response point: the Columbia River catches. Assuggested above, based on the available data, the Columbia River catch is not correlatedto Fraser River catches, although in most years when Columbia catches were low, theFraser River catches also were low. A useful limit is 500 tonnes, so that if the ColumbiaRiver catches were less than 500 tonnes, this would be a response point for considerationof a closure of the Fraser River. This estimate is available in about February or March ofeach year, several months prior to the Fraser spawning time. A potential concern forutilization of this estimate, however, is that it is subject to sources of variation (such aslocal markets or adverse weather) and quantification techniques that are not necessarilyavailable for review. Therefore we suggest that the implementation of such a responsepoint would be at the discretion of the Fraser River managers.
The fourth sequential (in-season) response point: the test fishery. As explainedabove, the test fishery has only been operational for 7 years, and the accuracy of the data,as a guide to the state of the SSB is uncertain. We reiterate that data gathered to date donot appear to sensitive to the wide changes in spawning abundance that we observedthrough egg and larval surveys, especially at low levels of abundance. Therefore, theappearance of a highly significant correlation between the test fishery and the larval-basedSSB is dependent only on the data from one extreme year (1996) when both the SSB andcumulative test fishery catch was very high. Therefore we advise that a predeterminedminimum level of test fishery cumulative catch of 5000 pieces could be a response pointrequirement for a partial opening and test fishery cumulative catch of 10000 before a fullopening, could be established such levels as 'reference' points.
Resolution of conflicting indicators. Probably, one or more of the indicators in anyspecific year may contradict the others. In such an instance there must be a mechanismfor resolution of which indicators are most important, and the risks associated with eitherrecognizing or ignoring an indicator. For instance, offshore abundance of eulachons
14
would appear to be an especially useful indicator, but we note that a very large runoccurred in the Fraser River in 1996, a year when the offshore abundance we apparentlylow. The Columbia River catch, as an indicator, is only useful if the catch reflectsabundance in that river, and not a reflection of management changes practices in thatriver. We have already described limitations in the test fishery data, and we consider itonly as a potential indicator. The SSB estimates can only be estimated well after thefishery, so SSB estimates from the previous year have little information about future years.
If all of the indicators - or response points - point in the same direction (i.e. all indicatingdownward or upwards trends) then management decisions would be relatively simple. Management decisions would be more complex and difficult if the signals are mixed. Resolution of 'mixed' signals, however, can be assisted by consideration of decision rulesthat anticipate some of the combinations of possibilities that could arise. For instance, wesuggest that there are actually four distinct 'pre-season' response points described in thepreceding sections.
1. SSB < 150 tonnes for one year;2. SSB < 150 tonnes for two consecutive years;3. Offshore biomass < 1000 tonnes;4. Columbia River catch < 500 tonnes
There are at least two potential 'in-season' indicators that might be used.
5. Test fishery returns < 5000 pieces6. Test fishery results < 10000 pieces
In addition to the indicators, there are many different potential management responses oroptions. Two obvious options are (1) a full fishery, and (2) no fishery. A third option issome form of partial fishery, and such an option may be appropriate during those timeswhen the indicators are mixed. We have attempted to illustrate these options, relative tonine different combinations pre-season indicators (Table 11). In this table we suggest thatthe test fishery results may be most useful when there are one or more conflicting signals. In general, when there are two or more indicators that indicate caution, we advise that thefishery be stopped, or perhaps reduced in scale (i.e. a partial fishery). The decisionscenarios indicated in Table 10 are only provided as an example of the process that mightbe considered at the present time. Probably all the response points would requiremodification with future information. Also, there could be reason to consider newindicators, or reconsideration of some of the indicators identified here.
15
Precautionary catch levels for the Fraser River
Readers may have noticed that we presented our analyses, descriptions and analyses ofindicators and response points without any mention of the recommended catch levels. This omission was deliberate, because we have no biological basis for recommendingbiologically sustainable catches except by referring to past catch levels. In theory, catchrates or quotas for management of Pacific herring, or other species, establish catch levelsthat consider the size of the spawning stock biomass, age structure and biologicalcapability of the population to replenish itself. Increasingly, new considerations areconsidered, such as the role of the species as prey for other species, and suchrequirements will compete for fish with other users. For eulachons, we do not haveenough information to suggest catches based on biological criteria, but we suggest thatthe past levels of catches from the Fraser, especially in the 1980's and 1990's may be auseful guide. Specifically a commercial catch of about 20 tonnes occurred for severaldecades in the 1970's and 1980's, and that this level probably was accompanied by a FirstNations and recreational catches of uncertain magnitude but perhaps the combinedcatches from all 'in-river' removals was as high as 40 tonnes.
The preceding discussion does not account for the removals by the offshore shrimp trawlfleet, as bycatch. The specific impact of the offshore shrimp bycatch on Fraser River SSBis difficult to quantify with precision, because (i) based on recent (preliminary geneticanalysis) some of the fish offshore fish are of Columbia River origin and (ii) the offshorebiomass consists of two cohorts - age 1+ and age 2+. It is only the age 2+ cohort thatwould contribute to the Fraser River SSB in the spring (April and May) of year following theyear of removal as bycatch. In recent years DFO shrimp fisheries managers have alloweda maximal bycatch of 40 tonnes, although such a level has only been met in one year. The approximate mean weight of individual eulachon in the age 1+ cohort, during theperiod of the annual offshore surveys is May, about 3-6 g. The mean wt of age 2+eulachons is about 25-35 g - almost ten times greater. Consequently, in most years, most(~80-90%) of the offshore biomass is made up of the age 2+ cohort, even when thenumbers and proportion of age 1+ eulachons is high. Therefore, if 40 percent of themaximal offshore bycatch were Fraser River fish, and if 90% of the biomass were from theage 2+ cohort, the maximal reduction in SSB from offshore bycatch would be about 37%or 14.4 tonnes. In most years, when the maximal bycatch were less than 40 tonnes, thereduction of Fraser River SSB would be much less. On the other hand, if the maximalallowable bycatch were increased, there would be a direct reduction of Fraser River SSBin the next year.
Clearly there is a resource conflict between demands for eulachons as a catch of a targetspecies in the river and as an avoidable bycatch species in offshore trawl fisheries. Suchfisheries have the potential to catch more eulachons than any other Fraser River eulachonfisheries. In future years we anticipate that there will be pressure to allow some level ofeulachons bycatch in the shrimp fishery as well as allow for in-river removals, especially insupport of First Nation fisheries. Resolution of such a conflict between competing usergroups is beyond the scope of this report. We suggest, however, that future resolutionwould be assisted with better information about the genetic structure of offshore stocks:specifically we suggest obtaining more genetic information on stock mixtures, and

16
especially if the proportion of Fraser River fish varies spatially or temporally in offshoreareas.
Summary
Efficacy of assessment indicators, response points and application to fisherymanagement.
The four available assessment indicators and the analysis undertaken have beendescribed in the preceding sections. The suggestion for the sequential implementation ofthese assessment indicators combined with response points has also been described.This section will comment on the efficacy of those indicators and the utility of responsepoints in the application to fishery management regime. (Table 10)
IndicatorsThe biomass indicators are measures of the state of the annual population abundance thatwill return to the spawning and fishing areas, in this case the Fraser River. The indicatorsare classified as to those providing information prior, during and after the fishing season(pre, in or post-season).
Response PointsThe response points identify varying levels of stock abundance at which different fisherymanagement actions would occur to achieve conservation and varying degrees of catchremovals. The response points identify the prioritized usage of the fish resource, rangingfrom conservation as the first priority, food social and ceremonial catches for First Nationsand then varying levels of recreational and commercial catches.
Fishery Management RegimeThis is the method of governance, through fishery management actions, that provides forthe annual requirements of conservation and utilization. The characteristic of a regime isthat of prescribed responses for fishery management to identified levels of stockabundance. The capabilities of the assessment and fishery processes need to becompatible. That is, a simplistic assessment capability would yield a simplistic fisherymanagement regime. A complex fishery management regime would need a rigorousassessment system. A rigorous assessment would provide increased efficacy in theapplication of indicators and response points in the fishery management regime. Thisinformation is arrayed in summary in Table 10.
Conclusions 1. The correlation of Fraser River Test Fishery to that of spawning biomass is dependent
on one year in a data set of seven years. 2. Each of the four Indicators is limited by their short time series. 3. Estimates from the four indicators may be improved by the collection of data for
additional years. As well, some indicators such as the offshore biomass may be furtherimproved with additional data such as age and stock composition.
17
4. The indicators, used separately, have limited capability to forecast/estimate the
returning biomass and as such have limited utility in their application in potential fisherymanagement responses.
5. The indicators, when used sequentially, may yield an increased capability to
forecast/estimate the returning abundance.
Recommendations for management
1. A series of indicators with sequential response points may provide a basis for eulachonmanagement in the Fraser River. Fraser River eulachon fisheries should be managedwith reference to only occur when the following conditions (response points) are achieved:
(i) A SSB of less than 150 tonnes, for the previous year (but not for two consecutive years)would be a precautionary indicator, and the impact on fisheries would depend ontrends in other indicators. Even though this SSB estimate is an 'after-the-factestimate', or a 'post-season' indicator, when the SSB is as low as 150 tonnes, thisshould be regarded as a 'pre-season' indicator for the next year. This responsepoint can be determined by about October of each year.
(ii) A related response point is the SSB from two previous years. A point where the SSB isless than 150 tonnes for two consecutive years should be considered as a criticalresponse point and a conservation concern. No fisheries should occur in thesubsequent year. This would represent a 'worst case scenario' and probably notoccur frequently. This response point can be determined by about October of eachyear.
(iii) An offshore biomass index of less than 1000 tonnes (summed from Statistical Areas124 and 125) is a pre-season indicator. The impact of this measure, whenconsidered with other indicators, could sometimes result in the suspension offishing activity, when eulachon stocks actually are plentiful, although based on thereview of the offshore indices, this would not happen often. Rather the effect, had itbeen implemented, would have been to impact fishing for 9 of the last 26 years(excluding 2002), and all years between 1994 and 2000 when biomass indiceswere low.
(iv) Consider restrictions on fishing if the Columbia River catch indicator is less than 500tonnes. The degree of restriction would depend on trends with other indicators. Thisis a not an especially conservative response point, because before 1994, therewere very few years where such a response point would apply. Such a responsepoint would be dependent on estimation procedures made in other jurisdictions, sowe advise that managers should consider such a point as having more flexibilitythan others.
(v) If the previous indicators were positive, as would happen in many years, then a fisherycould occur without dependence on in-season results of test fishery. On the otherhand, if one or more of the previous indicators is not positive, then the test fishery

18
results could be used to make 'in-season' decisions about the scale of catches - or'partial' fisheries. Here we suggest implementation of two response points basedon the rate of cumulative catches. First, suspension of all fishing activity mightoccur until the test fishery has accumulated a minimum of 5000 pieces, but oncethis is achieved, a partial fishery could open. 'Partial' could be a catch of no morethan 50 % of an annual fixed quota (see below). Once the test fishery had captured10000 pieces, then the full quota might be taken. In this regard, we advise that thetime required to catch either 5000 or 10000 pieces varies among years, perhapsvarying with environmental conditions. At the present time, we do not understandwhat determines the timing and duration of a spawning run, so it would beimpractical to attempt to imbed dates (relative to cumulative catches in the testfishery) into the OBFM or IFMP.
2. In the absence of specific biological criteria about the size of the spawning stock priorto a fishery , and when all indicators are positive, an annual catch of 40 tonnes for allusers (and which in the 1970's and 1980's about 20 tonnes was taken by a commercialfishery) could be sustained, and would not impose a risk to the stock.
3. Test fishery data and larval surveys in support of SSB estimates should continue. Thevalidity and utility of the test fishery procedures require more attention. This might be donein the form of experimental fishing methods that would examine sources of variabilityassociated with test fishery data.
4. There is a pressing requirement to reconcile the amount of eulachons taken by differentusers. A specific issue for management of Fraser River eulachons is the accounting forremovals in the sea, before they reach the river. Such a task may be assisted by thecontinued development of genetic techniques, and perhaps other approaches, for theelucidation of stock differences and stock origins.
5. The annual offshore shrimp surveys from determination of shrimp biomass should berecognized as having substantial inherent value as a source of meaningful pre-seasonreference points for eulachon fisheries, in addition to shrimp fisheries.
Recommendations for research
1. Investigate the possibility of earlier but smaller and undetected spawning runs ofeulachons in the Fraser River. Such runs have been suggested by some fishers.
2. Investigate factors affecting the timing and location of spawning as a factor affectingtest fisheries. One factor is water temperature. The relationship between temperatureand estimated incubation time is known, so future research could attempt to use the timingof peaks in egg and larval production data to estimate peaks in spawning period. Thiswould provide a potential check for the test fishery data.
3. Use estimated dates of historic catch data from data presented by Ricker et al (1954)and compare these with tidal state (that can be computed for all previous years). Thiswould allow a comparison of the approximate time of the spawning run for an additional10-12 years. These data also could be examined according the annual variation in Sea

19
Surface Temperature (SST) and Fraser River discharge rates. The dates of the oldercatch data, however, may lack sufficient precision to make this approach useful.
4. The compilation of historic Fraser River catch data should be re-examined andrecompiled if necessary. There are several published sources that appear to presentdifferent estimates, especially during the years when catches were maximal.
5. More genetic analyses of eulachons from offshore locations is required to betterdifferentiate between Fraser and Columbia River fish. In the longer term, a time series ofmixed stock analyses would be very useful for determining the effect of marineenvironmental conditions (SST, etc.) on the distribution and mixtures of eulachons from theFraser and Columbia Rivers, and perhaps from other sources.
ACKNOWLEDGEMENTS
Dennis Rutherford provided the data for offshore biomass estimates of eulachons. BruceMcCarter assisted with parts of the data compilation. Many others assisted with thecollection of field and laboratory data that were used in this report.
REFERENCES
Anon. 1993. Status Report - Columbia River fish runs and fisheries, 1938-1992. JointPublication of the Oregon Dept. of Fish and Wildlife and the Washington StateDept. of Fisheries. 257p.
Boutillier J. A., R. I. Perry, B. Waddell, and J. Bond. 1997. Assessment of the OffshorePandalus jordani Trawl Fishery off the West Coast of Vancouver Island. PSARCWorking Paper I-97-11.
Boutillier, J.A., J.A. Bond, H. Nguyen, and R.M Harbo. 1998. Shrimp survey off the WestCoast of Vancouver Island and Resulting Management Actions – May 1998. Can.Manuscr. Rep. Fish. Aquat. Sci. 2461: 110 p.
Hay, D.E., R. Harbo, C. E. Southey, J. R. Clarke, G. Parker, P. B. and PB.McCarter 1998. Catch composition of British Columbia shrimp trawls and preliminaryestimation of bycatch - with emphasis on eulachons. PSARC Working PaperI98:8. 40 pp. (Also presented as Canadian Stock Assessment SecretariatResearch Document 99/26. 45p. )
Hay, D.E., R. Harbo, J. Boutillier, E. Wylie, L. Convey, and P.B. McCarter. 1999. Assessment of bycatch in the 1997 and 1998 shrimp trawl fisheries in BritishColumbia, with emphasis on eulachons. Can. Stock Assessment SecretariatResearch Document 99/179. 44 p.
Hay, D.E., J. Boutillier, M. Joyce and G. Langford. 1997a. The eulachon (Thaleichthyspacificus) as an indicator species in the North Pacific. Proceedings. Forage Fishesin Marine Ecosystems. Wakefield Fisheries Symposium. Alaska Sea Grant CollegeProgram AK-SG-97-01, p 509-530.
20
Hay, D.E. and P.B. McCarter. 2000. Status of the eulachon Thaleichthys pacificusin Canada. Can. Stock Assessment Research Document 2000/145. 92 p.
Hay, D.E., P. B. McCarter, M. Joyce, and R. Pedersen. 1997b. Fraser river eulachonbiomass assessments and spawning distribution based on egg and larval surveys. PSARC Working Paper. November 1997. 60 pp.
Hay, D. E., P. B. McCarter, R. Joy, M. Thompson and K. West. 2002. Fraser Rivereulachon biomass assessments and spawning distribution: 1995-2002 .PSARCWorking Paper P2002-08. 60p.
Kitto, E.A. 2002. The ecology of the eulachon (Thaleichthys pacificus) in Turnagain Arm,Alaska. M.Sc. thesis. University of Alaska, Fairbanks.
Martell, S., Boutiller, J. Nguyen, H. and C. Walters. 2000. Reconstructing the offshorePandalus jordani trawl fishery off the west coast of Vancouver Island and simulatingalternate management policies. Can. Stock Assessment Secretariat ResearchDocument. 2000/149. 38 p.
Ricker, W.E., D.F. Manzer and E.A. Neave. 1954. The Fraser River eulachon fishery,1941-1953. Fish. Res. Bd. Canada. MS Rept. Biol. Sta., No. 583, 35 p.
Rogers, I.H., Birtwell, I.K. and G.M. Kruzynski. 1990. The Pacific eulachon (Thaleichthyspacificus) as a pollution indicator organism in the Fraser River estuary, VancouverBritish Columbia. Science of the Total Environment. 97/98. 713-727.
Rutherford, D.T. 2002. Shrimp Survey Bulletin 02-01: Description and Results of theWest Coast of Vancouver Island Shrimp survey, April 23 – May 7, 2002.http://www.pac.dfo-mpo.gc.ca/ops/fm/shellfish/shrimp/Default.htm
21
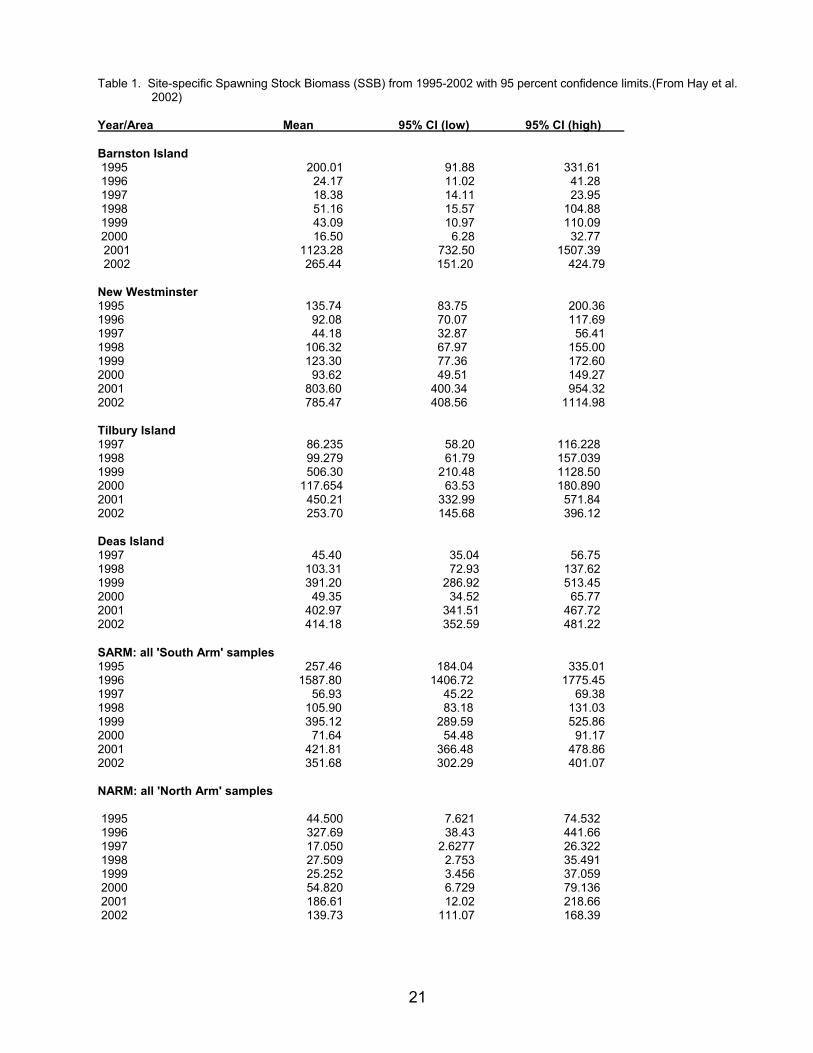
Table 1. Site-specific Spawning Stock Biomass (SSB) from 1995-2002 with 95 percent confidence limits.(From Hay et al.2002)
Year/Area Mean 95% CI (low) 95% CI (high)
Barnston Island1995 200.01 91.88 331.611996 24.17 11.02 41.281997 18.38 14.11 23.951998 51.16 15.57 104.881999 43.09 10.97 110.092000 16.50 6.28 32.772001 1123.28 732.50 1507.392002 265.44 151.20 424.79
New Westminster 1995 135.74 83.75 200.361996 92.08 70.07 117.691997 44.18 32.87 56.411998 106.32 67.97 155.001999 123.30 77.36 172.602000 93.62 49.51 149.272001 803.60 400.34 954.322002 785.47 408.56 1114.98
Tilbury Island1997 86.235 58.20 116.2281998 99.279 61.79 157.0391999 506.30 210.48 1128.502000 117.654 63.53 180.8902001 450.21 332.99 571.842002 253.70 145.68 396.12
Deas Island1997 45.40 35.04 56.751998 103.31 72.93 137.621999 391.20 286.92 513.452000 49.35 34.52 65.772001 402.97 341.51 467.722002 414.18 352.59 481.22
SARM: all 'South Arm' samples1995 257.46 184.04 335.011996 1587.80 1406.72 1775.451997 56.93 45.22 69.381998 105.90 83.18 131.031999 395.12 289.59 525.862000 71.64 54.48 91.172001 421.81 366.48 478.862002 351.68 302.29 401.07
NARM: all 'North Arm' samples
1995 44.500 7.621 74.5321996 327.69 38.43 441.661997 17.050 2.6277 26.3221998 27.509 2.753 35.4911999 25.252 3.456 37.0592000 54.820 6.729 79.1362001 186.61 12.02 218.662002 139.73 111.07 168.39
22
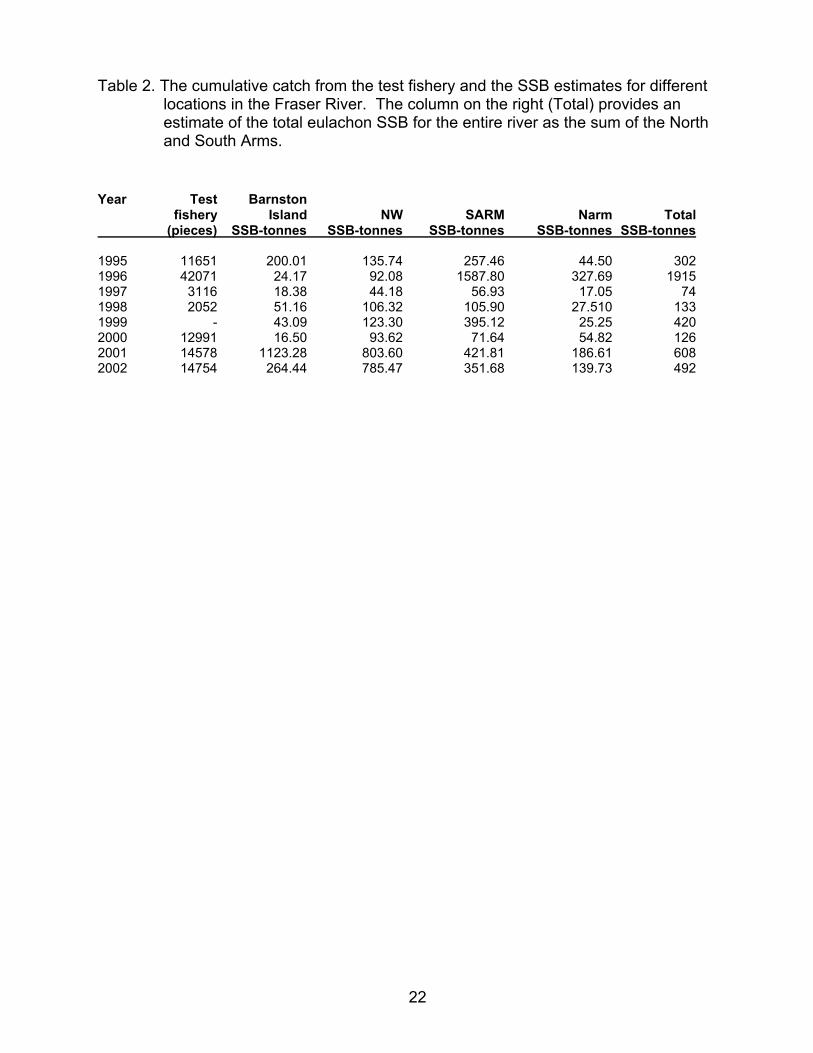
Table 2. The cumulative catch from the test fishery and the SSB estimates for differentlocations in the Fraser River. The column on the right (Total) provides an estimate of the total eulachon SSB for the entire river as the sum of the Northand South Arms.
Year Test Barnstonfishery Island NW SARM Narm Total
(pieces) SSB-tonnes SSB-tonnes SSB-tonnes SSB-tonnes SSB-tonnes
1995 11651 200.01 135.74 257.46 44.50 3021996 42071 24.17 92.08 1587.80 327.69 19151997 3116 18.38 44.18 56.93 17.05 741998 2052 51.16 106.32 105.90 27.510 1331999 - 43.09 123.30 395.12 25.25 4202000 12991 16.50 93.62 71.64 54.82 1262001 14578 1123.28 803.60 421.81 186.61 6082002 14754 264.44 785.47 351.68 139.73 492

23
Table 3. Annual offshore eulachon index ( biomass) from 1973-2002 for Statistical areas 124 and 125 and annual catch data (tonnes)from the Fraser and Columbia Rivers.
Year Offshore 124 Offshore 125 Fraser Catch Columbia Catch1941 - - 50.14 1265.901942 - - 152.74 1343.001943 - - 154.79 1988.651944 - - 65.70 1134.251945 - - 73.87 2859.651946 - - 115.71 1638.001947 - - 231.10 772.451948 - - 112.80 1987.051949 - - 102.70 1666.801950 - - 36.20 741.251951 - - 189.30 758.451952 - - 421.00 637.451953 - - 158.60 855.501954 - - 151.60 942.151955 - - 238.80 1118.551956 - - 235.50 841.951957 - - 33.20 789.501958 - - 92.10 1308.201959 - - 132.00 878.051960 - - 84.00 586.101961 - - 216.90 526.151962 - - 178.20 736.801963 - - 159.30 538.551964 - - 105.50 420.901965 - - 87.80 455.351966 - - 101.90 514.151967 - - 86.80 500.401968 - - 46.00 473.751969 - - 29.80 541.851970 - - 71.70 591.951971 - - 34.50 888.351972 - - 53.20 821.751973 222 107 53.10 1217.201974 - - 75.30 1180.901975 566 421 27.70 1038.801976 741 335 36.70 1537.551977 1581 659 32.20 876.501978 1244 25 38.60 1340.151979 701 456 22.30 578.351980 1013 291 24.40 1605.751981 431 561 21.20 836.151982 1599 541 13.70 1105.001983 116 176 10.80 1365.201984 - - 11.80 249.001985 1197 222 29.20 1019.001986 - - 49.60 1919.401987 1304 518 19.30 947.851988 1295 643 39.50 1433.851989 932 - 18.70 1533.401990 1132 370 19.90 1392.101991 1252 - 12.30 1475.201992 1989 1027 19.60 1836.901993 278 1024 8.70 256.951994 112 69 6.10 21.701995 166 115 15.50 220.001996 89 52 63.20 4.551997 168 110 closed 29.301998 19 125 closed 6.001999 124 28 closed 10.452000 836 310 closed closed -2001 1340 187 closed -2002 3993 5343 ~5.76 -

24
Table 4. Eulachon biomass indices and estimates of numbers of eulachon per age class(1,000s) for the West Coast of Vancouver Island 1999 to 2002. The biomass is thehighest observed since the surveys started in 1973.
Year Area Biomass (t) Number (1,000s)Age 1+ Age 2+
1999 121OFF, 23IN, 23OFF 335 5862 16512124OFF 124 5630 3736125OFF 28 351 959
2000 121OFF, 23IN, 23OFF 1971 128199 20002124OFF 846 61884 5880125OFF 346 18789 1948
2001 121OFF, 23IN, 23OFF 4896 111359 181922124OFF 1340 85533 32980125OFF 187 5684 4272
2002 121OFF, 23IN, 23OFF 5862 264348 136735124OFF 3993 35459 131949125OFF 5343 11894 190130

25
Table 5. Age composition of eulachon sampled from the WCVI shrimpsurvey, 1999 - 2002. Note the very high frequency of age 2+ fishin 2002.
Proportion Proportion
Year Area Age 1+ Age 2+
1999 121/123 0.26 0.74124 0.60 0.40125 0.27 0.73
2000 121/123 0.87 0.13124 0.91 0.09125 0.91 0.09
2001 121/123 0.38 0.62124 0.72 0.28125 0.57 0.43
2002 121/123 0.66 0.34124 0.21 0.79125 0.06 0.94

26
Table 6. Results of test fishery catches, 1995-2002. The numbers represent the numberof eulachons captured per day in a standard length of gillnet fished for the sameduration each day.
1995 1996 1997 1998 2000 2001 200223-Mar - 11 11 - - - -24-Mar - 43 33 - - - -25-Mar - 74 55 - - - -26-Mar - 53 34 3 - 2 -27-Mar - 31 12 34 - 10 -28-Mar - 22 12 15 0 5 -29-Mar 36 12 12 29 0 5 -30-Mar 76 11 13 59 6 7 -31-Mar 47 9 14 67 10 5 -01-Apr 5 22 29 50 13 13 -02-Apr 12 34 29 59 14 14 -03-Apr 15 32 44 41 21 17 104-Apr 41 30 66 30 20 13 005-Apr 3 9 88 29 28 7 406-Apr 14 14 81 71 34 16 107-Apr 14 27 74 1 39 16 108-Apr 5 40 141 33 56 12 409-Apr 35 26 52 2 71 11 610-Apr 142 231 36 8 54 11 611-Apr 176 579 48 2 42 34 112-Apr 210 616 40 6 89 15 113-Apr 302 743 30 19 84 14 014-Apr 822 195 50 7 79 23 015-Apr 623 2,709 112 6 95 45 2616-Apr 922 1,964 58 3 16 16 3017-Apr 434 2,640 108 8 75 42 1318-Apr 557 368 92 16 75 90 2119-Apr 2,185 5,980 173 18 57 170 4020-Apr 958 3,855 83 12 144 404 10521-Apr 2,857 1,730 169 6 85 488 23322-Apr 242 3,218 20 252 250 864 55323-Apr 37 1,929 54 109 177 1,239 65924-Apr 32 866 88 8 256 1,217 198125-Apr 85 824 270 14 180 400 131626-Apr 97 68 155 73 685 352 65127-Apr 130 421 20 59 708 280 89328-Apr 54 580 211 33 820 305 75129-Apr 54 831 401 243 1,860 313 85630-Apr 24 369 48 257 1,000 573 960
01-May 20 236 29 308 1,300 1,207 92802-May 17 2,343 9 52 1,600 894 84503-May 13 2,059 8 4 570 1,159 76104-May 22 1,729 6 2 239 888 54805-May 30 1,729 0 314 760 66906-May 56 1,399 2 316 619 42407-May 56 360 3 370 464 42408-May 81 492 70 367 15809-May 56 238 161 270 17010-May 30 75 87 89 13811-May 16 58 180 54 15312-May 2 58 195 54 14813-May 3 41 205 45 14214-May 3 21 44 43 4915-May 3 21 75 53 3816-May 32 92 3117-May 27 142 1518-May 34 10319-May 29 11320-May 3621-May 6422-May 15

27
Table 7. Cumulative catches, by day for the Fraser River, derived from Table 3. The days of cumulative catches of 5000 and10000 fishare marked in bold. See text for explanation.
1995 1996 1997 1998 2000 2001 200223-Mar 0 11 11 0 0 0 024-Mar 0 54 44 0 0 0 025-Mar 0 128 99 0 0 0 026-Mar 0 180 133 3 0 2 027-Mar 0 211 145 37 0 12 028-Mar 0 233 157 52 0 17 029-Mar 36 245 169 81 0 22 030-Mar 112 255 182 140 6 29 031-Mar 159 264 196 207 16 34 001-Apr 164 286 225 257 29 47 002-Apr 176 320 254 316 43 61 003-Apr 191 352 298 357 64 78 104-Apr 232 382 364 387 84 91 105-Apr 235 391 452 416 112 98 506-Apr 249 405 533 487 146 114 607-Apr 263 432 607 488 185 130 708-Apr 268 472 748 521 241 142 1109-Apr 303 498 800 523 312 153 1710-Apr 445 729 836 531 366 164 2311-Apr 621 1308 884 533 408 198 2412-Apr 831 1924 924 539 497 213 2513-Apr 1133 2667 954 558 581 227 2514-Apr 1955 2862 1004 565 660 250 2515-Apr 2578 5571 1116 571 755 295 5116-Apr 3500 7535 1174 574 771 311 8117-Apr 3934 10175 1282 582 846 353 9418-Apr 4491 10543 1374 598 921 443 11519-Apr 6676 16523 1547 616 978 613 15520-Apr 7634 20378 1630 628 1122 1017 26021-Apr 10491 22108 1799 634 1207 1505 49322-Apr 10733 25326 1819 886 1457 2369 104623-Apr 10770 27255 1873 995 1634 3608 170524-Apr 10802 28121 1961 1003 1890 4824 368625-Apr 10887 28944 2231 1017 2070 5224 500226-Apr 10984 29012 2386 1090 2755 5576 565327-Apr 11114 29434 2406 1149 3463 5856 654628-Apr 11168 30013 2616 1182 4283 6161 729729-Apr 11222 30844 3017 1425 6143 6474 815330-Apr 11246 31213 3065 1682 7143 7047 911301-May 11266 31449 3094 1990 8443 8254 1004102-May 11283 33792 3103 2042 10043 9148 1088603-May 11296 35851 3110 2046 10613 10307 1164704-May 11317 37580 3116 2048 10852 11195 1219505-May 11347 39309 3116 2048 11166 11955 1286406-May 11403 40708 3116 2049 11482 12574 1328807-May 11458 41068 3116 2052 11852 13038 1371208-May 11539 41560 3116 2052 11922 13405 1387009-May 11595 41798 3116 2052 12083 13675 1404010-May 11625 41873 3116 2052 12170 13764 1417811-May 11641 41931 3116 2052 12350 13818 1433112-May 11643 41989 3116 2052 12545 13872 1447913-May 11645 42030 3116 2052 12750 13917 1462114-May 11648 42051 3116 2052 12794 13960 1467015-May 11651 42071 3116 2052 12869 14013 1470816-May 11651 42071 3116 2052 12901 14105 1473917-May 11651 42071 3116 2052 12928 14247 1475418-May 11651 42071 3116 2052 12962 14350 1475419-May 11651 42071 3116 2052 12991 14463 1475420-May 11651 42071 3116 2052 12991 14499 1475421-May 11651 42071 3116 2052 12991 14563 1475422-May 11651 42071 3116 2052 12991 14578 14754
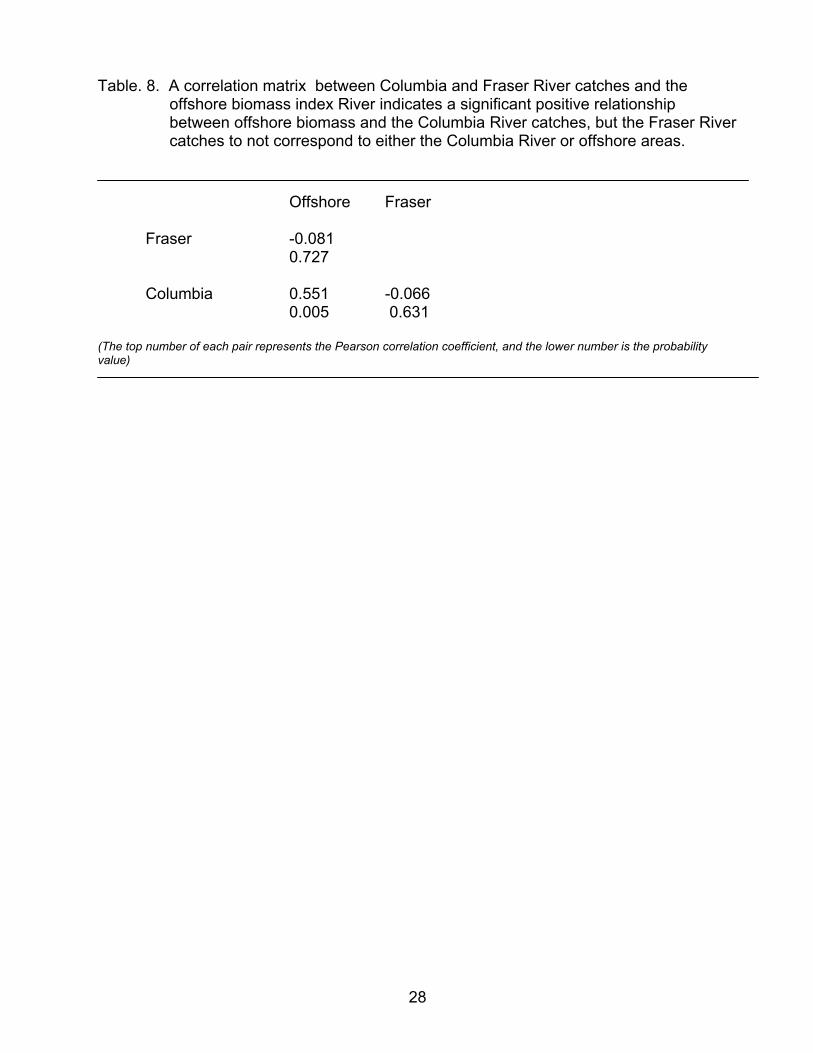
28
Table. 8. A correlation matrix between Columbia and Fraser River catches and theoffshore biomass index River indicates a significant positive relationshipbetween offshore biomass and the Columbia River catches, but the Fraser Rivercatches to not correspond to either the Columbia River or offshore areas.
Offshore Fraser
Fraser -0.0810.727
Columbia 0.551 -0.0660.005 0.631
(The top number of each pair represents the Pearson correlation coefficient, and the lower number is the probabilityvalue)
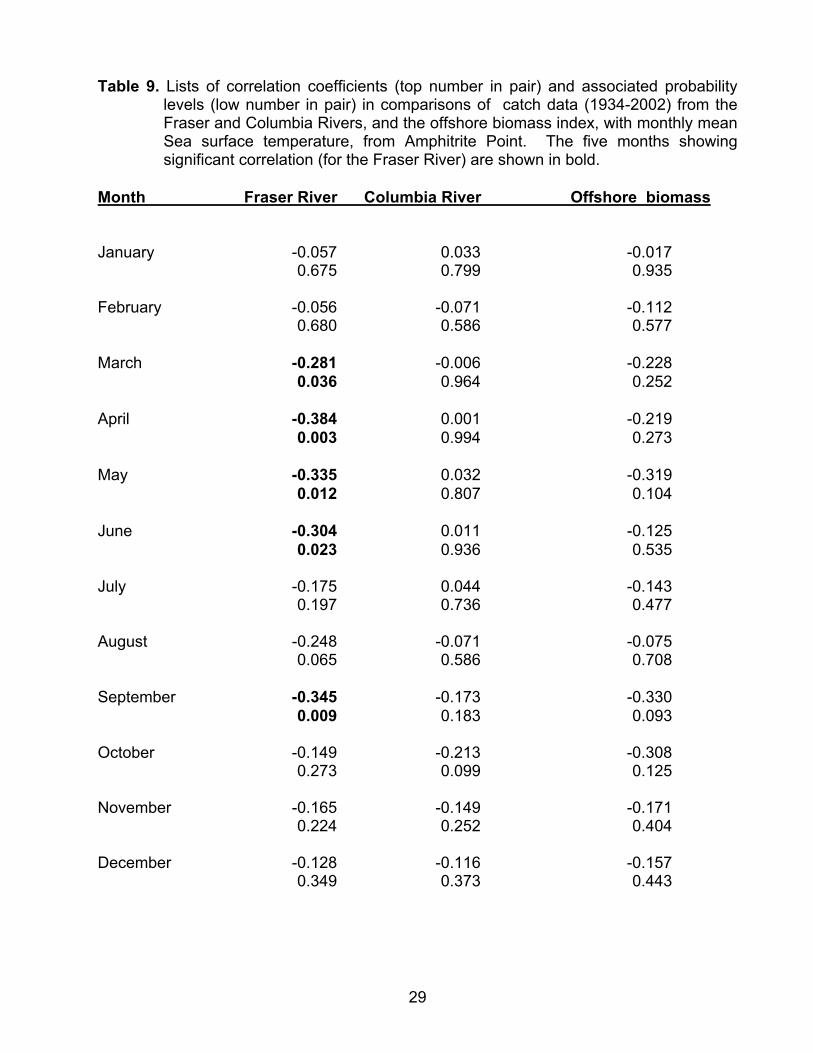
29
Table 9. Lists of correlation coefficients (top number in pair) and associated probabilitylevels (low number in pair) in comparisons of catch data (1934-2002) from theFraser and Columbia Rivers, and the offshore biomass index, with monthly meanSea surface temperature, from Amphitrite Point. The five months showingsignificant correlation (for the Fraser River) are shown in bold.
Month Fraser River Columbia River Offshore biomass
January -0.057 0.033 -0.0170.675 0.799 0.935
February -0.056 -0.071 -0.1120.680 0.586 0.577
March -0.281 -0.006 -0.2280.036 0.964 0.252
April -0.384 0.001 -0.2190.003 0.994 0.273
May -0.335 0.032 -0.3190.012 0.807 0.104
June -0.304 0.011 -0.1250.023 0.936 0.535
July -0.175 0.044 -0.1430.197 0.736 0.477
August -0.248 -0.071 -0.0750.065 0.586 0.708
September -0.345 -0.173 -0.3300.009 0.183 0.093
October -0.149 -0.213 -0.3080.273 0.099 0.125
November -0.165 -0.149 -0.1710.224 0.252 0.404
December -0.128 -0.116 -0.1570.349 0.373 0.443
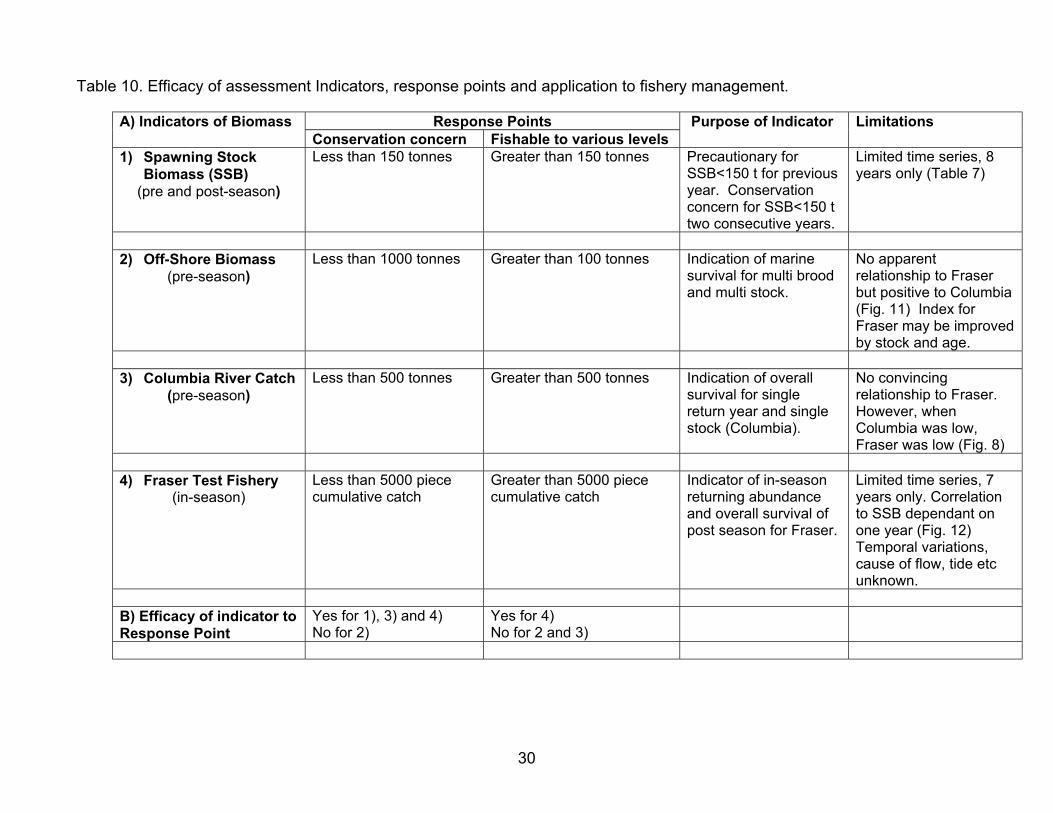
30
Table 10. Efficacy of assessment Indicators, response points and application to fishery management.
A) Indicators of Biomass Response Points Purpose of Indicator LimitationsConservation concern Fishable to various levels
1) Spawning Stock Biomass (SSB)
(pre and post-season)
Less than 150 tonnes Greater than 150 tonnes Precautionary forSSB<150 t for previousyear. Conservationconcern for SSB<150 ttwo consecutive years.
Limited time series, 8years only (Table 7)
2) Off-Shore Biomass(pre-season)
Less than 1000 tonnes Greater than 100 tonnes Indication of marinesurvival for multi broodand multi stock.
No apparentrelationship to Fraserbut positive to Columbia(Fig. 11) Index forFraser may be improvedby stock and age.
3) Columbia River Catch(pre-season)
Less than 500 tonnes Greater than 500 tonnes Indication of overallsurvival for singlereturn year and singlestock (Columbia).
No convincingrelationship to Fraser.However, whenColumbia was low,Fraser was low (Fig. 8)
4) Fraser Test Fishery(in-season)
Less than 5000 piececumulative catch
Greater than 5000 piececumulative catch
Indicator of in-seasonreturning abundanceand overall survival ofpost season for Fraser.
Limited time series, 7years only. Correlationto SSB dependant onone year (Fig. 12) Temporal variations,cause of flow, tide etcunknown.
B) Efficacy of indicator toResponse Point
Yes for 1), 3) and 4)No for 2)
Yes for 4)No for 2 and 3)
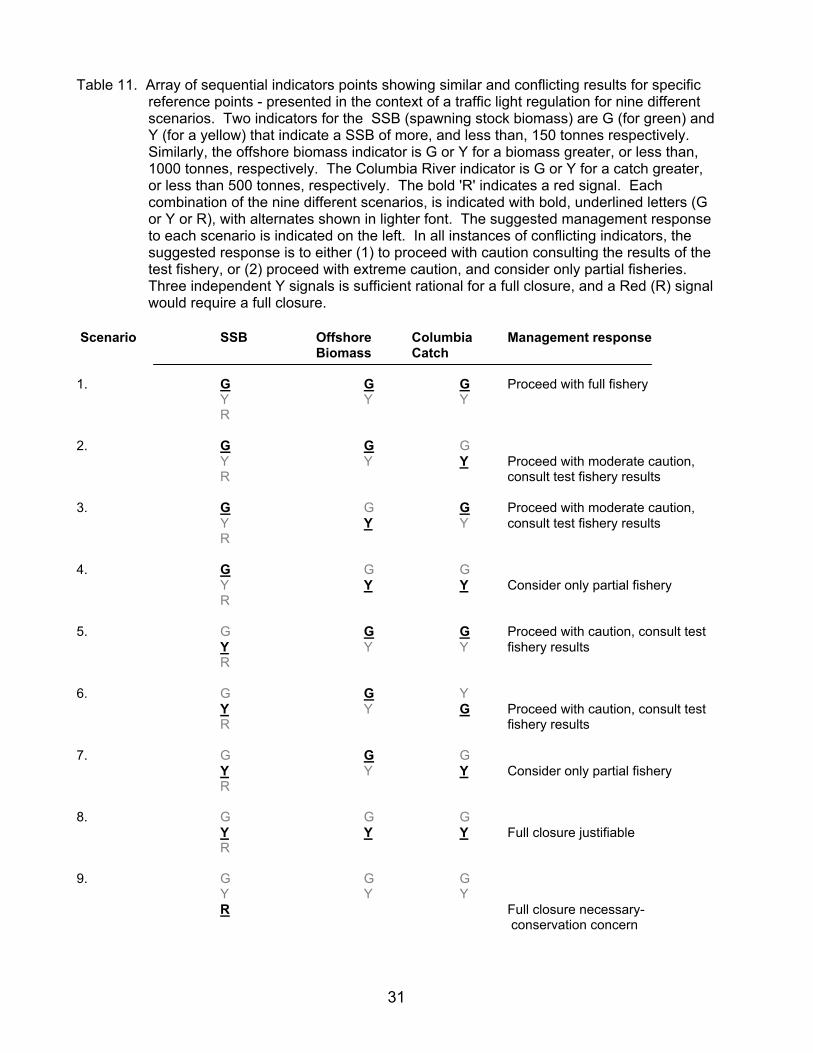
31
Table 11. Array of sequential indicators points showing similar and conflicting results for specificreference points - presented in the context of a traffic light regulation for nine differentscenarios. Two indicators for the SSB (spawning stock biomass) are G (for green) andY (for a yellow) that indicate a SSB of more, and less than, 150 tonnes respectively. Similarly, the offshore biomass indicator is G or Y for a biomass greater, or less than,1000 tonnes, respectively. The Columbia River indicator is G or Y for a catch greater,or less than 500 tonnes, respectively. The bold 'R' indicates a red signal. Eachcombination of the nine different scenarios, is indicated with bold, underlined letters (Gor Y or R), with alternates shown in lighter font. The suggested management responseto each scenario is indicated on the left. In all instances of conflicting indicators, thesuggested response is to either (1) to proceed with caution consulting the results of thetest fishery, or (2) proceed with extreme caution, and consider only partial fisheries. Three independent Y signals is sufficient rational for a full closure, and a Red (R) signalwould require a full closure.
Scenario SSB Offshore Columbia Management responseBiomass Catch
1. G G G Proceed with full fishery Y Y Y R
2. G G G Y Y Y Proceed with moderate caution, R consult test fishery results
3. G G G Proceed with moderate caution, Y Y Y consult test fishery results R
4. G G G Y Y Y Consider only partial fishery R
5. G G G Proceed with caution, consult test Y Y Y fishery results R
6. G G Y Y Y G Proceed with caution, consult test R fishery results
7. G G G Y Y Y Consider only partial fishery R
8. G G G Y Y Y Full closure justifiable R
9. G G G Y Y Y R Full closure necessary- conservation concern

32
Fig. 1. The key sampling locations examined throughout all years (1995-2002) forestimates of spawning stock biomass (SSB) from egg and larval surveys. Theabbreviations refer to sampling stations as follows: Deas Island (DI), BarnstonIsland (BI) New Westminster (BW), Tilbury Island (TI). The test fishery wasconducted in the vicinity of New Westminster.

33
Fig. 2. Offshore sample locations (gray polygons) examined during the annual shrimp trawlsurvey conducted in May of most years. The numbers within the polygons correspond tothe Statistical Areas refereed to in the text.
125
124
123

34
Fig. 3. Size modes of offshore eulachons, corresponding to age groups 1+ (about 15months of age) and 2+ (about 27 months of age) from size composition datacollected from eulachons in 1997 and 1998 during annual shrimp surveys in May,off the lower west coast of Vancouver Island. (Adapted from Hay and McCarter2000).
�������� 1999
0 100 200
0
1
2
3
4
5
6
7
8
9
10
S dlen1m m
Per
cent
������������������������������������������������
���������
��������
���������������
����������
������������������
����������
������������
����������������
������
��������
������������
���������������������
����������������
��������������������
������������������
���������������������������
��������������
������������������
����������
����������������������������������
�������� 1998
0 100 200
0
2
4
6
8
10
12
14
S dlen1mm
Per
cent
�����������
���������������������
������������������
���������������
�������������������
������
������
������������
���������������
������������
������������
���������������
����������
������������
��������������������������������������������������������

35
Fig. 4. Temporal variation in spawning stock biomass (SSB) for the Fraser River, 1995-2002 (Data from Table 2, and adapted from Hay et al. 2002).
200220012000199919981997199619951994
2000
1000
0
Year
SSB
(tonn
es) -
Nor
th a
nd S
outh
Arm
s

36
Fig. 5. The commercial catches of the Fraser River (A) and Columbia River by year. Catch data for recent years in the Columbia river are incomplete.
2000199019801970196019501940
400
300
200
100
0
Year
Fras
er c
atch
(ton
nes)
A
2000199019801970196019501940
3000
2000
1000
0
Year
Col
umbi
a ca
tch
- ton
nes
B

37
Fig. 6. The offshore biomass index from 1973 to 2002 for Statistical Areas 124 (A) and125 (B).
2000199019801970
4000
3000
2000
1000
0
Year
Offs
hore
(ton
nes)
- A
rea
124
A
2000199019801970
5000
4000
3000
2000
1000
0
Year
Offs
hore
(ton
nes)
- A
rea
125
B
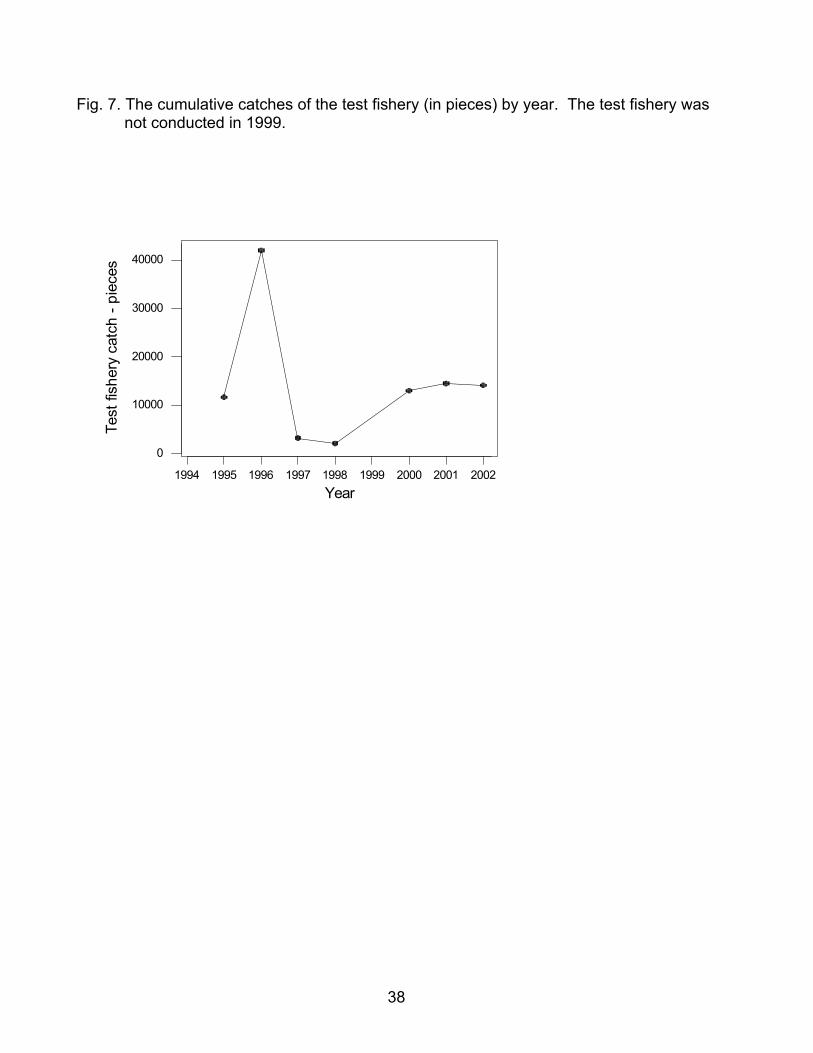
38
Fig. 7. The cumulative catches of the test fishery (in pieces) by year. The test fishery wasnot conducted in 1999.
1994 1995 1996 1997 1998 1999 2000 2001 2002
0
10000
20000
30000
40000
Year
Test
fish
ery
catc
h - p
iece
s
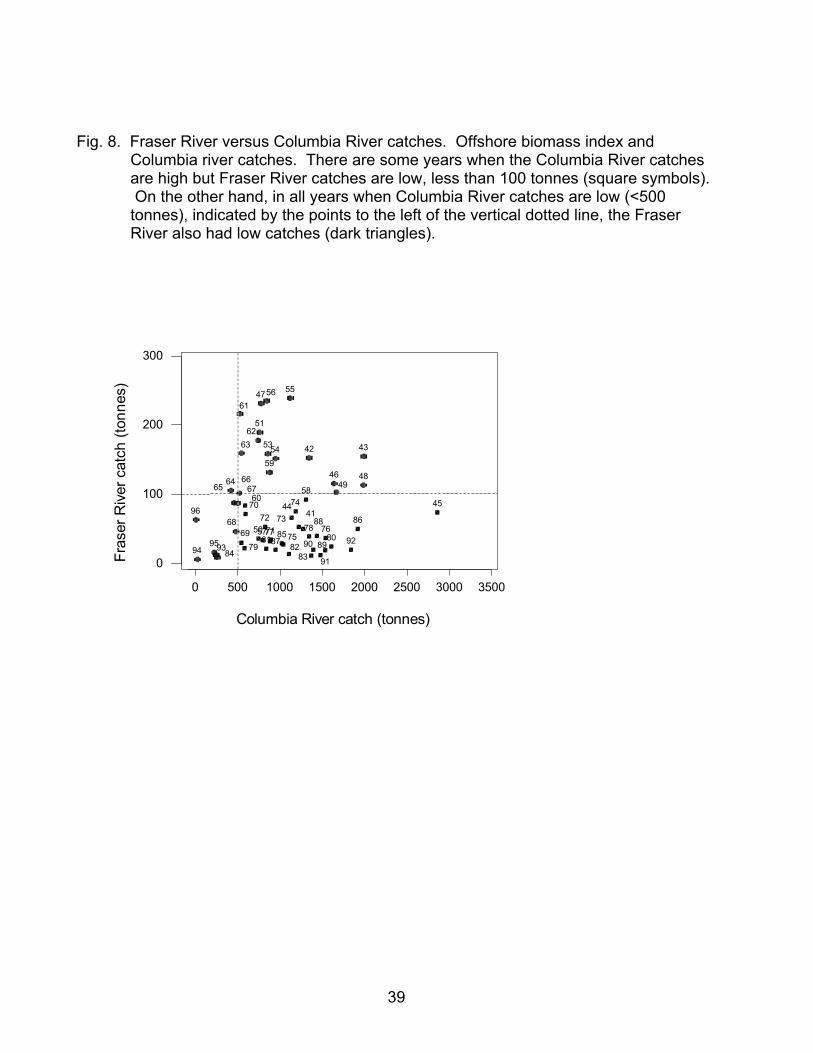
39
Fig. 8. Fraser River versus Columbia River catches. Offshore biomass index andColumbia river catches. There are some years when the Columbia River catchesare high but Fraser River catches are low, less than 100 tonnes (square symbols). On the other hand, in all years when Columbia River catches are low (<500tonnes), indicated by the points to the left of the vertical dotted line, the FraserRiver also had low catches (dark triangles).
3500300025002000150010005000
300
200
100
0
Columbia River catch (tonnes)
Fras
er R
iver c
atch
(ton
nes)
96
9594 93
92
91
90 89
88
87
8685
84 8382
81 8079
7877 7675
74
737271
70
6968
6766
6564
6362
61
60
59
58
57
56 55
5453
51
50
4948
47
46
4544
4342
41
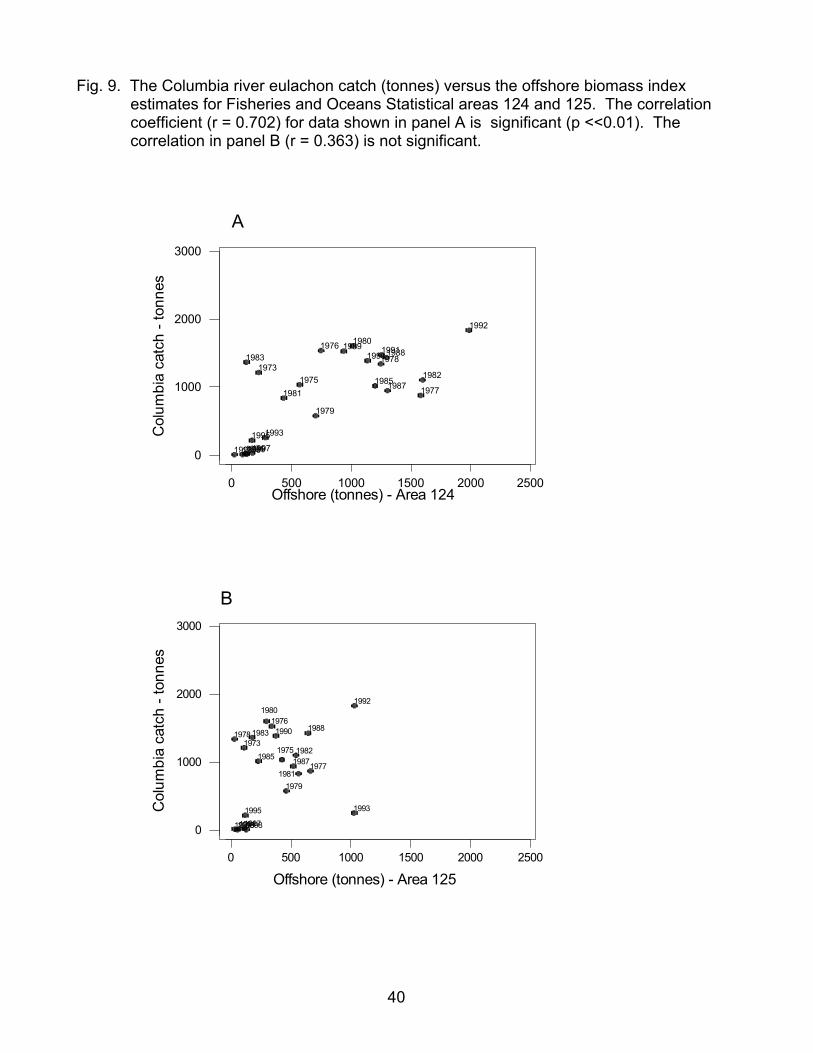
40
Fig. 9. The Columbia river eulachon catch (tonnes) versus the offshore biomass indexestimates for Fisheries and Oceans Statistical areas 124 and 125. The correlationcoefficient (r = 0.702) for data shown in panel A is significant (p <<0.01). Thecorrelation in panel B (r = 0.363) is not significant.
25002000150010005000
3000
2000
1000
0
Offshore (tonnes) - Area 125
Col
umbi
a ca
tch
- ton
nes
1999199819971996
19951994
1993
1992
1990 1988
19871985
1983
1982
1981
1980
1979
1978
1977
1976
19751973
B
0 500 1000 1500 2000 2500
0
1000
2000
3000
Offshore (tonnes) - Area 124
Col
umbi
a ca
tch
- ton
nes
19731975
1976
1977
1978
1979
1980
1981
1982
1983
19851987
19881989
19901991
1992
1993
19941995
1996199719981999
A
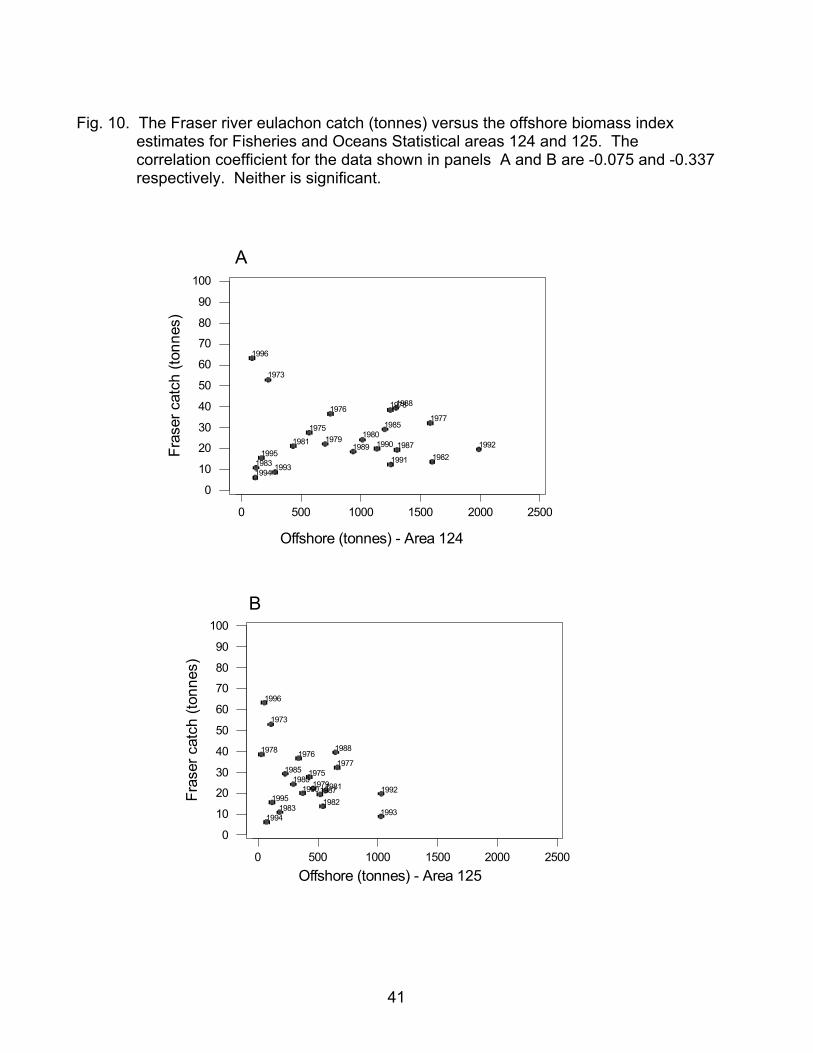
41
Fig. 10. The Fraser river eulachon catch (tonnes) versus the offshore biomass indexestimates for Fisheries and Oceans Statistical areas 124 and 125. Thecorrelation coefficient for the data shown in panels A and B are -0.075 and -0.337respectively. Neither is significant.
0 500 1000 1500 2000 2500
0
10
20
30
40
50
60
70
80
90
100
Offshore (tonnes) - Area 124
Fras
er c
atch
(ton
nes)
1973
1975
19761977
1978
1979 19801981
19821983
1985
1987
1988
1989 1990
1991
1992
19931994
1995
1996
A
0 500 1000 1500 2000 2500
0
10
20
30
40
50
60
70
80
90
100
Offshore (tonnes) - Area 125
Fras
er c
atch
(ton
nes)
1973
1975
19761977
1978
197919801981
19821983
1985
1987
1988
1990 1992
19931994
1995
1996
B
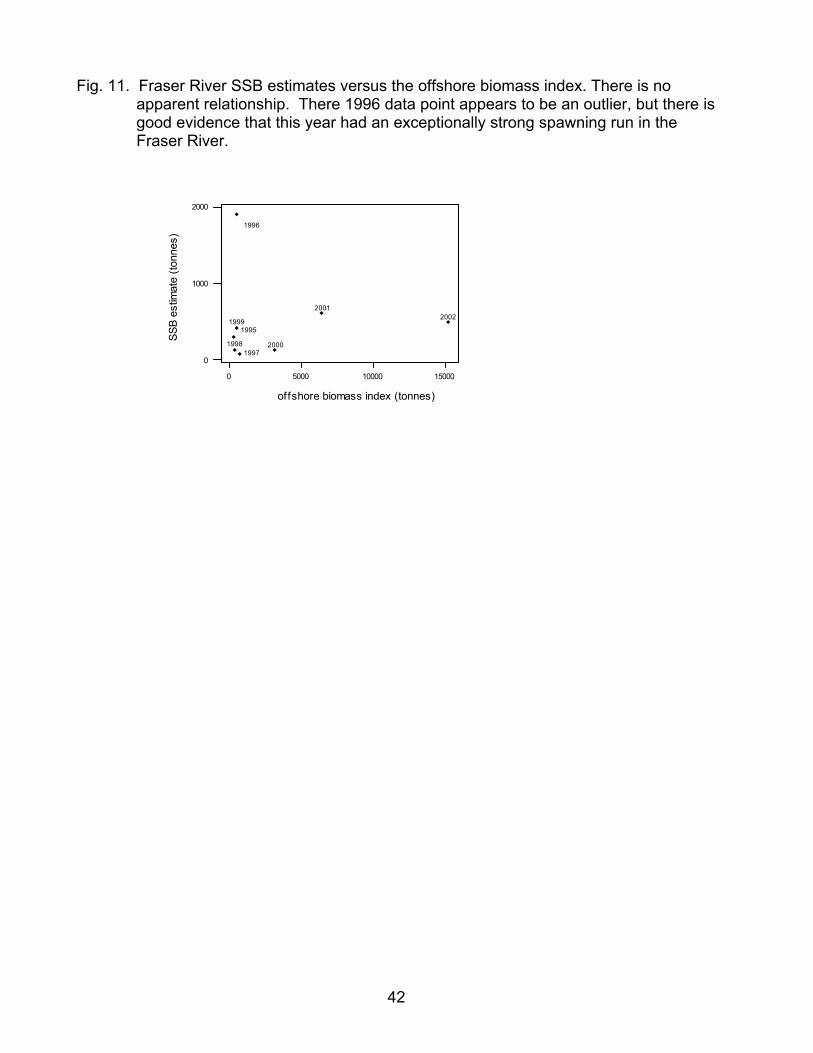
42
Fig. 11. Fraser River SSB estimates versus the offshore biomass index. There is noapparent relationship. There 1996 data point appears to be an outlier, but there isgood evidence that this year had an exceptionally strong spawning run in theFraser River.
150001000050000
2000
1000
0
offshore biomass index (tonnes)
SSB
estim
ate
(tonn
es)
20022001
2000
1999
19981997
1996
1995
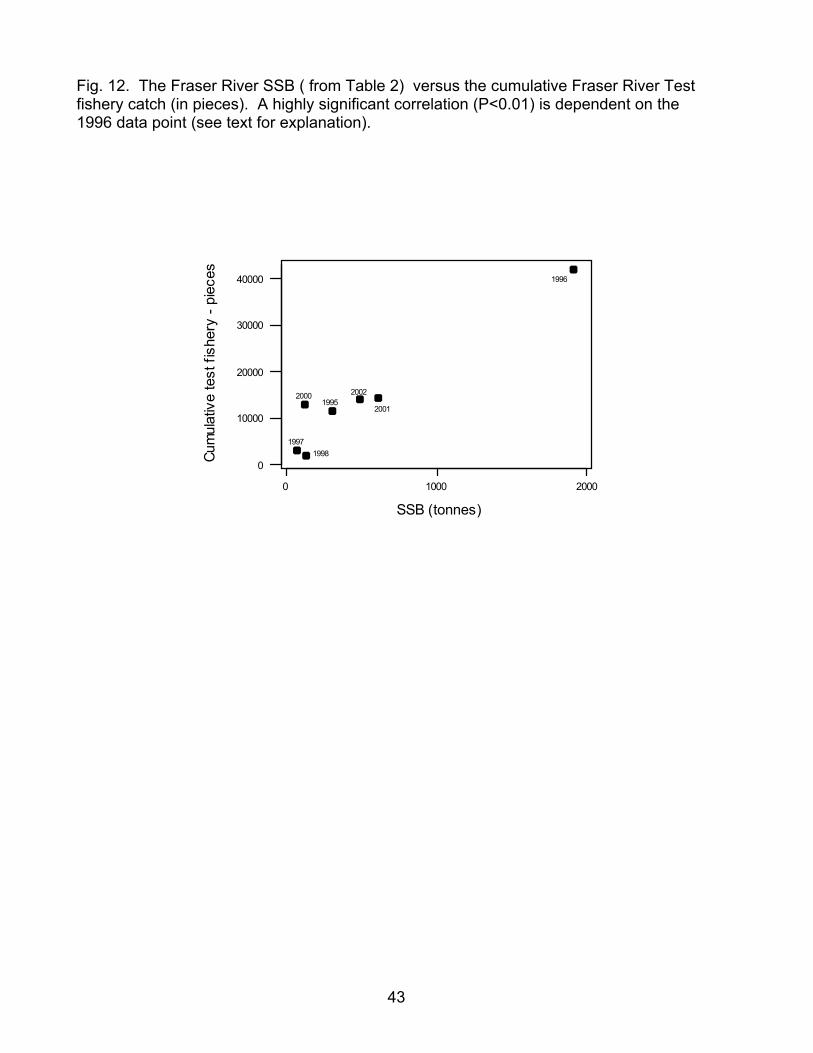
43
Fig. 12. The Fraser River SSB ( from Table 2) versus the cumulative Fraser River Testfishery catch (in pieces). A highly significant correlation (P<0.01) is dependent on the1996 data point (see text for explanation).
0 1000 2000
0
10000
20000
30000
40000
SSB (tonnes)
Cum
ulat
ive
test
fish
ery
- pie
ces
1995
1996
19971998
20002001
2002

44
Fig. 13. Patterns of cumulative catch from test fisheries for eulachons in the Fraser River,1995-2002. In two of the years, the cumulative catch did not reach 5000 pieces(lowest horizontal dotted line). In all other years, the cumulative catchexceeded 10000 pieces (higher horizontal dashed line). See text for furtherexplanation
1401301201101009080
40000
30000
20000
10000
0
DOY
Cum
ulat
ive c
atch
19981997
1995200020012002
1996