c%,- restricted file copy coflor
TRANSCRIPT

C%,- loo
RESTRICTED
FILE COPY coflort No. TO-548b
This report was prepared for use w in the Bank and its affiliated organizations.They do not accept responsibility for its accuracy or completeness. The report maynot be published nor may it be quoted as representing their views.
INTERNATIONÀL BANK FOR RECONSTRUCTION ÀND DEVELOPMENT
INTERNATIONAL DEVELOPMENT ASSOCIATION
CAMEROONS DEVELOPMENT CORPORATION PROJECT
FEDERAL REPUBLIC OF CAMEROON
February 17, 1967
Projects Department
Pub
lic D
iscl
osur
e A
utho
rized
Pub
lic D
iscl
osur
e A
utho
rized
Pub
lic D
iscl
osur
e A
utho
rized
Pub
lic D
iscl
osur
e A
utho
rized
Pub
lic D
iscl
osur
e A
utho
rized
Pub
lic D
iscl
osur
e A
utho
rized
Pub
lic D
iscl
osur
e A
utho
rized
Pub
lic D
iscl
osur
e A
utho
rized

CURRENCY EQUIVALENTS
$1 US = 247 CFA Francs1 CFA Francs = US $0. 0041, 000, 000 CFA Frs. = US $4, 050L 1 Sterling = 685 CFA Francs
WEIGHTS & MEASURES
1 Hectare = 2.47 Acres1 Kilogram = 2.20 Pounds1 Metric Ton = 2, 204.6 Pounds

FEDERAL REPUBLIC OF CAMEROON
CAMEROONS DEVELOPMENT CORPORATIONJ PROJECT
TABLE OF CONTENTS
Page No.
SUIMARY . ......................................... i
1. INTRODUCTION .......... ........................... 1
2. BACKGROUND ...................................... . 1General ........................................ 1The Corporation ............... ,. ............. 2
3. THE PROJECT . . .Definition ..................................... 4The Planting Program ...... ................... . 5Research ...................................... . 7Planting Material ....... ....................... 7Yields ......................................... 8Labor ....................................... . 8Field Development Costs ...... ................. . 8Processing Facilities & Other Fixed Assets ..... 8Total Investment Costs ...... ................... 9Marketing and Prices ...... ..................... il
4. FINANCIAL ASPECTS ....... ......................... ilPresent Financial Position ..... ................ ilReorganization ........ ......................... 13Accounting System ....... ....................... 14Audit ............ .............................. 14Depreciation and hmortization ..... ............. 14Insurance . ...................................... 14Taxes and Duty ............. 15Future Earnings ....... ......................... 15Dividends .......... ............................ 16Financing Plan ........ ......................... 16Future Financial Position ..... ................. 18Procurement and Disbursement ..... .............. 18
5. MANIAGEIENT, ORGANIZATION AND TRAINING .... ........ 18
6. BENEFITS AND ECONOMIC JUSTIFICATION .... .......... 19
7. CONCLUSIONS AND RECOMIVENDATIONS ..... ............. 20Recommendations ....... ......................... 21
This report is based on the findings of a mission in November/December 1965 to Cameroon composed of Messrs. Darnell, Whyte, Andreu andHumphrey (of the Bank) and Mr. Akhurst (consultant to FAO).

-2 -
ANNEXES
1. Past Income Statements2. Balance Sheets 1962-19663. Proposed Planting Program4. Production Yields5. Development Costs6. Capital Expenditure7. Price Assumptions8. Estimated Income Statements 1967-19829. Estimated Sources and Application of Funds 1967-1982
10. Estimated Balance Sheets 1967-198211. Estimated Annual Yield on Total Capital Invested
Organization Chart
Maps: Camdev Plantations - GeneralCamdev Oil Palm PlantationsCamdev Rubber, Tea, Pepper,
Cocoa and Banana Plantations.

FEDERAL REPUBLIC OF CAMEROON
CAMEROONS DEVELOPMENT CORPORATION PROJECT
SU?.ARY
i. The Federal Government of Cameroon has asked the Bank and theAssociation to help finance the development program of the CameroonsDevelop.ment Corporation (CAMDEV).
ii. CAMDEV, a statutory authority of the Government of WestCameroon has 22,400 hectares of plantations under oil palm, rubber,bananas, cocoa, tea and pepper, including 5,500 hectares of immature plant-ings. The development program, which would expand the total area to about33,100 hectares by the end of 1974 is concentrated mainly on oil palm.The total cost of the program from 1967 through 1974, excluding interest,is about US$25 million, including costs associated with bringing existingimmature plantings into production and the replacement of equipment. Anestimated additional US$4 million will be required to bring immature areasat the end of 1974 into production and to provide the necessary processingfacilities. Thus the total cost of the program is estimated at US$29million.
iii. The project proposed for Bank and IDA financing from 1967 through1974 comprises the development of approximateiy 11,500 hectares, consistingof 8,500 hectares of new planting and 3,000 hectares of replanting, bringinginto production the existing 5,500 hectares of immature plantings and theprovision of processing facilities and other equipment. The cost of theproject from 1967 through 1974 is estimated to be US$19 million, and an esti-mated additional US$3 million will be required to complete the project thusbringing the estimated total cost to US$22 million.
iv. CAMDEV's financial history is poor and its position has beenextremely difficult due to low earnings and a high proportion of debtfinancing. However, the capital structure has been reorganized and theCorporation has been placed on a sound basis to carry out its future devel-opment. The management is good.
v. CAMDEV's total capital requirements from 1967 through 1974 amountto US$31 million, including interest financed during this period and in-creases in working capital. This would be met by the proposed IDA creditof US$11 million and Bank loan of US$7 million, self-generated funds, and aloan from the European Economic Community of US$6 million.
vi. The project is suitable for the proposed Bank/IDA financing. TheIDA credit of US$11 million would be made to the Federal Government whichwould contribute the proceeds to the Corporation as equity. The Bank loanof US$7 million would be made to CAMDEV for a term of 30 years with a graceperiod of 8-1/2 years. The Bank loan would be disbursed after the IDAcredit has been fully drawn. Interest and commitment charges would befinanced until the end of the disbursement period. Since any plantationinvestment program must be reviewed annually in the light of changing com-modity prices, agricultural conditions and other factors, disbursement wouldbe subject to the Bank's approval of annual revised estimates for the com-plete development program.

FEDERAL REPUBLIC OF CAMEROON
CAMEROONS DEVELOPMENT CORPORATION PROJECO'C
1. INTRODUCTION
1.01 In July 1965 the Government of Cameroon applied to the Bank for aloan to help finance the development program of the Cameroons DevelopmentCorporation (CAMDEV). A mission consisting of Messrs. Darnell, Whyte,Andreu, Humphrey and Akhurst (FAO Consultant), visited West Cameroon betweenNovember 21 and December 12, 1965, to appraise this project. As a resultof discussions with CAMDEV, which took account of information not availableat the time the application was made, the program was modified to consistof the planting or replanting between 1967 and 1974 of approximately 12,300hectares of oil palm, 2,500 hectares of rubber, 1,000 hectares of tea and70 hectares of pepper. The development program also includes housing forlabor, roads, railways, vehicles and factories required both for existingareas and the new planting. The European Economic Community (EEC) is ex-pected to make a loan to cover the costs of a 4,400 hectares block of oilpalm together with processing facilities and the balance of the programwould be covered by Bank/IDA financing and self-generated fùnds. This reportrecommends that the Bank/IDA financing should cover CAMDEV's requirementsbetween 1967 and 1974. Expenditure on the planting programa after 1974 isassumed to be covered by self-generated funds. In some years between 1967and 1974, CAMDEV's requirements will exceed the cost of the planting programmentioned above since there are substantial areas of immature crop whichneed funds to enable them to be brought to maturity. This situation wasmainly caused by the fact that CAMDEV became ineligible for an equity con-tribution of L 2 million from the Colonial Development Corporation (CDC)when West Cameroon left the British Commonwealth. This contribution wasexpected to follow a loan of E 1 million made by CDC in 1960 for the develop-ment of CAMDEV. Until 1970, CAMDEV's surpluses available for bringingexisting immature areas 'nto production will be insufficient to cover theirrequirements. The Bank and IDA will help to finance this gap in additionto the new program.
2. BACKGROUND
General
2.01 At the end oa the First World War the former German colony ofKamerun was put under League of Nations mandate. The League gave GreatBritain a mandate to administer the western part, in the form of two trustterritories called Northern Cameroons and Southern Cameroons. France wasgiven a mandate to administer Eastern Cameroons. The British trust terri-tories were administered as regions of Nigeria. In 1961 a plebiscite washeld in the British trust territories. The people of Southern Cameroons,in which all CAMDEV plantations are situated, voted to -loin the newly inde-pendent republic of East Cameroon to form the Federal Republic of Cameroon,while those in Northern Cameroons voted to join Nigeria. After unificationSouthern Cameroons was renamed West Cameroon. The newly formed FederalRepublic of Cameroon came into existence on October 1, 1961. Tle unifica-tion of the two parts of the Republic has been slow, but it is likely to

accelerate in the near future. Fiscal harmonization took place during1966 and at the same time the Customs and Economic Union of Central Africacomprising Cameroon, Chad, Gabon, Central African Republic and Congo(Brazzaville) came into existence. This will progressively create a commonexternal tariff, with preferences for countries of the European EconomicCommunity (EEC). The countries of the Customs and Economic Union will enjoyfree entry for most of their products into the EEC under the AssociationConvention of Yaounde of 1963.
2.02 The economy of West Cameroon is almost entirely agricultural.CAMDEV is the largest single enterprise with 75 per cent of the plantationland and 9 per cent of the total cultivated land, providing 30 per cent ofthe region's exports. CAMOEV's development program forms an important partof the total investment program for the region envisaged in the five-yeardevelopment plan 1966-1970 of Cameroon. The Corporation's proposed develop-ment expenditure between 1966 and 1970 amounts to CFAF 3.6 billion as com-pared with projected total public investment of CFAF 16 billion and privateinvestment of CFAF 6 billion in the region. Over two-thirds of CAMDEV'sinvestment expenditures between 1967 and 1974 will be on the development ofoil palm. This, on present projections, is the most profitable tree cropthat can be grown there under prevailing conditions. It also fits in wellwith the government's plans for the development of smallholder productionthrough nucleus estates. CAMDEV will have an important role to play both inthe management of such nucleus estates and in the subsequent marketing of theproduce. The development program of CAMDEV thus makes up an important partof the development plans for the region as a whole. It will also make asubstantial contribution to the foreign exchange earnings of Cameroon as awhole, since CAMDEV provides about 5 per cent of the Federal Republic'sexport earnings.
The Corporation
2.03 The Cameroons Development Corporation, established in 1946, is astatutory authority of the Government of West Cameroon. Its Board isappointed by the Prime Minister of West Cameroon and the Financial Secre-tary is an ex officio member. The function of the corporation is to "securethe development of such lands as the Prime Minister of West Cameroon mayfrom time to time place under their control and management".
2.04 At the beginning of the Second World War, the British Custodianof Enemy Property, for the second time in the century, took over the German-owned plantations in what was then the British Trust Territory of SouthernCameroon. These plantations lay mainly on the southern and southwesternslopes of Mt. Cameroon. After the war, CAMDEV was set up as a statutorybody to manage and develop these estates on behalf of the Government.Throughout its life CAMDEV has been plagued by financial problems. Mostplantations are financed by risk capital. CAMDEV, however, was forced tofinance its development entirely by self-generated funds and sporadic long-term borrowings. Repeatedly, development programs were started, only to beeut back through shortages of funds. Considering this hand-to-mouth exis-tence, CAMDEV managed surprisingly well between 1947 and 1955. In these

- 3 -
years the main emphasis was on bananas with some oil palm, rubber, tea,cocoa and pepper. lowever, from 1955 onwards the area under bananas beganto decline, largely due to the ravages of Panama disease.
2.05 Until the end of 1958, CAMDEV's expansion was largely limited towhat it could finance out of earnings. However, the year 1959 was a disas-trous one for the Corporation. Wind and storm losses together with flooding,pests and a number of diseases had a calamitous effect on the banana crop.The loss for that year was E 587,000 (CFAF 402 million). It became clear in1959 that external finance would be needed for future development and nego-tiations were begun between the Federal Government of Nigeria and theGovernment of Southern Cameroons on the one hand and the then ColonialDevelopment Corporation (CDC) on the other. The outcome was that CDC agreedto invest E,3 million in CAMDEV, one of the conditions being that CDC becametheir Managing Agents. It was also agreed that the area under bananaswould continue to be reduced and emphasis placed on permanent crops. Aloan agreement for E 1 million was signed in 1960 and the amount was drawnbetween 1960 and 1962. The provision of the remaining E 2 million was madeconditional on the reconstitution of the Corporation as a joint stockcompany. Before the reorganization could take place, the Southern Cameroonsjoined the Cameroon Republic. The departure from the Commonwealth precludedCDC from making further investments, so that the remaining E 2 million wasnever committed and the reorganization was not effected. This led tofinencial difficulties, since the deveLopment program started with the ini-tial loan had to be carried out without the aid of the remaining E 2 million.However, CDC remained managing agents of CAMDEV.
2.06 CAMDEV has had mixed fortunes in recent years. This can be seenfrom the income statements and balance sheets from '962 to 1966 shown inAnnexes 1 and 2. In 1962 there was a loss of CFAF 219 million, the effectof which was compounded by the Corporation having to pay its 1961 profitof CFAF 33 million to the Government.
2.07 There was an improvement in 1963. Although bananas had theirworst year ever and showed a net deficit on trading, increases in productionof rubber and palm products and the higher selling prices of the latter,combined with generally lower production costs, resulted in a net profit ofCFAF 25 million. At the end of 1966 this amount was still owed to theGovernment.
2.08 There was a setback in 1964 when the loss was CFAF 58.4 milliondue to lower production of the three main crops. Bananas suffered from wind-storm damage, palm products from adverse weather and rubber from a lower in-tensity tapping system combined vith unofficial strikes. It was fortunatethat the lower production was partly coepensated for by much higher pricesfor bananas and palm products. In 1964 an agricultural mission from theCommonwealth Development Corporation visited West Cameroon to map out a de-velopment program for CAMDEV. The report of this mission was adopted by theCAMDEV Board, and its result embodied in loan applications to the Bank andEEC. External finance would have been needed to finance even the smallestof development programs, since the poor earnings over the last five yearsresulted in a continual cash shortage. In 1963 CAMDEV had to raise a loan

of CFAF 277 million locally from the Banque Camerounaise de Developpement (BCD)and between 1963 and 1966, bank overdraft increased from CFAF 80 million toCFAF 264 million, with a maximum of approximately CFAF 350 million in 1964.There was no long-term capital available during this period. Capital expend-iture had to be kept to a minimum, and a policy of "minimum replacement" wasadopted. In addition, some development expenditure on existing immatureacreage had to be neglected.
2.09 1965 was a better year. With little price change and a muchlarger crop, bananas showed a small surplus. The rubber price fell slightly,but a 25 per cent increase in production produced a considerably higherprofit. The price for palm products continued to rise and profits on thiscrop were at record levels. Tea production increased by 50 per cent and forthe first time made a significant contribution to CAMDEV's profits. TheCorporation's net profits for 1965 were CFAF 46.5 million.
2.10 The provisional results for 1966 show that CM4DEV achieved a smallprofit of CFAF 17.4 million. As a result of lower sales and a drop in theprice of palm oil, the surplus on palm products fell sharply, but the losson bananas was eliminated and tea profits showed a useful increase. Theresults on rubber, cocoa and pepper were about the same as in 1965.
2.11 At present, the Corporation's total concession is 88,545 hectares.Of this, 22,411 are under crops, with 12,361 hectares under rubber, 8,220hectares under oil palm, 1,014 hectares under bananas, 468 hectares undercocoa, 321 hectares under tea and 27 hectares under pepper. This makesCA1EV one of the largest tropical plantation enterprises in Africa. CAMDEVpays a rent of CFAF 24 million per year to the West Cameroon Government onits total concession. At present, the Corporation employs about 12,000people. This labor force accounts for more than 20 per cent of the totalnumber of wage earners in West Cameroon.
2.12 In 1966 CAMDEV produced 12,000 metric tons of bananas, 6,700 metrictons of rubber, 6,400 metric tons of palm oil, 209 metric tons of cocoa, 428metric tons of tea, and 39 metric tons of pepper. All the rubber and pepper,and most of the palm products are sold on the London market. Bananas aresold under a contract with Elders and Fyffe's, who guarantee to buy allCAMDEV's production at a fixed price f.o.b. West Cameroon. At present, mostof the bananas are being exported to France. Cocoa is sold through a govern-ment marketing board, while the bulk of tea production is sold on the localmarket, much of it being collected by merchants from the factory itself.
3. THE PROJECT
Definition
3.01 The project is part of CAMDEV's development program for the period1967 to 1974 and consists of the planting or replanting of approximately11,500 hectares of oil palm, rubber, tea and pepper, the bringing into pro-duction of approximately 5,500 additional hectares of existing immature

- 5 -
plantings, and the provision of the necessary infrastructure, processingfacilities and other equipment. The project is in the southern part of WestCameroon on CAMDEV's present concession.
3.02 The development program will be controlled by the General Managerand management staff of CANLEV. Its main objective is to increase the pro-duction and efficiency of CAMDEV, thereby making a major contribution to theeconomy of the country. By 1984, when all projected plantings are at fullmaturity, total annual production should be almost five times presentproduction.
3.03 In addition to the project, the program includes the planting of4,380 hectares of oil palms which would be almost wholly financed by a loanof US$6.4 million from the EEC. This loan bas been under discussion forsome time and is expected to be signed within a few months. The Bank loanand IDA credit will not be made effective until a resolution of the Commissionof the EEC approving the EEC loan has been adopted.
The Planting Program
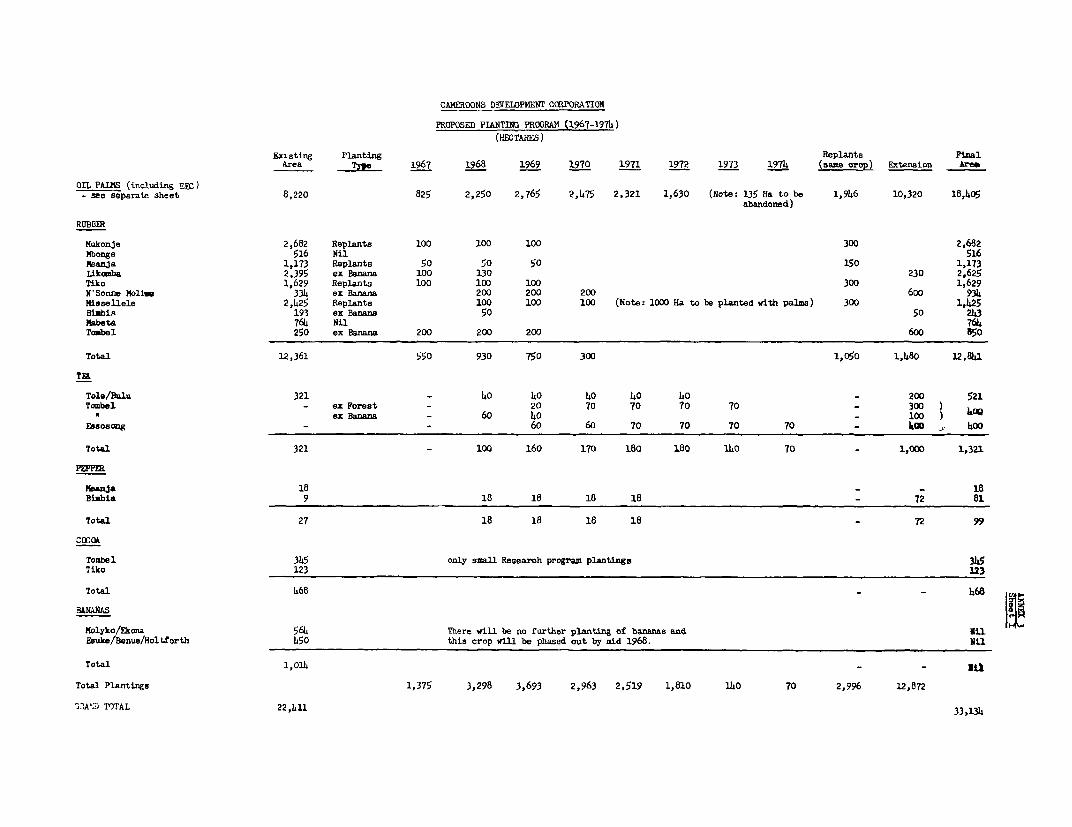
3.04 The main planting program will be completed in six years, thoughtea planting will continue for eight years. The rubber program consistsmainly of the replanting of existing rubber areas. The oil palm programconsists of some replanting of existing palm area, some new planting onexisting old rubber plantations, on abandoned banana land, on secondary bushland and on forest land. The tea and pepper development will all be onabandoned banana land or on land formerly cleared for other crops. Theareas of each crop are shown below.

- 6 -
Sunxnarized Program - 1967-19,74
in Hectares
Oil Palm Rubber Tea Pepper Cocoa Bananas Totals
Bank/IDA ProJect
Replanting 1,946 1,050 2,996
New Planting onforest land 2,200 2,200
New Planting onsecondary bush,ex banana andex rubber land 3,740 1,48o 1,000 72 6,292
Total Replantingand new planting 7,886 2,530 1,000 72 11,488
Bringing to pro-duction of existingimmature plantings 625 4,882 5,507
Total Project 8,511 7, 12 l,000 72 16,995
EEC Project
New Planting onforest land 4,380 _4,380
Total Program 12,891 7,412 1,000 72 21,375
Existing matureplantings 7,595 7,479 321 27 468 1,014 16,904
Less: replaced byother crops orabandoned (135) (1,000) (1,014) (2,149)
7,460 6,479 321 27 468 - 14,755
Total new plantinginc. existingimmature areas* 10,945 6,362 1,000 72 - - 18,379
Final Plantedarea 18,405 12,841 1,321 99 468 33,134
* Total Program less Replanting
The detailed planting schedules for estates are shown in Annex 3 and the mapsshow the location of the estates.
3.05 The allocation of specific crops to particular areas has been madewith proper consideration for rainfall, altitude, slope of land and soilproperties. In general, the agricultural and climatic conditions have proved

- 7 -
themselves to be excellent for the growing of rubber, oil palm, tea andpepper. Fertilizers will be used on the basis of experience on differentsoil types, fertilizer trials and chemical foliage analysis. There is ade-quate technical information for the control of the existing major pests anddiseases. It has been decided that banana production is unlikely to beprofitable in the future and it will be phased out during 1968. This willrelease 1,014 hectares for other crops.
Research
3.06 CAMDEV have their own research unit located at Ekona headed by aSenior Research Officer respons-ble to the Agricultural Advisor of CAMDEV.This unit has done valuable work in the past - much of it on bananas. Atpresent, the unit benefits considerably by its close association with theFrench research institutes which have two staff members resident at Ekona.These research institutes operate principally in the ex French territoriesthroughout West Africa and also in the remainder of the world. As a resultof its collaboration with these institutes, CAMDEV has access to comprehen-sive research studies on related problems throughout the world, as well asconsulting privileges on any specific problems which may arise.
3.07 The CAMDEV research unit maintains a laboratory where soil andleaf analyses are carried out. The Federal Government, who are responsiblefor agricultural research in Cameroon, have agreed to post specialist staffto Ekona to further strengthen the unit. These arrangements provide CAMDEVwith excellent research facilities which enable their techniques to becontinually improved.
Planting Material
3.08 Planting materials for all crops will be produced on CAMDEVestates. Sufficient amounts for the program will be available except foran estimated small deficiency of oil palm seeds in 1967, which can be madeup by purchases from the Institut de Recherches pour les Huiles etOleaginaux (IRHO). IRHO is the French research institute specializing inoils and oil seeds and has five experiment stations in West Africa includingone in Cameroon.
3.09 The tea seed garden planted on Tole estate in 1928 is the sourceof all West Cameroon tea plants, and the good performance of Tole plantingsjustified its use for tea stump planting in the tea extensions. Threepepper varieties, which are already developing well at Bimbia estate, are tobe used as cuttings for new pepper plantings. Prom the great variety ofmodern rubber clones available in West Cameroon, mostly imported from theFar East, a choice has been made of four to be planted as budded stumps inthe rubber extension. Rubber budwood and stump nurseries have been estab-lished on all rubber estates and, with annual replacements, ample numbers ofbudded stumps are produced. IRHO is collaborating with CA1DEV in supervisingthe oil palm selection and breeding program, and high quality seedlings willbe available from the CAMDEV oil palm nurseries.

- 8 -
3.10 The adoption of new techniques for producing planting materialsfor tea and rubber, together with new planting procedures, are likely tolead to planting cost econormies and to earlier maturity.
Yields
3.11 The future production from the different ages of all plantings ofall the crops has been estimated, after taking account of present yields andlikely increases due to improved planting material, use of fertilizer andbetter processing facilities. The yields used are given in Annex 4.
Labor
3.12 Tne peak agricultural labor requirements of the program will in-crease considerably the current labor force of about 12,000. The Corporationis confident that it will have no difficulty in recruiting the necessarylabor, some of which will be available locally, the rest being recruited fromthe Bamenda area in the north of West Cameroon. In the past, the Corporationhas recruited considerable amounts of labor in the Bamenda area and have hadno difficulty in doing so, so long as potential recruits were satisfied thatthey would have security of emuployment. With the training provided on theestates, the new recruits have no difficulty in carrying out their tasks,provided they are properly supervised. This supervision is judged to beadequate.
Field Development Costs
3.13 The unit field development costs for each crop are shown in Annex5, and total costs in Annex 6. These costs were agreed between the missionand CAMDEV in the field and are based on CAMDEV's recent experience, andare also in line with similar field costs for the same crops elsewhere.They include the rise in basic wage rates averaging ten per cent which tookplace in 1966. This rise compensates the labor force for the rise in thecost of living caused by the fiscal harmonization of West and East Cameroontaxes and duties, which took place during 1966. The development costs alsoinclude a 15 per cent contingency provision, which should be adequate.
Processing Facilities and Other Fixed Assets
3.14 The additional factory and processing facilities and other fixedassets which are concomitant with the crop area expansion have been phasedto use present facilities as long as possible.
3.15 The existing palm oil mills are operating well below 50 per centcapacity. However, the increased production from the new plantings, to-gether with the regrouping of the oil palm areas will mean that three newmills will be required, including one for the EEC palm area. As a result ofthe regrouping, one of the existing mills (Mpundu), which has outdatedequipment, is to be scrapped. New rubber processing plans require nine moreunits by the time full maturity is reached (i.e. one factory per additional1,000 tons of dry rubber). Because of the rapidly changing new development
- 9 -
in methods of presentation of natural rubber for world markets, final deci-sion on the type of processing equipment to be installed will be left untilfurther information on the processes, i.e. dynat, hevea crumb, etc. becomesavailable.
3.16 The main new development of tea on Essosong and Tombel estateswill require two new factories, while extensions to the existing Tole factorywill take in the crop from the Bulu planting. No elaborate equipment isforeseen for pepper treatment at Bimbia, which will be conventionally sundried.
3.17 The movement after harvesting of the different crops into thefactories presents few problems. Within the principal estate areas, atrolley rail system exists which will require some maintenance and replace-ment expenditure, and extensions of the rail lines in two or three years time.Use is also made of trucks, oil tankers, tractors and trailers, with somebarge transportation. Generally, this equipment has to be modernized, ex-panded and some of it replaced. In terrain where mechanized land prepa-ration is feasible, additional tractors and ancillary equipment are neededto speed up the work. The schedule of additional fixed assets associatedboth with the 1967-1974 planting program and with the increasing productionfrom present immature areas is shown in Annex 6. The composition, costs andphasing of these assets are reasonable.
Total Investment Costs
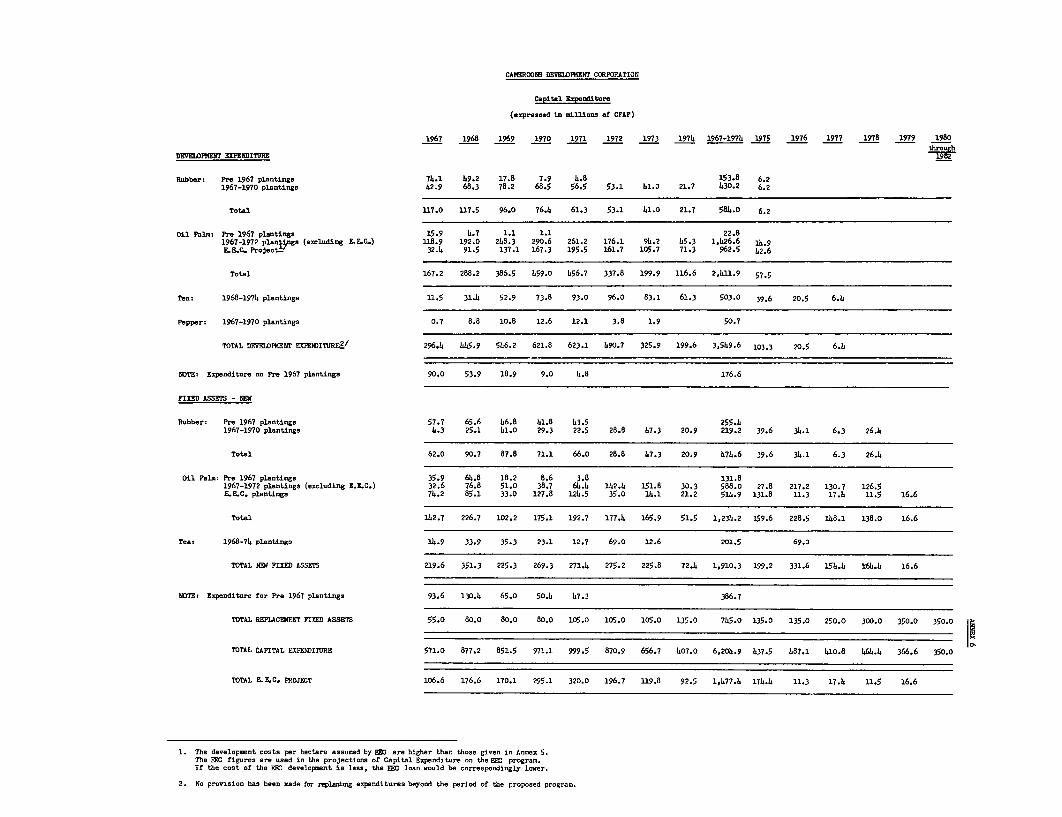
3.18 The following table summarizes the field development costs andcosts of fixed assets during the period of the project (1967 to 1974) to-gether with the costs after 1974 of bringing immature areas to productionand providing the necessary processing facilities. Total developments costsof the project are estimated at CFAF 5,492 million (US$22.2 million) and ofthe program at CFAF 7,201 million (US$29.1 million).

- 10 -
Expenditures 1967-1974
Development Fixed Asset Total ExpendituresCost COst 1967-1974 After 1974* TOTAL
(In CFAF Million)
Bank/IDA Project
Rubber:New/Replantings 430 255 685 112 797Existing immature 154 219 373 373
Total 584 474 1,058 112 1,170
Oil Palm:New/Replantings 1,426 132 1,558 517 2,075Existing immature 23 588 611 611
Total 1,449 720 2,169 517 2,686
Tea:New Planting 503 201 704 136 840
Pepper:New Planting 51 51 51
Replacement of fixedassets _ 745 745 745
Total Bank/IDA Project 2,587 2,140 4,727 765 5,492(Equivalent in millionsof' US$) (10.47) (8.66) (19.13) (3.10) (22.23)
EEC Project
Oil Palm:New Planting 963 515 1,478 231 1,709
Total cost of program 3,550 2,655 6,205 996 7,201(Equivalent in millionsof US$) (14-37) (10.75) (25,.12) (4.03) (29.15)
* Required to bring immature areas to production and provide the necessaryprocessing facilities.
It is estimated that the foreign exchange costs amount to about 20 per centof the development costs and 85 per cent of' the cost of fixed assets - i.e.about US$9.5 million from 1967 to 1974 or 50 per cent of the project costsduring that period. This figure does not include interest during thedevelopment period.

M4arketinE_and Prices
3.19 The marketing arrangements for each crop and the price assumptionsused in forecasting the future earnings of the Corporation are described inAnnex 7. The present marketing arrangements were described in para. 2.12.A convention was signed in October 1965 between the Federal Ports Authorityand the Corporation to bring about the transfer of the ports to the PortsAuthority. In August 1967, the quays, buildings and certain fixed assetswill be taken over by the Ports Authority. Stevedoring, lighterage andallied activities will continue to be run by CAMDEV.
3.20 The unit price assumptions used to forecast CAMDEV's future earn-ings have been based on IBRD Commodity Division forecasts after consultationin the field with CAMDEV's staff. Account has been taken of the harmoniza-tion of the West and East Cameroon export duties, but no account has beentaken of future preferences which may become established in the countriesof the EEC. It is, of course, impossible to forecast commodity prices withany degree of confidence, particularly over the 17 years which will elapsebefore the final plantings of the new program reaclh full maturity. Theearnings projections have been based on a single price for each commodityfor each future year. However, the program itself does permit some flexi-bility. Each year it will be revieved and future plantings determined inthe light of new price forecasts and cost estimates. In addition, there issome flexibility in techniques. For example, rubber tapping techniques canbe varied in accordance with prevailing price levels. These might be adoptedif rubber prices fell to levels lower than those usedlin the projections.For the purpose of the earnings projections, it has been assumed that allCAMDEV's rubber, pepper and bananas and most of the palm products will beexported, while all the tea will be sold on the home market.
4. FINANCIAL ASPECTS
Present Financial Position
4.o1 Reference has been made in paragraphs 2.04 to 2.10 to CAMDEV'scontinuous financial problems. These have resulted in its present poorfinancial position with a heavy burden of indebtedness and no cash workingcapital. The Corporation's cash difficulties were to some degree aggra-vated by the operation of Clause 19 of the former CAMDEV Ordinance whichrequired the profit in any year to be paid to the West Cameroon Governmentvithout any deduction for losses carried forvard or proper provision beingmade for development. However, while the profit for 1963 will be paid tothe Government during 1967, assuirances have been received that no furtherpayments vill be made before December 31, 1975.
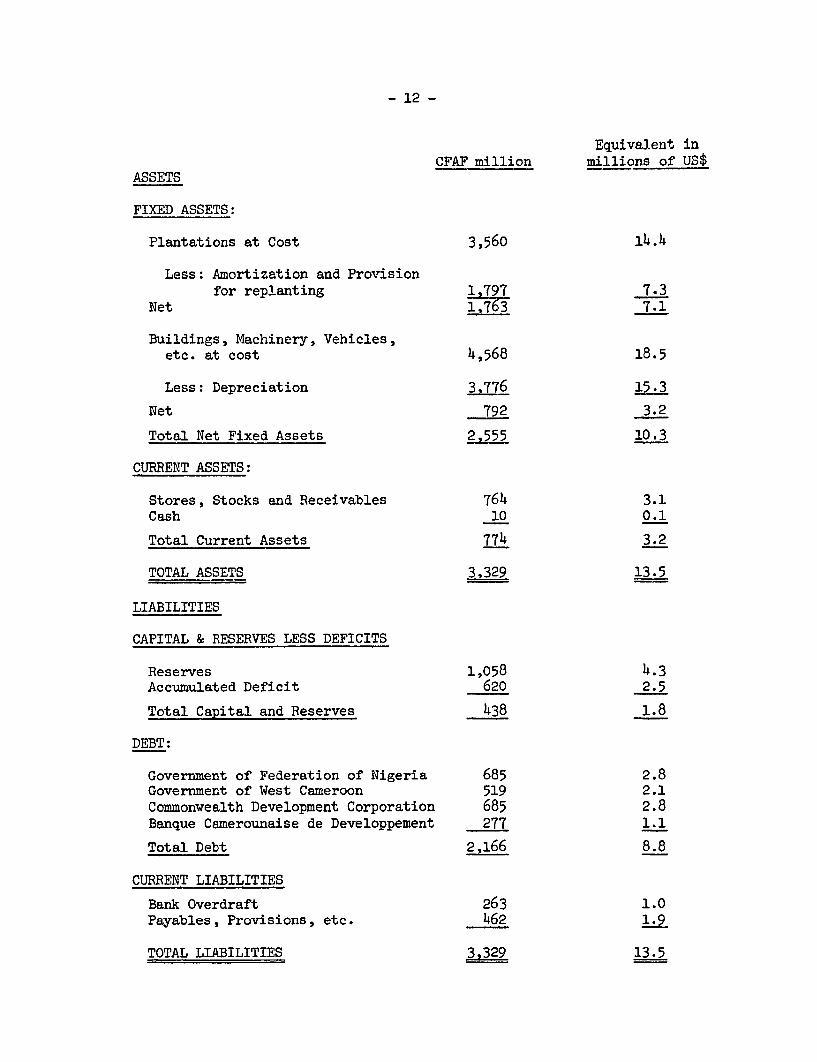
4.02 The obligation to pay its annual profits to the Governmentencouraged CAMDEV to maximize its transfers to reserves. On the other handthe Corporation vas unable to write off past losses. As a result the bal-ance sheet figures given in Annex 2 for reserves, accumulated loss, amorti-zation and provision for replanting are somewhat artificial. The followingis a summary of the provisional balance sheet at the end of 1966:
- 12 -
Equivalent inCFAF million millions of US$
ASSETS
FIXED ASSETS:
Plantations at Cost 3,560 14.4
Less: Amortization and Provisionfor replanting l,797 7.3
Net 1,763 7.1
Buildings, Machinery, Vehicles,etc. at cost 4,568 18.5
Less: Depreciation 3,776 15.3
Net 792 3.2
Total Net Fixed Assets 2,555 10.3
CURRENT ASSETS:
Stores, Stocks and Receivables 764 3.1Cash 10 0.1
Total Current Assets 774 3.2
TOTAL ASSETS 3,329 13.5
LIABILITIES
CAPITAL & RESERVES LESS DEFICITS
Reserves 1,058 4.3Accumulated Deficit 620 2.5
Total Capital and Reserves 438 1.8
DEBT:
Government of Federation of Nigeria 685 2.8Governnent of West Cameroon 519 2.1Commonwealth Development Corporation 685 2.8Banque Camerounaise de Developpement 277 1.1
Total Debt 2,166 8.8
CURRENT LIABILITIES
Bank Overdraft 263 1.0Payables, Provisions, etc. _462 1.9
TOTAL LIABILITIES 3,329 13.5

- 13 -
4.03 The debt shown in CAMDEV's balance sheét consists of US$7.7 mil-lion equivalent long-term loans from the Governments of Nigeria and WestCameroon and CDC, a US$1.1 million equivalent medium-term loan from theBanque Camerounaise de Developpement (BCD) and of bank overdrafts totallingUS$1.0 million equivalent. The details of the loans are as follows:
Lender AmountCFAF Million Interest Rate Repayment Period
Government of Federationof Nigeria 685 4% 1970 - 1987
Government of WestCameroon 519 4% 1970 - 1987Commonwealth DevelopmentCorporation (CDC) 685 7.5% 1970 - 1987
Banque Camerounaise deDeveloppement (BCD) 277 5.5% 1967 - 1968
TOTAL 2 166
4.04 The Government loans arose out of the loans made by the NigerianGoverlnment between 1947 and 1956. When West Cameroon joined East Cameroon,the total amount due to Nigeria was split and E 1,000,000 (US$2.8 million)is now held by Nigeria and E 750,000 (US$2.1 million) by West Cameroon. TheNigerian loan and other obligations to Nigeria are disputed by both theFederal and West Cameroon Governients and no interest has been paid sinceMarch 1964, although it has been accrued in the accounts. Assurances havebeen received from the Federal Government that CAIDEV will be held harmlessfrom any payments on the Nigerian loan and that if payments are resumed byCAMDEV they will be reimbursed by the West Cameroon Government which will beissued with stock for a like amount.
4.o5 The BCD loan was made in 1963 at 5.5 per cent interest and isrepayable in 1967 and 1968. The CDC loan was drawn in several tranches atvarying interest rates, the average being 7.5 per cent; it is repayable in 18annuities from 1970. The CDC loan was originally secured by a first chargeon the fixed assets and a floating charge on the current assets, but CDC hasagreed to give up this security in return for obtaining a guarantee from theGovernment.
4.o6 The Corporation's overdraft at the end of 1966 was CFAF 264 mil-lion. The total overdraft facility available to CAMDEV is CFAF 325 millionmade up of CFAF 200 million from the Banque Centrale through the SocieteCamerounaise de Banque (SCB) which is newly established in Victoria and isowned by the Federal Government and BCD, CFAF 60 million overdraft fromSCB and CFAF 65 million overdraft from Barclays Bank DCO.
Reorganization
4.07 In order to make CAMDEV's financial position less precarious itwas necessary not only to provide new capital on as generous terms aspossible but to undertake a reorganization of the Corporation's existing

- 14 -
capital structu e. In fact, a restructuring of the Corporation vas plannedin 1961 vhen it was anticipated that CDC would contribute equity capital,but it was not effected.
4.o8 The main purposes of the reorganization, which has been agreedwith the Federal and West Cameroon Governments, are to provide CAMDEV with asubstantial proportion of fixed equity capital and to reduce its indebted-ness. The following arrangements have been made:
(a) the amount of CFAF 519 million formerly due byCA1l1DEV to West Cameroon has been converted intoequity capital. This capital is held in the nameof the Marketing Board of West Cameroon.
(b) as explained in paragraph 4.04, CAMDEV will beheld harmless from any payments in respect of thedebt shown as due to the Republic of Nigeria.
(c) the proceeds of the proposed IDA credit will becontributed to CAMDEV as capital, issued in thename of the Federal Government.
Accounting System
4.09 The Corporation has a satisfactory accounting organization headedby a suitably qualified financial controller. As a result of discussionsbetween the Bank and CAMDEV and recommendations made by the Bank, a formof accounts has been instituted which will both provide the necessarycosting and financial information to the Corporation's management and theBank and enable the goods financed out of the loan and credit to beidentified.
Audit
4.10 The audit is carried out by Akintola Williams & Co., a Nigerianfirm which replaced Peat, Marwick, Casselton Elliott, in 1964. The presentarrangements appear satisfactory and assurances have been received thatCAMDEV shall have its financial statements certified annually by an account-ant or accounting firm acceptable to the Bank and shall promptly transmitto the Bank certified copies of the financial statements and auditors report.
Depreciation and Amortization
4.11 The Corporation provides for depreciation on its buildings, instal-lations and mechanical equipment on a straight-line basis using conservativelives for each category of asset. Normally the Corporation also providesannually for amortization of estate development costs but from 1961 through1964 no provision was made as the accumulated amortization provision wasconsidered aeequate.
Insurance
4.12 The Corporation's insurance practices are sound and it maintainsadequate coverage against risks and liability.

- 15 -
Taxes and Duty
4.13 CAMDEV is liable to income tax but because of its low profits anddepreciation and investment allowances, no tax has been paid since 1948.For the same reason CAMDEV is unlikely to incur any tax liability in theforeseeable future.
4.14 The Corporation is liable for export duty on the value of itscrop proceeds. However, in the case of rubber no duty is payable below aprice of CFAF 120 per kilo and no provision has been made for payment ofexport duty on rubber in the attached forecasts. Under the Federal Invest-ment Code of 1964, undertakings of special importance to the economic devel-opment of Cameroon can apply for exemption from import duties. Assuranceshave been received from the Federal Government that CAMDEV will be exemptfrom import duty on all goods imported by the Corporation for the programuntil the end of 1975 with the exception of consumer goods for the use ofpersonnel, goods for resale and petrol, diesel and fuel oils.
Future Earnings
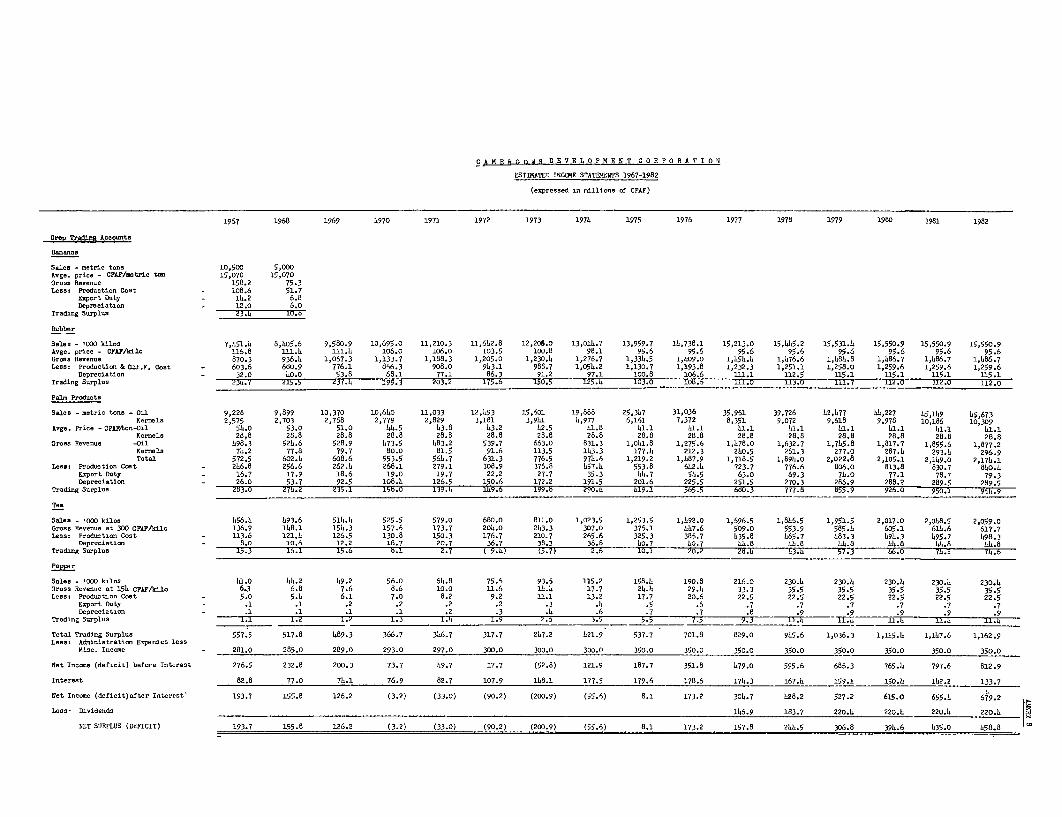
4.15 Estimated income statements for 1967-1982 are given in Annex 8.They are based on the yield and price assumptions detailed in Annexes 4 and7. Production costs have been estimated on the basis of historical andcurrent costs allowing for future wage increases and for improved productiontechniques. Depreciation of fixed assets has been calculated on a straight-line basis for each class of asset; the lives used are conservative. Noprovision has been made for amortization of estates or for replanting butthe Corporation will make such annual provision as the directors deemnecessary.
4.16 The results shown by the earnings forecasts are poor until theprogram comes into full production after 1977. The estimated fall in com-modity prices causes a rapid decrease in the profits from rubber and, to alesser extent, from palm products. The trading surplus on rubber is esti-mated to fall from CFAF 235 million in 1967 to about CFAF 103 million in1975, after which it should remain at a little over this level. The surplusfrom oil palms is shown to decrease from CFAF 283 million in 1967 to CFAF 139million in 1971, but after that it should rise quickly to reach aboutCFAF 965 million by 1982. Tea profits are estimated to be negligible forthe first five years and a loss is shown for the next two years, but there-after tea should make an increasing contribution to overall profit. Theresults from bananas, of which production will cease in 1968, and pepperare not likely to affect future earnings materially.
4.17 After providing for administration expenses and interest, all ofwhich is charged to income, the statements show annual losses from 1970through 1974 with a maximum of CFAF 201 million in 1973. After 1975, netincome after interest and dividends (which are assumed start in 1977) is esti-mated to increase to CFAF 459 million by 1982.
4.18 The income forecasts present a gloomy picture for many yearsahead. However, the forecasts are based on conservative assumptions ofcommodity prices and yields and include generous provision for production

- 16 -
costs and depreciation. The actual results may therefore improve consider-ably on the forecasts, but even if they do not, the long-term prospects ofthe Corporation are shown to be good.
Dividends
4.19 Assurances have been received that no dividends will be paid untilafter December 31, 1975. Thereafter dividends will be paid by the directorsfrom the net profit remaining after they have set aside such sums to reservesas they deem necessary or expedient. The forecasts assume that dividendswould be paid on total share capital as follows:
1977 - 4%1978 - 5%1979 and onwards - 6%
This dividend rate could be substantially higher if the results achieved arein line with or better than the projected income statements.
Financing Plan
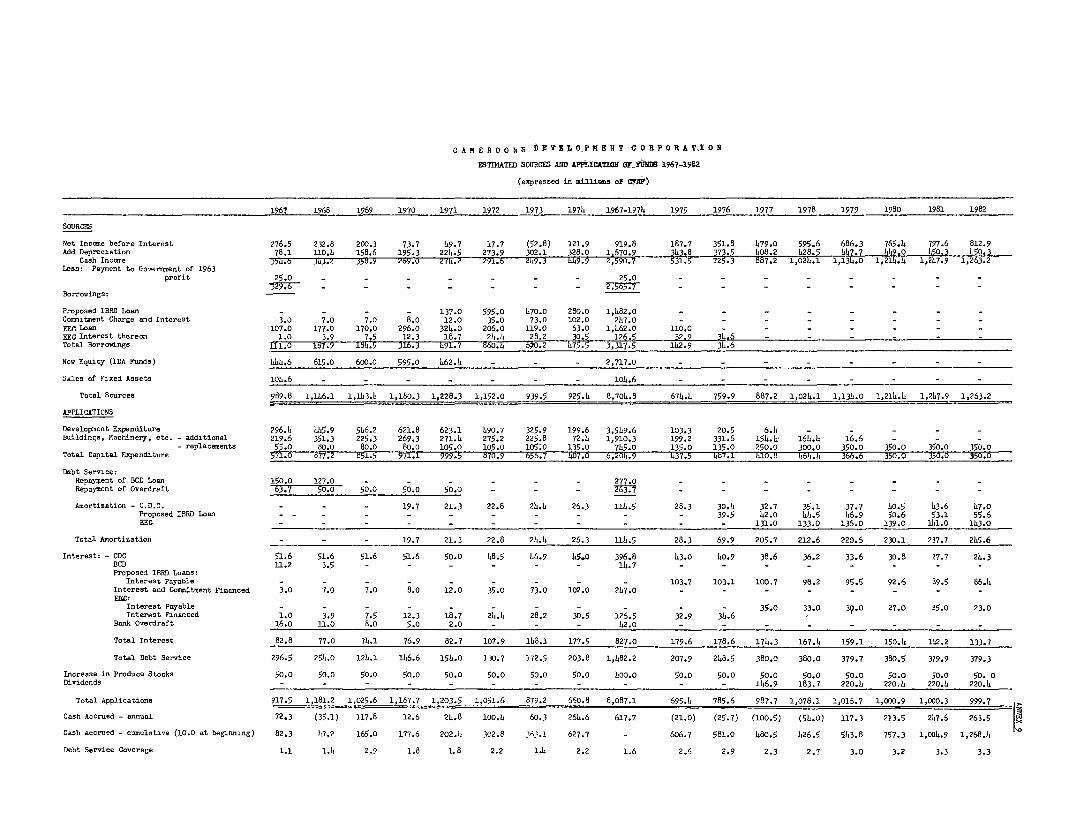
4.20 The proposed financing plan for the program, which is shown in thestatement of sources and applications of funds in Annex 9, assumes that theCorporation's requirements will be met out of earnings and its other cashreceipts, the proposed IDA credit of US$11 million (CFAF 2,717 million), theproposed Bank loan of US$7 million (CFAF 1,729 million) and the expectedloan from EEC.
4.21 In order to build up the equity capital of CAMDEV as quickly aspossible it is proposed to disburse the IDA credit first and it is estimatedthat disbursements will be completed by the end of 1971. It has been ex-plained in paragraph 4.08 that the proceeds of the credit will be contributedas capital to the Corporation by the Government and the Government will alsobear the service charge on the credit.
4.22 It is estimated that the Bank loan will be disbursed between 1971and 1974. It has been assumed that the loan will be at 6% interest with acommitment charge of 3/8 of 1% and would be for a term of 30 years includinga grace period of 8-1/2 years. Both the interest and commitment charge wouldbe financed out of the loan during the grace period.
4.23 Since a plantation investment program must be reviewed annuallyin the light of changing commodity prices, agricultural conditions and otherfactors, it has been agreed that disbursements from the c.cedit and loan willbe determined each year for the following year after the Bank has reviewedand approved the Corporation's estimates for that year and the remainder ofthe program.
4.24 It has been assumed that the EEC loan of US$6.4 million will bedisbursed between 1968 and 1974. Interest would be at 2% with interestadded to principal until the end of 1975, and repayment would be over 12years commencing in 1974.

- 17 -
4.25. The remaining sources of funds in addition to cash earnings are
the balance of the proceeds of sale of the port facilities which have beentaken over by the Government. The final instalment of CFAF 104.6 million isdue to be paid to CAMDEV in 1967.
4.26 Total capital expenditure from 1967/1974 is estimated at CFAF 6,205million. Details are given in Annex 6. Of this amount about CFAF 560 mil-lion would be on development and fixed assets from 1967-1971 in respect ofexisting immature areas. It is estimated that the Corporation would be ableto meet this expenditure out of its own resources but after doing so itwould only provide about CFAF 650 million towards the cost of replacement offixed assets which are estirmated to require CFAF 745 million in the period.The balance would be financed by the proposed IDA credit and Bank loan.
4.27 The following is a summary of proposed sources and applicationsof funds from 1967-1974:
(Equivalent in
(Millions of CFAF) millions of US$)
SOURCES
Net income before interest-/ 920 3.7Add depreciation 1 671 6.7
2- 566 Ïo7.4Less: Debt Service
Repayment of BCD Loan andbank overdraft 541 2.2
Amortization 115 0.5Interest (excl. interest 453 1,109 1.8 4.5
financed) 1,457 5.9
Borrowings:Proposed IBRD Loan 1,729 7.0EEC Loan 1,588 3,317 6.4 13.4
New Equity (IDA Funds) 2,717 11.0
Sales of Fixed Assets 105 o.4TOTAL SOURCES 7,596 30.7
APPLICATIONS
Capital Expenditure: (see para. 3.18)
Bank/IDA project 4,727 19.1EEC project 1,478 6,205 6.o 25.1
Interest financed 373 1.5Increase in produce stocks 400 1.6
TOTAL APPLICATIONS 6,978 28.2
TOTAL CASH ACCUMULATION IN PERIOD 618 2.5
1/ After payment of 1963 net profit to Government

- 18 -
4.28 The increase in produce stocks provided for, estimated at aroundCFAF 50 million annually, should be adequate. The estimated cash accumulationof CFAF 628 million by the end of 1974 will amount to a little more thanthree months cash revenue expenditures at that time and in view of theuncertainties in estimating so far ahead, it would be imprudent to allow asmaller cash margin. Should such cash accumulate in fact, it would be in-vested in the next phase of CAMDEV's development. In order to protect theCorporation's liquidity, assurances have been received that the policy of theCorporation will be to maintain its cash or undrawn overdraft facilities ata level equivalent to three months cash revenue expenditures.
Future Financial Position
4.29 Estimated balance sheets are given in Annex 10. They reflect thedeteriorating earnings until 1975. As explained in paras. 4.16 and 4.17there will be deficits in the years 1970 to 1974, but because of substantialprovisions for depreciation CAMDEV should be able to cover its debt serviceobligations with an adequate margin.
4.30 In order to insure that CAMDEV's financial position is safeguarded,its future borrowing powers have been limited. Assurances have been receivedthat except as the Bank shall otherwise agree the Corporation shall not incurany debt before December 31, 1975 without the prior approval of the Bank andthereaf'ter the Corporation shall not incur any debt if as a result thereofthe total debt of the Corporation shall be greater than its capital andaccumulated surplus. The term "accumulated surplus" is defined as excludingany surplus arising from a revaluation of assets.
4.31 Estimated Annual Yield on Total Capital Invested is shown inAnnex 11. In calculating the return, the direct payments to Government ofrent and export duty have been added back to the Net Income. It will beseen that yields deteriorate until 1973 after which a steady improvement isshown, and after 1980 the yield is above 10 per cent. This is becauseearnings until 1975 are poor and capital expenditure continues to increaseuntil this time without an immediate corresponding benefit to income.
Procurement and Disbursement
4.32 Procurement of machinery, building materials, and vehicles forthe development program would be on the basis of international competitivebidding. Disbursement of the loan and credit would be on identified importsof goods necessary for the development program and on an agreed percentageof certified planting expenditure. The detailed list of goods has beenagreed for the first year of the project.
5. MANAGEMENT, ORGANIZATION AND TRAINING
5.01 The Chairman and the Board of the Corporation are appointed by thePrime Minister of West Cameroon. CDC has two board members. The Directorof the Banque Centrale in West Cameroon and the Financial Secretary of WestCameroon are also members. The Board also includes, in addition to theChairman, a retired civil servant and a local businessman.

- 19 -
5.02 The Board meets four or five times a year, and is concerned on'lywith matters of general policy, the day-to-day operations of the Corporationbeing the responsibility of the General Manager.
5.03 Considering its financial difficulties, CAMDEV has been well managedunder the Managing Agency Agreement with CDC. Under this agreement, whichexpires in 1969, CDC supplies CMIDEV with a General Manager and his personalassistant, and also assists in recruitment. However, the planting program may entail the recruitment of additional expatriates, and CAMDEV will have to
ensure that the salaries offered are high enough to attract staff of sufficientcaliber. Assurances have been received that CAMDEV will employ in all of itssenior management positions, (including those of General Manager, AgriculturalAdviser and Financial Controller) experienced and qualified persons mutuallyacceptable to the Bank and the Corporation. The terms and conditions of anyManagement Agreement are also required to be satisfactory to the Bank. TheOrganization Chart shows the management structure. The four area managersreport directly to the general manager, as does the agrieultural advisor, chiefmedical officer, chief engineer and financial controller. Of the top ten posts,seven are occupied by expatriates, and three by Cameroonians. The totalsenior staff of CAMDEV at the end of 1966 numbered 136, 78 Cameroonians, 56expatriates and 2 Nigerians. The last few years have seen a vigorous imple-mentation of Cameroonization to reach this position, and CAMDEV is runninga number of training programs to enable this program to be accelerated with-out loss of efficiency. 27 Cameroonian staff are at present undergoingfurther education at CAMDEV's expense in Britain and Nigeria. In addition,22 management trainees are studying agriculture or science in Cameroon. CAMDEV
also provides some adult education facilities and runs tapping, palm harvest-ing, pest and disease control schools on the estates.
6. BENEFITS AND ECONOMIC JUSTIFICATION
6.01 Although the present financiaal position of CAMDEV will make itnecessary for part of the proceeds of the proposed Bank loan and IDA creditto be spent on bringing existing immature areas to maturity, the new plant-ing program, which will absorb mcst of the Bank/IDA funds, is the investmentfor which an economic return has been calculated. The return on the invest-ment in bringing existing immature areas under the same crops into produc-tion is, of course, much higher since costs already incurred would not beincluded in the calculation. Using the yields, development costs and pricescontained in Annexes 4, 5 and 7, together with estimates of unit operatingcosts for the production from the area to be planted, the discounted rateof return to the economy on the new investment in the various crops is asfollows: oil palm 16 per cent, rubber 13 per cent, tea 15 per cent and pepper21 per cent. The return on the total program is 16 per cent. This assumes a25 year life for oil palm, 35 for rubber, 50 for tea and 30 for pepper. Laborhas been costed at a rate lower than the wage rate actually to be incurred,since the wages paid by CAMDEV will be considerably higher than the contribu-
tion that the labor would make to the economy if it were not employed by theCorporation. An estimate of this "contribution to GDP in alternative employ-ment" has been made and the labor element of development and operating costs

- 20 -
reduced accordingly to 56 per cent of the labor costs to be incurred. Iffull wage coasts are used, the rates of return are oil paln 13 per cent, rubber6 per cent, tea 7 per cent and pepper 11 per cent, with the return on thetotal program 11 per cent.
6.o2 More generally, the project will also yield substantial indirectbenefits. CAMDEV is the largest single enterprise in West Cameroon, withthree-quarters of the total area under plantations, and 9 per cent of thetotal cultivated land. It employs at present a labor force of about 12,000
(over 20 per cent of total number oa vage earners in West Cemeroon), forwhom there are feu other enployment opportunities apart frca subsistenceagriculture. It mates substantial contributions to Government revenues,both directly in the form of export duties and rent and indirectly throughthe income taxes oa its employees. In 1966, it is estimated to have supplied30 per cent of the region's exports. This makes it one of Cameroon's largestexporters. It is thus important for the economy of the region and for theforeign exchenge position of Cameroon that the Corporation should be ableto operate profitably in the future and the proposed planting program is thebest way of ensuring this. This program is likely to have a considerableimpact on the future economic vell-being of West Cameroon and vill make asubstantial contribution to the economy of Cameroon as a whole.
7. CONCLUSIONS AND RECOMMNDATIONS
7.01 CAMDEV's planting program will take place under agricultural andclimatic conditions whieh have proved themselves to be excellent for thegrowing of rubber, oil palm, te& and pepper. The management is good and, ingeneral, there are few agricultural or technical problems. In addition, the
size of CAMDEV in relation to the West Cameroon economy means that a success-ful planting program with the resulting increase in production will have agreat impact on the economie activity of the whole region as well as makinga substantial contribution to the export earnings of Cameroon as a whole.
7.02 CAMDEV's recent earnings have been poor and its financiel positionhas been unsatisfactory with a high proportion of debt. However, the recentreorganization of CAMDEV's capital structure should place the Corporation ona sound financial basis. The financing plan for the programn ij satisfactoryand the Corporation should be able to meet its obligations but mainly be-cause of the expected decline in commodity prices, the Corporation's futureearnings are estimated to be poor until the development program comes intofull production.
7.03 The Bank/IDA financing is proposed to be made avaîlable only aiterannual review of estimates covering the period of the program. The programvill be revised periodically to take into account changing trends in commodityprices and agricultural conditions.

- 21 -
_Recommendations
7.04 The Development Program forms a suitabie basis for an IDA creditand Bank loan as follows:
(i) An IDA Credit of US$11.0 million to be contributed toCAMDEV by the Federal Government of West Cameroon inthe form of equityr and disbursed between 1967 and 1971.
(ii) A Bank loan of US$7.0 million for a period of 30 yearsincluding a grace period of 8-1/2 years to be disbursedbetween 1971 and 1974.
Disbursements would be subject to annual review of the estimates for thecomplete development program.
February 15, 1967.

CAMEROONS DEVELOPMENT CORPORATION
PAST INCCME STATDE2NTS
(expressed in millions of CFAF)
1962 1963 1964 1965 1966
Actual Actual Actual Actual Lovisional
Crop Trading Accounts
Bnnanas - Sales metrie tons 33,690 25,81l 15,850 18,618 13,318Average Price CFAF/smtric ton 19,044 16,877 18,599 18,5 47 19,222Gross Revenue 641.6 435.6 294.8 345.3 256.0Sales Production Cost 615.1 464.3 297.6 382.5 254.3(including depreciation Of) - 24.5 13.9 12.1 12.3
Net Surplus (Deficit) 26.5 (28.7) (2.8) (37.2) 1L7
Rubber - Sales '000 kilos 3,979 4,725 5,135 5,142 7,o44Average Price CFAF/kilo 133 127 117 117 107Gross Revenue 528.7 602.1 598.3 601.6 755.1Sales Production Cost 336.1 362.6 443.9 389.6 549.3(including depreciation or) - 26.4 25.3 35.3 36.3
Net Surplus 192.6 239.5 154.4 212.0 205.8
Palm Products - Sales oil metrie tons 4,h57 5,607 6,581 8,077 6,562kernels " " 1,483 2,085 2,230 2,706 2,017
Average Price oil CFAF/metric ton - 47,851 50,585 61,250 51,658kernels " " - 29,784 34,888 38,214 34,217
Gross Revenue oil - 268.3 332.9 494.7 339.0kernels - 62.1 77.8 103.4 69.0
Gross Revenue 239.3 330.4 410.7 598.1 408.0Sales Production Cost 165.4 131.8 265.7 298.3 234.3(including depreciation of) 31.3 28.9 32.0 32.5
Net Surplus 73.9 198.6 145.0 299.8 173.7
Cocoa - Sales '000 kilos 106 114 164 71 111Average Price CFAF/kilo ln 103 123 103.5 135Gross Revenue ll.8 11.7 20.1 7.3 15.0Sales Production Cost 21.4 23.2 20.9 21.2 26.0(ineluding depreciation of) - 1.9 2.1 2.6 3.3
Net Surplus (Deficit) (9-6) (11.5) (0.8) (13.9) (11.0)
Tea - Sales '000 kilos 83.4 112.8 193.0 321.9 4.43.4Average Price CFAF/kilo 257 242 271 237 356Gross Revenue 21.4 27.3 52.4 76.3 157.9Sales Production Cost 21.4 28.0 50.6 56.0 97.0(including depreciation Of) - 4.4 8.7 6.6 6.6
Net Surplus (Deficit) - (0.7) 1.8 20.3 60.9
Pepper - Sales '000 kilos 35.3 25.0 46.7 33.2 39.3Average Price CFAF/kilo 170 184 167 193 177Gross Revenue 6.G 4.6 7.8 6.4 6.9Sales Production Cost 3.4 2.9 5.7 3.4 6.4(including depreciation Of) - - 0.4 0.1 .1
Net Surplus 2.6 1.7 2.1 3.0 .5
Sales of Planting Material 23.3 5.2 24.7 8.9 8.5
Net Trading Surplus 309.3 404.1 324.4 492.9 440.1
Miscellaneous Income 55.1 98.7 84.5 79.5 110.5
Total Income 364.4 502.8 408.9 572.4 550.6
General 1>cpenses
Management and Overhead - Unallocated 286.4 316.9 304.2 357.5 362.8Depreciation - Unallocated 195.4 44.2 29.6 36.6 38.4
Total General Expenses 481.8 361.1 333.8 394.1 401.2
Net Income (Deficit) before Intereat (117.4) 14l.7 75.1 178.3 149.4
Interest 101.9 116.4 133.5 131.8 132.0
Net Income (Deficit) after Interest (219.3) 25.3 (58.4) 46.5 17.4
Less: Payment of Profit to Government 25.3 - -
NET SURPLUS (DEFICIT) (219.3) - (58.4) 46.5 17.4

ADEX 2
CAMEROONS DEVELOPMENT CORPORATION
B3LANcΠSHETS 1962-1966
(expi.é6d ifl K1llin» of OCFAF)
1962 1963 196
4 1965 1966
Actual Actual Actual Actual Proyisional
ASSETS
FIXED ASSETS:
Plantations at cost - Mature 1,608.7 1,763.8 2,086.3 2,323.7 2,775.0Imature 559.4 771.6 885.1 985.3 785.0Surveye 39.9 42.2 43.1 - -
Total 2,208.0 2,577.6 3,014.5 3,309.0 3,560.0
Leass Amortization and Provision for Replanting 1.397.4 1,397.5 1.650.5 1.743.2 1,797.0
Net Plantations 810.6 1.180.1 1.364.0 1,565.8 1.763.0
Buildings, Machinery, Vehicles, etc. at cost 4,400.1 4,477.4 4,502.2 4,507.4 4,568.3
Less: Depreciation 3,134.5 3,331.4 3,472.5 3,618.4 3,775.8
Net Buildings, Machinery, Vehiclee 1,265.6 1,146.0 1,029.7 889.0 792.5
Total Net Fixed Assets 2,076.2 2,326.1 2,393.7 2,454.8 2,555.5
CURRENT ASSETS:
Stores 388.5 433.5 460.4 354.5 435.0
Produce Stocks - net of sales advances 140.9 191.4 148.3 160.4 117.9
Receivables, Prepayments and Deposits 147.6 187.2 206.6 163.7 211.0
Cash 10.1 14.6 14.4 5.7 10.0
Total Current Assets 687.1 826.7 829.7 684.3 773.9
TOTAL ASSETS 2,763.3 3,152.8 3,223.4 3,139.1 3,329.4
LIA BILITIES
CAPITAL & RESERVES less DEFICIT:2/
Reserves 1,041.3 1,041.3 1,055.3 1,054.9 1,057.8
Accumulated Deficits (625.5) (625.5) (683.9) (637.5) (620.1)
Total Capital and Reserves 415.8 415.8 371.4 417.4 437.7
DEBT:2/
Government of Nigeria 692.0 692.0 685.o 685.0 685.0
Government of West Cameroon 519.0 519.0 519.0 519.0 519.0
Banque Camerounaise de Developpement 277.0 277.0 277.0 277.0
Commonwealth Development Corporation 692.0 692.0 685.o 685.o 685.0
Total Debt 1,903.0 2,180.0 2,166.0 2,166.0 2,166.0
CURRENT LIABILITIES:
Bank Overdraft 79.8 168.0 320.6 229.8 263.7
Payables and Provisions 364.7 388.8 365.4 325.9 462.0
Total Current Liabilities 444.5 556.8 686.o 555.7 725.7
TOTAL LIABILITIES 2,763.3 3,152.6 3,223.4 3,139.1 3,329.4
1/ Before net profit for year which wae paid to Government in following year and no is included in payables.
2/ The revaluation of the currency in 1964 from Fr.692 to il to Fr.685 to hl resulted in a variation in external debt.
CAMEROONS DEVE1LOPMENT CORPORATION
PROPOSED PLRNTINO PROGRAN (1967-1974)
(HECTARES)
Existirg Planting Replants Final
Area Tyr" 1967 1968 1969 1970 1971 1972 1973 1974 (sane crop) Extension Are*
OIL PALMS (including EEC)- see separate sheet 8,220 825 2,250 2,765 2,475 2,321 1,630 (Note: 135 Ha to be 1,946 10,320 18,405
abandoned)
RUBB_
Mukonje 2,682 Replants 100 100 100 300 2,682
Hbonge 516 Nil 516
Meanja 1,173 Replante 50 50 50 150 1,173
Likoba 2,395 ex Banana 100 130 230 2,625
Tiko 1,629 Replante 100 100 100 300 1,629
N Sonne Molve 334 ex Banana 200 200 200 600 934
Miasellele 2,425 Replanta 100 100 100 (Note: 1000 Ha to be planted vith palam) 300 1,425
Biubia 193 ex Banana 50 50 243
Habeta 764 Nil 7614
Tombel 250 ex Banana 200 200 200 600 850
Total 12,361 550 930 750 300 1,050 1,480 12,841
T1^
Tole/Bulu 321 - 40 40 40 40 40 - 200 521
Tombel - ex Forest - 20 70 70 70 70 - 300)
esx Bnan - 60 40 - 100)
Eeaosoeg _ 60 60 70 70 70 70 - WOO , 400
Total 321 - 100 160 170 180 180 110 70 - 1,000 1,321
PEPPE
Neanja 18 - -
Bimbia 9 18 18 18 18 - 72 81
Total 27 18 18 18 18 - 72 99
Tombel 345 orly sma. Research program plantinga 3145
Tiko 123 123
Total 468 468
Nolyko/Ekona 564 There «iU be no further planting of bananas and mil
E,uke/Benue/Holtforth h50 this crop will be phased out by mid 1968. Nil
Total 1,014 - - Bii
Total Plantings 1,375 3,298 3,693 2,963 2,519 1,810 14O 70 2,996 12,872
CRA3.D TOTAL 22,hll 33,134

CAHEROONS DEVEfPMENP T CORPORATION
PROPOSED PIANTING PROGRAM (1967-1972) - OIL PAIMS
(HECTARES)
Planting Area FinalMlii Area Existing n 1967 1968 1969 1970 1971 1972 Abandoned Replante Extensions Area
Idenau Idenau 1,882 Replants 50 50 100 100 300 1,882Debundscha 200 300 300 300 300 300 1,700 1,700
Bota Bota 2,287 Replants 25 100 100 100 125 150 600 2,287Saxenot Ebongo 1,217 1,217Mile il _ 250 250 250
Cmbe Tiko Palms - Ex Banana 400 600 600 400 2,000 2,000Tomatal Post War 489 489
n Pre War 285 Replants 50 50 50 - 135 150 150Eauke Pre War 496 Replants 100 100 100 196 496 496Ombe/Benue Extu etc. - ex Banana 50 50 50 50 200 200
Ekora Mpundu 1,564 Replants 50 50 100 100 100 400 1,564Mundame/lantango - ex Banana 75 300 300 325 1,000 1,000
- ex Forest 250 250 250EPona Estate - ex Banana 75 300 165 540 540
TOTAL OIL PALMS (excluding 8,220 825 1,850 1,765 1,475 1,321 650 1,946 5,940EEC)
_c_ Likomba2nd Bush 1400 800 h50 400 200ex Forest _ 350 350 430ex Rubber - 200 200 250 350
TOTAL EEC OIL PALMS _ 400 1,000 1,000 1,000 980 - 14,380
'mUA'D TOTAL 8,220 825 2,250 2,765 2,1h75 2,321 1,630 - 135 1,946 10,320
Total Plantings 12,266

ANNE( 4
PRODUCTION YIELDS
in Kgs/Hectares
ExistingNew or Immature Areas Mature
Years from PiantingCrop Estate 4 5 6 7 ô 9 10 11 and
onwardsPepper Bimbia 400 600 1,000 1,600 2,400
Meanja 2,000
Tea Tombel andTole/Bulu 500 800 1,100 1,300 1,500 1,650 - -
Essosong 350 600 850 1,050 1,200 1,350 - -
Cocoa Tombel 150 300 500 700 800 900 - - 700
Ikange 150 300 500 700 900 1,100 - -
Rubber PlantingYears:
1925/30 562
1931/40 898
1940/55 _ _ _ ,O10
1956/60 _ _ _ 430 750 960 1,070 1,120
1961/65 _ _ - 495 865 1,110 1,235 1,300
1966 andonwards _ _ - 515 905 1,165 1,290 1,355
Oil PalmMetric Tons Oil er Hectare:
Years from Planting5 6 7 9 10 11 12 and
onwards
Pre-Wvar 0.55
Post-War upto 1964 .40 .83 1.15 1.31 1.48 1.58 1.68 1.78
1965 andlater .42 1.04 1.56 2.00 2.40 2.57 2.72 2.84
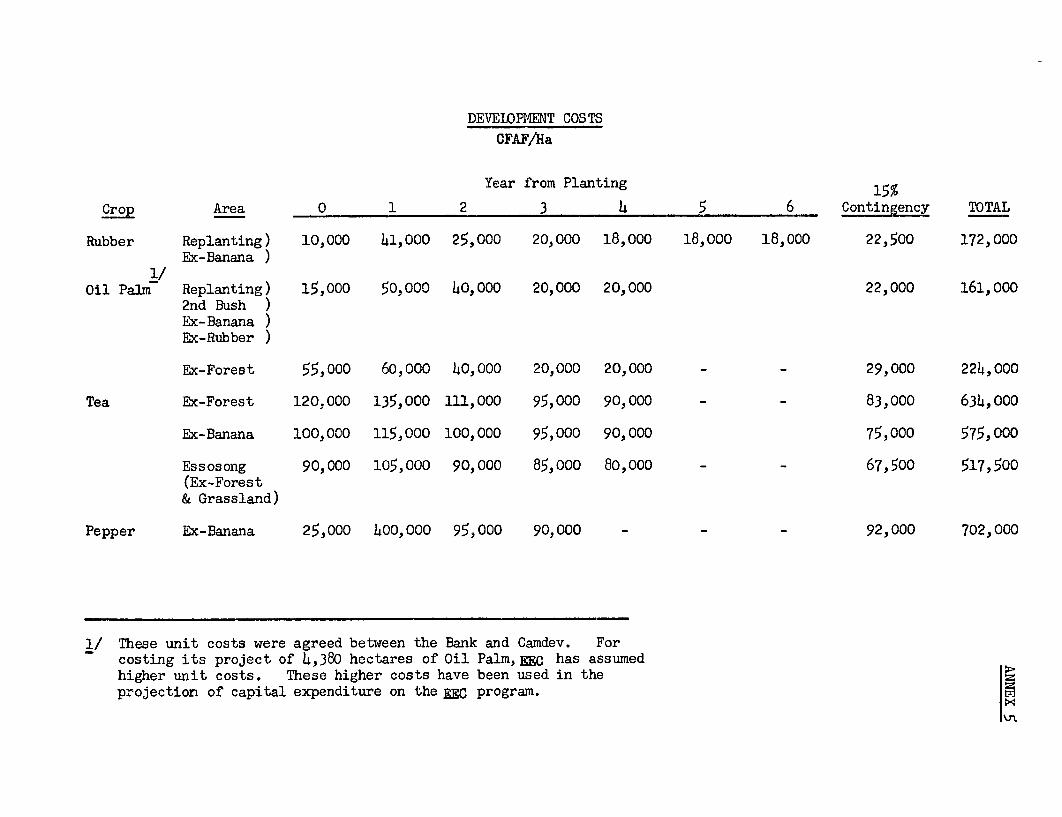
DEVELOPNENT COSTS
CFAF/Ha
Year from Planting 15%
Crop Area O 1 2 3 4 5 6 Contingenc TOTAL
Rubber Replanting) 10,000 41,000 25,000 20,000 18,000 18,000 18,000 22,500 172,000Ex-Banana )
1/Oil Palm Replanting) 15,000 50,000 40,000 20,000 20,000 22,000 161,000
2nd Bush )Ex-Banana )Ex-Rubber )
Ex-Forest 55,000 60,000 40,000 20,000 20,000 - - 29,000 224,000
Tea Ex-Forest 120,000 135,000 ll,OOO 95,000 90,000 - - 83,000 634,000
Ex-Banana 100,000 115,000 100,000 95,000 90,000 75,000 575,000
Essosong 90,000 105,000 90,000 85,000 80,000 - - 67,500 517,500(Ex-Forest& Grassland)
Pepper Ex-Banana 25,000 400,000 95,000 90,000 - - - 92,000 702,000
1/ These unit costs were agreed between the Bank and Camdev. Forcosting its project of 4,380 hectares of Oil Palm,EEW has assumedhigher unit costs. These higher costs have been used in theprojection of capital expenditure on the no program.
CAHEROONS DE7ELOPHENT CORPORATION
Capital ERprnditure
(expressed in millions of CFAF)
1967 1968 1969 1970 1971 1972 1973 1974 1967-1974 1975 1976 1977 1978 1979 1980
thr uhDEVEMPIOENT EXPENDITURE _
Rubber: Pre 1967 plantinrg 74.1 49.2 17.8 7.9 4.8 153.8 6.21967-1970 plantingo 42.9 68.3 78.2 68.5 56.5 53.1 41.0 21.7 430.2 6.2
Total 117.0 117.5 96.0 76.4 61.3 53.1 41.0 21.7 584.o 6.2
Oil Palm: Pro 1967 plantings 15.9 4.7 1.1 1.1 22.81967-1972 plani3pge (excluding EPo..) 118.9 192.0 24.8.3 290.6 261.2 176.1 940.2 4.5.3 1,4.26.6 14.9LE.C._ Projeotc 32.14 91.5 137.1 167.3 195.5 161.7 105.7 71.3 962.5 412.6
Total 167.2 288.2 386.5 459.0 456.7 337.8 199.9 116.6 2,411.9 57.5
Tea: 1968-1974 plantinga 11.5 31.14 52.9 73.8 93.0 96.0 83.1 61.3 503.0 39.6 20.5 6.4
Peppor: 1967-1970 plantings 0.7 8.8 10.8 12.6 12.1 3.8 1.9 50.7
TOTAL DEVELOPHENT EXPENDITJRE2/ 296.4 445.9 546.2 621.8 623.1 490.7 325.9 199.6 3,549.6 103.3 20.5 6.4
NOTE: Expendituro on Pro 1967 plantings 90.0 53.9 18.9 9.0 4.8 176.6
FIXED ASSETS - NEW
Rubber: Prm 1967 plantings 57.7 65.6 46.8 41.8 43.5 255.41967-1970 plantings 4..3 25.1 41.0 29.3 22.5 28.8 47.3 20.9 219.2 39.6 34.1 6.3 26.4
Total 62.0 90.7 87.8 71.1 66.0 28.8 47.3 20.9 474.6 39.6 34.1 6.3 26.4
Oil Palm: Pro 1967 plantings 35.9 64.8 18.2 8.6 3.8 131.81967-1972 plantiogs (exoloding E.E.C.) 32.6 76.8 51.0 38.7 64.4 142.4 151.8 30.3 588.0 27.8 217.2 130.7 126.5LLEEC. plantings 74.2 85.1 33.0 127.8 1214.5 35.0 14.1 21.2 514.9 131.8 11.3 17.4 11.5 16.6
Total 142.7 226.7 102.2 175.1 192.7 177.4 165.9 51.5 1,234.2 159.6 228.5 148.1 138.0 16.6
Tea: 1968-74 plantings 14.9 33.9 35.3 23.1 12.7 69.o 12.6 201.5 69.0
TOTAL NEi FIXZD ASSETS 219.6 351.3 225.3 269.3 271.4 275.2 225.8 72.4 1,910.3 199.2 331.6 515.4 1664.4 16.6
NOTE: Exponditunr for Pre 1967 plantings 93.6 130.4 65.o 50.4 47.3 386.7
TOTAL REPLACE4ENT FIIŒD ASSETS 55.0 80.0 80.0 80.0 lo5.o 105.0 105.0 135.0 745.0 135.0 135.0 250.0 300.0 350.0 350.0
TOTAL CAPITAL EXPENDITURE 571.0 877.2 851.5 971.1 999.5 870.9 656.7 407.0 6,204.9 437.5 487.1 410.8 464.4 366.6 350.0
TOTAL E.E 0 C. PROJECT 106.6 176.6 170.1 295.1 320.0 196.7 119.8 92.5 1,477.4 174.4 11.3 17.4 11.5 16.6
1. The devolop.nt costs per hectare assu ned by ER are higher than those given in Annex 5.The ERC figures are used in the projections of Capital Expenditore on the EEC progran.If the cost of the EEC developnent is less, the EEC 1-an .ouId be corrospondingly lover.
2. No provision bas been made frr replanbng expenditures beyond the period of the propooed progran.

A.NDEX 7Page 1
Price Assunmptions
The assumptions used in the earnings projections for each cropare given beLow. The price assumptions have been based on IBRD CommodityDivision forecasts aiter consultation in the field with CAMDEV sta-Xf.
(a) Palm Products. The bulk of ChMDEV's palm oil and kernels isexported and sold on the London market, but there are alsoat present some local sales. The local price is at presenthigh but it is expected that local production, other than byCAIDEV, will increase to satisfy this demand. The averageprice of oil sales by CAMDEV, consisting of f.o.b Victoriaand local, is high at m78 (US$218) per me-ric ton in 1967,but is asswaed to fall to .60 (US$168) by 1975, partly asa result of local sales ceasing in 1970. The kernel pricehas been conservatively put at S42 (US$118) per metric tonf.o.b. throughout the period. At present no preference isenioyed in EEC, since the Common Market in vegetable oilshas not yet been established. If and when the EEC doesagree to a common market in these products, it may well bemore profitable to sel1 in Eurepo r.ather than in London.
(b) Rubber. Rubber is also sold through the London marketthough it may be shipped elsewhere. Since the EEC commonexternal tariff on rubber is zero, there is unlikely to beany pre°'erence in the future in the EEC. The basis forthe rubber price assumptions is a 1967 spot New York pricefor Ribbed Smoked Sheet (RSS) 1 of 22 U.S. cents per poundfalling to 20 U.S. cents per pound by 1970 and to 18 U.S.cents per pound by 1975, after which it is assumed to remainconstant.
(c) Tea. 80% of CA1IDEV's present tea production is being soldon the local market, the rqst is sold in London. Localdemand is groawing and the qCrporation expects to have nodifficulty in sel].ing ail its tea locally in the future.Since there is at present only one other tea estate in thewhole of the Central African Customs and Economic Union,this seens to be a reasonable assumption to make. Atpresent, tea is being sold on the local market at CFAF 350(US$1.42) per kilo. A price of CFAF 300 (US$1.21) per kilohas been assumed throughout the period to allow a fall fromthis relatively high figure. At CFAF 300 per kilo, the teawculd stili be compatitive with tea bought on the Londonmarket at a low price of 3 shiïlings per pound, even with-out the tariff protection of from 76% to 90% which domesticproducers of tea enjoy in Cameroon.

fNf= 7Page c
(d) Pepper. All the pepper is sold on the London market.An f.o.b. price of CFAF 154 (62 U.S. cents) per kilo(equivalent to 2/3d. per pound c.i.f. London) has beenassumed throughout the period. This is about the pricebeing obtained at present and is in the lower end of therange over which pepper prices have been fluctuating inrecent years.
(e) Bananas. CAMDEV is scheduled to cease production ofbananas in 1968 as present and forecast prices will showlittle or no profit. It has been assumed that the priceobtainable in 1967 and 1968 will be CFAF 15,070 (US$61)per metric ton.
CAMEMOOIJC DEV6IOPME6T C0 R POR ÀT IOôN
ESTIMATED IN0C4E STATD2e~NTS 1967-1982
(expreuued .. ,illio.. oP CPAF)
1967 1968 1969 1970 1971 1972 1973 1976 1975 1976 1977 1978 1979 1980 1961 1962
0,~* Tradin Acosente
B-nna
Sales - metric ton 10,500 5,000legs, pries - CPAF/mtvîe t-e 15,070 15,070Oro.s R-vese 158.2 75.3
sess, Production Cot . 108.6 51.7Expwrt Dlty - 14.2 6.6Dep-ci.tisn 12.0 6.0
Tradlog Surplus 23.4 10.
Sal.. - 1000 kilos 7,651.6 8,405.6 9,580.9 1o,695.0 11,210.3 11,642.8 12,206.0 13,016.7 13,959.7 16,738.1 15,213.0 15,66,5.2 15,531.16 15,550.9 15,550.9 15,550.9l~es. price - CPAP/kilo 116.6 1.11.6 111.4 106.0 106.0 103.5 100.6 96.1 95.6 95.6 95.6 95.6 95.6 95.6 95.6 95.6Gr... Re-ene 870.3 936.4 1,067.3 1,133.7 1,188.3 1,205.0 1,230.6 1,276.7 1,336.5 1,409.0 i,454.4 1,676.6 1,484.6 1,486.7 1,L86.7 1,666.7tees Production & 0.11j . Coolt 603.6 680.9 776.1 866.3 908.0 963.1 988.7 1,054.2 1,130.7 1,193.6 1,232.3 1,251.1 1,258.0 1,259.6 1,259.6 1,259.6
Depreeîation 32.0 40.0 53.8 68.1 77.1 86.3 91.2 97.1 100.8 106.6 111.1 112.5 51 115.1 ns. n.1 n5.1Troding Suplus 235L..1 d15.5 Zd31.6 199.3 203.2 175 53.5 125.6 030 10. 111.0 113.0 111.7 112.0 112.1u> 112.0
Pal,o Produts
Soles - metri tons - 011 9,228 9,899 10,370 10,640 11,033 12,493 15,601 19,666 25,367 31,036 35,961 39,726 42,477 66,227 65,169 65.673K rer 1. 2,575 2,703 2,768 2,779 2,829 3,181 3,941 6,977 6,161 7,372 8,351 9,072 9,618 9,978 10,186 10,309
Avgs. Prie- -CFÀF/cen-0.1 54.0 53.0 51.0 46.5 63.8 63.2 42.5 61.6 61.1 1a.1 61.1 41.1 41.1 41.1 4i.1 41.1Ke-nel 26,6 28.8 28.6 26.8 26.6 28.8 28.8 26.6 26.8 28.6 26.6 28.6 26.6 26.6 28.6 28.6
Grees Besson -011 498.3 526.6 528.9 473.5 683.2 539.7 663.0 831.3 1,041.8 1,275.6 1,678.0 1,632.7 1,765.6 1,817.7 1,655.6 1,677.2K-1.sl 74.2 77.8 79.7 60.0 61.5 91.6 113.5 143.3 177.4 212.3 260.5 261.3 277.0 287.6 293.4 296.9Tuta1 572.5 602.6 608.6 553.5 566.7 631.3 776.5 976.6 1,219.2 1,667.9 1,718.5 1,894.0 2,022,6 2,105.1 2,169.0 2,176.1
tees, Prdutien Coot - 246.8 256.6 262.4 266.1 279.1 306.9 376.6 457.6 553.8 662.6 723.7 776.6 806.0 613.6 830.7 640.6Expert Duty - 16.7 17.9 18.6 19.0 19.7 22.2 27.7 35.3 66.7 54.5 63.0 69.3 76.0 77.1 78.7 79.3D.preciatien 26.0 53.7 92.5 108.6 i26.5 15o.6 172.2 191.5 201.6 225.5 251.5 270.3 266.9 268.2 269.5 289.5
Trading Surplus 0613.0 274.2 235.1 156.0 139.4 159.6 199.6 290.4 419.1 565.5 680.3 777.6 655.9 92. 5.1 964.9
Te,
Sales - 1000 kilos 456.6 693.6 514.6, 525.5 579.0 680.0 611.0 1,023.5 1,253.5 1,692.0 1,696.5 1,846.5 1,951.5 2,017.0 2,066.5 2,059.0Groso Re,veou .t 300 CFAF/kil. 136.9 166.1 156.3 157.6 173.7 206.0 263.3 307.0 376.1 667.6 509.0 553.9 585.6 605.1 614.6 617.7iessu, Preduet... let - 113.6 121.6 126.5 130.8 150.3 176.7 210.7 265.6 325.3 366.7 635.6 665.7 483.3 494.3 495.7 498.3
D.preei.ti.n 8 .0 i0.6é 12.2 18.7 20.7 36,7 36.3 38.6 60.7 60.7 4h.8 66.6 hh.6 46.8 66.8 466.8Trading Sorpl.. 15.3 15.1 15.5 6.1 2l.7 (9.4) (5.7) 0.5 10.1 20.2 2b.4 h3.4 57.3 56.0 14.1 74.5
Pepp,r
Sales - 1000 kilos 61.0 66.2 69.2 56.o 64.8 75.6 93.6 11i5.2 158.6 190.8 216.0 230.4 230.6 230.4 230.4 230.4Ores, Revenu ai 156 OPFiAdklo 6..j 6.8 7.6 8.6 10.0 11.6 16.6 17.7 24.6 29.4 33.3 35.5 35.5 35.5 35.5 35.5tees, Preduet,ee Coot 5.0 5.6 6,1 7.0 6.2 9.2 11.1 13.2 17.7 20.6 22.5 22.5 22.5 22.5 22.5 22.5
Export uty - .1 .1 .2 .2 .2 .2 .3 .4 .5 .6 .7 .7 .7 .7 .7 .7Depreeletien .1 .1 .1 .1 .2 .3 .4 .6 .7 .7 .6 .9 .9 .9 .9 .9
Tra1dlng Surplu 1.1 I.Z 1.2 I.J 1.6 1.9 2.5 3.5 5.5 7.5 9.3 11.4 116116 1.b 11.6
Total Trading Surplus 557.5 517.6 489.3 366.7 346.7 317.7 247.2 621.9 537.7 701.8 829.0 965.6 1,036.3 1,1-15.4 1,167.6 1,162.9L55,Adios tato Eopsos lou
mise. Ius,- 281.0 285.0 269.0 293.0 297.0 300.0 300.0 300.0 350.0 350.0 350.0 350.0 350.0 350.0 350.0 350.0
Nst Inoons <d.f,.it) bef-r Intereut 276.5 232.8 200.3 73.7 49.7 17.7 <52.6> 121.9 187.7 351.6 679.0 595.6 686.3 765.4 797.6 812.9
Intersut 82.6 77.0 74.1 76.9 82.7 107.9 166.1 177.5 179.6 178.6 174.3 167.6 159.1 150.6 162.2 133.7
Net Ineo- <defieit).ftsr 2nter..t' 193.7 155.6 126.2 (3.2) <33.0) <90.2) <200.9) (55.6) 8.1 173.2 304.7 626.2 527.2 615.0 655.6 679.2
Lee- Divld..d. 166.9 163.7 220.6 220.6 220.4 220.6
WzT SURPLUS <D29'ICIT) 193.7 155.6 126.2 (3.2) <33.0) <90.2) <200.9) <55.6) 6.1 173.2 157.6 216.5 306.6 394.6 435.0 458.8
CA M4EROO O is D VEZL(p YsIl I ~0Rp OR àT'ln s
ESTIMÂTED SOURCES AND APPLICATON 6FJUESMB 1967-1982
(expressed in milliois af CA7)
1967 1968 1969 1970 1971 1972 1973 1975 1,967-1974 1975 1976 1977 1978 1979 1980 1981 1982
SOURI-ES
Net Inceme before Interest 276.5 232.8 200.3 73.7 49.7 17.7 (52.8) 121.9 919.8 187.7 351.8 579.0 595.6 686.3 765.4 797.6 812.9Add Depreciation 78.1 110.4 158.6 195.3 225.5 273.9 302.1 380 1670. 33. 37~3.5 45082 4528.5 457.7 4j1.O 0.3
Cash Inonne j~~~~~~~~~~35.* y.j.2 3~.50 t9. 702 29. 249.3 559.9 2,5907 531. 723 8872 1,2. 1,34. 12. 127.1,26~3.2Leass Paynent to Go'errc,ent of 1963profit 25.0 - - - - - - -25.0 - - - -- - --
329.6 -- - - - - - ~~~~~~~ ~ ~ ~ ~ ~ ~ ~ ~ ~ ~~2,5t05.7 - - ----Borrowings:
Proposed IBRS boan - - - - 137.0 595.0 570.0 280.0 1,h82.0 - - ------Caositment Charge and Intereot 3.0 7.0 7.0 8.0 12.0 35.0 73.0 102.0 257.0 - - ------ESC Loan 107.0 177.0 170.0 296.0 324.0 206.0 119.0 63.0 1,462.0 110.0 - -----ESC Interest thereon 1.0 3.9 7,5 12.3 18.7 21t.4 28.2 305 165 32.9 34.6 -- ---Total Borrowigs 510 187.9 164.5 316.3 491.7 86.5 60.2 57. 3126.5 129 35.6
New Equity (IDA Funds) h55.6 615.0 600.0 595.0 462.5 - 2,717.0 - -------
Sales of Fîxed Assets 104.6 - - - - -- 104.6 - - --- --
Total Sources 989.8 i,146.1 1,143.h 1,180.3 1,228.3 1,152.0 939.5 925.4 8,704.8 674.4 759.9 887.2 1,024.1 1,134.0 1,214.4 1,247.9 1,263.2
APPLICATIONS
Oevelopnment Expenditure 296.4 hSS.9 5b6.2 621.8 623.1 490.7 325.9 199.6 3,5h9.6 103.3 20.5 6.1i - - - --Buildings, Machinery, etc. - additional 219.6 351.3 225.3 269.3 271.4 275.2 225.8 72.h 1,910.3 199.2 331.6 l54545 164.4 16.6 - --
- replacements 55.0 80.0 80.0 80.0 105.0 105.0 105-.0 135.0 745.0 135.0 135.0 250.0 300.0 350.0 350.0 350.0 350.0Total Capital Expenditure s71.0 b77.2 851.5 971.1 999.5 -870.9 656.7 407.0 6,205t.9 437.5 bb7.1 410. 0 464.4 366.6 350.0 350.0 350.0
Debt Service:Repayrgent of BCD Loan 150.0 127.0 - - - - - - 277.0 - - - - - - -Repayment or Overdraft 63.7 50.0- 50.0 50.0 50.0 - - - 7 - - - - - - -
A,oortization - C.D.C. - - - 19.7 21.3 22.8 24.5 26.3 115.5 28.3 30.4 32.7 35.1 37.7 ho.5 43.6 57.0Proposed I89RD Lan - - - - - - --- 39.5 h2.0 h4.5 46.9 50.6 53.1 55.6EEG - - - -. - - 131.0 133.0 136.0 139.0 151.0 153.0
Total Acoortization - - - 19.7 21.3 22.8 25.4 26.3 115.5 28.3 69.9 205.7 212.6 220.6 230.1 237.7 255.6
Interest, - CDC 51.6 51.6 51.6 5i.6 50.0 48.5 fi6.9 55.0 396.8 43.0 50.9 38.6 36.2 33.6 30.8 27.7 25.3BCD 11.2 3.5 - - - -- 15~. 7 - - - - - - - -Proposed IBRE L.ans:
Interest Payable - - - - - - - -- 103.7 103.1 100.7 98.2 95.5 92.6 89.5 86.4Interest and Cao0o±txent Financed 3.0 7.0 7.0 8.0 12.0 35.0 73.0 102.0 257.0 - - - - - - - -ELC'
Interest Payable - - - - - - - - - - - 35.0 33.0 3Q.0 27.0 25.0 23.0Interest 7inanced 1.0 3.9 7.5 12.3 18.7 24.5 28.2 30.5 126.5 32.9 35.6
Bank Overdraft 16.0 11.0 8.0 5.0 2.0 - - - 42.0 - - - - - - - -
Total Interest 82.8 77.0 74.1 76.9 82.7 107.9 15.l 177.5 827.0 179.6 178.6 175.3 167.4 159.1 150.4 142.2 133.7
Total Debt Service 296.5 254.0 125.1 l56.6 154.0 130.7 172.5 203.8 1,482.2 207.9 258.5 380.0 380.0 379.7 380.5 379.9 379.3
Increase in Produce Stocks 50.0 50.0 50.0 50.0 50.0 50.0 50.0 50.0 500.0 50.0 50.0 50.0 50.0 50.0 50.0 50.0 50. oDividends - - - - - - - - - - - 156.9 183.7 220.5 220.5 220.4 220.4
Total Applications 917.5 1,181.2 1,025.6 1,167.7 1,203.5 i,051.6 879.2 660.8 8,087.1 695.4 785.6 987.7 1,078.1 1,016.7 1,000.9 1,000.3 999.7
Cash Accrued - annual 72.3 (35.1) 117.8 12.6 24.8 100.4 60.3 264.6 617.7 (21.0) <25.7) (100.5) (55.0) 117.3 213.5 257.6 263.5
Cash accrued - cuco,lative <10.0 at beginn-ng) 82.3 57.2 165.o 177.6 202.4 302.8 3S3a'. 627.7 - 6o6.7 581.0 580.5 526.5 543.8 757.3 1.oo4.9 1,268.4
Debt Service Coverage 1.1 1.4 2.9 1.8 1.8 2.2 1.4 2.2 1.6 2.6 2.9 2.3 2.7 3.0 3.2 3.3 3.3

CA»EROONS D3V3LOPtf3IT CORPORATICN
ESTIMATED BALANCE SHEETS 1967-1982(expressed in millions of CFAF>)
1967 1968 1969 1970 1971 1972 1973 1971 1975 1976 1977 1978 1979 1980 1981 1982lSSETS
Mxec us3ets:Plantations at cost 3,856.4 4,302.3 4,848.5 5,470.3 6,093.4 6 ,54.1 6,910.0 7,109.6 7,212.9 7,233.4 7,239.8 7,239.8 7,239.8 7,239.8 7,239.8 7,239.8Less: 'lmortîzation and provision for replanting 1.797.0 1,797.0 1,797.0 1,797.0 1,797.0 1,797.0 1,797.0 1,797.0 1,797.0 1.797.0 1,797.0 1.797.0 1,797.0 1.797.0 1,797.0 1,797.0
Net Plantations 2.059.4 2,505.3 3,051.5 3,673.3 4.296.4 4,787.1 5.113.0 5.312.6 5,415.9 5,436.4 5.,112.8 5.442.8 5.b42.8 5.442.8 5.442.8 5,442.8
Buildings, machinery, vehicles at cost 14,82.9 5,274.2 5,579.5 5,928.8 6,305.2 6,685.4 7,016.2 7,223.6 7,557.8 8,024.4 8,428.8 8,893.2 9,259.8 9,609.8 9,959.8 10,309.8Less- Dereciation 3.958.51' 4,068.9 4,227.5 4,422.8 4,647.3 4,921.2 5,223.3 5,551.3 5,895.1 6,268.6 6.676.8 7,105.3 7,553.0 8,002.0 8.452.3 8,902.6
`.et Siulaîngs, iehîcles, Machinery, etc. 884.4 1,205.3 1,352.0 1,506.0 1,657.9 1,764.2 1,792.9 1,672.3 1,662.7 1.755.8 1,752.0 1,789.9 1.706.8 1.607.8 1.507.5 1,407.2
?ctal 'let Fixed Assets 2,943.8 3,710.6 4,403.5 5,179.3 5,954.3 6.551.3 6,905.9 6,984.9 7,078.6 7,192.2 7,194.8 7.30.7 7,149.6 7,050.6 6,950.3 6,850.0
Current Assets-Stores, produce stocks, receivables, etc. 813.9 863.9 913.9 963.9 1,013.9 1,063.9 1,113.9 1,163.9 1,213.9 1,263.9 1,313.9 1,363.9 1,113.9 1,4163.9 1,513.9 1,563.9Cash 82.3 47.2 165.0 177.6 202.4 302.8 363.1 627.7 606.7 551.0 480.5 426.5 543.8 757.3 1,004.9 1,268.4
Total Current Assets 896.2 911.1 1,078.9 1,11.1.5 1,216.3 1,366.7 1,477.0 1,791.6 1,820.6 1,84..9 1,794.4 1,790.4 1,957.7 2,221.2 2,518.8 2,832.3
TOTAL ASSETS 3,840.0 4,621.7 5,1482.4 6,320.8 7,170.6 7,918.0 8,382.9 8,776.5 8,899.2 9,037.1 8,989.2 9,021.1 9,107.3 9,271.8 9,469.1 9,682.3
LIABILITIESapitaard Reserves less Deficit 2
Share capital 1,401.3- 2,016.3 2,616.3 3,211.3 3,673.7 3,673.7 3,673.7 3,673.7 3,673.7 3,673.7 3,673.7 3,673.7 3,673.7 3,673.7 3,673.7 3,673.7Earned surplus (deficit) 193.7 349.5 475.7 472.5 439.5 349.3 1148.4 92.8 100.9 274.1 431.9 676.4 983.2 1,377.8 1,812.8 2.271.6
Total Equity 1,595.0 2,365.8 3,092.0 3,683.8 4,113.2 4.023.0 3,822.1 3,766.5 3,774.6 3,947.8 4.105.6 4.350.1 4,656.9 5,051.5 5.,86.5 5.945.3
Debt:Banque Camerounaise de Developpement 127.0Coerowmealth Developoient Corporation 685.C 685.0 685.o 665.3 644.o 621.2 596.8 570.5 542.2 511.8 479.1 41..0 406.3 365.8 322.2 275.2Proposed IBRD Loan 3.0 10.0 17.0 25.0 174.0 801.0 1,347.0 1 729.0 1 729.0 1,689.5 161.7.5 15603.0 1,556.1 1, 505.5 1,452.4 1,396.8Proposed Êlt Loan 108.0 288.9 166.4 774.7 1,117.4 1.347.8 1.495.0 1.588.5 1.731.4 1.766.0 1.635.0 1.502.0 1.366.0 1.227.0 1.086.0 943.0
Total Debt 923.0 983.9 1,168.4 1,465.0 1,935.4 2,773.0 3.438.8 3,888.0 4,002.6 3,967.3 3,761.6 3,549.0 3.328.4 3.098.3 2,860.6 2.615.0
Current Liabilîties:Ban6 cverdraft 200.0 150.0 100.0 50.0Payacle and provisions 437.0 o 37-0 1.37.0 137.0 437.0 437.0 437.0 437.0 437.0 437.0 437.0 437.0 437.0 437.0 437.0 437.0
Total Current Liabilities 637.0 587.0 537.0 487.0 437.0 437.0 437.0 437.0 437.0 437.0 437.0 437.0 437.0 437.0 437.0 437.0
Deferred Debt- 685.o 685.0 685.0 685.0 685.0 685.0 685.0 685.0 685.0
TCT1L LIABIITIES 3,840.0 4,621.7 5,1.82.1 6,320.8 7,170.6 7,918.0 8,382.9 8,776.5 8,899.2 9,037.1 8,989.2 9,021.1 9,107,3 9,271.8 9,4.69.1 9,682.3
Deht/Tnt:ty ratio (including overdraft) 41/59 32/68 29/71 29/71 32/68 44/56 47/53 5/1°A 51,AW9 Co/Co 4f8/52 4C/CC 12/5R 3q/62 3h/566 31(69
1, Incluo ng credît fcr surplus on cisposal of fixed assets.2/ made te as ftlîtas, Capital and reserves at 31/12/66 437.7
1. Cameroon loan at 31/12/66 519.0':ew equi, y hbh4-6
1, a01. 3il L_îan ~rt L- _ri,'. /o 7or- ment .

C»MMUROONS DEVI0PMENT CORPORATION
Esti,oated Innual Yield on Total Capital Imested (before Payont of Mroort Duty and Rentalo to GO rnrernt)
(expressed in >¶illions of CFAF)
1967 1968 1969 1970 1971 1972 1973 19m 1975 1976 1977 1978 1979 1980 1981 1982
CAPITAL INRPZo
Equity 1,595.0 2,365.8 3 092.0 3,683.8 b,113.2 3,b93.0 3,822.1 3 766.5 3,77b.6 3,9L7.8 1,105.6 1, 350.1 1, 656.9 5,051.5 5 b86.5 5 9U5.3
Derbt (including Bank Ovrerdraft) 1,123.0 1,133.9 1,268.h 1,515.5 1,935.4 2,773.0 3,138.8 3 888.0 b,002.6 3,967.3 3,761.6 3.5bs.o 3 328.b 3,098.3 2,860.6 2 615.0
Daferred Debt (Nigerian loan) 685.o 68S.0 685.o 685.0 685.0 685.0 685.0 685.o 685.0 685.0 685.0 685.0 685.0 685.o 685.0 685.0
3,403.0 14,181.7 5,0o45. 5,884.3 6,733.6 6,951.0 7,9b5.9 8,339.5 8,b62.2 8,600.1 8,552.2 8,58b.1 8,670.3 8,831.8 9,032.1 9,2U5.3
Less Cash 82.3 47.2 165.0 177.6 202.b 302.8 363.1 627.7 606.7 55L0 1,80.5 b26.5 5b3.8 757.3 1,001.9 1,268.1
Total Capital Invested 3,320.7 4,137.5 b,880.4 5,706.7 6,531.2 6,648.2 7,582.8 7,111.8 7,855.5 8pll9.1 8,0n1.7 8,157.6 8,126.5 8,077.5 8,027.2 7,976.9
ZiNNINOS
Net Incoom (Deficit) before Intermstand Dididende 276.5 232.8 200.3 73.7 19.7 17.7 (52.8) 121.9 187.7 351.8 1,79.0 595.6 686.3 765.b 797.6 812.9
Adds Payments to Gooer,oents,Rent 2b.0 24.0 2b.0 2b.0 21,.0 2b.0 2b.0 2b.0 2b.0 2f.0 2b.0 24.0 21.0 21,.0 2b.0 24.0
I,cort Duty 31.0 18.0 18.8 19.2 19.9 22.4 30.0 35.7 b5.2 55.1 63.7 70.0 7b.7 77.8 79.4 80.0
Barnings before Zxport Duty andRantal Chargea 331.5 274.8 2b3.1 116.9 93.6 61.i 1.2 181.6 256.9 b30.9 566.7 689.6 785.o 867.2 901.0 916.9
Percentage Yield on Total Capital Imested 10.0% 6.6% 5.0% 2.0% .14% 1.0% o.% 2.74% 3.3% 5.4% 7.0% 8.5% 9.7% 10.7S 11.2% 11.5%
Note: The abo,e earnings and retures do not taike 5nto account 54
V provision for azoortization of estates or replanting (para. .15)

CAMEROONS DEVELOPMENT CORPORATION
BOARD OF DIRECTORS
GENERALHMAIRMAGERN(FULLTIMEI| GENERAL MANAGER | |APERSONAL ASSISTANT S
GENERAL MANAGER (FULL TIMEUBLC ELTINSAN COMECIL ANGE
5 OTHERS
ASSISTANT
GENERAL MANAGER
MAANRAEGAER l l MANAGER l l MANAGER l l MAANRAEGAER l l AOVICULTURA MEDKCAL STUENGINEER CONTROLLR T MBOTrA TIKO EKO NA NORTH OFFICER
ASSISTANT OIL PALM HOSPITALS PLANNING ANDAREA MANAGER BREEDING UNIT FACTORY ENGINEERS
_ i ~~~~~~~~~~~ ~ ~ ~~~~~~~ ~ ~ ~~~~~~~~UN T - EKONA OFFICERSSUVY
ESTATES MANAGERS
ESTATES MANAGERS(TIKO (Rl ESTATES MANAGERSBOTA (P) LIKOMBA (R) ESTATES MANAGERSIDENAU (P) MISSELLELE (R) EKONA Ill)MOLIWE /SAXENHOF (Pl N'SONNE MOLIWE (R) _MOLYKO 18) _MUKONJE (RITOLE (T) TIKO (B) MPUNDU (P) TMBONEL (CaR)MAEIETA (R) HOLTFORTH (B) MEANJA (R a PEPPER) MOG RBIMBIA (R a PEPPER) ESUKE (B)
BENUE (B)
ADMINISTRATIO i..NS.Tf 1 DIITAS f AI7lTAI0 TRAINING MANAGER SUPPLIES MANAGERPUBLIC RELATIONS AND COMMERCIAL MANAGER
WELFARE OFFICER
_ g l l | l ~~~~~~~~~~~~~~~~~~~SHIPPING MANAGER ITRA UIACONS l| ACUT COACCOUNTS CONS PERSONNEL MANAGER
l l l l ~~~~~~~~~~WORK STUDY MANAGER
ENIERN UBRFCOY l1 EGNEIG l1ENGINEERING
|LEGEN-D R =Rubber T =Tee ENGINEERING l l B 5~~~~~~~~~~~~~~~~~~~~~ Banonos C =Cocoa
(R)I)BRD-2913

MAP I
- MAIN ROADS
TIKO-DOUALA ROADESSOSONG
CAAMEROON J ' MAIN RAILROADS 7EA
--- RAILROAD UNDER CONSTRUCTION
.. .. INTER-STATE BOUNOARY'
CCOA
(~~~~~~~~~~~~~~~~~~~~~TM EL>A 'A
~~~~~~~~~~~~~~~~~~~~R 8ER
FEBRUARO 1966 lORD 1704
7RUBOER 2§
g t g XM~~~~~~~~~~~~~~~~~~~~~~~BANGA
8 ~~~~~w E S T C A M E R O O N
'À . ~~~~~~~ ~ ~~~~~~RUEUtf ) q , -<) ~~~~~~~~~~~~~~~~E A S T C A M E R O O N
V ` ` 0° O/t~~~~~~~~~~~~~MU»DAME RU8 9
X~~~~~~~~~~~~I 0/ALML pYOAH°pp p
IDEaNDCAUCB j> "» o
OIL/ PALM EKO>NA PAZ UEE lSf
84 NA NA EXT ERO
BUL EX O ADE IATTIN\S s£<o P LM
E8RUARé 1966 - U,LE5 IHRD 1704~~7'E lKO

'C, . TYPE EXISTING RE PLANTING NEW PLANTING MfAIN ROADS
KUMBA ~1RUPPER // [f Ù TIKODOUALA ROAD --- Ko -
TEA 1 MAIN RAILROADS I MBONGE MUKONJE
CANANAS **
<~~~~~~~~~~~~~~~~PPE M ' J< N A A S_ (M EANJA
() ;< l>_ T O M B E L I N V IC INI TY OF A BOVE .!- b
OIL PALM FOR OIL PALM RE-PLANTING8BNEWARE AS PLaNTIN. SEE 1BRID-1705R (MAP 11) JUNDAME O I CT R I A
MU KO N ~ ~ ~ ~ ~ ~ ~ ~ ~ ~ ~ ~ ~ ~ ~ ~ ~ ~ ~ ~ ~ ~ KN
-EOF MOLYKO TO EXT
*~~~~~~~~~~~~ ? 0 T % A
-\L ` ,<`_4' NCAMOEV RUBBER, TEA, BANANA,COCOA & PEPPER AREAS
E 5 S O S X )X N s r
NE L. E 196 IR
TrEERUARY16 -NA -N-T-ER

I D EN U OL MIL0L$ _--
NuRSeRt Ç 1 ~~~~~~~MAIN ROADLAS=
ÔÉDbUNDCHA.&LN L
X < a SX A5 a X~~~~~~~~~~~~~~~~~~~~~~~~~~~~~~~~P ROJEC T
BO PJ X /-A L M L
MILL < â *u«ET
e5RU:RY1967 :1 'lel:, e s
VcA . E)NE
OILMILL(~~~~~~~~~~~~~~~~~~~~~~~~~~~~~~~~~ÉR 75