(c) r.d. weaver 2004 fundamental analysis ~prices over space review & application
TRANSCRIPT

(c) R.D. Weaver 2004
Fundamental Analysis~Prices over space
Review & Application

(c) R.D. Weaver 2004
Local prices vary due to changes in determinants of…. Demand
For current use For storage (carry-out) For export
Supply From current production From storage (carry-in) From imports

(c) R.D. Weaver 2004
Two market model of price Goals
Be able to describe and characterize spatial structure of prices Be able to analyze & predict spatial variation in prices
What we need to know What are key drivers of price What relationships can we predict between key drivers and price?
Approach Graphics Algebra Implications
(c) R.D. Weaver 2004
Arbitrage: Two decisions to be made
Entry: Can a profit be made from arbitrage? Where to move the product?
These decisions determine Direction of trade flow
(import or export) (from to where?)
Volume of trade flow
Let’s ignore inventories for now!

(c) R.D. Weaver 2004
Building Spatial Arbitrage into the Market Local demand Local supply External Flow ~ the result of arbitrage
Imports Exports
Physical Balance Total Supply = Total Demand
Local supply + Imports = Local Demand + Exports

(c) R.D. Weaver 2004
Questions we need to answer:
How does this system determine prices?
Can we use it to analyze and predict price variation across geography?

(c) R.D. Weaver 2004
Price balances the market Local demand = some function of local price Local supply = some function of local price External Flow ~ the result of arbitrage
Imports = function of local price and external price Exports = function of local price and external price
Physical Balance Total Supply = Total Demand
Local supply + Imports = Local Demand + Exports
Total supply(local price, external price)
= Total Demand(local price, external price)

(c) R.D. Weaver 2004
How does it happen?
We know each market has
Demand (consumers)
Supply (producers)
But we need one more type of actor – arbitrager
What@#$^%?

(c) R.D. Weaver 2004
Arbitrage defined
In any multi-market setting, if prices provide an opportunity to profit from moving product from one market to another, someone will make that happen!
Arbitrage is the economic function of taking a product from a market where is has a low price to a market where the same product has a higher price that covers the cost and results in profit.

(c) R.D. Weaver 2004
How arbitrage links markets
Arbritragers link markets by forcing their prices into a fixed relationship
In a sense, with arbitrage the markets become one market, integrated by the efforts of arbitragers to make a profit from moving product from one market to another.
Spatial arbitrage is “trade” !

(c) R.D. Weaver 2004
Consider two markets ~ what to look for Without trade = autarky
Prices differ one market pays less than the other for the same product! Why?
With trade Prices are forced into a relationship by arbitrage such
that the difference is reduced to reflect only average arbitrage cost.
(c) R.D. Weaver 2004
What do you need to enable arbitrage?

(c) R.D. Weaver 2004
What do you need to enable arbitrage? Information
Technology (containers, refrig, etc.)
Transportation
Insurance
Financial services

(c) R.D. Weaver 2004
Graphically Market 1 without arbitrage
Market 1
0
10
20
30
40
50
60
70
80
90
5 10 15 20 25 30 35 40 45 50 55 60 65 70
Quantity
Pri
ce (
P1)
Local supply
Local demand
(c) R.D. Weaver 2004
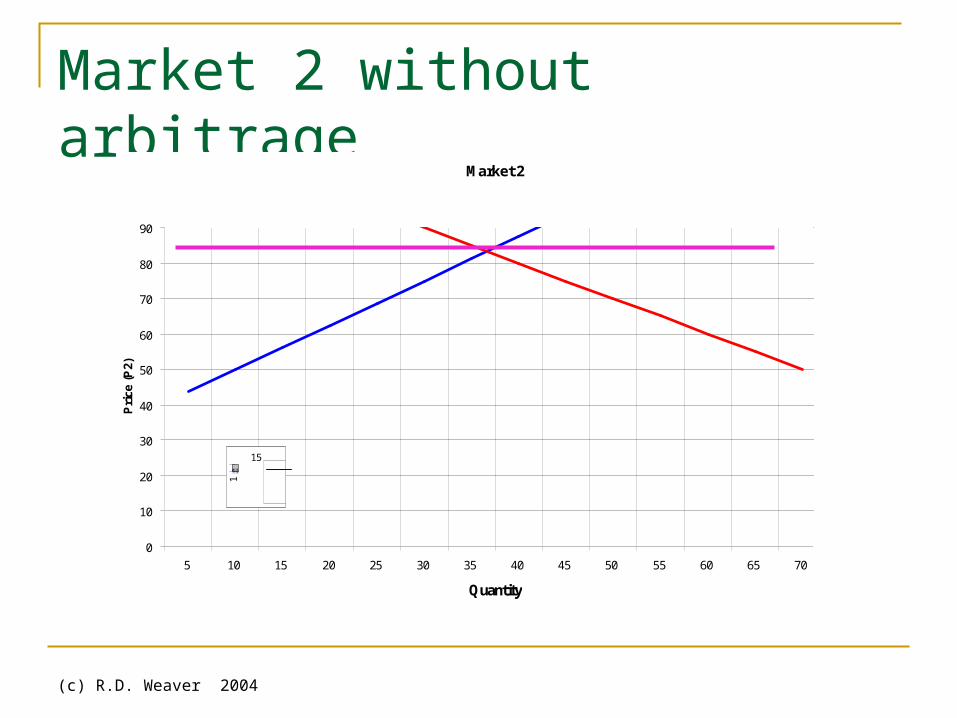
Market 2 without arbitrage
-600 787.5 -480 79.697 51.842-550 725 -430 79.697 51.842-500 662.5 -380 79.697 51.842-450 600 -330 79.697 51.842-400 537.5 -280 79.697 51.842-350 475 -230 79.697 51.842-300 412.5 -180 79.697 51.842
Data used for graphics -250 350 -130 79.697 51.842Here, the inverse demand and supply functions are calced. -200 287.5 -80 79.697 51.842
Price Dependent Price Dependent -150 225 -30 79.697 51.842Market 1 Market 2 Market 2 -100 162.5 20 79.697 51.842Pd Quanitity Ps Pd -50 100 70 79.697 51.842
72 5 43.75 115 -25 68.75 95 79.697 51.84267 10 50 110 0 37.5 120 79.697 51.84262 15 56.25 105 25 35 52 79.697 51.84257 20 62.5 100 50 60 27 79.697 51.84252 25 68.75 95 100 110 -23 79.697 51.84247 30 75 90 150 160 -73 79.697 51.84242 35 81.25 85 200 210 -123 79.697 51.842
15
1
15
1
15
1
15
1
Market 2
0
10
20
30
40
50
60
70
80
90
5 10 15 20 25 30 35 40 45 50 55 60 65 70
Quantity
Pri
ce (
P2)
15
1
(c) R.D. Weaver 2004
So, two markets different prices, what would you expect to happen?

(c) R.D. Weaver 2004
Two effects deserve consideration Prices will change
Quantity will shift from one market to the other What direction is the flow? How much? What determines the quantity

(c) R.D. Weaver 2004
Market 1
0
10
20
30
40
50
60
70
80
90
5 10 15 20 25 30 35 40 45 50 55 60 65 70
Quantity
Price
(P1)
Market 2
0
10
20
30
40
50
60
70
80
90
5 10 15 20 25 30 35 40 45 50 55 60 65 70
Quantity
Price
(P2)
Initially, P2>P1, what happens?
Only if P2 > P1 + AC12 would Y1 is arbitraged from Mkt 1 to Mkt 2
As product is moved from mkt 1 to mkt 2, P2 decreases and P1 increases, why?

(c) R.D. Weaver 2004
Market 1
0
10
20
30
40
50
60
70
80
90
5 10 15 20 25 30 35 40 45 50 55 60 65 70
Quantity
Price
(P1)
Market 2
0
10
20
30
40
50
60
70
80
90
5 10 15 20 25 30 35 40 45 50 55 60 65 70
Quantity
Price
(P2)
What happens to prices?
What happens to quantities?

(c) R.D. Weaver 2004
Market 1
0
10
20
30
40
50
60
70
80
90
5 10 15 20 25 30 35 40 45 50 55 60 65 70
Quantity
Price
(P1)
Market 2
0
10
20
30
40
50
60
70
80
90
5 10 15 20 25 30 35 40 45 50 55 60 65 70
Quantity
Price
(P2)
Note: at the new prices one market has “excess supply”
And one has “excess demand”
Together, excess supply = export to mkt 2 = import mkt1 = excess demand

(c) R.D. Weaver 2004
Market 1
0
20
40
60
80
100
120
5 10 15 20 25 30 35 40 45 50 55 60 65 70
Quantity
Price
(P1)
Market 2
0
10
20
30
40
50
60
70
80
90
5 10 15 20 25 30 35 40 45 50 55 60 65 70
Quantity
Pric
e (P
2)
Initially, P2<P1, what happens?
Only if P2 + AC21 < P1 would Y be arbitraged from Mkt 2 to Mkt 1
As product is moves, P2 increases and P1 decreases, why?

(c) R.D. Weaver 2004
Result: Geography of price
Economic theory tells us Direction of flow from one market to another How prices will be related ~ spatial structure of prices

(c) R.D. Weaver 2004
Effects of TradeImporting region’s
price is reduced as “imports” expands total supply = domestic supply + imports
Exporting region’s price is increased as exports reduce total supply = domestic supply - exports
Markets are linked >changes in exogenous factors in exporter market affect changes
in importer market price>changes in importer market change exporter price
Price differences between regions are reducedSpatial structure in prices is created

(c) R.D. Weaver 2004
Benefits of trade
Trade and arbitrage integrates markets that are spatially separated.
Reducing price in the high price market Increasing price in the low price market
Arbitrage brings goods otherwise not available into the high priced market, increasing the standard of living…..
Arbitrage increases prices in the low price market, providing increased demand, employment, driving wages up.

(c) R.D. Weaver 2004
Trade: What function in decentralized markets? Allocation of scarce products to locations where
they have the highest value Equalization of prices across markets ensures
everyone faces the same value of scarce resources