(c) m gerstein '06, gerstein.info/talks 1 cs/cbb 545 - data mining predicting networks through...
Post on 19-Dec-2015
215 views
TRANSCRIPT

(
c) M
Ger
stei
n '0
6, g
erst
ein
.info
/tal
ks
1
CS/CBB 545 - Data MiningPredicting Networks through
Bayesian Integration #2 - Application
Mark Gerstein, Yale Universitygersteinlab.org/courses/545
(class 2007,03.01 14:30-15:45)

(
c) M
Ger
stei
n '0
6, g
erst
ein
.info
/tal
ks
2
Predicting Networks via Bayesian Integration:
Real Thingbut with a few features

(
c) M
Ger
stei
n '0
6, g
erst
ein
.info
/tal
ks
3
Papers on Predicting Protein Interactions A Enright et al. (1999) "Protein interaction maps for complete genomes based on gene fusion events." Nature.
402(6757):86-90. E Marcotte et al. (1999) "A Combined Algorithm for Genome-Wide Prediction of Protein Function." Nature 402,
83-86 (1999). E Marcotte et al. (1999) "Detecting Protein Function & Protein-Protein Interactions from Genome Sequences."
Science 285, 751-753 M Pellegrini et al. (1999) "Assigning protein functions by comparative genome analysis: protein phylogenetic
profiles." Proc.Natl. Acad. Sci. 96, 4285-4288. R Jansen et al. (2003). "A Bayesian networks approach for predicting protein-protein interactions from genomic
data." Science 302: 449-53. I Lee et al. (2004) "A Probabilistic Functional Network of Yeast Genes". Science 206: 1555-1558 H Yu et al. (2004) "Annotation transfer between genomes: protein-protein interologs and protein-DNA regulogs."
Genome Res 14: 1107-18. L Lu et al. (2005) "Assessing the limits of genomic data integration for predicting protein networks."
Genome Res 15: 945-53. A Ramani et al. (2005) "Consolidating the set of known human protein-protein interactions in preparation for large-
scale mapping of the human interactome." Genome Biology 6:r40.
Xia et al. (2006) "Integrated prediction of the helical membrane protein interactome in yeast." J Mol Biol. 357:339-49

(
c) M
Ger
stei
n '0
6, g
erst
ein
.info
/tal
ks
4
Bayesian Formalism
R Jansen et al. (2003). "A Bayesian networks approach for predicting protein-protein interactions from genomic data." Science 302: 449-53.

(
c) M
Ger
stei
n '0
6, g
erst
ein
.info
/tal
ks
5
Overview of information integrated: PIE & PIP
Noisy high-throughput protein-protein interaction data
Features that are not explicit interactions but which are suggestive

(
c) M
Ger
stei
n '0
6, g
erst
ein
.info
/tal
ks
6
co-essentiality & gene-expression correlations
• if A and B interact both are more likely be essential or non-essential less likely that A is essential and B is non-essen (and the converse)
• Gene Expression Correlation Discussed earlier

(
c) M
Ger
stei
n '0
6, g
erst
ein
.info
/tal
ks
7
Subcellular localization as a gold-standard negative: If A and B interact they have to be in
the same cellular compartment
Nucleus
Membrane
Extra-cellular[secreted]
ER
Cytoplasm
Mitochondria
Golgi

(
c) M
Ger
stei
n '0
6, g
erst
ein
.info
/tal
ks
8
Predicting Networks via Bayesian Integration: Relating Function to
Interactions

(
c) M
Ger
stei
n '0
6, g
erst
ein
.info
/tal
ks
9
GO DAG
(
c) M
Ger
stei
n '0
6, g
erst
ein
.info
/tal
ks
10
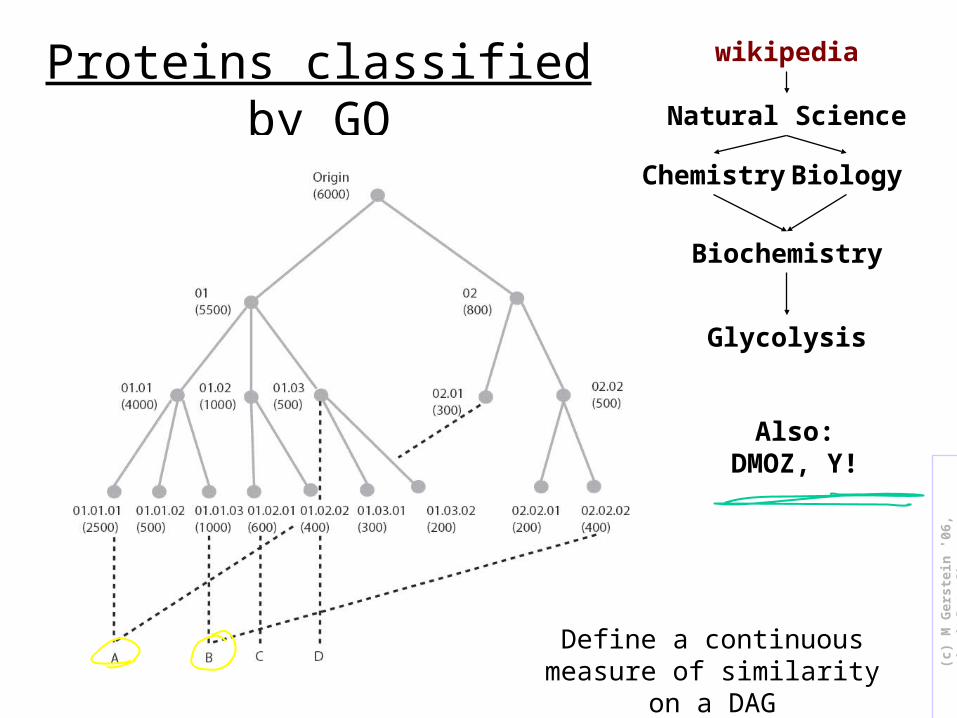
Proteins classified by GOwikipedia
Natural Science
Chemistry Biology
Biochemistry
Glycolysis
Also:DMOZ, Y!
Define a continuous measure of similarity on a DAG

(
c) M
Ger
stei
n '0
6, g
erst
ein
.info
/tal
ks
11
Simple Measures
Shortest Distance
Lowest Common Ancestor

(
c) M
Ger
stei
n '0
6, g
erst
ein
.info
/tal
ks
12
Resnik's Measure
(
c) M
Ger
stei
n '0
6, g
erst
ein
.info
/tal
ks
13
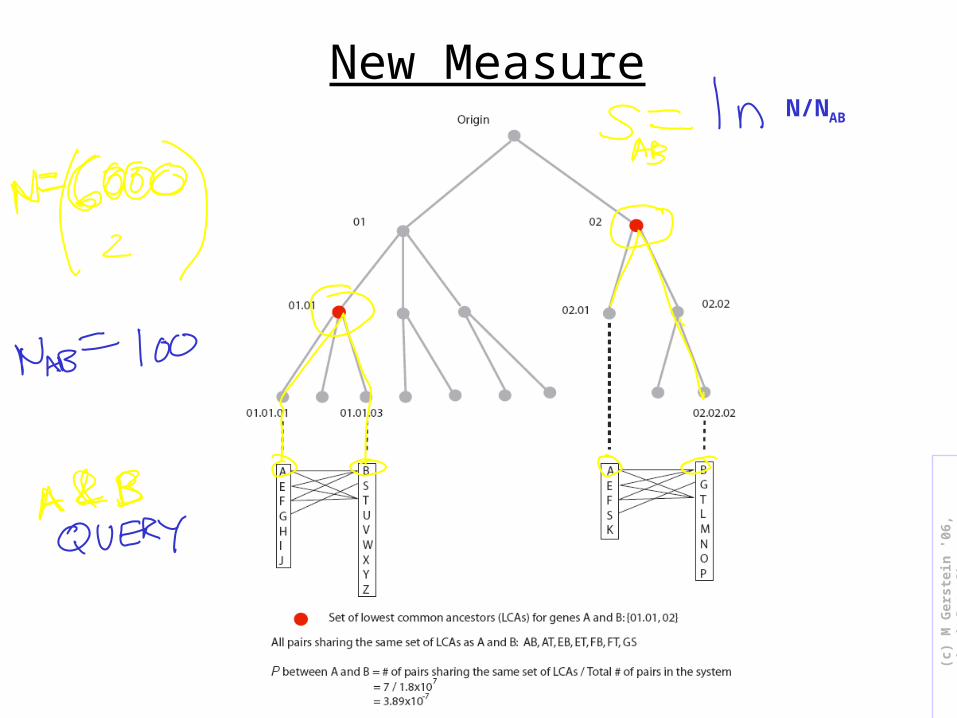
New MeasureN/NAB

(
c) M
Ger
stei
n '0
6, g
erst
ein
.info
/tal
ks
14
Differences between Methods

(
c) M
Ger
stei
n '0
6, g
erst
ein
.info
/tal
ks
15
Relationship of Functional Similarity to Protein Interactions
(Exclude Interactions in Evidence Codes)
(
c) M
Ger
stei
n '0
6, g
erst
ein
.info
/tal
ks
16
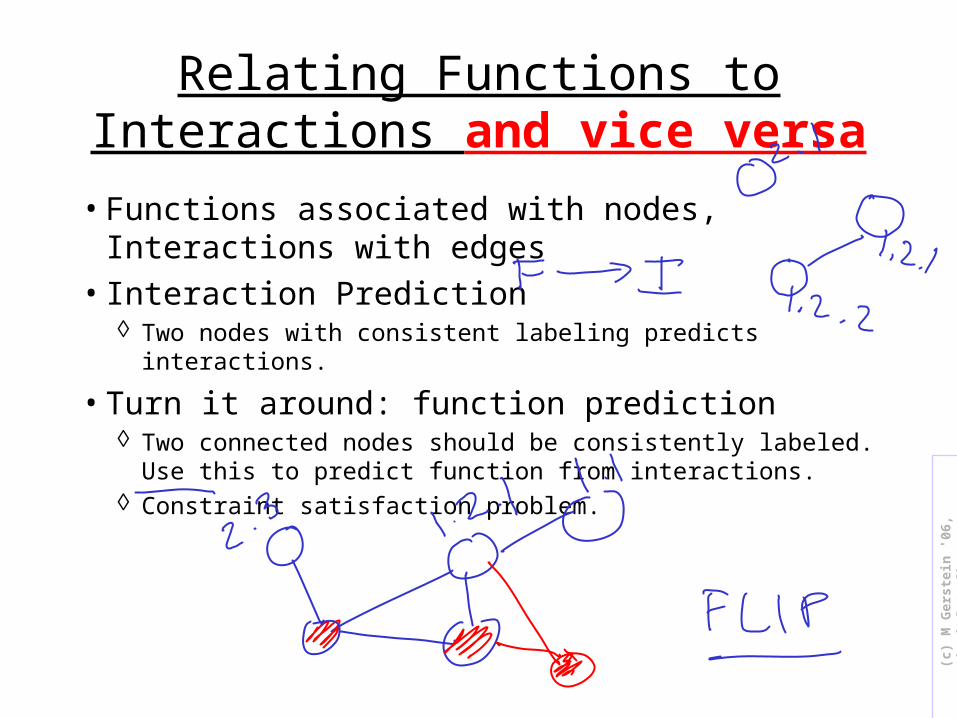
Relating Functions to Interactions and vice versa
• Functions associated with nodes, Interactions with edges
• Interaction Prediction Two nodes with consistent labeling predicts interactions.
• Turn it around: function prediction Two connected nodes should be consistently labeled. Use this to
predict function from interactions. Constraint satisfaction problem.

(
c) M
Ger
stei
n '0
6, g
erst
ein
.info
/tal
ks
17
Predicting Networks via Bayesian Integration:
Practical Issues in Assessing Results

(
c) M
Ger
stei
n '0
6, g
erst
ein
.info
/tal
ks
18
Combination of All Features
Genetic Interactions
GO
MIPS
mRNA co-expr.
Individual Features and their
Integration for Yeast
Membrane Protein
Interaction Prediction

(
c) M
Ger
stei
n '0
6, g
erst
ein
.info
/tal
ks
19
Integration of Features in PIP Gives Much Higher Likelihood Ratios than Any Individual
Feature
Likelihood ratio L better
than
de novo prediction
(PIP)
Merged Expression Correlations
(CC + Rosetta) Essentiality
Similar MIPS
function
600 9.9k
60 85k 56k6 420k 330k 380k0 19M 16M 7.6M 6.2M
Total Number of Protein Pairs Meeting Criteria
Jansen et al. Science 302:449
"WeightedVote"

(
c) M
Ger
stei
n '0
6, g
erst
ein
.info
/tal
ks
20
t-SNAREs
v-SNAREs
H+-transportingATPase (vacuolar)
lipid biosynthesis
cytochrome coxidase
cytochrome bc1complex
oligosaccharyltransferase
transport
COPII
carbohydrate transport
transport
proteintargeting
amino acidglycosylation
Map of Known and Predicted Membrane Protein Interactome in Yeast
New
Known
Xia et al. (2006) "Integrated prediction of the helical membrane protein interactome in yeast." J Mol Biol. 357:339-49

(
c) M
Ger
stei
n '0
6, g
erst
ein
.info
/tal
ks
21
How do we assess topology prediction?
• Validate against a gold-standard of known interactions• Choice of gold-standard is of paramount importance
A negative set is equally important and often overlooked. Reliably measured negative sets are not available, sets based on exclusion based on genomic annotations (i.e. GO cellular component) are often used.
• Measure false positive (FP), true positive (TP), false negative (FN) and true negative (TN) rate
• Often plot results as a ROC-curve (sensitivity vs. specificity) Other metrics useful (e.g. PPV) Balance of positives and negatives

(
c) M
Ger
stei
n '0
6, g
erst
ein
.info
/tal
ks
22
Comparison of Predictions against a Positive and Negative Gold Standard
Threshold "predictions" at different levels and compare to + and - gold standards
ROC plot(cross validated)
"Error Rate"
"Cov
erag
e"

(
c) M
Ger
stei
n '0
6, g
erst
ein
.info
/tal
ks
23
Effect on Predictions of Large Number of Negatives

(
c) M
Ger
stei
n '0
6, g
erst
ein
.info
/tal
ks
24
Importance of Balanced Positive and Negative Examples

(
c) M
Ger
stei
n '0
6, g
erst
ein
.info
/tal
ks
25
Predicting Networks via Bayesian Integration: Adding in Even More
Features

(
c) M
Ger
stei
n '0
6, g
erst
ein
.info
/tal
ks
26
Adding in More Features
Absolute mRNA Expression Level Absolute Protein Abundance Marginal Essentiality Synthetic Lethality Co-regulation (via ChIP-chip)
Threading ScoresCo-evolution Scores
Rosetta Stone Gene Clusters Phylogenetic ProfileGene Neighborhood
Interologs
More features for de novo
prediction (PIP)
Correlation of functional genomics data for pair of proteins
Matching sequence/structure feature for a pair of proteins
Similar conservation pattern or chrromosomal distribution for a
pair of proteins
Other feature
[Eisenberg, Bork, Boone, Skolnick, Vidal]

(
c) M
Ger
stei
n '0
6, g
erst
ein
.info
/tal
ks
27
Evidence Integration
+ Graph Clustering
I Lee et al. (2004) "A Probabilistic Functional Network of Yeast Genes". Science 206: 1555-1558

(
c) M
Ger
stei
n '0
6, g
erst
ein
.info
/tal
ks
28
Integrated Network Showing Context Inferred
Linkages
I Lee et al. (2004) "A Probabilistic Functional Network of Yeast Genes". Science 206: 1555-1558

(
c) M
Ger
stei
n '0
6, g
erst
ein
.info
/tal
ks
29
ROC-like Plot Showing Power of Integration
I Lee et al. (2004) "A Probabilistic Functional Network of Yeast Genes". Science 206: 1555-1558

(
c) M
Ger
stei
n '0
6, g
erst
ein
.info
/tal
ks
30
Predicting Networks via Bayesian Integration:
Feature List

(
c) M
Ger
stei
n '0
6, g
erst
ein
.info
/tal
ks
31
Phylogenetic Profiles
M Pellegrini et al. (1999) "Assigning protein functions by comparative genome analysis: protein phylogenetic profiles." Proc.Natl. Acad. Sci. 96, 4285-4288.
(
c) M
Ger
stei
n '0
6, g
erst
ein
.info
/tal
ks
32
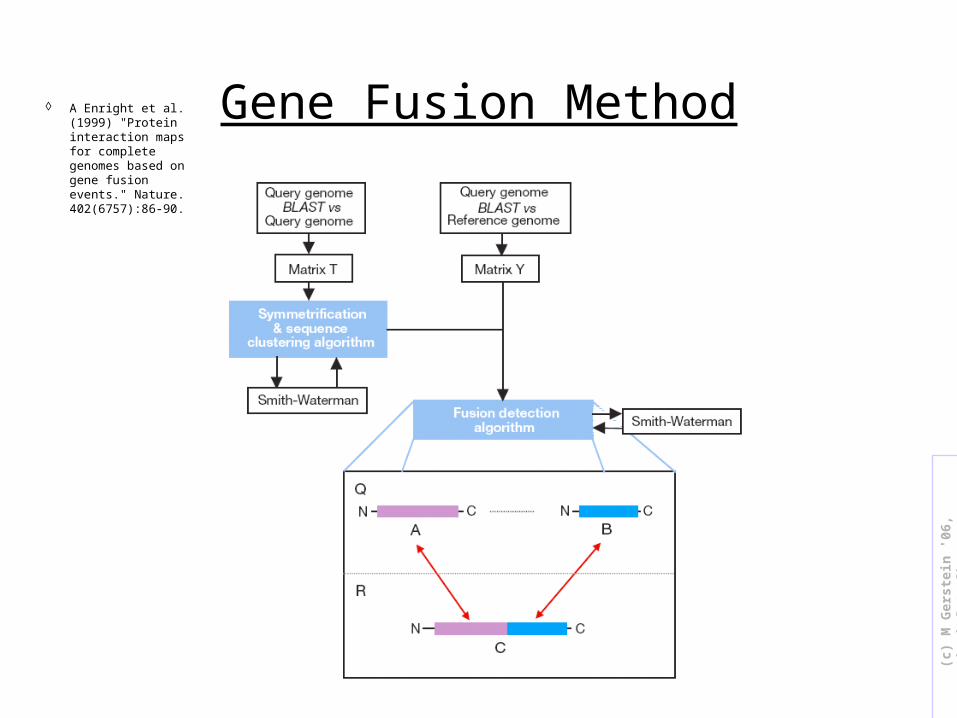
Gene Fusion Method A Enright et al. (1999) "Protein interaction maps for complete genomes based on gene fusion events." Nature. 402(6757):86-90.

(
c) M
Ger
stei
n '0
6, g
erst
ein
.info
/tal
ks
33
Co-citation feature
• P(chance L or more abstracts co-cite two proteins | n,m,N)
[from Ramani et al., 2005]
A Ramani et al. (2005) "Consolidating the set of known human protein-protein interactions in preparation for large-scale mapping of the human interactome." Genome Biology 6:r40.
(
c) M
Ger
stei
n '0
6, g
erst
ein
.info
/tal
ks
34
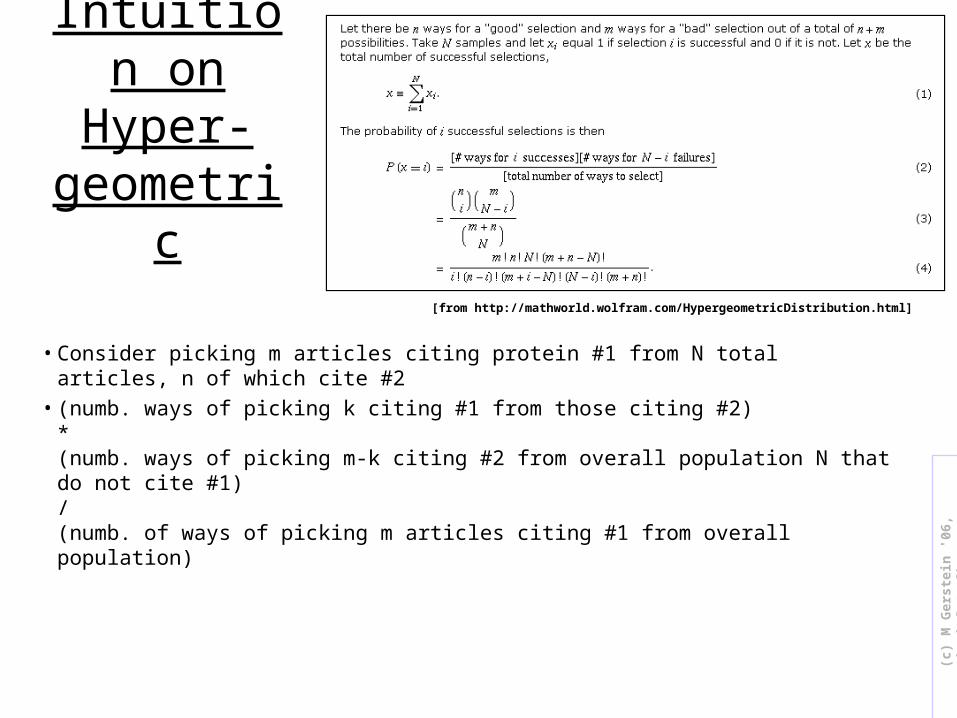
Intuition on Hyper-
geometric
• Consider picking m articles citing protein #1 from N total articles, n of which cite #2
• (numb. ways of picking k citing #1 from those citing #2) * (numb. ways of picking m-k citing #2 from overall population N that do not cite #1) / (numb. of ways of picking m articles citing #1 from overall population)
[from http://mathworld.wolfram.com/HypergeometricDistribution.html]

(
c) M
Ger
stei
n '0
6, g
erst
ein
.info
/tal
ks
35
Abs. Prot. Abund. & mRNA abund
• If A and B interact, abundance (A) - abundance (B) is less than just two random pairs (might be described proportionally)

(
c) M
Ger
stei
n '0
6, g
erst
ein
.info
/tal
ks
36
Interologs & Regulogs
H Yu et al. (2004) "Annotation transfer between genomes: protein-protein interologs and protein-DNA regulogs." Genome Res 14: 1107-18.

(
c) M
Ger
stei
n '0
6, g
erst
ein
.info
/tal
ks
37
LRcutoff ~ 1000
More similar Pairs of Sequences
Hig
her
Wei
ghte
d V
ote,
Mor
e lik
ely
to in
tera
ct
75
[Yu et al, Genome Res 14: 1107-18]
High likelihood ratios from interolog
mapping (for very similar
sequences)

(
c) M
Ger
stei
n '0
6, g
erst
ein
.info
/tal
ks
38
Synthetic Lethality
A
B
a
B
XA
bViable Lethal
a
bWild-type Viable
X
• Synthetic Lethality Identifies Functional Relationships
• Large-Scale Synthetic Lethality Analysis Should Generate a Global Map of Functional Relationships between Genes and Pathways
• Gene Conservation = Genetic Network Conservation

(
c) M
Ger
stei
n '0
6, g
erst
ein
.info
/tal
ks
39
A
B
C
EssentialProduct
X
Y
Z
A
B
C
EssentialProduct
X
Y
Z
A
B
C
EssentialProduct
X
Y
Z
A
B
C
EssentialProduct
X
Y
Z
X
Dead
X
DeadDead
X
X X
X
GeneticInteractionNetwork
Similar Patterns of Genetic Interactions Identify Pathways or Complexes

(
c) M
Ger
stei
n '0
6, g
erst
ein
.info
/tal
ks
40
Prevalence of interactions for co-regulated proteins
Occ
urr
en
ce o
f m
oti
f re
lati
ve t
o r
andom
expect
ati
on (
log)
TF-target Regulation
Target interaction

(
c) M
Ger
stei
n '0
6, g
erst
ein
.info
/tal
ks
41
Predicting protein interactions by completing defective cliques
• High-throughput experiments are prone to missing interactions
P Q
K
• If proteins P and Q interact with a clique K of proteins which all interact with each other, then P and Q are more likely to interact with each other
• P, Q, and K form a defective clique

(
c) M
Ger
stei
n '0
6, g
erst
ein
.info
/tal
ks
42
Predicting protein interactions by completing defective cliques (cont’d)
• A defective clique can be viewed as the union of two overlapping complete cliques
P Q
K• To find all defective
cliques, we look for partial overlap of pairs of maximal cliques
• In test cases shows good prediction likelihood ratio

(
c) M
Ger
stei
n '0
6, g
erst
ein
.info
/tal
ks
43
Examples
Yu et al, 2006, Bioinformatics
(
c) M
Ger
stei
n '0
6, g
erst
ein
.info
/tal
ks
44
Predicting Networks via Bayesian Integration: Practical Analysis of Feature Correlation

(
c) M
Ger
stei
n '0
6, g
erst
ein
.info
/tal
ks
45
Does adding in more features help?

(
c) M
Ger
stei
n '0
6, g
erst
ein
.info
/tal
ks
46
Integration of Three Best Additional Features with Four Original Features
0.75
0.8
0.85
0.9
0.95
1
0 0.1 0.2 0.3 0.4 0.5 0.6 0.7 0.8 0.9 1
FPR = FP/N
TP
R =
TP
/P
4 Orig. Features
Total 7 Features"Co
vera
ge"
"Error Rate"
L Lu et al. (2005) "Assessing the limits of genomic data integration for predicting protein networks." Genome Res 15: 945-53.

(
c) M
Ger
stei
n '0
6, g
erst
ein
.info
/tal
ks
47
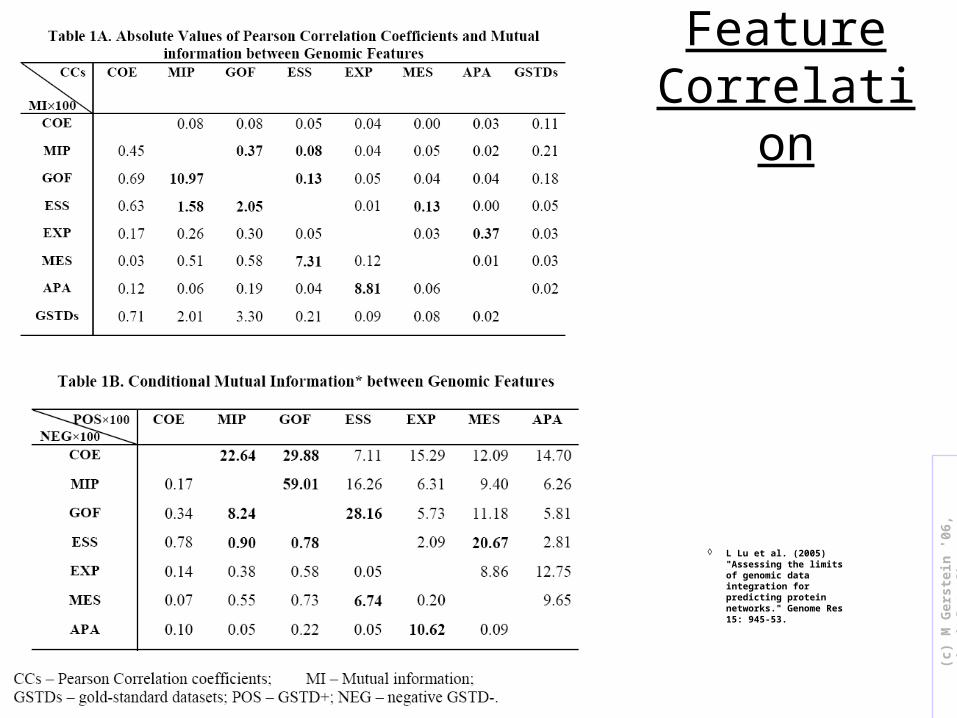
Feature Correlation
L Lu et al. (2005) "Assessing the limits of genomic data integration for predicting protein networks." Genome Res 15: 945-53.

(
c) M
Ger
stei
n '0
6, g
erst
ein
.info
/tal
ks
48
What is Mutual Information?

(
c) M
Ger
stei
n '0
6, g
erst
ein
.info
/tal
ks
49
Entropy H(a)
Information (or uncertainly) about event a is log2 1/f(p,a)
Entropy of an ensemble is probability weighted information content
H(a) = - a=1 to 20 f(a) log2 1/f(a),
where f(a) = frequency of character a
Say string only has one character (AAAAA): H(a) = 1 log2 1 + 0 log2 0 + 0 log2 0 + … = 0 + 0 + 0 + … = 0
Say string is random with all 20 chars equiprobable (ACD..ACD..ACD..):Hrand(a) = -.05 log2 .05 - .05 log2 .05 - … =.22 + .22 + … = 4.3 bits
H for a bionomial variable is 2*log2(1/.5) = 1 bit
Shannon derived a measure of information content called the self-information or "surprisal" of a message: log 1/p

(
c) M
Ger
stei
n '0
6, g
erst
ein
.info
/tal
ks
50
Worked Mutual Information Example
(
c) M
Ger
stei
n '0
6, g
erst
ein
.info
/tal
ks
51
Feature Correlation
L Lu et al. (2005) "Assessing the limits of genomic data integration for predicting protein networks." Genome Res 15: 945-53.

(
c) M
Ger
stei
n '0
6, g
erst
ein
.info
/tal
ks
52
Could lack of improvement have to do with feature correlation? NO! See effect of using
Boosting to overcome correlation
0.6
0.65
0.7
0.75
0.8
0.85
0.9
0.95
1
0 0.1 0.2 0.3 0.4 0.5 0.6 0.7 0.8 0.9 1
FPR = FP/N
TP
R =
TP
/P
Boosted Naïve Bayes
Naïve Bayes
"Co
vera
ge"
"Error Rate"
L Lu et al. (2005) "Assessing the limits of genomic data integration for predicting protein networks." Genome Res 15: 945-53.

(
c) M
Ger
stei
n '0
6, g
erst
ein
.info
/tal
ks
53
Control: Observe how boosting improves integration when features are definitely
correlated
0.6
0.65
0.7
0.75
0.8
0.85
0.9
0.95
1
0 0.1 0.2 0.3 0.4 0.5 0.6 0.7 0.8 0.9 1
FPR = FP/N
TP
R =
TP
/P
Using Simple Naïve Bayes
Using Boosting
"Co
vera
ge"
"Error Rate"