c copyright 2013 stab & the xxviiith issct organising...
TRANSCRIPT

This is the author’s version of a work that was submitted/accepted for pub-lication in the following source:
Thaval, Omkar P. & Kent, Geoffrey Alan(2013)Advanced computer simulation of the milling process. InHogarth, D.M. (Ed.)International Society of Sugar Cane Technologists, Sociedade dos Tecni-cos Acucareiros e Alcooleiros do Brasil & The XXVIIIth ISSCT OrganisingCommittee, Sao Paulo, Brazil, pp. 1595-1607.
This file was downloaded from: https://eprints.qut.edu.au/77912/
c© Copyright 2013 STAB & The XXVIIIth ISSCT Organising Committee
Notice: Changes introduced as a result of publishing processes such ascopy-editing and formatting may not be reflected in this document. For adefinitive version of this work, please refer to the published source:
http://www.issct.org/proceedings.html

FE3 ADVANCED COMPUTER SIMULATION OF THE MILLING PROCESS
By
O.P. THAVAL AND G.A. KENT
Queensland University of Technology, Brisbane, Australia [email protected]
KEYWORDS: Process Modelling, Simulation Package, Extraction model, Milling Efficiency
Abstract
Process modelling is an integral part of any process industry. Several sugar factory models have been developed over the years to simulate the unit operations. An enhanced and comprehensive milling process simulation model has been developed to analyse the performance of the milling train and to assess the impact of changes and advanced control options for improved operational efficiency. The developed model is incorporated in a proprietary software package ‘SysCAD’.
As an example, the milling process model has been used to predict a significant loss of extraction by returning the cush from the juice screen before #3 mill instead of before #2 mill as is more commonly done. Further work is being undertaken to more accurately model extraction processes in a milling train, to examine extraction issues dynamically and to integrate the model into a whole factory model.
Introduction
Process modelling of raw sugar factories has been undertaken using different techniques over the years for the purpose of understanding and improving the performance of the unit operations. For a mathematical model to be useful, it must be sufficiently complete and accurate to represent the system in the range of variables to be studied. Today, several commercial process modelling packages are available with the ability to incorporate various unit operations and integrate them together.
Software packages like Aspen HYSYS (Aspentech, 2012) and SUGARS (Sugars International, 2011) have been used in the past to simulate sugar factory processes. The Aspen HYSYS software is general process modelling software and does not contain a specific milling unit model. The SUGARS package does contain a milling unit model, but does not allow in-house process knowledge to be incorporated into the models (Peacock, 2002).
The use of process modelling software in the South African sugar industry was discussed and demonstrated by Peacock (2002). SIMULINK is a commercial software system overlaid on the MATLAB programming language, which is widely used in modelling, simulation and analysing steady state and dynamic systems using bock diagrams. Peacock explored the SIMULINK system for the mass and energy balance model in the cane diffuser system (an alternative extraction process to the milling

process). The SIMULINK diffuser model, which was at an early stage, consisted of a simple material and enthalpy balance.
The use of a spreadsheet with constraint equations and a Newton-Raphson technique to solve heat and mass balance models was demonstrated by Loubser (2004). Loubser discussed the applicability of such techniques, when commercial software such as SUGARS and SIMULINK is not available.
SysCAD is a commercial process modelling software package developed by Kenwalt Australia (KWA) and extensively used in mineral industries (SysCAD, 2011). The software package offers dynamic modelling and simulation of individual unit operations and the ability to develop “whole of plant” packages. This paper describes the application of SysCAD for developing a comprehensive process model of the milling train of a raw sugar factory. Although SysCAD offers both ProBal (static) and dynamic modes, only the static mode of the software is explored in this paper.
Modelling the milling process
Thaval and Kent (2012a) described a milling process model to predict the extraction performance of the milling train as shown in Figure 1. The main elements of the model are the milling units and the juice screen.
Fig. 1—Milling train
As defined by Thaval and Kent (2012a), the extraction model for a milling train consists of an extraction model for a milling unit and a juice screen and a series of
#5 #4#3#2 #1
JM
C B1 B2 B3 B4 B5
J1 J2 J3 J4 J5
Js
I
Legend:
C Cane
I Imbibition
B Bagasse streams
J Expressed juice streams
Js Return stream from the juice screen
JM Mixed juice stream
Milling unit
Juice screen

mass balance equations to determine the constituents of bagasse and juice transferred from one object to another. The extraction model can be used in two modes. In analytical mode, if bagasse analysis results are available, the extraction model can be used to calculate performance parameters for each milling unit. The calculated mill performance parameters are filling ratio and reabsorption factor (which determine the split of juice between delivery bagasse and expressed juice), imbibition coefficient (which determines the split of brix and moisture in delivery bagasse and expressed juice), and separation efficiency (which determines the split of fibre in delivery bagasse and expressed juice). These performance parameters can then be assessed to determine how well each mill is performing. The predictive mode involves defining the performance parameters for each milling unit so that the extraction model can predict bagasse analysis for each mill and predict the extraction for the milling train. Both the modes have found application in the sugar industry.
Thaval and Kent (2012b) developed an extension to the extraction model to determine the soluble and insoluble cane components in the milling process. The soluble solids were divided into sucrose, reducing sugars, ash and other components. The insoluble solids were divided into true fibre and mud solids components. The model assisted in understanding the flow of cane components in delivery bagasse and expressed juice, the factors affecting their distribution, and the significance of their impact on extraction performance. The overall performance parameter pol extraction can be determined by this model and the distribution of mud solids into bagasse and mixed juice can be studied using such a model.
Model calibration
Empirical relationships for reabsorption factor and imbibition coefficient were developed by Russell (1968). When these performance parameters are measured for a milling unit using the theory described by Thaval and Kent (2012a) and compared to the estimates from the empirical relationships, they are likely to be different.
To account for the differences between the actual values and the values calculated from the empirical equations, a calibration process is undertaken. Before using the theory to predict extraction performance, measurements of performance are first used to calibrate the model so that, for the conditions existing at the time of the measurements, the predicted extraction performance using the empirical equations matches the measured extraction performance. Multipliers are used to carry out this calibration. A multiplier is defined as the ratio of the actual value to the empirical value. When using the theory for prediction of performance, the multipliers are used to adjust the empirical performance parameter values so that, at the measured conditions, an exact match is obtained. Consequently, when changes in parameters are made, the actual extraction and not just the extraction difference can be reasonably well predicted.
Developing a milling unit model in SysCAD
The preliminary development work was conducted by modelling a milling unit as a tank (a standard object in SysCAD) and programming the tank to behave as a milling unit as defined by Thaval and Kent (2012a). KWA subsequently developed a milling unit object based on the Thaval and Kent (2012a) model.

Figure 2 shows a SysCAD milling unit object. The full model as presented consists of feeders (for input and output of the process streams), the milling unit and a vent for heat transfers. The inputs to the milling unit are feed bagasse and imbibition and the outputs are delivery bagasse and expressed juice. The model when solved splits the feed components between delivery bagasse and expressed juice. Some water may be evaporated in the process and the vent accounts for this loss of water.
Fig. 2—Single milling unit in SysCAD
Figure 3 shows the access window of the milling unit. Pop-up access windows contain all relevant information about a unit operation. The white cells represent input parameters while the grey cells represent the calculated parameters. The window shows the milling unit performance parameters defined by Thaval and Kent (2012a): filling ratio (called FillingRatio), reabsorption factor (called ReAbsorptionFac) and imbibition coefficient (called ImbibitionCoeff). Using the approach defined by Thaval and Kent (2012b), the separation efficiency is determined by the true fibre separation efficiency (called TF_SepEff) and the true fibre factor (called TrueFibreFactor). The window also shows the bagasse purity ratio (called BagPurityRatio) that, as described by Thaval and Kent (2012b), is used to determine the bagasse sucrose content from the bagasse brix content.

Fig. 3—Milling unit access window
Mimicking the Thaval and Kent (2012a) model, the SysCAD model can be used in both analytical mode and predictive mode.
Predictive mode is the default mode of operation of the SysCAD milling unit model. The performance parameters are mill inputs as shown in Figure 3 as the boxes with the white background.
To operate the SysCAD milling unit model in analytical mode, the Analytical_Controller object shown in Figure 4 is required. This object contains four PID controllers to determine the performance parameters. As shown in Figure 4, the imbibition coefficient is determined from the controller. The Set Point_Tag refers to the input bagasse brix, the measured tag (Meas_Tag) refers to the bagasse brix determined from the model and the Control_Tag refers to the performance parameter (imbibition coefficient). When solving the model, the controllers automatically adjust the performance parameters so that the required bagasse analysis results are achieved.

Fig. 4—Analytical controller access window
Thaval and Kent (2012a) developed a corrected filling ratio term which can be calculated from the conventionally defined filling ratio. The corrected filling ratio is calculated using the delivery bagasse fibre rate, instead of the cane fibre rate. In predictive mode, it is considered more likely that the corrected filling ratio will be used. In analytical mode, however, it is considered more likely that the conventionally defined filling ratio will be used. In SysCAD, the conventionally defined filling ratio is called FillingRatioM. The corrected filling ratio is the FillingRatio shown as an input in Figure 3. There is a filling ratio Checkbox called UseFillingRatio shown in Figure 3 that determines which of the two filling ratios is used as an input.
Developing a juice screen model in SysCAD
Thaval and Kent (2012a) developed a juice screen model to separate insoluble solids from a juice stream, resulting in a juice stream with low insoluble solids content and a high insoluble solids stream. The juice screen model is used to divide the juice

stream inputs (from #1 mill and #2 mill in Figure 1) between screened juice (mixed juice in Figure 1) and the cush return (return stream from the juice screen in Figure 1). Thaval and Kent (2012b) developed a true fibre factor term to account for the mud solids content of mixed juice stream. The juice screen model is incorporated in the SysCAD software, with the true fibre content of the cush return and the mixed juice being the inputs.
Figure 5 shows the access window to a juice screen object. As shown in Figure 5, there are three inputs to the model. The first input is the true fibre content of the cush return (called ReturnStreamTFConcReq). The second input is the true fibre content of the screened juice (called MixedJuiceTFConcReq). The third input is the true fibre factor (called TrueFibreFactorReq). In the juice screen object (similar to the milling unit object), the true fibre factor works with the true fibre separation efficiency of the juice screen to determine the overall insoluble solids content of the screened juice.

Fig. 5—Juice screen access window
It is also possible, instead of defining the true fibre factor, to define the split of mud solids between screened juice and cush return (called FracMudtoJuice). To configure this alternative approach, the SetFracMudtoJuice Checkbox should be selected.
Developing a milling train model in SysCAD
The milling unit model developed in SysCAD was constructed by linking together feeders, milling units and a juice screen as shown in Figure 6 Feeders are only required for inputs and outputs to the entire model (cane, imbibition, final bagasse and mixed juice). Most object output streams are input streams to another object and so don’t require a feeder.

Fig. 6—Milling train model in SysCAD
Figure 6 shows six controllers across the top of the figure called Inputs, Multipliers, Multipliers1, Analysis, Imbibition_Control and General_Controller and one down the left hand side of the figure called Filling_Ratio. SysCAD classifies these controllers as programmable module (PGM) controllers. A PGM controller is used to simulate plant operations and calculate displays. Figure 7 shows one controller (Imbibition_Control).

Fig. 7—PGM controller- Imbibition_Control
The Inputs controller is used to feed the bagasse analysis data in the model. The Filling_Ratio controller calculates the corrected filling ratio values from the filling ratio values as described by Thaval and Kent (2012a). These filling ratio values are used in the Multipliers and Multipliers1 controllers.
The Multipliers and Multipliers1 controllers calibrate the model. The controllers calculate the mill performance parameters from empirical equations, determine the multipliers and use the multipliers when predicting extraction performance as defined in the model calibration section earlier.
The Analysis controller shows the bagasse analysis output in the predictive mode. The Imbibition_Control is used to change the added water rate as fibre % cane is changed. The General_Controller turns the model from analytical mode to predictive mode and vice versa. It also controls the flow of cush return to the #2 or the # 3 mill.
Figure 6 shows four controllers down the left side of the figure called TF_SE, Reab_Fac, Imb_Coeff and Pty_Rat. These controllers are PID controllers, like Analytical_Controller in Figure 2. These PID controllers are set to determine the performance parameters for each milling unit as shown in Figure 4.
The table shown below the milling train model is an annotation table. Such tables can be created in SysCAD to display outputs of the model. In this case, the brix

extraction of each milling unit and the cumulative brix and pol extraction of each milling unit are displayed.
A tie is installed in the model to split the cush return from the juice screen to #2 or #3 mill. A PGM controller can be used to control this split.
As mentioned earlier, the default mode of the extraction model is predictive. The MILL TUNING INPUTS in the General_Controller (Figure 8) are used to switch from predictive mode to analytical mode and vice versa. The Tune01 parameter as shown in Figure 8 turns the TF_SE, Reab_Fac, Imb_Coeff and Pty_Rat PID controllers on and off with the command of 1 and 0 respectively. This creates flexibility in operating the model from one controller. When the model is running in analytical mode, the Multipliers1 controller is switched off. When turning off the Analytical_Controller, the predictive mode is turned on by default and the controller turns off all the Analytical_Controllers and turns on the Multipliers1 controller. With the multipliers determined and fixed, the model calibration process is started and the model can be run in predictive mode.
Fig. 8—General controller- dynamic tag function
Excel reports
SysCAD includes a function to “communicate” with Microsoft Excel. Inputs can be passed to the model though an Excel interface and values can be exported to Excel when the model is solved. Figure 9 shows an example of an Excel report sheet generated by SysCAD.

Fig. 9—SysCAD report generated in Excel spreadsheet
SysCAD keeps a list of tags, just like a process control computer. All the parameters in the model are available as tags. From Excel, tag values can be set in SysCAD, the model can be run and tags can then be displayed back in Excel.
In Figure 9, the blue cells refer to input values and the white cells are the outputs from the model. The values shown are typical values from model runs. The model is solved in predictive mode and the bagasse analysis is displayed as an output. The brix and pol extraction for each milling unit and overall milling train is also displayed.
Model application
As described, the SysCAD model has essentially the same functionality as the spreadsheet models described by Thaval and Kent (2012a, b). The main benefits of the SysCAD model over the spreadsheet models are:
The equations of the model are well defined for the model objects. They cannot be accidentally changed as is possible with cell formulae in a spreadsheet.
Equations for a milling unit object are only defined once for that type of object instead of having to be defined for every occurrence of that object as is necessary in a spreadsheet.
Units can be turned off and on and splitters can be inserted to divert streams or fractions of steams to different locations.

The links between objects are visible on the model schematic (such as Figure 5) and not hidden in cell formulae. If the objects are connected in a different way, it is a simple matter of moving the link without having to redefine a series of cell formulae.
An example of this last point is discussed in a case study below.
Thaval and Kent (2012a) reported the significance of the juice screen in the MILEX model. Thaval and Kent (2012a) did not, however, explore the position of the juice screen and its significance on extraction. Although the common position is accepted to be before the #2 mill, several Australian mills add the return stream to the #3 mill or distribute the cush between #2 and #3 mill, generally for historical reasons such as adding a new #1 mill before the original first mill and not moving the juice screen. Kent (2001) reported this scenario and mentioned that redirecting the entire or part of the cush return from #2 mill to #3 mill increases the throughput but at an extraction penalty. Kent (2001) did not report any values for reduction in extraction.
Figure 10 shows the more typical case with the return stream from the juice screen being returned before #2 mill (this is similar to Figure 5 but the alternative cush return path to #3 mill has been removed for clarity). Figure 11 shows the alternative case where the return stream from the juice screen is returned before #3 mill. This second scenario was defined by deleting the link between the juice screen object and the #2 mill object and creating a new link between the juice screen object and the #3 mill object. All the analytical controllers are turned off along with the filling ratio controller. The Multipliers1 controller is turned on to calculate the actual mill parameters from the multipliers and are used to predict extraction when cush return is shifted to the #3 mill.
Brix extraction and pol extraction results from the models are shown in the annotation table in each of the figures. A reduction of 0.76 units of brix extraction and 0.64 units of pol extraction is recorded when the return stream is directed to the #3 mill.
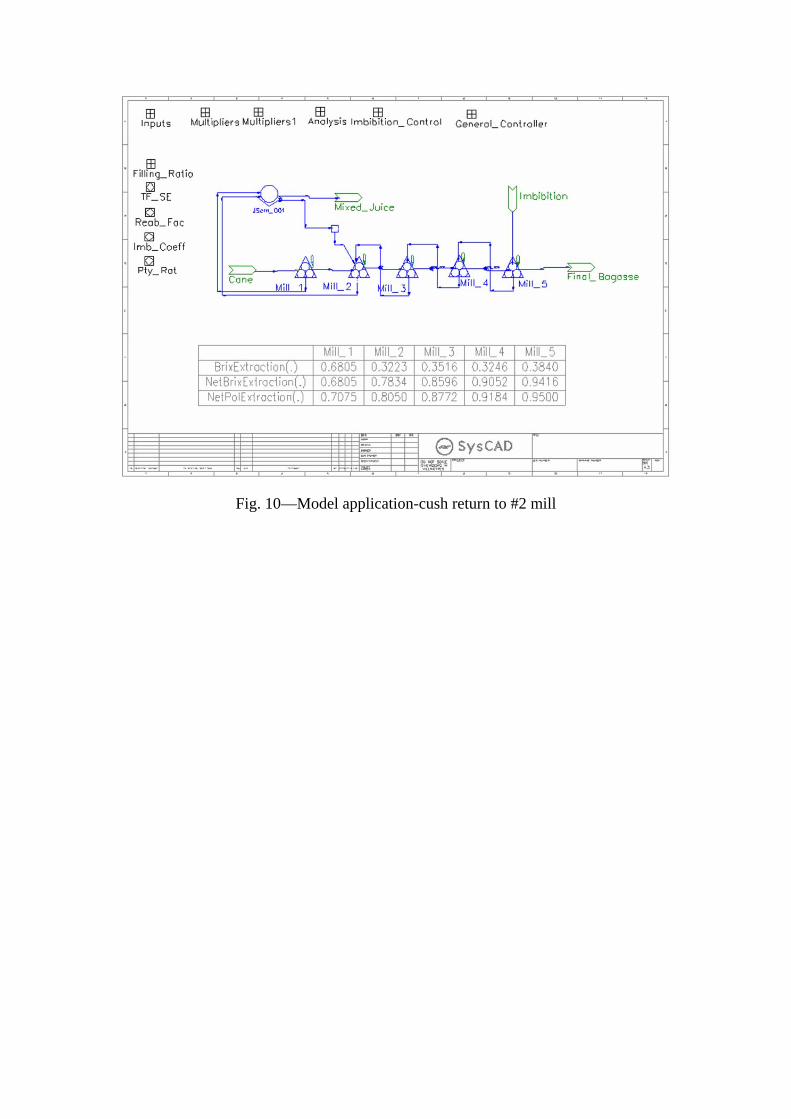
Fig. 10—Model application-cush return to #2 mill

Fig. 11—Model application-cush return to #3 mill
Further work
This paper describes the application of SysCAD in static mode. Further work has commenced to change the imbibition coefficient approach for determining brix extraction performance to an alternative approach that better represents the extraction process by modelling the cell breakage and imbibition mixing processes separately (Kent, 1997). Further work is also being undertaken to simulate the milling process in a dynamic mode. In one application of dynamic mode, continuous cane supply data, such as from the NIR-based Cane Analysis System (Staunton et al., 1999), can be fed into the model with brix and pol extraction predictions recorded as a function of time. This approach can be used to assess a range of imbibition control strategies to maximise extraction for a given total imbibition quantity.
The milling train model discussed in this paper is part of a ‘whole of factory’ model being developed in SysCAD that will ultimately enable the impact of a change in any part of the factory on the whole process to be examined.
Conclusion
The development and application of the SysCAD software as a process modelling tool has been demonstrated and discussed. This approach to process modelling provides the benefits of commercial flow sheeting software in terms of flexibility of configuration and ease of use. It also assists the incorporation of knowledge developed through research into commercially available models.

The model application example of the cush return discussed above shows the flexibility and ease of use of SysCAD. The model was used to show that returning the cush to the #3 mill produces substantial reduction in extraction performance.
The dynamic modelling capability of SysCAD provides a potential means for assessing the response of the milling process to different cane characteristics. It is expected that this work will enable the effectiveness of different control strategies to be assessed. It is planned that the milling train model will be integrated with other process models as part of a whole factory model to provide more accurate prediction of the effect of changes in any part of the process on the outputs of the whole factory process.
Acknowledgements
The authors would like to thank the Sugar Research & Development Corporation (SRDC) for funding the project. The authors would also like to thank the staff at KWA, in particular; Dr John McFeaters and Merry Huang for providing training and support in relation to the implementation of the milling model within SysCAD.
REFERENCES Aspentech. (2012). Aspen HYSYS. Accessed 1 Feb. 2012.
http://www.aspentech.com/hysys Kent, G.A. (1997). Modelling the extraction process of milling trains. Proc. Aust. Soc.
Sugar Cane Technol., 19: 315-321. Kent, G.A. (2001). A model to estimate milling train throughput. Proc. Aust. Soc.
Sugar Cane Technol., 23: 457-460. Loubser, R.C. (2004). Heat and mass balance using constraint equations, and the
Newton-Raphson technique. Proc. S. Afr. Sug. Technol. Ass., 78: 457-472. Peacock, S.D. (2002). The use of SIMULINK for process modelling in the sugar
industry. Proc. S. Afr. Sug. Technol. Ass., 76: 444-455. Russell, G.E. (1968). An investigation of the extraction performance of sugarcane
crushing trains. PhD Thesis, University of Queensland. Staunton, S.P., Lethbridge, P.J., Grimley, S.C., Streamer, R.W., Rogers, J. and
Mackintosh, D.L. (1999). On-line cane analysis by near infra-red spectroscopy. Proc. Aust. Soc. Sugar Cane Technol., 21: 20-27
Sugars International (2011). Sugars for Windows. Accessed 30 Nov. 2011. http://www.sugarsonline.com/SugarsOverview.pdf.
SysCAD. (2012). SysCAD. Accessed 06 Jun. 2012. http://www.syscad.net Thaval, O.P. and Kent, G.A. (2012a). An enhanced mill extraction model. Proc. Aust.
Soc. Sugar Cane Technol. (CD-ROM), 34: 11p. Thaval, O.P. and Kent, G.A. (2012b). Modelling the flow of cane constituents in the
milling process. Proc. S. Afr. Sug. Technol. Ass., 85: 435-453.