by xavier haro carriÓn - university of...
TRANSCRIPT
1
CONSERVATION IN A FRAGMENTED SEMI-DECIDUOUS FOREST IN ECUADOR
By
XAVIER HARO CARRIÓN
A THESIS PRESENTED TO THE GRADUATE SCHOOL OF THE UNIVERSITY OF FLORIDA IN PARTIAL FULFILLMENT
OF THE REQUIREMENTS FOR THE DEGREE OF MASTER OF SCIENCE
UNIVERSITY OF FLORIDA
2013

2
© 2013 Xavier Haro-Carrión

3
To my parents, Elizabeth and Gonzalo, for all their support “A mis padres, Elizabeth y Gonzalo, por todo su apoyo”
4
ACKNOWLEDGMENTS
First I thank F.E. “Jack” Putz for his investments in my professional development
and for his support during the many turns in my career. I also thank my committee
members Stephanie Bohlman and Kaoru Kitajima for their suggestions and constructive
criticism. Thanks also to Michael Binford for his assistance, Damian Adams for his help
in initial stages of proposal development, and Rebecca Kimball for her support and
advice. The staffs of the Department of Biology and the International Center helped me
navigate the University of Florida (UF) system. Karen Patterson, Susan Spaulding, and
Tangelyn Mitchell in Biology and Debra Anderson in the International Center provided
especially important logistical support.
My parents Gonzalo and Elizabeth, my sister Gabriela, and my friend Erika
Carrera all provided continuous support from overseas. In Gainesville, Craig Noles
helped with the editing of this thesis and with much other support. I have been
privileged to share offices with many interesting and fun graduate students including:
Drew Joseph, Yuan Zhou, and Jeremy Ash during my first year; Paulo Brando,
Alexander Shenkin, Ana Alice Eleuterio, Joseph Veldman, Mathew McConnachie,
Vincent Medjibe, and Martijn Slot later on my career; and, Rebeca Lima, Ruslandi,
Thales West, and Anand Roopsind during the final stages. Claudia Romero always
helped make me feel at home. Finally, my roommates and friends in Gainesville made
my life pleasant and enjoyable.
This research was made possible by many people in my home country of
Ecuador. Katya Romoleroux, Hugo Navarrete, and Carmen Torres from Pontificia
Universidad Católica del Ecuador provided institutional support and some field
equipment. Alvaro Pérez and the staff of QCNE assisted with species identification. The

5
first chapter of this thesis was conducted near Lalo Loor Reserve. Catherine Woodward,
Jason Hendsch, and Gabriela Castillo helped logistically. Fieldwork would have been
impossible without the help of field assistants Cesar Vera, Segundo Cusme Vera,
various students and volunteers from Lalo Loor, and many other people. Landowners in
the study region allowed me to sample on their land and shared their experiences with
me. The Ecuadorian Ministry of Environment granted permission for this work. In
Gainesville, Trent Blare and Cade Turnbach collaborated with me during various stages
of this study.
The second chapter of this thesis is based on the results from an internship with
Conservation International-Ecuador. Montserrat Alban directly supervised this work,
while Free de Koning, Christian Martinez, Cristina Felix, and Luis Suárez provided
suggestions and constructive criticism. I would also like to thank representatives of
Ceiba Foundation, ALTROPICO, UNOCYPP, FECCHE, Instituto de Investigaciones
Marinaz Nazca, and Fundación Coordillera Tropical for participating in my surveys.
Representatives of the Ceiba Foundation generously helped coordinate fieldwork in
Manabí and representatives of ALTROPICO included me in workshops with their
beneficiaries in Carchi and Esmeraldas, which facilitated my fieldwork.
Financial support for this research came from a Tropical Conservation and
Development (TCD) grant from the Center for Latin American Studies at UF and an
Innovation through Institutional Integration (I-Cubed) grant to UF from the US National
Science Foundation (NSF). The Fulbright Program of the Department of State of the
United States of America and the Secretaria Nacional de Educación Superior, Ciencia,
Tecnología e Investigación (SENESCYT) of Ecuador funded my initial graduate studies,

6
after which I was supported by teaching assistantships from the Department of Biology.
I thank Ann Wagner and Kent Vliet for their assistance when I started teaching as well
as all the professors for whom I worked as a TA. The experience of teaching contributed
substantially to my professional development.
7
TABLE OF CONTENTS page
ACKNOWLEDGMENTS .................................................................................................. 4
LIST OF TABLES ............................................................................................................ 9
LIST OF FIGURES ........................................................................................................ 10
LIST OF ABBREVIATIONS ........................................................................................... 11
ABSTRACT ................................................................................................................... 12
CHAPTER
1 LAND-COVER CHANGE IN A SEMI-DECIDUOUS TROPICAL FOREST: CONSEQUENCES FOR TREE DIVERSITY AND ABOVEGROUND BIOMASS ... 14
Summary ................................................................................................................ 14 Introduction ............................................................................................................. 15 Material and Methods ............................................................................................. 19
Study Area ........................................................................................................ 19 Field Data Collection ........................................................................................ 20 Tree Species Diversity and Aboveground Carbon Estimates ........................... 21 Land-Cover Change Analysis ........................................................................... 22 Implications of Land-Cover Change for Aboveground Biomass and Tree
Diversity ........................................................................................................ 25 Results .................................................................................................................... 25
Tree Diversity and Aboveground Biomass of Different Land-Cover Types....... 25 Land-Cover Change Trajectories ..................................................................... 26 Implications of Land-Cover Change for Tree Diversity and Aboveground
Biomass ........................................................................................................ 27 Discussion .............................................................................................................. 28 Conclusions and Implications for Conservation ...................................................... 31
2 IMPLEMENTATION OF THE SOCIO BOSQUE PROGRAM BY CONSERVATION INTERNATIONAL-ECUADOR WITH EMPHASIS ON THE NORTHWESTERN REGION .................................................................................. 38
Summary ................................................................................................................ 38 Introduction ............................................................................................................. 39 Materials and Methods............................................................................................ 43
Evaluation of CI-Partners ................................................................................. 43 Evaluation of the CI-PSB Framework and the PSB .......................................... 44 Survey Instrument Design ................................................................................ 44 Participant Selection ......................................................................................... 45
Results .................................................................................................................... 46
8
Evaluation of CI-partner Institutions ................................................................. 46 Evaluation of the CI-PSB Framework ............................................................... 46 Evaluation of the PSB ...................................................................................... 47
Discussion .............................................................................................................. 48 Conclusions ............................................................................................................ 50
APPENDIX: TREE SPECIES AMONG MAJOR LAND LAND-COVER TYPES ........... 56
LIST OF REFERENCES ............................................................................................... 62
BIOGRAPHICAL SKETCH ............................................................................................ 69

9
LIST OF TABLES
Table page 1-1 Total tree species richness, number of endemics, number of species with
IUCN status, and average density in forest, secondary forest, pasture and forestry plantations for trees >10 cm DBH .......................................................... 33
1-2 Accuracy assessment of the 2009 trajectory analysis ........................................ 33
1-3 Consequences of land-cover change for aboveground biomass for the 1990-2009 study period for the 75,016 ha of land surface of the study area in coastal Ecuador .................................................................................................. 33
2-1 Evaluation of the performance of CI-partner institutions ..................................... 51
2-2 Evaluation of the PSB and institutions in the CI-PSB framework by CI-partners .............................................................................................................. 52
2-3 Evaluation of the PSB ......................................................................................... 53
2-4 Percent of respondents that noted a particular PSB co-benefit .......................... 54
2-5 Reported values of the PSB ............................................................................... 55
10
LIST OF FIGURES
Figure page 1-1 Study location in coastal Ecuador. Colored area corresponds to the cropped
Landsat images used to monitor land-cover transitions ...................................... 34
1-2 Individual based species rarefaction curves for trees >10 cm DBH .................... 35
1-3 Average aboveground biomass for forest (N=80), secondary forest (N=13), pasture (N=10), and plantations of Tectona grandis (N=4), Schizolobium parahyba (N=3), and Ochroma pyramidale (N=3) .............................................. 36
1-4 Land-cover trajectory map for the study area ..................................................... 37

11
LIST OF ABBREVIATIONS
ALTROPICO Fundación para el Desarrollo de Alternativas Comunitarias de Conservación del Trópico
CI Conservation International
DBH Diameter at breast height
FECCHE Federación de Centros Chachis de Esmeraldas
IUCN International Union for Conservation of Nature
MA Millennium Ecosystem Assessment
MAE Ministry of Environment of Ecuador
NGO Non-governmental organization
PES Payment for environmental services
PSB Socio Bosque Program
QCA Quito Católica Herbarium
QCNE National Herbarium of Ecuador
REDD+ Reduced emissions from deforestation and degradation and increased carbón sequestration from improved forest management
TM Thematic mapper
TM+ Enhanced thematic mapper
UNOCYPP Unión Noroccidental de Organizaciones Campesionas y Poblaciones de Pichincha

12
Abstract of Thesis Presented to the Graduate School of the University of Florida in Partial Fulfillment of the Requirements for the Degree of Master of Science
CONSERVATION IN A FRAGMENTED SEMI-DECIDUOUS FOREST IN ECUADOR
By
Xavier Haro-Carrión
August 2013
Chair: Francis E. Putz Major: Botany
The best ways to promote biodiversity conservation in highly fragmented
landscapes remain unclear because land-cover dynamics and forest conservation
trade-offs are not fully understood. In recognition of this deficit, I studied land-cover
change and its consequences for tree diversity and aboveground biomass in a
fragmented landscape of 75,050 ha of semi-deciduous forests in Ecuador. Using field
inventories I recorded 123 tree species, including 14 endemic to Ecuador and 16 with
IUCN conservation status, and estimated tree diversity and biomass for the major land-
cover types. Diversity was highest in old growth forests followed by secondary forests,
pastures, and plantations. Old growth forest also exhibited the highest aboveground
biomass; secondary forests and plantations had similar values while pastures had the
least. Based on satellite image analysis I observed that 34% of the study area
experienced land-cover transitions between 1990-2009, with deforestation accounting
for 11%, and forest re-growth or forestry plantation development another 20%.
Aboveground biomass losses from deforestation were nearly offset by gains from forest
re-growth, but the biodiversity losses from land-cover change remained substantial.

13
To better understand one approach to forest conservation in Ecuador, I also
analyzed the Socio Bosque Program (PSB), a national conservation initiative. I
concentrated on the activities of six non-governmental organizations (NGOs) working
for this program. Discrepancies in records of land parcels enrolled in and proposed for
the program between NGOs and the government, and opinions of NGO-technicians
highlighted the need of a better tracking system of properties. Surveys of beneficiaries
indicate large differences in the PSB-related experiences of individual landowners in
Manabí compared to community-representatives from Esmeraldas Province.
Participants from Manabí perceived increased conservation awareness as the only co-
benefit from PSB, stressed the need of better program information, and cited low
credibility of program as a factor preventing more landowners from applying. In contrast,
community representatives from Esmeraldas identified five perceived co-benefits of the
program (increased in security, conservation awareness, interest in learning about the
environment, community collaboration, and better image of the government),
recommended that the financial incentives be increased, and identified internal
community differences as an impediment to increased participation in the program.
14
CHAPTER 1 LAND-COVER CHANGE IN A SEMI-DECIDUOUS TROPICAL FOREST:
CONSEQUENCES FOR TREE DIVERSITY AND ABOVEGROUND BIOMASS
Summary
Highly fragmented landscapes are expected to experience only limited changes
in land-cover because most remaining patches of forest are in unsuitable locations while
arable areas are already dedicated to productive activities that continue. The economic
trade-offs related to forest retention in highly fragmented landscapes are therefore
different than those on deforestation frontiers. To understand land-cover change and its
consequences for carbon storage and biodiversity in fragmented landscapes, I studied
land-cover changes in 75,050 ha of highly fragmented semi-deciduous forest in a
biodiversity hotspot in coastal Ecuador. Relationships between tree diversity and
biomass in different land cover types were also evaluated. With field inventories I
estimated tree diversity and aboveground biomass for each of four major land-cover
types (forest, secondary forest, pasture, and forestry plantations). A total of 123 tree
species were recorded in the study area, including 14 endemic to Ecuador. Tree
diversity was highest in forests followed by secondary forests, pastures, and
plantations. Forest also exhibited the highest aboveground biomass, while plantations
and secondary forests were similar, and pastures were the lowest. An analysis of
satellite images from 1990, 2000, and 2009 revealed that despite having been highly
fragmented since the 1970s, land-cover was still very dynamic. While forest conversion
into pastures continued (12% of the area), large areas of what was pasture in 1990
transitioned into secondary forests or plantations (24% of the area), with 4% of the latter
re-cleared for pasture before the end of the two-decade period of monitoring. The
associated aboveground biomass and diversity values for each land-cover indicate

15
contrasting consequences of land-cover transitions for biomass and diversity.
Aboveground biomass losses from deforestation were nearly offset by secondary forest
re-growth or plantation development. In contrast, forest loses had substantial negative
consequences for diversity. This study reveals high dynamism in land-cover transitions
despite earlier fragmentation, reveals the importance of initiatives to conserve the
remaining forest patches to protect biodiversity and to promote secondary forest
conservation to protect biodiversity and increase carbon stocks, and indicates some
synergies between tree diversity and aboveground biomass for semi-deciduous tropical
vegetation.
Introduction
Human-affected environments are starting to dominate the world’s landscapes,
often accompanied by losses of biodiversity (Tallis and Polasky 2009; Foley et al.
2005). Current rates of species extinction are estimated to be as much as 1,000 times
faster than in any previous time (MA 2005a); forests worldwide are being lost at net rate
of 7.3 million hectares per year (FAO 2005), and ecosystems changed more rapidly in
the 20th Century than at any other time in human history (MA 2005b). While these
statistics call for increasing conservation efforts, they also indicate complex trade-offs
between profitable land-uses and biodiversity conservation.
Understanding the trade-offs between land-use, biodiversity, and carbon stocks
requires knowledge of the drivers and consequences of land-use choices. Ecologists
have traditionally reported biodiversity losses associated with land-cover change (e.g.,
Nelson et al. 2008; 2009; Brooks et al. 2009; Lele et al. 2010; Raudesepp-Hearne et al.
2010). Only recently, efforts have been made to quantify the financial values of the
ecosystem services that are also lost (e.g., Costanza et al. 1997). Despite these efforts,
16
trade-offs between ecosystem conservation and economic use persist and species
continue to be lost as land management expands and increases in intensity (Nelson et
al. 2008; Brooks et al. 2009; Lele et al. 2010; Raudesepp-Hearne et al. 2010).
Rapid deforestation and associated land-use transformations in the tropics reveal
clear trade-offs between ecosystem conservation and exploitation (Asner et al. 2009). In
response to the losses, efforts to pay for conservation using payments for
environmental services (PES) have recently flourished (e.g., Asner et al. 2009; Lele et
al. 2010; Koellner et al. 2010). PES programs in the tropics started with efforts to
maintain watersheds, scenic beauty, crop pollinators, and biodiversity (Wunder 2007;
Koellner et al. 2008; 2010). More recently, carbon sequestration has received a great
deal of attention in response to increasing concerns about global climate change.
Financial incentives for carbon sequestration by planted forests were provided under
the Kyoto Protocol, but no compensation was provided for the maintenance of standing
forests (UNFCCC 1998; Davidson et al. 2001). The carbon benefits of standing forests
are now recognized in a new approach referred to as “reduced emissions from
deforestation and degradation, and increased carbon sequestration from improved
forest management” (REDD+; Santilli et al. 2005; Angelsen et al. 2009).
While advances in PES are encouraging, concerns remain about their financial
viability, potential negative impacts for naturally non-forested ecosystems, and the
effects of intensification of forest management to sequester more carbon (Stickler et al.
2009; Putz and Redford 2009a; Fisher et al. 2011; Ruslandi et al. 2011). Nonetheless, it
is generally agreed that carbon payments can potentially alleviate forest conservation
costs if properly used (Harvey et al. 2010).

17
To assess the value of carbon payments for forest conservation, estimates of the
quantities of carbon stored in forests and the biodiversity consequences of land-use
transitions are needed. A fair amount of research has reported carbon and biodiversity
consequences of land-use transitions for moist tropical ecosystem, mostly on
deforestation frontiers (Gibbs and Herold 2007; Baker et al. 2010; Macedo et al. 2012).
In contrast, this sort of information is scarce for other tropical ecosystems and for
already highly fragmented forests. In fragmented landscapes PES can have low impact
on reducing deforestation rates (Sánchez-Azofeila et al. 2007), and have limited effect
on changing land-use, which are usually correlated to other variables such as
topography and economics (Ferraro 2000; Sierra and Russman 2006; Freitas et al.
2010) indicating that better understanding of land-use transitions in fragmented
landscapes are necessary.
The semi-deciduous forests of coastal Ecuador provide an excellent opportunity
to evaluate the carbon and biodiversity consequences of land-use transitions in a
severely fragmented landscape. Deforestation rates in Ecuador are among the highest
in Latin America (Asner et al. 2009) and land-use transitions are the major source of the
country’s carbon emissions (Clirsen 2000, MAE 2010a). Within Ecuador, coastal areas
have long suffered the highest deforestation rates (Clirsen 2000; Sierra et al. 2002).
Current deforestation along the coast is concentrated in the moist tropical forests of
northwestern Ecuador in the Province of Esmeraldas on the frontier with Colombia
(Rudel 2000; Sierra et al. 2002). Along the central and southern coast, favorable
environmental conditions, reasonably high soil fertility, and rainfall seasonality, together
with a governmental focus on agro-exports during the last half of the past century,
18
resulted in a matrix of privatively owned agricultural land with <5% of native vegetation
cover remaining (Dodson and Gentry, 1991; Sierra, 1999; Clirsen 2000). The vegetation
in this region, which ranges from semi-deciduous vegetation in central coastal Ecuador
to dry forests in the south, are considered a biodiversity hot-spot because of their high
species richness, abundance of endemic species, and limited remaining coverage
(Myers et al. 2000; Cuesta-Camacho et al. 2006). While conservation in these areas is
a priority, the consequences of land-use change for biodiversity and carbon stored in
trees are less well understood.
Recently developed approaches to forest conservation in Ecuador are based on
payments for ecosystem services (PES), of which Ecuador has a diverse portfolio
(Wunder 2006). Ecuador’s PES programs prior to 2008 were decentralized initiatives
that targeted watershed protection and carbon sequestration (Cordero 2008; Wunder
and Alban 2008). In 2008, Ecuador’s Ministry of Environment launched the nation-wide
Socio Bosque Program (PSB, Programa Socio Bosque). Socio Bosque offers financial
compensation to landowners who preserve forest. This program is also the base for the
country’s REDD+ proposal (Chiu 2009; MAE 2010a, b; de Koning et al. 2011).
Biodiversity conservation and carbon stored in forests are key elements of Socio
Bosque (see Chapter 2 for details about this program). In recognition of the importance
of trees for forest biodiversity conservation and carbon sequestration, I evaluated the
consequences of land-use transitions for trees in a fragmented landscape of semi-
deciduous forest in the Jama-Pedernales region of coastal Ecuador. The objectives of
this chapter are to: i) describe the tree species diversity and carbon stored in
aboveground biomass the major land-cover types; ii) assess the extent of identified
19
land-cover types at the landscape level; and, iii) explore the consequences of land-use
transitions for tree diversity and aboveground biomass.
Material and Methods
Study Area
The study area encompasses about 75,050 ha of what historically was semi-
deciduous lowland tropical vegetation between the towns of Pedernales (UTM 17N
605712.73m E 7111.74m N) and Jama (UTM 17M 581278.15m E 9977385.34m S).
Forest is estimated to cover about 20% of this area and constitutes the largest remnant
of this vegetation type in Ecuador (Fig 1; Neill 1999). Semi-deciduous tropical forest is
currently found along the coast to approximately 10 km inland at elevations of 100-300
m; at higher elevations it transitions into cloud forest (Sierra 1999; Neil 1999). This
region is characterized by temperatures that fluctuate around 25°C, annual precipitation
of about 951 mm, a dry season of around 4 months during which monthly precipitation
can be as low as 3 mm, and rainy months with precipitation up to 190 mm (Neill 1999).
The terrain is composed of steep slopes with more level valleys used for agriculture and
cattle ranching. The remaining forests have relatively open canopies with dense
understories or closed canopies with more sparse understories; some species are
thorny and many trees lose their leaves during the dry season (e.g., Cochlospermum
vitifolium and Tabebuia chrysantha). Species characteristic of this vegetation type
include Gallesia integrifolia (Phytolacaceae), Triplaris cumingiana and Cocoloba mollis
(Polygonaceae), Pseudolmea rigida (Moraceae), and Eugenia spp. (Myrtaceae; Sierra
1999).

20
Currently, the major land-cover types in the study area are pastures, secondary
forests, forestry plantations, and some patches of relatively old growth natural forest.
The latter vegetation type (hereafter “forest”) likely experienced some selective logging
and other human impacts. Secondary forests are the result of pasture abandonment,
including pasture-fallow cycles, which occurred mostly in the last 20 years as indicated
by households and reported by deforestation rates in the area (Dodson and Gentry,
1991; Sierra, 1999; Clirsen 2000). Cattle pastures are the dominant land-cover type and
are planted with exotic grasses including Panicium maximum (saboya) and Cynodon
spp. (star grass). Most pastures support a scattered variety of species that provide
shade for cattle and other benefits. The forestry plantations are mostly monocultures of
Tectona grandis (teak), Schizolobium parahyba (pachaco), and Ochroma pyramidale
(balsa).
Field Data Collection
Field inventories conducted during 2010 and 2012 were used to estimate
aboveground biomass and tree diversity by land-cover type. In forest and secondary
forest I established 60 x 60 m2 plots with a nested 20 x 20 m2 plot (modified after
Phillips et al. 2003; Magnusson et al. 2005). I recorded tree diameter at breast height
(DBH; 1.40 m above the ground) and species of all trees >20 cm DBH in the large plot
and 10-20 cm DBH in the sub-plot. Because forestry plantations were typically
monocultures and many were young, I used 20 x 20 m2 plots to census all trees >10 cm
DBH. A single plantation of balsa with very young trees was included because this type
of plantation is new to the area. Large pastures (N = 7) were sampled using randomly
located 60 x 60 m2 plots for trees >10 cm DBH but trees in three small pastures were
inventoried in their entirety and then their areas were determined from GPS points taken

21
on their margins. Efforts were made to establish plots in the interior of each land-use
and away from roads, but one forest and one secondary forest were too small and plots
were modified to rectangles of the same area to avoid edge effects. All plots were geo-
referenced with a GPS. Inventories occurred in the vicinity of the town of Tabuga and
between Jama and Pedernales. Voucher specimens were processed in the QCA
Herbarium in Quito and species were identified in the QCA and QCNE Herbaria.
Species listed in Appendix A1 were categorized as endemic, native, or introduced to
Ecuador and include conservation status based on IUCN criteria when available.
Taxonomy is based on Tropicos.org (2012).
Tree Species Diversity and Aboveground Carbon Estimates
To correct for the number of individuals sampled, rarefaction curves computed
with EstimateS software (V.8.2) were used to compare tree species richness between
land-cover types (Gotelli and Colwell 2001). I set individuals as samples and then
calculated diversity using the Mao Tao estimator (Colwell 2004). The significance of
observed differences in species richness between land-cover types (at P<0.05) were
based on the locations of the rarefaction curves and their associated 95% confidence
interval (CIs).
The aboveground biomass (AGB) of each tree was estimated using an allometric
equation from Chave et al. (2005) and published values for wood density. The model
employed uses diameter at breast height (DBH) and wood density (p):
AGBest = p x exp(-1.499=2.148ln(D)+0.207(ln(D))2-0.0281(ln(D))3)
Wood density values were obtained from Zanne et al. (2009). I used the average
of values found for South America for each species (Appendix A1). For species not in
the database I used the average wood density value for the genus (54 species); for
22
genera that were not listed I used an average value for the family (10 cases). In three
cases species values from other regions of the world were used because no data were
found for South America; for two unidentified species, the average of all wood density
values was used.
Land-Cover Change Analysis
To quantify land-cover change over time I used digitally processed satellite
images to create a change trajectory map. Due to the abundance of dry season
deciduous trees, I used mid wet season images (February-March, a couple of months
after leaf emergence but with relatively cloud-free conditions). I used Landsat Thematic
Mapper (TM) and Enhance Thematic Mapper (TM+) scenes for path 11 and row 60 from
February 1990, April 2000, and February 2009 available from the United States
Geological Service (USGS) at http://glovis.usgs.gov/. Image-to-image geographic
registration was performed on the 2000 and 1990 images using the 2009 image as the
reference. About 50 reference points were used as ground control points to ensure a
Root Mean Squared (RMS) error of less than 15 m (half a pixel) for each registered
image. After completing the registration, each image was radiometrically calibrated to
correct for sensor related, illumination, and atmospheric sources of variance using the
CIPEC method (Green et al. 2005). Due to technical failures of Landsat 7, I performed
a gap-filling in the 2009 image (USGS 2013). This procedure did not substantially
change the original image because only a small portion of the image was affected by
gaps.
To create a land-cover map for 2009 that reflected land-cover transitions relevant
to estimation of changes in tree diversity and aboveground biomass, I performed a land-
cover trajectory analysis of the 1990-2009 period. First, I performed a supervised
23
classification of the 1990, 2000, and 2009 Landsat images using a Gaussian maximum
likelihood classifier. The location of some sampled areas, maps of Socio Bosque
conservation lands, forest fragments mapped by the Ceiba Foundation, and reference
points acquired in the towns of Pedernales and Jama were used as training areas. Each
map was then classified using the following land-cover types: forested areas, which
included forest, secondary forest and forestry plantations; pastures; and, bare soil,
which was mostly in over-grazed pastures. Additional land-cover types added to assist
the classification process included: open water in the ocean, rivers, and shrimp farms;
urban areas with similar reflectance signature to the areas of Jama and Pedernales;
and, cloud for areas where cloud cover prevented differentiation of land-cover classes.
This approach produced land-cover types with excellent separability for each time
period.
To differentiate forest from secondary forest and plantations, a land-cover
trajectory analysis was used to register successive changes in land cover types (Petit et
al. 2001, Southworth et al. 2010) for 1990-2009. This technique determines changes
between two or more time periods for particular land cover types, and provides
quantitative information about their spatial and temporal distributions and landscape
fragmentation (Mertens and Lambin 2000; Petit et al. 2001; Southworth et al. 2004;
2010). Most secondary forests and forestry plantations were <20 years old and it is
unlikely that large areas in 1990 were either secondary vegetation or plantations
because forest clearing for pasture was the dominant land-use activity in years
preceding 1990 (Dodson and Gentry, 1991). Therefore all forested vegetation on the
1990 image was considered forest, while areas classified as pasture in 1990 and then
24
as “forest” in 2000 and 2009 correspond to either secondary forest or forestry
plantations. With three dates and six land-cover types, there were 216 possible change-
trajectory classes, but I condensed all trajectories to eight that were common, physically
possible, and important to understand changes in tree diversity and aboveground
biomass. The analyzed trajectories classes included: forest on all three dates; forest
loss, for areas classified as forest in 1990 that transitioned to non-forested land-cover
types in 2000 and 2009; secondary forest, for areas that were not forested in 1990 that
transitioned to “forest” in 2009; secondary forest losses for some areas that were not
forested in 1990, were forested in 2000, and lost their forest in 2009; pasture, for areas
identified as pasture and bare soil on all three dates; urban, for areas identified as urban
on all three dates; and water, for areas identified as water on all three dates. Transitions
involving the land-cover type “cloud” were assigned to the most likely trajectory class
(i.e., cloud-forest-forest or forest-cloud-forest to the forest class, or cloud-pasture-
pasture to the pasture class). A small number of areas classified as “cloud” on all three
dates were marked as unknown on the final land-cover map. The total area of each
land-cover class for each date was estimated by conversion of pixel data to hectares.
This approach allowed identifying areas that likely correspond to forest, but areas
identified in the final map as secondary forest could correspond to either secondary
forest or forestry plantations.
To conduct accuracy assessment of the 2009 produced map, I used an error
matrix using the location of sampled sites, excluding those used in the classification
analysis. Remote sensing analyses were performed using Erdas Imagine 10.0 (Leica
Geosystems, Norcross, Georgia USA).
25
Implications of Land-Cover Change for Aboveground Biomass and Tree Diversity
The implications of land-cover change for aboveground biomass and tree
diversity were assessed by relating final land-cover classes to averages of aboveground
biomass and tree diversity values. For aboveground biomass, this calculation was
simply based on average values for each land-cover type. For tree diversity the
calculation of change over time is more complicated because a reduction in the extent
of a land-cover type does not translate directly into a known reduction in the number of
species. Moreover, the land-cover analysis did not allow differentiation between
secondary forest and forestry plantations. To circumvent this problem, I used the
estimated rarefied differences in species diversity values for each land-cover type to
assess the impact of land-use transitions. I concentrated this analysis on forest loses
but discuss the implications of newly “forested” areas being secondary forest or forestry
plantations.
Results
Tree Diversity and Aboveground Biomass of Different Land-Cover Types
A total of 123 tree species were recorded in the study area in 8 forest; 13
secondary forest; 10 pasture; and 10 plantation plots, including 14 endemic to Ecuador
and 16 with IUCN conservation status (Table A1). The species of conservation concern
occurred mostly in forest, but secondary forests also contained a few and two were only
found in this vegetation type. Tree species in pasture and all forestry plantations were
native with the exception of Tectona grandis (Table A1).
Tree diversity was highest in forests followed by secondary forests, pastures, and
plantations as indicated by total species richness for all studied land-uses (Table 1-1)
and rarefaction curves for forest, secondary forest, and forestry plantations (Fig 1-2).
26
Densities of trees >10 cm DBH were highest in plantations, followed by forest,
secondary forest, and pastures. However, as plantations mature the number of
individuals is expected to decline (Table 1-1).
Forest supported the highest aboveground biomass followed by secondary forest
and Tectona grandis plantations, which were similar. Schizolobium parahyba
plantations were the fourth highest in biomass, and Ochroma pyramidale the least
among forestry plantations because of their youth and the low wood density of this
species. Pastures supported significantly lower aboveground biomass than any other
studied land-cover type (Fig. 1-3).
Land-Cover Change Trajectories
Between 1990 and 2009 the studied landscape experienced land-cover
transitions of importance to tree diversity and aboveground biomass. Excluding the
ocean and inland water bodies, 75,016 ha of land surface on the 2009 image were
classified into different land-cover types. Pasture was the dominant land-cover type and
accounted for 43% of the study area, but only 29% of the landscape was classified as
pasture on all three-study dates. The remaining 14% of the pasture area was from
recently cleared areas, with 11% corresponding to forest losses from 1990 and 3% from
areas that transitioned from pasture in 1990 to “forest” in 2000 and back to pasture in
2009. Forest occupied 35% of the land surface of the study area, 20% was secondary
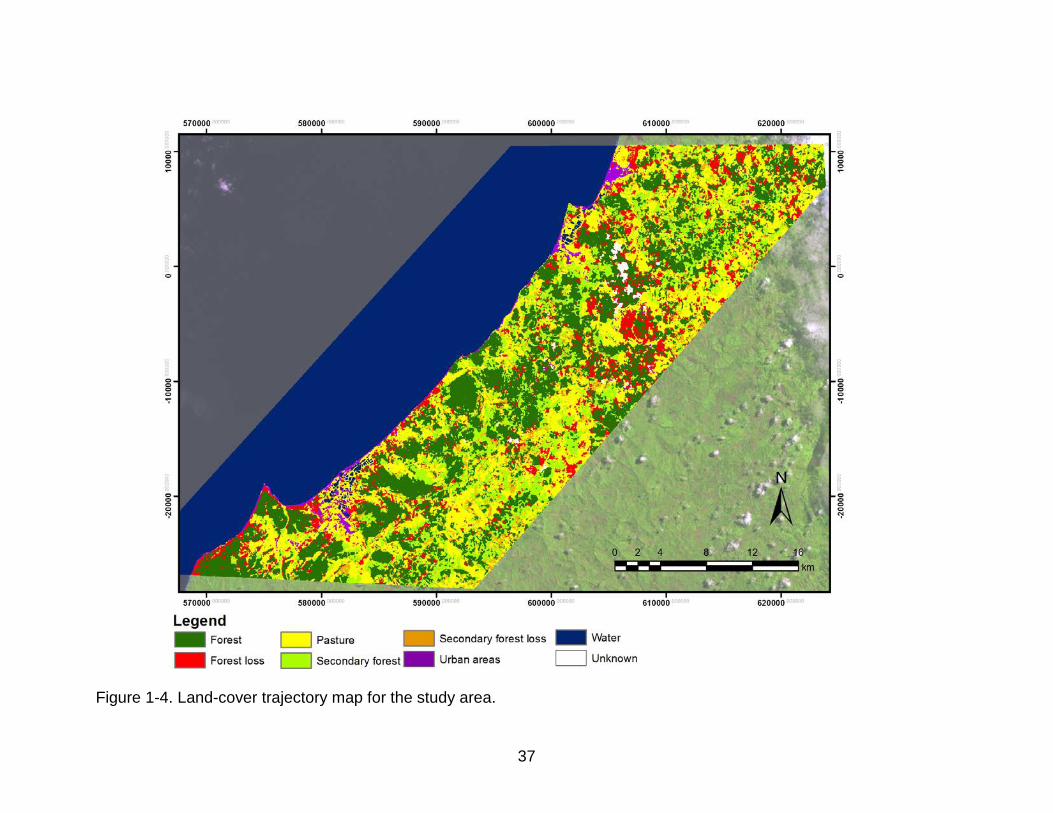
forest or forestry plantation, 2% was urban, and 1% could not be classified (Fig. 1-4).
These results indicate that over the 29-year study period about 34% of the area
transition to a different land-cover type, which highlights the dynamism in this highly
fragmented landscape. The final 2009 Landsat TM map of land-cover had overall
accuracy of 81% (Table 1-2).
27
Implications of Land-Cover Change for Tree Diversity and Aboveground Biomass
The land-cover trajectory analysis reveals negative consequences for tree
diversity. The 12% forest loss corresponds to 8,635 ha of forests that were converted
mostly to pasture, with a small proportion converted to urban areas. This estimate
indicates widespread transitions from the most tree species-rich land-cover type to the
second poorest and a loss of habitat for endemics and IUCN-listed species that are not
found in pastures. Another 20% of the landscape occupied either secondary forest or
forest plantations in 2009. Secondary forests contribute to tree diversity conservation
but do not compensate for forest losses while forestry plantations are the poorest in
species of all land-cover types (Figure 1-2).
In contrast to tree species, aboveground biomass was less affected by land-
cover transitions in the region. Deforestation and secondary forest re-clearing caused
the loss of 2,329,978 Mg of aboveground biomass between 1990 and 2009, assuming a
transition to pasture with average aboveground biomass of 7.4 Mg/ha. This loss is
nearly compensated for by forest re-growth and plantation development. The average
aboveground biomass for Tectona grandis, which is the dominant plantation, and
secondary forest was in both cases 137 Mg/ha (Fig. 1-3), which indicates in average
that transitions from pastures to both of these land-cover types accounted for about
2,078,305 Mg of biomass gains for a net loss of aboveground biomass of just 251,673
Mg (Table 1-3). Detailed estimates of secondary forests aboveground biomass of
different ages and plantation growth rates are necessary to fully understand
aboveground biomass fluxes, but it is even possible that they will fully offset
aboveground biomass looses from deforestation as they mature, at least until the
plantations are harvested and the secondary forests are re-cleared.
28
Discussion
The land-cover trajectory analysis for 1990-2009 indicates high dynamism in
land-cover transitions despite previous fragmentation. This dynamism has contrasting
consequences for tree diversity and aboveground biomass. As expected, tree species
richness declines from forest to secondary forests, pastures, and then plantations. That
one in eight species recorded is listed by the IUCN or endemic to Ecuador indicates the
importance of conservation in the study region. Contrary to estimates of about 5% forest
cover for central and southern coastal Ecuador (Dodson and Gentry, 1991; Sierra,
1999), 35% was identified as forest in the 2009 landscape (Fig. 1-4). This number
highlights the importance of preserving remaining forest patches especially considering
that the study area accounts for the largest remnants of semi-deciduous vegetation in
Ecuador and is considered a hotspot for conservation (Neil 1999; Myers et al. 2000).
Approximately 36% of the landscape (27,000 ha) experienced a change in land-
cover during the1990-2009-study period with deforestation accounting for 12% of this
change. This estimate suggests that while most deforestation in the region occurred
before 1990, it continues despite forest fragmentation. Most of the deforested areas
resulted from forest to pasture transitions, which suggests a trade-off between species
retention by forest conservation and species loss due to changes to more profitable
land-uses, such as pastures or plantations (Nelson et al. 2008; Brooks et al. 2009; Lele
et al. 2010; Raudesepp-Hearne et al. 2010). This trade-off is likely to continue in the
future because forests remain on areas suitable for pasture or plantations, which are
more profitable. Although most of the forests inventoried in this study occurred on steep
slopes, as expected in this highly fragmented landscape, pastures were also found in
steep areas, which indicates the possibility of further transitions in the future.

29
Furthermore, many forest patches south of Jama are on relatively flat topography, in
close proximity to the ocean, and on privately owned land where there are more
profitable land-uses than forest retention (Fig. 1-4). These fragmentation patterns
likewise indicate the importance of individual household decisions in shaping the
landscape and highlight their role in conservation. Given the many challenges for forest
conservation on private property, innovative incentive programs are much needed.
In 2009, 20% of the landscape was covered by secondary forests and forestry
plantations that transitioned from pastures in 1990 to “forest” in 2009. A majority of this
area is likely secondary forests, as indicated by household preference estimates based
on 24 surveys that reported secondary forest accounting for 7% of land-use in the area
and 1% for forestry plantations (Blare and Haro-Carrión 2013). The Blare and Haro-
Carrión (2013) survey analysis included landowners of some inventoried sites and show
that secondary forest likely occurs over a broader range of ownership while forestry
plantations are more restricted to households that own >200 ha. This suggests that
secondary forests can contribute substantially to tree species conservation at the
landscape level. Despite being less diverse than forest, secondary forests still support
substantial numbers of species, including endemics and species with IUCN
conservation status (Table 1-1; Table A-1). The conservation of secondary forest and
encouragement of their development are promising interventions especially where they
are close to patches of mature forest (Chazdon et al. 2009), but will require the active
participation of local people and appropriate incentives.
Aboveground biomass estimates also displayed dynamism over the 1990-2009
period even though the area was greatly deforested prior to the commencement of the
30
observations. In contrast to the substantial losses of biomass experienced on
deforestation frontiers in the humid tropics (Gibbs and Herold 2007; Gibbs et al. 2010;
Macedo et al. 2012), I found that forest re-growth and forestry plantation development
nearly offset the biomass losses from deforestation over the 29-year study period. The
net loss of aboveground biomass from the landscape was quite low, which is a positive
result for regional and global carbon emissions from tropical deforestation.
In contrast to the relatively small net losses in biomass from my study area over
the 29-year observation period, the observed land-cover transitions translated into
substantial losses in tree diversity. This finding highlights the importance of including
biodiversity in carbon- base conservation programs such as REDD+ and supports
concerns about some negative impacts of programs focused solely on carbon (Stickler
et al. 2009; Putz and Redford 2009a). In my study area, the remaining fragments of
mature forest were the richest land-cover type in both tree species and aboveground
biomass. Given the continued losses of these forests during the observation period,
forest conservation remains critical to safeguard both carbon stocks and associated
species diversity, including many endemic and endangered species.
The results of this study are of relevance to Ecuador’s Socio Bosque Program. It
recognizes the importance of Socio Bosque in promoting conservation of native
ecosystems while safeguarding other environmental services including carbon storage
and biodiversity (Baker et al. 2010; de Koning et al. 2011). The average aboveground
biomass of forest in the study region (237 Mg/ha) is at the low end of the range reported
for the humid tropics (227-390 Mg/ha; Brown and Lugo 1992; Houghton et al. 2009).
This difference would translate into lower revenues from carbon storage incentives
31
based on avoided deforestation of this semi-deciduous forest. In contrast, the number of
endemics and species with IUCN conservation status highlight the other values for the
region that Socio Bosque recognizes. The continued pressure on the small area that
remains of semi-deciduous forest in the study region highlights the importance of Socio
Bosque and other conservation efforts. Moreover, given the higher carbon stocks and
biological diversity in secondary forests compared to pastures, efforts are also
warranted to promote their conservation or accelerate succession to more mature
forests. In the absence of conservation incentives that recognize their value, it is
unlikely that much of the secondary forest in the region will be preserved over the long
term (Chazdon et al. 2009). Secondary forest conservation would promote tree diversity
maintenance at the landscape level. Furthermore, because secondary forests provide
many goods and services valued by poor households, their conservation might also
help alleviate poverty (Blare and Haro-Carrión 2013).
Conclusions and Implications for Conservation
This study provides information required for carbon-based conservation
interventions in the form of understanding of the spatial and temporal patterns of forest
carbon stocks (Baker et al. 2010). It also highlights the importance of land-cover
transitions for carbon balance, and clarifies the relationships between tree species
diversity and carbon storage in aboveground biomass. Despite massive earlier
deforestation and fragmentation, the landscape of semi-deciduous forest in the study
region was highly dynamic during 1990-2009. In particular, continued deforestation is of
concern. Forest conversion to other land-cover types has substantial negative
consequences for tree diversity, but only minor consequences for aboveground biomass

32
at the landscape level. These results indicate the importance of including biodiversity
conservation as a required co-benefit of carbon-based conservation programs.
The estimates of tree diversity and aboveground biomass provided in this study
are probably conservative because the impacts of forest degradation (i.e., losses of
carbon from forests that remain forest) are unclear. Forest degradation is expected to
contribute substantially to both tree species loss and carbon emissions (Putz and
Redford 2009b).
The remote-sensing based land-cover trajectory analysis utilized in this study can
inform conservation efforts. The unavailability of clear and cloud-free images prevented
more detailed analyses and the differentiation of secondary forests and plantations. But
even with better imagery, there will still be a need to combine field sampling with
satellite image analysis to inform conservation efforts.

33
Table 1-1. Total tree species richness, number of endemics, number of species with IUCN status, and average density in forest, secondary forest, pasture and forestry plantations for trees >10 cm DBH.
Land-use Species richness
No. Endemic species
No. Species with IUCN
status
Area sampled
(ha)
Average Density (ind/ha)
Forest 99 14 16 3.2 183±49 Secondary forests
68 8 9 5.2 130±57
Pasture 10 0 0 7.47 4±4 Tectona grandis
2 0 0 0.16 969±120
Schizolobium parahyba
1 0 0 0.12 333±14
Ochroma pyramidale
1 0 0 0.12 725±189
Table 1-2 Accuracy assessment of the 2009 trajectory analysis Class Producer’s accuracy (%) User’s accuracy (%) Forest 100 74 Pasture 80 72 Secondary forest 58 81 Urban 100 100 Overall accuracy 81 Table 1-3 Consequences of land-cover change for aboveground biomass for the 1990-
2009 study period for the 75,016 ha of land surface of the study area in coastal Ecuador.
Land-cover type Condensed trajectories (1990-2000-2009)
Total area (ha)
Total aboveground biomass (Mg)
Forest Forest—forest—forest 26,585 6,303,534 Pasture Pasture—pasture—pasture 22,049 162,414 Secondary forest Pasture—forest—forest 15,091 +2,078,305 Forest loss Forest—pasture—pasture
Forest—forest—pasture 8,635 -1,983,825
Secondary forest loss Pasture—forest—pasture 2,656 -346,153 Net aboveground biomass change
-251,673

34
Figure 1-1. Study location in coastal Ecuador. Colored area corresponds to the cropped
Landsat images used to monitor land-cover transitions.
35
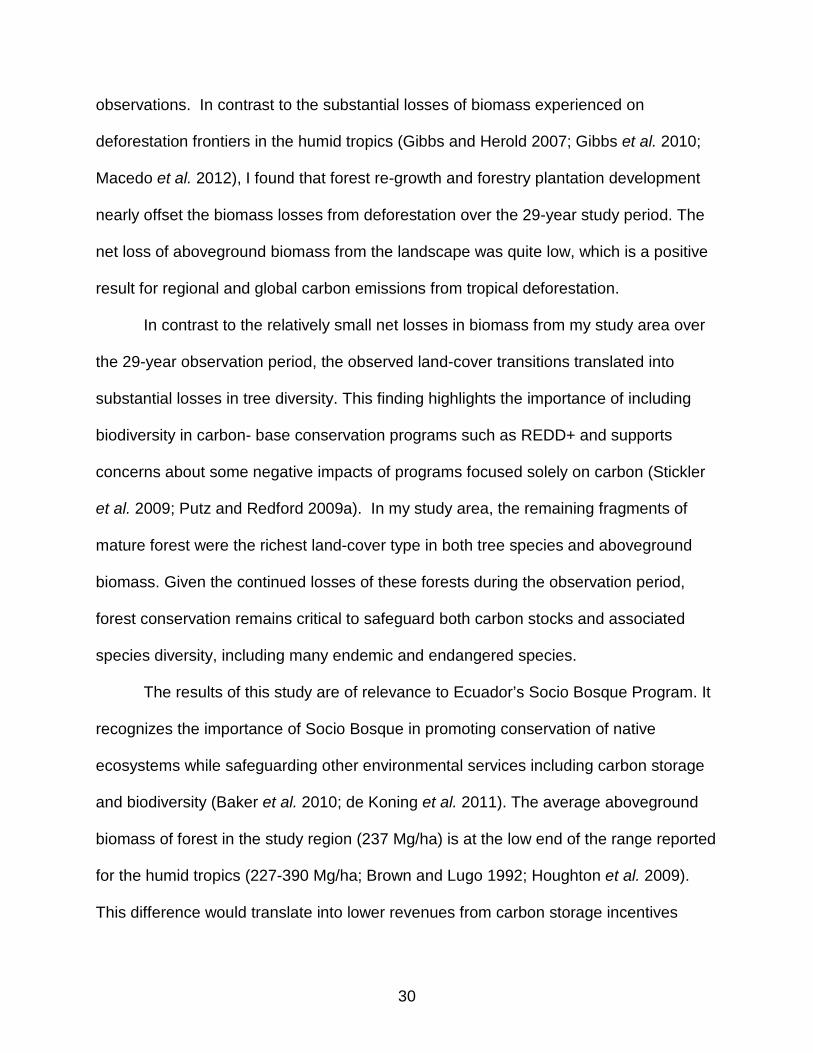
Figure 1-2. Individual based species rarefaction curves for trees >10 cm DBH. Land-
uses analyzed include forest (N=8); secondary forest (N=13); and, forestry plantations grouped together because of similar tree diversity patterns (Tectona grandis N=4; Schizolobium parahyba N=3, Ochroma pyramidale N=3). Pastures were excluded because low number of individuals did not allow rarefaction analysis. Dashed lines indicate 95% CI.

36
Figure 1-3. Average aboveground biomass for forest (N=80), secondary forest (N=13),
pasture (N=10), and plantations of Tectona grandis (N=4), Schizolobium parahyba (N=3), and Ochroma pyramidale (N=3).
37
Figure 1-4. Land-cover trajectory map for the study area.
38
CHAPTER 2 IMPLEMENTATION OF THE SOCIO BOSQUE PROGRAM BY CONSERVATION
INTERNATIONAL-ECUADOR WITH EMPHASIS ON THE NORTHWESTERN REGION
Summary
Conservation International (CI), a non-governmental environmental organization,
collaborates with Ecuador’s Ministry of Environment (MAE) to provide technical and
financial support to other organizations that implement the Socio-Bosque Program
(PSB), which financially compensates landowners for the preservation of native
ecosystems. This study evaluates the work of the institutions that work with CI (CI-
partners), the performance of the MAE and CI in implementation of PSB, and two PSB
current beneficiaries case studies in northwestern Ecuador: communities in Esmeraldas
and individual households in Manabí and Carchi.
To evaluate the work of CI-partners, I compared the land parcels proposed for
inclusion in the PSB by CI-partners vs. those already in the PSB. I found that of the
parcels proposed by CI-partners, 4-62% were accepted by the PSB, a small number
were either rejected or still under MAE revision, and the remaining were absent from the
records of the MAE. This result indicates the need of a better tracking system to follow
the status of proposed areas for inclusion in the PSB. To assess the importance of the
PSB for CI-partners, and to evaluate the performances of the MAE in Quito, MAE
provincial representatives, and CI in the implementation of the PSB, I surveyed
representatives of CI-partners. Respondents indicated that the PSB is important to
achievement of their institutions’ conservation goals, but reported that some of the
criteria utilized by the PSB are unclear. They also complained that the MAE in Quito is
slow to process PSB applications and provides insufficient updates about the status of
39
areas proposed for inclusion in the program. In contrast, their impressions of the MAE in
the provinces and of CI were generally positive.
In the two study cases, participating beneficiaries identified conservation
interests as the main incentive to join the program and did not find any PSB
requirements difficult to fulfill. In contrast, CI-partners cited land tittles as a difficult
hurdle for interested property owners showing the value of their assistance.
Representatives of communities participating in the PSB suggested that economic
incentives should increase, identified internal community differences as keeping other
communities from applying to the PSB, and emphasized five co-benefits of participation
in the PSB. These co-benefits were increased security of land tenure, increased
conservation awareness, increased interest in learning about conservation, increased
community collaboration, and an improved reputation of the MAE. In contrast, individual
landowners participants in the PSB suggested that information dissemination by the
PSB should improve, cited low credibility of PSB as a factor preventing more land-
owners from applying, and emphasized one co-benefit of the PSB: increased
conservation awareness. This contrast highlights the fundamental differences between
the two sorts of PSB cases evaluated. Finally, both communities and individuals that
participated in the PSB indicated they would likely maintain their forests, at least over
the short term, even without the economical compensations of the program, but
suggested they would most likely allow some selective logging. They also suggested
illegal logging is the biggest threat to forests in their areas.
Introduction
The Socio Bosque Program (PSB; “Forest Partner Program”) is an initiative of
the Ministry of the Environment (MAE) of the national government of Ecuador to

40
preserve native ecosystems. The government provides monetary compensation to
individuals or communities who conserve legally owned native forests, páramos (i.e.,
high elevation non-forested natural vegetation), and other vegetation types (MAE
2010a). PSB’s objectives extend beyond the preservation of ecosystems to include
reduction of greenhouse gas emissions produced by deforestation and forest
degradation as well as the alleviation of poverty in rural areas, especially those that are
ecologically sensitive (MAE 2008a). The program aims to preserve 4 million ha and,
since its inception in 2008 until May 2010, it already covered 1,058,929 ha with 1,780-
signed agreements (MAE 2012).
PSB was created to accomplish a mandate of the new 2008 Ecuadorian
constitution called “Mandato del Buen Vivir” (Mandate for the Good Living). This
mandate includes biodiversity conservation, maintenance of environmental services,
and reduced deforestation (MAE 2010b). The MAE manages the program and the
financial incentives offered to its beneficiaries come entirely from the central
government, although the international community has shown interest in contributing
(MAE 2010b; Podvin pers. comm. 2010).
Under PSB the government invites for individuals or communities that are
landowners to apply to the program by submission of applications that are evaluated by
the MAE. The applications include copies of land titles, maps of the areas proposed for
inclusion in the program, investment plans describing how funds will be used, and bank
account information. To estimate the importance of the areas proposed for inclusion in
the PSB, the MAE uses a national map of priority areas that reflects: level of threat, as
indicated by accessibility; generation of environmental services especially biodiversity,

41
hydrologic regulation, and carbon storage; and, poverty, as estimated with the social
indicators of the “Sistema Integrado de Indicadores Sociales del Ecuador” (Ecuadorian
Integrated System of Social Indicators). These three criteria are combined to generate a
map that indicates areas of high, medium, and low priority for the program (MAE
2008b). Applicants must agree to conserve the proposed parcels for 20 years if they are
accepted into the program. Logging is prohibited on PSB parcels and hunting can only
be for subsistence purposes; in the case of páramos, only limited cattle grazing is
allowed. PSB allows ecotourism and other activities with limited environmental impacts.
Once accepted into the program, payments are made directly to participants and
compliance with PSB rules is monitored with random field surveys and remote sensing
(MAE 2010b).
The MAE is aware that ambiguities and limited access to information about the
PSB, especially about the application procedures, keep many potential landowners from
participating. Some people do not know about the program or do not have time,
knowledge, capacity, or tools to complete the required paper work. These limitations are
particularly pronounced in rural areas that are of high priority to the program. To
mitigate these deficiencies, the MAE collaborates with other institutions to promote
awareness of the PSB and to aid in the application process (MAE 2010). These
institutions are mostly NGOs and social organizations dedicated to conservation or
social welfare. No financial help from the MAE is provided to these institutions, despite
their shared goals. Conservation International-Ecuador (CI) is the largest of these
organizations and its collaboration with the MAE dates back to the beginning of the
PSB. In fact, CI’s previous experience with Chachi communities in northwestern
42
Ecuador was used in the design of the program. CI offers its technical and financial
support to promote the program, zone parcels, and write investment plans (CI 2010). To
perform these activities, CI collaborates with other NGOs and social organizations
(hereafter referred to as CI-partners) that work closely with local people and concentrate
their activities in areas of interest to CI. The collaboration of CI with CI-partners includes
financial support for PSB promotion processes and aid in preparing PSB applications.
Among the organizations that work with CI under this framework, in May 2010 six
provided enough data to be evaluated in this study. These institutions are:
• Ceiba Foundation.
• Fundación para el Desarrollo de Alternativas Comunitarias de Conservación del Trópico (ALTROPICO).
• Unión Noroccidental de Organizaciones Campesinas y Poblaciones de Pichincha (UNOCYPP).
• Federación de Centros Chachis de Esmeraldas (FECCHE).
• Instituto de Investigaciones Marinas Nazca.
• Fundación Cordillera Tropical.
A variety of ecosystems and social groups are involved in the PSB where these
organizations work. For instance, the Province of Esmeraldas on the northern coast of
Ecuador is dominated by lowland tropical rain forest. South of Esmeraldas in Manabí
Province, semi-deciduous forests dominate the landscape. The Andean slopes, include
montane forests and high elevation páramos (Neill 1999). Among the social groups
involved, Afroecuadorian and Chachi communities dominate in Esmeraldas, individual
mestizo (mixes of Amerindians with Spanish) landowners dominate in Manabí, and
communities of different indigenous nationalities and mestizo individual landowners
characterize the Andes (Abya-Yala 2010; ALTROPICO 2010; Fundación Ceiba 2010).

43
While the above-mentioned characteristics produce high variation among
beneficiaries, the work of all CI-partners shares some important common
characteristics. CI has worked with the MAE for the longest; its experience in financial
compensation for conservation with Chachi communities in Esmeraldas predates the
PSB. Moreover, CI concentrates its efforts in areas critical for the program. A
preliminary analysis, with data updated to May 2010, revealed that CI’s efforts to help
property owners to join PSB included 74% of the total in areas of high priority for the
program, 22% in areas of intermediate priority, and 4% in areas of low priority. In
contrast, nationally 36% of the total area preserved by PSB is classified as high priority,
45% as intermediate priority, 14% as low priority, and an additional 5% is inside national
parks. In other words, CI successfully rose to the challenge of working in areas of high
priority where conservation is often more difficult. This research aims to evaluate the
framework of CI and CI-partners in the implementation of the PSB, to understand the
function of the PSB specifically in regards to CI, but also more generally, and to assess
the experiences of communitarian and individual beneficiaries.
Materials and Methods
Evaluation of CI-Partners
I evaluated the performance of CI-partners by comparing the number of parcels
and total area proposed for inclusion in the PSB for each CI-partner with those present
in the MAE. CI-partners reported to CI the parcels and areas proposed for inclusion in
the PSB. After evaluation by the MAE, each parcel should be classified in the PSB
database as accepted, rejected, or still under-evaluation. Using the names of the
beneficiaries, I compared number of parcels and land areas reported by CI-partners
with those in the PSB database. Partially complete names were considered the same

44
person as long as one name and one family name1 matched in both the CI-partners’
reports and the PSB database. In addition to the categories indicated above, I
established a “not-found” category for those parcels absent in the MAE but reported by
CI-partners.
Evaluation of the CI-PSB Framework and the PSB
I conducted a survey to evaluate the organizations in the CI-PSB framework,
understand CI-partners perceptions of the program, and assess the experience of PSB
beneficiaries. Two surveys were prepared, one for representatives of CI-partners to
evaluate the performance of the institutions of the CI-PSB framework and the PSB, and
another for PSB participating land owners to evaluate their experience with the
program. The evaluated institutions in the CI-PSB framework included: the MAE in
Quito (MAE-National), where PSB applications are analyzed and decisions about
acceptance made; MAE provincial representatives (MAE-Provinces) that assist the
MAE-National by receiving applications, helping beneficiaries, and reporting problems
like illegal logging; and CI, which finances the work of CI-partners. The two selected
case studies were communities in Esmeraldas and individual landowners in Manabí,
with some additional surveys conducted to individual households in Carchi.
Survey Instrument Design
Surveys were constructed on the basis of regular conversations with CI staff that
worked with CI-partners and with the PSB. Once the questionnaires were developed,
they were revised on the basis of comments from CI staff and then again after a pre-
test. The surveys included 17 questions with an additional section of basic information
1 In Ecuador family names are typically composed of the paternal last name followed by the maternal last name.
45
about the respondents. Most of the questions were multiple-choice with 6 choices
including one that allowed respondents to describe another alternative. Respondents
were asked to select the best option, but had the opportunity to select up to three
answers if desired and rank them. Some open-ended questions to collect general
information about the PSB were also part of both surveys. The questions can be
separated into three categories:
1) Evaluation of the institutional part of the CI-PSB framework with Likert scale questions to assess the performance of each institution in the CI-PSB framework. These questions were exclusive to CI-partner surveys.
2) Evaluation of the PSB with questions designed to assess incentives for people to join, issues that require improvement, and co-benefits of the PSB. These questions were addressed to both CI-partners and PSB beneficiaries.
3) Assessment of potential land-use changes in the absence of the PSB and the financial importance of the PSB. These questions were exclusive to the PSB beneficiaries’ surveys.
Participant Selection
Surveys were administered to as many people as possible working in CI-partner
institutions on PSB implementation. Respondents included mostly field technicians and
NGO administrators. Some surveys where administered when respondents visited CI in
Quito, others at institutions in Quito, and, in three cases, online surveys were used for
people that were in other cities or outside the country.
Community representatives and individual beneficiaries were surveyed in the
field during workshops organized by ALTROPICO in San Lorenzo, Esmeraldas; in two
cases I interviewed community delegates in Quito. In communities with joint ownership
of land, discussions among community members were needed before they decided to
join the PSB, and then community representatives were selected. I surveyed as many
representatives as possible from different communities in Esmeraldas, including both
46
Chachis and Afroecuadorians. To survey individual beneficiaries in Manabí, I contacted
and visited as many landowners as possible on their properties mostly in proximity to
the towns of Jama and Tabuga, Manabí. A small number of individual landowners were
also interviewed in during an ALTROPICO workshop in Carchi.
Results
Evaluation of CI-Partner Institutions
The performance of CI-partners, as indicated by the number of parcels and total
area each institution proposed for inclusion in the PSB compared to those already in the
PSB database, varied substantially. Two CI-partners had most of their proposed parcels
in the PSB database, while in the remaining institutions this number was lower (Table 2-
1a). However, all institutions had proposed areas that were not found in the PSB
database and whose status was unknown. In terms of the total areas proposed by
different CI-Partners, two had >80% of their total number of ha already accepted in the
PSB, while in the remaining institutions this number was about 15% (Table 2-1b). The
organizations with most number of parcels and areas already accepted in the program
were those working with communities, and typically had a lower number of parcels in
total, but of extensive areas (i.e. Organization 1). In contrast, organizations working with
mainly individual households had a high number of parcels, but of smaller areas (i.e.
Organization 6; Table 2-1a and b).
Evaluation of the CI-PSB Framework
I surveyed a total of 14 representatives of CI-partners, with at least two people
per institution. These respondents evaluated the performance of MAE-National, MAE-
Provinces, and CI in PSB implementation. Given that some CI-Partners employ three or
fewer people working on the PSB, this sample size seems reasonable. All respondents
47
identified the PSB as a contributor to their institutions’ goals. However, many
respondents reported that some of the criteria of PSB are unclear (Table 2-2).
The institutions involved in the CI-PSB framework differed in their performance,
as indicated by CI-partner representatives. MAE-National was evaluated harshly while
MAE-Provinces and CI generally received positive evaluations. The most frequently
criticized aspect of MAE-National was long bureaucratic processing times, although
slow communication among stakeholders received some criticism for both MAE-
National and MAE-Provinces. CI received very high evaluations, but this finding could
result partially from respondents being aware this study was conducted for CI and in
some cases at CI facilities (Table 2-2).
Evaluation of the PSB
A total of 42 respondents evaluated the PSB, 14 CI-partner representatives and
28 PSB beneficiaries (12 community representatives and 16 individual beneficiaries). In
general, concern about conservation was the most important motive for people to join
the PSB. Other sources of motivation mentioned included financial benefits and help
with securing land tenure. Many respondents reported that the financial incentive
represented important recognition from the government of their conservation initiatives.
Community representatives suggested that the incentive should be increased to
improve the PSB. In contrast, individual beneficiaries considered information
dissemination to be the main aspect of the program in need of improvement (Table 2-3).
All respondents indicated they knew people who were not interested in the PSB
for a variety of reasons. CI-partners and individual beneficiaries reported low credibility
of the PSB as the principal reason for their lack of interest, while community delegates
were not specific about the reasons. When asked to explain their answers,

48
disagreements about involvement within communities was reportedly the most
important obstacle to applying to the PSB (Table 2-3).
Both beneficiaries and CI-partners representatives identified numerous co-
benefits of the PSB. From the eight co-benefits identified, individual beneficiaries most
often noted that awareness about environmental conservation increased as a result of
the PSB. CI-representatives also noted environmental awareness as a co-benefit
together with increased interest in conservation among local people. Community
representatives identified six co-benefits including environmental awareness, interest in
conservation, improved image of the MAE, and security improvements resulting from
the program’s help resolving land boundary disputes (Table 2-4).
Both community representatives and individual beneficiaries indicated they would
likely have preserved their land even in the absence of the PSB. However, several
respondents noted that in the absence of the PSB, they would allow selective logging.
Finally, most respondents reported that illegal logging was the main threat to their PSB
areas and that they needed assistance to safeguard their forests (Table 2-5).
Discussion
Ecuador’s PSB contributes to biodiversity conservation and is an attractive
program for individuals and communities interested in maintaining their forests. By
working with PSB, CI helps clarify ambiguities, improve access to information about the
PSB particularly in areas of high conservation priority. The fact that many land areas
proposed by CI-Partners were not found in MAE databases indicates that a better way
to track submissions is needed. Furthermore, many of the surveyed CI partner
representatives indicated that some of PSB criteria are not clear, indicating that better
diffusion of information to people in charge of the PSB implementation could benefit the
49
program. In fact, some CI-representatives indicated that some of PSB criteria,
particularly land ownership requirements, kept many submitted areas from being
processed, which helps explain the high number of proposed land parcels not found in
the PSB databases.
CI-PSB stakeholders suggested that improved communication would improve
PSB implementation. Many of the surveyed CI-partner representatives indicated that it
would be easier to explain long delays in the processing of application submitted to the
MAE if they were kept apprised of their status. Nonetheless, even with improved
communication, the time taken to evaluate applications should be addressed in the
MAE.
PSB experience differs between individual beneficiaries and communities. While
respondents from both agreed that conservation was the main reason to join the
program, they emphasized different deficiencies in the PSB. Individual beneficiaries
indicated that dissemination of information about the program is the main aspect that
PSB should improve, probably because reaching individual landowners is especially
difficult. This suggestion was frequent among respondents from Manabí, many of who
do not reside in the area and therefore are not in close communication with neighboring
landowners. In addition, individual beneficiaries stated that low credibility in the program
may dissuade others from applying, which reinforces the importance of better
dissemination of information so as to increase understanding of PSB’s objectives and
requirements. In contrast, although communities are more isolated than are individual
landowners and have limited access to information disseminated by the media, they
probably interact more, which facilitates communication about PSB once the program is
50
introduce to them. Community representatives emphasized that PSB’s economic
incentives should be increased even if current incentives are reportedly only of medium
importance to their economic well-being. Moreover, PSB areas in Esmeraldas tend to
be large and other land-uses, particularly oil palm plantations and logging, are
comparatively profitable (Holopainen and Wit 2008). In Manabí, logging and cattle
ranching are also profitable, but the region is already highly fragmented, many
landowners have other sources of revenue, and the small remaining forest patches can
be dedicated to conservation without large impacts on their incomes. Still, it was
surprising to find that both communities and individual beneficiaries would likely
preserve their land in absence of the PSB, although in many cases with selective
logging and consequent forest degradation. Finally, community representatives
identified more co-benefits than individual landowners, which reinforces the importance
of the program for communities and suggests that additional mechanism to engage
individual landowners are necessary.
Conclusions
PSB implementation under the CI-PSB framework would benefit from improved
communication among stakeholders and from development of tools to track the status
of proposals submitted to the MAE. Based on the two case studies, communities
perceive more benefits from PSB than individual landowners, so additional incentives
may be necessary to engage more of the latter. Finally, it was widely agreed that long-
term success of the PSB often requires assistance to landowners in the protection of
their forests.
51
Table 2-1 Evaluation of the performance of CI-partner institutions. Numbers indicate status of parcels proposed for inclusion in the PSB by CI-partners in the PSB database (a) number of parcel areas (b) area of parcels. “Unknown” refers to applications not found in the PSB database, and % indicates the percent parcels accepted by PSB for each CI-Partner institution. For privacy reasons the name of each CI-partner is omitted.
(a) CI-PARTNER
Number of parcels % Unknown Rejected In revision Accepted TOTAL
Organization1 3 - - 5 8 63 Organization2 32 2 4 16 54 30 Organization3 25 - - 10 35 29 Organization4 7 - - 9 16 56 Organization5 4 11 2 10 27 37 Organization6 26 - - 1 27 4 TOTAL 93 13 6 51 163
(b) CI-PARTNER
Number of ha % Unknown Rejected In
revision Accepted TOTAL
Organization1 391 - - 13785 16192 85 Organization2 8928 48 327 1598 11237 14 Organization3 2868 - - 519 3611 14 Organization4 5842 - - 21800 27159 80 Organization5 - 295 30 190 1567 12 Organization6 2999 - - 100 3139 3 TOTAL 21028 343 357 37992 62905

52
Table 2-2 Evaluation of the PSB and institutions in the CI-PSB framework by CI-partners. Numbers indicate total number of respondents; responses of NA (Not Applicable) are excluded so totals vary among statements.
Totally
Agree Agree Partially
agree Disagree Totally
disagree PSB
The criteria to join the PSB are clear.
III
IIII
IIIII
II
The criteria to join the PSB are fair and coherent with the program objectives.
III IIII IIIIII I
The PSB is a significant conservation aid in the geographic area I work.
IIIIIIIII IIII I
MAE-National There is efficient communication with other stakeholders.
IIIIIII II IIII
Bureaucratic processes are performed in a timely manner.
II IIIIIII II II
It is fast in responding to inquiries and addressing problems.
I IIIIII I IIII II
MAE-Provinces There is an efficient communication with the other stakeholders.
IIII IIIII IIII
It is fast in responding to inquiries and addressing problems.
IIIIII IIIIII I
It is efficient addressing local problems like land appropriation or selective logging denounces.
I IIII IIII I I
CI There is an efficient communication with other stakeholders.
IIIIIIIII IIII
It is efficient in complying with terms and dates established in cooperative agreements.
IIIIIIIIIII III
It is fast in responding to inquiries and problems.
IIIIIIIIIIII I I

53
Table 2-3 Evaluation of the PSB. Percentage of affirmative responses. Options CI-
Partners Communities Individuals
Main reason to join the PSB.
1) Economical incentive. 2) Conservation. 3) Secure land tenure.
37 37 26
17 58 25
15 86 -
Most difficult requirement to apply to the PSB.
1) Title. 2) Zoning. 3) Investment plan. 4) Having a bank account. 5) Other.
64 21 - 7 7
- 42 8 42 17
24 40 - - 37
Aspects the PSB should improve.
1) Implementation time. 2) Clarity on how the program works. 3) Technical assistance. 4) Economic incentive. 5) Advertising the program.
43 29 43 43 29
25 42 17 67 -
44 20 13 28 61
Reasons why there is people not interested in the PSB.
1) Contract time. 2) Mistrust in the PSB. 3) There is negative information about the PSB. 4) Other.
8 50 25 17
- 33 - 67
- 74 17 10
54
Table 2-4 Percent of respondents that noted a particular PSB co-benefit. Co-benefits of the PSB CI-
Partners Communities Individuals
Other organizations have been interested in conservation in the area.
36 50 0
Security has improved in the area.
29
58
44
Projects like investment funds, protection of forest areas or public spaces have been developed partially or totally with fund of the PSB.
43
42
7
Awareness about conservation and environmental issues has increased.
79
67
58
Ecotourism has been initiated or has increased.
21
8
13
Local people are more interested in learning about conservation, study careers in the area or develop environmental projects.
50
75
20
There is more collaboration among people, particularly those in the PSB.
43
83
21
The MAE has gained a positive concept among people.
36
91
55

55
Table 2-5 Reported values of the PSB (percent of affirmative responses)
Options Communities Individuals
How important is the incentive of the PSB in your economy?
1) High importance 2) Medium importance. 3) Low importance.
25 58 17
37 22 39
Without PSB, I would be able to preserve my land for:
1) Less than a year. 2) About five years. 3) More than five years.
8 25 67
1 15 79
Without PSB, the likely land-use of my land would be:
1) Selective logging. 2) Low-intensity agriculture. 3) Intensive monocultures. 4) Pasture for cattle. 5) Conservation with another funding source. 6) Conservation without any aid.
25 8 8 8 0 50
18 0 0 0 7 75
The main problem I need assistance with is:
1) Report PSB investments to the MAE. 2) Control of illegal logging. 3) Control cattle entering my property. 4) Control land appropriations. 5) None.
25 58 0 8 17
0 55 6 0 40

56
APPENDIX TREE SPECIES AMONG MAJOR LAND LAND-COVER TYPES
57
Table A 1. Species density, status in Ecuador accompanied by IUCN conservation status if available, and wood densities for tree species in forest (F; N=8), secondary forest (SF; N=13), pastures (Pa; N=10), and forestry plantations (Pl; N=10). Taxonomy based on Tropicos.org

58
Table A-1. Continued

59
Table A-1. Continued

60
Table A-1. Continued
61
Table A-1. Continued
62
LIST OF REFERENCES
Abya-Yala. (2010). Pueblos del Ecuador / Peoples of Ecuador. Retrieved from: <http://abyayala.nativeweb.org/ecuador/pueblos.php>
Angelsen, A. with M. Brockhaus, M. Kanninen, E. Sillis, W.D. Sunderlin, and S. Wertz-Kanounnikoff (Eds.) (2009). Realising REDD+: National strategy and policy options. CIFOR, Bogor, Indonesia. 361pp.
Asner, G. P., Rudel, T. K., Aide, T. M., Defries, R., and Emerson, R. (2009). A contemporary assessment of change in humid tropical forests. Conservation Biology, 23, 1386-95.
Baker, T. R., Jones, J. P. G., Rendón Thompson, O. R., Cuesta, R. M. R., Del Castillo, D., Aguilar, I. C., Torres, J., et al. (2010). How can ecologists help realise the potential of payments for carbon in tropical forest countries? Journal of Applied Ecology, 47, 1159-1165.
Blare, T., and Haro-Carrion, X. (2013). Turning Carbon into Cash: Economic Model of payments for carbon sequestration in the dry tropical forest of coastal Ecuador. In Annual Meeting, February 2-5, 2013, Orlando, Florida (No. 143088). Southern Agricultural Economics Association.
Brooks, T. M., Wright, S. J., and Sheil, D. (2009). Evaluating the success of conservation actions in safeguarding tropical forest biodiversity. Conservation Biology, 23, 1448-57.
Brown, S., and Lugo, A. E. (1992). Aboveground biomass estimates for tropical moist forests of the Brazilian Amazon. Interciencia. Caracas, 17, 8-18.
Chave, J., Andalo, C., Brown, S., Cairns, M. a, Chambers, J. Q., Eamus, D., et al. (2005). Tree allometry and improved estimation of carbon stocks and balance in tropical forests. Oecologia, 145, 87-99.
Chazdon, R. L., Peres, C. A., Dent, D., Sheil, D., Lugo, A. E., Lamb, D., Stork, N. E., et al. (2009). The potential for species conservation in tropical secondary forests. Conservation Biology, 23, 1406–1417.
Chiu, M. (2009). Ecuador: taking firm steps toward REED. In: Page, R. (2009). Newsletter 49 (January 2009). Construction Law Handbook, 2009 (Newsletter 50), pp. 4-5.
CLIRSEN (Centro de levantamientos integrados de recursos naturales por sensores remotos) (2000) CLIRSEN data reported on <www.clirsen.gob.ec>
Colwell, R.K. (2004). EstimateS: Statistical estimation of species richness and shared species from samples. User’s guide and application. Version 8.2. University of Connecticut, Storrs, Connecticut.

63
Conservación Internacional Ecuador. 2010. Taller Socio Bosque – Mayo 2010. Documentos CI.
Conservación Internacional Ecuador. 2010. Apoyo al Programa Socio Bosque. Retrieved from: <http://www.conservation.org.ec/>
Costanza, R. D′Arge, R., De Groot, R., et al. (1997). The value of the worldʼs ecosystem services and natural capital. Nature, 387, 253–260.
Cordero, D. (2008). PES in Ecuador: experiences and lessons. In: Holopainen, J., Wit, M., Holopainen, J., and Wit, M. (eds). Financing Sustainable Forest Management, pp.. 101-106. Tropenbos International, Wageningen, The Netherlands.
Cuesta-Camacho, F., Peralvo, M.F., Gansenmüller., et al. (2006). Identificación de vacíos y prioridades de conservación para la biodiversidad en el Ecuador continental. EcoCiencia, The Nature Conservancy, Conservation International, Ministerio del Ambiente del Ecuador. Quito, Ecuador.
Davison, J., Freund, P., and Smith, A. (2001). Putting carbon back into the ground. IEA Greenhouse Gas RandD Programme, 28.
de Koning, F., Aguiñaga, M., Bravo, M., Chiu, M., Lascano, M., Lozada, T., and Suarez, L. (2011). Bridging the gap between forest conservation and poverty alleviation: the Ecuadorian Socio Bosque program. Environmental Science and Policy, 14, 531–542.
Dodson, C. H., and Gentry, A.H. (1991) Biological extinction in western Ecuador. Annals of the Missouri Botanical Garden, 78, 273-295.
FAO (Food and Agriculture Organization of the United Nations) (2005). Global forest resources assessment 2005: progress towards sustainable forest management. FAO Forestry paper 147.
Ferraro, P. J. (2000). Global habitat protection: limitations of development interventions and a role for conservation performance payments. Conservation Biology, 15, 990-1000.
Fisher, B., Edwards, D. P., Giam, X., and Wilcove, D. S. (2011). The high costs of conserving Southeast Asia's lowland rainforests. Frontiers in Ecology and the Environment, 9, 329–334.
Foley, J. a, Defries, R., Asner, G. P., Barford, C., Bonan, G., Carpenter, S. R., et al. (2005). Global consequences of land use. Science, 309, 570-574.
Freitas, S. R., Hawbaker, T. J., & Metzger, J. P. (2010). Effects of roads, topography, and land use on forest cover dynamics in the Brazilian Atlantic Forest. Forest Ecology and Management, 259, 410–417.

64
Fundación Ceiba. (2010). Implementación del Programa Socio Bosque para la conservación de los bosques del cantón Jama, provincia Manabí. Informe técnico presentado Julio 2010.
Fundación Cordillera Tropical. (2010). Apoyo a los beneficiarios a acceder al programa Socio Bosque en el nudo del Azuay, zona sur del Parque Nacional Sangay, Ecuador. Informe técnico presentado Enero – 2010.
Fundación para el Desarrollo de Alternativas Comunitarias del Trópico (ALTROPICO). (2010). Consolidación de áreas de conservación en la zona norte del Ecuador (Esmeraldas, cantón San Lorenzo y Carchi, cantón Tulcán). Informe técnico presentado Junio – 2010.
Gibbs, H. K., and Herold, M. (2007). Tropical deforestation and greenhouse gas emissions. Environmental Research Letters, 2, 045021.
Gibbs, H., Ruesch, A., Achard, F., Clayton, M., Holmgren, P., Ramankutty, N., and Foley, J. (2010). Tropical forests were the primary sources of new agricultural land in the 1980s and 1990s. Proceedings of the National Academy of Sciences, 107, 16732–16737.
Gotelli, N. J., and Colwell, R. K. (2001). Quantifying biodiversity: procedures and pitfalls in the measurement and comparison of species richness. Ecology Letters, 4, 379–391.
Green, G.M., Schweik, C.M, and Randolph J.C. (2005). Retrieving landcover change information from Landsat satellite images by minimizing other sources of reflectance variability. In: Moran, E.F., and E. Ostrom (Eds.). Seeing the forest and the trees: human-environment interactions in forest ecosystems, pp. 131-160. MIT Press, Cambridge, Mass.
Harvey, C.A., Zerbock O., Papageorgiou S. and Parra A. 2010. What is needed to make REDD+ work on the ground? Lessons learned from pilot forest carbon initiatives. Conservation International, Arlington, Virginia, USA. 132 pp.
Holopainen, J. and M. Wit (eds). (2008). Financing sustainable forest management. Tropenbos International, Wagegingen, The Netherlands. Xvi + 176 pp.
Houghton, R. A., Hall, F., and Goetz, S. J. (2009). Importance of biomass in the global carbon cycle. Journal of Geophysical Research, 114, 1-13.
Instituto de investigaciones marina Nazca. (2010). Apoyo a la aplicación del programa Socio Bosque en la península Galera – San Francisco. Informe final.
Koellner, T., Sell, J., Gahwiler, M., and Scholz, R. (2008). Assessment of the management of organizations supplying ecosystem services from tropical forests. Global Environmental Change, 18, 746-757.

65
Koellner, T., Sell, J., and Navarro, G. (2010). Why and how much are firms willing to invest in ecosystem services from tropical forests? A comparison of international and Costa Rican firms. Ecological Economics, 69, 2127-2139.
Lele, S., Wilshusen, P., Brockington, D., Seidler, R., and Bawa, K. (2010). Beyond exclusion: alternative approaches to biodiversity conservation in the developing tropics. Current Opinion in Environmental Sustainability, 2, 94-100.
MA (Millennium Ecosystem Assessment) (2005a). Ecosystems and human well-being: biodiversity synthesis. Washington, DC: Island Press. Retrieved July 17, 2011
MA (Millennium Ecosystem Assessment) (2005b). Ecosystems and human well-being: health synthesis. Washington, DC: Island Press. Retrieved July 10, 2011
Macedo, M. N., DeFries, R. S., Morton, D. C., Stickler, C. M., Galford, G. L., and Shimabukuro, Y. E. (2012). Decoupling of deforestation and soy production in the southern Amazon during the late 2000s. Proceedings of the National Academy of Sciences, 1-6.
MAE (Ministerio del Ambiente del Ecuador) (2008a). Acuerdo ministerial No. 169: Creación del proyecto Socio Bosque. Documentos de libre acceso del Programa Socio Bosque (PSB). Retrieved from: <http://www.ambiente.gob.ec>
MAE (Ministerio del Ambiente del Ecuador) (2008b). Modelo de priorización de Áreas – SOCIO BOSQUE. Retrieved from: <http://www.ambiente.gob.ec>
MAE (Ministerio del Ambiente del Ecuador) (2010a). Boletín informativo de Socio Bosque No.2. Retrieved from: <http://www.ambiente.gob.ec>
MAE (Ministerio del Ambiente del Ecuador) (2010b). Socio Bosque: Conceptualización y Avances al Segundo Año de Implementación. MAE Report.
MAE (Ministerio del Ambiente del Ecuador) (2012). Programa Socio Bosque. Retrieved from: <http://www.ambiente.gob.ec>
Magnusson, W., Lima, A., R, and F. (2005). RAPELD: a modification of the Gentry method for biodiversity surveys in long-term ecological research sites. Biota Neotropica, 5, 1-7.
Mertens, B., and Lambin, E. F. (2000). Land-cover-change trajectories in southern Cameroon. Annals of the association of American Geographers, 90, 467–494.
Myers, N., Mittermeier, R. a, Mittermeier, C. G., Fonseca, G. a da, and Kent, J. (2000). Biodiversity hotspots for conservation priorities. Nature, 403, 853-8.
Neill, D. 1999. Vegetation. Vegetation types. In: Jørgensen, P.M., and S. León-Yánez (Eds.). Catalogue of the vascular plants of Ecuador, pp. 13-25. Missouri Botanical Garden Press, USA.
66
Nelson, E., Polasky, S., Lewis, D. J., Plantinga, A. J., Lonsdorf, E., White, D., et al. (2008). Efficiency of incentives to jointly increase carbon sequestration and species conservation on a landscape. Proceedings of the National Academy of Sciences of the United States of America, 105, 9471-6.
Nelson, E., Mendoza, G., Regetz, J., Polasky, S., Tallis, H., Cameron, Dr., et al. (2009). Modeling multiple ecosystem services, biodiversity conservation, commodity production, and tradeoffs at landscape scales. Frontiers in Ecology and the Environment, 7, 4-11.
Petit, C., Scudder, T., and Lambin, E. (2001). Quantifying processes of land-cover change by remote sensing: Resettlement and rapid land-cover changes in south-eastern Zambia. International Journal of Remote Sensing, 22, 3435–3456.
Phillips, O., RV, and Vargas, P. (2003). Efficient plot-based floristic assessment of tropical forests. Journal of Tropical Ecology, 19, 629-645.
Putz, F. E., and Redford, K. H. (2009). Dangers of carbon-based conservation. Global Environmental Change, 19, 400-401.
Putz, F. E., and Redford, K. H. (2009). The Importance of Defining “Forest”: Tropical Forest Degradation, Deforestation, Long-term Phase Shifts, and Further Transitions. Biotropica, 42, 10-20.
Raudsepp-Hearne, C., Peterson, G. D., and Bennett, E. M. (2010). Ecosystem service bundles for analyzing tradeoffs in diverse landscapes. Proceedings of the National Academy of Sciences of the United States of America, 107, 5242-7.
Rudel, T. (2000). Organizing for sustainable development: conservation organizations and the struggle to protect tropical rain forests in Esmeraldas, Ecuador. AMBIO: A Journal of the Human Environment, 29, 78-82.
Ruslandi, Venter, O., and Putz, F. E. (2011). Overestimating conservation costs in Southeast Asia. Frontiers in Ecology and the Environment, 9, 542–544.
Sánchez-Azofeifa, G. A., PFAFF, A., ROBALINO, J. A., & BOOMHOWER, J. P. (2007). Costa Rica's Payment for Environmental Services Program: Intention, Implementation, and Impact. Conservation Biology, 21, 1165–1173.
Santilli, M., Moutinho, P., Schwartzman, S., Nepstad, D., Curran, L., and Nobre, C. (2005). Tropical Deforestation and the Kyoto Protocol. Climatic Change, 71, 267-276.
Sierra, R. (Ed.). (1999). Propuesta preliminar de un sistema de clasificación de vegetación para el Ecuador continental. Proyecto INEFAN-GEF-BIRF y EcoCiencia. Quito, Ecuador.

67
Sierra, R. (2002). Assessing biodiversity conservation priorities: ecosystem risk and representativeness in continental Ecuador. Landscape and Urban Planning, 59, 95-110.
Sierra, R., and Russman, E. (2006). On the efficiency of environmental service payments: A forest conservation assessment in the Osa Peninsula, Costa Rica. Ecological Economics, 59, 131–141.
Southworth, J., Munroe, D., and Nagendra, H. (2004). Land cover change and landscape fragmentation—comparing the utility of continuous and discrete analyses for a western Honduras region. Agriculture, Ecosystems and Environment, 101, 185–205.
Southworth, J., Hartter, J., Binford, M. W., Goldman, A., Chapman, C. A., Chapman, L. J., Omeja, P., et al. (2010). Parks, people and pixels: evaluating landscape effects of an East African national park on its surroundings. Tropical Conservation Science, 3, 122–142.
Stickler, C. M., Nepstad, D. C., Coe, M. T., McGrath, D. G., Rodrigues, H. O., Walker, W. S., et al. (2009). The potential ecological costs and cobenefits of REDD: a critical review and case study from the Amazon region. Global Change Biology, 15, 2803-2824.
Tallis, H., and Polasky, S. (2009). Mapping and valuing ecosystem services as an approach for conservation and natural-resource management. Annals of the New York Academy of Sciences, 1162, 265-83.
Tropicos.org. Missouri Botanical Garden. 2012 Retrieved from: <http:www.tropicos.org>
UNFCCC (United Nations Framework Convention on Climate Change) (1998). Kyoto Protocol to the United Nations Framework Convention on Climate Change. Retrieved from: <http://unfccc.int/2860.php>
Unión Noroccidental de Organizaciones Campesinas y Poblaciones de Pichincha (UNOCYPP). (2010). Apoyo a la obtención de requisitos imprescindibles de beneficiarios de la zona de amortiguamiento de la reserva ecológica Cotacachi-Cayapas que participarán en el programa Socio Bosque. Informe técnico presentado Octubre 2010.
Wunder, S. (2006). Between purity and reality: taking stock of PES schemes in the Andes. October. Retrieved from: <http://sanrem.cals.vt.edu/1010/Wunder2006_Purity reality PES Andes.pdf.>
Wunder, S. (2007). The efficiency of payments for environmental services in tropical conservation. Conservation Biology, 21, 48-58.

68
Wunder, S., and Alban, M. (2008). Decentralized payments for environmental services: The cases of Pimampiro and PROFAFOR in Ecuador. Ecological Economics, 65, 685-698.
Zanne AE, Lopez-Gonzalez G, Coomes DA, Ilic J, Jansen S, Lewis SL, Miller RB, Swenson NG, Wiemann MC, Chave J (2009) Global wood density database. Dryad. Retrieved from: <http://hdl.handle.net/10255/dryad.235>
69
BIOGRAPHICAL SKETCH
Xavier Haro-Carrión was born in Quito, Pichincha Province, Ecuador where he
then grew up. He received a Bachelor of Science in Biological Sciences from Pontificia
Universidad Católica del Ecuador (PUCE) in Quito in 2006. He carried out his
bachelor’s thesis under the Bio-Sys Project, a research component of the BioTEAM
program of the University of Göttingen sponsored by the Federal Ministry of Education
and Research (BMBF), Germany. Afterwards, he assisted with and carried out research
through various projects in many different forest types in Ecuador. His research
experiences range from evaluating vascular epiphyte conservation in cacao agroforests
to taxonomic studies in the family Asteraceae. In 2008, he enrolled in the graduate
program at University of Florida in the Department of Biology and Tropical Conservation
and Development Program after being granted a Fulbright Fellowship. In 2010 he
conducted a survey-based evaluation of implementation of the Socio-Bosque Program
for Conservation International-Ecuador. Upon his return to the University of Florida in
2011, he developed a deep interest in landscape-level biodiversity studies. His master’s
thesis resulted from his previous work with Conservation International and field research
on issues related to landscape conservation. His future plan is to deepen his
understanding of forest conservation trade-offs at the landscape level.