by - virginia department of transportation · aasho road test results led to the ... control and...
TRANSCRIPT
EVALUATION OF EXPERI•ENTAL FLEXIBLE PAVEMENTS
Interim Report No, 1 Construction ol Altavista Bypass Experimental Pavement
by
Ko H. MeGhee Highway Research Engineer
(The opinions, findings, and conclusions expressed in this report.are those of the author and not necessarily those of the sponsoring agencies•
Virginia Higi•way Research Council (A Cooperative Organization Sponsored Jointly by the Virginia
Department of Highways and the University of Virginia)
In Cooperation with the Uo S• Department of Transportation Federal I•ghway Administration
Charlottes%?ille, Virgtnia
June 1974 VHR C 73-R 56

SUMMARY
Deflection tests conducted during the construction and shortly after the completion of a large experimental pavement project are reported. Four different pavement designs, as follows, are compared:
lo 6-inch cement stabilized subgrade 6-inch crushed stone base 7½-inch bituminous concrete
6-inch cement stabilized subgrade 9½-inch bituminous concrete
3• 4-inch cement stabilized crushed stone subbase 6-inch crushed stone base 7½-inch bituminous concrete
4• 6-inch cement stabilized subgrade 4-inch cement stabilized crushed stone base 5 ½-inch bituminous concrete
The results of these early tests support the following conclusions-
lo Pavements having equivalent design parameters are not necessarily equivalent in either early structural strength or in construction costs°
2• Very early deflection tests are not good indicators of the ultimate strength characteristics of pavements having cement stabilized layers.
3• Highly resilient soils must be stabilized to achieve a good working platform and to assure the early development of design strength.
Design No. 4, above, de•elops the design structural strength more rapidly and at a lower cost than the ot'her three designs°
iii

EVALUATION OF EXPERIMENTAL FLEXIBLE PAVEMENTS
Interim Report No. 1 Construction of Altavista Bypass Experimental Pavement
by
K. H. McGhee Highway Research Engineer
582
INTRODUCTION
For a number of years the Virginia Highway Research Council and the Federal Highway Administration cooperated in comprehensive performance studies of typical highway pavements of all types located in all sections of Virginia° The study, which at one time included nearly two hundred projects, resulted either directly or indirectly in an almost total revision in the Virginia approach to flexible pavement design° As a result of this study highway engineers in Virginia are much more cognizant of soil re- siliency, the benefits of cement or lime stabilization, and of the value of thick bituminous concrete layers° (i, 2, 3, 4) In addition, Vaswani has utilized the results of the above men- tioned study and those of the AASHO road test in developing a strength coefficient design method for use in Virginia° (5)
The comprehensive studies were phased out at the end of calendar 1971, because most of the projects had reached the age where further study would not be profitable• On the other hand, recent innovations in pavement design are receiving attention so that casionally new construction projects have features quite different from anything in the past° Examples are full-depth asphalt pavements (up to 16 inches of bituminous concrete base) and pavement systems in which the layers have been switched from their usual positions° Clearly, the evaluation of such projects is crucial to the determination of whether or not the experimental features should be adopted for routine pavement designs°
PURPOSE AND SCOPE
The present report deals with the construction and preliminary evaluation of four experimental pavement systems designed by the layer coefficient method and found by that method to be structurally equivalent° This work is being done in cooperation with the Materials and Construction Divisions of the Highway Department° The experimental sections are located on the four-lane divided bypass of Altavista, Virginia (Uo So Route 29). While this project is only one of seven included in the overall study, it is reported separately here because of several distinguishing features and because the construction of the four experimental sections has been completed very recently. Construction began in the fall of 1971 and the pavement was opened to traffic in late 1973o
The primary objective of the Altavista project is to evaluate the relative merits of four typical pavement sections designed by the coefficient method• Included are: (1) An evaluation of the original relative structural strengths of the four pavement de- signs as determined by deflection tests during and immediately after construction, and (2) an evaluation of the relative performance of the four designs as determined by long= ter•n deflection and roughness tests along with visual observations°
A secondary objective is to evaluate the comparative construction costs of the four pavement designs in an effort to show that structurally equivalent pavements may be of different costs.
The present report deals almost entirely with the evaluation of layer deflection •ests conducted on the Altavista project while it was under construction. Other projects included in the overall study are indicated in the working plan. (6)
PROJECT DESCRIPTION
Background
The AASHO Road Test Results led to the development of a flexible pavement strength equation:
D a 1 h
1 + a 2 h
2 +
where
D designates the thickness index, or total strength index of the pavement;
a I is the strength coefficient of the surface layer of thickness hl•
a 2 is the strength coefficient of the second layer of thickness h2; etc.
Vaswani assigned ,the value 1,. 0 to asphaltic concrete (al) and evaluated the coefficients for other materials such that a pavement having a thickness index D can be considered structurally equivalent •o an asphaltic layer D inches thick° (5) Some of the resulting coefficients are tabulated in Table Io iFor design purposes Vaswani also gives a soil support value based on CBR tests and adjusted by a regional resiliency factor. (5)
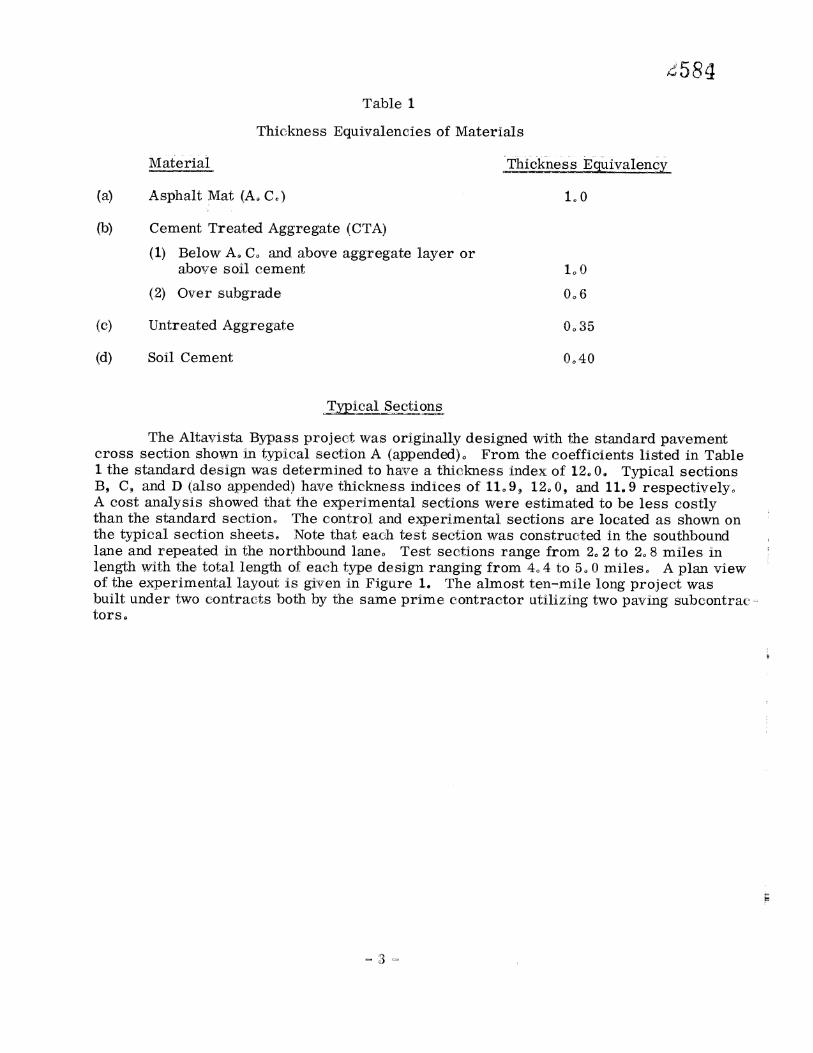
Table
(b)
Thickness Equivalencies of Materials
Material -•.T_h_•=c kn e•'i__v ale._ n.• (a) Asphalt Mat (A• Co) 1o 0
Cement Treated Aggregate (CTA) (1) Below Ao Co and above aggregate layer or
above soil cement
(2) Over subgrade 0°6
(c) Untreated Aggregate 0o 35
(d) Soil Cement 0o 40
•e_ctfi_on•s
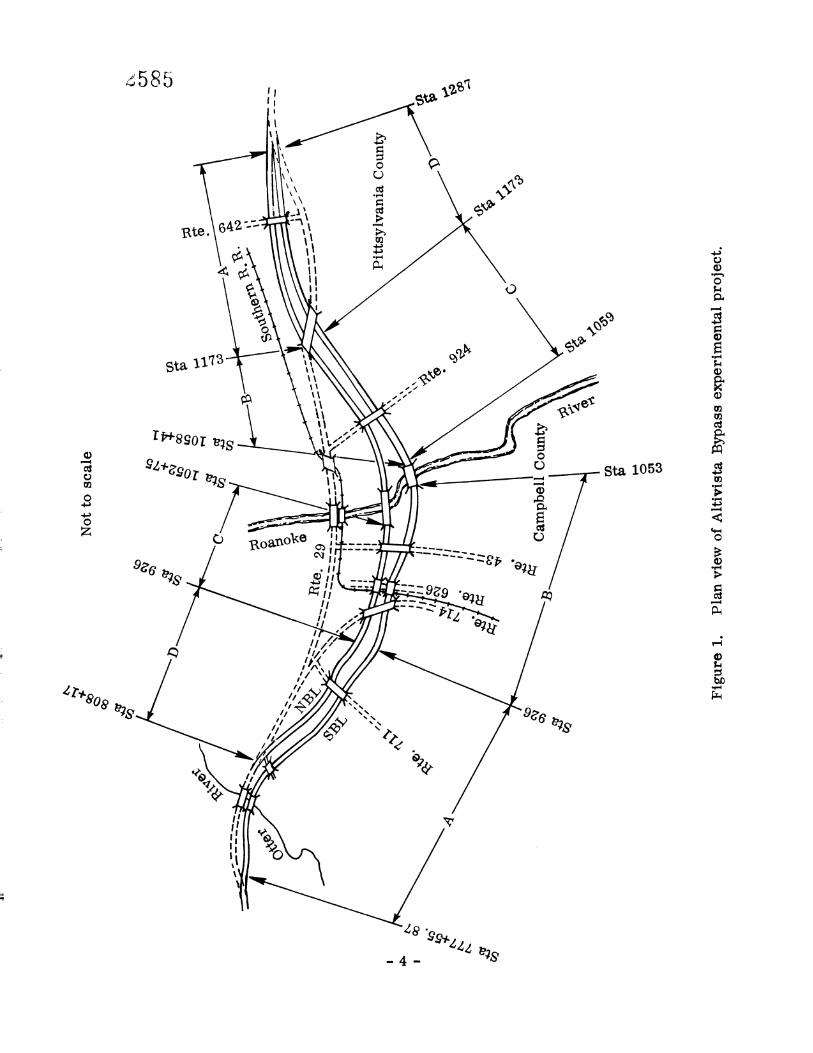
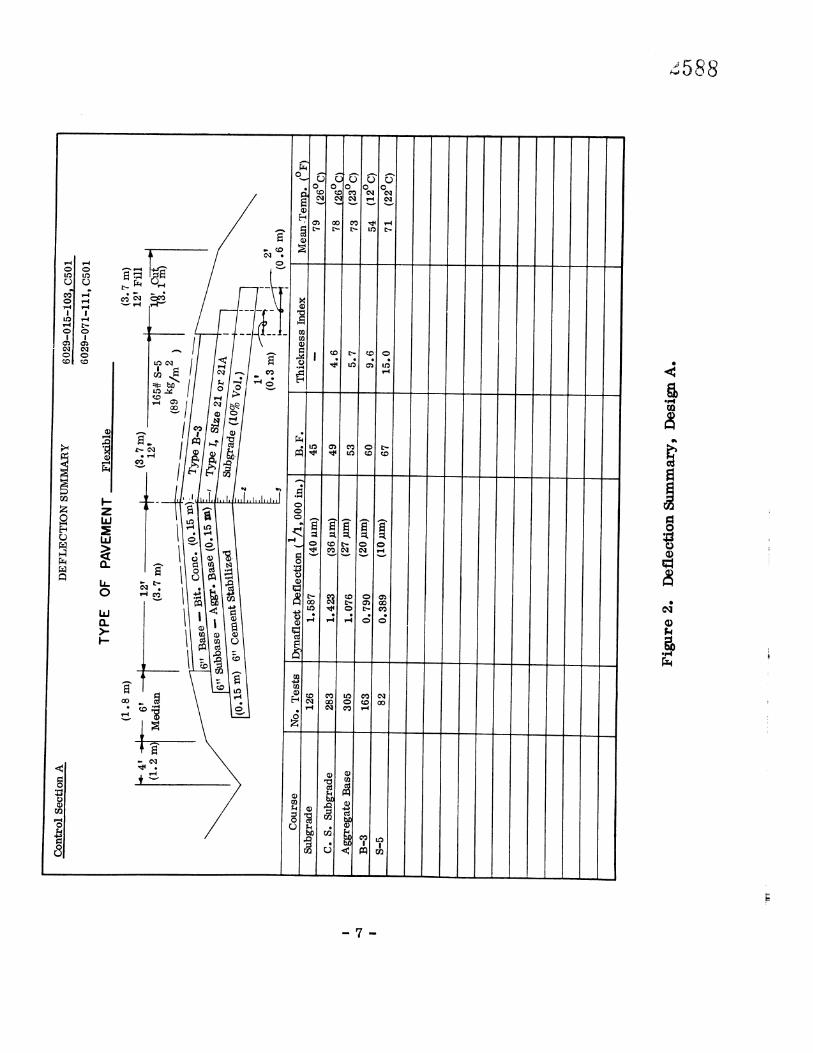
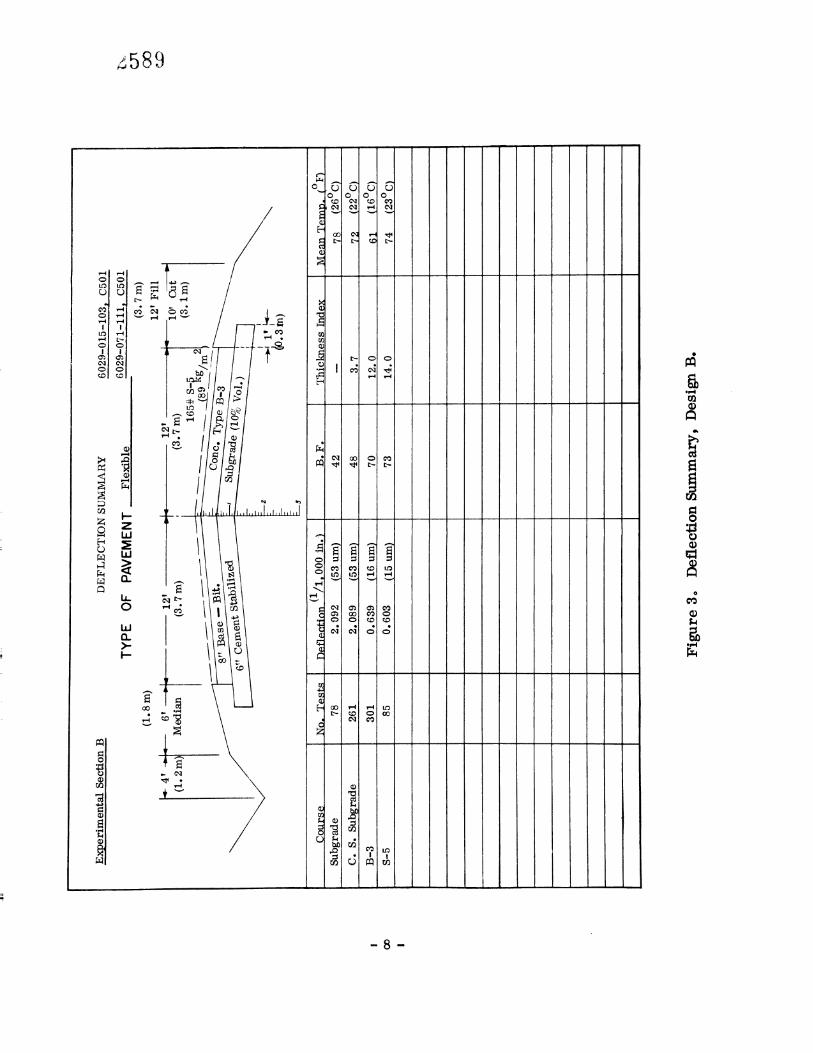
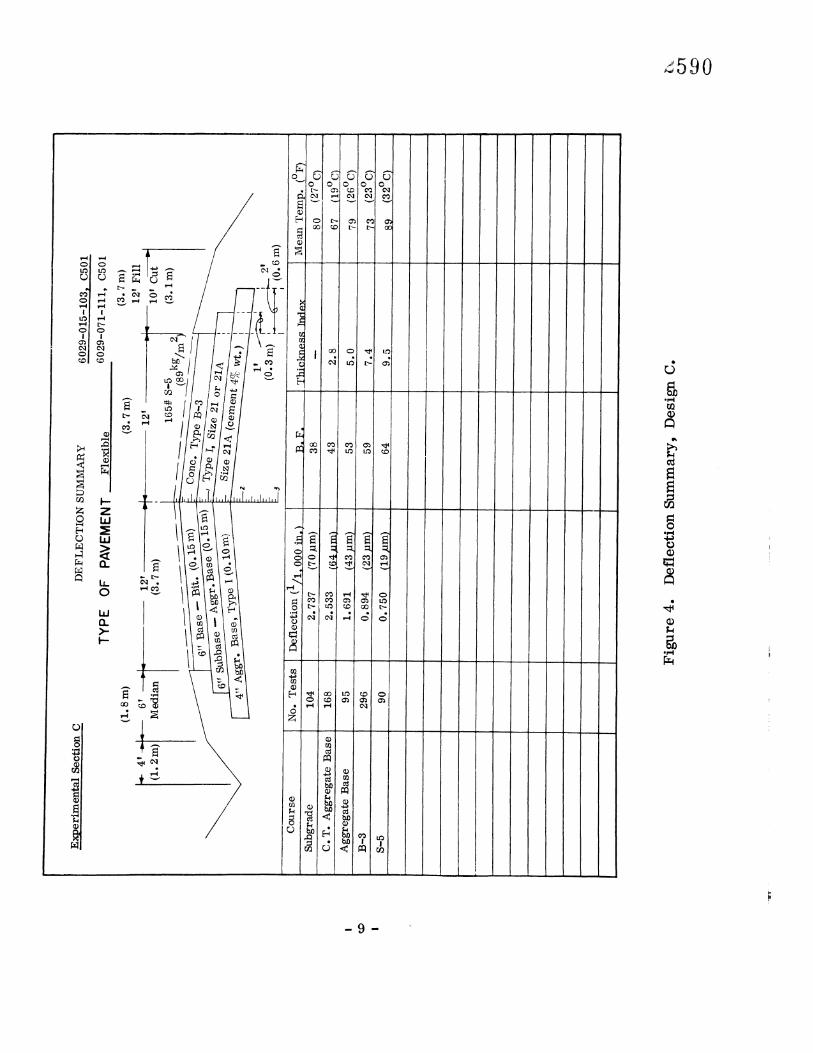
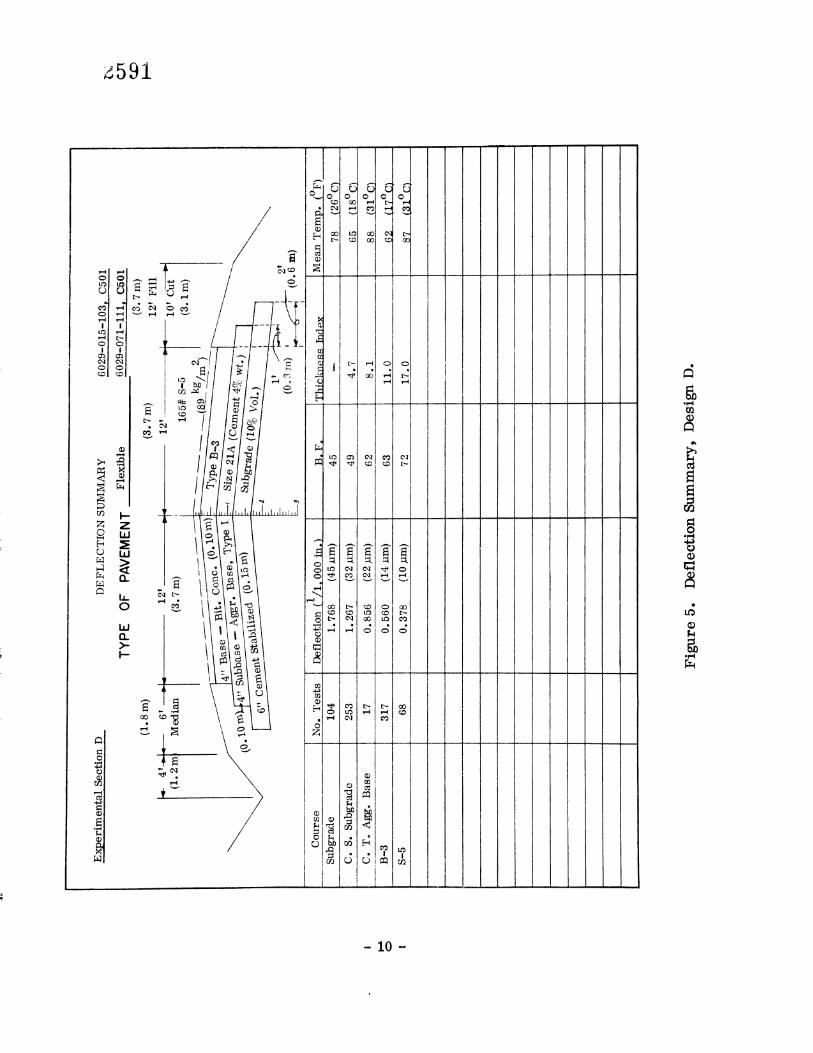
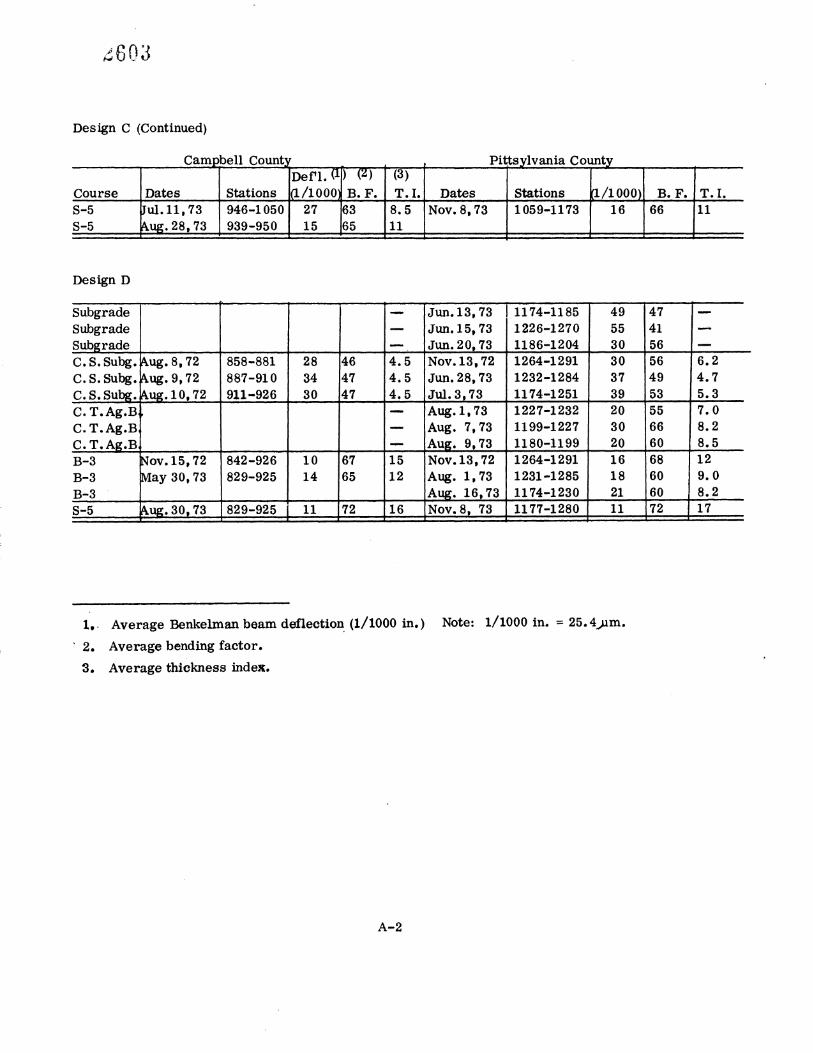
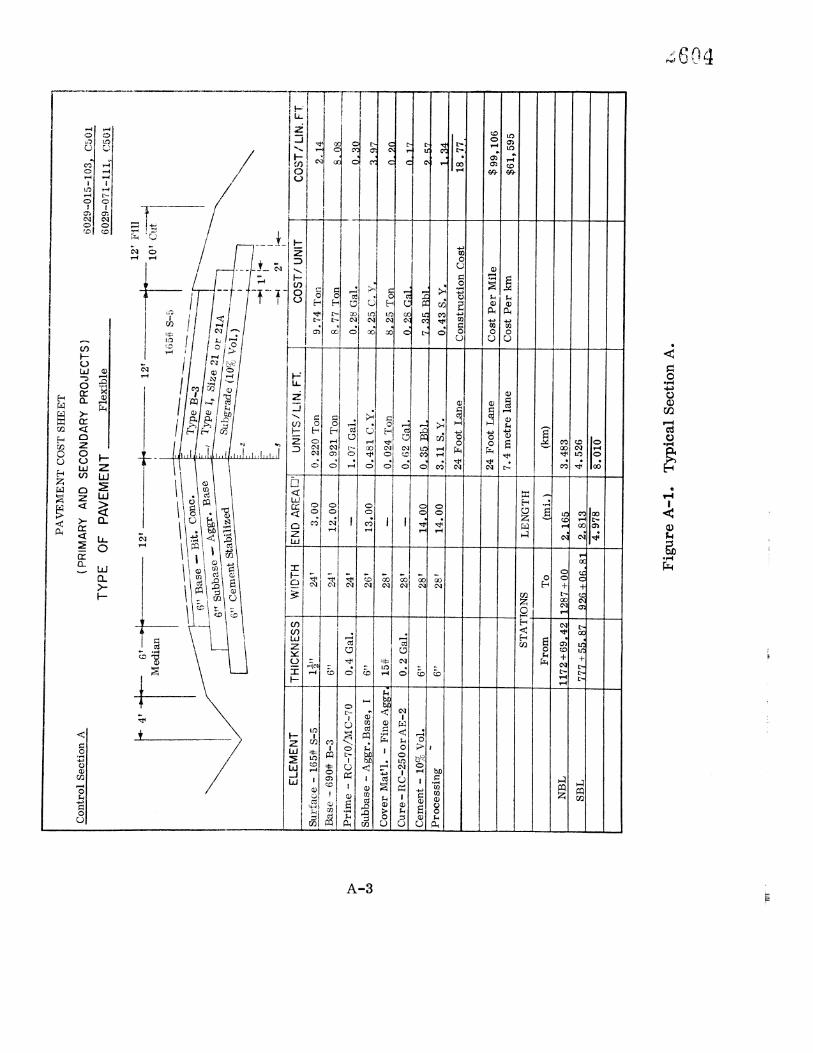
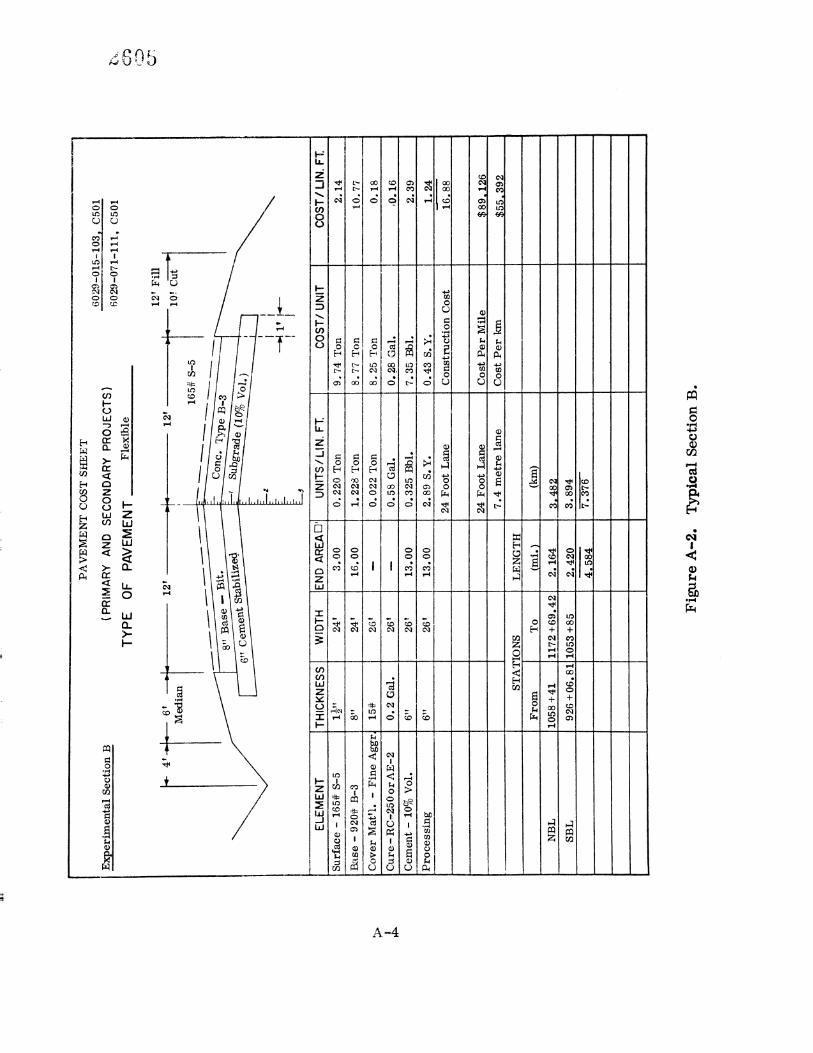
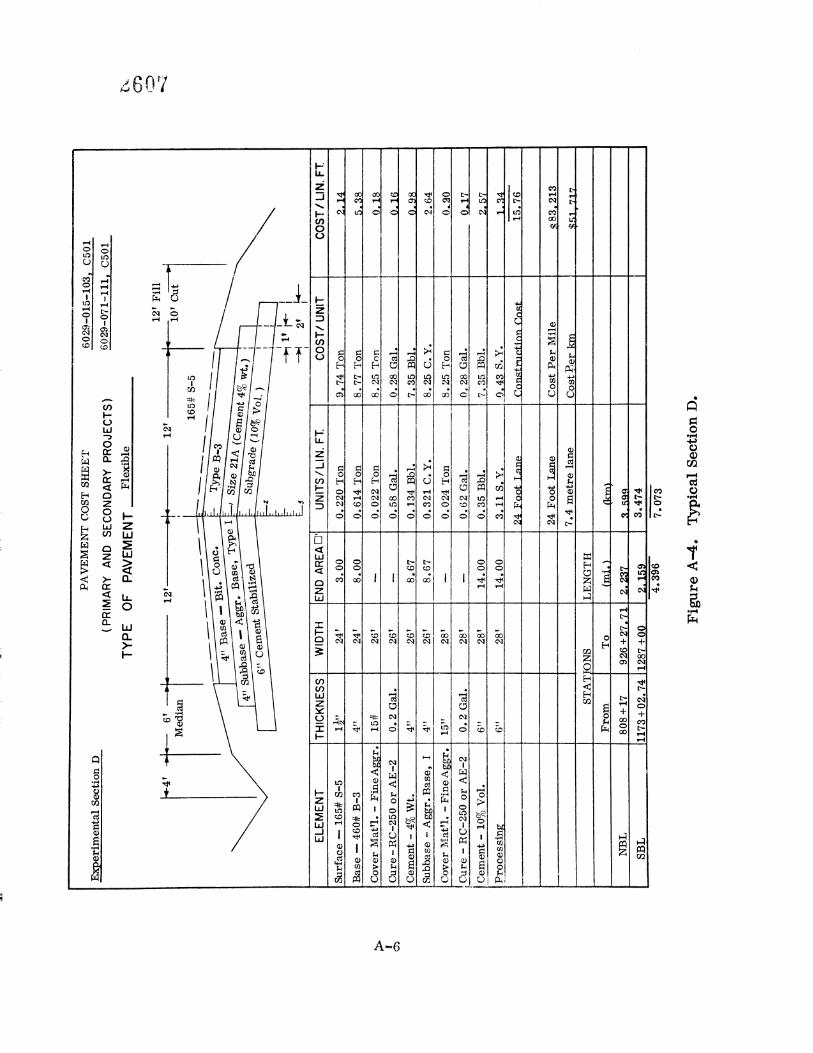
The Altavista Bypass project was originally designed with the standard pavement cross section shown in typical section A (appended)° From the coefficients listed in Table 1 the standard design was determined to have a thickness inde• of 12o 0, Typical sections B, C, and D (also appended) have thickness indices of 11o9, 12o0, and 11o9 respectively° A cost analysis showed that the experimental sections were estimated to be less costly than the standard section° The control and experimental sections are located as shown on the typical section sheets° Note that each test section was constructed in the southbound lane and repeated in the northbound laneo Test sections range from 2o 2 to 2o 8 miles in length with the total length oi each type design ranging from 40 4 to 5o 0 miles° A plan view of the experimental layout is given in Figure 1o The almost ten=mile long project was built under two contracts both by the same prime contractor utilizing two paving subcontrac=: torso
Z
Bte. 64Z
Roa.noke
// //
/
0 0
(D
Soil Conditions
The nature of the embankment and subgrade soils on the Altavista Project were determined during the preliminary engineering phase of the project° The details of these soil conditions are available in the project records. Briefly, the subgrade soils are predominately micaceous silts from A=2•4(0) through A-5(10) and with California bearing ratio values o• from 5 to 16• Since these soils are categorized as highly resilient with poor bearing capacity it has been conventional in Virginia to stabilize the top six inches of the subgrade with portland cement. As has been reported elsewhere, this sta• bilization has been found to provide both a good working platform for construction equipment and to enhance long-term pavement performance. (4) As indicated above, such stabilization was provided on three of the experimental sections on the present project, while the fourth design specified compacted native subgrade without stabilization.
•!on_ s
All experimental sections on the Altavista project were constructed in accordance with the project plans and the Virginia Department of Highways Road and Bridge Specifi- cations dated July 1, 1970.
•ection_
Since the experimental project is a bypass, existing traffic conditions were non- existent. However, Location and Design Division studies in 1968 projected an average daily design traffic of 2,730 vehicles in one direction based on traffic studies on connecting roadways° These same studies projected the daily mean 18,000 pound equivalent axle loads in the traffic lanes to be 134o
EVALUATION PROCEDURES
In general• the evaluation of experimental features begins when substantial portions of the subgrade for a given project have been prepared. At that time, dynaflect deflection tests are conducted on the subgrade• Similar tests follow the placement of subsequent pavement layers, including the final riding surface° Further steps in the evaluation of each project are as follows-
(i) Procurement of final plans and cross sections, materials descriptions, construction costs, and date of acceptance from the contractor•
(2) Establishment of easily identified project limits by the use of roadside markers and written descriptions.
(3) Initial and periodic collection of data reflecting•
trMfic characteristics, structural capability as indicated by deflection tests, roughness• and
visual defects such as cracking, rutting, patching, and settlements.
(4) Compilation of records of major maintenance operations •ituminous concrete overlays, for example) and their costs.
The details of the procedures mentioned in (3) above are given in earlier studies where it may be seen that a pavement is considered to have failed when the cracking factor (4) reaches 50. Because of the relative smoothness of its pavements, Virginia has been dissatisfied with performance evaluations based on present servicibility index concepts in which the BPR roughometer was used. (8) Recent efforts with the Portland Cement Association roadrneter appear more promising, so that this device will be used for roughness testing°
(4,7)
RESULTS AND DISCUSSION
Laye_r_ _D_eflections
Deflection tests were conducted at regular time intervals •rom the beginning of subgrade preparation until the project was opened to traffic. The first tests were conducted on the raw subgrade o• Section B and the cement stabilized subgrade o• Section A on August 8, 1972o Tests were then run on each layer of each section as test locations became avail- able. Final tests on the finished surface of all sections were conducted during the •all o• 1973.
Table I-A (Appended) summarizes all deflection tests conducted to date. In this table the test results are listed according to location within the project and within the pave= ment structure. Along with the Benkelman beam deflection at each location, the bending factor and the calculated accumulative thickness index(9)
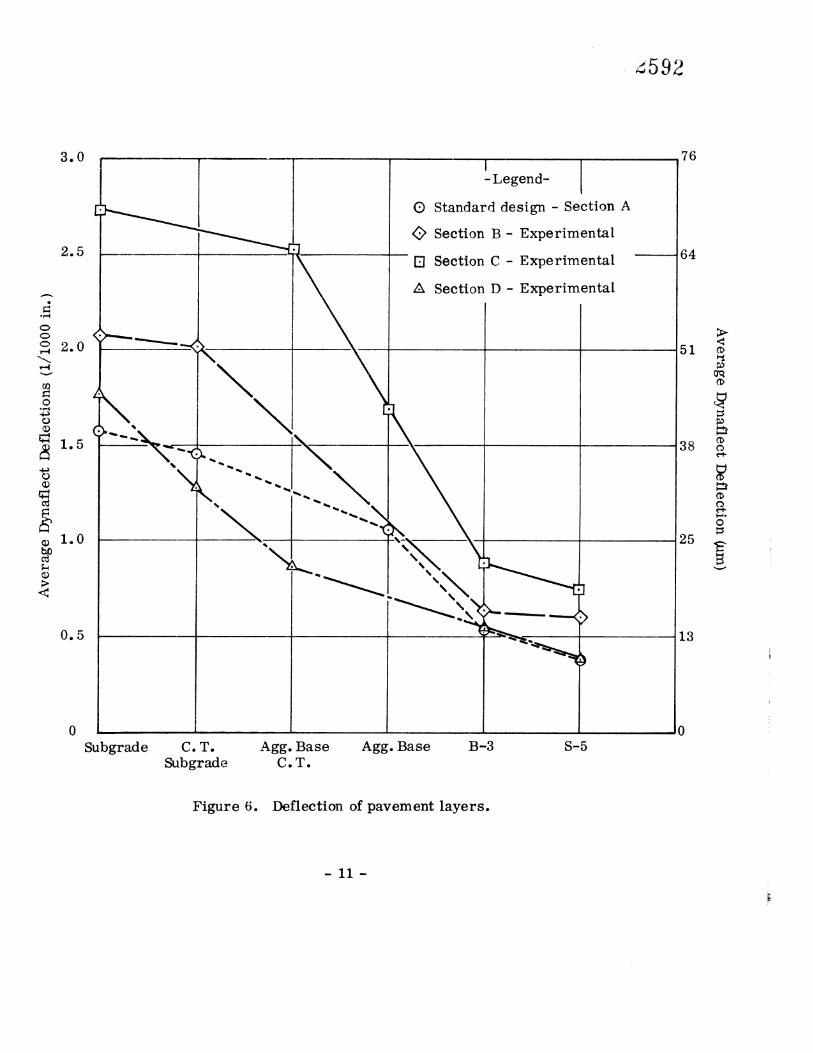
are tabulated for each testing condition. All deflection tests employed the dynaflect with the conversion to Benkelman beam made thorough use of the equation (Benkelman beam 27o8 dynaflect) determined by Hughes° (I0) In addition t•o Table I•A the deflection data are summarized in Figures 2, 3, 4, and 5 according to design types A, B, C, and D respectively. In these figures, all deflection tests for a given pavement layer ha•e been averaged. The data shown include the dynaflect defleetion• the bending factor, the accumulative thickness index, and the weighted average air temperature at the time of testing° Finally• Figure 6 depicts graph- ically the reduction in a•-erage dynafiect deflection 10r each design type as each of the pavement layers was constructed. A discussion of the deflection results for each design type follows.
-7-
r4 r•
I,• 0
C
-8-
9
0 0 i0 O 0
10-
592
-Legend-
Standard design Section A
Section B- Experimental
Section C Experimental
Section D- Experimental
76
64
51
38
25
13
Subgrade C.T. Agg. Base Agg. Base B-3 S-5 Subgrade C.T.
Figure 6. Deflection of pavement layers.
-11-
Design A• .shown in Figure 2, is of the general type often considered as the standard for many areas of the state and for that reason was chosen as the standard of comparison for the present study.
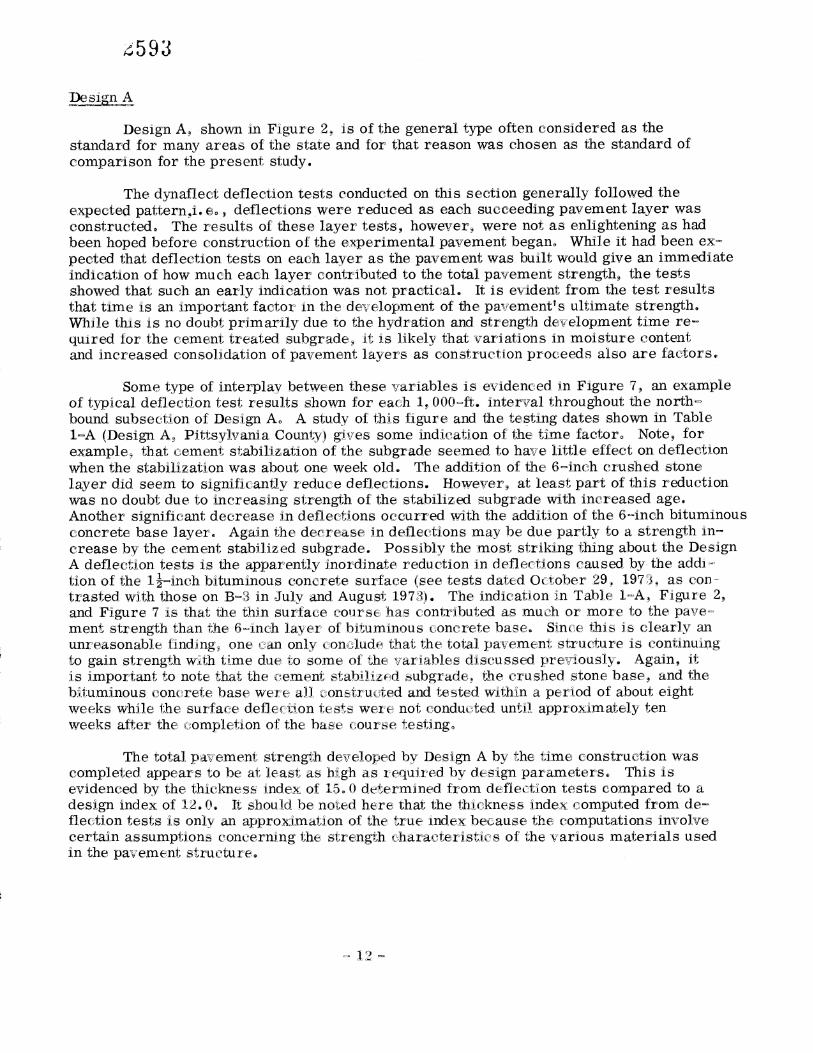
The d:•:naflect deflection tests conducted on this section generally followed the expected pattern,i, eo, deflections were reduced as each succeeding pavement layer was constructed. The results of these layer tests, however• were not as enlightening as had been hoped before construction of the e•perimental pavement began° While it had been peered that deflection tests on each layer as the pavement was built would give an immediate indication of how much each layer contributed to the total pavement strength• the tests showed that such an early indication was not practical. It is evident from the test results that time is an important factor in the. de•elopment of the pavement•s ultimate strength. While this is no doubt primarily due •o the hydration and strength development time re- quired for the cement treated subgrade• it is likely that variations in moisture content and increased consolidation of pavement layers as construction proceeds also are factors.
•Some type of interplay between these variables is evidenced in Figure 7, an example of typical deflection test results shown for each i, 000=ft. interval throughout the north= bound subsection of Design Ao A study of this figure and the testing dates shown in Table I=A (Design A• Pittsy!vania County) gives some indication of the t•me factor° Note• for e•ample• that cement stabilization of the subgrade seemed to ha•e little effect on deflection when the stabilization was about one week old. The addition of the 6=inch crushed stone layer did seem to significantly reduce deflections. However• at least part of this reduction was no doubt due to increasing strength of the stabilized subgrade with increased age. Another significant decrease in defiec•ions occurred with the add•£ion of the 6•inch bituminous concrete base ]ayero Again the decrease in deflections may be due partly to a strenglh in
crease by the cement stabilized subgrade. Possibly the most striking thing about the Design A deflection tests is the apparently inordinate reduction in deflections caused by• the add• tion of the 1½=inch bituminous concrete surface (see tests dated October 29, 197• as con trasted with those on B=3 in July and August 1973). The indication in Table I=A• Figure 2, and F•gure 7 is •hat •he thin surface ¢o•.rse has contributed as much or more to the pave= ment strength than the 6=inch lay•er of bituminous concrete base. Since this is clearly an unreasonable finding, one can only conclude that the total pa•emen,t structure is continuing to gain strength w•th t:i_me due to some of the variables discussed pre%•iously. Again, it is important to note that the •ement stabilized subgrade• the crushed stone base, and the bituminous concrete base were all •onstructed and tested within a period of about eight weeks while the surface deflection tests were not conduc•ted until appro:(imately ten weeks after the completion of the base course testing°
The total parlement strength developed by Design A by .the time construction was completed appears to be at least as high as reciuired by design parameters. This is evidenced by the thickness index o• •5• 0 de•errn•ned Irorn deflect•on tests compared to a design index of _12.0. It shou•_d be noted here that the thickness index computed £rom de- flection tests is only an approximation of the true index beaause the computations invol•e certain assumptions concerning the strength •haracterist:•es of the various materials used in the parlement structure.
-Legend- <•> Subgrade
Cement treated subgrade 6" (152mm)agg. base
6" (152mm)bit. conc. base
1½" (38 mm)bit, conc. surface
oo•
1180 1200 1220 1240 1260 128 0 Station
Figure 7. Layer deflections at 1,000 ft. (308 m) intervals. Typical results {Design A NBL).
127
102
76 ¢
25
13--
De si_gn B
Design B, so•netimes referred to as a modified full=depth asphalt pavement because, except for the cement stabilized subgrade, the pavement is comprised en-
tirely of bituminous concrete, shows strength development under construction very much as wo,ald be e_-•peeted. As can be seen in Table I•A and in Figures 3 and 6 the majorif•y of the strength development can be atiributed to the 8-inch bituminous con.crete base course. Furthermore• since from four weeks to ten months had elapsed between tests on the cement stabilized subgrade and those on •he bituminous concrete base, it is reasonable to assume that the stabilized subgrade had developed most of its strength be• fore the bituminous concrete was applied and tested.
In this case• as with Design A• the thi•kness index data show that the completed pavement has a stractoral strength at least equ•valent to design requirements° Again, the measured thickness index_ of 14o 0 compares favorably with the design value of Iio 9.
Desig•_•C
E•xperimental Design C is the only one of the four constructed with an unstabilized subgrade soilo For this reason• a poorer working plati•orm was provided for the contractor's equipmento This i°actor• together with extremely wet construction seasons and very poor soil conditions• resulted in some construction difficulties° These problems were evidenced (I) in the need to apply lime as a drying agent to certain saturated portions of the subgrade soil, (2) in the distortion of the prepared subgrade soils •nder constru.<•tion traffics and (3) primarily in •he veryearly failure of one segment (stations 1117 to 1130 approximately) of the 4•inch thick cement treated crushed stone sabbase under construction traffic° This subbase iai!ure was •?orrected by the provision of 4% cement by weight to the previously tmstabilized layer oi crashed stone baseo Because of this change in the pavement char• acger .the altered segment oi roadway will be excepted in future stttdies where the performances ofthe •our desi .gns are compared° Nevertheless, the researchers plan to observe the behavior of this exception i•or an indefinite periodo
As indicated ab(:•ve, the subgrade soils in the C sections were very poor° This is also shown, in. the deflection results given in Table I•A and in Figures ,i and 6o Note that subgrade deflect:ions and deflections on all subsequent layers were higher for Design C than for the other three designs° Even though the two subsections of Design C were located some distance at•art •.(l in opposite !anes• by chance they were locatc.•t in two of the worst soil areas on the e:•rperimental project. Soil problems identified in some portions of Design C were saturation in the Campbell County subsection and the presence of a highly resilient bh•e micaceous silt in the Pittsylvania County subsection°
The ga:i.n in pa•'em.ent strength with the addition of pa,Te•nent layers had some of the characteris.•ics seen for Design A. Note that again in Design C 2t appears, at first glance• that the l-•.•inch sust•ac•e cou.rse has contributed almost as much to pa'•,emeng strength as
the 6-inch bitaminous concrete base. However• a study of the ,testing dates in Table shows that the crushed s•one and the bituminous concrete base layers were applied shoz•ly after cement treatment of .the 4-inch subbase layer° Tests on the surface course
were conducted se•,eral months later in most cases° ttence, it is likely that much of the increase in thickness index apparently due to the surface course (Figure 4) was really due to strength gain• by the cement treated subbaseo
Apparently clue •o fl•e •oil p•oblem• •nd eon•ue•ion diffi•ul•ie• cli•eu•ed •bove, De_sign C has a completed thickness index averaging 9.5• which does not compare well with the design index of 12o 0. This design will deserve close observation and.testing to determine whether there are later significant improvements in pavement strefigth
or whether premature failures occur.
Design D• which contains two cement stabilized layers, produced the strongest finished product of the four designs included° The deflection data shown in Table and Figures 5 and 6 are self-explanatory and it suffices to point out that the final de- flections are the lowest and the final thickness index the highest of those measured for the four designs° Clearly• the final thickness index( of 17.0 compares very favorhbly with the design index of Iio 9o
The gain in pavement strenglh with time as noted for Designs A and C is again evident for Design D in that the surface course applied some months after the other pavement layers seemed to inordinately increase pavement strengths°
It is important to note here that while this particular design may perform extremely well, there will be reflection cracks from the cement treated crushed stone underlying the relatively thin bituminous concrete course° Furthermore, as has been reported earlier from a study of a similar pavement, (7) the extreme rigidity of this design coupled with the tendency of the cement treated stone to crack both transversely and longitudinally can sult in behavior very much like that of a concrete pavement° Thus, if water becomes trapped under the stabilized stone a pumping action can. occur to the detriment of pavement perform- anceo The performance of this partic•ular section will be watched closely for any evidence of this phenomenon°
Cost Comparison
Direct cost comparisons of the standard and the three e•erimen•al pavement sections are readily available from the appended Typical Sections A through D where contract bid prices have been used to compute actual construction costs Note that sections A and C were the most costly and happened to cost the same° Section D, with two cement stabilized layers but relatively thin asphaltic concrete, was the least costly by some $16,000 per mile. It should be kept in mind that the bid prices given were effective in late 1971 and in no way reflect current construction costs. It is conservatively estimated that the Altavista pavement costs would be doubled if the contracts were let in mid-1974o Furthermore• the relative costs of the four e•perimental sections may have changed be- cause all highway materials have not increased in cost at the same rate°
A closer analysis of actual construc•t.•_on costs is provided in Table 2, where more details are given° As can be seen in the table• pavement constrt•_otion costs are roughly related to the total .thickness of pa%•ement provided° In fact• when viewed in terms of cost per inch of pavement depth the standard design. (Design A) i•s the most economical pavement, while the thick bituminous concrete pavement (Design B) is the most expensive°

597
Table
Construction Cost Summary
Section Cost Total Cost per Thickness: Cost per per.mile Thickness (in.) mile per-in. --Index* mile/T, t, **
A $99,106 19.5 $5,08 2. 15.0 $16,607. B 89• 126 15.5 5,750. 14.0 6• 366. C 99• 106 17.5 5,662. 9.5 10,432. D 83• 213 15.5 5,369. 17.0 4,895.
*Measured thickness index, from deflection tests.
**Cost per mile per unit measured .thickness index.
However, in keeping with current design concepts wherein the pavement thickness index is the major structural parameter, it is more realistic to consider the costs per unit of thickness index. When viewed in this manner• the very rigid, highly stabilized Design D is the least expensive, while Design C, in which the subgrade was unstabilized, is the most costly.
While it is too early to draw firm conclusions, the deflection tests suggest, at this time, that the least expensive two designs (B and D) may provide better performance than the two more costly designs (A and C).
CONCLUSIONS
The following conclusions are based on tests conducted during construction and shortly after completioz• of the Altavista project. Because pavement characteristics may change under the first few months exposure to traffic and changing climatic conditions, no definite indications of ultimate pavement performance are offered in this initial report.
Pavements having equivalent design thickness indices are not necessarily equivalent in early structural strength.
Pavements .having equivalent design thickness indices are not necessarily equivalent in construction costs.
Very early deflection tests are not good indicators of the ultimate strength characteristics of pavements having cement stabilized layers.
Highly resilient soils, especially micaceous silts, must be stabilized to achieve a good working platform for pavement construction and to assure the early development of the design structural strength.
A design utilizing a cement stabilized subgrade overlain with a cement stabilized stone base and bituminous concrete develops the design structural strength more rapidly and at a lower co•t than any of the other three .designs.


ACKNOWLEDGEMENTS
The research reported was conducted under the sponsorship of the Virginia Department of Highways and the Federal Highway Administration. The study is financed from HPR funds and is under the general supervision of Jack H. Dillard, head of the Virginia Highway Research Council.
The interest and cooperation of J. P. Bassett, pavement design engineer; F. L. Burroughs, construction engineer; and numerous district, residency, and project per- sonnel have made the experimental project possible. The author gratefully acknowledges this assistance°
Finally, the diligence displayed by G. Vo Leake, highway materials technician, in conducting the deflection tests and in keeping detailed records of construction progress is most appreciated.

6•
So
9•
10o
REFERENCES
Nichols, Fo Po, Pr•_•_gress Report Number One_,___E_x•erimenta•_•exi•ie_-P•/_•-••i_ Virginia Highway Research Council, October 1959,
Virginia Highway Research Council, November 1963.
Hughes, Co So, Integral_m_. R•_e._,__P_h_a_s_e_C of Pavement Design and Perf. _o_rm_an_c)__S_t• "Experimental Flexible Pavements," Virginia Hig•way------•esearch Council• February 1968o
McGhee, Ko Ho, • Phase A_, Performance Stud•y_o_f_T_ypi_c_al Virgipia__ Pavements Virginia Highway Research Council, April 19720
Vaswani, No Ko, AASHO Road Test Find•lied to FleyAble Pavements in Vir •n•..•_ Virginia Highway Research Council• April 1969.
McGhee, Ko Ho, Work_in_g_Pl_l•_• Evaluat•i_0_n_o_f__•xper_ i_m_•n__ha_l Fle•xfib_l•e _Pav•ements• Virginia Highway Research Council• September 1971.
•_, Fin. _a••erimen.tal Flexible Pavements,.
Virginia Highway Research Council, May 1971.
McGhee, K. Ho, and R. Wo Gunn, •0admeter_ Roug_l/ne_s_._s_.T_esting •. Virgini_• Virginia Highway Research Council, September 1971.
Vaswani, No Ko, "Method for Separately Evaluating the Structural Performance of Subgrade and Overlying Fle•ble Pavements," HRB Record No. 36_•2 1971o
Hughes, Co So, R••ressi0PE uN_q_a•on to _mat. e m._sn_.. _Beam Values from •Resu_l_ts• Virginia Highway Research Council, July 19670


z601
APPENDIX

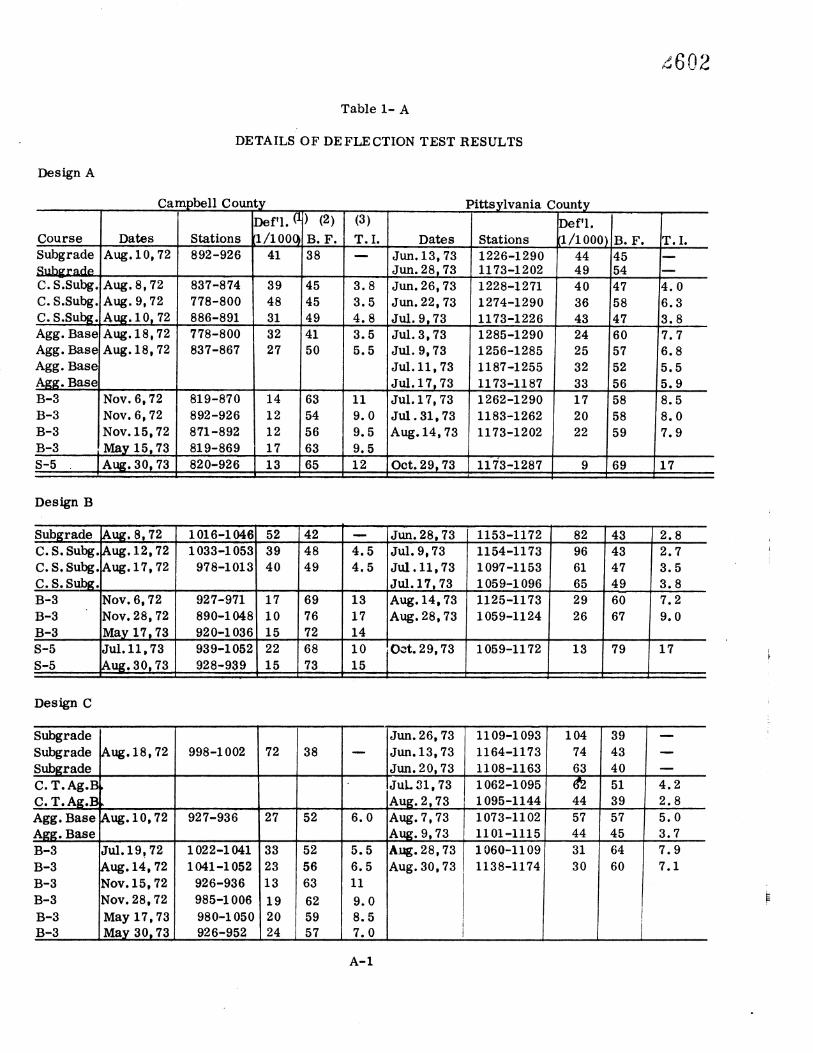
Table 1- A
DETAILS OF DEFLECTION TEST RESULTS
Design A
Campbell Count DePI. (1) (2)
Course Subgrade Subgrade C. S.Subg. •Aug. 8, 72 C. S.Subg.• Aug. 9, 72 C. S;Subg, Au•. 10,72 Agg. Base Aug. 18, 72 Agg. Base Aug. 18, 72 Agg. Base Agg. Base. B-3 B-3 Nov. 6, 72 B-3 Nov. 15, 72 B-3 May 15,73 S-5 Aug. 30, 73
Dates Stations Aug:10, 892- 6
837-8•74 778-800 886-891 778-800 837-867
Nov. 6, 72 819-870 892-926 871-892 819-869
(3) 11/1000). B. F.
41 38
14 12 12 17
820-926 13
39 45 3.8 48 45 3.5 31 49 4.8 32 41 3.5 27 50 5.5
63 54 56 63 65
Dates Jun. 13, 73 •un. 28, 73 Jun. 26, 73 Jun. 22, 73 Jul. 9, 73 Jul. 3, 73 Jul. 9, 73 Jul. 11,73 Jul. 17, 73 Jul. 17, 73 Jul. 31,73
Pittsylvania Count.
11 9.0 9.5 Aug. 14, 73 9.5 12 Oct. 2 9, 73
Stations 1226-1290 1173-1202 1228-1271 1274-1290 1173-1226 1285-1290 1256-1285 1187-1255 1173-1187 1262-1290 1183-1262 1173-1202
11•3-1287
Def'l. I1/1000) B. F.
44 i45 49 54 40 47 36 58 43 47 24 60 25 57 32 52 33 56 17 58 20 58 22 59
6.3 3.8 7.7 6.8 5.5 5.9 8.5 8.0 7.9
9 69 17
Design B
Subgrade C. S. Subg. c. s. Subg. C. S. Subg. B-3 B-3 B-3 S-5
Aug: 8, 7-2 Aug. 12, 72 Aug. 17, 72
Nov. 6, 72 Nov. 2.8, 72 May 17, 73.• Jul. 11,73 Aug. 30, 73
1016'1,046. 52- 42 1033-1053 39 48 978-1013 40 49
927--971 17 69 890-1048 I0 76
...920-10.36. 15 72 939-1052 22 68 .928-939._. 15 73
JUn. 28, 73 4.5 Jul. 9,73
1'1153-1172
13 17 14 10 15
Jul. II, 73 Jul. 17, 73 Aug. 14, 73 Aug. 28, 73
oc.t. 29, 73
1154-1173 1097-1153 1059-1096 1125-1173 1059-1124
1059-1172
82 43 96 61 65 29 26
13
43 47 49 6O 67
79
2.7 3.5 3.8 72 9.0
17
Design C
Subgrade Subgrade Aug. 18, 72 Subgrade C. T. Ag.B, C. T. Ag.B, Agg. Base Aug. 10, 72 Agg. Base B-3 j•-' 19, 72 B-3 Aug. 14, 72 B-3 Nov. 15, 72 B-3 Nov. 28, 72 B-3 May 17, 73 B-3 May 30, 73
998-1002 72
927-936 27
Jun. 26, 73 38 Jun. 13, 73
Jun. 20, 73 JuL 31,73 Aug. 2• 73
52 6.0 Aug. 7, 73
1022-104i 33 52 1041-1052 23 56 926-936 13 63 985-1006 19 62 980-1050 20 59 926-952 24 57
5.5 6.5 11 9.0 8.5 7.0
..Aug. 9, 73 A•g. 28, 73 Aug. 30, 73
1109-1093 1164-1173 1108-1163 1062-I 095 1095-1144 1073-1102 1101-1115 1060-1109 1138-1174
104 74 63
44 57 44 31 30
39 43 40
39
45 64 6O
4.2 2.8 5.0 3.7 7.9 7.1
Design C (Continued)
CamPbell County DeP1. (1) (2)
.Course Dates Sta.t, ions •./i000] B.•.F: S-5 lul. il, 73 946-10ff0 27 63 •S,-,5 A,ug. 2..8, 73 939-950 15 65
Pi .t-tsylvania Count_r (3) T.I:. Dates_•_ Statio.ns 11/100.0)
8, 5 Nov, 8, 73 1059-1173 16 11
So Fo
Design D
Subgrade Subgrade Subgrade C.s.subg. C. s. Subg. C. S. Subg. C. T. Ag.B, C. T. Ag.B, C. T•. Ag.B, B-3 B-3 B-3 S-5
•.•g. 8, 72 .•ug. 9, 72 •ug. 10, ,7.2
Nov. 15, 72 May 30, 73
%ug. 30, 73
858-881 28 46 887-910 34 47 911-926 3O 47
842-926 10 67 829-925 14 65
829-925 11 72'
jun. 13. •3 1174-1185 Jun. 15, 73 1226-127 0
"-- .Jun. 20, 73 1186-1204 4.5 Nov. 13,72 1264-1291 4.5 Jun. 28, 73 1232-1284 4:5 ,Ju1:3,73 1174-1251
Aug. 1,73 1227-1232 Aug. 7, 73 1199-1227 •Au•: 9,73 118,0-11,,99
15 Nov. 13, 72 1264-1291 12 Aug. 1,73 1231-1285
Au• 16,73 1174-1230 16 Nov, 8.• 73 1.177-i280
49 55 30 3O 37 39 20 30 20 16 18 21
47 41 56 56 49 53
66 6O 68 6O 6O
11 72
To Io
4.7 5.3 7.0 8.2 8.5 12 9.0 8.2 17
1.. Average Benkelman beam deflection. (1/1000 in.)
2. Average bending factor.
3o Average tMclmess index°
Note: 1/1000 in. 25.49am.
o o° •
< •,<•
• + +
-r
• + +
•
0
Z
0