by theodore f. buckwalter, clifford h. dodge, george r ...by theodore f. buckwalter, clifford h....
TRANSCRIPT

WATER RESOURCES OF THE CLARION RIVER AND REDBANK CREEK BASINS, NORTHWESTERN PENNSYLVANIA
By Theodore F. Buckwalter, Clifford H. Dodge, George R. Schiner, and Harry E. Koester
U. S. GEOLOGICAL SURVEY
Water-Resources Investigations Open-File Report 81-70
Prepared in cooperation with thePENNSYLVANIA DEPARTMENT OF ENVIRONMENTAL RESOURCES

UNITED STATES DEPARTMENT OF; THE INTERIOR
JAMES G. WATT, Secretary
GEOLOGICAL SURVEY
Dallas L. Peck, Director
For additional information write to:
U.S. Geological Survey Room 2204, Federal Building 1000 Liberty Avenue Pittsburgh, Pennsylvania 15222
Copies of this report can be purchased from:
Open-File Service Section Western Distribution Branch U.S. Geological Survey Box 25425, Federal Center Lakewood, Colorado 80225 Telephone: (303) 234-5888
CONTENTS
Page
Glossary vi.1.Conversion factors ' XIVA Wfi ^ » « » f* 4- MM ________________________________ ________ 1ADSL.La.CL. ±
Introduction 2Purpose and scope 2.Location and topography 3Climate jPopulation and culture 3Water use Q
Geology Qfeme*-*- r*i ___________________________________________________________ £vjcllci. d-L U
Stratigraphy oDevonian System o
Catsk.il 1 Formation 6Oswago Formation 6
Mississippian System ' 11Lower Mississippian Series, undifferentiated 11
Pennsylvanian System 11Pottsville Group j_j_Allegheny Group 11Conemaugh Group 12
Quaternary System 12L»olluvlum j_ _jAlluvium j__j
C ^ T*»* ft t~ »* V* *% ^~ l liMliM*Mi*Mi*Mi*Mi*Mi*Mi*Mi*Mi*Mi*Mi*Mi*MiliMliM«Mi 1 0OLLUL-LULc !£
Fractures
Joints 13Fracture traces 13
Mineral resources 13Surface-water hydrology 15
Low-flow frequency 19Flow duration 19iiase runoLL ---------------------------------------------------------------------------------------------------------------- j^i\Flooding 28Flood-prone area maps 28
T ._M ^ *~ ~* VtYTs4v*x^1 s^frw ^_^ __________________________«.______«.______________________...____...«.«.«.__________________«.__ OQwater nyaroiogy ^QRecharge, discharge, and movement 321,7 __ J_ -^ « 1 .-^ -I T _^_ 1 £ *^OWdLt: I. -Lc VC-L ID . . ........ ........ .... ................ ........ j^
III

CONTENTS (Continued)
I ' Pagei
Ground-water hydrology (continued)Availability of ground water 34
Specific capacities and well yields 34Geologic structure 41Topographic position 42Fractures and fracture traces I 42Regolith and alluvial aquifers ! 44Bedrock aquifers | 44
Lower Mississippian Series, undifferentiated 46Pottsville Group 46Allegheny Group 46Conemaugh Group 46
Water quality 46Quality of ground water 56
Data base 56Quality of water in aquifers [ 56Quality of water from flowing wells j 62Relation of topography to water quality 62Areal ground-water quality 64
Quality of surface water 66Data base i 66Chemical characteristics 70Areal water quality 74
Clarion River basin water-quality assessment 74Redbank Creek basin water-quality assessment 99
Aquatic biology 101Introduction 101Data base 101Methods 101Results and discussion 102
Conclusions 103Selected references 106
ILLUSTRATIONS
[Plate is in pocke^:]I
Plate 1. Bedrock geologic map of the Clarion River and Redbank Creekbasins, northwestern Pennsylvania
IV

ILLUSTRATIONS ( Continued)
Page
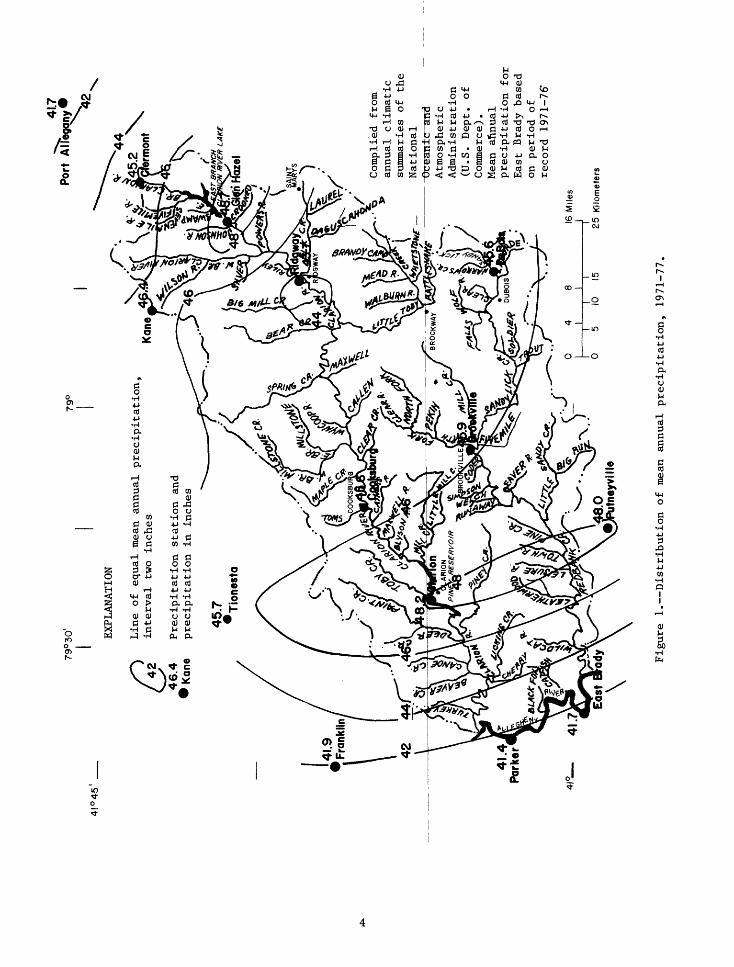
Figure 1. Map showing distribution of mean annual precipitation,1971-77 4
2. Annual coal production for Clarion, Elk, and JeffersonCounties for 1945-76, inclusive 14
3. Location of stream-gaging stations 16
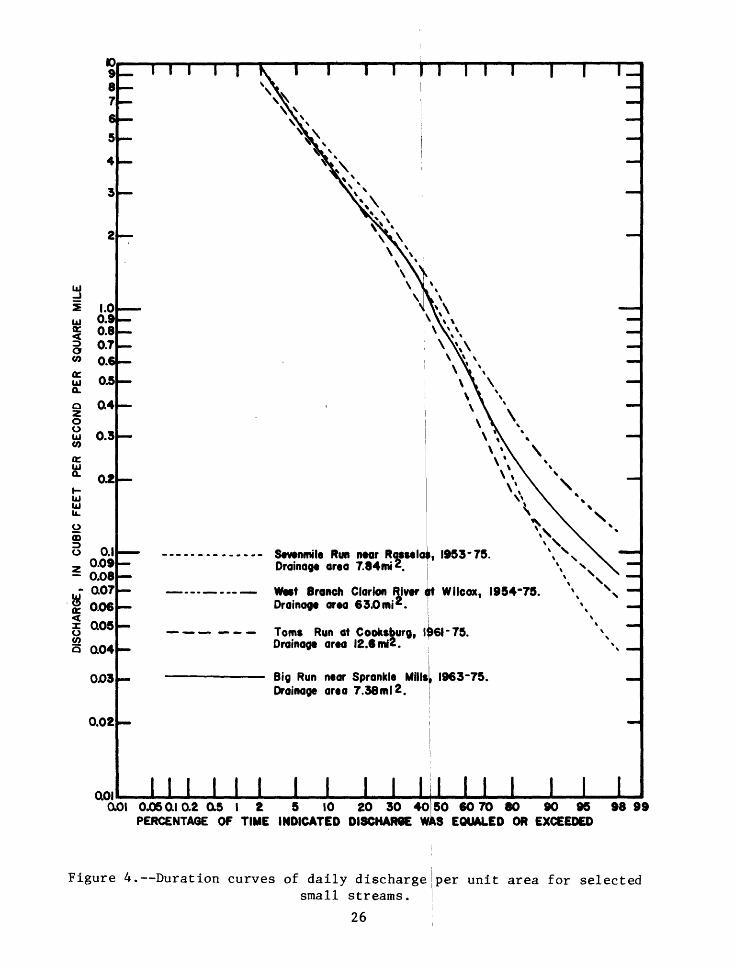
4. Duration curves of daily discharge per unit area forselected small streams 26
5. Duration curves of daily discharge per unit area forselected mainstream gages 27
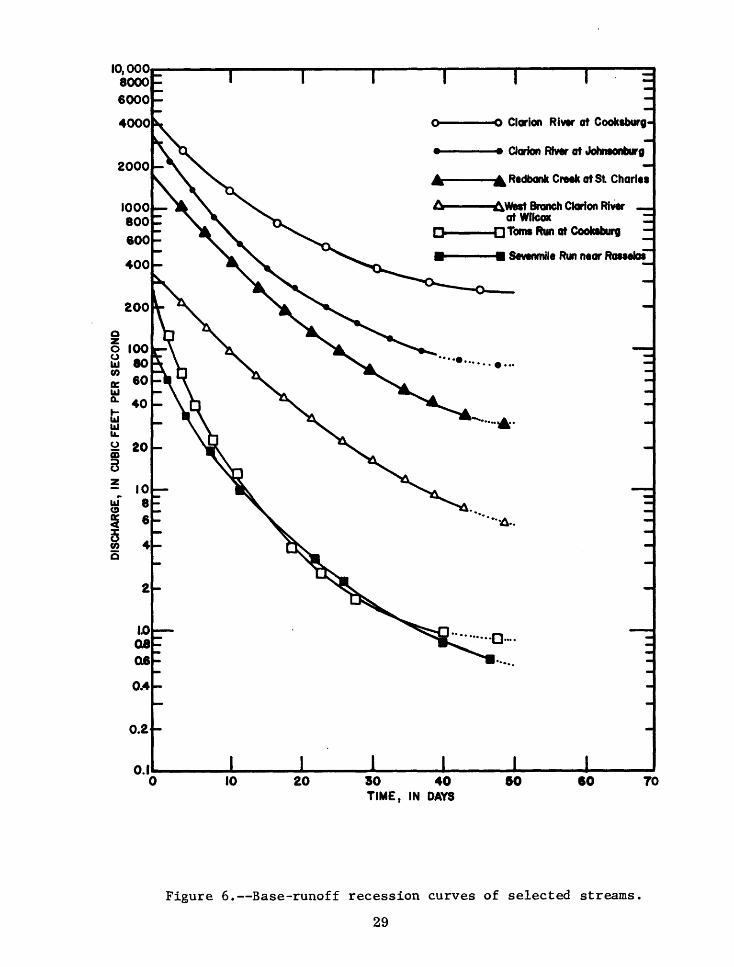
6. Base-runoff recession curves of selected streams 297. Index to flood-prone area maps, 1978 31
8. Sketch showing generalized directions of ground-watermovement in a multiaquifer system 33
9. Frequency distribution of specific capacities in fourbedrock units 45
10. Location of selected surface-water stations 6711. Variation of specific conductance with instantaneous
discharge in two streams having small drainage areas 7112. Variation of specific conductance with instantaneous
discharge in two streams having large drainage areas - 7213. Water analysis diagram showing percent composition of
chemical constituents of surface waters 7314. Stream quality of the Clarion River and Redbank Creek basins - 7515. Areal variation of specific conductance in surface-water
samples 7616. Areal variation of iron concentrations in surface-water
samples 77
17. Areal variation of sulfate concentrations in surface-watersamples 78
18. Areal variation of alkalinity concentrations in surface- water samples 79
19. Areal variation of nitrate concentrations in surface- water samples 80
20. Relation of daily sediment discharge to streamflow at Cooksburg on the Clarion River and St. Charles on the Redbank Creek 98
TABLES
Page
Table 1. Percentage distribution of land use 52. Public water supplies j 73. Composite stratigraphic section ) 104. Continuous streamflow stations j 175. Selected information for East Branch Clarion River Lake
and Piney Reservoir 186. Average monthly precipitation and streamflow for the
Clarion River and Redbank Creek basins, 1971-75 207. Magnitude and frequency of annual low flow 218. Annual low-flow frequency of four uigaged streams 239. Duration of daily discharge 2510. Magnitude of annual peak discharges at selected gaging
stations 30 11-13. Summary of data on yield, specific Rapacity, well depth,
and depth to water of:11. Domestic wells 35,12. Nondomestic wells I- 3713. All wells 39
14. Summary of data on yield and specific capacity of bedrockwells by topographic position 43
15. Guide to water-quality data in the Clarion River andRedbank Creek basins * 48
16. Source and significance of constituents and properties ofground water and surface water 51
17. Federal mandatory and recommended limits for selectedcontaminants of drinking water for public supply systems 53
18. Selected water-quality criteria for Pennsylvania 5419. Major effects of selected types of contamination 5520. Summary statistics of laboratory analyses of selected
quality characteristics of water in the aquifers 57 21-23. Summary statistics of field analyse^ of hardness, specific
conductance, and pH of: I21. Water in selected aquifers 5922. Water from wells in hilltop, hillside, and
valley topographies 6323. Water from wells in the (tlarion River and
Redbank Creek basins 6524. Selected data-collection sites 6825. Range and mean values of chemical analyses of surface water 8126. Mean values of selected chemical constituents for
sampling stations on the Clarion River, 1962-75 9327. Dissolved oxygen in the Clarion Rivex basin, January 10, 1973 - 9628. Diversity indices for selected aquatic invertebrate samples 104
VI

GLOSSARY
Acidity. The capacity of a water for neutralizing a basic solution.Acidity, as used in this report, is primarily caused by the presence of hydrogen ions produced by hydrolysis of the salts of strong acids and weak bases.
Alkalinity. The capacity of a water for neutralizing an acid solution. Alkalinity in natural water is caused primarily by the presence of carbonate and bicarbonate.
Alluvium. Sand, gravel, or other similar particle material deposited by running water.
Annual mean. For ground water, the arithmetic average of the monthly means for a given year.
Anticline. An upfold or arch of stratified rock in which the beds dip in opposite directions from the crest.
Aquifer. A formation, group of formations, or part of a formation thatcontains sufficient saturated permeable material to yield significant quantities of water to wells and springs.
Base flow. Discharge entering stream channels as effluent from the ground-water reservoir; the fair-weather flow of streams.
Bedding. Layers of sedimentary rocks of the same or different lithology.
Bedrock. A general term for the rock, generally solid, that underliessoil or other unconsolidated or semiconsolidated surficial material.
Benthic invertebrate. An animal without a backbone living in or on the bottom of an aquatic environment.
Benthic region. The bottom of a body of water.
Bilogical community. All the plant and animal populations living together in a habitat and functioning as a unit by virtue of food and other relationships.
Clean-water association. An association of organisms, generally characterized by many different kinds (species). The associations occur in unpolluted environments. Because of competition, predation, and other factors, however, relatively few individuals represent any particular species.
VII

GLOSSARY Cont inued
Colluvium. Loose and incoherent deposits of rock debris generally found at the foot of a slope and brought there chiefly by gravity.
Contamination. The state of being unfit, impure, or unclean for use by the introduction of undesirable elements,
Cubic feet per second (ft 3/s). The rate of discharge representing a volume of 1 cubic foot passing a given point during 1 second (equivalent to 7.48 gallons per second or 44S.S gallons per minute).
Cubic feet per second per square mile [(ft3 /s]i/nd-2J« The average number of cubic feet of water per second flowing from each square mile of area drained by a stream, assuming that the runoff is distributed uniformly, in time and area.
Dip. The angle or rate of drop at which a layer of rock is inclined from the horizontal.
Direct runoff. The water that moves over the land surface directly tostreams promptly after rainfall or snowmelt.
IDischarge. The volume of water (jor more broadly, volume of fluid including
dissolved minerals and suspended sediment) that passes a given point within a given period of time. ;
Dissolved solids. The dissolved mineral constituents in water; they formthe residue after evaporation and drying at a temperature of 180° Celsius; they may also be calculated by adding concentrations of anions and cations,
Drainage basin* A part of the surface of the earth that is occupied by a drainage system, which consists of a stream or a body of impounded water, together with all tributary streams and bodies of impounded water. j
IDrawdown. The lowering of the water table or fcotentiometric surface caused
by pumping (or artesian flow) of a well. ]
Duration curve. (.See flow-duration curve).
Evapotranspiration. Evaporation of water from transpiration by vegetation.
land and water surfaces plus
Fault. A fracture or fracture zone along whict( the sides have been displaced relative to each other.
Flood. Any relatively high streamflow overtoppjing the natural or artificial banks in any reach of a stream.
vra
GLOSSARY Continued
Flow-duration curve. A cumulative frequency curve that shows the percentage of time that specified discharges are equaled or exceeded.
Fold. A bend or flexure produced in rock strata by forces operating after deposition of the rock.
Fold axis. A continuous line on a folded surface formed by connecting points of maximum curvature on that surface.
Formation. The fundamental unit in rock-stratigraphic classification. It is a body of internal homogeneous rock; it is prevailingly but not necessarily tabular and is mappable at the earth's surface or traceable in the subsurface.
Fracture. A general term for any break in rock due to mechanical failure by stress, including cracks, joints, and faults.
Gaging station. A particular site on a stream, canal, lake, or reservoir where water level or discharge is observed systematically.
Ground water. That part of the subsurface water in the zone of saturation.
Ground-water discharge. Release of water in springs, seeps, or wells from the ground-water reservoir.
Ground-water recharge. Addition of water to the ground-water reservoir by infiltrating precipitation or seepage' from a streambed.
Ground-water reservoir. See aquifer.
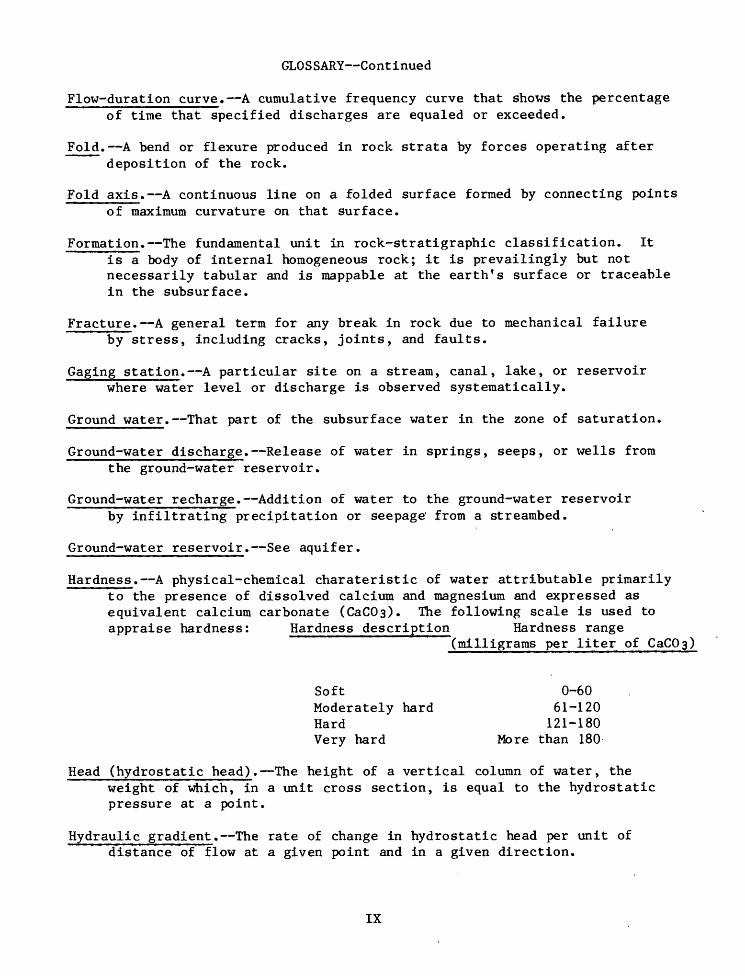
Hardness. A physical-chemical charateristic of water attributable primarily to the presence of dissolved calcium and magnesium and expressed as equivalent calcium carbonate (CaCOa). The following scale is used to appraise hardness: Hardness description Hardness range
(milligrams per liter of
Soft 0-60Moderately hard 61-120Hard 121-180Very hard More than 180
Head (hydrostatic head). The height of a vertical column of water, theweight of which, in a unit cross section, is equal to the hydrostatic pressure at a point.
Hydraulic gradient. The rate of change in hydrostatic head per unit of distance of flow at a given point and in a given direction.
IX

GLOSSARY Continued ji
Invertebrate. An animal without a backbone. (Common examples include worms, insects, snails, and crayfish.
Joint. A fracture in a rock, generally more or less vertical, along which no movement has taken place.
I
Lithology. The physical characteristics of a tock, generally as determined by examination with the naked eye or with the aid of a low-power magnifier.
Low-flow frequency curve. A graph showing theimagnitude and frequency of minimum flows for a period of given length. Frequency is generally expressed as the average interval, in years, between recurrences of an annual minimum flow equal to or less than|shown by the magnitude scale.
Macroinvertebrate. An invertebrate, in this report, generally a benthicorganism, that is retained on a U.S. Stanc ard No. 30 sieve (0.595-rnin mesh opening).
Marker bed. A bed that is distinctive enough t:o make it easily identifiable over a wide area. Marker beds, such as ccal beds, are commonly used as boundaries for a formation. j
iMicrograms per liter (yg/L). A unit for expressing the concentration of
chemical constituents in solution. It represents the mass of solute per unit volume of solution. One thousand micrograms per liter are equal to one milligram per liter.
Milligrams per liter (mg/L). A unit for expre! sing the concentration ofchemical constituents in solution. It represents the mass of solute per unit volume of solution. i
Mine drainage. Surface-water and ground-water containing a high concentration of acidic sulfate.
drainage from coal mines sulfates, especially ferrous
Monthly mean. For ground water, the arithmetic! average of the daily low water levels for a given month. !
Nutrients. Nitrate and phosphate; needed for plant or animal growth.
Observation well. A well in which periodic measurements of water level orwater quality are made.
i Permeability. The capacity of a porous rock, sediment, or soil to transmit
a fluid under a hydraulic head; it is a measure of the relative ease offluid flow under unequal pressure. t
X

GLOSSARY Continued
pH. A measure of the acidity or alkalinity of water. A pH of 7.0 indicates a neutral condition. An acid solution has a pH less than 7.0, and a basic or alkaline solution has a pH more than 7.0.
Plunge. The angle or inclination between a fold axis and its horizontal projection measured in a vertical plane.
Porosity. The ratio of the aggregate volume of open spaces in a rock or soil to its total volume. It is usually stated as a percentage.
Primary productivity. The rate at which radiant energy is stored by photo- synthetic and chemosynthetic activity of producer organisms (chiefly green plants) in the form of organic substances which can be used as food materials.
Recharge, ground water. The process by which water is added to the zone of saturation, also, the quantity of water added.
Recurrence interval. The average interval of time, in years, within which the given discharge will be equaled or exceeded once. The reciprocal of the recurrence interval is the probability of occurrence during any year.
Regolith. The unconsolidated to semiconsolidated residual mantle of weathered rock material, including the soil profile, that lies between land surface and the unweathered bedrock.
Regulation. The manipulation of the flow of a stream.
Reported well yield. The short-term yield of a well as reported by well drillers.
Runoff. That part of the precipitation that appears in streams. It isthe same as streamflow unaffected by diversions, storage, or otherworks of man in or on the stream channels.
Saturation, zone of. The zone in which interconnected interstices aresaturated with water under pressure equal to or greater than atmospheric.
Sediment. Fragmental material that originates mostly from rocks and is transported by, suspended in, or deposited from water or air.
Sediment discharge. The rate at which sediment passes a section of a stream, usually expressed in tons per day.
Sedimentary rocks. Rocks formed from sediments.
XI
GLOSSARY Continued
Soil tonal alinements. The arrangements of s in a particular direction on an aerial similarity in the properties of the soil,,
milar tones or shades of color photograph probably due to a
Specific capacity. The well yield divided by[the drawdown (pumping water level minus static water level) necessari to produce this yield. Itis usually expressed as gallons per minutjie per foot [(gal/min)ft].
i
Specific conductance. A measure of the capacity of a water to conduct an electrical current. It is expressed in iiicromhos per centimeter at 25°C. Specific conductance is related to the type and concentration of ions in solution and can be used for approximating the dissolved solids content of the water. Commonly, the concentration of dissolved solids (in milligrams per liter) is about 65 percent of the specific conductance (in micromhos).
Static water level. The depth to water in a tjrell that is not being affected by withdrawal of ground water. j
Strata. Sedimentary beds or layers, regardlesjs of thickness.i
Stream gage. An instrument that measures the stage or water level ofa stream. These stream water levels can (be converted into corresponding streaniflow through the use of a rating cujrve.
i
Stream-gaging station. A gaging station where stream is obtained. Within the U.S. used only for those gaging stations where discharge is obtained.
a record of discharge of a Geological Survey, this term is
a continuous record of
Structure. The sum of the features produced in deposition and commonly after consolidation
rocks by movement after of the rock.
the earth. Surface water is and ground-water discharge,
arcent overland runoff during zent ground-water discharge
Surface water. That water on the surface ofgenerally a combination of overland runoff the proportions ranging from almost 100 p periods of high-intensity rain to 100 per during periods of little or no rain.
Syncline. A downfold or depression of stratifjLed rock in which the bedsdip inward toward the axis of the fold.
tTaxon. Any classification category of organises, such as phylum, class,
order, family, genus, or species. j
Taxonomy. The division of biology concerned with the classification and naming of organisms.
Tons per days. A unit for expressing the weight, in tons, of a substancein solution or suspension that passes a stream section during a 24-hour period.
XII
GLOSSARY Continued
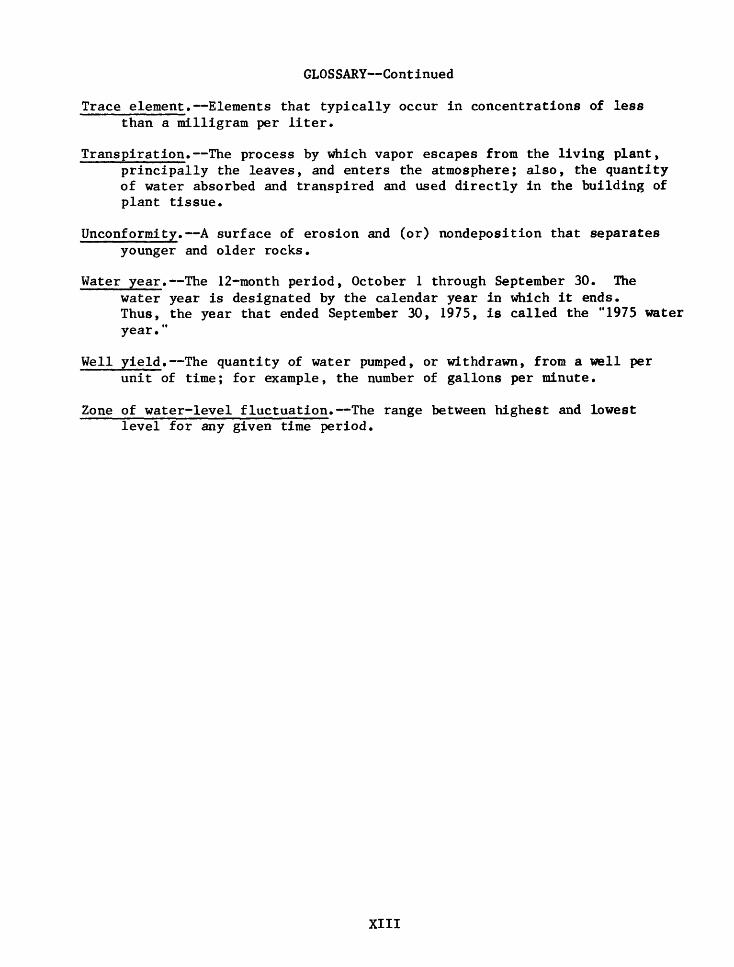
Trace element. Elements that typically occur in concentrations of less than a milligram per liter.
Transpiration. The process by which vapor escapes from the living plant, principally the leaves, and enters the atmosphere; also, the quantity of water absorbed and transpired and used directly in the building of plant tissue.
Unconformity. A surface of erosion and (or) nondeposition that separates younger and older rocks.
Water year. The 12-month period, October 1 through September 30. The water year is designated by the calendar year in which it ends. Thus, the year that ended September 30, 1975, is called the "1975 water year."
Well yield. The quantity of water pumped, or withdrawn, from a well per unit of time; for example, the number of gallons per minute.
Zone of water-level fluctuation. The range between highest and lowest level for any given time period.
XIII

CONVERSION FACTORS FACTORS FOR CONVERTING INCH-POUND UNITS TO INTERNATIONAL SYSTEM (SI) UNITS
Multipy inch-pound units Bjr To obtain SI units
acres 0.4047 acre-feet (acre-ft) 0.001233 barrels (bbl), (petroleum, 0.15901 bbl - 42 gal)
cubic feet per second (ft 3/s) 0.2832 cubic feet per second per 0.0193square mile [(ft 3/s)/mi 2 )
feet (ft) 0.3048 gallons (gal) 3.785 gallons per day (gal/d) 3.785 gallons per minute (gal/min) 0.06309 gallons per minute per foot 0.3070[(gal/min)/ft]
grains per gallon (gr/gal) 17.1 inches (in.) 2.54 micromhos (pmho) 1.0 miles (mi) 1.609 million gallons (Mgal) 3785 million gallons per day 3785(Mgal/d)
square miles (mi 2 ) 2.590 tons (short) 0.9072
square hectometers (hm2 ) cubic hectometers (hm2 ) cubic meters (m 3 )
cubic meters per second (m 3/s) cubic meters per second persquare kilometer [(m3/s)/km2)
meters (m) liters (L)liters per day (L/d) liters per second (L/s) liters per second per meter
milligrams per liter (mg/L)centimeters (cm)microsiemeus (liS)kilometers (km)cubic meters (m3 )cubic meters per day (m 3/d)
square kilometers (km2 ) metric tons or tonnes (t)
Equations for temperature conversion for degrees Celsius (°C) and degrees Fahrenheit (°F):
°COF 5/9 (°F-32^
(9/5°C) + 32
XIV

WATER RESOURCES OF THE CLARION RIVER AND REDBANK CREEK BASINS, NORTHWESTERN PENNSYLVANIA
By Theodore F. Buckwalter, Clifford H. Dodge, George R. Schiner and Harry E. Koester
ABSTRACT
The Clarion River and Redbank Creek basin occupy 1,280 and 545 square miles, respectively, in northwestern Pennsylvania. The area is mostly in Clarion, Elk, and Jefferson Counties and is approximately 70 miles long and 30 miles wide. All drainage is to the Allegheny River.
Sedimentary rocks of Late Devonian, Early Mississippian, and Pennsylvanian age underlie the area. P^ocks of Late Devonian age underlie the entire area and crop out in the deep stream valleys in the north. Lower Mississippian rocks generally crop out in strips' along major stream valleys; the strips are narrow in the south and broaden northward. Pennsylvanian rocks cover most of the interfluvial areas between major streams. The Upper Devonian and Lower Mississippian rocks are composed mostly of alternating sandstone and shale. Sandstone may intertongue laterally with shale. The Pennsylvanian rocks are more heterogeneous and contain many commercial coal beds.
The major mineral resources are bituminous coal, petroleum, and natural gas. Nearly all coal production is from strip mining in Clarion, Elk, and Jefferson Counties. Total coal production exceeded 8 million short tons in 1976. The basins are south and east of the major oil-producing regions in Pennsylvania, but more than 50,000 barrels of crude oil were produced here in 1975. Commercial quantities of natural gas are also obtained.
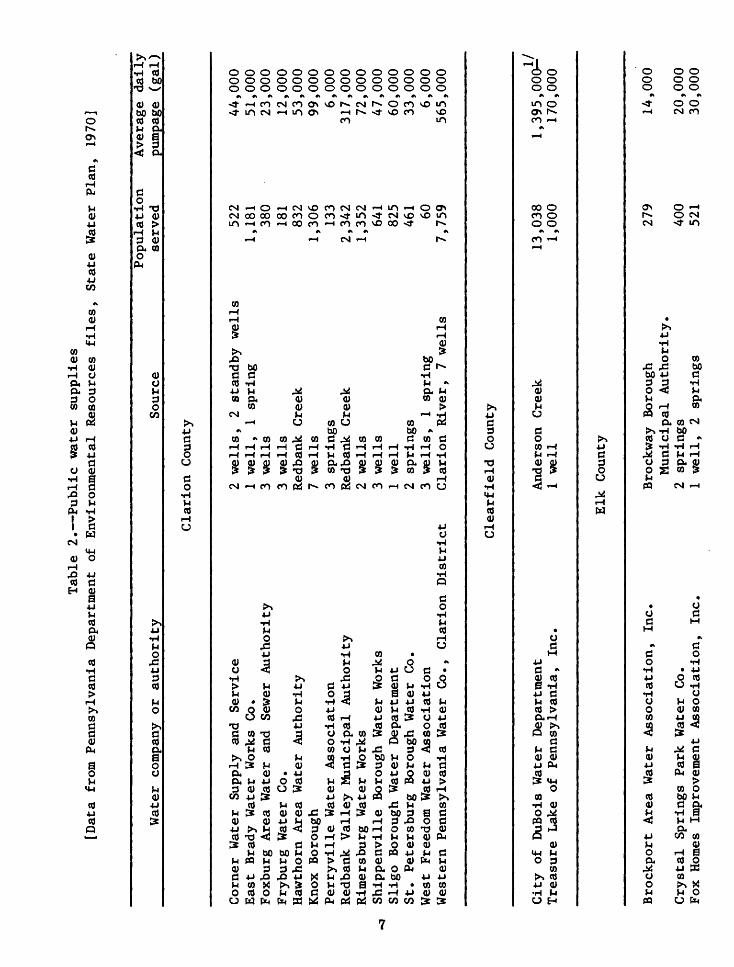
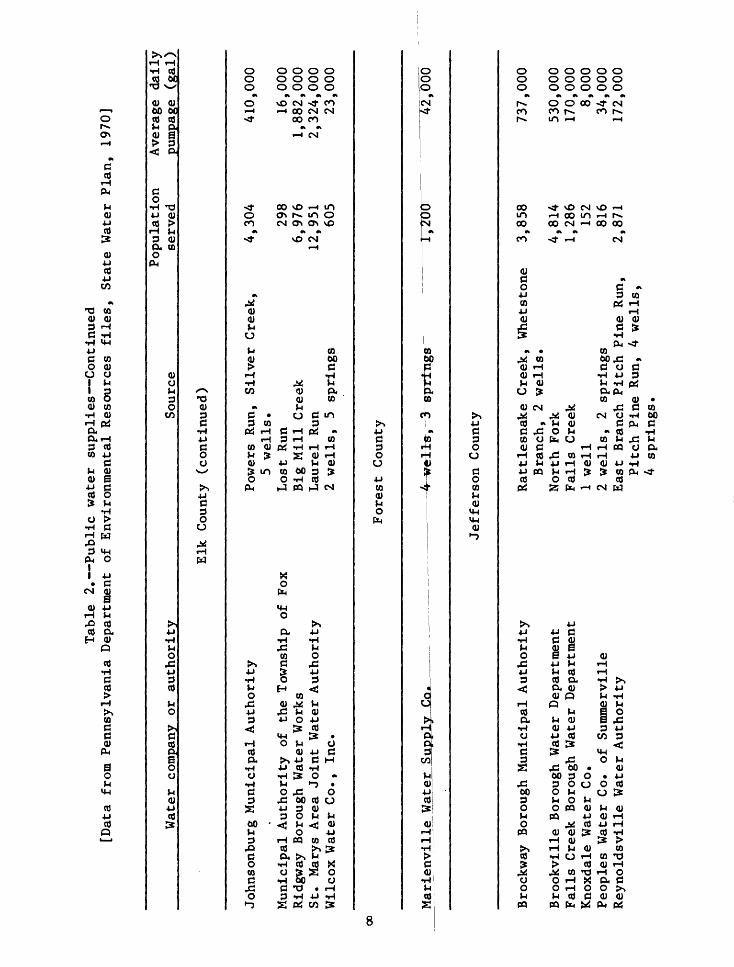
Thirty-three public water-supply systems furnish about two-thirds of the water for domestic use. Surface water is the source of about 90 percent of public-supply water. The remainder is from wells and springs.
In an average year, 64 percent of the precipitation in the Clarion River basin and 60 percent in the Redbank Creek basin leave the area as streamflow. The percentage of annual discharge from each basin that is base runoff averaged 53 and 51 percent, respectively, during 1972-75. Only 4 of 10 stream-gaging stations recorded an average 10-year 7-consecutive-day low flow of at least 0.15 cubic feet per second per square mile.
Most wells are completed in bedrock. Yields of bedrock wells are affected mostly by rock type, type of overburden, topography, depth of water-bearing zones, and by the rate and duration of pumping. Water in the bedrock occurs chiefly along fractures and bedding planes. Most wells get water from several zones. Yielding zones occur less frequently as depth increases, but are reported as much as 400 feet below land surface. Optimum well depth is about 350 feet.

Well yields range from less than 1 to more than 550 gallons per minute. The best bedrock aquifers are the Lower Mississippian rocks, which have a median specific capacity of 4.3 gallons per minute per foot of drawdown com pared to medians between 0.38 and 0.67 in the Cofieraaugh, Allegheny, and Pottsville Groups.
The maj or water-quality problems are due to high concentrations of iron, manganese, hardness, and acidity. Some of these problems are related to coal mining that has degraded water quality iifi parts of Clarion, Clearfield, Elk, and Jefferson Counties. Water-quality problems result from the rock composition. Many streams have low alkalinity concentrations and,consequently, have little capacity to neutralize the acid water from coalmines. Large forested areas, with little development, in Elk, Forest, and Jefferson Counties, have good quality water. The; water from over three- quarters of the t>edrock wells sampled has dissolved-solids concentrations less than 250 milligrams per liter. Water from aquifers of Pennsylvanian age is generally lower in dissolved solids than 1:hat from Lower Mississippian aquifers. Salt water is not a problem, except locally in Devonian rocks.
Water from wells on hilltops is generally of better quality than that from wells in valleys (median dissolved solids 1AO versus 340 milligrams per liter). In many valleys in Clarion and Jeffersoii Counties, old abandoned flowing oil and gas wells contribute highly mineralized water to streams. Iron concentrations from these wells may be as imich as 100 milligrams per liter and dissolved solids commonly exceed 1,500[milligrams per liter.
A large variety of aquatic invertebrates, mojstly insects, inhabit the clean-water streams. In many other streams, the [aquatic invertebrate popu lations have been eliminated or drastically reducjed because of exposure to mine drainage.
INTRODUCTION
Purpose and Scope j
This report describes and evaluates the water resources of the Clarion River and Redbank Creek basins in northwestern Pennsylvania. Special emphasis is placed on water quality as effected by coal mining and by rock composition. This appraisal should provide information needed for the orderly management and development of the water resources. I
This is the third of three reports on the ar^a by the U.S. Geological Survey in cooperation with the Pennsylvania Department of Environmental Re sources, Office of Resources Management, and Bureaus of Water Quality Management and Topographic and Geologic Survey. The first two reports (Koester and Lescinsky, 1976; Buckwalter and others, 1979) were compilations of hydrologic data and provide much of the information used for interpretation in this report. I

Location and Topographyf\
The study area is in northwestern Pennsylvania and includes 1,850 mi^ (see cover). It is 70 mi long and 30 mi wide and extends over parts of seven counties. The Clarion River and Redbank Creek basins include 1,280 and 545 mi2 , respectively. An area of 25 mi2 lies between the two basins. All drainage is to the Allegheny River.
The basins lie entirely in the nonglaciated region of the Allegheny Plateaus. The topography is characterized by rounded hills, steep-sided valleys, and some flat upland. Flood plains are generally narrow and dis continuous.
Climate
Winters are cold and summers mild. December, January, and February temperatures average below freezing. Temperatures in July and August average about 70°F and may exceed 90°F for 5 to 10 days each year. The frost-free season averages 160 days a year at East Brady in the southwest and 80 days at Clermont in the northeast.
Precipitation is fairly evenly distributed throughout the year, though
winter precipitation is usually 3 or 4 in. less than summer rainfall. Figure 1 shows the distribution of mean annual precipitation during 1971-77.
Population and Culture
The population is about 126,000 or 70 per square mile. (From data of the U.S. Bureau of Census, 1971.) Approximately 64 percent of the population live in communities of more than 500. The population decreased slightly during the 1960 f s, but the Pennsylvania Department of Commerce (1975) predicts a slight increase for the 1970-80 period because of the recent completion of Interstate Highway 80 and the anticipated expansion of activities concerned with the extraction of coal, gas, and oil for energy needs.
A large part of the area is forested; most of the remainder is classified agricultural. Table 1 gives the percentage distribution of land use in the categories of forests, agriculture, urban areas, and strip mines.
Mining, lumbering, and oil and gas extraction are the mainstays of the economy, but agriculture and manufacturing are also important. Hunting, fishing, and camping are seasonally important in some areas. In places, the seasonal recreational population commonly exceeds the permanent population.
79°3
0'
79
°
4I°
45
' __
\
4I7
Por
t A
lTe
go
ny*
42
G 46.4
&
Kan
e
EXPLANATION
Line
of
equal mean annual pr
ecip
itat
ion,
in
terval two
inches
Precipitation
stat
ion
and
prec
ipit
atio
n in inches
Complied fr
om
annual cl
imat
ic
summaries
of the
Nati
onal
Oc
eani
c and
Atmospheric
Admi
nist
rati
on
(U.S
. De
pt.
of
Commerce).
Mean
an
nual
precipitation
for
East
Br
ady
base
d on
period of
record 1971-76*
16 M
iles
10
1525
Kilo
met
ers
Fig
ure
1. D
istr
ibuti
on of
mea
n an
nual
p
recip
itati
on
, 1
97
1-7
7.

Table 1. Percentage distribution of land use
County
Armstrong
Clarion
Clearfield
Elk
Forest
Jefferson
McKean
Total
Square mile
26
541
65
529
101
512
__ 76_
1,850
Area
Percentage of total
1.4
29.2
3.5
28.6
5.5
27.7
4.1
100.0
Percentage distribution
Forests
53
62
54
90
92
68
93
Agriculture-^-/
37
24
12
4.9
6.0
19
5.5
of land
Urban^/ areas
7.7
6.5
24
3.7
2.0
7.5
1.2
use
Strip mines
2.3
7.5
10
1.4
.0
5.5
.3
Includes open area, crop land, and pasture,
21 Includes right-of-way, roads, and highways,

Water Use
Both surface water and ground water are used for supply. Thirty-three public water-supply systems furnish about twofthirds of the water for domestic use. The other third is from privately owned wells and springs. The total average daily pumpage for all public supplies is approximately 10 Mgal, nearly 1.4 Mgal of which is imported from outride the area. The total average daily pumpage for all private supplied, assuming an average use per person of 50 gal/d, is estimated at 2 Mgal. }3urface water is the source of about 90 percent of all public-supply water. The other 10 percent is from wells and springs. Data on public-supply facilities are given in table 2.
An average household can be supplied by a well that is pumped on demand at 3 gal/min. A well yield of 1 gal/min may also suffice, if adequate storage is available and water is conserved. Two wells that each yield 25 gal/min may be adequate to supply 125 homes, assuming 500 gal/d per family, if storage is sufficient and a standby for emergencies is dependable.
j GEOLOGY
General
Sedimentary rocks of Late Devonian, Early Mississippian, and Pennsylvanian age underlie the area (plate 1). A composite stratigraphic section is presented in table 3. The stratigraphic nomenclature in this report gen erally follows the usage of the Pennsylvania Topographic and Geologic Survey.
Stratigraphy ,
Catskill Formation
Devonian System
The Catskill Formation is composed of nonmarine greenish-gray shale and siltstone with thick present. The proportion of red clastic rocks formation is equivalent to the marine Venango and Venango Counties. The Catskill Formation in the east-central part.
Oswayo Formation
red, grayish-red, and sandstone interbeds locally decreases westward. This Formation of Crawford, Erie, crops out only in one valley
The Oswayo Formation is composed of interbedded greenish-gray to gray shale, siltstone, and sandstone and becomes increasingly shaly westward. It is equivalent to the Riceville Formation of Crawford, Erie, and Venango Counties. The Oswayo Formation crops out alonjg streams in the deep valleys in the north, but is not differentiated in plate 1.
Tabl
e 2. Public w
ater supplies
[Dat
a from Pennsylvania
Depa
rtme
nt of
En
viro
nmen
tal
Reso
urce
s fi
les,
St
ate
Water
Plan
, 1970]
Wate
r co
mpan
y or
authority
Source
Popu
lati
on
serv
edAverage
dail
y pu
mpag
e (gal)
Clarion
Coun
ty
Corner W
ater
Supply an
d Se
rvic
eEa
st Brady
Water
Work
s Co
.Fo
xbur
g Area W
ater
and
Sewer
Authority
Fryb
urg
Water
Co.
Hawthorn A
rea
Water
Authority
Knox
Bo
roug
hPerr
yvil
le Water
Asso
ciat
ion
Redbank
Valley M
unicipal Authority
Rimersburg Wate
r Works
Shippenville Borough
Wate
r Works
Slig
o Bo
roug
h Water
Depa
rtme
ntSt
. Petersburg Borough
Wate
r Co
.West Fr
eedo
m Wa
ter
Asso
ciat
ion
West
ern
Penn
sylv
ania
Wat
er Co., Cl
ario
n District
2 we
lls,
2 standby
wells
1 well,
1 spring
3 we
lls
3 we
lls
Redbank
Cree
k7 wells
3 sp
ring
sRe
dban
k Cr
eek
2 wells
3 wells
1 we
ll2
spri
ngs
3 wells,
1 spring
Clar
ion
River, 7 wells
522
1,181
380
181
832
1,30
6133
2,342
1,35
264
182
546
1 607,759
44,0
0051,000
23,000
12,0
0053
,000
99,0
006,
000
317,000
72,0
0047
,000
60,0
0033
,000
6,00
0565,000
Clea
rfie
ld Co
unty
City of
Du
Bois
Wa
ter
Depa
rtme
nt
Trea
sure
La
ke of
Pe
nnsy
lvan
ia,
Inc.
Anderson Cr
eek
1 we
ll13
,038
1,00
01,395,000^
170,
000
Elk
County
Brockport
Area W
ater
As
soci
atio
n, Inc.
Crys
tal
Springs
Park
Wat
er Co
.Fo
x Homes
Improvement
Asso
ciat
ion,
Inc.
Broc
kway
Bo
roug
hMu
nici
pal
Authority,
2 sp
ring
s 1 well,
2 sp
ring
s
279
400
521
14,0
00
20,0
0030
,000
Tabl
e 2. Public wa
ter
supp
lies
Con
tinu
ed
[Dat
a fr
om P
ennsylvania
Department of
Environmental
Reso
urce
s fi
les,
State
Wate
r Plan,
1970
]
Wate
r co
mpan
y or
au
thor
ity
Source
Popu
lati
on
served
Aver
age
daily
pump
age
(gal
)
Elk
Coun
ty (c
onti
nued
)
John
sonb
urg Municipal Au
thor
ity
Municipal Au
thor
ity
of the Township of
Fo
x Ri
dgwa
y Bo
roug
h Water Works
St.
Marys Area Jo
int
Wate
r Au
thor
ity
Wilcox Wat
er C
o.,
Inc.
Powe
rs Run, Silver C
reek
, 4,
304
5 we
lls.
Lost
Run
298
Big Mill Cr
eek
6,97
6 La
urel
Run
12,9
51
2 we
lls,
5
spri
ngs
605
410,
000
16,000
1,88
2,00
02,324,000
23,0
00
00
Fore
st County
Mari
envi
lle
17200^
^2,000
Jeff
erso
n Co
unty
Broc
kway
Bo
roug
h Mu
nici
pal Au
thor
ity
Broo
kvil
le Borough
Wate
r Department
Falls
Creek
Borough Water
Department
Knox
dale
Water C
o.
Peop
les
Wate
r Co.
of Su
mmer
vill
e Re
ynol
dsvi
lle
Wate
r Authority
Rattlesnake
Creek, Wh
etston
e 3,858
Bran
ch,
2 wells.
North
Fork
4,
814
Fall
s Cr
eek
1,286
1 well
152
2 we
lls,
2
springs
816
East Br
anch
Pi
tch
Pine R
un,
2,87
1Pitch
Pine R
un,
4 wells,
4 sp
ring
s.
737,
000
530,000
170,000
8,000
34,0
00172,000

Tabl
e 2. Public w
ater su
ppli
es C
onti
nued
[Data
from P
enns
ylva
nia
Depa
rtme
nt of
En
viro
nmen
tal
Reso
urce
s fi
les,
State
Water
Plan,
1970]
Wate
r co
mpan
y or
authority
Population
Average
daily
Source___________served____pumpage (g
al)
McKe
an Co
unty
Western
Penn
sylvan
ia Water Co., Mo
unt
Jewe
tt
Dist
rict
.4
well
s, 4
spri
ngs
1,000
70,000
All water
is im
port
ed from outside
the
study
area.

Tab
le
3. C
om
posi
te st
rati
gra
phic
se
ctio
n
System
Series,
group
or formation
Maxi
mum
thic
knes
s(f
t)Li
thol
ogy
Water-bearing
characteristics
Quat
erna
ryAlluvium
0 -
70+
Unconsolidated,
heterogeneous
deposits of
cl
ay,
sand
, gr
avel
, an
d bo
ulde
rs.
Yiel
ds of
we
lls
rang
e wi
dely
depending
on so
rtin
g and
thickness
of deposits.
Few
data available;
yiel
d could
probably ex
ceed
500
gal/
min.
____
____
____
____
____
__Co
lluv
ium
0 -
40+
Unco
nsol
idat
ed,
heterogeneous
depo
sits
of
si
lt,
sand,
gravel,
and
boul
ders
.
Yiel
ds of we
lls
probably sm
all,
da
ta available.
Few
Penn
sylv
ania
!!
Cone
maug
h Group
450
Sandstone, siltstone, shale, th
in
lime
ston
es,
thin coals, and
some
red
beds.
Yiel
ds of
we
lls
rang
e from 1
to
30 g
al/min.
Median y
ield
is
' 1
0 gal/min._______________
Allegheny
Group
300
- 325
Sandstone, siltstone, shale,
lime
ston
e (V
anpo
rt Limestone),
and
several
comm
erci
al coals.
Yields of we
lls
rang
e fr
om 0
to
254
gal/min.
Median y
ield
is
10 ga
l/mi
n.__
____
____
____
____
_Pottsvillp Gr
oup
___6
Q.--
=~2A
O-Cenerally-twe maggive
sandstones
separated
by sh
ale
and
coal
. Upper
sand
ston
e is
thin or
abse
nt locally._______________
Yields of wellsi "range
from
0 ^o
300
gal/min.
Median y
ield
is
10 gal/min.
Mississippian
Lowe
r Mi
ssis
sipp
ian
200
- 700
Series.
Sandstone, siltstone, shale, some
red
beds
, and
locally
flat-
pebb
le co
nglo
mera
te._
____
____
___
Yields of
we
lls
range
from 1
to
550
gal/
min.
Median y
ield
is
25 ga
l/mi
n.__
____
____
____
____
Devo
nian
Oswayo F
ormation
150
- 200
Interbedded
shale
and
sandstone.
Yiel
ds of we
lls
prob
ably
small.
No
data
available.
Catskill Formation
0 -
350
Red
to gr
ayis
h-re
d shale wi
th
some
sandstone.
Probably not
an aquifer.
Mississippian System
Lower Mississippian Series, undifferentiated
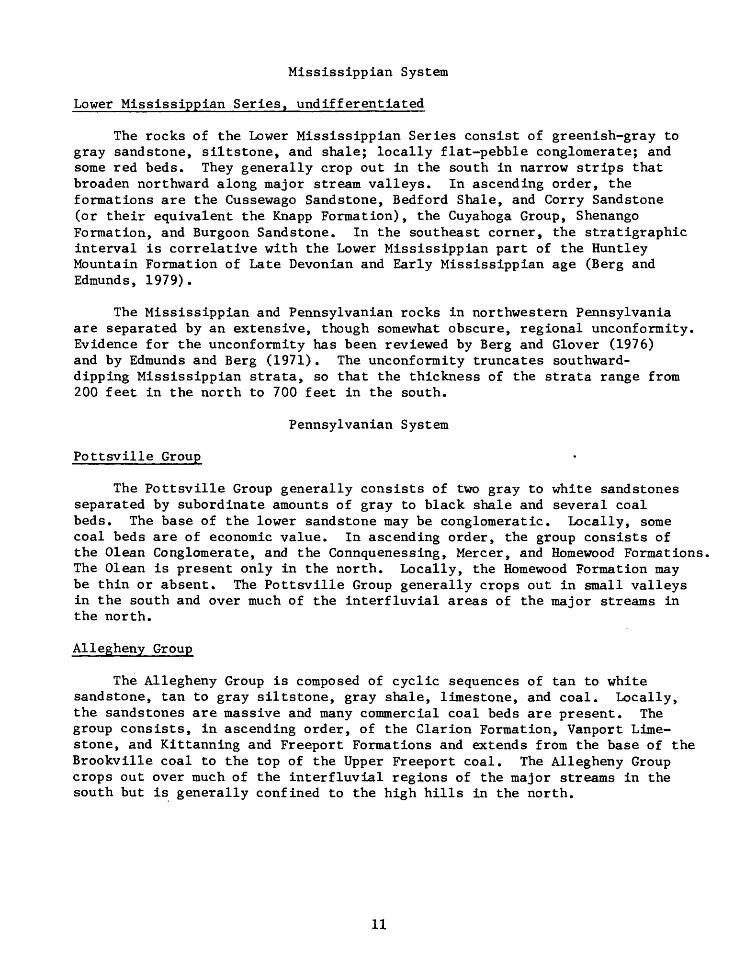
The rocks of the Lower Mississippian Series consist of greenish-gray to gray sandstone, siltstone, and shale; locally flat-pebble conglomerate; and some red beds. They generally crop out in the south in narrow strips that broaden northward along major stream valleys. In ascending order, the formations are the Cussewago Sandstone, Bedford Shale, and Corry Sandstone (or their equivalent the Knapp Formation), the Cuyahoga Group, Shenango Formation, and Burgoon Sandstone. In the southeast corner, the stratigraphic interval is correlative with the Lower Mississippian part of the Huntley Mountain Formation of Late Devonian and Early Mississippian age (Berg and Edmunds, 1979).
The Mississippian and Pennsylvanian rocks in northwestern Pennsylvania are separated by an extensive, though somewhat obscure, regional unconformity. Evidence for the unconformity has been reviewed by Berg and Glover (1976) and by Edmunds and Berg (1971). The unconformity truncates southward- dipping Mississippian strata, so that the thickness of the strata range from 200 feet in the north to 700 feet in the south.
Pennsylvanian System
Pottsville Group
The Pottsville Group generally consists of two gray to white sandstones separated by subordinate amounts of gray to black shale and several coal beds. The base of the lower sandstone may be conglomeratic. Locally, some coal beds are of economic value. In ascending order, the group consists of the Clean Conglomerate, and the Connquenessing, Mercer, and Homewood Formations, The Clean is present only in the north. Locally, the Homewood Formation may be thin or absent. The Pottsville Group generally crops out in small valleys in the south and over much of the interfluvial areas of the major streams in the north.
Allegheny Group
The Allegheny Group is composed of cyclic sequences of tan to white sandstone, tan to gray siltstone, gray shale, limestone, and coal. Locally, the sandstones are massive and many commercial coal beds are present. The group consists, in ascending order, of the Clarion Formation, Vanport Lime stone, and Kittanning and Freeport Formations and extends from the base of the Brookville coal to the top of the Upper Freeport coal. The Allegheny Group crops out over much of the interfluvial regions of the major streams in the south but is generally confined to the high hills in the north.
11
Conemaugh Group
The Conemaugh Group is composed of cyclic sequences of tan to white sandstone; tan to gray siltstone; red and gray shale; thin, fresh water limestone; and thin, nonpersistent coal. The sandstone may be massive to thin bedded. Locally, the Conemaugh contains [commercial coal beds. The group extends from the top of the Upper Freepcirt coal to the base of the Pittsburgh coal and, in ascending order, consists of the Glenshaw and Casselman Formations. The boundary between the two formations is the top of the Ames Limestone Member of the Glenshaw (commonly a marine limestone). The massive Mahoning Sandstone Member of the Glenshaw is commonly present at the base of the group. The Glenshaw is confined to the higher hills in the southern and east-central parts of the area. The Casselman Formation is present only on hilltops in the southeast corner.
Quaternary System
Colluvium
The colluvium is composed of unconsolidated, heterogeneous deposits of silt, sand, gravel, and boulders. It is derived from weathered bedrock, and is generally found at the base of slopes, where it has moved chiefly by gravity. i
Alluviumi
The alluvium consists of unconsolidated a|ad generally heterogeneous, water-laid deposits of clay, sand, gravel, and! boulders. It generally occurs as discontinuous terrace and flood-plain deposits. The alluvium in themajor valleys may be as thick as 70 ft, but is Along tributary streams, both the terrace and thinner with increased distance from the main
commonly less than 50 ft. flood-plain deposits become streams. Little data are
available on the thickness and texture of thesa deposits.
Structure
Folds
The rocks have been deformed into a series trend northeast (plate 1). These folds or and troughs (synclines) are superposed on a Mississippian-Pennsylvanian unconformity that
of gentle folds whose axes structural ridges (anticlines) broader structure beneath the
dips southward.
Folding is least in the northwest, but eastward. Fold heights (structural relief), flanks of folds all increase southeastward, although many are doubly plunging. Vertical synclines and the top of adjacent anticlines g the northwest to 1,350 ft in the southeast, two adjacent anticlinal or synclinal axes, ranj the flanks of folds commonly range from 30 to plunge from 15 to 150 ft/mi.
12
becomes more pronounced south- wavelengths, and dips along Most folds plunge southwest, distances between the bottom ofnerally range from 50 ft in
Wavelengths, measured between e from 6 to 9 mi. Dips along 150 ft/mi and the rate of
Fractures
Faults
Although faults have been inderitifled in the Allegheny Plateau in the subsurface (Gate, 1961), those that have topographic expression are rare. Of particular significance, therefore, is the major fault recognized by Berg and Glover (1976) that has topographic expression along Mountain Run on the southern flank of Boone Mountain anticline (plate 1). This fault follows the same northeast trend as the fold axes. Berg and Glover interpret the Mountain Run fault as a nonplanar, steeply dipping reverse fault that has the upthrown block in the northwest side. The maximum displacement along the fault is approximately 400 ft.
Joints
Most joints are nearly vertical and consist of two prominent sets bearing N. 30°-60° E., and N. 30°-50° W. Thus, the sets are roughly at right angles and are parallel and at right angles to the axes of the major folds.
Fracture traces
Fracture traces are natural linear features consisting of topographic, vegetal, or soil tonal alinements visible primarily on aerial photographs. They may appear on land surface as shallow, straight-line depressions and may be found in any topographic position. Parizek and others (1971) report that in Illinois fractures are detectable as fracture traces, although covered by as much as 150 ft drift. The traces are probably the surface expression of concentrated fracture zones (faults or joints) in the under lying bedrock; in places where the fractures are not concentrated, the traces may be discontinous. Field evidence indicates that the rock frac tures associated with traces are near vertical in attitude (Blanchet, 1957).
Mineral Resources
The major mineral resources are bituminous coal, petroleum, and natural gas. Other mineral resources include clay and shale, limestone, sand and gravel, and construction stone.
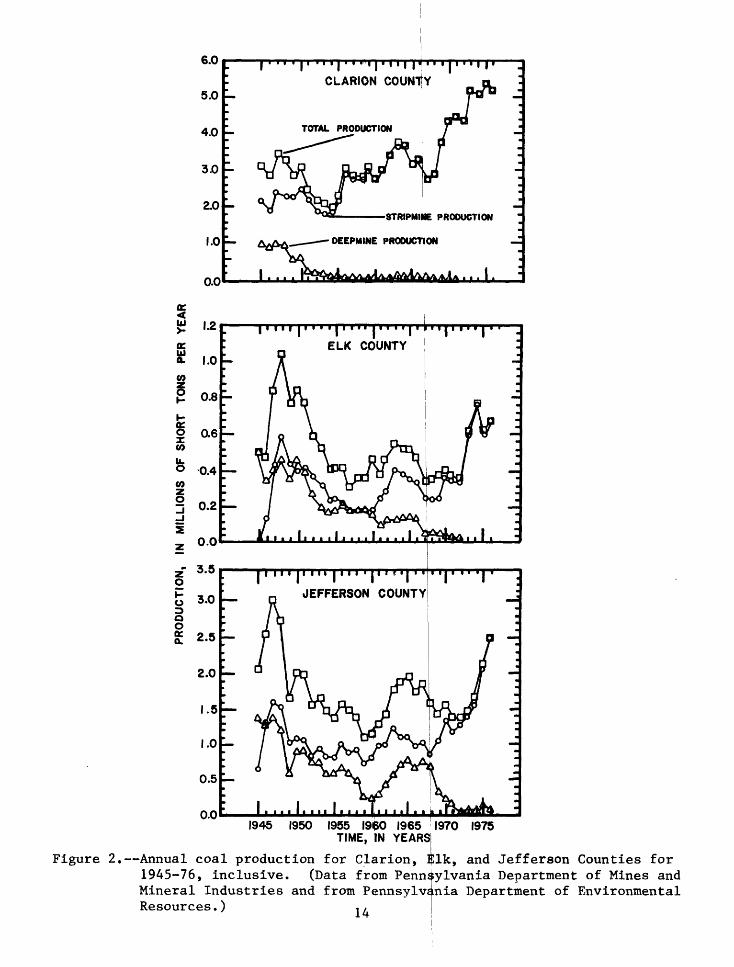
The Clarion River and Redbank Creek basins have been important producers of coal for over a century. Most of the coal seams mined are in the Allegheny Group. Coal production is now nearly all from strip mines in Clarion, Elk, and Jefferson Counties. In 1976, for example, deep mining accounted for only about 1 percent of the total coal production of these counties. Total coal production that year exceeded 8 million short tons. Annual coal pro duction data for the three counties for 1945-76, inclusive, are presented in figure 2.
13
6.0
5.0
4.0
3O
2.0
1.0
0.0
*" >/ o5» ^».M..J PRODUCTION
A^A__ - DEEPMINE PRODUCTION
A>JA AA/VJ/VAA A I . . . I .
a: < UJ
£o>
|CO
O ,0.4
COi5
z
Q O
0.5
0.01945 1950 1955 I960 1965 1970 1975
TIME, IN YEARSj
Figure 2. Annual coal production for Clarion, flllk, and Jefferson Counties for 1945-76, inclusive. (Data from Pennsylvania Department of Mines and Mineral Industries and from Pennsylvania Department of EnvironmentalResources.) 14

Clarion County ranked 8th out of the 27 bituminous coal producing counties in total coal production in 1976, with nearly 5.2 million short tons; Elk County ranked 16th, with over 670 thousand short tons; and Jefferson County ranked 12th, with nearly 2.5 million short tons. Recov erable coal reserves for Clarion County are estimated at 630 million short tons, and strippable coal reserves are estimated at 189 million short tons. Recoverable coal reserves for Elk County are estimated at 140 million short tons. Recoverable coal reserves for Jefferson County are estimated at 1,200 million short tons, and strippable coal reserves are estimated at nearly 140 million short tons. (See Edmunds, 1972.)
The recent upward trend in total coal production in Clarion, Elk, and Jefferson Counties reflects increased demand. Nearly all production comes from strip mines, and this will probably continue. The outlook for continued growth of the coal industry is good, owing to abundant strippable coal reserves and encouragement from the Federal Government to develop domestic energy resources.
The Clarion River and Redbank Creek basins are south and east of the major oil-producing regions in Pennsylvania, but, nevertheless, produce modest amounts of crude oil. Oil production has fluctuated somewhat during the past decade, but significant increases are unlikely. Clarion County ranked llth of 18 counties in crude oil production in 1975, with 23,264 bbl; Elk County ranked 10th, with 24,239 bbl; and Jefferson County ranked 16th, with 2,714 bbl. (See Lytle and others, 1977, p. 20.) Commercial quantities of natural gas are also produced in these counties.
SURFACE-WATER HYDROLOGY
General
Streamflow data have been collected by the Geological Survey as part of a long standing cooperative, systematic monitoring program. These data have been published annually for water years 1961-74 in "Water Resources Data for Pennsylvania, Part 1: Surface Water Records." Beginning with the 1975 water year and continuing as an annual series, surface-water and water- quality records are published in "Water Resources Data for Pennsylvania, Volume 3: Ohio River and St. Lawrence River Basins."
Surface-water and water-quality data were collected at 11 continuous record stream-gaging stations. Their locations are shown in figure 3, and their period of record is given in table 4. Data from about 140 miscellaneous sites were also collected. These are summarized in a report by Koester and Lescinsky (1976). All analyses of streamflow are based on records for water years (October 1 to September 30), unless otherwise noted. Streamflow on the Clarion River is affected by two impoundments: East Branch Clarion River Lake and Piney Reservoir (see fig. 3). Selected physical data on the impoundments are given in table 5.
15

79° 30
'79
°
4I°45'
295OO
EXPL
ANAT
ION
Cont
inuo
us record ga
ging
st
atio
n
.
. .
Basin
boun
dary
,'EA
ST
BR
AN
CH
C
LA
RIO
N R
IVE
R L
AK
E
o :
''x
/ f/^
X'"^
1 r
10
15
16 M
iles
I I 25 K
ilom
eter
s
Figure 3. Location of st
ream
-gag
ing
stat
ions
.

Table 4. Continuous streatnflow stations
Station number and nameLocation (71/2-minute quadrangle)
Drainage area (mi 2 )
Period of record
26500 Sevenmile Run near Hazel Hurst Rasselas.
27500 East Branch Clarion Glen Hazel River at East Branch Clarion River Dam.
7.84
73.2
1951 to present.
I/1948 to present. '
28000
28500
29000
29400
29500
30500
31000
31950
32500
West Branch Clarion River at Wilcox.
Clarion River at Johnsonburg.
Clarion River at Ridgway.
Toms Run at Cooks burg.
Clarion River at Cooks burg.
Clarion River near Piney.
Clarion River at St. Petersburg.
Big Run near Sprankle Mills.
Redbank Creek at St. Charles.
Wilcox
Ridgway
Ridgway
Cooksburg
Cooksburg
Clarion
Emlenton
Valier
Templeton
63.0
204
303
12.6
807
951
1,246
7.38
528
1953
1945
1954
1959
1938
1944
1942 1972
1963
1910
to present.
to present.
1 2/ to present. '
to 1978
to present .
3/ to present.
- 19532/ - 1977-'
to present.
to present.
-=-,Flow regulated since June 1952 by East Branch Clarion River Dam.-r-,Record unpublished.- Flow regulated by East Branch Clarion River Dam since June 1952 and by
hydroelectric plant at Piney Dam.
17

Table 5. Selected information for East Branch Clarion River Lakeand Piney Reservoir
Reservoir name
Stream impounded
County
7l/2~minute quadrangle
Dam location latitude longitude
Drainage area (mi 2 )
Surface area ( acres )JL'
Capacity (acre-ft)
Length (mi)i/
Year built
Owner
Purposes
JL'Summer pool.
East Branch Clarion River Lake
East Branch Clarion River j
Elk
Glen Hazel
41°33 f 35" 78°35 f 40"
72,4
1,160
84,300
5.7
1952
U.S. Army Corps of Engineers
Flood control Low-flow augmentation Recreation
Piney Reservoir
Clarion River
Clarion
Clarion, Strattanville
41°ll f 30' 78 0 26 f 02'
957.0
690
33,800
12
1924
Pennsylvania Electric Co.
Electric powergeneration
Recreation
18

Runoff
Runoff has a distinct seasonal pattern. The period of greatest runoff is generally March and April, the least, August and September. Due to melting of snow, runoff commonly exceeds precipitation during March and April when about 25 to 30 percent of the total runoff for the year occurs (table 6). The minimum runoffs, in August, result mostly from the high evapotranspiration rates.
In an average year, over half the annual precipitation reaches the streams. For the stations Clarion River at St. Petersburg and Redbank Creek at St. Charles, the average annual runoff is 64 and 60 percent, respectively, of the precipitation.
Low-Flow Frequency
Low-flow frequency characteristics provide information useful for planning utilization of streamflow. The low-flow frequency most often used is the 7-day, 10-year low flow. The State Water Plan (Chiang and others, 1975, p.50) recommends a 7-day, 10-year low flow of at least 0.15 (ft 3/s)mi 2 to prevent degradation of water quality and to aid in the assimilation of pollutants. Table 7 shows that only 4 of the 10 continuous recording stations (27500, 28500, 29000 and 29500) have low flows of this magnitude. Low-flow discharge at stations 27500, 28500, 29000 and 29500 is regulated.
Low-flow characteristics for ungaged streams can be computed by correlating base-flow measurements with records from a nearby long-term gaging station. Table 8 gives data on low-flow frequency for four stations, derived from such correlation. (See figure 10 for locations.)
Flow Duration
The magnitude and variability of streamflow are dependent upon basin characteristics such as size, slope, shape, altitude, geology, and stream density as well as climatic conditions. Because basins have different physical characteristics and climatic conditions, their streamflow also differs. These differences in streamflow can be shown by flow-duration curves. A flow-duration curve shows the percentage of time any magnitude of discharge was equaled or exceeded during a given period, regardless of the flow sequence.
The shape of the duration curve reflects the hydrologic and geologic characteristics of the drainage basin. The high-flow end of the curve is related chiefly to climate, topography, and land cover. The low- or base- flow end is related mostly to the geology of the basin. A curve that is steep throughout indicates flows of a highly variable stream that has much direct runoff. A flat curve indicates the availability in the basin of enough surface-water or ground-water discharge from storage to moderate streamflow.
19

Table 6. Average monthly preciplltation and streamflowfor the Clarion River and Redbank Creek basins, 1971-75
Clarion River at St. Petersburg (1,246 mi 2 )
Precipitation! Streamflow Month____________(in.)_____________(in.)
October 3.0 1.0November 3.3 1.6December 3.7 2.4January 2.8 3.3February 3.0 3.5March 3.7 3.7April 3.0 3.7May 4.0 3.5June 6.5 3.7July 3.4 1.2August 4.3 .5September 4.5 | .9
Total 45.2 ! 29.0
Redbank Creek at St. CharJ.es (528 mi 2 )
October 2.6November 3.2December 4.0January 3.0February 3.4March 3.9April 3.1May 3.8June 6.3July 3.5August 4.4 ! .5September 4.9 | 1.1
Total 46.1 ! 27.9
20

Table
7. M
agni
tude
an
d fr
eque
ncy
of annual lo
w fl
ow
to
Station
name
Station
Period of
record
numb
er
Drainage ar
ea
2650
0
2750
0
28000
2850
0
2900
0
2940
0
Seve
nmil
e Run
ne^a
r Rasselas
1953-72
7.84
mi
2
East
Br
anch
Cl
ario
n Ri
ver
atEast Br
anch
Cl
ario
n Ri
ver
Dam
1953-75
73.2 mi
2
West
Br
anch
Cl
ario
n Ri
ver
atWllcox
1955-72
63.0
mi
2
Clar
ion
Rive
r at Jo
hns onburgA'
1952
-75
204
mi2
Clarion
Rive
r at
Ri
dgwa
yi/
1954-75
303
mi2
Toms Run
at Cooksburg
1961
-72
12.6 mi
2
Peri
od of
Di
scha
rge,
in
cubic
feet per
second,
consecutive
for
indi
cate
d recurrence interval,
in y
ears
1(
days 7 14 30 60 120 7 14 30 60 120 7 14 30 60 120 7 14 30 60 120 7 14 30 60 120 7 14 30 60 120
2 0.4 .5 .7 1.0
1.7
22.7
24.9
29.7
37.0
62.3 9.4
10 12 14 23 114
121
137
178
228
120
135
150
180
250 1.
11.
21.
41.
72.
6
5 0.2 .3 .4 .5 .8
16.5
18.3
21.0
25.5
37.1 8.5
7.0
7.7
9.4
13 79.3
84.2
91.8
114
147 85 96 105
127
158
.7 .8 .9 1.2
1.7
10 0.1 .2 .3 .4 .5
14.1
15.7
17.6
21.1
28.1 5.8
6.2
6.8
8.6
11 61.7
65.4
70.9
84.1
105 70 77 81 111
130
.5 .6 .7 1.1
1.4
20 0.1 .2 .2 .3 .4
12.4
13.9
15.3
18.1
22.2 5.3
5.8
6.3
8.0
9.6
48.4
51.3
55.8
62.6
75.3
58 64 71 84 106
.4 .5 .6 1.0
1.3
40 0.1 .1 .2 .2 .4
11.2
12.5
13.5
15.9
18.2 4.6
4.8
5.6
6.6
9.0
38.5
40.5
45.2
47.0
54.4
46 50 56 67 86
50 0.09 .1 .2 .2 .3
10.8
12.1
13.0
15.3
17.0 4.5
4.7
5.4
6.4
8.8
35.4
37.5
41.4
42.8
48.5
43 46 49 62 80
7-day
)-ye
ar discharge
in (ft3/s)/mi2
0.01 .19
.09
.30
.23
.04

Table
7. Magnitude and
freq
uenc
y of
an
nual
low fl
ow C
onti
nued
to
to
Stat
ion
name
St
atio
n Period of
record
number
Drainage area
2950
0
3050
0
3195
0
3250
0
Clar
ion
River
at Cooks burgj/
1954-75
807
mi2
Clarion
River
near
Piney.
2'
1953-75
951
mi2
Big
Run
near Sprankle Mills
1965-72
7.38
mi
2
Redb
ank
Cree
k at
St.
CharlesJ/
1920
, 19
23-7
2 52
8 mi
2
Period of
Di
scha
rge,
in cu
bic
feet pe
r second,
7-da
y consecutive
for
indicated
recu
rren
ce interval,
in y
ears
10-year
disc
harg
edays 7 14
30 60 120 7 14
30 60 120 7 14
30 120 7 14
30 60 120
2
260
280
304
346
469
225
286
317
394
534 0.
58
.67
.92
2.0
49 55
70 87 145
5
179
191
205
233
300
127
180
211
261
343 0.
45
.52
.65
1.4
36 40
50 60 86
10
139
150
163
189
232 89.2
13
4 16
721
026
7 0.42
.47
.54
- r72
1.
1
32 35
43 50 69
20
110
119
133
159
186 64.6
102
137
174
216
- 28 32
38 44 57
40 88.0
96.0
111
137
152 48.5
79
.0
116
150
178 26 29
34 39 49
50
in (ftVs)/mi*
81.4
0.17
90.0
10
5130
142 43.5
.09
73.0
10
9141
168
.06
25
.06
28
33 38 47
i /
* .i
'Low
fl
ows
affected by
releases from E
ast
Branch Cl
ario
n Ri
ver
Lake
and
by In
dust
rial
pl
ants
above
stat
ion.
'Low
flows
affe
cted
by
re
leas
es from E
ast
Branch Clarion
Rive
r La
ke and
by hy
droe
lect
ric
plan
t at Pi
ney
Dam.
'So
me regulation by
mills above
stat
ion.

Table 8. Annual low-flow frequency of four ungaged streams
Discharge for 7 consecutive days, in cubic feet per second, for indicated recurrence interval,
Gaging station ___________in years________ ________Drainage area________________________2_________10_____
29185 Spring Creek near Halltonl/ 10 5.9 86.0 mi 2
30100 Toby Creek near Miolal/ 5.2 2.9 29.6 mi 2
30860 Little Licking Creek at Sligol/ 3.0 2.3 4.29 mi 2
30900 Licking Creek at Callensburgl/ 46 33
_______51.9 mi 2_______________________________________________
.I/From relationship with West Branch Clarion River at Wilcox, using fivedischarge measurements.
Ji/From relationship with Toms Run at Cooksburg, using seven dischargemeasurements.
_i/From relationship with Redbank Creek at St. Charles, using four dischargemeasurements.
23

Table 9 gives flow durations of 12 gaging stations for selected per centages of time. The data for four nonrecording stations (29185, 30100, 30860, 30900) were estimated by correlation with recording stations. Figures 4 and 5 are flow-duration curves of eight streams on a unit-area (discharge per square mile) basis. Comparison of runoff on this basis removes basin size as a hydrologic factor and leaves climate, geology, topography, and man-made regulation as the chief controls of streamflow. The discharges of small streams are similar in about the 5 to 60 percent range and diverge most at low flow. This divergence probably reflects differences in the geology of the basins because the streams are not regu lated. The slight divergence at the high-flow!end probably reflects differ ences in topography or land cover (fig. 5).
Figure 5 shows the effect on the Clarion River by regulation of the East Branch Clarion River Lake. The effect is an increase in low flows at stations Clarion River at Johnsonburg and Clarion River at Cooksburg and a reduction in high flows at Johnsonburg.
When compared to the other mainstream gages, the discharge per square mile of the Clarion River at St. Petersburg is smaller after the 90 percentile is exceeded (fig. 5). These low flows are primarily a result of discharge management at the electric generating facility at Piney Dam, 20 miles upstream. Discharges are restricted, especially than 50 ft3 /s to conserve water for generating
Base Runoff
during dry periods, to less periods.
Streamflow can be separated into direct runoff and base runoff. Base runoff is the sustained or fair weather runoff land is largely ground-water discharge. When direct runoff and base runoff separation of streamflow hydrographs are made, the percentage of total flow that is base runoff can be calculated. It is then possible to decide which of several drainagebasins has the greatest sustained yield. This evaluating streams for potential water supply, for the St. Petersburg and Redbank Creek gages 51 percent, respectively.
information is useful in The calculated base runoffs during 1972-75 average 53 and
A base-runoff recession curve indicates the amount of water released from ground-water storage. The curve may be used to compare ground water yields of stream basins. A high sustained streamflow indicates that a relatively large amount of ground water is available from storage; a low sustained flow indicates the opposite. |
24

Tabl
e 9. Duration of da
ily
discharge
Disc
harg
e, in cubic
feet
per
seco
nd,
that
was
equa
led
orGaging st
atio
n Drainage
______________exceeded for
indicated
perc
ent
of time_____________________
Period of
record______area (m
i2)____2
5 10
20
30
40
50
60
70
80
90
95
98
2650
0 Sevenmile
Run
near
7.84
74
46
32
20
15
10
7.5
5.2
3.2
1.6
0.7
0.5
0.3
Rasselas,
1953
-75
28000
West
Branch Cl
ario
n 63
.0
590
400
280
180
130
94
70
48
33
22
13
9.9
7.6
River
at Wi
lcox
,19
54-7
5
2850
0 Cl
ario
n Ri
ver
at
204
1,400
990
750
490
370
300
250
220
190
160
120
94
54
Johnsonburg,
1953
-75
29185
Spri
ng Cr
eek
near
86.0
780
500
340
220
140
95
65
45
. 30
20
15
12
9.5
Hall
tonl
'
29400
Toms
Run
at
12.6
104
69
47
30
20
14
8.8
6.0
3.8
2.2
1.4
1.1
.8
Cooksburg,
1961
-75
29500
Clar
ion
River
at
807
6,100
4,500
3,200
2,100
1,50
0 1,
100
840
610
470
370
290
220
150
Cook
sbur
g,
1953
-75
30100
Toby Creek
near
29.6
190
130
90
65
45
35
25
20
10
8.5
6.0
4.6
3.5
Miol
a!/
30860
Little Li
ckin
g Creek
4.27
22
17
13
10
9.0
7.5
6.5
5.5
4.5
3.8
3.2
2.8
2.4
at Sl
igol
'
3090
0 Li
ckin
g Cr
eek
at
51.9
32
0 200
130
90
65
50
38
30
22
16
12
9.5
7.5
Cali
ensb
urg^
/
31000
Clar
ion
Rive
r at
1,246
10,5
00
7,800
5,500
3,60
0 2,600
1,800
1,20
0 84
0 54
0 32
0 18
0 96
66
St
. Petersburg,
1942-53, 19
71-7
5
31950
Big
Run
near
7.38
71
44
29
18
13
10
6.3
4.4
2.9
1.8
1.1
.8
.6
Spra
nkle
Mi
lls,
19
63-7
5
3250
0 Re
dban
k Cr
eek
at
528
4,50
0 3,
100
2,20
0 1,300
890
600
410
280
180
120
75
56
42
St.
Charles,
1919
-75
.I/Estimated fr
om relationship with We
st Branch Cl
ario
n Ri
ver
at Wi
lcox
.Ji
'Est
imat
ed fr
om relationship with Toms Ru
n at
Cooksburg.
.1'Estimated from re
lati
onsh
ip with Re
dban
k Creek
at St
. Ch
arle
s.
00 c "« rt> -P- i i o H-
O
3 n c 1 < rt> CO O Hi
CO 3
o.
05
05M
H
- M
(-
^<
CO
rt
C
Ln
H-n>
co
05 n
3 sr
CO
05
l-< 00 rt> o
rt> s.
O
bg
DIS
CH
ARG
E,
IN
CU
BIC
FE
ET
PER
S
EC
ON
D
PE
R
SQU
ARE
MIL
E
PP
Q
p
p O
oo
5bb
0CT
<f
t H
08
<O
I I
I I
I I
I I
|
o o
p o
o*
2
«
OH II
<o
r:
3 I
rCM i
O
l
p
Ol
p
p O
00
-
' Q
Q<
pp
Ittff
11i
i i
i rn f
I I
I1
I I
I I
I I
» I
I I II
I I
i I
i I
I

ro
i o c n 0>
rt H-
O
ft)
(U
CX.
3
H-
CO
OQ
O
0) rr
OQ
o>n>
^CO
OQ
n> CO n> i-
1 n>
o rt
n>
a.
o
Jb p
m o P is *§ H m
r
»
2 s- 5 o o «s 8$ m Is 8
O X i8
m m O
^J
CD
8 8
DIS
CH
AR
GE,
IN
C
UB
IC
FEE
T PE
R
SEC
ON
D
PER
SQ
UA
RE
MIL
Ep
p
p p
o
p
6 o
bb
pp
p
p
p
pp
r-
oo<Q
Or
r rrm
r r
r r r
rm
i '
i i
i »
ii
i i
i i
ui
i i
11

Base-runoff recession curves of selected streams are shown in figure 6. The curves were developed for summer runoff conditions. The base-runoffrecession curve for the gaging station Clarion greatest sustained streamflow.
Flooding
River at Cooksburg shows the
Knowledge of the frequency, extent, and magnitude of potential floods is essential for the management of flood-pronej lands. Flooding may occur at any time of year and is influenced by the size! of the basin. Most floodingin basins of more than about 100 mi2 is in the spring, when melting ofaccumulated snow cover combines with rain. Small basins are more likely to have floods during the summer, as a result of 'ieavy local thunderstorms.
The flood-frequency characteristics of a stream depend upon many factors. Some of the more significant are the;drainage area, precipitation pattern, and topography. Flood-frequency characteristics can be calculated from streamflow records. The reliability of the calculations depends largely upon the length and quality of the records available. Annual peak discharges for several recurrence intervals ard shown for five streams in table 10.
For ungaged sites on unregulated streams ^.n Pennsylvania the flood magnitudes for various recurrence intervals caiji be estimated from equations developed by Flippo (1977). Flood information for regulated streams can be obtained from the Flippo report through the us^ of discharge profile models.
Flood-Prone Area Maps
Maps showing areas that have a 1 in 100 chance on the average of being inundated during any year are available through several Federal and State agencies. The maps are on standard U.S. Geological Survey 7%-minute topo graphic sheets and were compiled to assist in minimizing flood losses by identifying areas of potential flood hazards. Figure 7 is an index map that shows the status of the mapping in 1978. More detailed flood information may be required for purposes such as structural, designs, economic studies, or formulation of land-use regulations. This detailed information may be obtained from the Geological Survey, other Federal agencies, or State, local, and private agencies.
GROUND WATER HYDROIJOGY
Ground water occurs in the Earth in that zone where all openings are saturated. It is in slow but constant movement from areas of recharge to areas of discharge. The materials in which water occurs constitute a com plex hydrogeologic framework for the storage and transmission of the water and consist of bedrock, regolith which overliesj the bedrock nearly every where, and alluvial deposits. Each unit has characteristics and water bearing properties that determine its utility a|s a source of supply. If a layer of rock acts as a hydrologic unit and is [sufficiently permeable to yield water in usable quantities, the layer is referred to as an aquifer.
28
DIS
CH
AR
GE
, IN
C
UB
IC F
EE
T P
ER
SE
CO
ND
to «£>
H- 00 c i td
P
CO
fl> I l-»
C
0
O fl> o CO
CO
H-
O 0 O <
CO o CO
0)
H>
0)
O It CO rt
ro -r r
O
O
g g
bO>
OB
Oro O
ro
o
oo
o
O)
Oo
oo o
o
o
o
o> 8 o
,p :8IT
TT
S
ro
gi
O o»
o

Tabl
e 10. Magnitude
of an
nual
peak di
scha
rges
at
selected ga
ging
stations
Drai
nage
area
(mi2)
Discharge, in
cu
bic
feet
pe
r second,
for
indicated
_______recurrence interval,
in y
ears____________
2.33
1025
5010
0
26500
Seve
nmil
e Run
near
Rass
elas,
1952
-75
7.84
485
757
1,02
0 1,410
1,750
I/
28000
West Branch Cl
ario
n River
at Wi
lcox
, 19
54-7
5 63
.02
,30
0
3,2
90
4,1
70
5,4
00
6,390
I/
CO 0
2940
0 Toms Ru
n at
Cooksburg,
1960
-75
3195
0 Bi
g Run
near
Sprankle Mills,
1964
-75
12.6
348
7.38
527
484
712
604
767
871
1,080
896
I/ --
I/
I/
3250
0 Re
dban
k Cr
eek
at
St.
Charles,
1910
-75
528
13,100
18,400
23,1
00
29,9
00
35,500
41,5
00
I
nsufficient
period of
record to
wa
rran
t ca
lcul
atio
n.
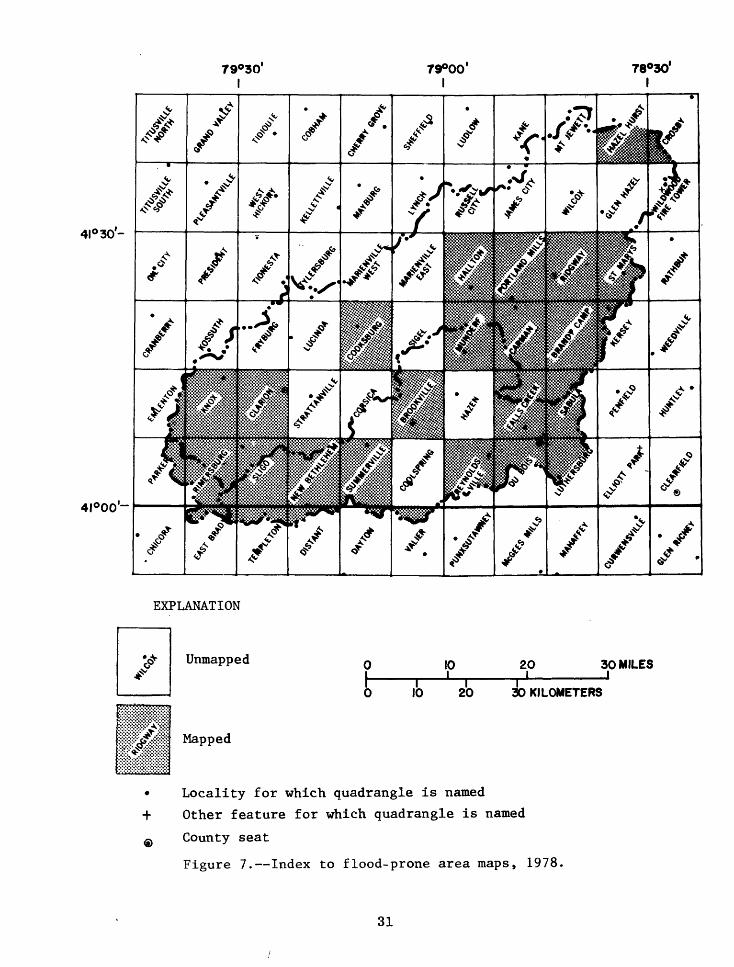
79°30'
41° 30'-
4I°00'-
EXPLANATION
Unmapped
Mapped
10 20 i
30 MILES
30 KILOMETERS
+Locality for which quadrangle is named
Other feature for which quadrangle is named
County seat
Figure 7. Index to flood-prone area maps, 1978,
31
The yields of wells depend upon the ease of movement of the water through the rock and the amount the rocks can release from storage. In the bedrock, ground water occurs along bedding planes and joints or fractures (called secondary openings) and in spaces between mineral grains (called primary openings). The intensity and distribut ion of fracturing is related to the lithology and structural history of the rocks. In the alluvium, and to a lesser extent in the regolith, water occurs in primary openings. The character and thickness of the alluvium and reg;olith are important because, water moving through them will recharge the underlying bedrock. Additionally, the alluvium may be an excellent aquifer; the regolith is not widespread and, thus, is less important.
i Recharge, Discharge, and Movement
The pattern of movement of ground water is controlled mostly by the topography, which is highly dissected by major and minor valleys into bedrock "islands", more or less hydrologically isolated. The movement of water in these bedrock islands is downward and then outward toward the valley sides.
Water moves from areas of high head to those of lower head; the paths of flow may be shallow, intermediate, or deep. j In most places, recharge moves nearly vertically into a shallow aquifer 'and eventually into deeper- lying aquifers through overlying units. Under natural conditions, most recharge is on the highlands; discharge occurs in the valleys to small streams descending from the uplands, to major streams, as seeps or springsalong hillsides, or from flowing wells. Figure showing theoretical paths of movement of water
8 is a generalized sketch in a multi-aquifer system.
Actual movement may differ considerably in places because of the complexity of geologic controls and the activities of man.
Water Levels
Water-level fluctuations are most affected by precipitation patterns and the duration of the growing season. Levels are generally highest in early spring and fall and lowest during the late spring, summer, and early winter. However, midwinter thaws or summer storms can temporarily reverse this seasonal pattern. An analysis of water-level data from observation wells in the report by Buckwalter and others (1979) indicated no annual downward trend between 1971 and 1977. I
Depth to water from land surface is dependent chiefly on the topo graphic position of the well and ranges between! wide limits from wells in valleys that flow, to wells on hilltops in which water levels may be more than 300 ft below the land surface. The median depth to water in bedrock is 28 ft in 11 valley wells and 50 ft in 170 hilltop wells. Water levels in the unconsolidated deposits generally fluctuate!less than in bedrock in the same topographic position because the storage capacity and permeability of unconsolidated deposits is greater.
32
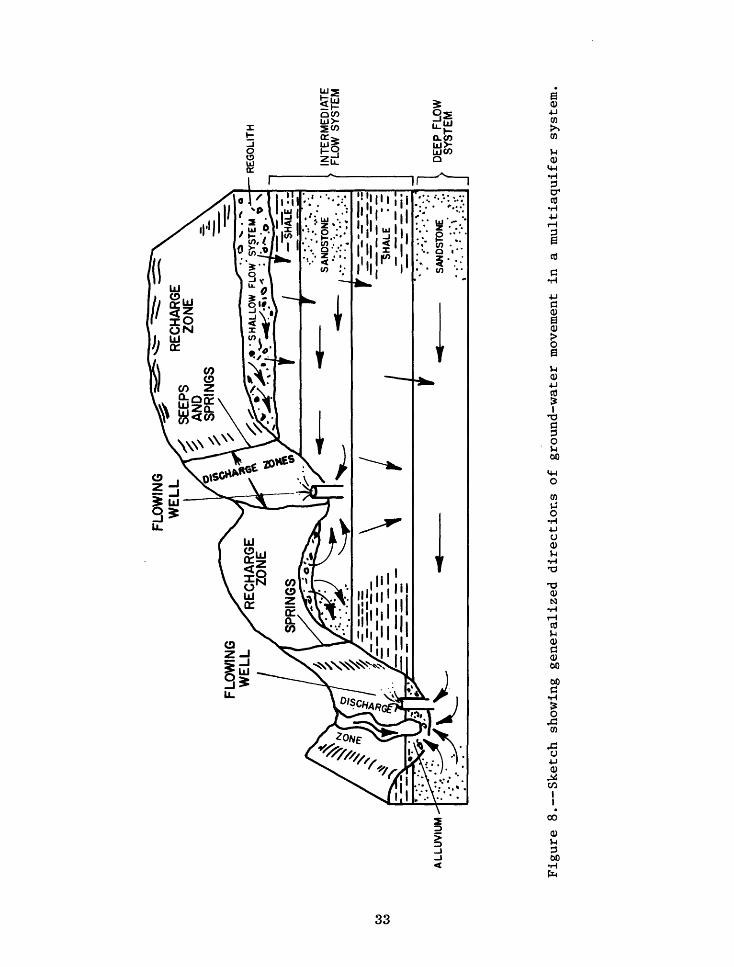
CO
CO
FLO
WIN
G
WE
LL
FLO
WIN
G
WE
LL
^ . O
>
. .
-x
O
. 'S
HA
LL
OW
FL
OW
* S
YS
TEM
/J
AL
LU
VIU
M
^^=
r^=
/ F
"S
HA
lE I-
SAN
OST
ON
E
"SH
ALE
: -
SAN
DST
ON
E;:
;'.
':':^iU
-;
RE
GO
LITH
. IN
TE
RM
ED
IAT
E
f FL
OW
S
YS
TE
M
]D
EEP
FLO
W
SY
STE
M
Figure 8. Sketch showing
gene
rali
zed
dire
ctio
ns of gr
ound
-wat
er movement in a multiaquifer system.

Depth to water below land surface in domestic and nondomestic wells is presented in Buckwalter and others (1979). The depth-to-water data are related to well construction practices of the drillers. Over half of the wells inventoried were finished openhole, with Less than 25 ft of surface casing (Buckwalter and others, 1979). Few water bearing zones were reported at depths less than 30 ft; therefore, casing generally did not seal off water-bearing zones. As a well is deepened in a hilltop or recharge area, the head, and thus water level generally is lower as the well casing pene trates points of progressively lower head. Conversely, in a discharge area there is an increase in head with increasing depth of an open end casing, and a corresponding higher water level. Also, where water-bearing zones are separated by layers of low permeability, water levels in wells of the same depth may be different in those wells with lessjperforated casing, because any shallow water-bearing zones that could have effected the water level aresealed off.
i
Availability of Ground W^ter
The availability of ground water is indicated in plate 1 and table 3. Information on yield, specific capacity, depth cjf wells, and depth to wateris summarized in tables 11-13. Hydrologic data report by Buckwalter and others (1979).
on wells are contained in a
All geologic units in the study area are wa.ter wells in the north tap aquifers lower in the geologic the south and have higher yields. Small to moderate in most of the highlands. In places, large yields in the major stream valleys. However, the quality domestic use where streams carry acid-mine drainage wells, dependent upon complex interrelationships depth, can differ by hundreds of gallons per minute
bearing. In general,section than wells in
supplies can be obtained are obtained from wells may not be suitable forwater. Yields of individual
of geology, hydrology, and within a 1-acre lot.
Specific Capacities and Well Yields
The specific capacity of a well is the rate of water, in gallons per minute, that can be pumped for each foot that the water level in the well is lowered. It is roughly linear through moderate ranges. Thus if the specific capacity of a well were constant, the sustained yield of the well could be obtained by multiplying the specific capacity by the number of feet the water level could be lowered. However, specific capacity is not constant, but decreases with increased pumping rates and time. Therefore, a well pumped at 10 gal/min, with 10 feet of drawdown, will not necessarily dis charge 20 gal/min, with a 20-foot drawdown. Additionally, with prolonged time, the discharge will decrease or the water level will continue todecline or both. i
Specific capacity and reported yield data gfLven in tables 11-13 can be used as a guide in assessing the availability of water in the various geologic units. The data are based mostly on drillers 1 reports of pumping rate, drawdown, and test duration and thus are siibject to errors caused by variations in test conditions and recording of d^ta.
34

Table 11. Summary of data on yield, specific capacity,well depth, and depth to water of domestic wells
Aquifer
Quaternary System Alluvium
Pennsylvanian SystemConemaugh GroupAllegheny GroupPottsville GroupAll groups, combined
Mississippian SystemLower Mississippianrocks
Bedrock, combined
Number of
wells
Yield of
8
35274328637
65
702
Specific capacity
Quaternary SystemAlluvium
Pennsylvanian SystemConemaugh GroupAllegheny GroupPottsville GroupAll groups, combined
Mississippian SystemLower Mississippianrocks
Bedrock, combined
662112180
15
195
Range
Percentage of wells in which indicated yield or
specific capacity is equaled or exceeded
90 80 50 20 10
wells (gal/min)
1- 30
1- 300- 600-1050-105
1- 65
0-105
of wells
0.06-2.0.03-10.02-24.02-24
.05-10
.02-24
32 *
33
3
3
[(gal/min)/ft]
-0.05 0.08.07
.05
.07
_
4344
5
4
-.11.10.10
.20
.10
12
9101010
10
10
0.38.62.38.40
,55
.40
-
15202020
29
20
-1.81.51.6
4.3
1.7
-
25303030
34
30
-5.94.04.0
9.2
4.6
35
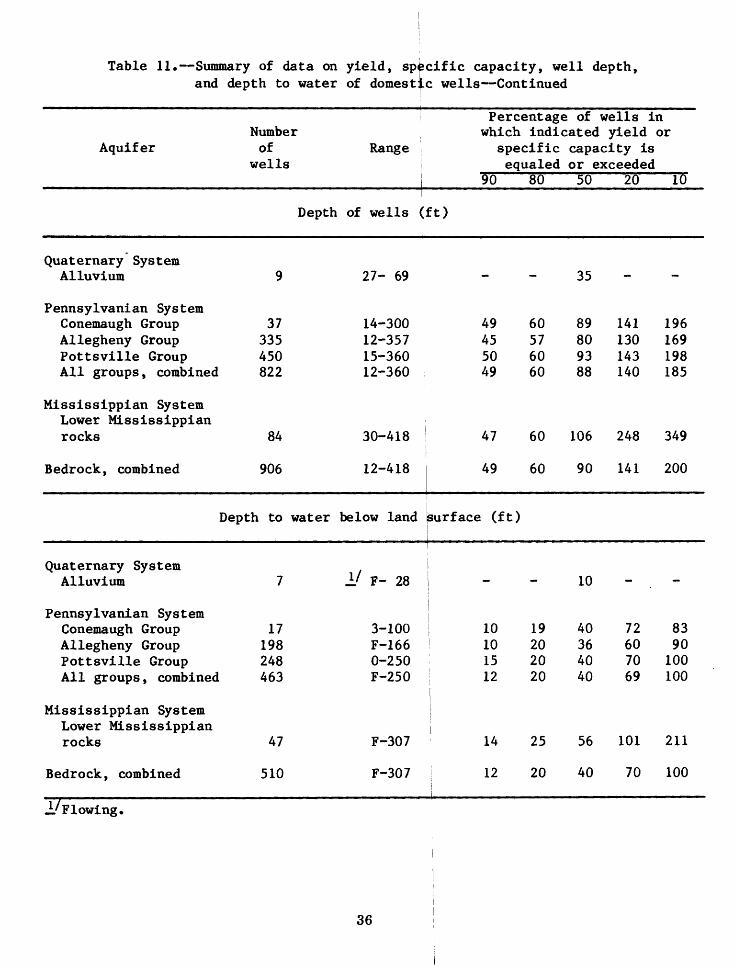
Table 11. Summary of data on yield, specific capacity, well depth, and depth to water of domestic wells Continued
Number Aquifer of
wellsRange
Percentage of wells in which indicated yield or
specific capacity is equaled or exceeded
90 80 50 20 10
Depth of wells (ft)
Quaternary System Alluvium
Pennsylvanian SystemConemaugh GroupAllegheny GroupPottsville GroupAll groups, combined
Mississippian SystemLower Mississippianrocks
Bedrock, combined
Depth
Quaternary SystemAlluvium
Pennsylvanian SystemConemaugh GroupAllegheny GroupPottsville GroupAll groups, combined
Mississippian SystemLower Mississippianrocks
Bedrock , combined
9
37335450822
84
906
to water
7
17198248463
47
510
27- 69
14-30012-35715-36012-360
30-418
12-418
below land
I/ F- 28
3-100F-1660-250F-250
F-307
F-307
49455049
47
49
surface (ft)
10! 10
1512
14
12
60576060
60
60
19202020
25
20
35
89809388
106
90
10
40364040
56
40
141130143140
248
141
72607069
101
70
-
196169198185
349
200
8390100100
211
100
^./Flowing.
36

Table 12. Summary of data on yield, specific capacity, well depth, and depth to water of nondomestic wells
Percentage of wells in Number which indicated yield or
Aquifer of Range specific capacity is wells equaled or exceeded
90 80 50 20 10
Yield of wells (gal/min)
Quaternary System Alluvium
Pennsylvanian System Conemaugh GroupAllegheny Group Pottsville Group All groups, combined
Mississippian System Lower Mississippian rocks
20 48 68
57
Bedrock, combined 125
Specific capacity
2-254 4-300 2-300
6-550
2-550
of wells
2 5 4
20
6
5 8 6
27
14
14 31 25
78
40
44 150 116
271
160
130 195 178
368
267
[(gal/min)/ft]
Quaternary SystemAlluvium -
Pennsylvanian SystemConemaugh Group - Allegheny Group 11 Pottsville Group 20 All groups, combined 31
Mississippian System Lower Mississippian rocks 28
Bedrock, combined 59
0.13- 11 0.15 0.25 3.0 6.6 10.04- 20 .12 .28 1.8 5.9 11.04- 20 .13 .28 2.6 5.6 10
1.1 -186 1.3 3.7 5.0 18 38
.04-186 .27 1.0 4.0 9.2 20
37

Table 12. Summary of data on yield, s and depth to water of nonda
Number Aquifer of
wellsRang^
pecific capacity, well depth, mestic wells Continued
Percentage of wells in which indicated depth is
equaled or exceeded90 80 50 20 10
Depth of well£ (ft)
Quaternary System Alluvium
Pennsylvanian System Conemaugh Group Allegheny Group Pottsville Group All groups , combined
Mississippian System Lower Mississippian rocks
Bedrock, combined
Depth
Quaternary System Alluvium
Pennsylvanian System Conemaugh Group Allegheny Group Pottsville Group All groups, combined
Mississippian System Lower Mississippian rocks
Bedrock, combined
24 63 87
69
156
of water
-
20 46 66
54
120
_ _____
37-300 64 96 125 265 294 30-417 84 112 180 319 388 30-417 85 100 165 295 345
42-542 60 105 201 300 410
30-542
below lar
-
U F-175 F-281 F-281
70 100 180 300 352
d surface (ft)
_____
1 8 35 82 100 5 17 51 141 245 5 10 46 100 225
j F-180 F 2 19 70 107
F-281 F 9 33 160 267
.I/Flowing.
38

Table 13. Summary of data on yield, specific capacity, well depth, and depth to water of all wells
Percentage of wells in
Aquifer
Quaternary SystemAlluvium
Pennsylvanian SystemConemaugh GroupAllegheny GroupPottsville GroupAll groups, combined
Mississippian SystemLower Mississippianrocks
Bedrock, combined
Numberof
wells
Yield of
10
37294376707
122
829
Specific capacity
Quaternary SystemAlluvium
Pennsylvanian SystemConemaugh GroupAllegheny GroupPottsville GroupAll groups, combined
Mississippian SystemLower Mississippianrocks
Bedrock, combined
673132211
43
254
which indicated yieldRange specific
equaled90 80
wells (gal/min)
1-200
1-30 340-254 2 30-300 4 50-300 3 4
1-550 5 8
0-550 3 5
of wells [(gal/min) /ft]
0.06- 2.0.03- 11 0.06 0.12.02- 24 .08 .12.02- 24 .07 .12
.05-186 .26 .99
.02-186 .08 .13
capacity isor exceeded50 20
20
10 1510 2010 2910 25
25 100
10 30
0.38.67 3.0.41 2.2.46 2.2
4.3 10
.68 4.0
or
10
26303632
248
40
-6.55.05.0
22
7.5
39
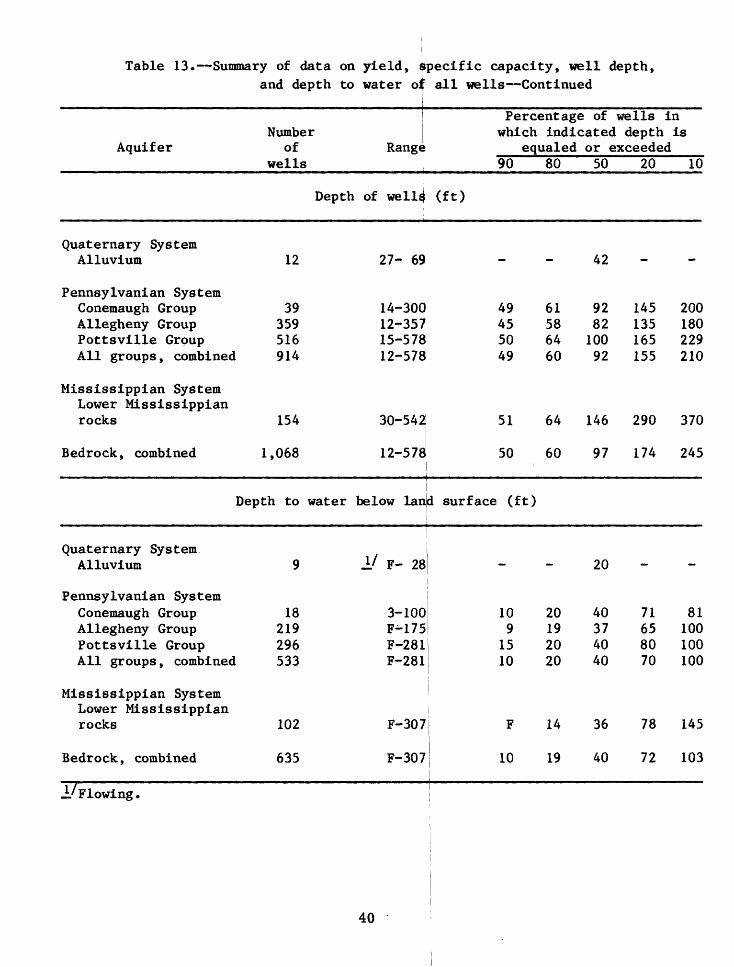
Table 13. Summary of data on yield, ;; and depth to water oJ:
Number Aquifer of
wellsRange >
pecific capacity, well depth, all wells Continued
Percentage of wells in which indicated depth is
equaled or exceeded90 80 50 20 10
Depth of well^ (ft)
Quaternary System Alluvium
Pennsylvanian System Conemaugh Group Allegheny Group Pottsville Group All groups, combined
Mississippian System Lower Mississippian rocks
Bedrock, combined 1,
Depth
Quaternary System, Alluvium
Pennsylvanian System Conemaugh Group Allegheny Group Pottsville Group All groups, combined
Mississippian System Lower Mississippian rocks
Bedrock, combined
12
39 359 516 914
154
068
to water
9
18 219 296 533
102
635
27- 6^
14-300 49 12-357 45 15-578 50 12-578 49
30-542 51
12-5781 50
below lan
I/ F- 28
3-100 F^175 F-281 F-281
F-307
F-307
d surface (ft)
10 9
15 10
pi
10
61 58 64 60
64
60
20 19 20 20
14
19
42
92 82 100 92
146
97
20
40 37 40 40
36
40
145 135 165 155
290
174
71 65 80 70
78
72
-
200 180 229 210
370
245
81 100 100 100
145
103
A/Flowing.
40

Specific capacities shown in the tables have a wide range, even where the thickness of the unit is constant, because of differences in depth of penetration of the wells; variations in the number, size, and degree of interconnection of fractures and pore spaces; and the use of test data of different durations and pumping rates. As few data are available for alluvial wells, the following discussion relates only to the bedrock.
Most specific capacities calculated from drillers 1 data are based on low rates of withdrawal from a well and on tests of short duration (gener ally less than a half hour). Results of controlled tests, however, based on higher withdrawal rates and longer pumping under uniform conditions, indi cate that the actual sustained yield may be 50 to 70 percent smaller than the potential yields calculated from most drillers 1 tests. Therefore, the median specific capacities shown in the tables are probably representative of better than average yielding wells. Typically, the specific capacities are one-half to one-third the median shown in the table. For example, the median specific capacity of 0.41 (gal/min)/ft for the Pottsville Group multiplied by 100 ft of available drawdown indicates a potential yield of 40 gal/min about the expected yield of a good well. If the specific capacity of 0.41 (gal/min)/ft were reduced by two-thirds, the average predicted yield for the Pottsville Group would be 14 gal/min about the median yield of the formation as shown in table 13.
Wells generally penetrate more water-bearing zones as they are deepened and thus their yields increase with depth. However, drilling deeper in shale will generally yield little or no additional water. The relation between depth of wells and yield is illustrated by data on nondomestic wells (generally deep) and domestic wells (relatively shallow). The median depth of nondomestic bedrock wells is about 180 ft (table 12), whereas that of domestic wells is 90 ft (table 11). The median yield of 40 gal/min and specific capacity of 4.0 (gal/min)/ft of nondomestic wells are 4 and 10 times respectively, those of domestic wells. Thus, in some places, yields of shallow wells may be improved by drilling deeper, to as much as 350 ft.
Water-bearing zones decrease with increasing depth. The deepest reported zone for a water well (Buckwalter and others, 1979, table 1) is 396 ft. Many high-yielding nondomestic wells have intercepted water-bearing zones at depths of 300-350 ft.
Geologic Structure
As a general rule, wells tapping the same formation yield more water along axes of synclines than along axes of anticlines. This is because water tends to move downward, away from the axes of anticlines and toward the axes of adjacent synclines, so that depths to water on anticlines may be greater than depths to water on synclines. Therefore, a formation may be above the water table and dry at the axis of an anticline and saturated along a synclinal axis.
41

Water in bedrock is found chiefly in fractures and along bedding planes. Openings are generally widest near the land surface and tend to close at depth due to the weight of the overlying rock. Fractures or zones of fractures may be several hundreds or thousand!? of feet in length and hundreds of feet in depth, and divide the bedrock into inany irregularly shaped blocks of solid rock. The spacing or distance between fractures has a significant influence on well yield and is related to major structural features (such as fold posit*011) and to the lithology. The bedrock seems to be more fractured in valleys and along slopes than on the uplands, and, consequently, yields are higher in valleys and along slopes.
Topographic Position
The relation between topographic position and well yield is shown in table 14. Wells are arranged by their position in a valley, on a hillside, or a hilltop, and are also grouped by use into "domestic, nondomestic," and "all wells." Table 14 shows that wells in valleys have the highest median specific capacity and yield. Also, the median of wells on hillsides is somewhat higher than that of wells on hilltops.
Valley wells have the highest yields for several reasons: (1) the rock underlying valleys is more fractured, making it more permeable and increasing the storage capability; (2) the alluvial materjials, which are commonly highly permeable, are confined mostly to vallekrs and serve as a recharge reservoir to the bedrock; (3) water levels are| shallowest and fluctuate less in valley wells, allowing more available drawdbwn than that in hillside or hilltop wells of equal depth; and (4) streams in the valleys may provide recharge. I
Fractures and Fracture Traces
The capacity of fractured rocks to store apd transmit water is directly related to the rock type. Yields of wells in jshale are low because fractures are small. Most sandstones and many siltstone3, on the other hand, are hard and tightly cemented and thus develop clean breaks than are more extensive and less likely to heal after fracturing. In addition, the spaces between grains in sandstones are larger and more permeable than those in shales. As a result, sandstone and siltstone aquifers have higher yields than shale. In general, the more siltstone and sandstone penetrated by a well the more water-bearing openings tapped and the greater uhe yield.
Many wells are completed in the fractured of the surface traces of fractures is an aid well yields. The most advantageous location of two or more traces. Because the width of may be difficult to locate them accurately in
>edrock, so that the location in choosing sites for optimum i«i probably at the intersection traces is generally small, it
:he field.
Where the bedrock consists of siltstone anq sandstone, wells located on fracture traces have significantly higher yields. However, according toLattman (oral commun., 1974), where the bedrock on a fracture trace will probably not increase
42
consists of shale, drilling a well's yield.

Table 14. Summary of data on yield and specific capacity of bedrock wells by topographic position
Number of wells
Specific Capacity [(gal/min)/ft]
Range Median
Number of wells
Reported yield (gal/min)
Range Median
Domestic wells
ValleyHillsideHilltop
1311859
0.25- 10.03- 24.02- 15
0.75.40.32
59447187
2.0- 600-1050- 50
15108
Nondomestic wells
ValleyHillsideHilltop
301512
0.27-186.13- 17.04- 20
5.23.01.0
534329
5.0-5503.0-3502.0-220
1003020
All wells
ValleyHillsideHilltop
4313371
0.25-186.03-24.02-20
4.1.48.40
112490216
2.0-5500-3500-220
30108
43

Regolith and Alluvial Aquifers
The study area is covered by a mantle ofthat ranges in thickness from 0 to about 50 ft: and averages about 20 ft. It stores more water per unit volume than the underlying fractured rock. How ever, its hydrologic importance is not as a di.rect source of water to wells,but, rather, as a reservoir that sustains the lying bedrock.
weathered bedrock, or regolith,
yields of wells in the under-
Alluvium is an unconsolidated mixture of silt, sand, and gravel as originally deposited, generally by rivers or streams. It is present in most stream valleys but is generally thin or of small areal extent. Even in the large stream valleys, which contain the greatest thickness of material, the alluvium occurs as remnants of terraces in discontinuous, narrow bands and patches. Along the Clarion River, wells penetrate as much as 70 ft of alluvium.
The alluvium has hydrologic properties similar to those of the regolith but is commonly more permeable. Wells completed in bedrock at sites overlain by alluvium generally have substantially higher yields than wells at sites not overlain by alluvium. For example, where [the Lower Mississippian rocks are covered by alluvium, the median reported yjield is 45 gal/min, and the specific capacity is 5.5 (gal/min)/ft. Where ;it is not covered by alluvium, the median yield and specific capacity are 15 [gal/min and 2.2 (gal/min)/ft, respectively. The highest reported yields (as much as 550 gal/min) are from wells in alluvium-covered bedrock. Where openings in the bedrock are small, few, or discontinous (commonly characteristic 'of shale), yields are low regardless of the alluvial cover.
Bedrock Aquif erjs
householdsBedrock is the source of water for tries, and municipalities that need small to ever, well yields are extremely variable and cementation, and thickness of the aquifer; the permeability; and the amount of saturation of control may change considerably over relatively
The relative water-yielding properties of
, schools, shops, indus- e amounts of water. How-larg
depend on lithology, degree of amount of fracturing and the the overlying alluvium. Each
short distances.
the geologic units are shown The Lower Mississippian rocksby the specific-capacity graphs in figure 9.
are clearly much more productive than the othejr units with a median specificcapacity of 4.3 (gal/min)/ft. The other units range from 0.38 to0.67 (gal/min)/ft. I
44

M - i i-r i-i r40 L I
30
O
20 » O
O 9i 8< 7
S 6
O
0.01
AA
V CONEMAU6N GROUP
A ALLEGHENY GROUP
OPOTTSVILLE GROUP
A LOWER MI88IS8IPP1AN ROCKS
fc
°0*
O
--.O
LJ»-
Z
°- I
CO °'9
3 53irf 04
0.3
" OJZ O u. otfCO
0.1 0.09 OXM 0.07 0.06
0.05
OX>4
04)3 -
0.02
0.O 4 O
4 o 4 O
4 A0
1 . . 1aoi 0.05 0.1 a2 as i 2 s 10 20 so 40 so so 70 eo 90 95 98 99 99.599499.9 99.99
PERCENTAGE OF WELLS WHOSE SPECIFIC CAPACITY IS EQUAL TO OR GREATER THANVALUE SHOWN
Figure 9. Frequency distribution of specific capacities in four bedrock units45

Lower Mississippian Series, undifferentiated
The largest yields are from the Lower Mijssissippian rocks, which con sist of interbedded sandstone, siltstone, and shale, although the sandstone predominates. The unit underlies most of thej area and crops out along major stream valleys in the south in narrow strips [that widen northward. Few wells are drilled deep enough to penetrate this Lower Mississippian rocks in the south. Specific capacities of 43 wells r.ange from 0.05 to 186 (gal/min)/ft and have a median of 4.3 (gal/min)/ft. The median reported yield of 122 wells is 25 gal/min. Yields of as much as 550 gal/min are reported.
iPottsville Group |
tI
More wells tap the Pottsville Group than!any other aquifer. The Potts ville, which consists largely of sandstone, is used mostly in the north, but is also used in the south, where overlying formations are thin or unsat- urated. Specific capacities of 132 wells range from 0.02 to 24 (gal/min)/ft and have a median of 0.41 (gal/min)ft. The median reported yield of 376 wells is 10 gal/min, but yields of 300 gal/min are reported.
Allegheny Group
The Allegheny Group is a major aquifer iij. the south, where it contains thick channel sands and is more completely preserved. In the north, it is generally thin, more shaly, and confined to the higher hills. Specific capacities of 73 wells in the Allegheny range from 0.03 to 11 (gal/min)/ft and have a median of 0.67 (gal/min)/ft. The nedian reported yield of 294 wells is 10 gal/min, but yields of 250 gal/min are reported from several wells.
Conemaugh Group
The Conemaugh Group is mostly sandstone and yields small to moderate supplies of water. As the Conemaugh is confined to uplands in the south and much of it is unsaturated, it is less used than the other rocks. Specific capacities of six wells range from 0.06 to 2.0 (gal/min)/ft and have a median value of 0.38 (gal/min)/ft. The median'reported yield of 37 wells is10 gal/min, and the highest is 30 gal/min. [
i iWATER QUALITY
The composition and concentration of dissolved substances in water change continuously as water moves through the hydrologic cycle. The quality of water at any point is the result of all prior changes. Some of the principal natural factors that control water quality are the composition of soil and bedrock, climate, vegetation, and length of time the water is in contact with the soil and rocks.
46
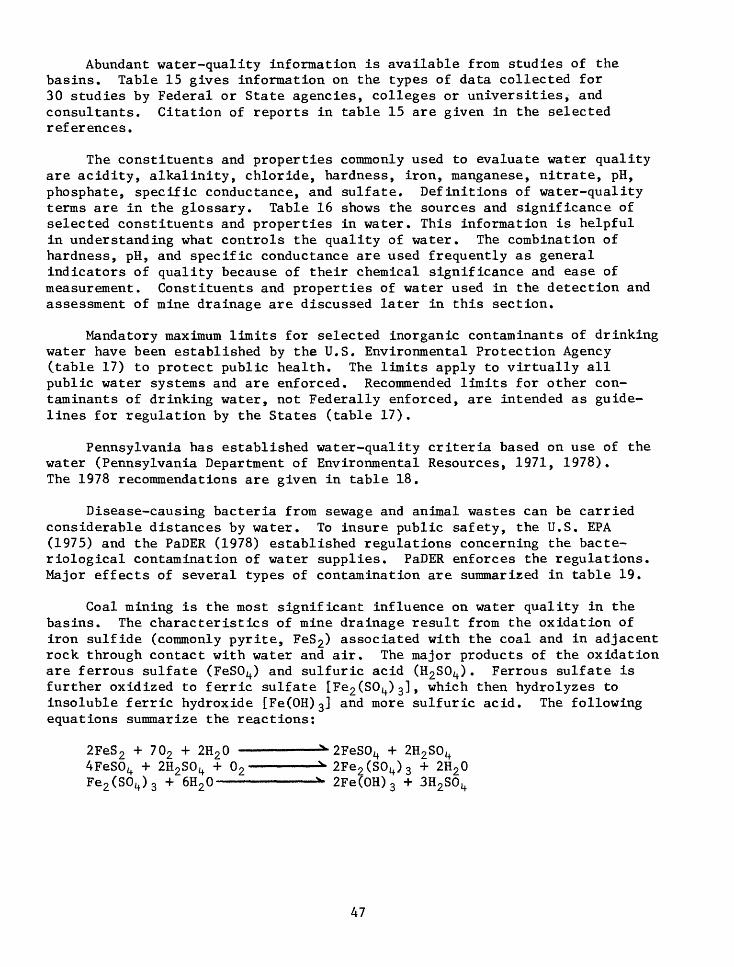
Abundant water-quality information is available from studies of the basins. Table 15 gives information on the types of data collected for 30 studies by Federal or State agencies, colleges or universities^ and consultants. Citation of reports in table 15 are given in the selected references.
The constituents and properties commonly used to evaluate water quality are acidity, alkalinity, chloride, hardness, iron, manganese, nitrate, pH, phosphate, specific conductance, and sulfate. Definitions of water-quality terms are in the glossary. Table 16 shows the sources and significance of selected constituents and properties in water. This information is helpful in understanding what controls the quality of water. The combination of hardness, pH, and specific conductance are used frequently as general indicators of quality because of their chemical significance and ease of measurement. Constituents and properties of water used in the detection and assessment of mine drainage are discussed later in this section.
Mandatory maximum limits for selected inorganic contaminants of drinking water have been established by the U.S. Environmental Protection Agency (.table 17) to protect public health. The limits apply to virtually all public water systems and are enforced. Recommended limits for other con taminants of drinking water, not Federally enforced, are intended as guide lines for regulation by the States (table 17).
Pennsylvania has established water-quality criteria based on use of the water (Pennsylvania Department of Environmental Resources, 1971, 1978). The 1978 recommendations are given in table 18.
Disease-causing bacteria from sewage and animal wastes can be carried considerable distances by water. To insure public safety, the U.S. EPA (1975) and the PaDER (1978) established regulations concerning the bacte riological contamination of water supplies. PaDER enforces the regulations. Major effects of several types of contamination are summarized in table 19.
Coal mining is the most significant influence on water quality in the basins. The characteristics of mine drainage result from the oxidation of iron sulfide (commonly pyrite, FeS2 ) associated with the coal and in adjacent rock through contact with water and air. The major products of the oxidation are ferrous sulfate (FeSO^) and sulfuric acid (l^SO^). Ferrous sulfate is further oxidized to ferric sulfate [Fe2 (SO l+ ) 3 ] , which then hydrolyzes to insoluble ferric hydroxide [Fe(OH) 3 ] and more sulfuric acid. The following equations summarize the reactions:
2FeS 2 + 702 + 2H20 x 2FeSO l+ + 2H2SO l+ 4FeSO l+ + 2H2SO l+ + 0 2 * 2Fe2 (8(^)3 + 2H2 0 Fe2 (80^)3 + 6H20 ^ 2Fe(OH) 3 + 3H2SO t+
47
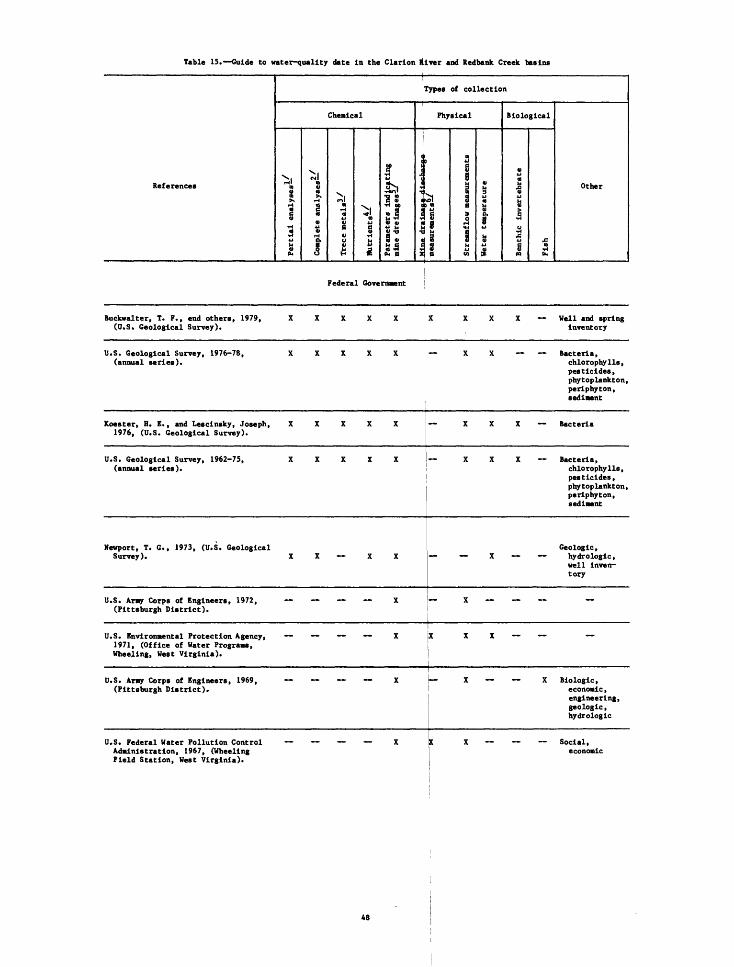
Table IS. Guide to water-quality date in the Clarion Rtver and Redbank Creek basins
References
Chemical
sPertial enal
"Xi
?,%,
rH
Complete ana
\
Trece metals Nutrients^/
&Tl
9^,TJ«
Parameters 1 mine drelnag
<!
J.
\i<< iti *« iT
Types of collection
Physical
i
x.1 «
§ ig I
a
ss
Streamflow m
«3
a
Biological
4J
8«iBenthlc inve
a rt
Other
Federal Government
Buckwalter, T. F. , end others, 1979, (U.S. Geological Survey).
U.S. Geological Survey, 1976-78, (annual scries).
Koester, H. E. , and Lescinsky, Joseph, 1976, (U.S. Geological Survey).
U.S. Geological Survey, 1962-75, (annual series).
Newport, T. G., 1973, (U.S. Geological Survey).
XXXXX X XXX Well and spring Inventory
XXXXX XX Bacteria, chlorophylls, pesticides, phytoplankton, perlphyton, sediment
XXXXX
XXXXX
X X X X
U.S. Army Corps of Engineers, 1972, Ti (Pittsburgh District).
U.S. Environmental Protection Agency, 1971, (Office of Water Programs, Wheeling, West Virginia).
U.S. Army Corps of Engineers, 1969, (Pittsburgh District).
U.S. Federal Water Pollution Control Administration, 1967, (Wheeling
_ _ _ _ x
*""" """" """" ~ X
- - - - X
X X X Bacteria
XXX Bacteria, chlorophylls, pesticides, phytoplankton, perlphyton, sediment
Geologic, X hydrologlc,
well Inven tory
_ x - - -
X XX """" """" """"
X X Biologic, economic, engineering, geologic , hydrologic
K X Social, economic
Field Station, West Virginia).

Table 15. Guide to water-quality data In the Clarion River and Redbank Creek basins Continued
References
Types of collection
Chemical
^0)0)m
1
4J
M
2
>jlm0)m
rH
i0)4J0)
1
\J
rHID
B<uoM
a
\. g HM4J
I4J0}
|H H 00
» §
m U
§ 0)
S|
Physical
0)00
5o
H"^
owloo m
a §n) eM 8 o u0) 0)
s a
§ gh 3
ia
§ H
w
5
<Uu3 u aSo. g4J
3
1
Biological
HI 4JID
£134J
M0)
1
£
gn
am H
Other
Federal Government Continued
McCarren, E. F., 1967, (U.S. Geological XX XX XX Survey).
Beamer, N. H. Survey).
Leggette, R. Geological
, 1953, (U.S. Geological X X X
M., 1936, (U.S. X X X Survey).
_ _ x _ _
X Geologic, hydro logic, well Inventory
Commonwealth of Pennsylvania
Pennsylvania Department ofEnvironmental Resources, Bureau of Water Quality Management, 1975.
X X X X
Merrltt, G. L., and Emrlck, G. H., 1970, (Pennsylvania Department of Health, Bureau of Sanitary Engineering).
X Geologic,hydrologlc
Pennsylvania Department of Health, and Pennsylvania Fish Commission, 1970.
XXX
Pennsylvania Bureau of Engineerings, Mine Wastes Dlvlaon, 1953.
College or University
Alexander, D.J., 1976, (Clarion State College).
XXX
Kay, G.G., 1974 (Clarion State College).
49

1 wjj
, IB
- fc>
K>
h
afg"
,f,f
fn»
rtr
rr*
o.r
ta-rr
!f283ft
2S
2
gJ2.B
fiJ&
J"g".-
g
jg
H<
»
»
O
h-<
B
H<
O
H-
3
B
3"
H-
H
-**
rr
a.
00
1
rt
rrJ^S
S"
xie-
g-SE
-s-
s-ts
^tr
s s
ga-R
SS
S-
5rt
o o
a. f n
tii
(
H<
*
H"
rti
e
» r->
e
H, &
eT
ft
S ?a
SB
"
cs«
|s
s r
tii c
-o
H>
0.
0
-
O P
v«
O
H-
A
r->O
O
. til
1
H-
*S
3*
8
gft
? a&
*
? g.
I&"
8""I
8rl
8
SM
a
H-
r*
!- «
» O
. O
p-
a.
a
rt
rt1?
5*
1 ?
O. a
rt
ii
M.
S
«P
*
53
§ 3$
5-
E
. o
n
r*o
» C
a"
-a
8 r*
S ?
«S
!f
S C
. tiT
S"
* 0
g
. tS
ft
5-
P,
es
s 8 &
J-s
a
?
.
s-8
2
8.H
-
P»
ft
H
. N
1
1
f H
-s
8* ."
8S
S~
8
S S
3 S
C
3
SM
.
»
2
! »»
iS
S8
* ?
&
fi S
I til
H
i
o a
MI
H>
o a
tii 3
3 S
ng
» _»
«
aO
rr
(1
o n
aff
S &
s- g
a rr
»
*
O amp,
Dresser, < I z 1 \o *-
\o X I 1 I X ! X X ! ! Biochemical
oxygen di w
r- a
z H-
O o M til rr
» n <-,
jl M
g \O S 1 1 I 1 X X X ! ! ! Economic
, geolog
ic hydrol
og:
h* «
O
? O a"
tii »i rr * 3 <o -xi
* 1 ! I 1 X X X ! 1 1 ! Economi
c ,
geologic,
hydrolog:!
0
> > >
geologic,
hydrologi o
r D n> J. § i o w 7> I ! I < < < i
n Iglneering and
Servic
es, 1971
i ! ! I X X X ! ! ! Economic
, geolog
ic, hydrol
og: o
?5j
? ^
a
o>
- O
f V
OB
-x
l O
voS S g. "a o I & M g 1 I 1 1 X X X ! ! ! Economi
c ,
geologic
hydrolog: o
0 reen Internal
li
continuing.
I M M g %O W Y *j 00 til B. X X
X X X h X X ! X ffS
^S
aas
-&§
&&
5?
Sff
-H
-»
O
Privat
o 0 c s 1
w ardarlk, D.
G.
Pittsburgh). "_ \o ON O f 5 rr « g
, X I 1 1 X I X X ! X !
a insmore, B.
H.
College). "(- \o S [Cleri
on en .7 rt a X ! ! 1 X ! X X X X Algae,
periphyt o a
r1oa* 2.S sr-9 ir<-. vO O c? tit
n § en
rr til rr
O X I ! 1 X ! I X X X !
z 08 2.3
f"
* !* \o *- c? ,t M r* S rt R o X 1 I X X ! ! X ! X Chlorophyl
phytopla g-s
rrr
*O a
n ang, M.
W., en
1974,
(Pennsy
University).
a. § if n a H" a. 1 X
X 1 X X X X ! ! Geologic,
hydrolog
H>
O
O o 1 8 a 9
P- S 3 H> rt 1 i »±- I
S a i |
Part
ial
an
aly
ses!
-/
Com
plet
e an
aly
ses
'
Tra
ce m
etal
si/
Nu
trie
nts
^-
Par
amet
era
Indic
atin
g
min
e dra
inag
e^/
Min
e dra
inag
e d
isch
arg
e m
easu
rem
ents
^/
Str
eam
f low
mea
sure
men
ts
Wat
er te
mp
erat
ure
Ben
thic
in
vert
ebra
te
Fis
h
Chemical
Physical
Biological
o
n S rl
Types
of
collection
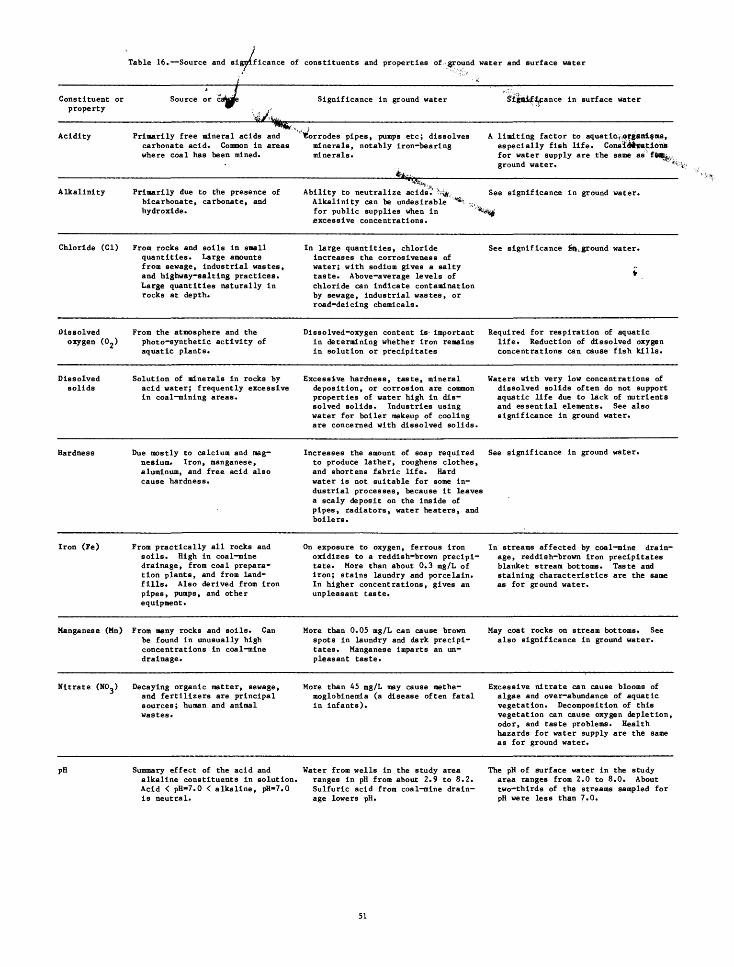
Table 16. Source and signifficance of constituents and properties of .ground water and surface water
Constituent or property
Source or Significance in ground water ance in surface water
Acidity Primarily free mineral acids and carbonate acid. Common in areas where coal has been mined.
corrodes pipes, pumps etc; dissolves minerals, notably iron-bearing minerals.
**£
A limiting factor to aquatic, organisms, especially fish life. Considerations for water supply are the same as ground water.
Alkalinity Primarily due to the presence of bicarbonate, carbonate, and hydroxide.
Ability to neutralize acids.' ^f^t . Alkalinity can be undesirable *** for public supplies when in excessive concentrations.
See significance in ground water.
Chloride (Cl) From rocks and soils in small quantities. Large amounts from sewage, Industrial wastes, and highway-salting practices. Large quantities naturally in rocks at depth.
In large quantities, chloride increases the corrosiveness of water; with sodium gives a salty taste. Above-average levels of chloride can indicate contamination by sewage, industrial wastes, or road-deictng chemicals.
See significance in. ground water.
Dissolved From the atmosphere and the oxygen (0-) photo-synthetic activity of
aquatic plants.
Dissolved-oxygen content is- important in determining whether iron remains in solution or precipitates
Required for respiration of aquatic life. Reduction of dissolved oxygen concentrations can cause fish kills.
Dissolved Solution of minerals in rocks by solids acid water; frequently excessive
in coal-mining areas.
Excessive hardness, taste, mineral deposition, or corrosion are common properties of water high in dis solved solids. Industries using water for boiler makeup of cooling are concerned with dissolved solids.
Waters with very low concentrations of dissolved solids often do not support aquatic life due to lack of nutrients and essential elements. See also significance in ground water.
Hardness Due mostly to calcium and mag nesium. Iron, manganese, aluminum, and free acid also cause hardness.
Increases the amount of soap required See significance in ground water, to produce lather, roughens clothes, and shortens fabric life. Hard water is not suitable for some in dustrial processes, because it leaves a scaly deposit on the inside of pipes, radiators, water heaters, and boilers.
Iron (Fe) From practically all rocks and soils. High in coal-mine drainage, from coal prepara tion plants, and from land fills. Also derived from iron pipes, pumps, and other equipment.
On exposure to oxygen, ferrous iron oxidizes to a reddish-brown precipi tate. More than about 0.3 mg/L of iron; stains laundry and porcelain. In higher concentrations, gives an unpleasant taste.
In streams affected by coal-mine drain age, reddish-brown iron precipitates blanket stream bottoms. Taste and staining characteristics are the same as for ground water.
Manganese (Mn) From many rocks and soils. Can be found in unusually high concentrations in coal-mine drainage.
More than 0.05 mg/L can cause brown spots in laundry and dark precipi tates. Manganese Imparts an un pleasant taste.
May coat rocks on stream bottoms. See also significance in ground water.
Nitrate (NO.) Decaying organic matter, sewage, and fertilizers are principal sources; human and animal wastes.
More than 45 mg/L may cause methe- moglobinemia (a disease often fatal in infants).
Excessive nitrate can cause blooms of algae and over-abundance of aquatic vegetation. Decomposition of this vegetation can cause oxygen depletion, odor, and taste problems. Health hazards for water supply are the same as for ground water.
pH Summary effect of the acid and Water from wells in the study area alkaline constituents in solution. ranges In pH from about 2.9 to 8.2. Acid < pH-7.0 < alkaline, pH-7.0 Sulfuric acid from coal-mine drain- is neutral. age lowers pH.
The pH of surface water in the study area ranges from 2.0 to 8.0. About two-thirds of the streams sampled for pH were less than 7.0.
51

Table 16. Source and significance of constituents and properties of ground water and surface water Continued
Constituent or property
Sourc^;-0r cause Significance in ground water Significance in surface water
Phosphate (PO.) In very small quantities from, 4i'*: most rocks and soils. The chief
,,. " sources are fertilizer and detergents.
Not a problem at concentrations generally encountered.
May stimulate overabundance of aquatic vegetation; see under nitrate.
Sulfate (SO.) By solution and oxidation of sul- fide minerals, especially iron sulfide (pyrite). Concentrated in coal-mine drainage. Also present in some industrial waste and sewage.
Chief anion in mine drainage and in all high dissolved-solids water. Forms sulfuric acid. Sulfate may cause detectable tastes at concen trations of 300-400 mg/L. At con centrations above 600 mg/L sulfate may have laxative effect.
See significance in ground water.
Suspended Caused by a wide variety of con- solids stituents including sediments,
organic material, metal hydrox ides, and microorganisms.
Suspended solids are a problem in water supply for esthetic reasons and because of abrasive effects on pipes, pumps, and turbine blades.
High concentrations affect aquatic life by inhibiting light penetration, in fluencing temperature, and interfering with respiration and reproduction of fish. Factors concerning water supply are the same as for ground water.
Temperature At depths less than 30 to 60 feet I Nearly constant temperature, which temperatures fluctuate seasonally makes it desirable for cooling, and nearly equal the average j annual air temperature. At deptns greater than 60 feet, temperatures increase about 1°F/100 ft. ]
Controls physical, chemical, and bio logical processes.
Trace- elements Rocks, landfill leachates, domestic Depends on element, much not known, and industrial wastes. Some, such as copper and zinc, from pipes carrying the water.
See significance in ground water.

Table 17. Federal mandatory and recommended limits for selectedcontaminants of drinking water for public supply systems
[Limits in milligrams per liter except as indicated]
II 21 Contaminant Mandatory limit Recommended limit
Arsenic (As) 0.05Barium (Ba) 1.Cadmium (Cd) .010 Chromium (Cr) .05 Lead (Pb) .05Mercury (Hg) .002 Nitrate (N) 10.Selenium (Se) .01 Silver (Ag) .05 Chloride (Cl) 250Color (color units) 15Copper (Cu) 1Corrosivity NoncorrosiveFoaming agents .5Hydrogen sulfide .05Iron (Fe) .3Manganese .05Odor (threshold odor number) 3pH (units) 6.5-8.5Sulfate (SOi*) 250Total dissolved solids 500Zinc (Zn) 5
Tj-yU.S. Environmental Protection Agency (1975, p.5957). U.S. Environmental Protection Agency (1977, p. 17146).
53

Table 18. Selected water-quality criteria for Pennsylvania.!/
[Water-quality criteria are based on water us«>. The selection of numerical values for toxic substances is to insure protection of the water having the most restrictive use criteria and to provide: a basis of control for these substances. Protected uses include aquatic life, water supply, recreation, and special protection waters].!/ |
Constituent Recommended criterion
Alkalinity as CaCOs
Aluminum (Al)
Arsenic (As) Chromium (Cr) Copper (Cu)
Cyanide (CN) Flouride (F) Iron (Fe)
Lead (Pb) Manganese (Mn) Nickel (Ni)
Nitrite plus nitrate as NPHPhenolSulfate (SOt*)Zinc (Zn)
Alkalinity shall be 20 mg/L or more asexcept where re.tural conditions are less.
Not to exceed 0.] of the 96-hour LC50 for represen tative important species .-2/
Not to exceed 0.05 mg/L of total arsenic.Not to exceed 0.05 mg/L as hexavalent chromium.Not to exceed 0.1 of the 96-hour LC50 for represen
tative important species.Not to exceed 0.005 mg/L as free cyanide.Not to exceed 2.0 mg/L.Not to exceed 1.5 mg/L as total iron; not to exceed 0.3 mg/L as dissolved iron.
to exceed O.C5 mg/L.to exceed l.C mg/L as total manganese.to exceed 0.01 of the 96-hour LC50 for
Not Not Not
representative Not to exceed 10 Not less than 6.0
important species. mg/L as nitrate nitrogen, and not more than 9.0.
Not to exceed 0.005 mg/L.Not to exceed 250Not to exceed 0.01 of the 96-hour LC50 for repre sentative important species.
mg/L.
Pennsylvania Department of Environmental Resources (1978, p. 522-526). The 96-hour LC50 value is the concentration, of a pollutant in test waters that is lethal to 50 percent of the test organisms during continuous exposure for a period of 96 hours. Representative important species are defined as those species of aquatic life whose protection and propagation will assure thesustained presence of a balanced community of aquatic life and waterfowl in andon the waters of the Commonwealth* Such species are representative in the sense that maintenance of water-quality crjteria will assure both the natural completion of the species' life cycle and the overall protection and propagation of the balanced community* \
54

Table 19.--Major effects of selected types of contamination
Effects
Contamination of ground water
Contamination of surface water
Large concentrations can restrict use for public supply
Health hazard
Linked to causing cancer
Odor problems
Taste problems
Esthetically displeasing
Increases flood hazard
Fills reservoirs
Decrease in dissolved oxygen
Overabundance of algae and/or aquatic vegetation
Disrupts the food chains of aquatic life
Reduction in number and kinds of naturally occurring aquatic organisms
Toxic to selected aquatic organisms
Types of Contamination
Agriculture
to ij <u
iX
X
X
-
"
X
"
X
X
X
-
S> H
IO Ha & £
X
X
X
"
X
-
X
X
X
X
X
"
n
X
X
X
X
"
"
"
X
X
X
Sediment
-
X
X
-
"
X
X
-
X
X
"
Manufacturing
Inorganic chemicals
X
X
X
X
X
X
X
-
X
X
X
Metals
X
X
X
X
X
X
"
X
X
X
Organic chemicals
X
X
X
X
X
X
X
X
X
X
Solid wastes
X
X
"
X
X
X
X
X
X
X
Thermal
--
X
--
--
--
X
X
X
X
Logging
Sediment
--
X
X
"
X
X
X
"
X
X
UJ IW
h
eo4Jw
-
X
--
«
X
X
X
X
X
X
Mining
Sediment
-
X
X
-
X
X
X
-
X
X
inrH<d
2
X
X
X
"
"
--
X
X
X
Urban
n <u4Jn g 0 H
Oen
X
X
-
X
X
X
X
,x
IW IW
h
e4J CO
"
X
-
X
X
X
X
X
Sewage
.3 \t4J
3
X
X
X
X
"
-
X
X
(0tHid
£X
X
X
"
-
-
X
X
X
a4J
£ Hh
I
X
X
X
"
--
"
X
X
X
Organic loading
X
X
X
"
X
X
X
X
X
X
a 3fHs 118-£
-
X
X
--
X
"
-
X
"
55

The oxidation of pyrite contributes large quantities of sulfuric acid and iron compounds to receiving waters. As a result, the pH of the water is commonly below 4. Effects of mine drainage on the chemistry of a stream include depletion of bicarbonate, increase in the titratable acidity, lowering of pH, introduction of various cations, and in places and at times, reduction in the quantity of oxygen dissolved in the stream.
Constituents and properties routinely and assessment of mine drainage include acidi ferrous iron, hardness, manganese, pH, s
measured
specific
Quality of Ground Waiter
in water in the detection ty, alkalinity, ferric and
conductance, and sulfate.
Data Base
Field data, chiefly pH, hardness, and specific conductance, of water from 350 wells are given in table 1 of Buckwalter and others (1979); about 300 chemical analyses, including major anions, cations, and nutrients of water from 196 wells and 43 springs in table 3; and 66 trace-element analyses in table 4. Temperature, hardness, specific conductance, pH, and total iron measurements are also reported for 47 springs in table 2. Chem ical analyses of water from abandoned flowing oil and gas wells are given in tables 3 and 4 of both Buckwalter and others (1979) and Koester and Lescinsky (1976). Locations of wells, springs, and mine drainages are given in figures 2-51 of Buckwalter and others (1979) snd abandoned flowing oil and gas wells in figure 1 of Koester and Lescinsky (1976).
Quality of Water in Aquifers
Summary statistics of laboratory analyses teristics of water from aquifers are presented summary statistics of field analyses of pH, ductance of water from wells and springs in
of selected quality charac- in table 20. Table 21 gives
hardness, and specific con- selected aquifers.
estimateSpecific conductance can be used to tration, as the two are proportional. Because ments are cheaper and many more were made than information on approximate dissolved-solids extended. Median ratios of dissolved solids 180°C) to specific conductance were computed
Aquifer
dissolved-solids concen- specific-conductance measure- dissolved-solids determinations,
concentration can be greatly (residue on evaporation at for selected aquifers:
Allegheny GroupPottsville GroupLower Mississippian rocks
Ratio
0.600.670.63
Through the use of these ratios, the dissolved-solids statistics in the following sections were calculated from specific-conductance data in table 21.
56
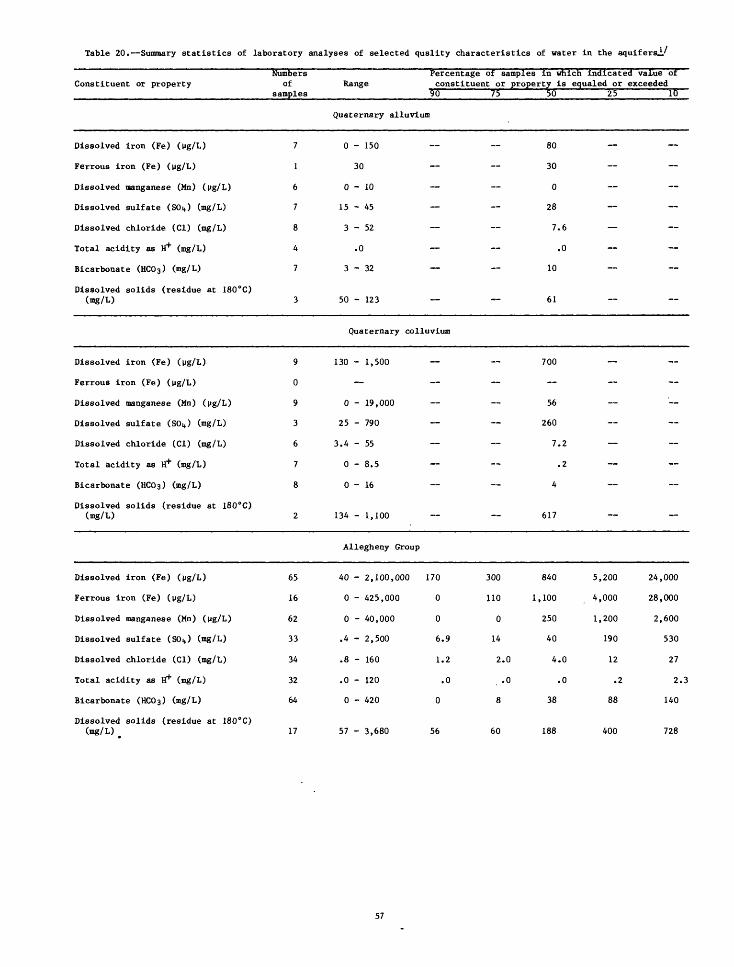
Table 20. Summary statistics of laboratory analyses of selected quslity characteristics of water in the aquiferai/
Constituent or propertyNumbers
of samples
Percentage of samples in which indicated value of Range constituent or property is equaled or exceeded
90 75 50 25 10
Quaternary alluvium
Dissolved iron (Fe) (Ug/L)
Ferrous iron (Fe) (Mg/L)
Dissolved manganese (Mn) (Mg/L)
Dissolved sulfate (SOi*) (mg/L)
Dissolved chloride (Cl) (mg/L)
Total acidity as tf*" (mg/L)
Bicarbonate (HC03 ) (mg/L)
Dissolved solids (residue at 180°C) (mg/L)
7
1
6
7
8
4
7
3
0 - 150
30
0-10
15 - 45
3-52
.0
3-32
50 - 123
80
30
0
OQio
7.6
Q ,
10
61
Quaternary colluvium
Dissolved iron (Fe) (Mg/L)
Ferrous iron (Fe) (Mg/L)
Dissolved manganese (Mn) (Mg/L)
Dissolved sulfate (SOi,) (mg/L)
Dissolved chloride (Cl) (mg/L)
Total acidity as H+ (mg/L)
Bicarbonate (HCOa) (mg/L)
Dissolved solids (residue at 180°C) (mg/L)
9
0
9
3
6
7
8
2
130 - 1,500
0 - 19,000
25 - 790
3.4 - 55
0 - 8.5
0-16
134 - 1,100
700
56
260
7.2
.2
4
617
Allegheny Group
Dissolved iron (Fe) (Mg/L)
Ferrous iron (Fe) (Mg/L)
Dissolved manganese (Mn) (Mg/L)
Dissolved sulfate (SOij) (mg/L)
Dissolved chloride (Cl) (mg/L)
Total acidity as S4" (mg/L)
Bicarbonate (HC0 3 ) (mg/L)
65
16
62
33
34
32
64
40 - 2,100,000 170 300
0 - 425,000 0 110
0 - 40,000 0 0
.4 - 2,500 6.9 14
.8 - 160 1.2 2
.0 - 120 .0
0-420 0 8
840 5,200 24,000
1,100 4,000 28,000
250 1,200 2,600
40 190 530
.0 4.0 12 27
.0 .0 .2 2.3
38 88 140
Dissolved solids (residue at 180°C) (mg/L) 17 57 - 3,680 56 60 188 400 728
57

Table 20. Summary statistics of laboratory analyses or selected quality characteristics of water in the aquifer si' Continued
Constituent or propertyNumbers
of samples
Percentage of samples in which indicated value of Range [constituent or property is equaled or exceeded
W 75 50 25 10
Pottsville Group
Dissolved iron (Fe) (ug/L)
Ferrous iron (Fe) (ug/L)
Dissolved manganese (Mn) (ug/L)
Dissolved sulfate (S0i») Ug/L)
Dissolved chloride (Cl) (mg/L)
Total acidity as H* (mg/L)
Bicarbonate (HCOa) (mg/L)
Dissolved solids (residue at 180°C) (mg/L)
96
27
95
42
47
41
97
25
0
0
0
.2
.5
.0
0
13
- 280,000 110
- 135,000 |0
- 280,00 JO
- 6,200 [2
- 900 ''
- 45
- 240 0
- 7,400 2\
590
100
100
.9 9.9
.9 3.2
.0 .0
2
42
2,300
7,500
520
34
6.2
.0
16
227
18,800
31,000
1,300
320
26
1.0
39
564
53,000
70,300
7,800
1,000
63
5.6
120
1,225
Lower Missisaippian rocks. . . . .. .. . i . . _
Dissolved iron (Fe) (Mg/L)
Ferrous iron (Fe) (Mg/L)
Dissolved manganese (Mn) (Mg/L)
Dissolved sulfate (S0i») (mg/L)
Dissolved chloride (Cl) (mg/L)
Total acidity as H* (mg/L)
Bicarbonate (HCOs) (mg/L)
Dissolved solids (residue at 180°C) (mg/L)
37
10
33
30
35
9
34
26
0
830
0
.2
.6
.0
0
31
i - 250,000 6(^
- 50,000 1,100
- 40,000 ICJ
- 950 l|
- 1,670 ^
- 4.9
- 240 2
- 2,710 50
360
1,200
140
.2 3.1
.7 5.2
26
71
2,600
3,200
380
17
12
.2
74
176
10,100
8,100
1,200
40
86
160
388
34,000
9,000
2,000
480
332
210
875
A/Computed from chemical analyses in Buckwalter and others (1979, table }, p. 110-117).
58

Table 21. Summary statistics of field analyses of hardness, specific conductance, and pH of water in selected aquifers I/,If
Constituent or property
Number of Percentage of wells in which wells and Range indicated value of constituentsprings property is equaled or exceeded90* ^ ^ -
Quaternary alluvium
Hardness (Ca, Mg) as CaC03 (mg/L)
Specific conductance (micromhos at 25°C)
pH
30 - 120
165 - 220
5.0
70
192
5.0
Quaternary colluvium
Hardness (Ca, Mg) as 8 CaC03 (mg/L)
Specific conductance 9 (micromhos at 25°C)
pH 6
20 - 410
50 - 1,500
3.6 - 6.5
40
185
5.0
Conemaugh Group
Hardness (Ca, Mg) as CaC03 (mg/L)
Specific conductance (micromhos at 25°C)
pH
100
155 - 920
100
515
Allegheny Group
Hardness(Ca, Mg) asCaC03 (mg/L) 52
Specific conductance(micromhos at 25°C) 55
pH 40
20 - 630 30 30 90 140 290
44 - 5,500 89 138 215 380 1,240
4.3 - 7.7 5.0 5.6 6.4 6.8 7.5
59

Table 21. Summary statistics of field analyses of hardness, specific conductance, and pH of water in selected aquifers JL' ,£' Continued
Constituent or property
Number of Percentage of wells in which wells and Range indicated value of constituentsprings property is equaled or exceeded
_______________________90 75 50 25 10
Pottsville Group
Hardness (Ca, Mg) asCaC0 3 (mg/L) 117
Specific conductance(micromhos at 25°C) 106
pH 84
20 - 990 30! 30 90 150 390
23 - 5,800 73! 115 225 412 1,190
3.2 - 8.2 4.3 5.4 6.2 6.8 7.5
Pennsylvanian rocks, combined
Hardness (Ca, Mg) as 170 CaCOs (mg/L)
Specific conductance 165 (micromhos at 25°C)
PH 124
20 - 990 30 30 90 140 290
} 23 - 5,800 80 | 120 225 400 1,190
3.2 - 8.2 4.4 5.4 6.2 6.8 7.5
Lower Mississippian rocks
Hardness (Ca, Mg) as CaC0 3 (mg/L) 51
Specific conductance (micromhos at 25°C) 37
pH 41
Hardness (Ca, Mg) as CaC0 3 (mg/L) 221
Specific conductance (micromhos ar 25°C) 202
pH 165
20 -
52 -
4.5 -
Bedrock,
20 -
23 -
3.2 -
500 30
4,230 93
7.9 5.i
combined
990 30
5,800 80
8.2 4.7
70 90 140 270
145 350 965 1,890
6.2 6.6 7.0 7.2
50 90 40 70
20 35 31 1,270
5.6 6.3 6.8 7.5
__'Computed from field chemical data in Buckwalter and others (1979, tables 1 and 2,p. 58-109).
.£'Springs were sampled only in Quaternary colluvium.
60

The ranges in tables 20 and 21 indicate that water quality is highly variable within an aquifer. The median values of hardness, specific con ductance, and pH are similar in water from the Allegheny and Pottsville Groups. Conductances are slightly higher in the Lower Mississippian rocks.
Data on the quality of water in the Quaternary alluvium pertain chiefly to springs in Clarion County. Median values indicate the water is soft, acidic, and does not exceed U.S. EPA recommended limits for iron, manganese, and sulfate. The water is generally of better quality than that from bedrock in the same area. The quality of the water that discharges from springs in the alluvium is probably due to its shorter flow path and residence time from the recharge to discharge area.
Data on the quality of water in the Quaternary colluvium are also derived primarily from springs in Clarion County. The quality is highly variable. Iron, manganese, and sulfate exceed the recommended limits of EPA in more than half the samples. The maximum values of manganese, sulfate, and acidity in table 20 were obtained from several springs near abandoned strip mines.
More than half of the wells sampled in the Allegheny Group had moder ately hard to very hard water. Iron exceeded the EPA recommended limit of 0.3 mg/L in 75 percent of the samples; manganese, the 0.05 mg/L recommended limit in over 50 percent (and by a factor of 10 or 0.50 mg/L in over 25 per cent) ; and sulfate, the recommended limit of 250 mg/L in over 10 percent of the samples. Mercury concentrations were above the EPA mandatory limit of 0.002 mg/L in two samples from well Fo-11 in the Clarion Formation of the Allegheny Group. Water from 50 percent of the wells sampled for pH was in the recommended range of 6.5-8.5. Less than 25 percent of the samples had dissolved-solids concentrations greater than the recommended limit of 500 mg/L.
In over half the wells sampled in the Pottsville Group, the water was moderately hard to very hard. Iron equaled or exceeded 2.3 mg/L and man ganese 0.52 mg/L in half of the samples, and both exceeded the EPA recom mended limits in over 75 percent. More than 25 percent of the samples contained more than the recommended amount of sulfate. Samples from three wells exceeded the limit for chloride. Mandatory EPA limits for cadmium were exceeded in two springs and for chromium in one spring. Excessive zinc (5 mg/L) was present in one spring and one well in Clarion County. Water from over 50 percent of the wells sampled for pH are below the recommended range of 6.5-8.5. Less than 25 percent of the water had too much dissolved solids (500 mg/L). Several samples from wells and springs in Clarion County were among the highest recorded for specific conductance, iron, manganese, and sulfate.
In more than half the wells sampled in the Lower Mississippian rocks, the water was moderately hard to very hard. The recommended limits for iron (0.3 mg/L) and manganese (0.05 mg/L) were exceeded in more than 75 percent of the samples, and for sulfate in less than 25 percent of the samples. Water from five wells contained excessive chloride. More than 50 percent of the pH values are in the recommended range of 6.5-8.5. Less than a fourth of the samples had more than 500 mg/L dissolved solids.
61
Quality of Water from Flowing Wells
Highly mineralized water flows into many tributaries of the Clarion River and Redbank Creek from some abandoned oil and gas wells. In the Clarion River basin, most of these wells flow into the Little Toby Creek, Toms Run, Mill Creek, Toby Creek, Piney Creek, Deer Creek, and Licking Creek watersheds. In the Redbank Creek basin, flows are mostly into the Little Sandy Creek, Welch Run, Simpson Run, and Cod^r Run watersheds.
It is commonly impossible to determine 1:he aquifer responsible for the water that flows from these abandoned oil anc gas wells. Host wells are bridged (or closed off) near the surface, making it difficult to measure depth, log geophysically, or determine water-bearing zones. In some places, the wells cannot be exactly located because the well casings have been destroyed. Most of the water probably comes from the Pottsville Group or Lower Mississippian aquifers below valleys because (1) the flowing wells that have been studied derive their fldw from these aquifers, (2) the high chloride concentrations and brines typical of the Devonian (Poth, 1962) were not found, and (3) local storms commonly resulted in increased flows, which would not be expected if the water came from the deeper aquifers.
Most of the flowing wells studied were l|n watersheds that have been extensively mined for coal. Because of the mining, water from the flowing wells commonly contains high concentrations otf iron, manganese, sulfate, acidity, and trace-elements. Specific conductances over 2,000 ymho are common. The median ratio of dissolved-solidsi concentration to specific conductance is 0.73. Thus, dissolved solids commonly exceed 1,500 mg/L. A pH of 2.9 was measured at a flowing well in the Hill Creek watershed of the Clarion River basin. Concentrations over 100 mg/L of iron and 300 mg/L of sulfate were reported for flowing wells in many watersheds, including Welch Run, Mill Creek, Licking Creek, Deer Creek, aid Toby Creek.
Relation of Topography to Water Quality
Summary statistics of hardness, specific conductance, and pH in water from wells drilled on hilltops, hillsides, and in valleys are given in table 22. The statistics indicate that water from wells on hilltops generally has slightly better quality than that from we!,Is on hillsides. The calculated median dissolved-solids concentrations of watur from hilltop and hillside wells are 140 and 215 mg/L, respectively. Several factors may account for this observation. In places, hilltop wells are less likely to penetrate coal beds and the associated poor-quality wat<tr than hillside wells. Water in hillside wells has moved along longer flow paths and so has longer resi dence time in aquifers, resulting in dissolutj.on of more minerals. In addition, wells on hillsides have a greater probability of penetrating an aquifer of wide areal extent and below local crainage than wells on hilltops. Contaminants in these aquifers, such as those caused by coal mining, may move long distances and degrade the quality of the water several miles away.
62

Table 22. Summary statistics of field analyses of hardness,specific conductance, and pH of water from wellsin hilltop, hillside, and valley topographies
Number Constituent or of
property wells
Percentage of wells in which Range indicated value of constituent
property is equaled or exceeded90 75 50 25 10
Hilltop
Hardness (Ca, Mg) as CaCOa (mg/L) 61
Specific conductance (micromhos at 25 °C) 64
pH 50
20 - 600 20
23 - 5,500 70
4.2 - 7.7 4.5
30 70 140 310
119 230 495 1,190
5.2 6.2 6.6 7.1
Hillside
Hardness (Ca, Mg) as CaC0 3 (mg/L) 131
Specific conductance (micromhos at 25*C) 153
pH 128
20 - 1,500 30
52 - 5,800 100
3.2 - 8.2 4.3
50 100 200 620
160 340 888 1,860
4.9 6.0 6.6 7.1
Valley
Hardness (Ca, Mg) as CaC0 3 (mg/L) 49
Specific conductance (micromhos at 25°C) 70
pH 65
20 - 1,370 30
50 - 5,200 130
2.9 - 8.0 4.5
70 90 120 340
260 545 1,200 2,370
5.5 6.4 7.0 7.5
63

Water from bedrock wells in valleys hasconductance. The median dissolved-solids concentration in valley wells is 340 mg/L. Wells in valleys generally tap water that has a long residencetime. As stream valleys are areas of ground
the highest median specific
-water discharge, they mayreceive ground water from mined areas on hiljLtops and hillsides. Further more, the tendency of municipalities and industries to locate in valleys and dispose of wastes there may result in ground-Hwater contamination.
Areal Ground-Water Quality
Measurements of hardness, specific conductance, and pH of ground water in the Clarion River and Redbank Creek basing are summarized in table 23. The statistics indicate that ground water in the Clarion River basin is slightly more acidic and generally higher in dissolved solids than in the Redbank Creek basin. j
The quality is generally better in the northern half of the Clarion River basin than in the southern half except in the East Branch Clarion River, Elk Creek, and Little Toby Creek watersheds. In these watersheds, particularly the Swamp Creek and Johnson Run watersheds of the East Branch Clarion River and the Daguscahonda Creek watershed of the Elk Creek drainage area, ground- water quality has been degraded because of coal mining. In much of the northern half of the Little Toby Creek basin, coal mining has caused higher than normal concentrations of iron, manganesej, and sulfate (for example, in Limestone Run, Kyler Run, Sawmill Run, Brandyt Camp Creek, and Mead Run). In watersheds in the northern half of the Clario|n River basin not influenced by mining (for example, West Branch Clarion River, Big Mill Creek, Bear Creek, Spring Creek, and Millstone Creek), median dissolved-solids concentrations are lower than in watersheds affected by mining. However, even in a few watersheds unaffected by mining (Spring Creek, Millstone Creek), iron and manganese may naturally occur in concentrations exceeding EPA recommended limits.
In the southern half of the Clarion Rive severely degraded in areas that have been ext areas, however, have ground water of good quality in many watersheds, including those of Mill, Creeks, where water of poor quality discharge Water of good quality is present in the basins Gathers, Maxwell, and Blyson Runs, and in the
basin, much ground water is ansively mined for coal; some
Degradation has occurred Toby, Piney, Deer, and Licking 3 from numerous flowing wells.of Maple Creek, Coleman, headwater area of Mill Creek.
In the Redbank Creek basin, ground-water quality ranges from fairly good to severely degraded. It is best in some of the northern areas, including the basins of North Fork, Mill Creek, and several tributaries to Sandy Lick Creek. Downstream from Brookville,, the ground water in many tributary watersheds is degraded, primarily as a result of coal mining (for example, in Coder, Welch, Runaway, Beaver, To\jm, Leisure, and Wildcat Runs, and Little Sandy Creek).
64
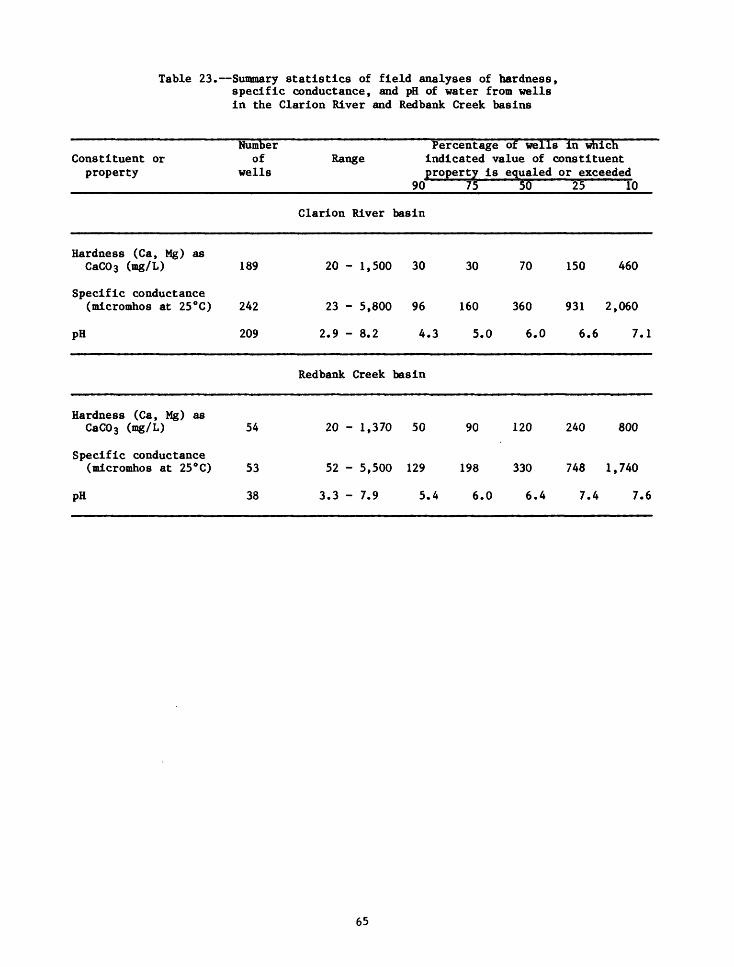
Table 23. Summary statistics of field analyses of hardness, specific conductance, and pH of water from wells in the Clarion River and Redbank Creek basins
Constituent or property
Numberof
wells
Percentage of wells in which Range indicated value of constituent
property is equaled or exceeded 90 75 50 25 10
Clarion River basin
Hardness (Ca, Mg) asCaC0 3 (mg/L) 189
Specific conductance(micromhos at 25°C) 242
pH 209
20 - 1,500 30 30 70 150 460
23 - 5,800 96 160 360 931 2,060
2.9 - 8.2 4.3 5.0 6.0 6.6 7.1
Redbank Creek basin
Hardness (Ca, Mg) asCaC0 3 (mg/L) 54
Specific conductance(micromhos at 25°C) 53
pH 38
20 - 1,370 50 90 120 240 800
52 - 5,500 129 198 330 748 1,740
3.3 - 7.9 5.4 6.0 6.4 7.4 7.6
65
Areal ground-water quality can also be assessed through the use of surface-water quality data collected at base iilow. Streams at base flow, discharge ground water, largely or entirely, ^Ithpugh the flow may also be augmented from industries or municipalities o^: from reservoirs. Information on which stations are affected by reservoir regulation is given in the surface-water hydrology section. With the exception of Elk Creek in Elk County, the contribution to streamflow at base flow by industrial or munic ipal discharge is relatively small.
Evaluation of ground-water quality through quality data is particularly valuable in areasi the large undeveloped and forested parts of
the use of base-flow stream- of few water wells, such as and Forest Counties.Elk
Base-flow samples were collected at all gaging stations and in selected tributary streams during 1971-76 to assess ground-water quality. Most of the chemical analyses given in Koester and Lescinsky (1976, tables 6a-c) collected during August, September, and Octobeir represent base-flow condi tions. Chemical analyses of base-flow samplinjg are also given in Buckwalter and others (1979, table 6). |
The quality of water in specific aquifers can also be assessed, as the base flow at a particular site reflects the gejneral quality of aquifers upstream. By plotting the location of a streab-sampling site on the bedrock geologic map (plate 1), the aquifers that contribute the water can be identi fied. Millstone Creek, for example, drains anj undeveloped and heavily forested area in Elk and Forest Counties, wher^ few water wells are avail able. Stream-quality data were collected at b^se flow on October 11, 1972, at two sites (Koester and Lescinsky, 1976, table 6a). The sample at the mouth of the creek consisted mostly of water from the Pottsville Group plus a little from the Allegheny and Lower Mississippian rocks. The sample upstream on the East Branch Millstone Creek was comprised of water chiefly from the Pottsville Group and a little from tha Allegheny. Both samples were similar in composition, soft, low in sulfate and chloride, and con tained some alkalinity. There was no acidity or ferrous iron. The only excessive constituent was dissolved ferric iron, which averaged 0.88 mg/L.
Quality of Surface iteter
Data Base j t
Most of the chemical analyses of streams are in Koester and Lescinsky (1976). Tables 6a-c give analyses of about 800 samples collected during 1969-75 at 164 stream sites. Station descriptions, drainage areas, and selected discharge measurements are listed for the data-collection sites. Buckwalter and others (1979) also gives data OIL stream quality (also in table 6) and locations of the sites on page-siz;e reductions of 7^-minute topographic quadrangle maps. In the present r(sport, figure 10 shows the major tributary streams and the locations of selected gaging and chemical quality stations. Table 24 gives information o|n the stations.
Some data are also published annually sinde 1961 in the Survey's "Water Resources Data for Pennsylvania."
66

2,9
(D
I O
O Hi
(DO.
0) rt P> rt H-
§ 0>

Table
24.
Sele
cted
data co
llec
tion
sites
Stat
ion
numb
erDrainage
Stat
ion
name
area (mi2)
71/2-
Quad
rang
leLa
titu
deLongitude
Figu
re
number^.'
Clar
ion
River
basin
2650
0
26850
27500
27545
28000
2850
0
2852
0
28900
29000
29120
2913
6
29150
29170
29180
2918
5
2919
5
29250
29400
29500
2970
0
3010
6
30500
Seve
nmil
e Ru
n ne
ar Ra
ssel
asi'
Swam
p Cr
eek
near
Rasselas
East
Br
anch
Cl
ario
n River
at East
Bran
ch Cl
ario
n River
Dami'
East Br
anch
Cl
ario
n River
abov
e Gl
en Ha
zel
West Br
anch
Cl
ario
n River
at Wi
lcox
i/
Clar
ion
River
at Johnsonburgi'
Powers Ru
n at
mouth
Elk
Creek
at Ri
dgwa
y
Clar
ion
River
at RidgwayJ/
Big
Mill Creek
near
Ri
dgwa
y
Litt
le Toby Cr
eek
at Kylers Co
rner
s
Litt
le Toby Creek
at Brockway
Litt
le Toby Creek
at Portland Mills
Bear
Creek
near
Ri
dgwa
y
Spri
ng Cr
eek
near
Hal It
on
Millstone
Cree
k ne
ar Clarington
Maple
Creek
near
Cl
arin
gton
Toms Ru
n at
Co
oksb
urgi
/
Clar
ion
River
at Co
oksb
urgJ
/
Mill Cr
eek
near
St
ratt
anvi
lle
Toby Creek
near
Cl
ario
n
Clar
ion
River
near Pi
neyJ
/
7.84
3.61
73.2
80.1
63.0
204 11.8
64.1
303 9.
04
6.44
54.0
126 38.8
86.0
54.2
18.7
12.6
807 66.1
35.0
951
Haze
l Hu
rst
Glen Hazel
Glen Hazel
Glen
Hazel
Wilcox
Ridg
way
Ridg
way
Ridg
way
Ridg
way
Port
land
Mills
Bran
dy Ca
mp
Carm
an
Carman
Port
land
Mi
lls
Hall
ton
Sigel
Cook
sbur
g
Cook
sbur
g
Cooksburg
Stra
ttan
vill
e
Clar
ion
Clar
ion
41°3
7'52
"
41°3
5'30
"
41°35'11
M
41°32'40"
41°34'31
M
41°2
9'10
"
41°2
8'45
"
41°2
5'31
"
41°2
5'15
"
41°2
4'58
"
41°19'05"
41°15'09
M
41°2
1'53
"
41°2
3'52
"
41°2
4'59
"
41°2ri9"
41°2
0'32
"
41°2
0'16
"
41°1
9'50
"
41°1
4'15
"
41°14'05
M
41°1
1'33
"
78°3
4'37
"
78°3
5'46
"
78°35'47"
78°3
6'50
"
78°4
1'33
"
78°40'43"
78°4
0'12
"
78°43'38"
78°44'10"
78°4
6'31
"
78"38'26"
78°47'48"
78°4
9'22
"
78°49'23"
78°5
6'52
"
79°04'18"
79°08'19"
79°1
2'50
"
79°1
2'33
"
79°17'11"
79°2
3'06
"
79°2
6'25
"
19 17 17 17 50 37 37 37 37 35 2 4 4 35 18 42 6 6 6
44
5 5

Table
24. Selected da
ta co
llec
tion
sites Continued
Station
numb
erDrainage
Stat
ion
name
ar
ea (mi2)
Clarion
River
30515
30600
30700
30750
3090
0
3100
0
31600
31620
3168
0
31770
3187
6
31880
31882
31895
31950
3198
0
3205
5
32100
32400
3250
0
Clar
ion
River
at Piney
Piney
Creek
at Piney
Deer Cr
eek
at Pi
ney
Canoe
Creek
near
Callensburg
Lick
ing
Creek
at Callensburg
Clarion
River
at St.
Petersburg
1
Sandy
Lick Cree
k ne
ar Sabula
Labo
rde
Bran
ch near Homecamp
Sandy
Lick
Cr
eek
near
Fa
lls
Creek
Sandy
Lick
Creek
near
Brookville
North
Fork
ne
ar Richardsville
North
Fork
at
Br
ookv
ille
Redb
ank
Creek
at Brookville
Welch
Run
at Su
mmer
vill
e
Big
Run
near
Sprankle MillsJ/
Little Sa
ndy
Cree
k near North
Free
dom
Town Ru
n near Ha
wtho
rn
Leisure
Run
at New
Beth
lehe
m
Leatherwood
Creek
near
New
Bethlehem
Redbank
Creek
at St.
Char
lesJ
/
967 72.3
74.2
18.8
51.9
,246 Re
dban
k
4.65
15.5
86.9
158 71.3
98.2
327 4.
24
7.38
67.2 9.41
6.47
18.1
528
71/2
-Oua
dran
gle
basin Continued
Clar
ion
Clarion
Clarion
Knox
Rimersburg
Emle
nton
Creek
basi
n
Sabula
Luthersburg
DuBo
is
Broo
kvil
le
Brookville
Brookville
Brookville
Corsica
Valier
Summ
ervi
lle
New Bethlehem
New
Bethlehem
Slig
o
Temp
leto
n
Lati
tude
41°10'12"
41°1
0'12
"
41°1
0'24
"
41°09'46"
41°0
7'25
"
41°08'57"
41°08'26"
41°0
6'18
"
41°07'29"
41°0
9'20
"
41°1
3'44
"
41°0
9'36
"
41°0
9'29
"
41°0
7'30
"
40°5
9'30
"
41°01'58"
41°0
0'56
"
41°0
0'13
"
41°0
1'12
"
40°5
9'40
"
Long
itud
e
79028'
21"
79°28'20"
79°2
8'41
"
79°31'57"
79°3
4'06
"
79°39'37"
78°4
1'00
"
78°4
2'52
"
78°4
9'25
"
79°0
3'12
"
79°02'57"
79°0
4'29
"
79°04
I52"
79°10'58"
79°0
5'26
"
79°1
1'05
"
79°1
7'56
"
79°1
9'41
"
79°2
3'14
"
79°2
3'40
"
Figu
re
numb
erf/
5 5 5 24 38 14 40 27 12 3 3 3 3 8 49 45 33 33 43 46
^/Continuous-record
stre
amfl
ow ga
ging
st
atio
n.
JL/F
igur
e number of 7l
/2~m
inut
e to
pogr
aphi
c ma
pssh
owin
g da
ta co
llec
tion
sites
given
in Bu
ckwa
lter
and
othe
rs (1979).

The Pennsylvania Department of Environmental Resources operates the Pennsylvania Water-Quality Network that includes sites on streams in the Clarion River and Redbank Creek basins. Many of these chemical analyses from network sites were reported in Koester and Lescinsky (1976, tables 6a- c). Beginning with the 1976 water year, data from the State's network are included in "Water Resources Data for Pennsylvania, Volume 3: Ohio Riverand St. Lawrence River Basins." Information on Quality Network and other surface-water-qualityClarion River and Redbank Creek basins is available in the Comprehensive Water Quality Management Planning Program for Study Area 8 (Green Inter national Inc., 1975-78).
the Pennsylvania Water- programs concerning the
Chemical Characteristics
Concentration of dissolved solids in streams generally varies inversely with stream discharge. During low (or base) flaw, stream discharge is sustained by ground-water discharge that generally has a high concentration of dissolved solids, although during high flow, stream discharge is from precipitation and overland flow that has low concentrations of dissolved solids. The relation of dissolved-solids concentration to the variation in discharge of streams is shown for small drainage areas in figure 11, and large areas in figure 12.
Concentration of dissolved solids has a fix ductance of about 0.65. Specific conductance c easily, accurately, and inexpensively in the fL solved solids concentrations can only be obtain expensive laboratory methods. Therefore, speci used to extend the analyses of dissolved-solids
The chemical characteristics of 19 surface- during base flow is shown on a trilinear water Cations in solution are assumed to be calcium, potassium, and the anions are assumed to be bic and chloride. Any minor constituents present a uents that are chemically related. The diagram the percent milliequivalents per liter (meq/L) sample in small triangles in the lower part of plots were then extrapolated to the diamond- point representing the composition of the princ
shaped
d ratio to specific con- n be obtained quickly, Id, whereas reliable dis- d by time-consuming and ic conductance is generally concentrations.
water samples collected iinalysis diagram (fig. 13). magnesium, sodium, and rbonate, carbonate, sulfate, e summed with major constit- was prepared by first plotting 'f cations and anions of each he figure. Cation and anion
field to form a single pal solutes of the sample.
In order to identify the chemical type of a angles were subdivided and labeled on the basisand anions expressed in percentage reacting values. When an ion makes up 50 percent or more of its ionic group, the watei is classified according to the type designated by that ion. For example, siample 11 represents a calciumsulfate water. When no ion composes 50 percent
water sample, small tri- of predominance of cations
or more of the cationic oranionic group, the hydrochemical type is designs.ted by the first and second most abundant ions. Sample 4 represents calcium^ sodium chloride sulfate water.
70
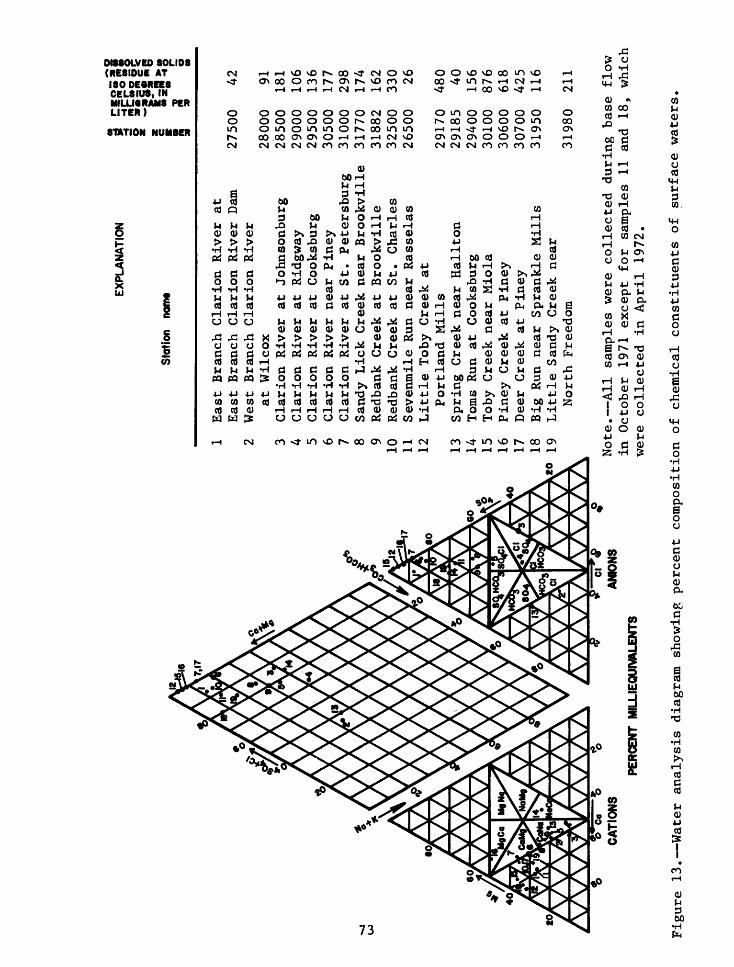
EXPL
AN
ATI
ON
i
Stat
ion
mm
*
CA
TIO
NS
A
NIO
NS
PER
CEN
T M
ILLI
EQU
IVA
LEN
TS
East
Branch Cl
ario
n River
atEast Br
anch
Clarion
River
Dam
2750
0 42
West Branch Cla
rion River
at Wilcox
2800
0 91
Clarion
River
at Johnsonburg
2850
0 181
Clarion
River
at Ri
dgwa
y 29
000
106
Clar
ion
River
at Cooksburg
2950
0 136
Clarion
River
near
Piney
30500
177
Clar
ion
River
at St
. Petersburg
3100
0 29
8 Sandy Lick Creek ne
ar Brookville
31770
174
Redbank Creek
at Brookville
31882
162
Redbank
Creek
at St.
Charles
32500
330
Sevenmile
Run
near Ra
ssel
as
2650
0 26
Li
ttle
To
by Creek
atPortland Mills
29170
480
Spring Creek nea
r Hallton
2918
5 40
To
ms Run
at Cooksburg
2940
0 15
6 To
by Creek
near
Miola
3010
0 876
Piney
Creek
at Piney
30600
618
Deer Creek
at Piney
30700
425
Big
Run
near Sprankle Mills
31950
116
Litt
le Sandy
Creek
near
North Fr
eedo
m 31980
211
Note. All samples
were
collected
during ba
se flow
in October
1971
ex
cept
fo
r samples
11 and
18,
which
were
co
llec
ted
in April
1972.
Figu
re 13. Water an
alys
is di
agra
m sh
owing
percent
composition
of chemical co
nsti
tuen
ts of surface
waters.

TheAlthough there are many combinations, the
found is calcium sulfate (CaSOi+) (fig. 13). anion are calcium and sulfate for 13 samples, contain sulfate as their first or second most sulfate waters high in dissolved solids (for e>:ampl 17) indicate contamination by acid mine drainag; bicarbonate waters (for example, samples 2 and water.
predominant type of watermost abundant cation and
Only three samples do not £.bundant anion. Calcium
e, samples 12, 15, and e, whereas calcium sodium 13) indicate good quality
Relative downstream changes in the chemica.l composition of water in the Clarion River and Redbank Creek are shown in fj.gure 13. A comparison of the water composition of the upper part (samples 3 and 4) of the Clarion River to the lower part (samples 6 and 7) shows the following trends for cations and anions: (1) little change in calcium, (2) increase in magnesium, (3) de crease in sodium plus potassium, (4) decrease :.n bicarbonate, (5) large increase in sulfate, and (6) large decrease in chloride. A comparison of the water composition of the upper part (samples 8 and 9) of the Redbank Creek to the lower part (sample 10) shows these; trends: (1) little change in calcium, (2) increase in magnesium, (3) decrease in sodium plus potassium, (4) decrease in bicarbonate, (5) increase in sulfate, and (6) decrease in chloride. I
RedbankWater in both the Clarion River and sulfate in type. Secondary constituents bicarbonate, and chloride. As the water moves composition result magnesium increases, as and sulfate increases at the expense of bicarbc
indue e
soc ium
Creek is dominantly calcium magnesium, sodium, potassium,
downstream, slight changes in plus potassium decrease,
nate and chloride.
Areal Water Quality
Figure 14 shows streams with good quality mine drainage. The areal variation of specific: alkalinity, and nitrate is shown in figures for water-quality parameters for selected statJ The data for figures 15-19 and table 25 were values of selected water-quality parameters for sampling stations on the Clarion River are water-quality characteristics of the Clarion discussed in the following sections starting in ceeding toward the mouth.
and those affected by coal conductance, iron, sulfate,
Range and mean values ons are given in table 25.
collected during 1969-76. Mean the period 1962-75 for in table 26. The areal and Redbank Creek are
the headwaters and pro-
15-19
give m River
Clarion River basin water-quality assessment
During the 1930 f s and 1940 f s, the Clarionnated by organic substances from industries anc municipalities (Camp,Dresser, and McKee Consulting Engineers, 1949),
River was severely contami-
Presently (1978), it isrelatively free of organic contamination; the major water-quality problem is mine drainage.
74

300
250
CO
200UJoCO
CO UJO
150
100
Si soI-
oca300
o 250
c^ZOO
§ 150OooG 100
CO
50
28000West Branch Clarion River
at Wilcox, 1970-76.
Drainage Area 63.0 ml 2
I
I
10 20 50 100 200 500 1000
IIP
29400Toms Run at Cooksburg,
1970-76. Drainage Area
12.6 mi 2
0.5 I 2 5 10 20 50 DISCHARGE, IN CUBIC FEET PER SECOND
100
Figure 11. Variation of specitic conductance with instantaneous discharge in two streams having small drainage areas.
71
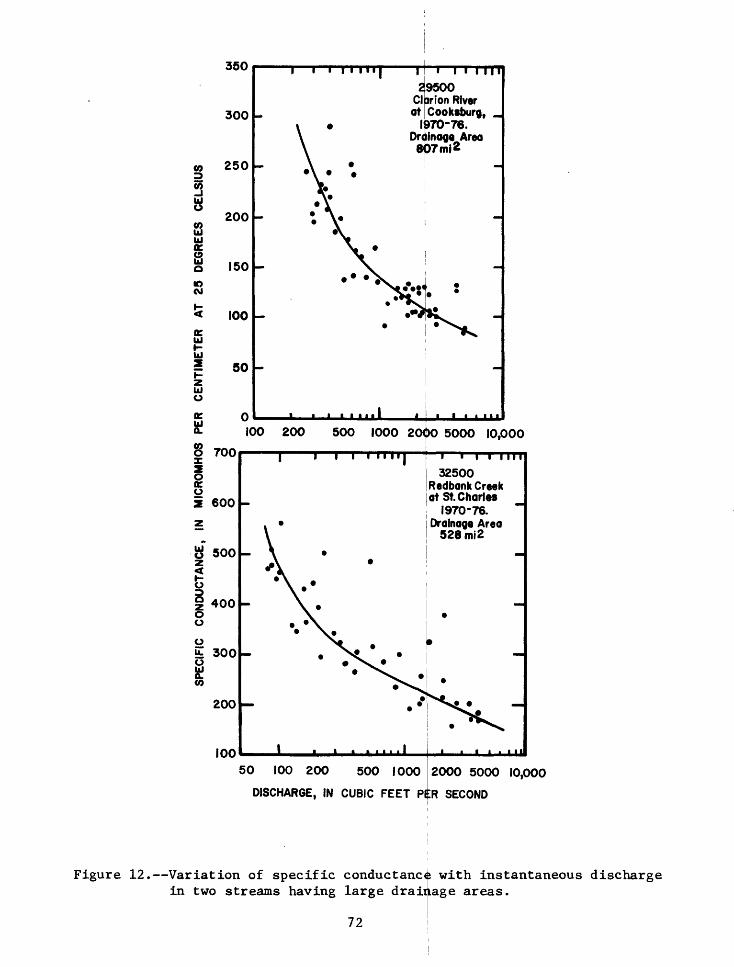
OQ I-Jrt
H
-£
03
O
rf H-
CO
Oft
P
tt>
Oto
M
i
CO
CO oD
* 0>
PJ
O<
H
-H
- M
iP
H«
OQ
O
I-1
O
P>
O
OQ
CX,
(D
C OC3
-> ft
H.
n
OQ
3fD
H
- rt
pj
pr
i-{ co
co
rf
P
P
rt
0}
P S e co
SPEC
IFIC
C
ON
DU
CTA
NC
E,
IN
MIC
RO
MH
OS
PER
C
EN
TIM
ETE
R
AT
25
DEG
REE
S C
ELS
IUS
Ol o
o
oO
i O
ro
roO
01
O
O01
O
o
OJ
Ol o
II
9.a
oM
- ffc^r
il^i'
i!«
"'
»Jo _
If
:
H«
CO
O ff OQ

79° 30'
79°
4I°4
5'
EXPL
ANAT
ION
Stre
am wit
h good wa
ter
qual
ity
Stre
am who
se qu
alit
y is
affected
by co
al mi
ne drainage
,^-«._-. Bas
in bo
unda
ry
D
Surf
ace-
wate
r intake or
re
serv
oir
used for mu
nici
pal
wate
r supply
EA
ST
BR
AN
CH
CLAR
ION
rave
n LA
KE
D4 1
8 1
1.I
1 s
l10
15
16 M
iles
25
Kilo
met
ers
Figure 14. Stream qu
alit
y of th
e Cl
ario
n Ri
ver
and
Redb
ank
Creek
basi
ns.

79° 30
'
4!°45'
Minimum
Average
Maximum
2800
0 S
tati
on
nu
mbe
rS
pecif
ic
conduct
ance
, in
m
icro
tnh
os,
19
70-7
6
048
161
11
1
0
31
89
5
54
0
12
20
1800
III
I 5
10
15
25
Mile
s
Kilo
met
ers
Figure 15. Areal va
riat
ion
of specific co
nduc
tanc
e of
su
rfac
e-wa
ter
samples.
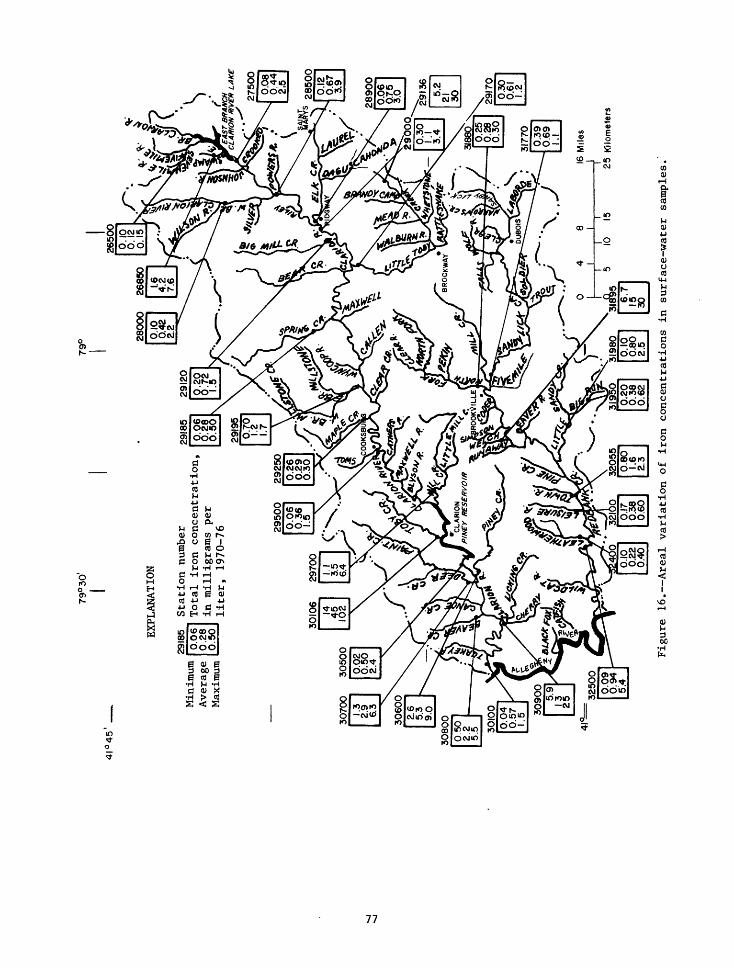
4I°45
79° 30'
EXPLANATION
79°
26500
«
28000
Minimum
Average
Maximum
2918
5Station number
Total iron concentration,
in milligrams per
liter, 1970-76
2918
5
l 25 K
ilom
eter
s
Figure 16. Areal variation of iron concentrations in
surface-water samples.
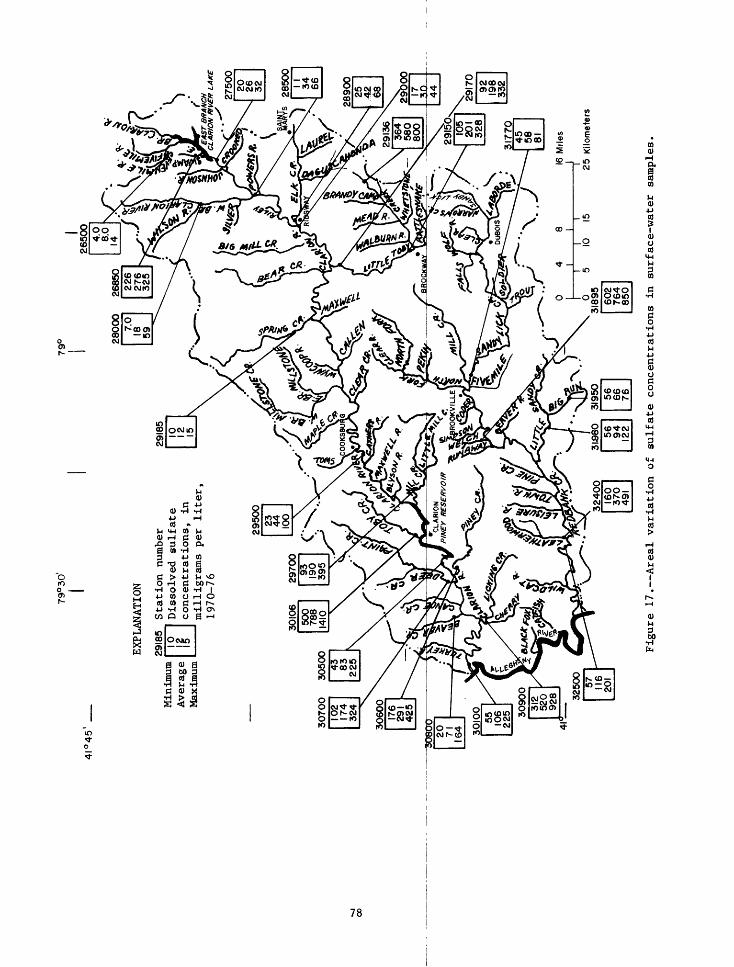
79°
30'
79°
4I°
45
' __
Min
imum
A
ver
age
Max
imum
EXPL
AN
ATI
ON
2918
5 S
tati
on
num
ber
Diss
olve
d su
lfat
e concentrations,
in
mill
igra
ms pe
r li
ter,
1970-76
V s
(
318
54
81
1
/^ -
^
45
7^^-
58
"S
81
16 M
iles
1111
1 D
5 10
15
25
Kilo
met
e 95
60
2
76
4
850
Figu
re 17. Areal variation
of su
lfat
e co
ncen
trat
ions
in surface-water
samples

79°30'
79
°
4!°45'
26
50
0
EX
PLA
NA
TIO
N
Minimum
Average
Maximum
28000
Station number
Alkalinity as Ca
CO-
in milligrams per
lite
r,
1970-76
(
\ (
318
548
16,11
i
D 95 0
0
0
III
! 5
10
15
25
Mile
s
Kilo
met
ers
Figure 18. Areal variation of alkalinity concentrations in surface-water samples.

79°
30'
79°
U°4
5'
8
28
00
0
Mini
mum
Average
Maxi
mum
EXPL
ANAT
ION
2750
0 Station
number
Diss
olve
d ni
trat
e as
N0
3 in mil
ligr
ams
per
lite
r, 1970-76
-5 0
\i
3188
22.
22.
8 3.
3
^"\.J-t
90 7 4
48
16 M
iles
1 1
IIII
1 5
10
15
25 K
ilom
eter
s
Figure 19. Areal variation
of nitrate
conc
entr
atio
ns in surface-water
samp
les.

se ?p ifl P 03I OQ 3 OQ
u>
o00
I ?
1 ?u»
U) NJ
S?Uo
00
rX*^
1 I
-~j I
Lrt
8? *- Ln
1
O
1 1
1 1
1 1
"i
S?CT»
N *
01 *
o> *.
1 1
1 1
1 1
M
Si
1 1
COn
rr
3
0
O
Of>
O
!a
»
Ketner
t
Of>
0
r
i-
i
i-
u>
r
>Ul
M
1-
K-
r
i
i
o
00M
«*J t00 <
.
1
r
i
jj
r
, Station .Vft-i9
03027589
r & " §"3> CD
- §
> f
S »
ff: i
1 £
'
f 3X :
J
1
1
1
=
J1
1^
4
(1
h
*
! '
Of>
r
Of> Of>
^-
o
'
Ni
0 O
1
r
i
£»
0
-:
*00 x
1
1
1
°t
»
'
sj 01 f 1 n t-J* H. O>
° §
03027550
3 O
-' i ^ fa
j a oo!> S- °
01
n o ITa? ff r
A
1 *- t~ 00
V-/l
00
? In ui>
Of>
1 00
r i*1 o
N> 1 **«
r 0 UlJ»
D W
t>
c *-
t
r
r
§
! ^ i
a
Station 37-450
0
oUl K>
1 -J
N O O
*C t*lI a *. SO
rr
01 a
1 ff
Ro
? 5 i- a
>- »
C OB
J- *
O B-
1 O NJ K-
Ul 1 H-
a
- I
o i
I =;
CO
o
1
1
J-
2
i5
a
Ln
r
*o
^o00
'
vc
f
1
1
1
0
s i
1°
1
1
1
* c -J
1
r*
B-
1
30
f ! - X, 1
5 3 D (D 9? U>
» if= 1 ' »
^.
0 '
Ji
3 °S
b30
1 1
1 1
1
1f-
> 0
r
i
r
E>
r
M rr
1 IO
O
O Ul 0
J I «* ip.u
r Rasselas
* ,.
HO 4*
C
b
b
vO
r
U)
o
T
1
c b
c
£
1
s
1
i1
r
<
i M < to f
'
i
c
4 V
<
O 0 <
<
r
r
r
i
Of*
00 *"
ht
c * <O f-
I
r
r
u> *M 4
0
1
CO
<0 (D
: o
o o
o J\
J1
[3
= Corr
illiamsvill
(D
r
s J1
: ^
= ?
>
r
j j
;
i
§s
to
Degrees Celsius
mlcromhos at 25°C
H- N
i
1
H
Discharge
Temperature
pH
Specific conductance
Dissolved oxygen (02)
Silica (Si02)
Total iron (Fe)
Ferrous iron (Fe)
Total manganese (Mn)
Calcium (Ca)
Magnesium (Mg)
Sodium + Potassium (Na + K)
Alkalinity as CaCOj
Acidity as CaCOj
Sulfate (S04)
Chloride (Cl)
Fluoride (F)
Nitrate (N03)
Phosphate (P04)
Hardness as CaCoj
Dissolved solids (Residue at 180°C)
gH(D
1
I
I8
I(D
8,
S
§
i8,gs1(D

Z8
I! !l II II II II 19 » i (ft O O W
OH (B b
"S §
1 i 1 90 O
' 5] ff
sl p i« 8
p? : W O
sj IfOa
« J
* T "^50 t
. . 8* .a
o o o r **
O -J
of °°. ; t£ ^
1 1
1 1
1 1
P 00 1
r ui * o
, . e
i i
i i
i i
i i
5 £
i i
(iw
; ?0Ul
Troi*> to
I
00
crJ CT« O
§§?
«
10
?too J O
H*
- ?cr
i
a* Of
u»1 si
41 h> » « «> 0 H- *^
0 1
3 0
5 i00
n £ r 1J s
-
Ul
ON) O
i * Ulo
1Co
r? ' a
1
03028530
fX
g
u
o
1OQ
N> 00
O GO
GO
«
" "»
°i
,
1
si:
V H
'
j_ i
L
S1
' c8.
1
I
1
H-
w
JlV
\o "'
1
1
1
»0
'
J
i n *j
;nn
j S
i » s ; gP-
j
j * *IS!
? *
3 -J
F 3 tS «2
»
fv
f
- i jD
*
t>
N J
!
A
I J O
s a. «* i0 1
^i
?IsJJ»3
O>
T-si
>
s!«>j
:?j e>
3
«
-TD »-
1r u^
te
3
»
» N > 1
S
NJ
> to,i
to00
» - 1T« *J
»so- i O»
ON
JN
^?Ulo
1»
»B V
i-
c - '
VO
K ! K n 1
g
eljo
vt '» >-p ^s03028500
f '0
1 =ft
Johnsonburj
K
0
t N
tO^ 1 w
-*jGO
* ^
0
*
W
H
»-
0
L
:
^
u
iio
»
X SO
I- S 1 rt in
§ § ""~ 0
? § I § ' r §
X £ '- S , i T * Sg 0 -* S
o00 "
i I ? * rt ON
3
F S? IT ,£ s
! * o
. K . 8 « 2
? 5 s o -
w ui t
To>
?*
*
V i*
I g 00
0 0
I 5c
i s
H 1
!
i M * 1 Ul
a
? ,
i i* » §o ~"
f" 0 O 10J S ' ji f O *
? 1 ' p §
! B
5
! S*
i i
I b c
s s . I "! 8
f -. k 0 * CLn u»
Ul
1 1
1 1
1 1
f» Vw
b b
00
I S w
S s
1 1
1 1
1 1
N * Ul
i °
'
O
; s « B §H. 8
o 2 S ' " s
T f ,» " - sr -
ii- s °? 5 s S S o, * R _
51 0 1
S
I £ 3
*
8 £j S
§ S . 7 » S c *-
1 1
1 1
1 1
«
b ui
? s
? 1 -
1 1
u
i i
i * 0
'
o
B S '
I I s o* s1 io
C |s9
? ft ES SS§
! ? > n° R
Johnsonb
? <S T g »
r vo? s
: oo
I °°C N>
1
1
M
0
O
?b
?N
U
C
4
O
'
1
'
I
<l
1
1
§1
n
» & n o
" 0
1_
14
i
s»**
Discharge
Temperature
pH
Specific conductance
Dissolved oxygen (02)
Silica (Si02)
Total iron (Fe)
Ferrous iron (Fe)
Total manganese (Mn)
Calcium (Ca)
Magnesiun (Mg)
Sodium + Fotassiun (Na + K)
Alkalinity as CaCOj
Acidity as CaCOj
Sulfate (S04)
Chloride (Cl)
Fluoride (F)
Nitrate (N03)
Phosphate (PO/()
Hardness aa CaCO,
Dissolved solids (Residue at 180°C)

if? ffP ifP
9 <ro00 »
V
1 «
1
s
^O oo r
'
c
b
,
I
I
o
o*Q
Chj e *j J
r r
* » <
1 V
1 C
. I
iN9 CN) O C
C
t I
X »
» §03029140
> w> 2 . g.
n
g 1
I ? § ^
: 1 = 0 |
0
r
-»j' ^
£ 5 0
/
JN
I
i
c
1
J
XI
1
1
U
00
VO
'
B
U
LJ
»
1
1
1
O
Kc
o
«
1
'
1
*-4> O
1
H-
Ui
Ui
00H-
OlO^
UJ
VU)
o*
000»
m too
QT*
ro 1o0*
1
Ui
ro 1
w o
LJ
1*
i
Oi I
Ui
Ui
'
1
1
0
c
CT» O
U9
2
1
!
i.
i
!§i
Ǥo oVO
O^
P
scr *<
f?\ft-5M
Corners
w>
O1
00
00
0*»
c
c c
1c 1
1
1
1
c.
cc
W Vc
« » 1
( C11
1
1 v
V
c c*.V ! t Cro
i c
i
i
t
i
i
i
i
i
of
I
x enU
» o x> a
03029120
/i
^ Sr 5MS S1
Itg fr
8ar Rldgway
*
= *0 :
3 «4?
0 O* 7»
D
«
'
-J <
1
1
1
i
(
1 1
.
Ct- C
c ^i.
<
i <
.Ui 1
o'
'h- C
.
c
.
NJ 0
ts>
'
LJ4>
t- W
i- < O*
r i
N>
o
w *°,4
^NJ - O
L I
L;
c c to
1
!
! j
r>* 4 0**
Cr-
c t K o4> H
L C
S S
- o: a
03029000
>> o n
fB- H-
i 5 f n
£ R
Rldgway
B>
/
X)
t
KD h-
*
N -J
B- *» 3 **
I ?
s
"
/i
c
?>30
C
30
j
n
0
'
r
*-
j
cj
r
-
H-
1
1
*»
CT»
O *-
t
*
i-
c
n
*
00
ro
r
f*
LJ Ui
^
W>
S
g
*- 00
w
so
iUi
o
Ui
rUi
c
o o
?toCT»
I
b o>OJ
b
a.u
o>NI
1
1
*0 1
4> \0
OJo
?o1 w
v<a
i fv:
?O
a*
»
ro
!N3a
CT*
fU
CT
«
Oa
03028900
*
snrr
ft
BO<
1
sto1
-»J00*»
00
c* '.
. <
i 1
4
I 1
,
V
h I
*» ICc
f f
H! ^to 1
c
1
1 h- <."* 1
c
c c
(.
i e >£> 00 K
e
I
I
i
o <
ts>
C O> hro
c4
Ui^i
I
I
1
4 O* 4 N>
CC
1
J en^ s-J 3
=- 8o
J 1C-
0 g" ? D 01
- f
5 *
i j - R-
! 5 0 00
= sahonda
i
10
- 0
* :
e
00*
k ^
r
4
1
*>
! F
* *O C
J
.
i |.
i
c1
1
c ( C
U h Vc
^
£ C
b i c
1
! 1 C
b Hi
C C
o c
h cU
1 <
1
1
1
rts> N> I
c
c
<
100
c »
*- 10** <
C
1
1
1
3 =
i
5 0>
> o a
03028750
r*
: r i? x> a
" * - *<
B-
D
0
3 =
- -»J 3 00
Ji O*
*
i
!
!
UJ h
Vl I".
1
I.
*. 1
C
1
1-
to C
gv«
c
« , f
c
1
00
o
c
t C
i
'
i
'
f ^J I
C
c
c
I 1 C
V 1 C
1
1
1
cN>t£ t-
1
: g 3 O
a
03028740
n
» J5-
- 3(ft 0 K
! s? B rl X
> >
3 Ki-
00
Ji £-
'
no
DC
Cr
siPS? MOD
IS
{.ft1^o fr O 0
RM MH*
(ft
5
Discharge
Temperature
pH
Specific conductance
Dissolved oxygen(Q2)
Silica (Si02)
Total
(Fe)
Ferrousiron(Fe)
Total manganese (Mn)
Calcium (Ca)
Magnesium (Mg)
Sodium + Potassium (Na + K)
Alkalinity as CaC03
Acidity as CaCOj
Sulfate (S04)
Chloride (Cl)
Fluoride (F)
Nitrate (N03)
Phosphate (P04)
Hardness as CaC03
Dissolved solids (Residue at 180°C)

?ett p P<S1
I
1
S
-
8
b
4
1
0
*-
O
1
*- o
o
ts>*-
1
3»3
w '
3 & nJ H- *3
1 §
03029185
] f ' H-
' &0
f? Ln - W
' I
Hallton
\ r»
»
n
* J §
> **i
' i
' i
*
£ S
3 O
?
1
1
* rs> *-
E '
* 3
I "N M 1
T H u, N- H-
ao
«J 0
1 5 ' O« *>
T | .
- RUl tt
i- la
va VO 1
CO
1 1
I »
vo
^4
? S «
VO
1 1
1 1
1 1
1 i- N> O
O O
1 £
^
1 1
1 1
1 1
1 S
1 1
£ ifa a Q 3
N) rt1- » K>
& ? 59
O
3 O
O VO 1
T< O
T S? . 0- »
g 1
i S "0 »
a.
bis I * z
1 £
i T< "o
E m ^
*- *- O VO
1 S
1 1-
1 "*-
iVO
O ->J
1 MO1- 00
u 1 OC
1. 00
1 u
1 MO
§
1 00
§
U)1 H-
NJ
f r CO '
V R " J. S S S §
0
«, ST S ' N> ^1 J O
5 I . vO I-1
M S Y ' £ <^ r> aK S S-5 R V 31 f t l-t K
J~« »
- g. -
1 1 Si>
T K
? J 0
O "^4 ts ^ 00 ^
*^
1 f00
XD 1 r-
K) 0&
1 i i- t
? N
?S H
V 5 U *
* 1M *
t, !
b i <
Lf
? i o
"i K
g s
*T i £ I
c
g1 if S >OQ a
r- n> u> i S w 0> 0 U 3
O
o
o
I 5 ' rt
,0 ff» cr
s s? y° § oo RT S rs 1XV
oC r
! S° 8 vO
9 ^ .* 1 00 J
i" *?U) --J
00
NJ
i
?o
V I o
? K
?
? C U) XC NJ 00
C
u
1 1
ts
Jl 1
° 1
L S
C
UJ 1
*8
g1 r g s
p S g S oa
w S or « iD
oC 5 ' rt
4»- t-1
P " 0S f? °°0 it£ R? tr P G 8 * * PE
(- i i
3 u>
f "
° ^1 K> 1 00
' *-
1 1
1 1
1 1
1 O
«
cc I- o>
K
1 1
1 1
1 1
] 0
1 1
g1 9 t « ^ a
1 ,
I I ~ a Ow a
o o
p « 1
Ui
I S H- J~«
* 9» X *-if"? RJ x r si O -s
oo S- g- s - ft
1
1 I
r i 's
° oo bi *
»
£
? i
i
0
1 ON
00CT» *-
1 *> Uitooo
u a « K a
u 1
H 1
1 1
! ° c
- '
!? R »- >** §u SoO K)
O £-
I 1I-(
- ri t / i "" M(-
Oi- 8
?
1
?
i
' O*
£-
^1 C 00
J*
1
1
£o
?b
*-
u1 1N
'
1
1
1
1
ir
Degrees Celsius
nlcromhos at 25'C
1
h*
flB
S»-* h* rtn
Discharge
Temperature
PH
Specific conductance
Dissolved oxygen (02)
Silica (Si02)
Total iron (Fe)
Ferrous iron (Fe)
Total manganese (Mn)
Calcium (Ca)
Magnesium (Mg)
Sodium + Potassium (Na + K)
Alkalinity as CaCC>3
Acidity as CaC03
Sulfate(so4)
Chloride (Cl)
Fluoride (F)
Nitrate (N03)
Phosphate (P04)
Hardness as CaC03
Dissolved solids (Residue at 180°C)

STS? PP pp pp ppPPa
t
X
1 1Ui
o*
i 7OS
ocY
c
o
rj
1 1
10
8?a
b T
3
o10 1
c
1 1
1 1
1 1
NJ ?
O O
£
.«
1 1
1 1
1 1
u
1 1
01
o
Gather
CD
B
Hc
8
so
u
*
VCo
1
1
In
U
ve
K
l
0
w
t
vo
OS
3
^
*
c
3
c
s
S
c 01
n
*
I
o
V
00
YVC
UI1
o
ibT
8
bIo00
V
1
00
10
j
K o
Y 8
IsjN
c
I
a
o
u 7 a
Station
So
S
p1H- OO
R
r
1OQ
UI O
VO
U
-
1
'
u
c
£
is
b w
*-
00
LJ
00
LtJ
-
O
s
£
o
u»
b
u
g
n
S
o
Yo-
?
71
Tb
7o
10
o1
§
o
o> 1
1u
7
0
00
7
c
c
?
I1
f0»
Station
8o
§
fSo*
on
10o
vO
=
!
r^j00
(
'
VC
-
1
K:
8
o
1
1
1
S
o
1
1
'
'
1
a
»
7
£u a
[o-
* o
o
U)
o
1
To
*?'
c00
1
'
'7*
o
o
s
1
1
1
tsj
1 uOC
'
01
H-oo
s so
h-
i
GLarlngton
g
VO
O 00
VO
S
1
1
S
oVO
1
10UJ
b u
o
1
1
1
00
o
1
1
'
1
1
«'
»
*
i00
110
UI
c
o
1
10
'of sb
S
?"
o00
1
1
1
1
o
00
c
1
1
1
7u
'
Station
o o
o
o »
o
sKR
C
CO
8
'
CO
1
1
8
o
1
CO
a
o
1
1
'9>
O
1
1
1
1
1
U)
1
»u
T10 K
00
T
to
I
UI
S
o
CO
1
00 00
o
9Y
^
1
'
I
*
o
s
-
1
1
'
£
Station
o oISVO
Mlllst
o g
osrH-
Oo
vo
O
"
3
i
'
c
o*
'
£
8
*
'
i
'
5
o
1
'
1
'
1
fo o*
1
»
VOT
c
10
*
UI
TC*
Ui
Jo
T
i
I
8
'
i
'
1
O
S
a
I
'
I
1 u
1
Station
i*H
Sg-5
g
3
g »
UI
o *
s
1
OC
?
'
3
§
w
'1
1
VO
o
1
00
1
1
1
g
1
»o
1*
*
i
!
w
1
oLll
1
o
8
oo
k
'1
1
ro
oo
IT
u
1
K]
1
1
1
7u
1
Station
1VO
g
R g
10
oUI
00
UI
Ml
Elg*
nKg.
(L
Sh- H-
S
Discharge
pH
Specific conductance
Dissolved oxygen (02)
Silica (S102)
Total iron (Fe)
Ferrous Iron (Fe)
Totalnanvanene(Mn)
Calcium (Ca)
Magnesium (Mg)
Sodium + Potassium (Na + K)
Alkalinity as CaC03
Acidityas CaCOj
Sulfate (S04)
Chloride (CD
Fluoride (F)
Nitrate (N03)
Phosphate (P04)
Hardness as CaC03
Dissolved solids (Residue at 180°C)

nu> i f
i *
i f
H-
to 1 b
I i
u
1 §
H-
1 1
1 1
1 1
1 0
1 8
i i
i i
i i
i i
i i
c
1 1
0n
a
03030540
f
"0
Is°R-
In
stone
8
xj
roo
s
!|C
M (. N]
1
1
1
.
j(a
h
10 f
1
C
f '* ^ o
VI
( r- mO 1
,
!
o* *. 3
v
H- (Vfi
i
.
I
.
00 I
vo > l.
( u I
11- « ro i
4(.
1 I
'
i- ,
t \
.
i C
1
1
O ^
4
(. <
V4
G i- <
S,
t
S
5 §03030500
>.
s to
h H>
- §; B ; s
«d
j9
D
*
O -xl
D I
x,
J.
'
/
/
i
x
/I
J f
i
t
'
/
;
"
i
c«
0»
i r
0
-
'
'
o
00 J
'
5
5
5
to
tc
s
o
s
i5
'
1
'
o
1
a
U1
Vw
T
I
SUl1 ro o> o o
00
jeUl
=
o ro
T
Ul
U)
*
5
00
tc
o
a
1 3
500-1410
u u
s
cr
1
'
310-1100
i
n
§
03030106
H
1
S
eoa
g
a
OX
'
'
00
S
o
1
g
t00
toUl
-
K
o
-
s
ro
'
1
'
o
1
I
TSw
J00
too
00
1
CO
a te
u
iV
1?o o
00to
*
o
fcO»
¥tc
c
c
'
1
o
00 J
0n
§
03030100
H
1
S1S iI*&0
ito
M
3
ro
'
1
I
vC
b
K
u o
c
3
S
5
o
u0
£
o
'
1
1
o
'
IV00
fro
Ul
T49-
3
00
T
1
U
!oV
o ro
G
roA
o
to
1KU
Ul
p
c
'
1
1
1
'
n
S03030089
ton 3
S
S
^!
xj
ro
xj
s1
ON
'
i
*
£
t
u
Nj
O
s
Ul
5o
s
s
c
'
'
1
s
1
r1VoUl
1
2O>
o a
M
1
Vm
I
I
is
Ioic
7u
1
1
'
11
COn0
§
03030007
H
1
1S
n*aS1
^
to
oo
Hh- t
i
1 J!(
1.
)
h.
1!c
siL
at i to t
U 1-
Ul 1
.
f <
'.
t\
W
. r<
i
oi
o c
s;\ i- i.
a t. vi.
1 *~ i
i
i cro O '
ri
i"~ i
<.
'a <. t.
c
wi§,'
0
CA
P S£ §
03029700
5
S 1 ! S S
trattanvlll
n
:
h>
> t
1 -xj
'
S
f
"_
*
C
C
n
f
S
i
;
sr
c
1
'
' r c
nr>4*> Lto
h
.
1 1
.3
1
1G
3
G3L
»
j
(
i
c u *
'.
0 '
.
1
is 51 c
1
1
1
r
c b <
Ul I.c
V 00 <
'
1
1
c
":
'
0
CA
; * §03029680
r
P h -
0
*'
g
.
It
3
i)j
x
a 4s-
x
J -xj ri SO
0
- gox
"n
^
t
'
S
a
Degrees Celsius
at 25"C
mllllgr
gsH>rr n
Discharge
Temperature
pH
Specific conductance
Dissolved oxygen (o2)
Silica (S102)
Total Iron (Fe)
Ferrous Iron (Fe)
Total manganese (Mn)
Calcium (Ca)
Magnesium (Mg)
Sodium + Potassium (Na + K)
Alkalinity as CaC03
Acidity as CaCOj
Sulfate (SOA)
Chloride (Cl)
Fluorlde (F)
Nitrate (N03)
Phosphate (P03)
Hardness as CaCOj
Dissolved solids (Residue at 180°C)

Teble
25. Range
and
mean
values
of chemical analyses of su
rfac
e wa
ter
Cont
inue
d
Range
Mean
Rang
e Me
an
Range
Mean
Rang
e Mean
Rang
e Mean
Rang
e Mean
Range
Mean
Range
Mean
s(ft3/s)
Temperature
Degr
ees
Celsius
Stat
ion
0303
0550
118 -
6.5 -
Stat
ion
0303
0560
2018.4 -
Stat
ion
0303
0580
4.8-63
27
Station
13-235
111
Stat
ion
2.1-
5026
Station
5.7-95
56
Station
.22-29
12
Station
209
6.8-
18.5
-
0303
0600
3.5-
20.8
-
0303
0610
7.8-
13.8
-
0303
0660
3.8-
17.8
-
0303
0690
6.4-
18.8
-
0303
0700
1
Specific conductanc
e
mlcromhos
at 25
'C
Dissolved
oxygen (02)
H O
H -H
H a
t1 !
" H -H
Ferrous iron
(Fe)
Total
maneanese
(Mn)
Calcium (Ca
)
Magnesium (Mg
)
Sodium
+ Potassiu
m (Na +
K)Alkalin
ity as CaC
Oj |
en1*
0u 0
H < s
H O*
3 to
Chloride (CD
Fluoride (F
)
0)Phosph
ate (POA)
Hardness
as CaC03
Dissolved
solids (Resid
ue at 180°C)
milligrams per
lite
r
Pine
y Creek
near
Limestone
41°0
8'44
" 79°21'49"
4.8 -
260 -
12.8 -
- -
Reld
s Sun
at Reldsburg
6.0 -
480 -
9.8 -
- -
Brus
h Ru
n at Wi
llla
nsbu
rg
3.2-4.5
- Pine
y
3.3-4.1
-
560-
1000
850
10.0-12.0
10.8
- -
Cree
k at Pl
ney
"420
-101
065
27.
4-11
.69.
26.
4-7.
67.
0
Licking
Creek
at Hu
efne
r
3.0-
3.9
-260-925
592
10.8-11.0
10.9
- -
Paint
Cree
k at
Shippenvllle
2.8-
4.1
-330-750
530
7.6-14.0
11.2
- -
Deer
Cr
eek
at Shippenvllle
3.4-4.2
-69
0-95
0850
9.6-12.0
11.1
Deer
Cr
eek
at Pl
ney
412
10.7
- - 8.0
2.5
0.40 -
41"0
8'50
"
.37
.00 -
41'1
0'24
"
.94-7.0
4.1
.10-3.0
1.5
41010'12"
2.6-
9.0
5.3
1.3-
4.4
2.8
41«1
8'53
"
2.0-
8.4
5.2
1.1-6.5
3.8
41''14'47"
4.6-8.0
6.7
.72-1.6
1.2
41°1
5'26
"
8.0-
2015
1.9-
104.8
41° 10' 24
"
2.9
1.2
0.05 -
- -- -
- - 4
-15 -
112 -
S.9 -
- -- -
- -120 -
- -
79*24'09"
1.1 -
- -- -
- -34 -
0 -- -
- -- -
- -- -
210 -
- -
79*23'56"
7.7-
2213
- -- -
- -0 0
30-80
63480-510
500
16-2
018
- -- -
, 260-480
390
- -
79°28'20"
3.1-15
7.9
32-80
4819-58
337.
9-22
150 0
25-72
44176-425
291
8.2-26
15.3-. 6
.5.90-7.1
4.2
.00-
. 01
.00
140-500
260
260-
618
460
79°23'20"
2.5-
5.9
4.2
- -- -
- -0 0
27-85
56
- -- -
- -- -
- -85-90
88- -
79°23'20"
1.0-
5.5
3.3
- -- -
- -0 0
49-95
6814
6-
16- -
- -- -
150-
240
190
- -
79°28'25"
5.5-
8.1
6.3
- -
79«2
8'41
"
2.7
27
- - 14
- - 14
0 0 0
61-120
82 47
300 - 174
18 15
- .2
- - 1.4
- - .00
250-
400
320
130
- - 292

I.is en
!i $ _y 1
o< n'? S '
9
S? S 5 HI * »1 O
" R
"5 S -1- 2 o*
eM *
*
u,? r
'"1 * '3
! ? ». tUl
Bi ,s
»?0
* 2 '
3 £ i
X
, u
£! ? ,
37 a *s
SI
! r CO
! * 5 * §03030950
o
Y 2 ,
T a K
s S ° - s -
I ! : P 2
M
1 SO
N "
! si 5
O -1Y *. E& "i
00
* - u o>
S S
. .s
* Ul
SO Ul « M
O
" S
-
, r
§
f1 *
i
,S §
j? SF 8 '«
I Iig Creek at
Callenaburl
00
iiUl
SO S
1 Ul» 1
£ 2 - *
a
f
YK
I
1
X
01
j
1
i
f
7
S1.
'
1
n
-s;
o o
1
*
u,
1
1
1
r Mi,
nj
v.
1 J
1
1
1
1
Ulso
i
a > i
Stetton
0680COCO
*
1 =3 R
?
= S"
I5 ° r »3 ^
n so
OS
4 1
h
;0n
S
rK
t
|
X
9
T o
i
i
KMO
1
1
S
g
u.
i
a
_
SJ
E
M
1
1
1
1
e
Station
0980COCO
1 P n rt
Ucklng Ci
^ 1 CA
1*
; i $
i $*
j
I
5
i i )
i
1
f K) *
(
\
'
1
C <i
'
-""
a » M
i
i r
i
io
u
1
1 «
1
1
1
1
1
8*
SI CO
f R S = §8S80COCO
^
R- o 3 R
a *
1
/
?M
I i *4
I S. ii
S
i
i
**
in
C
1
1
1
n » OISI
1
,? IS §
* S oi i se
«
j |
? 1 li
ftX
uUl
? ? S 1
J s1- W
*
X
'Y
3
2
I 'i
8
*
T
i
,8'
i
u1C
ei
i
k
M
OR
S
'
'
'
H-
«
-
5
»
1
'
i
i
i
I
ijaei
u
I
OD
JE»
aH
»rt
a
TUl
a
j
s
1 U
'
Zo
o
?§
J'
:0
8
ta
i
Stetton
03030750
f
1f
Callenaburl
3 £
3
;?
Degrees Celaiua
*£f) 5
t
I
i">*
Discharge
Temperature
pH
Specific conductance
Dissolved oxygen (02)
Silica (S102)
Total iron (Fe)
Ferroua Iron (Fe)
Total anganeaa
Calciun (Ca)
NagnealuB (Mg)
Sodlua » Potasslun (Na + K)
Alkalinity aa CaCOj
Acidity aa CaC03
Sulfate :
Chloride (Cl)
Fluorlde (F)
Nitrate (N03)
Phosphate (P04)
Hardness aa CaCOj
Dissolved solids (Residua at 180°C)

>a B a IK 3 « iU)
V
, ;
K <
Ul Vt t
s
OVI
1
10 i
C
S
b
».
rv
.ON 1
- 1
!
4*
t 00
c
b i
»- ' tV
to
N '
!
c"i
i
VH- I"5
t
ena 2? S2 g
03031770
f\
f (A
J- 10 X
f
s $ T n
= 10 B
? ff
: |c ?
: s
' "^ s s
1
>
rx> x>
J
> /
;
i
!
>
/'
c
I
10
'
1
K
O
^*
1
S
§
*1
1
1
-
0
'
1
1
'
1
s
'
a
aNJ
1
1C
o*
T
00
«
?
a
ON
10
1
1
8
f
'
i
i
v
b
S
u
a
i
<nnrt
g
03031720
gft
rB
ff
ynoldsville
g
00
VI
C
'
'
00
VC
1
^
N
U
a
i
'
i
o
KJ
'
1
'
1
'
S
'
It
TN
b
u
Y0>
Io »
'w
Y
Ul
o Y
'
1
'o
Iz
=
'
1
1
i
'
<nB ft
Oa
03031700
EH-
1IB ft
£H»h*
0
O
00
e
N)
i,
'
, ji
to iss
,00
I
!
1
to * * .
1
1 c * 1 c
1a i
i
i
i
I
i- N9 r
c
b c
w
,:
i
i
O f ! C
'
»- co
^ RS §
089UOEO
1 1 » X
e *"
g P- IDi-- ffh*
» 0)
I
c
;
-u«i
i
c
, ; .
c 1 c
1
« c
1
oO» 1
.
'
1 l»
~\
o
c
1 c c
1
1
1
1
4 O*
c
o c
I1 C
1
1
'
1
c * ',0V
1
>
rf B
* §
03031640
* |
S; ? D M
M
10 rt
v
s 2 .
' °!00
0
>
10
V
10
1
'
LO U
O
1
O
o o
S!
s
-
c
t.
5
s
LJ 0
1
O
1
It
LJ
~
to0
II00'i
»0
'
I
o o
b
I
TLO
1
W
O to
b
!00
$
1
O1c
is
Jc
1
B
0
03031620
1
e Branch ne
ar Home camp
o0*
11z
.-
1
'
S
0
00
1
»
is
£
i
i
0-
'
1
'
1
1
1
o
1
ItLJ
O
LJ
to1
to
?
1
O
i-
1
00
o
T
'
'
i
o
c£
o
'
1
1
K:
S
1
B
§
03031520
CO
X
j 9f
X
0
i-.-t^
3aa
n cMOO,
II
10 0
milligr
1
SM H*
It
Discharge
Temperature
*
Specific conductance
Dissolved oxygen (02)
Silica (Si02)
Total iron (Fe)
Ferrous iron (Fe)
Total manganese (Mn)
Calcium (Ca)
Magnesium (Mg)
Sodium + Potassium (Na + K)
Alkalinity as CaC03
Acidity as CaCOj
Sulfate (S04)
Chloride (Cl)
Fluoride (F)
Nitrate (N03)
Phosphate (P04)
Hardness as CaC03
Dissolved solids (Residue at 180°C)

||
*
?5
i T
10 X
.n
1 >
NJ Jl
Ln
U»
Oh T .«
00
1 §
*
sr
»?
to
5I
o b
S?c
*
i
£3U!
of cK]
00 S O 1
3o
NJ 1
rt
H-
ao o
ro
|O
1
ft
s? g5"H-
i?
o
SO
o
'
3 ?
M*
jw
a
;
00 C 00
I
SI
; C
1
°°L
i Jc
si
1
1
1
*ro .
i
b <
i
i
i
i
i
t. a> 'V. SI
1
s
5 Srt: i"
03031880
r>i X o r» 11, s-
! s 1 ir
okville
j"
J3
8
<J
i *0*
&
'
l i
?gSi
v00
:
! i
c
1
s
00 t
1 J
1
1 c inw c
c
si
g! (sj
1
1
1
V
ro * c
o (
1 J
1
1
1
1
i*-
i4
1
0 rt
ft
2 I"
03031876
r-
rt
1
: B
lichardsvill
o r\
: -J
3 O O ro
f
1
=
*
f
>
1
'
i
ri1 SI
J
1 >
1
, I
1
1 V
'\
, \
1
1
1
1 '
1 ' c
1 1
t 1 r
1
1
1
, 4
1
rt
5 S s
03031875
rt sr
' ft
B
hards ville
5
3 £"
i *
»>
s
'
1
*
;o-o
b1
«;
8
rii
i>. o
1 «-
1
1 1
1 1
1
£
1
CO
B
03031874
a
rtp-
4
ff
S
O-n
ON
o
00
*
if g H
Ju c_
c
1 1'.L
.
5s
: 10 (
SI
*- ! o
1
so'
1
O
cL
10
L C
i S
1 VJ
1
t Is)°S
b t
ON 1ws
i
i ' t.
i '<c
1 SO '
c c
1
06
)
* COft
1 M-
3
03031872
Fivemi
n
a j ^ B 3 rt
rookville
^ j
? i
*
^
D
/i
J
.
X
!
}
De
n0
h h
0
, j: j
. \
.
~ a tL
VJ
M \
* t-
C
1
1e* '
LC
O Co <
c c o
M
. r
i
i
i. N:
s.
b <
r u c10
(.c
10
rj
i
i ic
s.
*- C L
1
)
0 CO rt
rt J Ht J 0j a
03031870
n
° i?h-s
Sn h pr5 B J rtn-j at
okville
- *
g
[ J
n
)
*
i
'
f
t' tt
FE9 V(1
*- l
I
1
1 <
r< c 10 1
SOo
1
1
c
r s<<
si
c.
<
cV
1
1
\
£»
<
O <
1 1
1
1
1
1
o > J c
1
0
rtC H-
* S03031785
/
» P
; g - B
- n S
15
tf
s *.T ro
& !
£
j\*
i
i
n
iDegrees Celsius
O 0
milligr
I
n
Temperature
pH
Specific conductance
Dissolved oxygen (02)
Silica (Si02)
Total iron (Fe)
Ferrous iron (Fe)
Total manganese (Mn)
Calcium (Ca)
Magnesium (Mg)
Sodium + Potassium (Na + K)
Alkalinity as CaC(>3
Acidity as CaC03
Sulfate (S04)
Chloride (Cl)
Fluoride (F)
Nitrate (N03)
Phosphate (P04)
Hardness as CaC03
Dissolved solids (Residue at 180°C)

uo aa
CO «
o
u
CO
u
1 SVC
760-1300
10
k?o
b?o
10
10 -4
00
1 1
1 1
1 1
Ul 00 1
*
10 10
*«
1 C 00
1 C
1 1
a c o>
i i
en
rt i H-
g
O
O
8
Ec3 -
f' ft C rt
sv Bethlehei
(
H-
S
so
<
.
- * ^ 1
*J
00
IUl
og?D ^-
N
SO
1
y> to
Ul Ul
i i
O
* "i
ii
i^ *«j3 b
o
K)Ul
1
1
X
s?'§
'
Station
o
soUl
H
1
«D
fft
S
o o
ON
VD
:
1
1
, <'
C
1
t1
O '
'
1
I .
1
;
<
si
t .
1
'
i
o*
o
V
1
1
1
S'o;
1
rtB- B
rl
* g
O
5032025 'i 0-16 ri
T*
* ^
" ?
» R
o
s-
i
o
J -J
1
=
/I
o
;
10 10 I
<ri
<
'
i! c
Ul
c
I, 1
00o
* <
1
10 - 00
1
Ul
o
V< tc
,
I ro c00 I
s
1
J H-
£ go5031980
»\
P P rt
P 1 I *- 10 g» 8
- 1 a
" 1
Jt
§ 2rf 00
? so
X
J»
r
£
*ir»
j h
0
*
'
s
r i
:
J
"t
V
r c " '
O I
<
t "!
'
i e
»,
1
1
1
u
o
1V
'
'
1
1
.£«
1
Station
o5031955
= S
g R
I f
t t-i
|B«
^
3 '
§ °
3 -P-
5 S
i
i
i
f
~l
\
'1
y to s10
i1
i,
'
O <
'.
s
1
1
1
to
0
1V
1
'
1
'
. *
1
0 » rt
* go
031935 4 it-D/l A
/
f c * n rtJi I-1
»- 8-
I Rh-1
&
30
t~
: o
^ J
ji
1
10 1O
tC
'<
1
IV
1 c1
I4
8;
<
10 t-
1
C
|
*
sii
r<UJ 1
i
f* '10 "
1
1 V
1 i
1
10
J Ul'
U.J N" 1
c
1
1 V C
1 i e
O L
1
Station
o
ooeteo
I n
] R
rt
3 IM
JI
a
£ o
' ro
0
a o
§
y
=
»
*s
B-
X
!
1
o>
1 ^' 1
1
t,
i.H- (
'
(
00
'
c
'(
Ul^ t
o>
*- c
OD O
*-
O
c
1N,
* V<
5
i
i
i
. S e00 >i
* '
Station "\ (S^'iT 1
j
F -
f
; R
i Iervllle
r'
o f ^13 o
so
O
00
J>
!«
IJ
:
J
g
0 |
i
B>»;;
; i
5
MOQ£.3
at 25°C
P.
fl
I
K
H-
It
Discharge
Temperature
pH
Specific conductance
Dissolved oxygen(o2)
Silica (S102)
Total Iron (Fe)
Ferrous Iron (Fe)
Total manganese (Mn)
Calcium (Ca)
Magnesium (Mg)
Sodium + Potassium (Ha + K)
Alkalinity as CaC03
Acidity as CaC03
Sulfate (S04)
Chloride (Cl)
Fluorlde (F)
Nitrate (N03)
Phosphate (P04)
Hardness as CaC03
Dissolved solids (Residue at 180°C)

Tabl
e 25. Range and
mean
va
lues
of
chemical an
alys
es of
surface
water Continued
Ran
ge
Mea
n
Ran
geM
ean
Ran
ge
Mea
n
C0 y H a
(ft
3/s)
Sta
tio
n
2.4
-67
'L
27
Sta
tio
n
93-4
110
1060
Sta
tion
1 .6
4-5
.02
.8
V S g EH
Deg
rees
Cel
sius
0303
2400
7.3
-18
.2-
0303
2500
1.0
-24
.5-
0303
2770
11. 0
-16
. (-
p.
V
0
S
1H
4JMH
a
"o
)V
B
P. S
mic
rom
hos
at
25°C
fl w oo
*~*
at >,
CM
rf
X 0
H O
H
Win
^
^
O
K
P*
rl
B *
~*
^ ^"^
V <£
o §
isH
B
^-
I o *->
-S
3C
J ^-
^
I H S |s
H"*"
5 2
1
S
H>5
S0
0 Z
U)
{L<
*^
4J a
o>
. 0
<
«
HI CO
^->
41 O
*^x
rH
rH
0^-
H f- ^
siA
* ^
g Q
1
SO
,3 ao
«
^
oC9
?§
rH
«D
H £
Q^
mil
lig
ram
s p
er li
ter
Lea
ther
woo
d C
reek
ne
ar
New
B
ethl
ehem
4
1°0
1'1
2"
79°2
3'14
"
5.6
-7.2
385-
1030
739
9.4
-12.2
10.8
- -0
.10-.
40
.22
0.0
0-.
03
.01
0.4
0-1
24.0
- -- -
- -
3-33 15
0.0 .0
160-
491
370
7. 4
- IT
11- -
1.4 -
0.00 -
190-
580
400
- -
Red
bank
C
reek
at
, S
t.
Char
les
4005
9'4
0"
79°2
3'40
"
5.5
-7.4
- Fid
dle
6.6
-6.8
-
180-
560
333
8.0
-14.4
16.1
.6-5
.23.0
rs
Run
n
ear
Rim
ersb
urg
400-
420
410
11
.4-1
1.6
11.5
- -
.09
-5.4
.94
.03-.
13
.08
4100
0'5
r1
.29-.
38
.34
.00-.
15
.08
.35
-4.2
1.4
14-5
231
5.8
-21
1314
-20
17
79°2
8'40
"
.30-.
50
.40
- -- -
- -
2-40 9
.0-5
.01.
5
46-5
^ .0
52
) .0
57-2
0111
5
98 -
7.0-
3016
11-1
312
.2 - -
.10-
4.3
1.6 - -
.00-
.77
.13 - -
58-2
4013
0
140-
19T5
160
130-
330
220 - -

Tabl
e 26. Mean valu
es of
selected ch
emic
al co
nsti
tuen
ts fo
r sa
mpli
ng st
atio
nson th
e Clarion
River, 1962-75
Station
27545
East Branch Clarion
Rive
r above
Glen
Haze
l
^
28000
West
Br
anch
Clarion
Rive
r at
Wi
lcox
28500
Clar
ion
Rive
r at
John
sonb
urg
29000
Clar
ion
River
atRidgway
3051
5 Clarion
Rive
r at
Pine
y
3100
0 Cl
ario
n River
atSt.
Petersburg
Dissolved
oxygen
(mg/
L)
10.9
10.7 8.9
8.2
9.0
8.1
Tota
l ir
on
(mg/L)
0.33 .38
.45
.40
.74
.71
Tota
l dissolved
solids
(mg/L) 61 74 91 63 113
228
Temperature
(°C)
11.4
10.7
13.5
12.4
12.0
24.8
Ammoni
a as
(N)
(mg/L) 0.9 .08
.15
.25
.18
.15
Tota
l phosphorus (P)
(mg/
L)
0.02 .02
.05
.06
.05
.02
Alkalinity
as CaCOs
(mg/
L) 6 26 19 23 10 6

The East Branch Clarion River watershed (drainage area 108 mi2) con tains streams of good quality and streams affected by mine drainage. Fivemile Run, a tributary to East Branch Clarion River Lake, has good water; dissolved solids average less than 50 mg/L. However, Swamp Creek, another tributary to East Branch Clarion River Lake, is affected by mine drainage. Samples from Swamp Creek indicate the pH ranges from 3.7 to 4.2, manganese commonly exceeds 10 mg/L, and sulfate concentrations are generally above 200 mg/L.
East Branch Clarion River Lake has low concentrations of alkalinity, phosphate, and nitrate. Iron and manganese concentrations are generally less than 1.0 mg/L at all lake depths. The lake has low primary biological production and, as a result, supports only marginal fish populations (Moore, 1974). !
Water samples half a mile below the East Branch Clarion River Damoccasionally contain iron and manganese concentrations in excess of naturallevels. This is interpreted as the effect of the input of mine drainage tothe reservoir. Johnson Run, that enters the East Branch Clarion River 4 mi above Johnsonburg, additionally degrades the East Branch Clarion River withmine drainage.
iWater from the West Branch Clarion River watershed (drainage area
and sulfate, and contains no invertebrate life and trout
93.7 mi2) is generally soft, low in manganese acidity. The West Branch has diverse aquatic both indicators of good quality water.
The East and West Branches of the Clarion in Elk County to form the Clarion River. The West Branch mixes and dilutes the poorer quali The quality of the Clarion River at Johnsonburg soft to moderately hard; contains little nitra and has an average alkalinity of about 16 mg/L solids concentration from 1971-74 was about 120
River join at Johnsonburg higher quality water of the ty water of the East Branch,varies, but is generally
te, phosphate, or chloride;The average dissolved-
mg/L.
e of several sources of waterSamples collected near the
for pH and manganese (Koester
Powers Run (drainage area 11.8 mi2) is on supply for the Borough of Johnsonburg (table 4) mouth sometimes exceed EPA recommended limits and Lescinsky, 1976, table 6a, p. 52).
Riley Run (drainage area 1.96 mi2), is a ismall severely degraded trib utary entering the Clarion River between Johnsonburg and Ridgway. The wateris high in organic material, dissolved solids(average 550 mg/L), and alkalinity (average 350 mg/L). A dissolved-oxygenconcentration of only 1.9 mg/L was recorded on Lescinsky, 1976, p. 53).
(average 1,500 mg/L), chloride
April 8, 1974 (Koester and
94

Data in table 27 were collected in downstream order within a 3-hour span. A 5.-2 percent decrease in dissolved oxygen occurred between Johnsonburg and Ridgway, despite a substantial addition from Elk Creek. Reduction was due chiefly to reaction with organic substances introduced into the Clarion River between Johnsonburg and Ridgway.
Elk Creek (drainage area 64.1 mi2) enters the Clarion River at Ridgway. Because of mine drainage and industries, Elk Creek has dissolved-solids con centrations higher than those of streams in nondeveloped areas to the north. Laurel Run, a tributary to Elk Creek and a municipal supply for St. Marys, has iron and manganese concentrations in three samples that exceed EPA recommended limits. Daguscahonda Creek, an Elk Creek tributary downstream from Laurel Run, is degraded by coal mining. Elk Creek at Ridgway reflects the influence of mine drainage and has high iron, manganese, and sulfate concentrations.
Big Mill Creek (drainage area 32.7 mi2) supplies water for the Borough of Ridgway. The water is soft, low in alkalinity and dissolved solids, and ranges in pH from about 5.5 to 6.4. Recommended limits for iron and manganese are exceeded in three water samples collected below the reservoir.
Little Toby Creek (drainage area 126 mi2) enters the Clarion River about 8 mi below Ridgway. Water quality of the upper half and many of its headwater tributaries is severely degraded by drainage from mines. Several tributaries that enter the lower half improve its quality; however, it still has excessive hardness, manganese, and sulfate, and little or no alkalinity.
A large part of the 504 mi2 drainage area of the Clarion River between Ridgway and Cooksburg is in the Allegheny National Forest, where the water quality is generally good. Trout are common in these waters. Several good quality streams (each more than 40 mi2 in drainage area) are Bear Creek, Spring Creek, and Millstone Creek; these and several other smaller streams (Maxwell Run, Callen Run, Wyncoop Run, Clear Creek, Maples Creek) contribute alkaline water low in dissolved solids to the Clarion River, that helps to neutralize and dilute water contributed by poorer quality streams, especially Little Toby Creek.
The quality of the Clarion River at Cooksburg is generally good. Iron and manganese concentrations are less than those at Ridgway. The water is generally soft to moderately hard (average 54 mg/L) and has low alkalinity (average 10 mg/L). The dissolved-solids concentration averages about 100 mg/L.
95
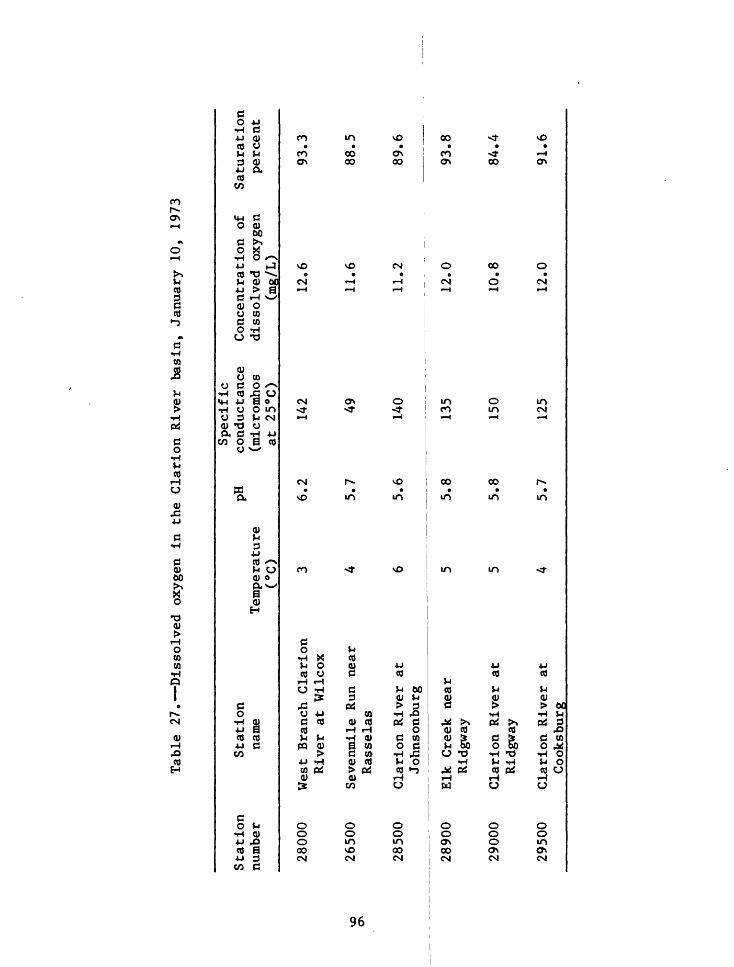
Tabl
e 27. Dissolved ox
ygen
in the
Clarion Ri
ver
basin, January
10,
1973
Specific
Station
Station
pH
cond
ucta
nce
Conc
entr
atio
n of
number
name
Temp
erat
ure
(micromhos
diss
olve
d ox
ygen
(°C)
at 25°C)
(mg/
L)
28000
West
Branch C
larion
3 6.
2 142
12.6
Rive
r at
Wilcox
&
26500
Seve
nmil
e Run
near
4
5.7
49
11.6
°*
Rass
elas
28500
Clar
ion River
at
6 5.6
140
11.2
John
s onburg
28900
Elk
Cree
k ne
ar
5 5.
8 13
5 12.0
Ridg
way
2900
0 Cl
ario
n Ri
ver
at
5 5.
8 150
10.8
Ridgway
29500
Clar
ion River
at
4 5.
7 12
5 12.0
Cook
sbur
g
Saturation
percent
93.3
88.5
89.6
93.8
84.4
91.6
Suspended-sediment discharge data were collected at the Clarion River- at-Cooksburg gaging station from January 1971 to September 1973 and are reported in the annual series "Water Resources Data for Pennsylvania- Part 2." The estimated suspended-sediment discharge for the 1971, 1972, and 1973 water years was 58, 104, and 34 tons/mi 2, respectively. The 1972 value is exceptionally high because of flooding and soil erosion caused by Hurricane Agnes in June. About 67 percent of the total suspended sediment discharged in 1972 occurred during that month. The relation between daily sediment load and streamflow for the Clarion River at Cooksburg is illustrated in figure 20.
Before entering Piney Reservoir, the Clarion River below Cooksburg is augmented by several tributaries (Gathers, Maxwell, and Blyson Runs) that have low dissolved-solids concentrations.
Mill and Toby Creeks (drainage areas 59.4 and 35.0 mi 2), which empty into Piney Reservoir, contribute excessive quantities of iron, manganese, aluminum, sulfate, and acidity. Little Mill Creek, a tributary to Mill Creek, is primarily responsible for the poor quality of Mill Creek. In the Toby Creek basin, surface and deep mines and abandoned flowing wells contribute mine drainage to the stream. Concentrations of cadmium and chromium in an unnamed tributary of Toby Creek (30103 sampling site) exceed mandatory limits of the EPA.
Little aquatic life is present in Piney Reservoir chiefly because the water quality is degraded by Mill and Toby Creeks. Acidity intermittently reaches levels harmful to aquatic life (Eggers, 1973).
Discharge from Piney Dam fluctuates as water is released periodically for electric-power generation, causing concentrations and loads of constit uents to vary below the dam; the water quality is poor. Average concentra tions of manganese and sulfate are about 3.5 mg/L and 80 mg/L, respectively. Dissolved aluminum averages 1.0 mg/L. Acidity concentrations average about 12 mg/L expressed as CaCOg.
Piney and Deer Creeks (drainage areas 72.2 and 74.2 mi 2 , respectively) join the Clarion River about 2 mi below Piney Dam. Both are severely con taminated by drainage from mines and abandoned flowing oil and gas wells. In 1975, the Pennsylvania Department of Environmental Resources plugged flowing wells in the northern part of Deer Creek basin to reduce the flow of highly mineralized acid water.
Canoe and Beaver Creeks (drainage areas 18.8 and 17.6 mi2 , respectively) enter the Clarion River south of Knox. The streams have marginal water quality and show a slight influence of mine drainage, but can support trout. Canoe Creek has moderate concentrations of iron (average 0.50 mg/L), manganese (average 0.70 mg/L), and sulfate (average 120 mg/L) near its mouth. Beaver Creek has slightly better water. The average specific conductance of three samples at station 30800 is 293 micromhos.
97
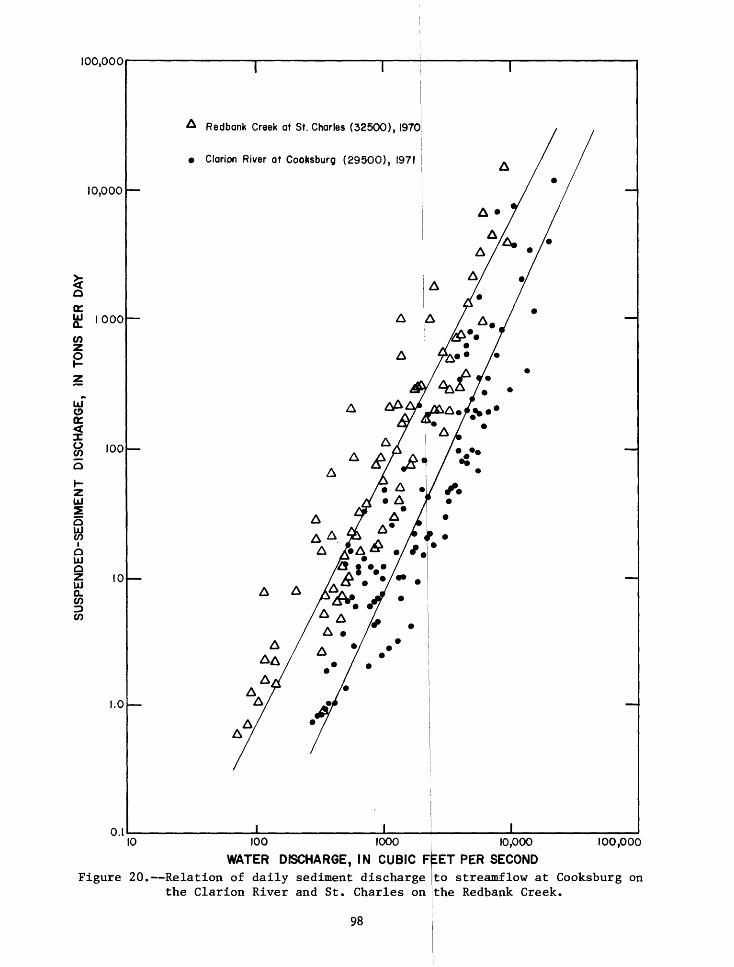
100,000
10,000
o cc.
<o
ILUo cc.
Q
h- Z LU
5wIQ LU
LUOL CO3 CO
000
100
10
1.0
O.I10
Redbank Creek at St. Charles (32500), 1970
Clarion River at Cooksburg (29500), 1971
A A
I100,000100 1000 i 10,000
WATER DISCHARGE, IN CUBIC FtET PER SECONDFigure 20. Relation of daily sediment discharge I to streamflow at Cooksburg on
the Clarion River and St. Charles on the Redbank Creek.
98

Licking Creek (drainage area 51.9 mi2) joins the Clarion River below Beaver Creek, and is severely polluted by drainage from surface and deep mines. Much surface mining has taken place during the 1970's. Water at the Callensburg site has excessive concentrations of iron, manganese, sulfate, and acidity. From 1971-76, average concentrations for these constituents were 13, 12, 520, and 45 mg/L, respectively.
Clarion River quality at St. Petersburg is poor. The concentration of dissolved solids is higher than upstream at the gaging station below Piney Dam, mostly because of the highly mineralized water contributed by Piney, Deer, and Licking Creeks. It is most noticeable during low flows. During flood flows, and during releases of large volumes of water from Piney Dam, the water tends to be lower in solids because of dilution. The concentra tion generally ranges from 130 mg/L to 300 mg/L, and averages about 200 mg/L (estimated from specific conductance data). The water is generally moderately hard to hard, low in alkalinity, and high in sulfate. In 1971-74, average concentrations of hardness, alkalinity, and sulfate were 106, 4, and 106 mg/L, respectively. The pH is frequently below 5.5.
In summary, general trends in the quality of the Clarion River are shown in figures 11-20 and tables 25-27. From the mouth of the Clarion to the confluence of Mill Creek, the average dissolved-solids concentration is higher than in the reach above Mill Creek. The higher solids concentration is caused mostly by mine drainage from Mill, Toby, Piney, Deer, and Licking Creeks. Alkalinity concentrations tend to decrease downstream, and are sometimes absent at the Piney and St. Petersburg sites. Nitrate does not appear to be a problem, as concentrations are low. Based on data collected during 1974-78, dissolved oxygen (more than 5 mg/L) is present throughout the Clarion River in sufficient concentrations to support the propagation of sport fish.
Redbank Creek basin water-quality assesment
Redbank Creek is formed by the confluence of Sandy Lick and North Fork Creeks at Brookville in Jefferson County. The quality of Sandy Lick Creek (drainage area 229 mi2) ranges from good to poor. Several of the good- quality tributaries are Falls and Mill Creeks and Wolf Run. The Borough of Falls Creek uses Falls Creek for its water supply. Iron in only two samples and manganese in one exceed EPA recommended limits (Koester and Lescinsky, 1976, table 6c). The quality is degraded by mining in Clear and Soldier Runs. Data from the sampling station on Sandy Lick Creek near Brookville indicate the water is moderately hard, contains no acidity, and has moderate concentrations of sulfate (average 60 mg/L).
99

The North Fork (drainage area 98.2 mi )j is used for water supply by the Borough of Brookville. The water at the mouth is characteristically soft, and low in alkalinity, dissolved solids, iron, and manganese. The North Fork and several of its tributaries (Clear and Peking Runs, for example) support trout. Aquatic invertebrate life is diverse. Although the basin of the North Fork contains sizable coal reserves, little mining has been done. In order to protect the quality of water in the basin, permits for surface mining are not being issued at present (1978) by the Pennsylvania Department of Environmental Resources.
Between Brookville and New Bethlehem, Redbank Creek receives much mine drainage. Polluted tributaries include Coder, Simpson, Welch, Runaway, Beaver, Town, and Leisure Runs, and Pine Creok.
2 Welch Run (drainage area 4.24 mi ) is one of the most polluted streamsin the study area. It has been contaminated I by highly mineralized and acidic water from surface and deep mines, and from abandoned flowing oil and gas wells. Dissolved solids are about l,000 | mg/L, and aluminum, sulfate, and ferrous iron concentrations are excessive. The cadmium concentrations frequently equal or exceed the mandatory limit of 0.010 mg/L established bythe EPA. i
iLittle Sandy Creek (drainage area 73.2 riii^) joins Redbank Creek about
6 mi upstream from New Bethlehem. Although the creek is in a heavily surface- mined area, several tributaries show less influence of mine drainage than streams to the north. For example, Big Run supports trout and its alkalinity is high, averaging 46 mg/L at Sprankle Mills and 38 mg/L at Worthville. Undoubtedly, its quality is due both to the adherence of coal operators to mining laws, and the scarcity of pyritic material in the overburden assoc iated with the coal seams.
Several other streams polluted by mine between New Bethlehem and the mouth; unusually high concentrations of dissolved
Leathervrood sc lids
drainage enter Redbank CreekCreek and Wildcat Run have
The water quality at the gaging station Redbank Creek at St. Charles is poor. The water is generally hard and low in alkalinity (average 9 mg/L). The average (1970-74) concentration of sulfate (.120 mg/L), manganese (1.4 mg/L), aluminum (0.55 mg/L), and dissolved solids (200 mg/L) are excessive.
jAnnual suspended-sediment discharge of the Redbank Creek at St. Charles
for water years 1969, 1970, and 1977 was 192, tively. Although little data are available,charge rates seem to be greater here than the. Clarion River at Cooksburg.These yields can probably be attributed to a agricultural and mining use.
f)
123, and 245 tons/mi , respec- the suspended-sediment dis-
greater percentage of land in
100

AQUATIC BIOLOGY
Introduction
Valuable information on the quality of streams can be gained by studying the number and types of bottom dwelling invertebrates (benthic macroinverte brates) , due to their environmental sensitivity. Because the organisms lack sufficient mobility to flee areas of pollution and their life cycles are commonly a year or more, they reflect past and present environmental con ditions. Chemical surveys, on the other hand, indicate conditions only for a single moment. Thus, if a transient toxic chemical or other pollutant destroys these environmentally sensitive macroinvertebrates, an extended period typically weeks or months is required to reestablish the community. A chemical sample collected during this post-pollution period would probably show no evidence of pollution. Because continuous comprehensive monitoring for chemical constituents is costly, benthic-macroinvertebrate surveys pro vide a relatively economical means of assessing many past and present water- quality characteristics.
Several previous studies of aquatic biology were made in the Clarion River and Redbank Creek basins. Selected reports that contain data on aquatic biology are listed in table 15,
Data Base
Benthic-invertebrate data were collected at 136 sampling stations during 1973 and 1974. The locations of the stations are shown in figures 2-51 of Buckwalter and others (1979) and in figure 1 of Koester and Lescinsky (1976). Table 7 of Buckwalter and others (1979), lists the common names and taxonomic classification of the benthic-invertebrates collected from streams of the Clarion River and Redbank Creek basins. The station number and name, date of collection, and number of individuals per taxon are listed for benthic- invertebrate samples in table 8 of Buckwalter and others (1979).
Methods
Interpretations of macroinvertebrate data depend upon the methods of collection and the time of sampling. A single sample of macroinvertebrates from a stream provides only an estimate of what was living at that site at a particular time. A sample made at another time from the same site may have a different selection of species and numbers of individuals. Life cycles of aquatic insects are an important influence on the species and numbers found in a stream. Mayflies, for example, have three life stages: egg, aquatic nymph, and terrestrial adult. Stream sampling during the nymph stage may show an abundance of a species, but sampling several months later may reveal no nymphs because they have hatched into flying, terrestrial adults.
101
Aquatic invertebrate collections at sampling stations were made pri marily with D-shaped dip nets used on the stream bottom. Invertebrates were also collected with forceps from randomly selected stream-bed rocks and debris. To obtain representative samples, collections were made from pools,riffles, and undercut banks. The sampling was but some invertebrates that normally dwell at
primarily for benthie organisms, the water-air interface also
were collected. Sampling time at each site was 30 minutes.
The techniques of collection were a modification of the qualitative methods described by Hahn, Slack, and Tilley (1977) . The methods were chosen to permit rough quantifications. Specimens were sorted, counted, and identi fied in the laboratory. Identification was done with manuals of Pennak (1953), Burks (1953), and Usinger (1971). The recent revisions in the taxonomy of selected aquatic insect groups (Metritt and Cummins, 1978) are followed in reporting the aquatic insect data.
Invertebrate collecting was mostly during base or low-base flow conditions. These flows were selected because wading is relatively easy and the water is generally clear. Also, the dissolved solids are high because at these times, any pollutants present would be concentrated sufficiently to affect sensitive fauna.
Numbers and species of invertebrates may vary along a stream. Thus, moving a sampling site upstream or downstream may markedly affect the com position of the sample. Sample stations on major tributaries were near the mouth and at several sites upstream; smaller streams were sampled only near the mouth. , !
Results and Discussion
A large variety of invertebrates inhabit insects. Mayflies, caddisflies, stoneflies, comprise over three-fourths of the total number
and
Mine drainage is an important influence on the distribution and occur rence of aquatic invertebrates. The bottoms oi: affected streams are commonly covered by blankets of "yellowboy", a deposit of iron, manganese, and other compounds and sediment. Numerous sites, especially in the south, contained "yellowboy. 11 |
l:he streams, the majority aremembers of the order Diptera of individuals collected.
Dissolved ferrous iron, common in mine tebrate life in the study area. Laboratory be toxic to some aquatic invertebrates at (Warnick and Bell, 1969). Such concentrations sites.
drainagetests
concentrations
At 21 of the 136 sampling sites (17 in the the Redbank Creek basin), no benthic inverteb sites were on streams receiving continuous, highly
, probably limits inver- have shown ferrous iron to
exceeding 0.32 mg/L were found at 73 sampling
Clarion River basin and 4 in es were found. Most of these
concentrated, mine drainage,
102

At sites less severely affected by mine drainage, invertebrates were present only in select taxa and in reduced numbers. The following taxa were found in these streams:
Megaloptera: SialisHemiptera: Genera of Corixidae and GerridaeColeoptera: Genera of DytiscidaeTrichoptera: Diplectrona, Hydropsyche, OligostomisDiptera: Genera of Chironomidae
The effects of mine drainage on aquatic life have also been studied by Parsons (1968), Roback and Richardson (1969), Weed and Rutschky (1972), and Woodrum and Tarter (1973). They are in general agreement with the findings of this study concerning the fact that aquatic insect fauna are eliminated or drastically reduced when exposed to mine drainage.
The northern part of the area contains many forested watersheds whose stream quality is little influenced by man. These areas support large popu lations of aquatic invertebrates of many taxa. Examples of sampling sites having unpolluted waters are Crooked Creek at Glen Hazel, Bear Creek near Ridgway, Clear Creek at its mouth, and the North Fork at Richardsville for which 17, 14, 14, and 21 taxa were collected, respectively. The natural stream environment is most likely responsible for these diverse invertebrate communities. Stoneflies and mayflies are especially common, and their abun dance and occurrence commonly correlates with high-quality streams.
Diversity indices are mathematical expressions that summarize large quantities of data on biological communities. The indices were calculated through the use of the methods of Wilhm and Dorris (1968), who suggest the health of a stream can be assessed quantitatively by the indices the index is generally between 3 and 4 in clean-water streams, from 1 to 3 in areas of moderate pollution, and less than 1 in heavily polluted streams (Wilhm, 1970). This relationship is generally supported by the data for the streams in the study area.
Table 28 gives examples of diversity indices of some aquatic inverte brate samples.
CONCLUSIONS
Surface-water and ground-water sources are able to supply enough water for most industrial, municipal and private uses. However, in parts of Clarion, Clearfield, Elk, and Jefferson Counties, the water quality of both have been degraded by coal mining; in places, it is not economically feasible to treat the water. Most municipalities are supplied by surface water.
During 1971-75, runoff was about 60 percent of the average annual pre cipitation of about 45 in. Base runoff averaged about 50 percent of the annual streamflow. Only 4 of 10 continuous-gaging stations have an average 10-year 7-consecutive-day low flow of at least 0.15 (ft 3/s)/mi2 .
103
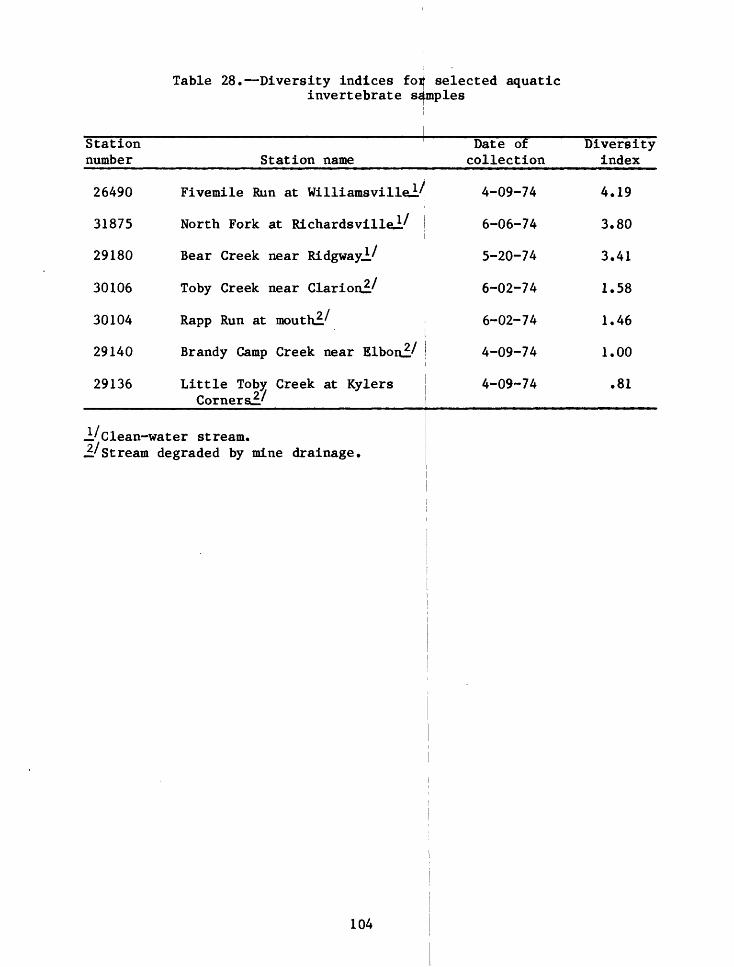
Table 28, Diversity indices foij selected aquatic invertebrate samples
Station number
26490
31875
29180
30106
30104
29140
29136
Station nameDate of collection
Fivemile Run at Williamsvillei^ 4-09-74
North Fork at Richardsvillel/ 6-06-74
Bear Creek near Ridgwayl/ 5-20-74
Toby Creek near Clarion!/ 6-02-74
Rapp Run at mouth!'
Brandy Camp Creek near Elbon!'
Little Toby Creek at Kylers Corners!'
6-02-74
4-09-74
4-09-74
Diversity index
4.19
3.80
3.41
1.58
1.46
1.00
.81
_ /Clean-water stream.3J Stream degraded by mine drainage.
104

Most wells are completed in bedrock, as the alluvium is limited in areal extent. Yields of bedrock wells are affected mostly by rock type, type of overburden, topography, depth of water-bearing zones, and by the rate and duration of pumping. In general, the regolith, which covers the bedrock in most places, serves as a reservoir that recharges the bedrock.
Due to their lithologic variability and the effects of fracturing, bedrock aquifers differ considerably from place to place in their capacity to yield water. Yields of wells are least on hills, larger on slopes, and largest in valleys. Most wells obtain water from several zones, generally less than 350 ft.
The Lower Mississippian rocks are the highest yielding some reported yields exceed 550 gal/min. Their median specific capacity is 4.3 (gal/min)/ft, whereas the median specific capacity of wells in the Conemaugh Group is 0.38, in the Allegheny is 0.67, and in the Pottsville is 0.41. No data are avail able for rocks of Devonian age, but they are probably poor aquifers because they consist mostly of shale and are deeply buried.
Problems of excessive iron, manganese, hardness, and acidity in the water are related chiefly to coal mining. Nonmined areas generally have good-quality water, but parts of these areas may be contaminated if regional aquifers and streams have carried the poor-quality water long distances. Poor-quality water is present in large parts of Clarion, Elk, and Jefferson Counties.
Water from most bedrock wells has a dissolved-solids content of less than 250 mg/L. Water from aquifers of Pennsylvanian age is lower in dis solved solids than that from the Lower Mississippian rocks. Water from hilltop wells is generally of better quality than that from valley wells. There are some abandoned flowing oil and gas wells that discharge highly mineralized water to streams in Clarion and Jefferson Counties. These wells may have iron concentrations in excess of 100 mg/L, and dissolved solids that exceed 1,500 mg/L.
Aquatic invertebrates can be used to assess stream quality. In many streams, their populations have been eliminated or drastically reduced because of exposure to mine drainage.
105

SELECTED REFERENCES
Alexander, D.J., 1976, The effects of a hydrogen sulfide effluent on themacroinvertebrate life in a single riffle| of the North Fork [Jefferson County, Pennsylvania]: Clarion State ColJLege, unpublished M.S. thesis,70 p. i i
Bardarik, D. G., 1961, The composition of fishjcommunities in relation toriver pollution: University of Pittsburgh, unpublished Ph. D. disser tation, 140 p.
Beamer, N. H., 1953, Chemical character of surface water in Pennsylvania, 1949-51: Pennsylvania Department of Commerce State Planning Board Publication 26, 96 p.
Berg, T. M., and Edmunds, W. E., 1979, The Huntley Catskill-to-Burgoon transition in north- Pennsylvania Geological Survey, 4th series IC-83, 80 p.
Mountain Formation: central Pennsylvania:
Information Circular
Berg, T. M., and Glover, A. D., 1976, Geology &nd mineral resources of the Sabula and Penfield [7%-minute] quadrangles, Clearfield, Elk, and Jefferson Counties, Pennsylvania: Pennsylvania Geological Survey, 4th series, Atlas A-74ab, 98 p. and appendices.
i iBlanchet, P. H., 1957, Development of fracture analysis as an exploration
method: American Association of Petroleujn Geologists Bulletin, v. 41, p. 1748-1759.
Buchart-Horn Consulting Engineers and Planners drainage pollution abatement project, Cla Pennsylvania Department of Environmental Project SL-194, 107 p. and appendix.
Buckwalter, T. F., Dodge, C. H., and Schiner, resources data, Clarion River and RedbankPennsylvania Part 2: gation 79-19, 135 p.
1975, Licking Creek mineion County, [Pennsylvania]:Resources Operation Scarlift
;. R., 1979, Selected water Creek basins, northwestern
U.S. Geological Survey Water-Resources Investi-
Burks, B. D., 1953, The mayflies or Ephemeropt^ra of Illinois: Illinois Natural History Survey Bulletin, v. 26, ajct. 1, 216 p.
Camp, Dresser, and McKee Consulting Engineers, pollution abatement: Unpublished report Mines and Mineral Industries, 196 p.
1949, Report on Clarion River for Pennsylvania Department of
Carter, R. W., and Davidian, Jacob, 1968, General chap. A6 of bk. 3, Applications of hydraulics Techniques of Water-Resources Investigations,
theGate, A. S., 1961, Stratigraphic studies ofPart 1, Stratigraphic cross sections of Lower rocks in western Pennsylvania and adjacent Survey, 4th series, Special Bulletin SB-10
106
procedure for gaging streams,U.S. Geological Survey
13 p.
Silurian rocks of Pennsylvania,Devonian and Silurian
areas: Pennsylvania Geological 3 p.

SELECTED REFERENCES Continued
Chiang, Sie Ling, McSparren, J. F., and others, 1975, The state water plan, planning principles, goals, objectives, standards criteria, work pro gram, and methodology: Pennsylvania Department of Environmental Resources, p. 49-63.
Dinsmore, B. H., 1968, The aquatic ecology of Toms Run, Clarion County,Pennsylvania: Pennsylvania Department of Health, Bureau of Sanitary Engineering, Division of Water Quality Publication 21, 64 p.
Edmunds, W. E., 1972, Coal reserves of Pennsylvania: Total, recoverable, and strippable (January 1, 1970): Pennsylvania Geological Survey, 4th series, Information Circular IC-72, 40 p.
Edmunds, W. E., and Berg, T. M., 1971, Geology and mineral resources of the southern half of the Penfield 15-minute quadrangle, Pennsylvania [with appendix by W. C. Darrah]: Pennsylvania Geological Survey, 4th series, Atlas A-74cd, 184 p. and appendices.
Eggers, J. M., 1973, Spatial and temporal aspects of primary productivity in Piney Reservoir, Clarion, Pennsylvania: Clarion State College, unpublished M.S. thesis, 101 p.
Engineering and Associated Design Services, 1977, Mine drainage abatement project for the Mill Creek watershed, Clarion and Jefferson Counties [Pennsylvania]: Pennsylvania Department of Environmental Resources Operation Scarlift Project SL-133-5, 379 p.
Flippo, H. N., 1977, Floods in Pennsylvania: Pennsylvania Department of Environmental Resources Bulletin No. 13, 59 p.
Gang, M. W., and Langmuir, Donald, 1974, Controls on heavy metals in surface and ground waters affected by coal mine drainage; Clarion River-Redbank Creek watershed, Pennsylvania: National Coal Association Fifth Symposium on Coal Mine Drainage Research, Louisville, 1974, p. 39-69.
Green International Inc., 1975-78, Comprehensive water quality managementplan, upper Allegheny River basin [Pennsylvania], study area 8: Report to Pennsylvania Department of Environmental Resources, preliminary draft, chap. 2-11 and appendices.
Gwin, Dobson and Foreman, Inc., 1977, Piney Creek mine drainage pollutionabatement project, Clarion County [Pennsylvania]: Pennsylvania Depart ment of Environmental Resources Operation Scarlift Project SL-192, 83 p. and appendices.
107

SELECTED REFERENCES Continued
Gwin, Dobson and Foreman, Inc., 1979, Deer Creek mine drainage pollution abatement project, Clarion County [Pennsylvania]: Pennsylvania Department of Environmental Resources Operation Scarlift Project SL-193, 90 p. and appendices.
-1979, Toby Creek mine drainage pollution County [Pennsylvania]: Pennsylvania Resources Operation Scarlift Project SL-
abatement project, Clarionof Envionmental
110 p. and appendices.Department
Hahn, S. S., Slack, K. V., and Tilley, L. J., J977, Benthic invertebrates, in Methods for collection and analysis of j aquatic biological and microbiological samples, chap. A4 of bk. £, Laboratory analysis: U.S. Geological Survey Techniques of Wate^-Resources Investigations, p. 145-198. i
Kay, G. G., 1974, Macroinvertebrate populationsmine drainage in Canoe Creek, Clarion County State College, unpublished M.S. thesis,
with varying levels of acid Pennsylvania: Clarion
106 p.
Koester, H. E., and Lescinsky, Joseph, 1976, Selected hydrologic data,Clarion River and Redbank Creek basins, northwestern Pennsylvania An interim report: U.S. Geological Survey O^en-File Report 76-445, 164 p.
Lee-Simpson Associates, Inc., 1976, Toby Creek mine drainage pollution aba tement project [Elk County, Pennsylvania]| Pennsylvania Department of Environmental Resources Operation Scarliftf: Project SL-132, variously paged. |
Leggette, R. M., 1936, Ground water in northwestern Pennsylvania:Pennsylvania Geological Survey, 4th serie^, Water Resources Report W-3, 215 p. i
Linton, K. J., 1970, Some aspects of the ecology of Mill Creek [ClarionCounty, Pennsylvania]: Unpublished repori of Pennsylvania Departmentof Mines and Mineral Industries, 36 p. i
Lloyd, 0. B., Jr., and Growitz, D. J., 1977, Gtound-water resources of central and southern York County, Pennsylvania: Pennsylvania Geological Survey, 4th Series, Water Resource Report W-42, 93 p.
Lytle, W. S., Heyman, Louis, Piotrowski, R. G.i and Krajewski, S. A., 1977, Oil and gas developments in Pennsylvania }.n 1976: Pennsylvania Geological Survey, 4th series, Progress Report PR-190, 49 p.
iMcCarren, E. F., 1967, Chemical quality of surface water in the Allegheny
River basin, Pennsylvania and New York: tl.S. Geological Survey Water-Supply Paper 1835, 74 p.
needMerritt, G. L. and Emrich, G. H., 1970, The luation in a mine drainage abatement Clarion County, Pennsylvania: National Symposium on Coal Mining Drainage Research 334-365. 108
for a hydrogeologic eva- program: A case study; Toms Run,
Coal Association Third Louisville, 1974, p.

SELECTED REFERENCES Continued
Merritt, R. W., and Cummins, K. W., eds., 1978, An introduction to theaquatic insects of North America: Dubuque, Iowa, Kendall/Hunt, 441 p.
Michael Baker, Jr., Inc., 1970, Acid mine drainage survey East Branch Clarion River watershed, Elk and McKean Counties [Pennsylvania]: Pennsylvania Department of Mines and Mineral Industries Operation Scarlift SL-108, variously paged.
Moore, J. R. , 1974, Water analysis program and report, East Branch ClarionRiver Lake [Elk County, Pennsylvania]: Unpublished report for U.S. ArmyCorps of Engineers, Pittsburgh, Pa., 296 p.
Newport, T. G., 1973, Summary ground-water resources of Clarion County, Pennsylvania: Pennsylvania Geological Survey, 4th series, Water Resources Report W-32, 42 p.
Parizek, R. R. , White, W. B., and Langmuir, Donald, 1971, Hydrogeology and Geochemistry of Folded and Faulted Rocks of the Central Appalachian Type and Related Land Use Problems: Pennsylvania State University, College of Earth and Mineral Sciences, Circular 82, 181 p.
Parsons, J. D. , 1968, The effects of acid strip-mine effluents on theecology of a stream: Archives Hydrobiology, v. 65, no. 1, p. 25-50.
Pennak, R. W., 1953, Fresh-water invertebrates of the United States: New York, The Ronald Press, 769 p.
Pennsylvania Bureau of Engineering, 1953, Memorandum report East Branch Clarion River; Sergeant Township, McKean County; Jones Township, Elk County [Pennsylvania]: Mine Waste Division, 17 p.
Pennsylvania Department of Commerce, 1975, Industry report series:Pennsylvania Department of Commerce, Bureau of Statistics, Research, and Planning Release M-5-75, p. 25-30.
Pennsylvania Department of Environmental Resources, 1970-76, Annual reporton mining, oil and gas, and land reclamation and conservation activities Pennsylvania Department of Environmental Resources [annual series].
1971, Water quality criteria: Title 25 - Rules and regulations,Subpart C - Protection of natural resources chapter 93, p. 93.1-93.98.
1975, Commonwealth of Pennsylvania 1974 water quality inventory:Pennsylvania Department of Environmental Resources, Bureau of Water Quality Management, 182 p.
1978, Proposals for recommended revisions to water quality criteria,waste water treatment requirements, and industrial wastes; Pennsylvania Bulletin, v.8, no. 9, pt. II, p. 511-708.
109

SELECTED REFERENCES Continued
Pennsylvania Department of Health and Pennsylvania Fish Commission, 1970,Aquatic biology investigation, Clarion River, McKean, Elk, Forest, and Clarion Counties [Pennsylvania]; Watershed survey July 21-24, 1969: unpublished report, 19 p. |
iPennsylvania Department of Mines and Mineral Industries, 1945-69, Annual
report of the Bituminous Coal Division: !Pennsylvania Department of Mines and Mineral Industries [annual series],
Poth, C. W., 1962, The occurrence of brine in western Pennsylvania:Pennsylvania Geological Survey, 4th series, Mineral Resource Report M-47, 53 p.
Roback, S. S., and Richardson, J. W., 1969, Tne effects of acid minedrainage on aquatic insects: Philadelphia Academy Natural Science Proceedings, v. 121 (3), p. 81-107.
U.S. Army Corps of Engineers, 1969, Project analysis, St. Petersburg Reservoir, Clarion River, Pennsylvania, in Development of water resources in Appalachia: Appalachian Regional Commission, pt. Ill, chap. 11, 258 p.
1972, Clarion River acid mine drainage abatement program, Pennsylvania,Draft Environmental Statement: U«S. Army Corps of Engineers, Pittsburgh,Pa., 15 p. I
U.S. Bureau of the Census, 1971, Pennsylvania 1970 census of population:U.S. Bureau of the Census Ser. PC(1)-A, 33 p.
U.S. Department of Commerce, Environmental Dai:a Service, 1971-77, Climatolog- ical data, Pennsylvania (annual summary),
U.S. Environmental Protection Agency, 1971, Cooperative mine drainage study, selected areas in the Clarion River basin [Pennsylvania]: Office of Water Programs, Wheeling, W. Va., 144 p.
i 1975, National interim primary drinking water regulations: Federal
Register, v. 40, no. 248, p. 59566-59587
1977, National secondary drinking water regulations: Federal Register, v. 42, no 62, p. 17143-17147.
U.S. Federal Water Pollution Control Administration, 1967, Water supply andwater quality control needs, St. Petersburg Reservoir, Clarion River,Pennsylvania: Federal Water Pollution Control Administration, Wheeling,W. Va., 48 p. i
i
U.S. Geological Survey, 1962-75, Water resources data for Pennsylvania Parts 1 and 2; Surface water records and| water quality records, 1961-74 [annual series]. ,
110
SELECTED REFERENCES Continued
U.S. Geological Survey, 1976-78, Water resources data for Pennsylvania,Volume 3, Ohio River and St. Lawrence River basins: U.S. Geological Survey Water-Data Reports PA-75-3-PA-77-3.
Usinger, R. L. , 1971, Aquatic insects of California with keys to NorthAmerican genera and California species: Berkeley, University California Press, 508 p.
Warnick, S. L., and Bell, H. L., 1969, The acute toxicity of some heavymetals to different species of aquatic insects: Water PollutionControl Federation Journal, v.41, no. 2, pt.l, p. 280-284.
Weed, C. E., and Rutschky, C. W., 1972, Benthic macroinvertebrate communitystructure in a stream receiving acid mine drainage: Pennsylvania Academy Science Proceedings, v.46, p. 41-47.
Wilhm, J. L., 1970, Range of diversity index in benthic macroinvertebrate populations: Water Pollution Control Federation Journal, v. 42, no. 5, pt. 2, p. R221-R224.
Wilhm, H. L., and Dorris, T. C. , 1968, Biological parameters for water, quality criteria: Bioscience, v. 18, no. 6, p. 447-481.
Woodrum, J. E., and Tarter, D. C., 1973, The life history of the alderfly,Sialis aequalis Banks, in an acid mine stream: American MidlandNaturalist, v. 89, no. 2, p. 360-368.
Ill