by the end of this session, you will - poinstitute.com · vivanda* *ex-cio, mccormick panel...
TRANSCRIPT

Page 1 The future direction of trade promotion
► Better understand the trade promotion “conundrum” facing CPG companies
► Hear what analysts/investors are saying about trade promotion and how companies need to think differently
► Get reactions from a few companies on if, and how,
they will behave differently in the future
By the end of this session, you will …

Page 2 The future direction of trade promotion
Historical growth and operating margin performance
Source: S&P Capital IQ. Chart shows weighted revenue growth and EBITDA margin performance of the top 50 CPG (food, beverage, HPC and tobacco) companies as ranked by revenues in 2014
Growth and operating margin for top 50 CPG companies over last 10 years
75% say that it has become harder to sustain or grow operating margins
74% say they need to make a significant change to maintain margins
-1.0%
6.7% 14.0%
10.0%
5.5% 7.1% 6.6% 6.0% 2.3%
-3.0%
18.2% 18.6% 18.6% 18.1% 18.3% 18.9% 19.3% 19.1% 19.2% 19.1%
-5%
5%
15%
25%
35%
45%
55%
Revenue Growth Operating Margin
Source: EY Margin Unlocked: integrated margin management to deliver breakthrough performance in consumer products

Page 3 The future direction of trade promotion
Recent growth and margin trends
Source: Company 10Ks *Includes ZBB (zero-based budgeting) **Quarterly figures
0
10
20
30
40
50
60
70
-4 -3 -2 -1 0 1 2 3 4 5 6
Company B, FY08-14
10
12
14
0 1 2 3 4 5 6
Company D, FY13-14**
Company A, FY06-14
Ope
ratin
g m
argi
n (%
)
Company C, FY11-14
10
15
20
25
30
-3 -2 -1 0 1 2 3 4
30
32
34
36
38
40
2 3 4 5 6 7 8 9
Underlying revenue growth (%)
Ope
ratin
g m
argi
n (%
)
Impact of ”cost-cutting” initiatives* on growth and margin (select CPG companies)
Underlying revenue growth (%)
Page 4 The future direction of trade promotion
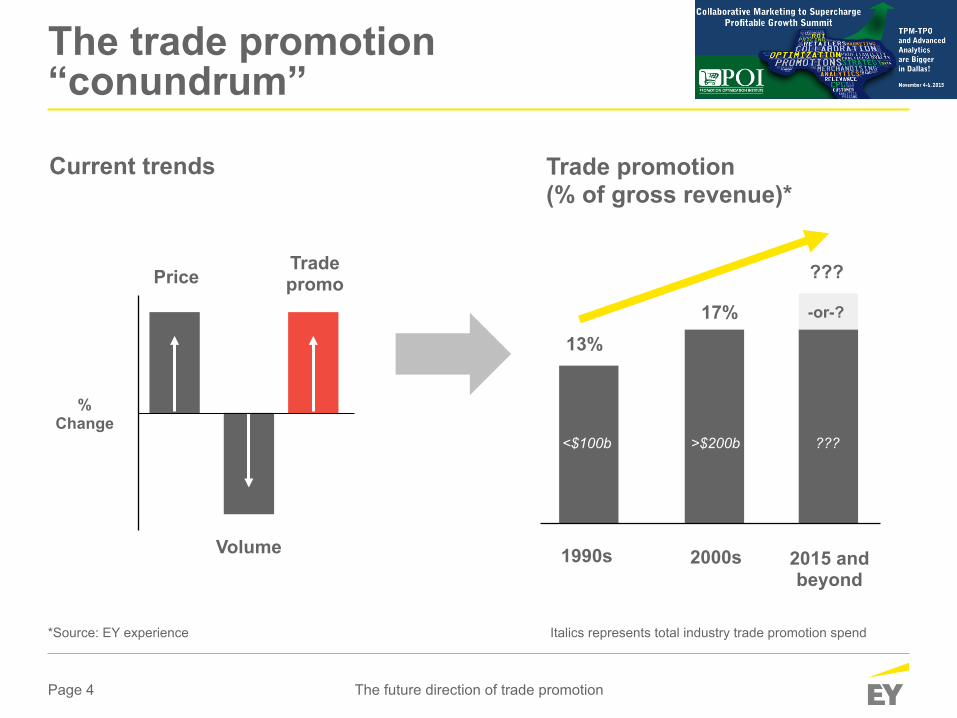
Trade promotion (% of gross revenue)*
*Source: EY experience
% Change
???
-or-?
???
2015 and beyond
17%
2000s
>$200b <$100b
1990s
13%
Current trends
The trade promotion “conundrum”
Price
Volume
Trade promo
Italics represents total industry trade promotion spend

Page 5 The future direction of trade promotion
*Source: The Wall Street Journal
Trade promotion – the next “cost-cutting” frontier “Cost-cutting” actions* Profit waterfall
Trade spend
Gross revenue
COGS
SG&A/ A&C
Oper. margin
Using black/white & 2-sided printing, copies, business cards, etc. Reducing use of corporate jets and first class Eliminating individual offices Shutting down factories Reducing client entertainment Eliminating management layers & downsizing office space

Page 6 The future direction of trade promotion
Processes ► Simplification and standardization ► “Closed-loop” planning/
execution/analysis A really good start …
Traditional approaches – a good start but not enough
Tools ► TPM and TFM solutions ► TPE and TPO “pilots”
Resources ► Trade marketing organizations and
“centers of excellence” ► “Controllable” KPIs/measures
Page 7 The future direction of trade promotion
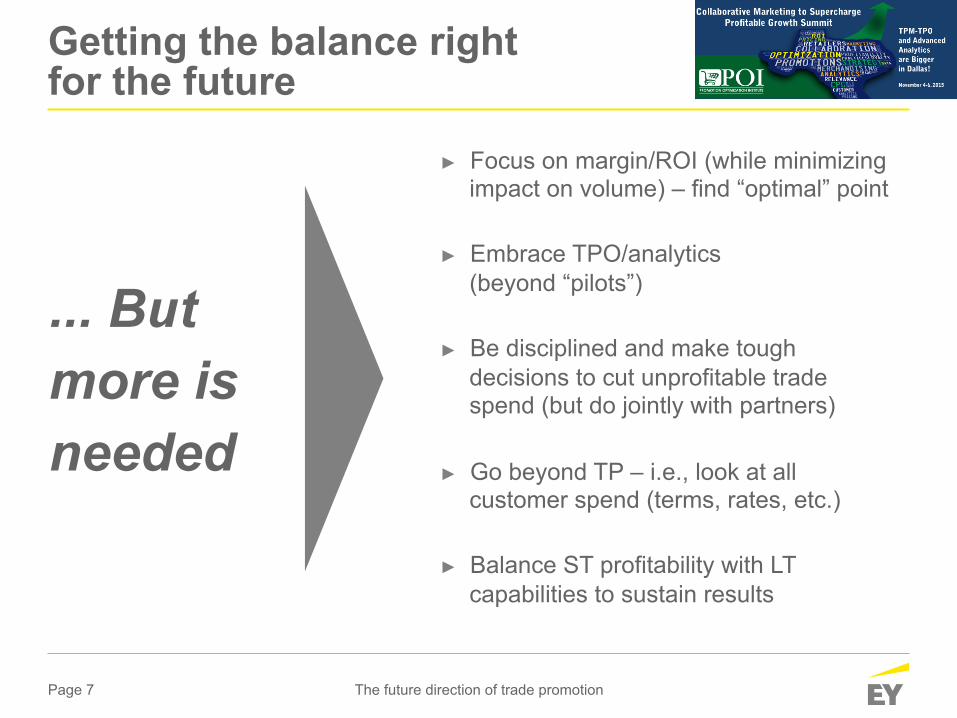
... But more is needed
► Focus on margin/ROI (while minimizing impact on volume) – find “optimal” point
► Embrace TPO/analytics (beyond “pilots”)
► Be disciplined and make tough decisions to cut unprofitable trade spend (but do jointly with partners)
► Go beyond TP – i.e., look at all customer spend (terms, rates, etc.)
► Balance ST profitability with LT capabilities to sustain results
Getting the balance right for the future

Page 8 The future direction of trade promotion
Jason English Vice President, Lead Packaged Food and Household and Personal Care Equity Analyst Goldman Sachs
Curt Balara Vice President, Sales Strategy and Planning Tyson Foods
Jerry Wolfe CEO and Founder Vivanda* *Ex-CIO, McCormick
Panel introduction