by steven t. anderson - usgs · by steven t. anderson import and export tables were prepared by...
TRANSCRIPT

CHILE—2004 7.1
1References that include a section mark (§) are found in the Internet References Cited section.
THE MINERAL INDUSTRY OF CHILE
By Steven T. Anderson
Import and export tables were prepared by Glenn J. Wallace, international data coordinator.
The Republic of Chile is the leading copper producer and exporter in the world; mine production of copper accounted for about 12% of the country’s gross domestic product (GDP), and exports of copper accounted for about 15% of the Chilean GDP in 2004 (Banco Central de Chile, 2005a, p. 24-25, 33). Based on purchasing power parity, Chile’s GDP was about $173.8 billion and the country’s GDP per capita was about $10,869 in 2004; these figures amounted to annual increases of about 7.4% and 6.1%, respectively compared with those of 2003 (International Monetary Fund, 2005§1). These increases were partly the result of an increase in the annual average price of copper to about $2.87 per kilogram ($1.30 per pound) compared with about $1.79 per kilogram ($0.85 per pound) in 2003. The mining sector of Chile increased the value of its production by 6.9% compared with 2003 because new copper mining projects and expansions of existing operations that had been put on hold during the past 2 to 3 years began production in 2004. Copper mining contributed 8.1% more to Chile’s real GDP in 2004 than in 2003, but other mining operations contributed about 1.5% less (Central Bank of Chile, 2005, p. 22, 29, 55).
In addition to increased copper prices, an economic development that was very important to the mineral industry of Chile in 2004 was the enactment of the new Chile-U.S. Free Trade Agreement (FTA). The immediate effect of this bilateral FTA on the value of mineral trade between the two countries was phenomenal, according to nominal figures. In 2004, the value of Chilean copper exports to the United States almost doubled compared with that of 2003; this value increased by only about 85% to all recipient countries, which included the United States, on average. The value of Chilean imports of combustible petroleum products from the United States increased in value by about 380%, mostly owing to increased imports of diesel fuel. The value of imports of combustible petroleum products increased by about 70%, and the value of imports of crude petroleum increased by about 35% from all supplying countries on average. At global prices, the value of trade in mineral commodities between Chile and the United States increased much more dramatically than between Chile and its other major trading partners in 2004. Even in real terms, the extent of trade creation in the first year of the U.S.-Chile FTA was striking especially because tariffs on trade of mineral commodities will not be fully eliminated between the two countries until 2012, and Chile had already completed FTAs with U.S. competitors for Chile’s mineral resources, which included Canada, the European Union, Mexico, and the Republic of Korea, years before the U.S.-Chile FTA was implemented. Increased exports of minerals to Chile’s major trading partners were largely responsible for the steady
depletion of the stocks of many minerals in Chile during the second half of the year (Banco Central de Chile, 2005b, p. 27, 32, 175-177; Central Bank of Chile, 2005, p. 22).
Chile was by far the world’s leading producer of copper with shares of about 37.5% of global mine production, 18% of refined copper production, and 13% of smelter production (Comisión Chilena del Cobre, 2005a, p. 109-113). Chile contains about 30% of world reserves of copper and state-owned Corporación Nacional del Cobre (CODELCO) was the leading copper-producing company in the world with a nearly 13% share of global production. The broader mineral industry of Chile is quite diversified and also well-developed, although Chile faces low and diminishing reserves of mineral fuels (U.S. Energy Information Administration, 2005§).
Chile was the second ranked producer of molybdenum in the world and ranked third in world reserves of the metal. Chile was also the leading producer of lithium in the world, and the country held almost three quarters of the global reserves of lithium. Chile was the fifth ranked producer of selenium in the world and contained the highest share of world reserves (about 20%). The country also contained the highest share of world reserves of rhenium and was the leading producer in the world in 2004. Annually, Chile produces a globally significant amount of silver and large quantities of other metals mostly as byproducts of the country’s copper production. Chile is also a globally significant producer of many industrial minerals; in 2004, the country produced 63% of the world’s iodine and held 60% of global reserves. Chile was also the fifth ranked producer of boron in the world and had boron reserves of major global significance (Bonel and Chapman, 2005, p. 39-41, 128-129, 153-155, 181-182, 228-229, 231-232). Chile also annually produces regionally significant quantities of nitrates and specialty fertilizers, of which the country exported slightly more than one-third to the United States in 2004 (Industrial Minerals, 2005). Mineral industry production, which included production of industrial minerals and other metals, contributed about 15.3% of the Chilean GDP in 2004,. Total exports of production from all mining operations in the country accounted for 18% of the GDP (Banco Central de Chile, 2005a, p. 24-25, 33).
Government Policies and Programs
The Government attempted to pass a new tax bill that would impose a 3% mining royalty on metallic mineral mines’ net sales and a 1% royalty on sales from nonmetallic mines. The bill was directed only at mining profits that would be at least 15% of gross sales. The impetus for this mining royalty bill was prompted by the discovery that Exxon Mobil Corp. sold off Compañía Minera Disputada de Las Condes Ltda. (Disputada) to Anglo American plc in 2002 without having paid any income taxes on this copper mining property during the preceding 25 years. Nonetheless, the new royalty bill was defeated on

7.2 U.S. GEOLOGICAL SURVEY MINERALS YEARBOOK—2004
August 10, 2004, by Government opposition concerned about the potential effect of any royalty payments on discouraging mining investment in Chile (Egan and Webber, 2004).
Attracting foreign direct investment (FDI) has played an essential role in Chile’s national development strategy, and foreign investors traditionally have been treated and taxed in a manner that was very similar to that shown to domestic investors in nearly all sectors, which included the mineral industry. The country’s 1974 foreign investment statute, known as Decree Law 600, is still in effect and clearly outlines a favorable policy toward foreign investors. Under Decree Law 600, a foreign investor may sign a contract with the Chilean Government, and the Comité de Inversiones Extranjeras (CIE) establishes the terms and conditions of the investment. Through 2004, such contracts were not allowed to be modified unilaterally by the Government or by the enactment of any legal regulations after being signed (U.S. Commercial Service, 2005, p. 54-57). Chile’s Mining Council, which was formed by the owners and operators of 17 large mines in Chile, was successful through 2004 in arguing that imposing a mining royalty retroactively would be a violation of these contracts (Egan and Webber, 2004).
At the end of November 2004, the President of Chile backed submission of an even stronger mining tax bill, and the Government presented this new mining sector-specific tax bill to the Chilean Chamber of Deputies on December 14, proposing the establishment of a 5% tax on operating profits derived from the sale of mineral products (Mining Journal, 2004). If this new royalty bill is passed, then companies protected under Decree Law 600 would be allowed to wait for their Decree Law 600 contracts to expire. They may also opt to renounce their Decree Law 600 status starting with the first year of enactment of the new tax policy (proposed to begin in 2006) and face only a 4% tax that would be guaranteed not to fluctuate for a stipulated period of time after enactment. Otherwise, the new tax policy would honor all existing Decree Law 600 contracts between mining companies and the state, and the new royalty would not be applied until these tax contracts expire, at which time their profits would be taxed at the going rate (5% or possibly higher if further contingent legislation is passed). If enacted, then this new legislation would eventually have a greater cost impact on existing mines than the royalty bill that was turned down in August, and it could have some impact on the potential development of new mining projects, although such impacts will be difficult to measure and are almost impossible to determine beforehand (Placer Dome Inc., 2005, p. 56).
According to proponents of a mining royalty bill, Chile’s mining law has included various loopholes from which foreign and domestic mining companies have been able to benefit. Industry and Government opposition to the bill downplayed the existence of such legal loopholes and successfully promoted the concept of the mining royalty as a threat to the international allure that the mineral industry of Chile has had for investment in recent years. The opposition claimed that much of the Chilean wealth and infrastructure generated during the past 30 years was heavily related to private investment in the mining industry, which included substantial FDI. In 2004, the Chilean President and his party claimed that Chile requires additional Government revenue from the mineral industry to reinvest
in diversification of the Chilean economy in anticipation of less mineral resource wealth in the future. The defeated bill had been expected to raise about $100 million per year in Government revenue starting in 2007. The new mining royalty legislation, which was being debated through the end of 2004, was expected to be implemented in 2006 and was anticipated to raise about $200 million per year for economic development programs (Economist, The, 2004; Porteous, 2005§).
In 2003, the Fraser Institute ranked Chile second in the world in terms of the appeal of its Government’s mining policies to private investors, which included some of the leading multinational mining firms in the world. In 2004, the country’s ranking by the same criteria fell to 14th possibly owing to the controversy over mining royalties in the country. In the combined rankings, however, Chile remained among the top five jurisdictions in terms of the overall appeal to mineral industry investors; this was mostly the result of being ranked second in terms of geologic mineral potential; that is, the country’s wealth of minerals still allowed its mineral industry to be very attractive to foreign investors in spite of increased uncertainty concerning the Government’s mining policies (McMahon and Lymer, 2005, p. 6-12, 25, 36).
The Chilean Government, through the Ministerio de Minería, exercised control of the mineral industry through three large state-owned companies and four regulatory agencies. The mining companies would not be subjected to the new mining royalty (if it is passed) and included CODELCO, some subsidiaries of Corporación de Fomento de la Producción (CORFO), and Empresa Nacional de Minería (ENAMI). The subsidiaries of CORFO that were important to the mineral industry included Cía. Chilena de Electricidad S.A., Cía. de Acero del Pacífico S.A. de Inversiones (CAP), Empresa Nacional del Carbón S.A., and the state-owned oil company Empresa Nacional del Petróleo S.A. (ENAP). The four regulatory agencies were the CIE, the Comisión Chilena del Cobre (COCHILCO), the Comisión Nacional del Medio Ambiente (CONAMA), and the Servicio Nacional de Geología y Minería. Although not likely to be privatized or subject to mining royalty payments, CODELCO faces other challenges owing to its ownership by the Chilean Government. A prominent example of such challenges is that CODELCO has historically experienced difficulty in expanding its interests or forming joint ventures within South America, especially with neighboring countries, because 10% of CODELCO’s foreign sales (exports) help fund the military of Chile. Even without royalty payments, CODELCO contributed more than $3.0 billion to the National Government Treasury in 2004 and accounted for about 14.7% of total Chilean fiscal revenues. ENAMI contributed just $1.6 million in Government revenue, and information concerning the contributions of the individual CORFO subsidiaries was not clear (Comisión Chilena del Cobre, 2005a, p. 69; Porteous, 2005§).
Chile has FTAs with Canada, countries in Central America, the European Free Trade Association (Iceland, Liechtenstein, Norway, and Switzerland), the European Union, Mexico, the Republic of Korea, and the United States. Chile also has complementary economic agreements that provide certain sector-specific tariff reductions or eliminations with Bolivia,

CHILE—2004 7.3
Colombia, Cuba, Ecuador, Peru, and Venezuela. Chile is an associate member of Mercado Común del Sur (MERCOSUR, or the Southern Common Market). The core members of MERCOSUR are Argentina, Brazil, Paraguay, and Uruguay, and the other associate member is Bolivia. Chile is also a participant in the Free Trade Area of the Americas negotiations. In 2004, Chile was also negotiating FTAs with China, India, New Zealand, and Singapore (U.S. Commercial Service, 2005, p. 2).
Structure of the Mineral Industry
For most of the 1990s, the Chilean economy attracted large inflows of FDI, especially in the mining sector. By 2004, many of the world’s leading mining companies, which included Anglo American, Barrick Gold Corporation, BHP Billiton Plc, Falconbridge Limited, Phelps Dodge Corporation, and Placer Dome Inc., were deeply invested in the mineral industry of Chile. Through 2004, the few barriers to FDI in the mineral industry that existed were mostly informal. For the mining sector, all investment projects required authorization by COCHILCO, but the authority of COCHILCO or the CIE to reject a foreign investment was severely limited by the Chilean Constitution. Consideration of a new mining royalty bill by the Chilean Congress did not appear to deter or delay substantially any major mining investment decisions. Even if the mining tax policy passes, its impact on investment was expected to be minimal as long as Chile maintained its global advantages in mineral reserves. Thus, the new royalty was expected to generate substantial Government revenue in the short run, but this increase in funding was expected to be used by the Government to restructure the Chilean economy toward industries more based on science and technology and less dependent on domestic exploitation of mineral resources in the long run (Egan and Webber, 2004; U.S. Commercial Service, 2005, p. 47, 54).
In 2004, Chile held about 30% of global copper reserves, and the total production of all the copper mines of CODELCO made this state-run company the country’s and the world’s leading producer of copper. CODELCO had four mining divisions (Andina, Codelco Norte, El Teniente, and Salvador) and one metallurgical division (Talleres) at the beginning of 2004. All divisions were located in northern and central Chile. CODELCO finished the process of privatizing its steel and metal products foundry Fundición de División Talleres Rancagua, but still retained a 40% share in the newly created company Sociedad Fundición Talleres S.A. This effectively terminated CODELCO’s Talleres Division at the end of May 2004. The private company Compañía Electro Metalúrgica S.A. purchased the entire 60% of the shares in Sociedad Fundición Talleres that were sold in a public offering but then sold off shares to other private interests to reduce its ownership share to 40% (equal to CODELCO’s) as of January 2004. In 2004, CODELCO accounted for about 19% of the world’s mine production of copper from the company’s total production across its four copper mining divisions, which included at least nine operating mines, and from its shares in copper production from other joint ventures in Chile (Corporación Nacional del Cobre, 2005a, p. 26, 107, 115, 133).
In 2004, the world’s leading individual copper mine, Escondida, was operated by Minera Escondida Limitada. The Escondida Mine accounted for 8.8% of global mine production of copper and about 22% of the Chilean mine production of copper. Minera Escondida’s total production accounted for about 2.5% of Chile’s GDP for the year. The company was privately owned; BHP Billiton held a controlling ownership share of 57.5%. By the end of 2004, Minera Escondida directly employed 2,814 people, including executives and administrative personnel, and hired 2,388 contractors during the year. The Escondida Mine produced about 1.2 million metric tons (Mt) of copper contained mostly in concentrate, with about 152,000 metric tons (t) of this total copper output in the form of cathodes. In comparison, CODELCO produced about 1.84 Mt of copper content; about 70% of this production was in the form of cathodes. The company directly employed 16,778 people and hired 19,929 operational contractors and 8,683 investment contractors during the year to achieve this production level. Thus, Minera Escondida’s copper productivity per internal employee (not including outside contractors) was estimated to be about 420 t of fine copper in 2004 compared with an estimate of about 110 t of copper per internal employee across CODELCO’s divisions (Corporación Nacional del Cobre, 2005a, p. 11; Minera Escondida Limitada, 2005, p. 12, 17, 21, 23). The average productivity of the approximately 37,000 people employed internally by all the copper mining companies with significant production levels in 2004 in Chile was about 150 t of copper per employee (Comisión Chilena del Cobre, 2005a, p. 67).
In 2004, Minera Escondida paid about $617 million in taxes to the Chilean Government; this figure did not account for any deferred tax payments or portions of these taxes that might be recoverable (Minera Escondida Limitada, 2005, p. 16). Thus, Minera Escondida produced about 65% as much copper as CODELCO, but paid only about 21% as much in direct tax contributions to the Government. A new mining royalty will increase the tax burden on private mining companies, but the Government was expected to keep relying heavily on state-run CODELCO for revenues from this sector of the economy. The main concern presented by the Government in continuing to press for new mining legislation was tax avoidance among private mining companies in Chile in addition to concerns surrounding missing opportunities to generate more revenues from the mining sector to help diversify the economy. The Government did not expect that the proposed royalty would either significantly deter FDI or provide state-run companies like CODELCO with an unfair competitive advantage.
In 2004, CODELCO started negotiations with state-owned China Minmetals Non-Ferrous Metals Co. Ltd. for a joint venture that involved development of CODELCO’s Gaby copper mine. This was one of a series of mineral development projects that Chile and China were mutually interested in pursuing. In November, the President of China signed multiple letters of intent concerning Chinese investment in mineral development projects in Chile while visiting to discuss greater economic cooperation and freer trade between the two countries (Ratliff, 2005). CODELCO has historically experienced difficulty in expanding its interests within South America

7.4 U.S. GEOLOGICAL SURVEY MINERALS YEARBOOK—2004
because neighboring Governments have voiced concerns about companies that operate in their countries assisting in funding Chile’s military through joint ventures with CODELCO, among other concerns about CODELCO’s market power in the region (Porteous, 2005§). These concerns did not appear to bother Chinese Government officials, and many of the potential Sino-Chilean mineral investment joint ventures were expected to be with CODELCO. Many state-owned mineral companies from China also had global supply arrangements or joint ventures with leading mineral multinationals, so private mining interests in Chile could also become involved either directly or indirectly with new Sino-Chilean investment contracts (Gonnella, 2004§).
As of December 31, 2004, Falconbridge was owned by Noranda Inc. (58.8%) and by other investors (41.2%). The third ranked producer of copper in Chile was Compañía Minera Doña Inés de Collahuasi SCM, which was a joint venture between Anglo-American and Falconbridge (each with a 44% ownership share) and a Japanese consortium of interested companies led by Mitsui & Co. Ltd. (12% share). The Collahuasi Mine was the fourth ranked copper producer in the world (Falconbridge Limited, 2005, p. 18). In response to the rapid increase of molybdenum prices in 2004, many of the leading copper producers began attempts to increase recovery of molybdenum. Increases in rates of molybdenum extraction were realized by CODELCO in 2004, and more increases were expected at its Chuquicamata smelter in the company’s Codelco Norte Division in 2005. Increases in rates of molybdenum extraction were also expected from 2005 through 2006 by Minera Collahuasi and at Noranda’s Altonorte copper smelter (Comisión Chilena del Cobre, 2005b, p. 18-20).
Most of the leading mining companies in Chile continued to expand production and to invest in new capacity in 2004 in response to an increase of about 61% in the average annual price of copper compared with that of 2003 on the London Metal Exchange. The 10 largest mining investment projects in Chile, the project development budget, and the owner with controlling interest, in order of decreasing expected development cost, were the Aldebarán Mine (copper-gold)—$1,650 million (Placer Dome), the Andina Mine expansion (copper)—$1,600 (CODELCO), the Pascua-Lama Mine (copper-gold)—$1,400 million (Barrick), the Spence Mine (copper)—$990 million (BHP Billiton), the Codelco Norte expansion (copper)—$900 million (CODELCO), the El Teniente Mine expansion (copper-gold)—$800 million (CODELCO), the Gaby Mine (copper)—$600 million (CODELCO), the Ministro Alejandro Hales Mine (copper)—$430 million (CODELCO), the Los Pelambres Mine expansion (copper)—$400 million (Antofagasta Minerals S.A.), and El Teniente metal processing plant (copper, gold, silver)—$340 million (CODELCO) (U.S. Commercial Service, 2005, p. 33).
ENAMI processed, smelted, and refined minerals for small- and medium-scale mining companies. The company has also traditionally provided technical assistance to small-scale copper mining operations. In 2004, Chile’s congress approved the sale of ENAMI’s Las Ventanas copper smelter and refinery to CODELCO. The sale was necessary to reduce ENAMI’s indebtedness. Prior to 2004, the company had increased its debt
by taking commercial loans to finance environmental remedies at its smelters and also used “advance profits” to repay National Government Treasury-supplied mining promotion funds. The smelter is located 8 kilometers (km) from Quinteros in Region V and had a registered smelting capacity of 400,000 metric tons per year (t/yr) and a refining capacity of 315,000 t/yr in 2004. ENAMI remained in control of concentration plants at Matta, Ovalle, Taltal, and Vallenar and expected to use some portion of the proceeds from the sale of Las Ventanas to upgrade production of copper anodes at the company’s Paipote smelter by an additional 65,000 to 75,000 t/yr from Paipote’s 2004 listed capacity of 300,000 t/yr (Mining Journal, 2004; Tarbutt, 2005).
The subsidiaries of CORFO accounted for most of the country’s domestic production of mineral fuels and steel. ENAP was in charge of domestic production of natural gas and petroleum but was faced with a continuing situation of low and diminishing domestic reserves of both mineral fuel commodities in 2004. In addition, Empresa Nacional del Carbón S.A. (ENACAR) (which is a former coal subsidiary of CORFO that was privatized in 1985) had only one small coal mine left in operation in 2004, and only one other small coal mine (also privately owned) was operating during the year in Chile (U.S. Energy Information Administration, 2005§).
The country as a whole, which included the mineral industry, was highly dependent on imports of natural gas from Argentina to meet growing energy requirements. Although Argentina began limiting natural gas exports early in 2004, owing to an energy crisis in that country, its gas exports to Chile still increased between 8% and 10% in 2004 compared with that of 2003 because of preexisting contracts between the two countries (Petroleum Economist, 2004). This narrowly averted a natural gas crisis, which would have constrained production of many mineral commodities.
With respect to industrial minerals, Sociedad Química y Minera S.A. (SQM) was the world’s leading producer of iodine, lithium, and specialty fertilizers (nitrates) in 2004. SQM was formerly a subsidiary of CORFO but was privatized in 1988 (Sociedad Química y Minera S.A., 2005, p. 1). In the mining royalty bill that was defeated in 2004, a lesser charge (compared with that on sales of metals) of a 1% royalty on sales of industrial minerals by such companies as SQM was to have been assessed. In the new mining tax proposal, however, sales of industrial minerals were expected to be excluded entirely from royalty payments (Egan and Webber, 2004).
In 2004, the entire mineral industry employed 48,734 people internally, which was about 1% of the total number of employees in Chile. The metals sector employed 41,256 people; the industrial minerals sector, 5,383; and the mineral fuels sector, 2,095. SQM alone employed a Chile-based staff of 3,183 people and was the major employer in the industrial minerals sector. Copper mining companies employed 37,020 people (not including outside contractors), or about 76% of the total directly employed by the mineral industry of Chile. Large-scale copper mining firms employed 26,584 people; the small-scale firms, 5,542; and the medium-scale firms, 4,894 (Comisión Chilena del Cobre, 2005a, p. 67).

CHILE—2004 7.5
Environment
The basis of Chilean environmental regulation was the Chilean Environmental Framework Law (Law 19,300). Adopted in 1994, it established the country’s general environmental policy and regulated all major activities likely to have an environmental impact. For mining projects with a potential environmental impact, authorization was required from CONAMA at the national level or the Comisión Regional del Medio Ambiente (COREMA) at the regional level, depending on the case (U.S. Commercial Service, 2005, p. 59).
In 2004, Barrick decided to revive its Pascua-Lama gold project in Chile’s Atacama region on the southern Chile-Argentina border as an open pit operation instead of an underground mine. The COREMA for Chile’s Atacama region, which was responsible for environmental authorization of this project, had approved the project as a partly underground mine in 2001. Barrick was working to show the rationale for a completely open pit mine as being more cost effective and not significantly less environmentally friendly than a partly underground operation despite the possibility that the company’s revised plan would involve moving portions of three glaciers and conserving the ice onto a larger glacier that drains into the same water basin. Barrick expected that an open pit at Pascua-Lama would enter production much earlier than a partly underground mine and produce about 23 t/yr of gold by 2009 (Jordan, 2005).
Major copper smelters began to take more account of arsenic and sulfur emissions and ramped up production of sulfuric acid to be reused in mining operations. Arsenic trioxide production had not apparently kept pace with increases in copper production, but CODELCO came up with its own brand of bioleaching technology and development of a more-stable arsenic compound that was beginning to be synthesized at Chuquicamata. Data were not readily available on mercury used or produced in major gold mines or other metal mining entities.
Exploration
The number of official exploration claims increased to 28,680 in 2004 from 24,357 in 2003. Mining exploration claims have to be renewed every 2 years. Likewise, an accounting of exploitation claims, which was based on paid annual licensing fees recorded by the Servicio Nacional de Geología y Minería showed that the total number of mineral exploitation claims in 2004 increased to 1,376,491 from 1,363,740 in 2003 (Servicio Nacional de Geología y Minería, 2005, p. 164-165).
In 2004, higher metal prices encouraged companies to increase their mineral exploration activity, and Latin America was the leading geographic area targeted for proposed exploration capital. Chile continued to be cited by the Metals Economics Group (MEG) as one of the top 10 countries expected to be a destination for proposed global exploration expenditures in 2004. The global copper exploration budget for copper expanded by 70% in 2004 compared with that of 2003; the exploration budgets for gold increased by about 68%; and for other minerals, which included silver and industrial minerals, by about 114%. Exploration activity in Chile was mostly aimed at potential copper and gold projects, but some regional
exploration also indicated economic potential for other mining projects (Wilburn, 2005).
In addition to BHP Billiton’s Spence copper project, a significant extension of Meridian Gold Inc.’s El Peñón gold-silver mine was also approved for development in 2004 and had a development budget of $35 million. The development of El Peñón will focus on exploration of the Dorada gold-silver vein, which was not discovered until 2004 because it lies 150 meters underground, despite its location only 1 km east of the Quebrada Colorada vein at El Peñón, which had already been explored. By the end of 2004, the Dorada vein was estimated to contain more than 15,500 kilograms (kg) in gold reserves; this figure is expected to increase with further exploration. Meridian also discovered the Fortuna gold-silver vein on the Angelina property in 2004, which continued to be explored under a joint-venture agreement with Gold Fields Limited. Under this joint-venture agreement, Meridian budgeted $1.25 million for the next 4 years to explore at Angelina and can earn up to an 80% interest in the project. The Fortuna vein is located only 7 km from the El Peñón Mine (Meridian Gold Inc., 2005, p. 2-3, 20).
Coeur d’Alene Mines Corporation budgeted $3.5 million for 2004 to continue its exploration program at the Cerro Bayo gold and silver deposit in Region XI near the border with Argentina, and $3.9 million for 2005 to explore in the area immediately around Cerro Bayo. Production in 2004 at the Cerro Bayo Mine came from five main epithermal vein systems within the deposit; the company reported that more than 100 such veins had been discovered in the area. In 2004, Coeur d’Alene approved a plan to extend its exploration program at Cerro Bayo for the following 3 years with the expectation that this effort would help extend the life of the mine by about 3 years. The plan was designed to focus exploration efforts close to the areas of the mine that were producing and near existing infrastructure so that any new discoveries of ore could be brought into production while prices remained high. As a result of exploration discoveries and higher prices, the company’s estimate of gold reserves at the Cerro Bayo Mine, although still only about 3,610 kg, was 372% higher in 2004 compared with that of 2003. Silver reserves were estimated to be about 190,000 kg in 2004, which was about 300% higher than the company’s 2003 estimate (Coeur d’Alene Mines Corporation, 2005, p. 14-15, 25).
Noranda Chile S.A., which became a subsidiary of Falconbridge after Noranda was merged with Falconbridge at the end of 2004, continued to conduct the exploration of El Morro porphyry copper-gold deposit in Region III. El Morro was owned by Metallica Resources Inc. of Denver, Colorado. Falconbridge budgeted $1.66 million for 2004 to resume exploration at El Morro after Noranda Chile suspended its exploration efforts in 2003 owing to copper prices not being high enough, on average, to attract sufficient capital to the project. In 2004, Falconbridge remained in good standing, however, with respect to Noranda’s initial agreement with Metallica Resources to earn a 70% interest in El Morro by spending $10 million on exploration and development from 1999 to 2005, paying an additional $10 million to Metallica in 2005, and completing a feasibility study by 2007. Although the copper and gold resources at El Morro were inferred only through 2004, the deposit is located very near two copper
7.6 U.S. GEOLOGICAL SURVEY MINERALS YEARBOOK—2004
smelters, and any metal from a potential mine could be brought to market quickly enough to take advantage of high copper prices if the status of these resources was upgraded soon (Noranda Inc., 2005, p. 14).
In 2004, Lumina Copper Corp. completed a new $300,000 drilling program at its Regalito copper project in Region III. According to the company, Regalito was the second largest reported copper discovery in Chile since 1996. Any future exploitation was expected to necessitate heap and dump leaching of the material contained in the measured and indicated resources. The Regalito deposit is located approximately 150 km southwest of a major mining center at Copiapo and near the Candelaria open pit mine and the Cerro Casale copper-gold deposit (Regalito Copper Corp., 2005). In addition, Rio Tinto plc approved a budget of $4 million to explore at the Ricardo copper property near Calama (Wilburn, 2005).
Production
In 2004, Chile’s mine production of copper increased by about 10% compared with that of 2003, but Chilean smelter production did not increase proportionally (by only about 1.4%). Annual smelter production increased at about the same rate (7%) as mine output in 2003 compared with that of 2002, and any stockpiles of mined copper ore were estimated to have been almost completely depleted as prices increased toward the end of 2003. In 2004, production of refined copper in Chile actually decreased slightly compared with that of 2003 owing to new solvent extraction-electrowinning (SX/EW) plants not coming onstream or existing plants not expanding production as quickly as expected. Primary electrolytic copper refineries, however, were actually able to ramp up production somewhat in 2004 compared with 2003.
Total annual mine production of copper was higher in 2004 because many new projects and expansions at almost all the major copper-producing companies contributed a full year of production after being put on hold or only partially activated during a period of lower copper prices that ended toward the end of 2003. Across its divisions, CODELCO’s mine production of copper increased by 11% in 2004 compared with that of 2003. In addition, copper production increased by 22% at the Collahuasi Mine, 20% at the Escondida Mine, about 7.6% at the Sur Andes Mine (formerly Disputada Mine until 2003), and slightly more than 7% at Los Pelambres Mine (Comisión Chilena del Cobre, 2005a, p. 17).
Molibdenos y Metales S.A. (MOLYMET) produced most of the ferromolybdenum and rhenium in Chile, and the company reportedly exported almost all its output of these two metals. Because the actual figures are not officially reported (for reasons of company privacy), estimates are often based upon Chilean export data for these two commodities. Accurate data on the production of arsenic trioxide was also not available, but some companies that smelt ores that contain significant amounts of arsenic, such as CODELCO, report on their processes for recovering arsenic from the smelter emissions and producing stable arsenic compounds. U.S. Geological Survey estimates for production of arsenic trioxide were based upon this informal evidence and some historically reported figures for arsenic
(trioxide) exports or production (Comisión Chilena del Cobre, 2005b, p. 18-20; Corporación Nacional del Cobre, 2005b, p. 8, 10, 12, 19).
In 2004, reported mine production of molybdenum increased by 25.5% compared with that of 2003 in Chile, mostly owing to increased recovery of the metal at CODELCO’s Chuquicamata smelter. CODELCO was the leading producer of molybdenum in Chile and produced all the country’s reported production of molybdenum oxides at the company’s Codelco Norte Division. CODELCO produced 77% (32,324 t) of Chile’s total molybdenum production in 2004, and 15,932 t of molybdenum-in-concentrate was produced at the company’s Codelco Norte Division. Los Pelambres copper mine was the next ranked producer of molybdenum concentrate, with a production of 7,853 t in molybdenum content. The reserves at the Escondida Mine predominantly contained gold and silver as economically exploitable byproducts, but not much molybdenum (Comisión Chilena del Cobre, 2005a, p. 19; 2005b, p. 19-20).
Mine production of gold increased by slightly more than 2.6% in 2004 compared with that of 2003. This increase was primarily the result of increased production of gold as a byproduct from mines that produced predominantly copper. From 2000 through 2004, copper mines were responsible for an increasing share of total gold production, which increased to 41.3% in 2004 compared with 40.3% in 2003. The level of mine production of gold by copper mines increased by 5.25% in 2004 compared with that of 2003, and gold production by gold mines increased by less than 1% (Servicio Nacional de Geología y Minería, 2005, p. 40). The leading contributor to increased gold production in 2004 was the Escondida copper mine where mine production of gold increased by about 20% compared with that of 2003 and was comparable to the mine’s increase in copper production (BHP Billiton Plc, 2003, p. 8; 2004, p. 8-9; 2005, p. 26-27)
Mine production of silver was almost all as a byproduct of mining operations targeted primarily at recovering copper and/or gold; lead-zinc mines contributed only about 3 t of silver content in 2004. Copper mines accounted for about 55% (approximately 747 t of silver content) of all silver production in Chile. In 2004, the Escondida Mine produced about 135 t of silver, and the four mining divisions of CODELCO contributed a majority of the remaining share of the Chilean copper mine production of silver. Gold mines in Chile contributed about 610 t of silver content, and were led by La Coipa and the Cerro Bayo Mines (BHP Billiton Plc, 2004, p. 9; 2005, p. 27; Servicio Nacional de Geología y Minería, 2005, p. 59; Corporación Nacional del Cobre, 2005§).
After acquiring PCS Yumbes SCM on December 21, 2004, SQM controlled about 93% (about 1.3 Mt) of the total amount of Chilean production of nitrates entering 2005. In 2004, prior to this acquisition, SQM’s annual production of nitrates increased by about 15% compared with that of 2003. The company also controlled about 51.6% (about 7,700 t) of the total iodine production in Chile and increased production of iodine and iodine derivatives by about 16.7% compared with that of 2003. It also produced about 74% (about 32,600 t) of the total amount of lithium carbonate produced in 2004 in Chile and increased its production of lithium by about 19% compared

CHILE—2004 7.7
with that of 2003 (Sociedad Química y Minera S.A., 2005, p. 35-38).
Trade
The domestic trade data for mineral trade with Chile is transparent and reliably provided by the sources cited in this section of the chapter. Tables 3 and 4 at the end of this chapter were compiled from an international source and the data is not as current, although it is comparable and includes more detail than the figures that have been summarized in the text. Tables 3 and 4, therefore, are not cited in this chapter, but the data from the UN Commodities Trade Database is still provided for comparison.
In 2004, Chile’s overall trade balance had a surplus of slightly more than $9 billion and exports of copper contributed about $14.4 billion to this balance (Central Bank of Chile, 2005, p. 58). The value of Chile’s total mineral exports increased by 92.3% in 2004 compared with that of 2003 (Comisión Chilena del Cobre, 2005a, p. 22). The country’s total mining exports contributed slightly less than $17 billion towards the trade surplus and accounted for about 53% of the value of Chile’s total exports in 2004. Mining operations in Chile imported only $3.9 billion worth of total goods, which included machinery; this total represented an increase of about 43% compared with that of 2003 (Banco Central de Chile, 2005b, p. 7; 2005c, p. 7). In 2004, only about $371 million of the total imported goods actually consisted of mineral commodities, which still represented an increase of about 190% compared with that of 2003. The substantial increases in the values of Chilean exports and imports of mineral commodities in 2004 compared with those of 2003 were mostly the result of increases in the annual average prices of these commodities, especially for copper but also for other metals, such as molybdenum, and for some industrial minerals (Comisión Chilena del Cobre, 2005a, p. 101, 122-127).
Most of the goods imported by the mineral industry of Chile consisted of mining equipment, which does not enter into the country’s mineral trade balance. Increased imports of mining equipment into the mining sector in 2004 largely consisted of increased imports of U.S.-made equipment as a result of the new U.S.-Chile FTA. In 2004, U.S. suppliers captured 60% of the Chilean mining equipment market compared with about 44% in 2003, but this share was not expected to increase much more after 2004 primarily owing to competition from mining equipment manufacturers in Brazil, Canada, Germany, Japan, and the Republic of Korea. All these countries, except Japan, were participating in FTAs with Chile prior to the U.S. agreement (U.S. Commercial Service, 2004, p. 20-21; 2005, p. 32).
After copper, Chile’s most important mineral export commodities in 2004 were, in order of decreasing value, molybdenum, gold, iodine, iron ore, silver, nitrates, and lithium carbonate. The country’s mineral trade balance was about $16.6 billion in 2004 compared with about $8.7 billion in 2003. Higher prices for these export commodities were largely responsible for almost doubling the value of Chile’s mineral trade surplus in 2004 compared with that of 2003, but Chile also increased the quantity produced and exported for most of
these minerals. In terms of quantity, exports of copper increased by about 17% in 2004 compared with that of 2003. The quantity of Chile’s exports of molybdenum increased by 118%; ferromolybdenum, 41%; silver, 37%; molybdenum oxide, 21%; iron ore, 14.5%; iodine, 8.2%; and potassium nitrate, 5.7% in 2004 compared with those of 2003. Total exports of minerals for Chile reached about 17 Mt in 2004, which represented an increase in quantity of about 9.4% compared with that of 2003. In percentage terms, the annual increase in Chilean imports of minerals was actually much higher than for mineral exports in 2004 but reached only about 419,000 t, which represented an increase of 28% in total quantity compared with that of 2003 (Comisión Chilena del Cobre, 2005a, p. 22-23, 101-102).
In 2004, China purchased enough Chilean copper to represent 18.7% of the total value of the country’s copper exports in 2004; Chile also shipped another 12.8% to Japan, 9.4% to the Republic of Korea, 7.2% to Italy, and 7.0% to France. About 65% of Chilean exports of molybdenum concentrates and 52% of ferromolybdenum exports were purchased by the Netherlands in 2004. Japan was Chile’s leading customer for molybdenum oxide and bought an amount of this mineral commodity that was equivalent to a 44% share of the total value of Chilean exports. The United Kingdom was the leading customer for Chile’s gold exports (60% of the total value of Chilean exported gold), and the United States purchased most of the rest of Chilean gold exports (about 35% of the total export value). The United Kingdom also bought the largest share of Chile’s silver exports (about 53%, by value). The United States (about 35% of the total export value) and Argentina (about 12%) were the next most significant importers of silver from Chile. Almost all Chile’s iron ore exports were purchased by Asian companies (about 94%, by value), led, in order of the value of Chilean iron ore received in 2004, by firms in China, Japan, Indonesia, and Malaysia (Comisión Chilena del Cobre, 2005a, p. 24).
The United States was Chile’s leading customer for exports of lithium carbonate in 2004 (with a 24.5% share of Chile’s total exports, by value) but was closely followed by Japan (23.2%), and then by Belgium (17.9%), and China (14.5%). The United States was also the world’s leading importer of iodine from Chile (with a 33.7% share of total Chilean exports, by value), and Belgium imported almost as much (31.3% share). Brazil was by far the leading customer for the potassium nitrate that was exported by Chile in 2004, with a 76.2% share of total Chilean exports of this specialty fertilizer in 2004. Asian countries purchased about 50% of the metals and 49% of the total minerals exported by Chile in 2004, by value. The countries of Europe purchased about 31.6 % of the exported metals and 31.4% of all Chilean mineral exports, while the countries of the Americas purchased about 18.2% of Chilean metals exports and 19.2% of total Chilean mineral exports. The bulk of the remainders (composed predominantly of copper and molybdenum oxide) was purchased by South Africa (Comisión Chilena del Cobre, 2005a, p. 25-26).
In November of 2004, the President of China spent 2 weeks in four Latin American countries, which included Chile, to sign letters of intent to pursue increased investment and freer trade. Specifically, his visit to Chile was reported to be for officially beginning negotiations on a bilateral FTA between Chile and

7.8 U.S. GEOLOGICAL SURVEY MINERALS YEARBOOK—2004
China (Sino-Chilean FTA). China was the leading consumer of refined copper in the world, and its growing demand for this and other raw mineral materials was the focus of the countries’ negotiations through the end of the year. About 65% of total Chilean exports to China consisted of copper in 2004. A target date of December 2005 was set to complete the FTA (Ratliff, 2005). China was already the fifth ranked purchaser of Chilean exports, which included minerals. In turn, Chile was already China’s third ranked trading partner in Latin America, after Brazil and Mexico (Jin, 2004§). In 2004, about 20% of CODELCO’s total sales of copper was exported to China (Corporación Nacional del Cobre, 2005a, p. 27).
Commodity Review
Metals
Copper.—In 2004, Minera Escondida continued to develop the Escondida Norte open pit copper mine where production was scheduled to begin in the fourth quarter of 2005; Escondida Norte is adjacent to the main Escondida open pit mine. The capacity for production out of the Escondida Norte pit was expected to replace almost exactly the depletion of reserves in the main pit, which would leave production capacity at the Escondida Mine unchanged at 1.25 million metric tons per year (Mt/yr) of copper contained in concentrate and cathodes. The Escondida sulfide leach project was approved for development on April 6, 2004, by the majority owner of Minera Escondida, BHP Billiton, and will produce 180,000 t/yr of copper from low-grade run-of-mine ore from the Escondida and the Escondida Norte pits starting in the second half of 2006. Development of the Spence copper project was approved in October 2004 by BHP Billiton and was expected to begin producing 200,000 t/yr of copper cathode in the last quarter of 2006 (BHP Billiton Plc, 2005, p. 21, 25-27, 196-199; Minera Escondida Limitada, 2005, p. 12).
In 2004, CODELCO increased its mine production of copper by 10% compared with that of 2003. An increase in production occurred at the company’s El Teniente Division because several projects to improve the mine, plant, infrastructure, technology, and management were implemented midway through 2003 after being held back during the preceding period of low copper prices. These projects were more fully implemented in 2004 and were responsible for expanding annual fine copper production capacity to an estimated 440,000 t/yr compared with about 350,000 t/yr in 2003. Even more-complete implementation of these improvements at El Teniente was expected to increase copper production capacity to 480,000 t/yr in 2005. In 2004, mine production of copper at El Teniente Mine and plant was 435,658 t compared with 339,440 t in 2003. Beginning development of the open pit Gaby Mine SX/EW plant was also delayed until prices improved sufficiently, but the basic engineering for this project began in 2004. After extraction, the ore will be heap leached and treated by using solvent extraction, and then a production capacity of 150,000 t/yr in cathodes will be electrowon out of solution. Production at Gaby was scheduled to start up toward the end of 2007 (Corporación Nacional del Cobre, 2005a, p. 25, 42-43).
In 2004, the company continued to develop the Mina Sur northern expansion project within its Codelco Norte Division, which included operations to prepare the mine for opening and to build a heap leaching plant that will be able to produce 120,000 t/yr of copper. The mine and the plant were scheduled to be available to start production by the second half of 2005. Development of the Ministro Alejandro Hales Mine (named Mansa Mina until 2004) was under review in 2004, and the potential output from this copper mine may be at least partially bioleached owing to the complex nature and high arsenic content of its ore. Additionally, a brief strike by most of the supervisors of the Chuquicamata operations started on October 4 and ended on October 17. Total annual mine production of copper in the Codelco Norte Division was not severely interrupted and increased to 982,817 t in 2004 compared with 907,169 t in 2003, although some smelting operations were temporarily taken offline during the strike for care and maintenance. CODELCO’s increased production in 2004 compared with that of 2003 also increased the company’s world-leading market share for primary copper production to about 19% from about 15% (Corporación Nacional del Cobre, 2005a, p. 25-26, 41, 46, 58).
In 2004, copper production exceeded Falconbridge’s forecast for the Collahuasi Mine and reached about 512,800 t, which was an increase of 22% compared with that of 2003. Minera Collahuasi completed a transfer of most mining activities to the Rosario deposit where grades were now higher than those at the more-depleted Ujina deposit. The company completed an expansion of the concentration plant to increase its capacity by about 57% in 2004 compared with that of 2003. The improvements at the plant were expected to enable Minera Collahuasi to maintain production even if copper grades decline, and copper production was expected to increase to about 550,000 t in 2005. In 2004, a scoping study was started at Collahuasi Mine to assess further expansion that would increase annual copper production by about 175,000 t/yr (Falconbridge Limited, 2005, p. 6, 8, 18, 32-33).
Falconbridge completed a crusher expansion project in April at its Lomas Bayas Mine, which produced 62,000 t of copper in 2004. The company also had an option to purchase a resource adjacent to the Lomas Bayas property, Fortuna de Cobre, which would increase copper production capacity to about 90,000 t/yr by mid-2007 at Lomas Bayas and extend the life of the mine past 2020, if placed in production (Falconbridge Limited, 2005, p. 6, 8, 19, 33).
In 2004, Noranda Chile S.A. was a wholly owned subsidiary of Noranda and operated the Altonorte copper smelter, which produced 266,440 t of copper anodes compared with 260,971 t in 2003 (Noranda Inc., 2005, p. 87).
In 2004, Antofagasta plc increased mine production to 350,600 t of copper compared with 326,700 t in 2003 at the company’s Los Pelambres Mine, and to 97,800 t compared with 92,400 t during the same time frame at its El Tesoro Mine. These increases in production resulted from completion of modifications to the grinding lines at the plants that corresponded to each mine at the end of 2003, which allowed a higher amount of ore to be processed in 2004 and compensated for slightly lower copper grades and recovery rates at both mines. In March 2004, the COREMA for Chile’s Fourth

CHILE—2004 7.9
Region approved an environmental impact assessment submitted by Antofagasta for construction of a new tailings dam at El Mauro Valley, which is located about 60 km from the Los Pelambres concentrator plant, to deposit tailings generated by Los Pelambres when the existing dam reaches capacity. This development was expected to enable Antofagasta to increase the ore reserves at Los Pelambres Mine to 2.1 billion metric tons (Gt) because it will enable Los Pelambres to increase capacity at the plant by 40%. Antofagasta began constructing Mauro Dam at the end of 2004 and expected to begin the plant expansion at Los Pelambres in the second half of 2005. Antofagasta expected to complete a prefeasibility study for the Esperanza copper-gold project, which is located adjacent to the El Tesoro Mine, by the end of 2006. Antofagasta intended to develop Esperanza as an open pit mine. The company expected Esperanza to produce 120,000 t/yr of copper in concentrates and 5,300 kilograms per year (kg/yr) of gold during the first 5 years of its expected 20-year mine life (Antofagasta plc, 2005, p. 8-9, 12-15, 22, 40).
After acquiring Disputada, Anglo American changed the name of the mining company to Minera Sur Andes Limitada. In 2004, Minera Sur operated two copper mines, Los Bronces and El Soldado, and the Chagres smelter. Los Bronces Mine and its associated Las Tortolas concentration plant produced 231,600 t of copper in concentrates in 2004 compared with 207,800 t in 2003 owing to a larger quantity of ore mined, higher copper grades, and an improved metal recovery rate. Minera Sur began a scoping study in 2004 to increase future production at Los Bronces Mine. Anglo American’s smaller El Soldado Mine produced 68,800 t of copper content in 2004 compared with 70,500 t in 2003, but the company approved a project to expand the open pit mine after Minera Sur identified additional copper resources there. Anglo American also approved an expansion of Chagres in 2004, which was expected to increase production capacity to 184,000 t/yr of copper anode/blister after its expected commissioning during 2005. The smelter produced 165,000 t of copper anode/blister in 2004 compared with 160,100 t in 2003 (Anglo American plc, 2005, p. 9, 14, 99, 115-116).
Another Chilean mining subsidiary of Anglo American was Empresa Minera de Mantos Blancos S.A., which operated the Mantos Blancos and the Mantoverde open pit mines. Some of the assets of the Mantos Blancos Mine were reduced in value in 2004 because the expected life of the mine was reduced. This reduction was estimated to equate to a loss of 10 Mt of potential sulfide ore reserves. Mantos Blancos Mine was then scheduled to cease production when the oxide plant runs out of material; only the sulfide plant will remain. The operation was not expected to be economic with production only from the sulfide plant. At the Mantoverde Mine, the dump leach reserves had also decreased because of ore depletion (Anglo American plc, 2005, p. 99).
The Zaldívar copper mine lies on an extension of the Escondida Norte deposit. In 2004, the mine produced 147,602 t of copper in concentrate compared with 150,466 t in 2003. Placer Dome owned the mine and expected that production would be 150,500 t in 2005 because of the company’s ongoing investment in improvements to the processing capacity at the mine. In addition, the ore had a higher sulfide content than the
company was expecting for 2004, which slowed down metal recovery rates (Placer Dome Inc., 2005, p. 13, 22, 30, 36, 48).
Gold and Silver.—La Coipa Mine was operated by Compañía Minera Mantos de Oro and produced 5,657 kg of gold in 2004 compared with 6,198 kg in 2003; the mine also produced 229,730 kg of silver compared with 252,996 kg in 2003. This decreased production was primarily the result of a 14% depletion of reserves at the mine during 2004 (Placer Dome Inc., 2005, p. 22, 36-37). In contrast, gold and silver reserves increased by about 372% and 300%, respectively, in 2004 compared with those of 2003 at the Cerro Bayo gold-silver mine, which was operated by Cerro Bayo Ltda. (a wholly owned subsidiary of Coeur d’Alene Mines Corporation). Production included 153,784 kg of silver and 1,862 kg of gold compared with 151,438 kg of silver and 2,086 kg of gold in 2003 (Coeur d’Alene Mines Corporation, 2005, p. 4, 14, 15).
In 2004, production of gold as a byproduct of copper also decreased (by about 6.5%) compared with that of 2003 at the Escondida Mine, but silver production increased by about 4.3% owing to the increased production of copper ore that contained increasingly more silver than gold (BHP Billiton Plc, 2004, p. 9; 2005, p. 27). Production of gold and silver as byproducts at Phelps Dodge’s Candelaria Mine was estimated to have increased in 2004 compared with that of 2003, although total copper production actually decreased slightly. The Candelaria mining operation consisted of an open pit and underground copper mine and a concentration plant. The underground mining operations were being expanded into the Candelaria Sur and the Candelaria Norte Mines in 2004, and the average grade of gold in the initial ore recovered from this underground expansion was about 0.5 gram per metric ton (g/t) of gold compared with about 0.1 g/t of ore at the existing Candelaria Mine. In 2004, mine production of copper was restarted during the year by Phelps Dodge at its nearby Ojos del Salado mining operation, which was accounted for by the company as part of the existing Candelaria Mine but had been placed on care and maintenance status since 1998. Only one of the two inactive underground mines at Ojos del Solado was brought back into production along with its associated concentration plant. In 2004, the average grade of gold was estimated at about 0.25 g/t of ore mined at Ojos del Solado (Phelps Dodge Corporation, 2005, p. 2, 7, 14, 17).
The restart of gold production at El Refugio Mine was rescheduled to begin in May 2005 (instead of the end of 2004) at an expected rate of about 3,700 kg/yr. Only about 1,500 kg of gold was expected to be produced in 2005 at the mine before full annual production capacity is achieved in 2006 (Bema Gold Corporation, 2005, p. 4, 6). In 2004, Sociedad Contractual Minera Purén, which was a joint venture between CODELCO and Mantos de Oro, completed a feasibility study on the Puren gold deposit, which had been discovered in late 2002 near the La Coipa Mine in northern Chile. Construction of the mine was scheduled to begin during the first quarter of 2005, and the first of three production phases was expected to start up in 2006 (Corporación Nacional del Cobre, 2005a, p. 37-38).
Molybdenum.—CODELCO expected to increase molybdenum recovery at its Chuquicamata Mine where production of molybdenum in concentrate was 15,932 t in 2004.

7.10 U.S. GEOLOGICAL SURVEY MINERALS YEARBOOK—2004
Total production, which included molybdenum oxides, was 32,324 t in 2004 across the CODELCO divisions. Although all four of CODELCO’s copper mining divisions produced molybdenum as a byproduct, the Codelco Norte Division was responsible for almost all CODELCO’s production of molybdenum in 2004; production of molybdenum by the Codelco Norte Division was 24,271 t in 2004 compared with 16,432 t in 2003 (Corporación Nacional del Cobre, 2005a, p. 37-38). Increased molybdenum production from copper ore was expected in the Codelco Norte Division owing to higher than expected production of copper and continued high prices for copper and molybdenum in 2005. Total production of molybdenum across the four mining divisions in 2005 was expected to reach about 33,400 t (Comisión Chilena del Cobre, 2005b, p. 19-20).
Minera Sur produced about 1,706 t of molybdenum in concentrate in 2004 compared to 1,503 t in 2003. Production was not expected to increase much more at Minera Sur in the near future, however, because the mine was producing at capacity in 2004 and higher grades of molybdenum were not expected. Minera Los Pelambres S.A. produced less molybdenum in concentrate (7,853 t) in 2004 compared with 8,688 t in 2003, despite an increase in the annual average price of molybdenum to about $16.20 per pound compared with $5.30. This was owing to lower molybdenum grades in the ore mined at Los Pelambres and to lower recovery rates of the metal during ore processing (Antofagasta plc, 2005, p. 8, 22, 44-45).
Even if the price of molybdenum were to decrease slightly in coming years, it was expected to remain well above historical norms of $3 to $4 per pound (Antofagasta plc, 2005, p. 11). As a result of such expectations, the owners of the Collahuasi Mine approved construction of a new molybdenum flotation plant at nearby Punta Patache to begin in the first quarter of 2005; production was expected to be about 4,000 t during 2006 (Anglo American plc, 2005, p. 9). The plant’s average production capacity will be 12,000 t/yr of molybdenum in concentrate. This project was expected to deliver economic rates of return if it produces at this capacity even if molybdenum prices decrease to somewhere between 2003 and 2004 levels. Because mining operations at the Collahuasi Mine have now shifted to the Rosario deposit, production at the plant was expected to reach this design capacity over time as a result of the increasing grades of molybdenum in the ore at greater depth (Falconbridge Limited, 2005, p. 8, 18, 33). In 2004, Noranda Chile began converting existing roasters at its Altonorte smelter to facilitate the treatment of molybdenum concentrates and to produce molybdenum trioxide (molybdite). The total production capacity of this project was estimated to be about 5,000 t/yr of molybdenum metal contained in the molybdite (Noranda Inc., 2005, p. 7, 12, 23).
Zinc.—Sociedad Contractual Minera El Toqui Ltda. (a wholly owned subsidiary of Breakwater Resources Ltd.) was responsible for almost all zinc production in Chile in 2004 (Servicio Nacional de Geología y Minería, 2005, p. 67). El Toqui operated the Doña Rosa Mine, which is an underground gold and zinc mine located in Region XI, and a new concentrating plant. El Toqui produced 27,190 t of zinc in 2004 compared with 32,848 t in 2003. Mine production of
gold, however, was about 867 kg in 2004 compared with only about 79 kg in 2003. In July 2003, the new crushing plant installation was completed; corresponding expansions in the grinding, dewatering, and tails handling circuits were also completed by July. This mill expansion and increased access to the Aserradero deposit, which extends from the existing Doña Rosa Mine, was primarily responsible for the increase in gold production in 2004. The Aserradero deposit contributed 16% of the mill feed for El Toqui. Further exploration and increasing production of zinc and gold were expected in 2005 because zinc prices were expected to remain high enough to justify fuller utilization of the new production capacity at El Toqui. El Toqui also produced 7,212 kg of silver in 2004 compared with 7,020 kg in 2003 (Breakwater Resources Ltd., 2005, p. 11, 23-28).
Industrial Minerals
Cement.—Cemento Melón S.A. (82% owned by the LaFarge Group) produced about 1.4 Mt of cement in 2004, which was an increase of about 5.7% compared with that of 2003 but was below the 1.5-Mt/yr capacity of the company’s plant in La Calera. Melón’s 2004 level of production accounted for about 37% of the total cement produced in Chile, which was the leading share of domestic production. At the end of 2004, the company made plans to submit an EIS for a second grinding plant in Puerto Montt, which was expected to produce 300,000 t/yr of cement beginning in 2007 if the EIS is approved (Building Bulletin, 2005).
The second ranked producer of cement in Chile, Cementos Bío Bío S.A., produced about 309,000 t of cement in 2004 compared with 306,000 t in 2003 at its main cement plant in Talcahuano. Industria Nacional de Cemento S.A. (a wholly owned subsidiary of Bío) produced 773,000 t of cement in 2004 compared with 723,000 t in 2003 across all the company’s plants in the cities of Antofagasta, Copiapo, and Curico (Cementos Bío Bío S.A., 2005, p. 16).
Iodine, Lithium, and Nitrates.—In 2004, Ajay-SQM Chile S.A. (a 51% owned subsidiary of SQM) was partially responsible for SQM’s final production of iodine and its derivatives at a chemical plant in Santiago, Chile. SQM Químicos S.A. (a wholly owned subsidiary of SQM) was actually responsible for extracting iodine from the same caliche ore that another 100% owned subsidiary of SQM (SQM Nitratos S.A.) used to produce nitrates and specialty fertilizers. In 2004, SQM held the mining and exploration rights on more than 2.5 million hectares of caliche mineral deposits near the city of Antofagasta; these deposits were estimated to account for about 75% of the world’s economic deposits of caliche ore. Consequently, SQM was the world’s leading producer of iodine in 2004 and accounted for about 29% of the world’s iodine production. SQM produced about 7,700 t of iodine and iodine derivatives in 2004 compared with about 6,600 t in 2003. In response to growing global demand, especially from the pharmaceutical and disinfectant industries in China, SQM expanded its iodine production capacity in 2004 through upgrading existing facilities and expanding certain bottlenecks in its iodine production process. The company also began construction to expand its production facilities in 2004 and

CHILE—2004 7.11
expected to expand iodine production capacity 30% by 2006 (Sociedad Química y Minera, 2005, p. 12, 23, 36).
SQM Salar S.A. (a wholly owned subsidiary of SQM) was mostly in charge of lithium carbonate production at its plant located in the Salar del Carmen, which is located near the city of Antofagasta, but SQM Potasio S.A. was more in charge of the actual mining and extraction of lithium chloride as a byproduct of the potassium chloride that SQM mined from the brines of the Salar de Atacama. In 2004, SQM produced about 32,400 t of lithium carbonate and lithium derivatives compared with 27,400 t in 2003. The company’s production of lithium carbonate in 2004 accounted for about 41% of production in the world. SQM’s recent increases in production of lithium carbonate had been primarily in response to the increased use of lithium in rechargeable batteries and the increased demand for lithium in China. Expectations of continuing increases in demand encouraged SQM to begin construction of a new lithium hydroxide plant adjacent to the lithium carbonate plant near Antofagasta in 2004; production of lithium was expected to begin during the second quarter of 2005 at the new plant (Sociedad Química y Minera, 2005, p. 13, 27-29, 36).
SQM considered itself basically self-sufficient in terms of the company’s ownership of potassium resources to create fertilizers that contain this primary ingredient in its specialty fertilizers, which includes potassium nitrate. SQM’s combined production of sodium nitrate, potassium nitrate, and sodium-potassium nitrate for its specialty fertilizer business reached 766,300 t in 2004 compared with 759,000 t in 2003. SQM also produced industrial grades of sodium nitrate and potassium nitrate, but the company’s production of industrial nitrates in 2004 decreased to 183,300 t compared with 193,200 t in 2003 in spite of an increase of about 7% in global demand for these products, mostly from the pulp and paper industries and the detergent industries. The decreased production was a result of a company policy to allocate more production of nitrates to the production of the SQM’s specialty fertilizers, which were even more lucrative in 2004 (Sociedad Química y Minera, 2005, p. 20, 35, 37).
On December 23, 2004, SQM and its subsidiary SQM Nitratos signed a contract to acquire PCS Yumbes S.C.M. By 2007, SQM expected to increase its capacity to produce iodine and nitrates by 30% at its existing facilities and its efficiency in mining mineral-bearing caliche ore and brines by replacing its María Elena Mine with another mine that will be located 10 km away. SQM expected to increase its production of iodine, specialty plant nutrients, and lithium through 2010 based upon these recent and planned developments together with the company’s new lithium plant (Sociedad Química y Minera, 2005, p. 12, 41, 37).
Through 2004, Potash Corporation of Saskatchewan Inc. was the owner of PCS Yumbes. Potash Corporation also owned 37.5% of SQM’s series A shares and elected two out of eight of SQM’s directors for the fiscal year. During the year, SQM supplied PCS Yumbes with potassium chloride, which is a raw material used in the production of potassium nitrate. PCS Yumbes sold about 130,000 t of potassium nitrate back to SQM. This total amount of nitrates sold by PCS Yumbes to SQM in 2004 was slightly greater than the approximately 125,000 t sold
back in 2003 (Sociedad Química y Minera, 2004, p. 36, 39; 2005, p. 35).
Mineral Fuels
Coal.—In 2004, Coal was produced in only two remaining mines, one owned by ENACAR and the other owned by La Compañía Carbonífera San Pedro de Catamutún (Servicio Nacional de Geología y Minería, 2005, p. 110-111). These two mines are located in the Lota/Coronel area and in Tierra del Fuego, respectively. Total reserves of coal in Chile were estimated to be about 1.18 Gt. The coal was of low quality, and production costs were high. Coal production declined greatly during the past decade, and the country’s largest coal mine was closed in 1997. In 2004, Chile imported most of its coal for consumption and mostly for electricity generation from, in order of quantity imported, Australia, Indonesia, and Colombia (U.S. Energy Information Administration, 2005§).
Natural Gas.—In 2004, the production and importation of natural gas in Chile was the responsibility of ENAP. Annual domestic production of natural gas decreased by about 3.4% in 2004 compared with that of 2003 (Servicio Nacional de Geología y Minería, 2005, p. 112). Historically, a power shortage in the late 1990s, which resulted from a severe drought that greatly reduced hydroelectric power generation, led Chile’s National Energy Commission (CNE) to call for the increased use of natural gas in Chile’s energy mix. Many industries had access to natural gas by 2001, and increasing numbers of residential users in the larger cities were connected to the gas transmission system by the end of 2004. Since 1997, seven natural gas pipelines have been completed and were transporting natural gas from Argentina in 2004. These developments have resulted in Chile being highly dependent on natural gas imports from Argentina. In 2004, the energy crisis in Argentina caused exports to Chile to fluctuate between 20% and 50% below the volumes contractually agreed upon between the two countries. In 2004, the reduction in natural gas imports caused shutdowns at powerplants and methanol plants. This forced Chileans to switch to costlier fuels, such as petroleum products imported from other countries, which included the United States (U.S. Energy Information Administration, 2005§).
Petroleum.—Chile’s own production of petroleum decreased by about 2% in 2004 compared with that of 2003 (Servicio Nacional de Geología y Minería, 2005, p. 112). In 2004, ENAP was also the only producer of petroleum in Chile; operations were concentrated in the Magallanes Basin in Region XII. In 2004, Chilean crude oil reserves were estimated to be about 150 million barrels. Chile’s crude oil production declined by about 74% from 1982 to 2002, and consumption increased by about 135%. As a result, Chile has steadily increased imports of oil; the country’s main suppliers, in order of volume exported to Chile in 2004, were Argentina, Brazil, Angola, and Nigeria (U.S. Energy Information Administration, 2005§).
Outlook
Some analysts expect the value of production from Chile’s mining sector to grow by about 8% to 10% each year through

7.12 U.S. GEOLOGICAL SURVEY MINERALS YEARBOOK—2004
2010. This assumes continuing higher prices for most mineral commodities, especially copper. These higher prices have already started to have an effect on the quantities that the mineral industry of Chile is expected to produce, namely through increasing expectation for investment, especially FDI (U.S. Commercial Service, 2005, p. 3). The likelihood of a new mining royalty in 2006 on the expected profits for many of the same mineral development projects that are expected to generate this growth in the mining sector will certainly deter some of these investments. The investments that are most likely to be affected are the ones with longer term production potential because most investment during a period of high prices is directed toward projects that can be developed quickly enough to take advantage of the short-term situation with prices. Thus, projections of such a high growth rate in the mine production of the mineral industry of Chile beyond 2007 should be tempered somewhat. As long as Chile retains its considerable global advantages in raw mineral wealth, however, royalty payments of from 4% to 5% for only the largest producers should not deter investment overly much, even for the longer term projects. In 2004, the President of China also signed letters of intent to increase investment in the mineral industry of Chile. This increased competition for Chile’s mineral resources is going to keep many multinational mineral companies interested in maintaining or expanding their claims to those resources for the foreseeable future.
In 2004, Chile’s own economic growth and development was still dependent on exports of raw materials and processed natural resources (principally copper, fresh fruit, and forestry and fisheries products) (U.S. Commercial Service, 2005, p. 45). The exports of the mineral industry of Chile will continue to be responsible for a large share of the revenues that drive fluctuations in Chile’s GDP together with FDI in the mining sector. This share could slowly decrease as Chile’s network of FTAs expands and global market access for a wider variety of Chilean products, which includes some that have not even yet been developed, improves. The Government of Chile expects the product mix of Chilean exports to expand through these FTAs, which include an imminent agreement with China; this will lower the Chilean economy’s dependency on copper exports, especially if the Government fulfills its promise to reinvest expected revenues from a mining tax in nonmining sectors of the economy.
References Cited
Anglo American plc, 2005, Annual report 2004: London, United Kingdom, Anglo American plc, February 22, 124 p.
Antofagasta plc, 2005, Annual report and financial statements 2004: London, United Kingdom, Antofagasta plc, May 3, 112 p.
Banco Central de Chile, 2005a, Cuentas nacionales de Chile—1996-2004: Santiago, Chile, Banco Central de Chile, June, 277 p.
Banco Central de Chile, 2005b, Indicadores de comercio exterior—Cuarto trimestre de 2004: Santiago, Chile, Banco Central de Chile, February, 277 p.
Banco Central de Chile, 2005c, Indicadores de comercio exterior—Primer trimestre de 2005: Santiago, Chile, Banco Central de Chile, May, 279 p.
Bema Gold Corporation, 2005, Annual report 2004: Vancouver, British Columbia, Canada, Bema Gold Corporation, May 2, 61 p.
BHP Billiton Plc, 2003, Annual report 2003: London, United Kingdom, BHP Billiton Plc, September 9, 212 p.
BHP Billiton Plc, 2004, Annual report 2004: London, United Kingdom, BHP Billiton Plc, September 1, 204 p.
BHP Billiton Plc, 2005, Annual report 2005: London, United Kingdom, BHP Billiton Plc, September 8, 216 p.
Bonel, K.A., and Chapman, G.R., 2005, World metals & minerals review 2005: London, United Kingdom, Metal Bulletin plc, 306 p.
Breakwater Resources Ltd., 2005, Annual information form—Year ended December 31, 2004: Toronto, Ontario, Canada, Breakwater Resources Ltd., March, 31, 56 p.
Building Bulletin, 2005, Grinding proposal: Building Bulletin, Issue 84, International Cement Review, April, p. 3.
Cementos Bío Bío S.A., 2005, Memoria anual 2004: Talcahuano and Santiago, Chile, Cementos Bío Bío S.A., March 4, 187 p.
Central Bank of Chile, 2005, 2004 annual report: Santiago, Chile, Central Bank of Chile, April 25, 93 p.
Comisión Chilena del Cobre, 2005a, Estadísticas del cobre y otros minerales 1985-2004: Santiago, Chile, Comisión Chilena del Cobre, June, 145 p.
Comisión Chilena del Cobre, 2005b, Mercado nacional e internacional del molibdeno: Santiago, Chile, Comisión Chilena del Cobre, August, 22 p.
Corporación Nacional del Cobre, 2005a, Annual report 2004: Santiago, Chile, Corporación Nacional del Cobre, February 4, 181 p.
Corporación Nacional del Cobre, 2005b, Sustainability report 2004: Santiago, Chile, Corporación Nacional del Cobre, 48 p.
Coeur d’Alene Mines Corporation, 2005, 2004 annual report: Coeur d’Alene, Idaho, Coeur d’Alene Mines Corporation, March 22, 132 p.
Economist, The, 2004, Mining and tax—A right royal row: The Economist, v. 372, no. 8382, July 3, p. 34.
Egan, L., and Webber, J., 2004, Chile’s royalty to test future development: Australia’s Paydirt, August, p. 43.
Falconbridge Limited, 2005, 2004 Annual report: Toronto, Ontario, Canada, Falconbridge Limited, February 24, 98 p.
Industrial Minerals, 2005, Chile’s 2004 mineral production: Industrial Minerals Information, Metal Bulletin plc., September, p. 15.
Jordan, Pav, 2005, Barrick to file environmental plan for Chile mine: London, United Kingdom, Reuters press release, August 23, 2 p.
McMahon, F., and Lymer, W., 2005, The Fraser Institute annual survey of mining companies 2004/2005: Vancouver, British Columbia, Canada, January 3, 82 p.
Meridian Gold Inc., 2005, 2004 annual report: Reno, Nevada, Meridian Gold Inc., February 22, 46 p.
Minera Escondida Limitada, 2005, Memoria anual 2004: Antofagasta and Santiago, Chile, Minera Escondida Limitada, February 14, 75 p.
Mining Journal, 2004, Chilean royalty levy: Mining Journal, November 12, p. 3.Noranda Inc., 2005, Annual report 2004: Toronto, Ontario, Canada, Noranda
Inc., February 3, 96 p.Petroleum Economist, 2004, News in brief, Chile: Petroleum Economist, v. 71,
no. 12, December, p. 44.Phelps Dodge Corporation, 2005, 2004 annual report: Phoenix, Arizona, Phelps
Dodge Corporation, March 7, 152 p.Placer Dome Inc., 2005, 2004 annual report: Vancouver, British Columbia,
Canada, Placer Dome Inc., February 24, 93 p.Ratliff, William, 2005, China goes south of the border, Chinese President Hu
Jintao has spent more time in Latin America than George W. Bush. What are the Chinese up to?: The Hoover Digest 2005, no. 1, winter issue, 8 p.
Regalito Copper Corp., 2005, News summary: Vancouver, British Columbia, Canada, Press Release, Regalito Copper Corp., August 10, 4 p.
Servicio Nacional de Geología y Minería, 2005, Anuario de la minería de Chile, 2004: Santiago, Chile, Servicio Nacional de Geología y Minería, 186 p.
Sociedad Química y Minera S.A., 2004, Annual report 2003: Santiago, Chile, Sociedad Química y Minera S.A., February 17, 128 p.
Sociedad Química y Minera S.A., 2005, Annual report 2004: Santiago, Chile, Sociedad Química y Minera S.A., March 4, 126 p.
Tarbutt, S.H.C., 2005, Chile, in Mining annual review 2004: London, United Kingdom, Mining Communications Ltd., CD-ROM.
U.S. Commercial Service, 2004, Country commercial guide, fiscal year 2004: Santiago, Chile, July 19, 67 p.
U.S. Commercial Service, 2005, Doing business in Chile, the 2005 country commercial Guide for U.S. companies: Santiago, Chile, February 7, 82 p.
Wilburn, D.R., 2005, Exploration overview: Mining Engineering v. 57, no. 5, May, p. 37-48.

CHILE—2004 7.13
Internet References Cited
Corporación Nacional del Cobre, 2005, Ventanas Division, The Corporation Divisions, accessed October 4, 2005, at URL http://www.codelco.cl/english/la_corporacion/division_ventanas.asp.
Gonnella, Peter, 2004 (June 1), Latinos vie with Aussie for China’s affections, Mineweb, accessed June 2, 2004, at URL http://www.mineweb.net/sections/base_metals/326461.htm.
International Monetary Fund, 2005 (April), Chile, World Economic Outlook Database, accessed June 27, 2005, via URL http://www.imf.org/external/pubs/ft/weo/2005/01/data/dbginim.cfm.
Jin, Zhang, 2004 (August 27), China-Chile FTA talks switched to fast track, China Daily, accessed March 29, 2005, at URL http://www.bilaterals.org/article.php3?id_article=527.
Porteous, Clinton, 2005 (July 15), Chile defends skewed royalty, The Sydney Morning Herald, accessed August 31, 2005, at URL http://www.smh.com.au/news/business/chile-defends-skewed-royalty/2005/07/14/1120934363260.html.
U.S. Energy Information Administration, 2005 (September), Chile, Country Analysis Brief, accessed September 13, 2005, at URL http://www.eia.doe.gov/emeu/cabs/chile.html.
Major Sources of Information
Comisión Chilena del Cobre (COCHILCO)Agustinas 1161 Piso 4Casilla 9493Santiago, ChileTelephone: 56-2-6726219Fax: 56-2-6723584Internet: http://www.cochilco.cl
Instituto Nacional de Estadísticas (INE) Av. Presidente Bulnes 418Santiago, ChileTelephone: 56-2-3667777Fax: 56-2-6712169
Servicio Nacional de Geología y Minería (SERNAGEOMIN)Avda. Santa María 0104Casilla 10465Santiago, ChileTelephone: 56-2-6375050Fax: 56-2-6372026
Major Publications
Comisión Chilena del Cobre. Estadísticas del Cobre y otros Minerales, 1985-2004.
Corporación Nacional del Cobre de Chile. Annual Report, 2004.Servicio Nacional de Geología y Minería. Anuario de la Minería
de Chile, 2004

7.14 U.S. GEOLOGICAL SURVEY MINERALS YEARBOOK—2004
TABLE 1
CHILE: PRODUCTION OF MINERAL COMMODITIES1
(Metric tons unless otherwise specified)
Commodity2 2000 2001 2002 2003 2004METALS
Arsenic trioxidee 10,712 r, 3, 4 11,500 r 11,400 r 11,600 r 11,600Copper:
Mine output, Cu content5 thousand metric tons 4,602 4,739 4,581 4,904 5,413Metal:
Smelter, primary do. 1,460 1,503 1,439 1,542 1,564 p
Refined:Electrowon do. 1,372 r 1,538 1,602 1,653 1,636 p
Primary, other do. 1,297 r 1,344 1,248 1,249 1,259 p
Total do. 2,669 2,882 2,850 2,902 2,895 p
Gold, mine output, Au content kilograms 54,143 42,673 38,688 38,954 39,986Iron and steel:
Ore and concentrate:Gross weight thousand metric tons 8,729 8,834 7,269 8,011 8,003Fe content do. 5,398 r 5,437 4,398 4,865 r 4,850
Metal:Pig iron do. 1,024 897 934 988 1,137Ferroalloys: Ferromanganese 4,011 2,213 -- -- --
Ferromolybdenume 1,420 r 1,740 r 3,160 r 4,070 r 5,760 Ferrosilicomanganese 1,800 -- -- -- --
Total 7,231 r 3,953 r 3,160 r 4,070 r 5,760Steel, crude thousand metric tons 1,352 1,247 1,280 1,377 1,579 p
Semimanufactures do. 1,300 e 1,067 1,150 1,197 1,370 e
Lead, mine output, Pb content 785 1,193 2,895 1,697 2,286Manganese ore and concentrate:
Gross weight 41,716 31,320 12,195 19,641 25,801Mn content 12,474 r 9,129 r 3,190 5,824 r 7,188
Molybdenum:Mine output, Mo content 33,187 r 33,492 29,466 r 33,375 r 41,883Oxides 9,724 8,813 7,716 5,398 8,339
Rhenium, mine output, t Re conten e, 6 kilograms 17,000 r 17,000 r 15,400 4 17,000 r 22,000
Seleniume do. 47,000 r 84,000 r 80,000 r 83,000 r 82,000Silver:
Mine output, Ag content 1,242 1,349 1,210 1,313 1,360Metal, Ag content -- 584 796 424 129
Zinc, mine output, Zn content 31,403 32,762 36,161 33,051 27,635INDUSTRIAL MINERALS
Barite 1,026 584 384 229 31Borates, crude, natural (ulexite) 337,966 327,743 431,293 400,603 594,191Cement, hydraulic thousand metric tons 3,377 3,513 3,461 r 3,622 r 3,798Clays:
Bentonite 1,314 1,695 632 748 101Kaolin 6,445 5,300 6,164 11,500 51,769Other, unspecified 23,387 28,330 35,091 51,622 50,250
Diatomite 13,384 22,705 30,274 25,594 30,015Dolomite 12,506 29,940 31,439 17,308 27,436Feldspar 2,311 2,867 3,069 6,690 4,838Gypsum:
Crude thousand metric tons 376 517 610 662 630Calcined do. 176 175 229 190 304
Iodine, elemental 10,474 11,355 11,648 13,916 r 14,931
Lime, hydraulice thousand metric tons 1,000 1,000 1,000 1,000 1,000Lithium carbonate 35,869 31,320 35,242 41,667 43,971Nitrogen, natural, crude nitrates thousand metric tons 988 1,072 1,174 1,134 1,402See footnotes at end of table.

CHILE—2004 7.15
TABLE 1--Continued
CHILE: PRODUCTION OF MINERAL COMMODITIES1
(Metric tons unless otherwise specified)
Commodity2 2000 2001 2002 2003 2004INDUSTRIAL MINERALS--Continued
Phosphate rock (apatite): Gross weight 12,474 11,511 11,066 9,389 11,695 P2O5 content 3,889 3,589 3,411 2,894 3,604Phosphorite 6,050 7,466 8,475 11,911 9,770
Potash, K2O equivalente 330,000 390,000 350,000 370,000 370,000Potassium chloride, KCl thousand metric tons 642 r 748 r 771 r 764 r 743Pozzolan do. 830 785 826 825 750Pumice -- -- 354 417,023 785,033Quartz, common thousand metric tons 576 538 879 765 1,085Salt, all types do. 5,083 5,989 3,503 6,213 4,939
Sand and gravel, silicae do. 300 300 300 300 300
Sodium compounds, n.e.s., sulfate7 56,501 67,760 70,776 44,011 30,622Stone: Limestone, calcium carbonate thousand metric tons 5,395 5,563 5,888 5,901 6,653 Marble 812 782 633 828 845Sulfur, byproduct, metallurgy thousand metric tons 1,100 1,160 1,275 1,430 r 1,510Talc 2,421 4,177 3,537 4,374 2,993
MINERAL FUELS AND RELATED MATERIALS
Coal, bituminous and lignite:Run of mine thousand metric tons 509 578 452 359 250Marketable do. 503 568 451 347 238
Coke, coke oven do. 500 e 500 440 400 e 400 e
Methanol do. 2,912 2,784 2,932 2,704 2,692Natural gas, marketable million cubic meters 2,702 2,684 2,543 2,181 2,106
Natural gas liquids:e
Natural gasoline thousand 42-gallon barrels 1,000 1,000 1,000 1,000 1,000Liquefied natural gas do. 2,500 2,500 2,500 2,500 2,500
Total do. 3,500 3,500 3,500 3,500 3,500Petroleum:
Crude and condensate8 do. 2,050 2,425 2,116 1,319 1,292
Refinery products:9
Liquefied petroleum gas do. 7,040 7,768 7,914 7,534 7,793Gasoline:
Aviation do. 116 5,381 68 97 52Motor do. 19,008 17,808 18,396 19,712 20,809
Jet fuel do. 1,508 5,852 5,054 4,641 5,416Kerosene do. 4,409 1,281 1,185 681 626Distillate fuel oil do. 28,776 29,295 29,345 30,297 27,658Residual fuel oil do. 10,457 10,207 9,210 12,332 13,581Unspecified do. 6,368 1,898 2,124 2,119 2,054
Total do. 77,682 79,490 73,296 77,413 77,989eEstimated; estimated data are rounded to no more than three significant digits; may not add to totals shown. pPreliminary. rRevised. -- Zero.1Table includes data available through January 2006.2In addition to the commodities listed, pyrite is also produced, but available information is inadequate to make reliable estimates of output levels.3Exports (Bonel, K.A., and Chapman, G.R., 2005, World metals & minerals review 2005: London, United Kingdom, Metal Bulletin plc, p. 19).4Reported figure.5Figures are the nonduplicate copper content of ore concentrates, blister, and refined copper measured at the last stage of commercial production, as reported by Comisión Chilena del Cobre (COCHILCO). Mine production reported by Servicio Nacional de Geología y Minería(SERNAGEOMIN) for the same years was only slightly higher (0.01% to 0.95%).6Rhenium content of mine output in Chile (whether processed in Chile or elsewhere) was estimated based on information from COCHILCO; the reported production figure for 2002 may include some rhenium content from Mexico processed at Molibdenos y Metales S.A. in Chile.7Includes production of natural sodium sulfate and anhydrous sodium sulfate, coproducts of the nitrate industry (salitre).8Includes natural gasoline.9Includes production from both imported and domestic petroleum, as reported by SERNAGEOMIN.

7.16 U.S. GEOLOGICAL SURVEY MINERALS YEARBOOK—2004
TABLE 2CHILE: STRUCTURE OF THE MINERAL INDUSTRY IN 2004
(Metric tons unless otherwise specified)
Major operating companiesCommodity and major equity owners Location of main facilities Annual capacity
Cement Cemento Melón S.A. (LaFarge Group, 82%; La Calera Plant, Region V 1,500,000.other private, 18%)
Do. Cementos Bío Bío S.A. (private, 100%) Talcahuano Plant, Region VIII 310,000.e
Do. Industria Nacional de Cemento S.A. Plants in Antofagasta City, Region II; Copiapo 775,000.e
(Cementos Bío Bío S.A., 100%) City, Region III; Curico City, Region VII
Coal:Bituminous Empresa Nacional del Carbón S.A. (ENACAR) Trongol Mine near city of Curanilahue 140,000.Subbituminous La Compañía Carbonífera San Pedro de Catamutún Pecket Mine, Region XII (open pit) 100,000.
Copper Corporación Nacional del Cobre de Chile Mining divisions and operating mines 1,740,000. (CODELCO) (Government, 100%) Of which:
Andina Division, including Rio Blanco 240,000.and Sur Sur Mines
CODELCO Norte Division, including 985,000.Chuquicamata, Mina Sur, and Radomiro Tomic Mines
El Teniente Division and Mine 440,000.Salvador Division, including Inca, 75,000.
Campamento Antiguo, and Damiana Norte Mines
Do. do. Smelters 960,000.Of which:
Chuquicamata (CODELCO Norte) 460,000.Caletones (El Teniente) 360,000.Potrerillos (Salvador) 140,000.
Do. do. Refineries 815,000.Of which:
Chuquicamata (oxide) 600,000.Chuquicamata (sulfide) 85,000.Potrerillos 130,000.
Do. do. SX-EW plants1 217,000.Of which:
Chuquicamata (oxide) 130,000.El Teniente 2,000.Potrerillos (oxide and sulfide) 85,000.
Do. Sociedad Contractual Minera El Abra [Phelps Dodge El Abra Mine and SX-EW1 plant, near Calama 250,000.Corporation, 51%, and Corporación Nacional del Cobre de Chile (CODELCO), 49%]
Do. Compañía Minera Doña Inés de Collahuasi SCM Open pit mine, concentrator plant, SX-EW1 515,000.e
(Anglo American plc, 44%; Falconbridge Limited, plant, at Ujina, Region I44%; Companies led by Mitsui & Co. Ltd., 12%)
Do. Minera Sur Andes Ltda. (prior to 2003, named Los Bronces Mine and Tortolas SX-EW1 plant 240,000.Compañía Minera Disputada de Las Condes S.A.)(Anglo American plc, 100%)
Do. do. El Soldado Mine 70,000.Do. do. Chagres smelter (blister and anodes) 162,000.Do. Empresa Minera de Mantos Blancos S.A. (Anglo Mantos Blancos open pit mine, SX-EW1 plant 95,000.
American plc, 99.9%, and other private, 0.1%)Do. do. Mantoverde open pit mine, SX-EW1 plant 60,000.Do. Minera Los Pelambres S.A. (Antofagasta plc, 60%, Los Pelambres open pit mine, 200 kilometers 360,000.
and Japanese consortia, 40%) northeast of SantiagoDo. Minera El Tesoro S.A. (Antofagasta plc, 61%, and El Tesoro open pit mine and SX-EW1 plant, 100,000.
Equatorial Mining Ltd., 39% ) near Chuquicamata and CalamaDo. Minera Michilla S.A. (Antofagasta plc, 74.2%, and Michilla Mine and SX-EW1/sulfide leaching 55,000.
other private Chilean investor, 25.8%) plant, 1,500 kilometers north of SantiagoSee footnotes at end of table.

CHILE—2004 7.17
TABLE 2--ContinuedCHILE: STRUCTURE OF THE MINERAL INDUSTRY IN 2004
(Metric tons unless otherwise specified)
Major operating companiesCommodity and major equity owners Location of main facilities Annual capacity
Copper--Continued Compañía Minera Quebrada Blanca (Aur Resources Quebrada Blanca open pit mine, Region I 80,000.Inc., 76.5%, and Inversiones Mineras S.A., 13.5%)
Do. Compañía Minera Carmen de Andacollo (Aur Andacollo Mine, Region IV 22,000.Resources Inc., 63%; Compañía Minera del Pacífico, 27%; Empresa Nacional de Minería, 10%)
Do. Compañía Minera Zaldívar (Placer Dome Inc., 100%) Zaldívar open pit heap-leach mine, Region II 150,000.Do. Compañía Minera Falconbridge Lomas Bayas Lomas Bayas Mine and SX-EW1 plant, 65,000.
(Falconbridge Limited, 100%) Region IIDo. Noranda Chile S.A., Fundición Altonorte Altonorte smelter, La Negra, Region II 290,000.
(Noranda Inc., 100%)Do. Compañía Minera Cerro Colorado Cerro Colorado Mine and SX-EW1 plant 125,000.
(BHP Billiton Plc, 100%)Do. Alliance Copper Ltd. (BHP Billiton Plc, 50%, and Bioleaching plant to process copper from 20,000.
Corporación Nacional del Cobre de Chile, 50%) CODELCO Norte concentrates in Chuquicamata
Copper, gold, kilograms Minera Escondida Ltd. (BHP Billiton Plc, 57.5%; Escondida open pit mine, two concentrator 1,250,000 copper;silver Rio Tinto plc, 30%; Japan Escondida Corporation, plants and an oxide plant, for cathode 5,600 gold;
10%; International Finance Corp., 2.5%) production (SX-EW1) 135,000 silver.Do. Empresa Nacional de Minería (Government, 100%) Matta, Ovalle, Taltal, and Vallenar plants 22,000 copper.Do. kilograms do. Las Ventanas refinery 335,000 copper;
6,300 gold;190,000 silver.
Do. do. Las Ventanas smelter (anodes and blister) 400,000 copper.Do. do. Paipote smelter (anodes) 300,000 copper.Do. kilograms Cía. Contractual Minera Candelaria (Phelps Dodge Candelaria open pit mine, underground mine, 232,000 copper;
Corporation, 80%, and SMMA Candelaria, Inc., and concentration plant; Ojos del Salado 2,500 gold;
20%) Mine and concentration plant, near Copiapo 30,000 silver.
Gold, silver do. Cerro Bayo Ltda. (Coeur d'Alene Mines Corp., Cerro Bayo Mine and concentration plant, 1,870 gold;e
100%) Laguna Verde, Region XI 154,000 silver.e
Do. do. Corporación Nacional del Cobre de Chile Andina, CODELCO Norte, El Teniente, and 1,600 gold;(Government, 100%) (gold and silver Salvador Divisions 300,000 silver.byproducts from copper)
Do. do. Compañía Minera Mantos de Oro (Placer Dome Inc., La Coipa open pit mines, 140 kilometers north of 5,700 gold;50%, and Kinross Gold Corporation, 50%) Copiapo, Region III 230,000 silver.
Do. do. Compañía Minera Maricunga (Kinross Gold El Refugio open pit, heap-leach mine, 100 4,300 gold.Corporation, 50%, and Bema Gold Corporation, kilometers east of Copiapo, Region III 50%)
Iodine SQM Químicos S.A. (Sociedad Química y Minera Plant in Antofagasta, Region II 7,700.de Chile S.A., 100%)
Iron ore thousand metric tons Cía. Minera del Pacífico S.A. (subsidiary of CAP El Algarrobo Mine, Region III; El Romeral 10,500.S.A., formerly Cía de Acero del Pacífico S.A.) Mine and El Tofo Mine, Region IV
Do. do. Private, 100% El Agarrobito, El Laco, El Romeral, Los 14,000.
Colorados, and Huasco concentration plantsDo. do. Cía. Minera Huasco S.A. (Cía. Minera del Pacifico Huasco Pellet Plant, Region III 4,800.
S.A., 50%, and MC Inversiones Ltda., 50%)
Lithium carbonate SQM Salar S.A. (subsidiary of Sociedad Química Plant in Santiago, Region II 33,000.
y Minera de Chile S.A.) (private, 100%)
Manganese Manganesos Atacama S.A. (subsidiary of CAP Plant in Coquimbo, Region IV 15,000.
S.A., 98.7%, and other private, 1.3%)
Molybdenum Corporación Nacional del Cobre de Chile Andina, CODELCO Norte, El Teniente, and 32,500.
(Government, 100%) (byproduct from copper) Salvador Divisions
Do. Minera Los Pelambres S.A. (Antofagasta plc, 60%, Los Pelambres open pit mine, 200 kilometers 8,000.
and Japanese consortia, 40%) northeast of Santiago
See footnotes at end of table.

7.18 U.S. GEOLOGICAL SURVEY MINERALS YEARBOOK—2004
TABLE 2--Continued
CHILE: STRUCTURE OF THE MINERAL INDUSTRY IN 2004
(Metric tons unless otherwise specified)
Major operating companies
Commodity and major equity owners Location of main facilities Annual capacity
Natural gas million Empresa Nacional del Petróleo S.A. (subsidiary of Byproduct from 23 oilfields, including Costa 2,200.e
cubic meters Corporación de Fomento de la Producción) Auera, in the Magallanes basin, Region XII
(Government, 100%)
Petroleum thousand do. Magallanes Basin, Region XII 6,500.
42-gallon barrels
Pig Iron thousand metric tons Cía. Siderúrgica Huachipato S.A. (subsidiary of Plant in Bahía de San Vicente, 14 kilometers 1,200.
CAP S.A.) (private, 100%) northeast of Concepcion, Region VIII
Nitrates (in fertilizer) SQM Nitratos S.A. (subsidiary of Sociedad Química Maria Elena, Pampa Blanca, and Pedro de 770,000.
y Minera de Chile S.A.) (private, 100%) Valdivia Mines and a plant in Antofagasta,
Region II
Do. Cosayach Nitratos S.A. (Errázuriz Group, 100%) Plant in Maria Elena, Iquique, Region I 200,000.e
Do. PCS Yumbes SCM (subsidiary of Potash Corporation Plant in Santiago, Region II 100,000.e
of Saskatchewan) (private, 100%)
Rhenium kilograms Molibdenos y Metales S.A. (private, 100%) Plant in Nos, 30 kilometers south of Santiago 18,100.e
Steel thousand metric tons Cía. Siderúrgica Huachipato S.A. (subsidiary of Primary plant in Talcahuano and plant in 1,100.
CAP S.A.) (private, 100%) Rengo, Region VIII
Do. Gerdau AZA S.A. of Brazil Rolling mills and steel plants in Renca and Colina 375,000.
Zinc, gold kilograms Sociedad Contractual Minera El Toqui Ltda. Doña Rosa zinc mine and a concentrating plant, 870 gold;
do. (Breakwater Resources Ltd., 100%) 120 kilometers north of Coyhaique, 9,500 silver;
Region XI 35,000 zinc.eEstimated; estimated data are rounded to no more than three significant digits. NA Not available. 1Solvent-extraction/electrowinning.

CHILE—2004 7.19
TABLE 3CHILE: EXPORTS OF SELECTED MINERAL COMMODITIES IN 2003
(Value, in dollars, unless otherwise specified)
DestinationsCountry and commodity Total United States Other (principal)
METALS
Aluminum:Oxides and hydroxides $19,146 -- Colombia $18,960; unspecified $186.Ash and residue that contain aluminum $10,003 -- All to Belgium.Metal, including alloys:
Scrap value, thousands $14,440 $573 China $4,470; Brazil $3,432; United Kingdom $1,655.Unwrought $404 -- Unspecified $404.Semimanufactures:
Powders and flakes $29,600 -- All to Peru.Rods, bars, profiles $902,545 -- Bolivia $724,784; Brazil $70,204; Mexico $46,772.Wire $36,769 -- Peru $34,304; Uruguay $2,465.Plates, sheets, strips $55,214 $6,596 Brazil $43,396; Peru $4,414; unspecified $808.Foil value, thousands $8,507 $140 Colombia $1,692; Costa Rica $1,160; Honduras $1,137.Tubes and pipes $160,191 -- Bolivia $142,563; Peru $8,658; Australia $6,476.Tube or pipe fittings $1,201 -- Bolivia $859; unspecified $342.
Antimony, oxides $461 -- Unspecified $461.Chromium:
Ore and concentrate $77,111 -- Mexico $70,031; Peru $7,080.Oxides and hydroxides $49,000 -- All to Argentina.
Cobalt, oxides and hydroxides $1,215 -- All to Bolivia.Copper:
Ore and concentrate value, thousands $2,408,324 $9,875 Japan $834,790; China $380,565; Republic of Korea $273,148.Matte and speiss, including cement copper $2,037,661 -- China $1,735,159; Brazil $302,492.Oxides and hydroxides $33,485 -- Spain $21,132; Argentina $12,300; unspecified $53.Sulfate $2,372,392 $74,922 Canada $1,716,124; Tunisia $196,699; Costa Rica $78,925.Metal, including alloys:
Scrap value, thousands $37,546 $28 Mexico $17,201; China $12,285; Republic of Korea 3,122.Unwrought do. $4,867,096 $364,823 China $897,225; Italy $653,398; France $491,726.Semimanufactures:
Powders and flakes $812,911 -- Peru $665,825; India $124,389; Sri Lanka $22,697.Rods, bars, profiles $6,714,049 $810,176 Argentina $2,646,943; Mexico $1,957,021; Canada $422,348.Wire value, thousands $84,792 $74 Brazil $27,719; Venezuela $19,122; Costa Rica $18,569.Plates, sheets, strips do. $25,636 $8,657 Germany $6,855; Austria $3,704; Argentina $1,382.Foil $1,084,571 $855,241 Peru $136,602; Argentina $78,880; Paraguay $8,291.Tubes and pipes value, thousands $14,044 $4,449 Argentina $2,282; Italy $2,046; Colombia $1,961.Tube or pipe fittings $880,346 $245,516 Venezuela $241,492; Italy $124,904; Costa Rica $62,242.
Gold, metal, including alloys, unwrought and partlywrought value, thousands $282,344 $68,206 United Kingdom $213,430; Germany $708.
Iron and steel:Iron ore and concentrate, excluding roasted
pyrite do. $140,105 $7,121 China $37,594; Japan $33,003; Indonesia $22,382.Metal:
Scrap do. $5,696 $164 Netherlands $2,190; Peru $980; United Kingdom $946.Pig iron, cast iron, related materials $39,069 $2,500 Panama $24,393; Peru $7,199; Uruguay $4,977.Ferroalloys:
Ferromolybdenum value, thousands $34,106 $537 Netherlands $11,636; Finland $5,734; Sweden $4,325.Silicon metal $1,139 -- All to Argentina.
Steel, primary forms $552,567 -- All to Malaysia.Semimanufactures:
Flat-rolled products:Of iron or nonalloy steel:
Not clad, plated, coated value, thousands $32,549 $11,918 China $9,975; Mexico $3,793; Malaysia $2,736.Clad, plated, coated $6,099,864 $729 Bolivia $1,337,449; Mexico $1,017,676; Italy $670,191.
Of alloy steel $3,679,322 -- Peru $2,199,964; Ecuador $909,164; Bolivia $374,099.Bars, rods, angles, shapes, sections $8,055,958 $237,335 Ecuador $6,204,162; Peru $777,391; Bolivia $326,336.
See footnote at end of table.

7.20 U.S. GEOLOGICAL SURVEY MINERALS YEARBOOK—2004
TABLE 3--ContinuedCHILE: EXPORTS OF SELECTED MINERAL COMMODITIES IN 2003
(Value, in dollars, unless otherwise specified)
DestinationsCountry and commodity Total United States Other (principal)METALS--Continued
Iron and steel--Continued:Metal--Continued:
Semimanufactures--Continued:Rails and accessories $75,649 $16,000 Argentina $39,899; Brazil $12,056; Ecuador $7,537.Wire $4,690,512 $1,682,161 Argentina $1,521,839; Mexico $390,792; Colombia $335,349.Tubes, pipes, fittings $6,027,841 $1,702,297 Bolivia $1,545,531; Peru $995,673; Colombia $393,714.
Lead:Oxides $84,256 -- Argentina $54,369; Cuba $26,462; Uruguay $1,936.Metal, including alloys:
Scrap $341,318 -- India $219,832; Israel $76,425; Indonesia $45,061.Unwrought $864,046 -- Brazil $710,944; Argentina $153,102.Semimanufactures $13,806 -- Cuba $8,930; Peru $2,175; unspecified $1,658.
Lithium oxides and hydroxides $1,079 -- All to Argentina.Magnesium, metal, including alloys, unwrought $170 -- Unspecified $170.Molybdenum:
Ore and concentrate:Roasted value, thousands $234,310 $3,321 Japan $76,684; Netherlands $47,934; Brazil $27,924.Unroasted do. $68,148 $2,945 Netherlands $51,869; Mexico $8,741; Belgium $3,937.
Oxides and hydroxides do. $26,387 $2,724 Netherlands $20,186; Sweden $2,080; Japan $1,241.Nickel:
Oxides and hydroxides $14,651 -- China $10,839; Netherlands $3,812.Metal, including alloys:
Unwrought $7,353 -- Peru $4,863; Bolivia $2,490.Semimanufactures $28,241 -- Bolivia $27,800; unspecified $441.
Platinum-group metals:Waste and sweepings $48,634 $8,750 Germany $39,884.Metals, including alloys, unwrought and partly
wrought:Palladium $27,992 -- All to France.Platinum $22,057 -- All to Italy.
Selenium, elemental $301,249 -- Brazil $85,733; Colombia $64,850; China $34,656.Silver:
Ore and concentrate value, thousands $22,975 -- All to Japan.Metal, including alloys, unwrought and partly
wrought do. $92,843 $10,406 United Kingdom $60,017; Brazil $9,766; Argentina $8,060.Tin, metal, including alloys:
Unwrought $332 -- Unspecified $332.Semimanufactures $1,806 -- Argentina $968; Bolivia $702; unspecified $136.
Titanium:Oxides $18,009 -- Brazil $17,992; unspecified $17.Metal, including alloys, semimanufactures $6,928 -- Germany $4,197; Peru $2,731.
Tungsten, metal, including alloys, semimanufactures $1,200 -- Bolivia $1,166; unspecified $34.Zinc:
Ore and concentrate value, thousands $11,752 -- China $3,100; North Korea $2,915; Republic of Korea $2,771.Oxides $4,131 -- Bolivia $4,055; unspecified $76.Ash and residue that contain zinc $126,567 -- Spain $70,574; Peru $55,993.Metal, including alloys:
Scrap $21,281 -- All to India.Semimanufactures $18,297 -- Costa Rica $10,137; Brazil $8,037; unspecified $123.
Zirconium:Ore and concentrate $7,137 -- All to Peru.Metal, including alloys, unwrought, waste or
scrap, powders $6,614 -- All to Germany.Other, ash and residue value, thousands $68,695 -- Belgium $37,378; Mexico $24,822; Japan $6,331.
See footnote at end of table.

CHILE—2004 7.21
TABLE 3--ContinuedCHILE: EXPORTS OF SELECTED MINERAL COMMODITIES IN 2003
(Value, in dollars, unless otherwise specified)
DestinationsCountry and commodity Total United States Other (principal)
INDUSTRIAL MINERALS
Abrasives, n.e.s.:Natural: Corundum, emery, pumice, etc. $723 -- Colombia $649; unspecified $74.Dust and powder of precious and semiprecious
stones ex/including diamond $1,793 -- All to United Kingdom.Grinding and polishing wheels and stones $47,130 -- Peru $23,724; Italy $4,699; Ecuador $4,534.
Boron materials:Crude natural borates value, thousands $11,095 $3,258 Brazil $3,845; India $1,662; Republic of Korea $589.Oxides and acids do. $23,819 $5,575 China $5,603; Brazil $2,726; Germany $2,095.
Cement $117,328 -- Cuba $106,500; Argentina $7,375; unspecified $2,280.Clays, crude:
Bentonite $12,991 -- Bolivia $7,560; Argentina $2,056; Venezuela $1,964.Fire clay $202 -- Unspecified $202.Kaolin $127 -- Unspecified $127.
Diatomite and other infusorial earth $2,741,596 -- Brazil $845,117; Argentina $822,414; Peru $551,592.Fertilizer materials:
Crude, n.e.s. value, thousands $321 $22 Ecuador $114; Republic of Korea $63; Venezuela $47.Manufactured:
Ammonia $140,386 -- Peru $125,380; Bolivia $12,047; Argentina $2,959.Nitrogenous value, thousands $189,962 -- Peru $153,029; Bolivia $954; Guatemala $670.Potassic do. $22,791 $1,947 China $4,979; South Africa $3,480; Mexico $2,226.Unspecified and mixed do. $130,373 $18,242 Brazil $35,718; Peru $16,941; Mexico $14,168.
Graphite, natural $417 -- Unspecified $417.Gypsum and plaster $768,960 -- Ecuador $656,997; Venezuela $193,264; Costa Rica $7,252.Iodine value, thousands $142,330 $45,694 Belgium $42,067; Japan $18,271; Brazil $11,515.Lime $370,878 -- All to Peru.Magnesium compounds:
Magnesite, crude $1,000 -- Do.Oxides and hydroxides $10,018 -- Peru $9,419; Paraguay $599.
Mica:Crude, including splittings and waste $39 -- Unspecified $39.Worked, including agglomerated splittings $9,381 -- All to Peru.
Nitrates, crude value, thousands $32,186 $15,006 Belgium $6,509; Japan $2,891; China $1,940.Phosphates, crude $87,393 -- Argentina $46,457; Bolivia $40,936.Pigments, mineral, iron oxides and hydroxides,
processed $41,496 -- Peru $41,365; unspecified $131.Precious and semiprecious stones other than
diamond:Natural $103,268 $99,511 Germany $2,250; Belgium $983; Spain $524.Synthetic $5,761 $3,100 China $2,592; unspecified $69.
Salt and brine value, thousands $40,935 $32,880 Brazil $2,107; Canada $1,599; Netherlands $1,241.Sodium compounds, n.e.s., natural and/or
manufactured:Soda ash $4,003 -- Bolivia $3,717; unspecified $286.Sulfate $1,564,277 -- Brazil $677,610; Argentina $587,175; Peru $257,355.
Stone, sand and gravel:Dimension stone:
Crude and partly worked value, thousands $119,326 $27,162 United Kingdom $25,841; India $14,211; Japan $12,668.Worked $265,039 $37,074 Italy $162,514; Cuba $29,023; France $19,906.
Gravel and crushed rock $78,118 $57,766 Switzerland $20,311; unspecified $41.Quartz and quartzite $25,766 -- Mexico $22,893; China $2,574; unspecified $299.Sand other than metal-bearing $982,547 $946,126 Switzerland $30,160; Argentina $2,719; unspecified $2,637.
See footnote at end of table.

7.22 U.S. GEOLOGICAL SURVEY MINERALS YEARBOOK—2004
TABLE 3--ContinuedCHILE: EXPORTS OF SELECTED MINERAL COMMODITIES IN 2003
(Value, in dollars, unless otherwise specified)
DestinationsCountry and commodity Total United States Other (principal)
INDUSTRIAL MINERALS--Continued
Sulfur:Elemental:
Crude, including native and byproduct $85,715 -- Peru $39,156; Argentina $37,664; Costa Rica $8,857.Colloidal, precipitated, sublimed $409 -- Unspecified $409.
Dioxide $105,117 -- Peru $94,617; Uruguay $10,500.Sulfuric acid $4,770,622 -- Brazil $2,362,072; Peru $1,933,798; Bolivia $428,697.
Talc, steatite, soapstone, pyrophyllite $235 -- Unspecified $235.Other, slag and dross, not metal-bearing $216,568 $101,886 Panama $105,369; Uruguay $6,635; Argentina $2,399.
MINERAL FUELS AND RELATED MATERIALS
Asphalt and bitumen, natural $16,736 -- All to Bolivia.Carbon black $3,780 -- All to Venezuela.Coal:
Anthracite $111 -- Unspecified $111.Bituminous $268 -- Unspecified $268.
Coke and semicoke $2,649,445 -- All to Brazil.Gas, natural, gaseous $35,497 -- Argentina $7,083; unspecified $28,414.Peat, including briquets and litter $3,044 -- All to Bolivia.Petroleum, refinery products:
Liquefied petroleum gas value, thousands $36,597 -- Ecuador $28,760; Peru $5,539; Brazil $2,298.Mineral jelly and wax $80,914 -- Ecuador $42,960; Peru $27,192; Argentina $9,188.Bituminous mixtures $390,657 -- Bolivia $364,966; Ecuador $11,382; Argentina $5,382.Unspecified value, thousands $396,869 $112,550 Guatemala $94,370; Panama $53,229; Peru $40,497.
-- Zero.
Source: United Nations Statistics Division, Commodity Trade Statistics Database (COMTRADE), available at URL http://unstats.un.org/unsd/comtrade/dqBasicQueryResults.

CHILE—2004 7.23
TABLE 4CHILE: IMPORTS OF SELECTED MINERAL COMMODITIES IN 2003
(Value, in dollars, unless otherwise specified)
SourcesCountry and commodity Total United States Other (principal)
METALS
Alkali and alkaline-earth metals:Alkali metals $5,012 $4,861 Unspecified $151.Alkaline-earth metals $76,168 $1,141 Canada $74,977; unspecified $50.
Aluminum:Ore and concentrate $1,428,283 $664 Australia $1,137,378; China $179,567; Argentina $55,464.Oxides and hydroxides $2,778,089 $896,027 Australia $681,111; Netherlands $336,353; Germany $331,623.Metal, including alloys:
Scrap $20,736 -- Mexico $1,595; unspecified $19,141.Unwrought value, thousands $27,352 $24 Argentina $25,264; Brazil $1,850; Spain $136.Semimanufactures:
Powders and flakes $365,118 $37,453 Russia $166,227; Czech Republic $83,699; Germany $28,641.Rods, bars, profiles value, thousands $10,367 -- Brazil $6,284; China $1,496; Colombia $699,044.Wire $1,149,452 $311,721 Argentina $364,866; Germany $257,911; Spain $138,794.Plates, sheets, strips value, thousands $14,197 $749 Brazil $5,716; Germany $4,390; Argentina $1,173.Foil do. $21,077 $475 Germany $5,757; Brazil $3,933; Argentina $3,858.Tubes and pipes $1,098,120 $83,999 Argentina $591,507; Brazil $265,628; Italy $110,679.Tube or pipe fittings $673,576 $233,061 Argentina $169,802; Mexico $93,944; Spain $63,376.
Antimony:Oxides $76,292 $59,320 Bolivia $10,949; Argentina $3,429; Germany $2,594.Metal, including alloys, all forms $40,780 -- China $29,106; Peru $11,462; unspecified $212.
Bismuth, metal, including alloys, all forms $164,716 -- Peru $158,184; Germany $3,460; Canada $1,823.Cadmium, metal, including alloys, all forms $7,227 -- Peru $5,620; Spain $1,218; unspecified $389.Chromium:
Ore and concentrate $2,897,794 $30,152 South Africa $1,912,652; Spain 495,563; Philippines $458,882.Oxides and hydroxides $2,099,040 $88,639 China $1,272,078; Argentina $354,066; Canada $187,143.Metal, including alloys, all forms $148,888 $10,353 United Kingdom $76,039; Germany $32,660; France $12,717.
Cobalt:Oxides and hydroxides $192,517 -- Canada $125,216; Belgium $44,679; China $8,563.Metal, including alloys, all forms $70,698 $12,663 Germany $25,195; China $11,241; United Kingdom $8,840.
Columbium and tantalum, metal, including alloys,all forms, tantalum $17,287 $12,697 Germany $2,337; unspecified $2,253.
Copper:Ore and concentrate $8,828,378 -- Argentina $8,802,360; Brazil $12,510; Bolivia $3,158.Oxides and hydroxides $1,724,922 $345,624 Australia $673,283; Norway $574,049; Peru $127,468.Sulfate $30,431 $1,250 Spain $12,408; Germany $11,260; Mexico $2,187.Metal, including alloys:
Scrap $1,393,584 -- Mexico $657,566; Argentina $406,366; Peru $301,920.Unwrought $197,208 $97,126 France $61,199; United Kingdom $18,966; Spain $9,520.Semimanufactures:
Powders and flakes $68,985 $4,823 Germany $50,712; United Kingdom $7,461; Italy $2,073.Rods, bars, profiles $4,087,241 $15,615 Canada $3,019,299; South Africa $305,246; Italy $200,466.Wire $1,529,184 $32,746 Brazil $877,276; Peru $186,114; Mexico $180,210.Plates, sheets, strips $1,078,790 $119,234 Mexico $476,743; Peru $177,775; Argentina $121,092.Foil $444,627 $50,874 Sweden $276,880; Germany $46,024; Venezuela $29,167.Tubes and pipes $2,129,570 $102,033 Mexico $1,170,458; Republic of Korea $421,818; Spain $221,794.Tube or pipe fittings $4,417,561 $309,070 China $1,412,517; Spain $1,220,733; Italy $757,839.
Gold, metal, including alloys, unwrought and partlywrought $2,731 $1,971 Spain $760.
Iron and steel:Iron ore and concentrate, excluding roasted
pyrite $5,117 -- Japan $3,577; Mexico $1,540.Metal:
Scrap $562,101 -- Argentina $384,552; South Africa $47,393; unspecified $125,122.Pig iron, cast iron, related materials $1,091,767 $68,453 Canada $516,465; Brazil $386,558; South Africa $49,509.
See footnote at end of table.

7.24 U.S. GEOLOGICAL SURVEY MINERALS YEARBOOK—2004
TABLE 4--ContinuedCHILE: IMPORTS OF SELECTED MINERAL COMMODITIES IN 2003
(Value, in dollars, unless otherwise specified)
SourcesCountry and commodity Total United States Other (principal)METALS--Continued
Iron and steel--Continued:Metal--Continued:
Ferroalloys:Ferrochromium value, thousands $1,571 $30 Kazakhstan $872; Russia $525; United Kingdom $138.Ferromanganese $5,930,669 $7,285 Brazil $4,725,466; South Africa $497,271; Mexico 659,352.Ferromolybdenum $82,879 $6,886 Brazil $67,671; Canada $8,322.Ferrosilicomanganese $2,262,272 -- Brazil $2,184,083; South Africa $53,313; Argentina $24,876.Ferrosilicon $7,145,388 $7,285 Argentina $3,231,007; Brazil $3,140,348; Mexico $634,929.Silicon metal $118,389 $16,695 United Kingdom $49,343; Germany $30,266; Brazil $22,085.
Steel, primary forms $146,539 $4,102 Brazil $98,455; Argentina $31,523; Australia $6,475.Semimanufactures:
Flat-rolled products:Of iron or nonalloy steel:
Not clad, plated, coated value, thousands $96,637 $493 Brazil $52,920; Ukraine $15,079; Argentina $9,217.Clad, plated, coated do. $78,542 $90 Argentina $23,749; Brazil $19,959; Luxembourg $8,197.
Of alloy steel do. $55,337 $928 Canada $13,021; Spain $12,152; Brazil $7,703.Bars, rods, angles, shapes, sections do. $97,008 $796 Peru $18,250; South Africa $18,141; Brazil $13,068.Rails and accessories do. $12,229 $1,310 France $6,503; Poland $1,340; Paraguay $1,107.Wire $9,230,785 $136,457 Mexico $2,608,517; Spain $1,855,243; Brazil $1,508,944.Tubes, pipes, fittings value, thousands $73,731 $11,903 Argentina $19,272; Brazil $10,810; unspecified Asia $4,721.
Lead:Oxides $306,302 $102,283 South Africa $110,473; Peru $88,618; Guatemala $1,779.Metal, including alloys:
Unwrought $1,780,286 -- Peru $1,285,802; Argentina $489,830; Austria $4,208.Semimanufactures $160,060 $113,158 Bolivia $30,298; Germany $9,839; Brazil $3,080.
Lithium oxides and hydroxides $94,553 $90,587 Germany $1,714; Spain $1,492; Belgium $760.Magnesium, metal, including alloys:
Unwrought $43,548 -- China $20,410; Argentina $15,085; Netherlands $5,395.Semimanufactures $524,425 $23,563 Switzerland $233,423; Germany $148,848; Argentina $73,333.
Manganese:Ore and concentrate $34,040 -- Kazakhstan $33,354; Brazil $669; unspecified $17.Oxides $160,300 $110,771 Brazil $43,121; Germany 46,408.Metal, including alloys, all forms $45,572 -- Kazakhstan $26,998; China $18,529; unspecified $45.
Mercury $20,758 $597 Spain $8,774; Argentina $6,238; Germany $5,149.Molybdenum:
Ore and concentrate:Roasted $13,710 -- Canada $10,562; unspecified $3,148.Unroasted value, thousands $77,430 $2 Peru $76,274; Canada $705; Armenia $406.
Oxides and hydroxides $1,171,978 -- Netherlands $1,170,499; Germany $1,479.Metal, including alloys:
Unwrought and scrap (powder) $349 -- Unspecified $349.Semimanufactures $68,634 $67,300 Germany $1,047; unspecified $287.
Nickel:Matte and speiss $133 -- Unspecified $133.Oxides and hydroxides $69,653 -- Cuba $69,610; unspecified $43.Metal, including alloys:
Unwrought $1,640,044 $2,009 Brazil $780,471; Canada $716,469; Russia $68,365.Semimanufactures $1,049,256 $208,890 Brazil $767,428; Germany $10,142; United Kingdom $7,583.
Platinum-group metals, metal, including alloys,unwrought and partly wrought:
Palladium $1,677 -- All from Italy.Platinum $22,445 $5,610 Austria $10,981; Germany $5,854.Rhodium $325 -- Unspecified $325.Iridium, osmium, ruthenium $3,717 -- France $3,055; unspecified $662.
See footnote at end of table.

CHILE—2004 7.25
TABLE 4--ContinuedCHILE: IMPORTS OF SELECTED MINERAL COMMODITIES IN 2003
(Value, in dollars, unless otherwise specified)
SourcesCountry and commodity Total United States Other (principal)METALS--Continued
Rare-earth metals including alloys, all forms $653 $653 None.Selenium, elemental $2,391 $998 Germany $1,393.Silver, metal including alloys, unwrought and partly
wrought $102,365 $15,231 Canada $36,924; Germany $31,571; Brazil $16,694.Tin, metal, including alloys:
Unwrought $3,124,747 $11,930 Peru $2,783,476; Brazil $327,650; Canada $1,507.Semimanufactures $108,731 -- Bolivia $96,287; Spain $5,111; Brazil $3,763.
Titanium:Ore and concentrate $466,937 -- South Africa $253,016; Australia $213,921.Oxides $735,383 $278,951 France $118,397; Czech Republic $87,753; Finland $72,074.Metal, including alloys:
Unwrought, waste or scrap, powders $231 -- Unspecified $231.Semimanufactures $2,068,263 $253,690 Canada $1,441,799; Italy $308,562; Sweden $48,244.
Tungsten, metal, including alloys:Powders (wolfram) $71,017 $60,824 China $4,143; Peru $2,131; Canada $2,076.Unwrought, bars/rods simply sintered, scrap $6,016 -- Brazil $4,861; Austria $655; unspecified $500.Semimanufactures $765,236 $721,753 Germany $19,415; China $8,919; Italy $6,428.
Zinc:Oxides $1,210,189 $513 Argentina $665,585; Mexico $230,173; Peru $180,317.Blue powder value, thousands $896,009 $802,552 Peru $39,723; Australia $26,899; Belgium $26,835.Metal, including alloys:
Unwrought $9,617,522 $53,947 Peru $9,513,842; Canada $48,895; Argentina $667.Semimanufactures value, thousands $916 $107 Belgium $302; South Africa $235; United Kingdom $173.
Zirconium:Ore and concentrate $960,909 $1,282 Mexico $876,547; Italy $52,115; Australia $13,501.Metal, including alloys, semimanufactures $98,044 -- Germany $92,777; Spain $5,267.Semimanufactures $232,396 $5,070 Germany $218,878; India $8,448.
Other, ash and residue $3,562 -- Germany $1,735; Japan $737; unspecified $1,090.INDUSTRIAL MINERALS
Abrasives, n.e.s.:Natural: Corundum, emery, pumice, etc. $99,684 $28,747 Argentina $36,826; Peru $12,352; China $9,683.Artificial:
Corundum $282,064 -- Brazil $153,522; China $111,361; Netherlands $7,733.Silicon carbide $181,348 -- Argentina $94,684; Brazil $68,203; China $18,208.
Dust and powder of precious and semipreciousstones ex/including diamond $135,592 $10,674 Ireland $112,115; United Kingdom $4,030; Ghana $3,319.
Grinding and polishing wheels and stonesvalue, thousands $11,708 $838 Germany $2.737; Switzerland $2,196; Brazil $1,516.
Barite and witherite $173,490 -- Peru $134,514; Canada $20,576; Bolivia $10,601.Boron materials:
Crude natural borates $1,230,143 $856 Bolivia $900,372; Argentina $328,915.Oxides and acids $22,930 $4,707 Germany $12,366; Mexico $1,678; unspecified $4,179.
Cement value, thousands $22,259 $33,768 Thailand $9,591; Argentina $5,856; Peru $3,766.Chalk $1,661,424 $42,662 Peru $787,881; Argentina $757,038; Spain $37,257.Clays, crude:
Bentonite $1,015,989 $286,264 Argentina $547,826; Brazil $155,033; Germany $24,587.Fire clay $750,382 $182,636 Guyana $275,624; China $176,283; Argentina $58,483.Kaolin $5,384,483 $4,497,039 China $292,239; United Kingdom $198,910; Spain $145,255.
Diamond, natural:Gem, not set or strung $117,954 -- Israel $101,190; Brazil $16,764.Industrial stones $41,499 $10,342 Ireland $16,162; Ghana $14,995.Dust and powder $132,455 $9,528 Ireland $112,155; United Kingdom $4,030; Ghana $3,319.
Diatomite and other infusorial earth $815,851 $6,354 Peru $556,967; Mexico $226,613; Brazil $12,084.Feldspar $531,860 $157,923 Argentina $349,373; Brazil $24,554; unspecified $10.See footnote at end of table.
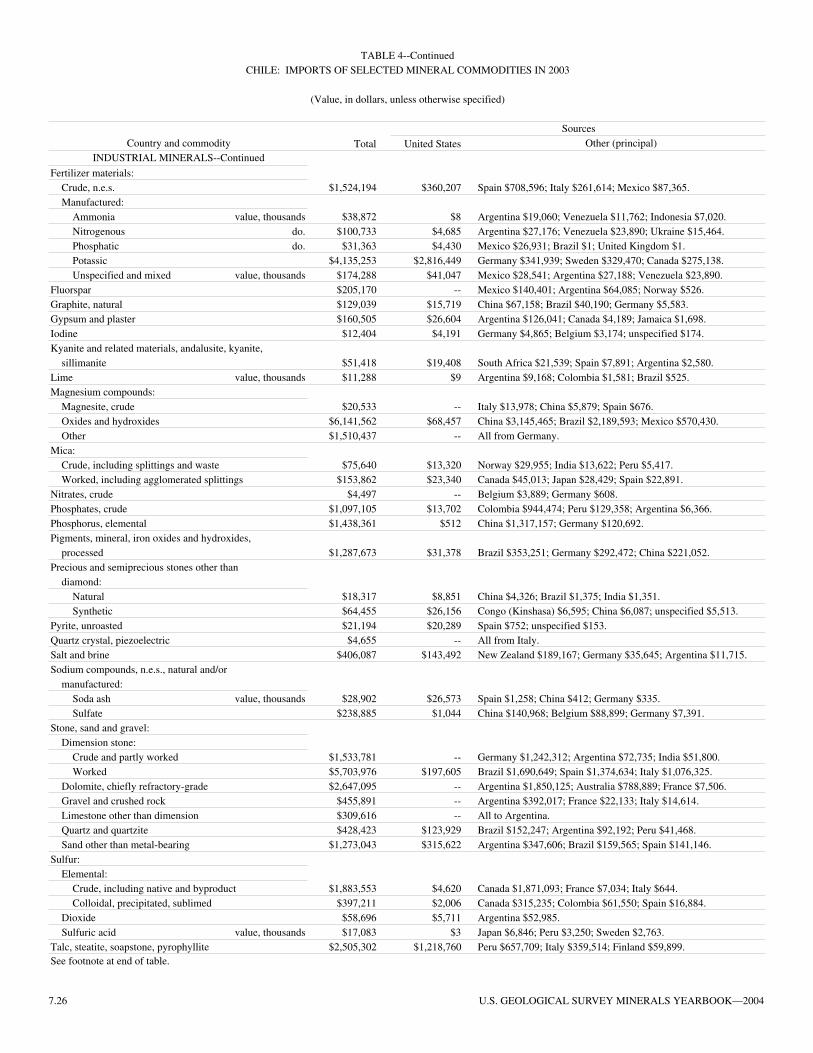
7.26 U.S. GEOLOGICAL SURVEY MINERALS YEARBOOK—2004
TABLE 4--ContinuedCHILE: IMPORTS OF SELECTED MINERAL COMMODITIES IN 2003
(Value, in dollars, unless otherwise specified)
SourcesCountry and commodity Total United States Other (principal)
INDUSTRIAL MINERALS--Continued
Fertilizer materials:Crude, n.e.s. $1,524,194 $360,207 Spain $708,596; Italy $261,614; Mexico $87,365.Manufactured:
Ammonia value, thousands $38,872 $8 Argentina $19,060; Venezuela $11,762; Indonesia $7,020.Nitrogenous do. $100,733 $4,685 Argentina $27,176; Venezuela $23,890; Ukraine $15,464.Phosphatic do. $31,363 $4,430 Mexico $26,931; Brazil $1; United Kingdom $1.Potassic $4,135,253 $2,816,449 Germany $341,939; Sweden $329,470; Canada $275,138.Unspecified and mixed value, thousands $174,288 $41,047 Mexico $28,541; Argentina $27,188; Venezuela $23,890.
Fluorspar $205,170 -- Mexico $140,401; Argentina $64,085; Norway $526.Graphite, natural $129,039 $15,719 China $67,158; Brazil $40,190; Germany $5,583.Gypsum and plaster $160,505 $26,604 Argentina $126,041; Canada $4,189; Jamaica $1,698.Iodine $12,404 $4,191 Germany $4,865; Belgium $3,174; unspecified $174.Kyanite and related materials, andalusite, kyanite,
sillimanite $51,418 $19,408 South Africa $21,539; Spain $7,891; Argentina $2,580.Lime value, thousands $11,288 $9 Argentina $9,168; Colombia $1,581; Brazil $525.Magnesium compounds:
Magnesite, crude $20,533 -- Italy $13,978; China $5,879; Spain $676.Oxides and hydroxides $6,141,562 $68,457 China $3,145,465; Brazil $2,189,593; Mexico $570,430.Other $1,510,437 -- All from Germany.
Mica:Crude, including splittings and waste $75,640 $13,320 Norway $29,955; India $13,622; Peru $5,417.Worked, including agglomerated splittings $153,862 $23,340 Canada $45,013; Japan $28,429; Spain $22,891.
Nitrates, crude $4,497 -- Belgium $3,889; Germany $608.Phosphates, crude $1,097,105 $13,702 Colombia $944,474; Peru $129,358; Argentina $6,366.Phosphorus, elemental $1,438,361 $512 China $1,317,157; Germany $120,692.Pigments, mineral, iron oxides and hydroxides,
processed $1,287,673 $31,378 Brazil $353,251; Germany $292,472; China $221,052.Precious and semiprecious stones other than
diamond:Natural $18,317 $8,851 China $4,326; Brazil $1,375; India $1,351.Synthetic $64,455 $26,156 Congo (Kinshasa) $6,595; China $6,087; unspecified $5,513.
Pyrite, unroasted $21,194 $20,289 Spain $752; unspecified $153.Quartz crystal, piezoelectric $4,655 -- All from Italy.Salt and brine $406,087 $143,492 New Zealand $189,167; Germany $35,645; Argentina $11,715.Sodium compounds, n.e.s., natural and/or
manufactured:Soda ash value, thousands $28,902 $26,573 Spain $1,258; China $412; Germany $335.Sulfate $238,885 $1,044 China $140,968; Belgium $88,899; Germany $7,391.
Stone, sand and gravel:Dimension stone:
Crude and partly worked $1,533,781 -- Germany $1,242,312; Argentina $72,735; India $51,800.Worked $5,703,976 $197,605 Brazil $1,690,649; Spain $1,374,634; Italy $1,076,325.
Dolomite, chiefly refractory-grade $2,647,095 -- Argentina $1,850,125; Australia $788,889; France $7,506.Gravel and crushed rock $455,891 -- Argentina $392,017; France $22,133; Italy $14,614.Limestone other than dimension $309,616 -- All to Argentina.Quartz and quartzite $428,423 $123,929 Brazil $152,247; Argentina $92,192; Peru $41,468.Sand other than metal-bearing $1,273,043 $315,622 Argentina $347,606; Brazil $159,565; Spain $141,146.
Sulfur:Elemental:
Crude, including native and byproduct $1,883,553 $4,620 Canada $1,871,093; France $7,034; Italy $644.Colloidal, precipitated, sublimed $397,211 $2,006 Canada $315,235; Colombia $61,550; Spain $16,884.
Dioxide $58,696 $5,711 Argentina $52,985.Sulfuric acid value, thousands $17,083 $3 Japan $6,846; Peru $3,250; Sweden $2,763.
Talc, steatite, soapstone, pyrophyllite $2,505,302 $1,218,760 Peru $657,709; Italy $359,514; Finland $59,899.See footnote at end of table.

CHILE—2004 7.27
TABLE 4--ContinuedCHILE: IMPORTS OF SELECTED MINERAL COMMODITIES IN 2003
(Value, in dollars, unless otherwise specified)
SourcesCountry and commodity Total United States Other (principal)
INDUSTRIAL MINERALS--Continued
Vermiculite, perlite, chlorite $82,953 -- Netherlands $41,264; Mexico $19,889; Argentina $18,990.Other, slag and dross, not metal-bearing $23,900 -- United Kingdom $22,363; Brazil $1,224; unspecified $313.
MINERAL FUELS AND RELATED MATERIALS
Asphalt and bitumen, natural $69,729 $21,544 Venezuela $46,602; Argentina $1,185; unspecified $398.Carbon black value, thousands $11,048 $1,054 Venezuela $4,266; Colombia $3,465; Argentina $1,661.Coal:
Anthracite $284,215 $204,106 Colombia $56,541; United Kingdom $13,468; Belgium $10,100.Bituminous value, thousands $105,539 $3,265 Australia $43,409; Colombia $22,779; Canada $22,724.
Coke and semicoke $4,316,243 $16,535 China $2,582,354; Australia $1,494,893; Colombia $187,285.Gas, natural, gaseous value, thousands $378,661 $1 Argentina $378,659; United Kingdom $1.Peat, including briquets and litter $932,292 $4,241 Canada $479,058; Netherlands $202,740; Finland $143,216.Petroleum:
Crude value, thousands $2,125,552 $3 Argentina $1,458,618; Brazil $224,236; Peru $168,084.Refinery products:
Liquefied petroleum gas do. $158,344 $60 Argentina $153,243; Ecuador $4,434; Bolivia $468. Mineral jelly and wax $9,843,141 $750,379 Argentina $3,029,334; Germany $2,646,834; China $1,082,976.Asphalt $58,083 $11,556 Argentina $42,901; Brazil $3,423; unspecified $203.Bituminous mixtures value, thousands $10,296 $57 Argentina $214; Canada $41; unspecified $9,932.Petroleum coke do. $12,217 $6,946 Argentina $5,206; Brazil $65.Unspecified value, millions $457 $56,945 Argentina $241; Republic of Korea $76; unspecified Asia 20.
-- Zero.
Source: United Nations Statistics Division, Commodity Trade Statistics Database (COMTRADE), available at URL http://unstats.un.org/unsd/comtrade/dqBasicQueryResults.