by robert w. simpson, thomas b. gage, and robert e. bracken
TRANSCRIPT

DEPARTMENT OF THE INTERIOR U.S. GEOLOGICAL SURVEY
TO ACCOMPANY MAP MF-1602-B
AEROMAGNETIC AND ISOSTATIC GRAVITY MAPS OF TUBCROSSMAN PEAK WILDERNESS STUDY AREA,
MOHAVE COUNTY, ARIZONA
By
Robert W. Simpson, Thomas B. Gage, and Robert E. Bracken
STUDIES RELATED TO WILDERNESS
Bureau of Land Management Wilderness Study Areas
The Federal Land Policy and Management Act (Public Law 94-579, October 21, 1976) requires the U.S. Geological Survey and the U.S. Bureau of Mines to conduct mineral surveys of certain areas to determine their mineral resource potential. Results must be made available to the public and be submitted to the President and the Congress. This report presents the results of aeromagnetic and gravity surveys of the Crossman Peak Wilderness Study Area (5-7B), Mohave County, Arizona.
INTRODUCTION
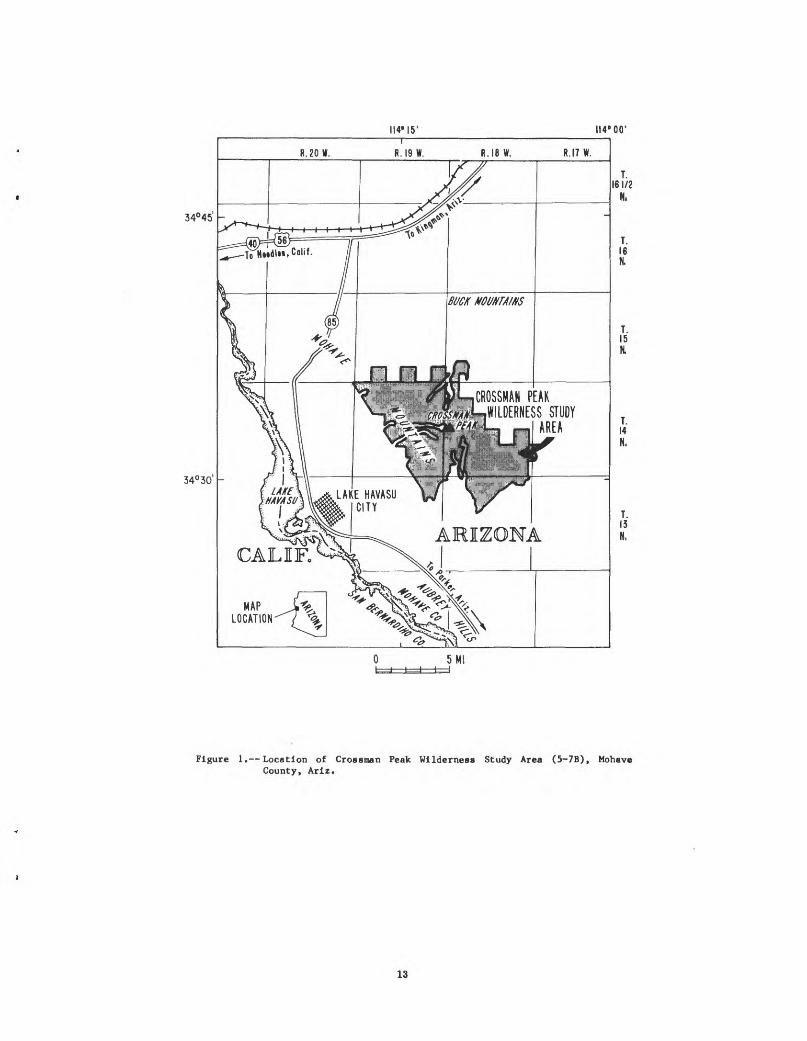
The Crossman Peak Wilderness Study Area (fig. 1) is in western Arizona, 3 mi east of Lake Havasu City. Ariz. and 45 mi southwest of Kingman, Ariz. The study area covers approximately 38,000 acres in the topographically rugged center and flanking foothills of the Mohave Mountains, which are sometimes included as part of the Chemehuevi Mountains. (The Chemehuevi Mountains, as referred to in this report, are adjacent to the northwest Mohave Mountains but across the Colorado River in California.) The Mohave Mountains form a northwest-trending range adjacent to Lake Havasu (elevation 448 ft) on the Colorado River. Within the wilderness study area the Mohave Mountains are dominated by Crossman Peak, which has an elevation of 5,148 ft. The area is accessible from the north and west by numerous jeep trails that inter sect either Interstate Highway 40, Arizona Highway 95, or some residential streets of Lake Havasu City. From the south, southeast, and northeast access to the area is by jeep trails that intersect the unimproved Dutch Flat Road, which skirts the south flank of the mountains. Several small areas of mines and roads excluded from the Crossman Peak Wilder ness Study Area proper are within the approximate boundary shown for the study area.
This report describes the aeromagnetic and gravity data for the Crossman Peak area. Companion reports describe the mineral resource potential (Light and others, 1983b), the mineralization (Light and McDonnell, 1983). the geochemical data (Light and others, 1983a), and remote sensing data (Raines, 1983). Additional reports describing geologic investigations are those of Pike and Hansen (1982), Nakata (1982), Howard and others (1982). John and Howard (1982), Pike (1983), Wilshire and others (1983), and Howard and John (1983).
GEOLOGIC SETTING
The wilderness study area lies adjacent to a belt of metamorphic core complexes exposed to the west in the Whipple and Chemehuevi Mountains (Davis and others, 1980). Mountain ranges within the mapped area (fig. 1 and fig. 2) are flanked by Quaternary alluvium and expose Proterozoic meta morphic and igneous rocks, Tertiary dikes, and Tertiary volcanic and sedimentary rocks (Light and others. 1983). A Tertiary low-angle normal fault, the Crossman Peak detach ment fault, has been mapped in the southern part of the map area where it appears to outline a northeast-trending synform (Howard and others, 1982). Dense swarms of dikes intrude Proterozoic rocks in the wilderness study area north of and structurally below the trace of this fault (Nakata. 1982). Howard and others (1982) suggested that the entire area is
allochthonous above another major Tertiary fault, the Whipple Mountains detachment fault, which projects under the area from the west. Miocene strata within the area generally dip steeply southwestward, owing to tilting of structural blocks (Pike and Hansen, 1982; Howard and others, 1982).
AEROMAGNETIC DATA
Data collection and processing
The total-field aeromagnetic data for the Crossman Peak Wilderness Study Area were extracted from a survey that covers the entire Needles 1° by 2° quadrangle (U.S. Geological Survey, 1981). The 1975 International Geo magnetic Reference Field (IGRF) updated to the date of flying was subtracted from the total-field intensity measurements, and a constant datum of 5,000 gammas (1 gamma=l nanotesla) was added to obtain the total-field anomaly map (sheet 1).
The survey was flown at a constant (nominal) elevation of 1,000 ft above ground level. Because it is not possible to maintain a strictly constant ground clearance when flying over rugged topography, some anomalies result from the changing distance to magnetic sources that occur when the plane skims peaks and flies high over narrow valleys. It is difficult to eliminate such artifacts from the data set, although it is usually not difficult to identify where such problems may exist from a topographic map. Anomalies clearly associated with topographic features have been labeled T on sheet 2. Flightlines were spaced 0.5 mi apart and were flown in an east-west direction. Tie lines spaced approximately 10 mi apart were flown in a north-south direc tion. Occasionally, if a flightline is incorrectly located or if the data values are shifted by a small datum level from those on neighboring flightlines, an elongate east-trending anomaly or gradient may appear on the contoured map. Such east- west trends need to be viewed with caution because of these possible flightline problems.
The aeromagnetic data on sheet 2 were reduced to the pole (Baranov and Naudy, 1964) using the following procedure. Digital data provided by the contractor were interpolated to a regularly spaced (0.25 km by 0.25 km) rectangular grid using an algorithm based on minimum curvature (Webring. 1981). A filter was then applied to the grid (Hildenbrand, 1983), which has the effect of replacing the inclined geomagnetic field and magnetization directions found at the latitude of the study area with vertical directions such as would be found at the pole. The advantages gained by this reduction are discussed in the next section. In addition, the data shown on sheet 2 were continued upward an additional 1,000 ft in order to

smooth some chevron patterns in the contours caused by flightline datum and location problems.
Interpretation of aeromagnetic anomalies
Rock magnetization is caused by a small number of magnetic minerals most commonly magnetite. Thus aero magnetic anomalies usually reflect the presence or absence of magnetite in rocks. The shape of a magnetic anomaly is a function of the geometry of the magnetic source body, the distance of the magnetic sensor from the source body, the direction of magnetization in the source body, and the direc tion of the ambient geomagnetic field.
Smooth, widely spaced -magnetic contours generally indicate a considerable depth to magnetic rocks. Such con tours can be seen over deep alluvium-filled basins because sedimentary deposits are usually not very magnetic. Highly curved and closely spaced contours, on the other hand, indicate changes in magnetic sources located at or very near the ground surface. This can give useful information about the magnetization of rocks that form topographic features anomalies correlating with individual ridges and peaks crossed by a flightline often imply magnetic rocks at the surface, while the absence of such correlative anomalies implies that relatively nonmagnetic rocks make up the topo graphic features.
The direction of magnetization and the direction of the ambient field also affect the shape of anomalies. A symmetrical body produces a symmetrical anomaly only at the north (or south) magnetic pole; elsewhere, the nonvertical direction of magnetization and ambient field adds asymmetry to the shape of the anomaly. For example, at the latitude of the wilderness study area (lat 34° N.), a symmetrical source produces a pair of anomalies: a high-amplitude positive anomaly displaced slightly to the south of the body and a low-amplitude negative anomaly displaced slightly to the north.
One way to simplify such a high-low polarization anomaly is to transform it into a new anomaly caused by the same source but with vertical magnetization and vertical ambient field. This transformation is called "reduction to the pole" and requires no assumptions about shape or location of the body (Baranov and Naudy, 1964). However, it does require knowledge about the direction of magnetization. In many rocks, the magnetization is largely induced by and parallel to the Earth's field. In volcanic rocks and some metamorphic rocks, however, remanent magnetization is an important component of the total magnetization and may have an unknown direction. Young volcanic rocks that were magnetized during an interval of reversed magnetic polarity (Harland and others, 1982) have magnetic directions approxi mately anti-parallel to the Earth's present field. Reduction to the pole rotates such magnetizations so that magnetic low anomalies are centered over the reversely magnetized rocks.
Magnetic lows can also be caused by an absence of magnetic material relative to the surrounding areas. Broad magnetic lows often occur over basins filled with nonmag netic sedimentary rocks. The existence of a basin can usually be confirmed by the coincidence of a gravity low caused by the low densities of sedimentary fill relative to surrounding bedrock. The coincidence of a magnetic low and a gravity low does not guarantee the presence of an alluvium-filled basin, however, because some granitic and metamorphic lithologies have low magnetization values. Conversely, magnetic rocks such as volcanics occurring within a sedimen tary section can produce short-wavelength aeromagnetic anomalies coinciding with a gravity low.
For purposes of mineral exploration, an important class of aeromagnetic lows are those that occur over areas of alteration and mineralization in which magnetite has been destroyed by the alteration process. Such lows are sometimes found in conjunction with geochemical and remote-sensing anomalies that indicate alteration. In many cases, the size of the aeromagnetic low may serve as a useful guide to the extent of the altered area.
Magnetic gradients and depth determinations
A rapid change in magnetic field intensity often occurs over the boundary between two areas with different magnetic properties. At the latitude of the study area, these gradients may be somewhat offset from the boundaries because of nonvertical magnetization and ambient field directions. If the magnetization is assumed to be induced rather than remanent, this offset can be corrected by reduction to the pole.
A further simplification of anomalies is possible if a pseudogravity transform is performed on the magnetic data. This, in effect, replaces magnetic material by dense material from which a gravity anomaly is calculated (Baranov, 1957). The horizontal gradient of the pseudogravity field probably gives the best estimate of the positions of contacts, because the steepest gradients occur nearly over the magnetic bound aries (Cordell, 1979). Magnetization boundaries close to the surface produce steeper gradients than more deeply buried boundaries of the same nature. Geologic contacts that do not have different magnetizations on the two sides or that are not favorably oriented relative to the magnetic field do not, of course, show up as magnetic anomalies or gradients. The position of one steep horizontal gradient of the pseudogravity field is shown on the aeromagnetic 'interpretation map (sheet 2). The length of th6 dashes indicates in rough fashion the sharpness of definition of. the boundary in terms of the steep ness and continuity of the gradient.
Depth to magnetic sources can be inferred from the wavelengths of aeromagnetic anomalies. Certain areas of the aeromagnetic map have broad anomalies with gentle gradi ents. Magnetic sources in these areas are likely to lie at greater depth than those in areas where anomalies have narrow widths and steep gradients. This relation was quanti fied by Vacquier and others (1951) using the gradients of anomalies. The horizontal length of the linear part of anomaly gradients is measured, preferably from flightline profiles, and this horizontal length provides an approximate estimate of a maximum possible depth to the top of the source body. Because of the subjectivity in measuring the straight part of the gradient, and because anomalies are not always of the ideal form required by the method, the depths obtained are estimated to be uncertain by 20 percent.
Regional context
The aeromagnetic anomalies within the study area can be seen in a broader context on the "Composite Magnetic Anomaly Map of the United States" (Zietz. 1982), on the Basin and Range compilation maps of Hildenbrand and Kucks (1983), on the aeromagnetic maps of Arizona (Sauck and Sumner, 1970; Sauck, 1972), and on the "Aeromagnetic Map of the Needles 1° by 2° quadrangle" (U.S. Geological Survey, 1981). Magnetic profiles over the Needles quadrangle were also obtained as part of an aerial radiometric survey (Geodeta International, Inc., 1979). The anomalies within the study area are rather subdued compared to much more prominent anomalies to the north and east over the Colorado Plateau. (The edge of the plateau lies about 50 mi northeast of the study area.)
The study area lies approximately in the center of a north- to northwest-trending belt of high anomalies at least 300 mi long (best seen on the map of Hildenbrand and Kucks, 1983). Klein (1982) considers the southeastward extension of the belt of highs to be caused by "a locus of intrusion, metamorphism, or basement structural defects that accom pany a primary weakness between two different crustal regimes." The belt probably continues north-northwest of the wilderness study area along the Colorado River into Nevada. Along this northward extension it coincides with many of the domed ranges in a belt of metamorphic core complexes (for example, Davis and others, 1980; Frost and Martin,-1982).
The wilderness study area also lies at the southwest margin of a very irregular belt of low aeromagnetic anomalies that follows the margin of the Colorado Plateau through west-central Arizona. This belt coincides with a zone of shallow depth to Curie isotherms determined by Byerly and Stolt (1977) from an analysis of the state

aeromagnetic map. A second irregular belt of lows, which is flanked by prominent highs, extends northeastward from the wilderness study area across the Colorado Plateau. These lows may reflect the presence of nonmagnetic lithologies in the Precambrian basement.
Other features of regional significance in the vicinity of the wilderness study area are prominent N. 55°-60° E. trends defined by magnetic gradients and by truncations of magnetic anomalies. These are most apparent on the Needles 1° by 2° aeromagnetic survey (U.S. Geological Survey, 1981). The most prominent of these (trend A, sheet 2), passes about 3 mi northwest of the northwest corner of the wilder ness study area and continues 30 mi southwestward into the Turtle Mountains. These N. 55°-bO° E. trends are crossed, and sometimes offset in a right-lateral sense, by a strong N. 30° W. grain in the aeromagnetic anomalies in the eastern half of the Needles 1° by 2° quadrangle. For example, the N. 55° E. magnetic gradient that extends to the Turtle Moun tains (trend A, sheet 2) appears to step in a right-lateral sense on the west side of the Mohave Mountains and again on the west side of the Chemehuevi Mountains (U.S. Geological Survey, 1981). Tne offsets suggest right-lateral shear motion parallel to the San Andreas fault system, but approximately 100 mi northeast of the presently active San Andreas fault.
The extrapolation of individual N. 60° E. aeromagnetic trends to the northeast of the Needles survey is difficult because data of comparable quality are not available in this region'. Prominent N. 30°-45° E. trends defined by geologic structures (Kelley, 1955; Kelley and Clinton, I960; Davis, 1978) and by elongate aeromagnetic high anomalies and gradients exist on the Colorado Plateau to the northeast of the study area (Sauck and Sumner, 1970; Shoemaker and others, 1978). A regional N. 45°-60° E. fabric is apparent across this entire region. The aeromagnetic high anomalies and gradients on the Colorado Plateau appear to be caused by magnetic Precambrian metavolcanic rocks that are bounded in part by northeast-trending structures (Shoemaker and others, 1978). These structures were first formed in the Precambrian, but have been reactivated many times since then and have served as pathways for magma and mineraliz ing fluids. The wilderness study area sits at the southwest end of the Colorado lineament (Warner, 1978; Brill and Nuttli, 1983). This lineament is an extension of the Colorado mineral belt des ribed by Tweto and Sims (1963).
if the N. 60° E. aeromagnetic trends in the Needles 1, by 2, quadrangle also indicate reactivated structures in the Precambrian basement, then their presence in the Mojave Desert may help to define the westward extent of autochthonous cratonic basement. Their presence may also help to constrain the location of a possible northwest- trending Mojave-Sonora megashear (Silver and Anderson, 1983) passing through the Mojave Desert. The N. 60, E. trends do not appear to continue into the western half of the Needles 1° by 2" quadrangle (U.S. Geological Survey, 1981) unless they were rotated to a more east-west orientation.
Magnetizations of exposed units
Magnetic susceptibilities for many of the units within the study area are shown in table 1. Typically, magneti zations vary widely for determinations even a short distance apart, so it is useful to report both the range of measure ments and the average of median values.
Approximate correspondences of measured susceptibil ities with aeromagnetic anomalies in the Crossman Peak wilderness study area are shown in table 2. Table 2 is intended to serve as a rule-of-thumb guide and would need revision for other geologic conditions ana survey specifica tions.
Many of the larger positive anomalies over Precambrian basement coincide approximately with mapped exposures of Proterozoic augen gneiss, although not all mapped exposures of this unit have corresponding associated aeromagnetic highs. Susceptibilities measured for this unit show a wide range of values (table 1) with a median value of about 0.9 x 10 cgs units. It is not unusual for metamorphic rocks to show such variability given the possibilities for creating and destroying magnetite under various metamorphic
conditions. Other Precamorian gneisses ana granitoids avail able for susceptibility measurements gave values that span a range equal to that of the augen gneiss. Quartz monzoaiorite, in the vicinity of the large aeromagnetic nign just south of the wilderness study area, averaged about 1.3 x 10~ cgs units, while a sample of otner gneisses (not representative of the exposed outcrop in any statistical sense) gave an average susceptibility of only 0.3 x 10 cgs units. It appears from the susceptibility measurements that tne Proterozoic augen gneiss and the quartz monzodiorite soutn of the wilderness study area attain magnetization values that are large enough to produce the ooserved magnetic anomalies.
The crystalline TOCKS exposed in tne Monave Mountains are intruded by large numbers of dikes of Precamorian to Tertiary age (NaKata, 1982). Only the more mafic diKes have moderately high magnetizations (taole 1). Indiviaual dikes with such magnetizations cannot normally be resolvea oy a magnetometer 1,000 ft above the ground surface unless tne dikes are at least several hundred feet thicK. Ooservea aeromagnetic anomalies (sheet 1) do not seem to correlate witn either the distribution or density of tne dikes (NaKata, 1982).
Tertiary volcanic outcrops, samplea on a ground traverse, were found to nave moderate susceptibilities (table 1). Numerous small aeromagnetic nigns ana lows occur over topographic features that are comprised of volcanic rocks. Aeromagnetic lows suggest that some of tnese volcanic rocks were magnetized during reversed polarity intervals.
Sedimentary fill in basins is usually nonmagnetic, although magnetite grains may oe concentratea oy wind or water to yield detectaole aeromagnetic anomalies. In tne present study area, most short-wavelength aeromagnetic anomalies over areas of sedimentary fill are thought to represent volcanic rocks ouried in tne section or anomalies caused oy crystalline casement rocKs. Areas with suostantial thicknesses of sedimentary fill, which are aefinea oy low gravity values, tena to coincide witn uroad aeromagnetic low anomalies, and thus confirm that much of the fill is not very magnetic.
Aeromagnetic nign anomalies
Magnetic anomaly values (sneet 1) range from a nisn of 5,337 gammas to a low of 4,324 gammas; both values are part of a large polarization high-low anomaly pair to the south of the wilderness study area. All of tne important high anomalies overlie exposures of either (i) Proterozoic au^en gneiss, (2) Precambrian quartz monzodiorite, (3) unaifferenti- ated Precamorian gneisses and Tertiary diKes, or 14) Tertiary volcanic rocks. These aeromagnetic higns are inaicateu on sheet 2 oy the symbols AriAG, AH^MD, AhGND, and AHV, respectively. Precambrian amphibolite oooies may ue responsible for a small high laoeled AriA, out the numerous dikes that cut tne Precambrian oasement do not iudiviauaily produce significant anomalies, although tney may ue responsible for the general Droaa nign that encompasses most of the range.
The positions of many of these nighs shift to the north when they are reduced to the pole (sheet 2). In general, tne positions of the anomalies on sneet 2 provide a oetter indicator of the locations of the causative oodies, except for the shortest wavelength anomalies that are shown in greater detail on sheet 1.
The coincidence of the aeromagnetic higns ana the lithologies listed aoove is consistent with tne rneasurea magnetizations of these lithologies as discussed in tne previous section. The steep gradients and narrow widths associated with highs laoeled AiiAG^ ana AHAG2 suggest that these highs are causea by litnologies exposed at tne surface. Other anomalies that are clearly associated with large topographic features, implying magnetic iitnologies at the surface, are laoeled T on sheet 2.
The large high AHQMD^ south of the wilderness stuay area straddles the southern exposure of the Crossman Peak detachment fault (Howard and others, li»«2). The northern part of the nigh overlies upper plate rocKs aoove the Cross man Peak fault, which d.ips snallowly to the north here. Some

of these rocks are moderately to highly magnetic Tertiary volcanic and intrusive rocks and moderately magnetic Pre- cambrian quartz monzodiorite. The southern part of this high lies over moderately to highly magnetic Precambrian granitic and gneissic rocks including some augen gneisses. The northern part of the high anomaly has steeper gradients and shorter wavelength components than the generally smoother southern part. This relation suggests that magnetic sources are closer to the surface at the north ena than at the south end. The line of steep magnetic gradients indicated on sheet 2 lies close to the trace of the Crossman Peak fault and suggests some difference in the magnetic materials across the fault. Four possibilities arise to explain these observa tions: (1) the juxtaposition of magnetic rocks on either side of the Crossman Peak fault is quite coincidental, (2) the displacement on the fault has been relatively minor so that the magnetic lithologies were never offset very far, (3) the magnetic material is a buried mafic intrusive body that postdates motion on the fault, or (4) the main contribution to the large high comes from Precambrian rocks in the lower plate both to the north and to the south of the surface trace of the detachment fault, with a coincidentally superposed short-wavelength component from shallow Precambrian and Tertiary magnetic sources in the upper plate. Because of other short-wavelength anomalies over upper plate rocks just to the north of the high, this fourth explanation seems the most plausible.
A low-amplitude high over the BUCK Mountains (north of the wilderness study area) emphasizes certain differences between this range and the Mohave Mountains. The buck Mountains contain lithologies similar to those exposed in the Mohave Mountains, including the Precambrian augen gneiss. However, the crowded dike swarms that cut the Mohave Mountains are not present in the buck Mountains (Keith Howard, oral commun., 1983). Perhaps the scarcity of dikes explains the modest amplitude of the high over the BUCK Mountains compared to higher amplitudes over the Mohave Mountains. Structural relations require some important structural discontinuity between these ranges (Howard and others, 1982). The aeromagnetic gradient along the northeast margin of the Mohave Mountains may indicate such a discon tinuity.
Aeromagnetic low anomalies
Important aeromagnetic lows are caused by (1) non magnetic sedimentary fill in basins, (2) reversely magnetized volcanic rocks, and (3) areas of relatively nonmagnetic Pre cambrian basement. These are indicated by ALS, ALV, ana ALPC, respectively (sheet 2). Several major lows on the north sides of high anomalies on sheet 1 are greatly attenuated by reduction to the pole.
Except for the isolated aeromagnetic high AHAG 2 at the east end of the wilderness study area, tne southeast quarter of the wilderness study area has lower aeromagnetic anomaly values than other parts of tne range. This could reflect an absence of the magnetic Proterozoic augen gneiss in the area, a smaller proportion of the more magnetic mafic dikes, or possibly a higher degree of alteration that has destroyed magnetite in these rocks. Geologic mapping has not revealed any obvious increase in the degree of alteration in this area (Keith Howard, oral commun., 1983), although the area of low aeromagnetic values partly overlaps areas of alteration defined by remote-sensing techniques (Raines, 1983) and geochemical anomalies defined by regional geo- chemical sampling (Light and others, 1982). Several smaller lows best displayed on sheet 1 are labeled AL? on sheet 2. They occur along the northeast and south boundaries of the wilderness study area and might indicate local areas of more intense alteration, topographic effects, or reversely magnetized volcanic rocks.
Aeromagnetic trends
Several prominent aeromagnetic trends are indicated on sheet 2. The N. 60° E. linear trends labeled trend A and trend B in the margin of sheet 2 lie on either side of an area of generally lower aeromagnetic values. The linear trends
and the enclosed low can be traced, witn some interruption, for 60 mi across the entire eastern naif of tne Needles 1, uy 2, quadrangle (U.S. Geological Survey, 19ol). Trenus C and D are of more local significance tney are extrapolated from the nortnern Wliipple Mountains to tne soutuwest wnere they oound an area of magnetic nigh values auout i> mi long. Trend D parallels tne Crossman PeaK fault in the study area. The regional significance of such N. 60, ti. trends is discussed in an earlier section. Tue two largest nign-anomaly areas on sheet 1 appear to ue offset aoout 3 mi in a rigttt-lateral sense across trend C, which extends across the soutn end of tne Mohave Mountains. However, previous geologic mapping suggests left-lateral offset (Keith Howard, oral commun., 1984). A second fabric trend of N. JO, W. is quite apparent in the magnetic gradients throughout the study area and parallels a Tertiary structural grain reflected in tne striKes of numerous listric-normal fault traces.
GRAVITY DATA
Data collection and processing
Some 263 new gravity ooservations were added to 55 existing observations (obtained from tne National Oceanic and Atmospheric Administration Geopnysical Data Center, Boulder, Colo.) to produce the gravity map of the Crossman Peak wilderness Study Area (sneet 3). Anomaly values were calculated using the 1967 Geodetic Reference System formula for theoretical gravity at sea level (International Association of Geodesy, 1971), and observed gravity values conform to the International Gravity Standardization Net of 1971 (Morelli, 1974). A standard Bouguer reduction density of 2.67 g/cm was used. All stations were corrected for terrain effects out to 16617 km from the station usin^ an automatic terrain correction program of Plouff (19/7). Stations in areas of rugged topograpny were corrected uy nand out to O.a9 Km. The largest error in Bouguer gravity values was produced QJ uncertainties in elevations for some of the stations accessed by helicopter. This error prouauly never exceeded o mGal, and none of the anomalies discussed in this report are controlled exclusively by such stations. Stations measured at bench marks or spot elevations and those tnat were measured at surveyed elevations have Bouguer values with uncertainties less than the 2-mGal contour interval. Tne principal facts for the stations and tneir estimated errors are detailed in Gage and Simpson (1983).
Isostatic corrections were oased on an Airy-HeisKanen model of local compensation (HeisKanen and Moritz, 1967), whicn assumes a depth of compensation for sea-level eleva tions of 25 km, a density for topography of 2.67 g/cm , and a density contrast between the crustal column and the compen sating material of 0.4 g/cm . Investigations snow that tnese parameters can be changed over a considerable range without changing the isostatic residual gravity anomalies in any important way, especially for an area of tnis size (Saltus, 1984). Tne corrections were applied using a program described by Simpson and otners (198Ja). Tne isostatic correction term, also Known as tne isostatic regional (fig. 3), is a gradient sloping to the northeast that reflects tne attrac tion of the compensating masses under the nearoy Colorado Plateau. This isostatic regional was suutracted from tne Bouguer gravity field to yield the isostatic residual gravity map (sheet 3). Trie isostatic correction removed most of the effects of topograpny and of its compensating roots, leaving anomalies produced mostly uy density contrasts within tue upper crust. (Some snort-wavelength anomalies can ue pro duced by topographic features tnat are not made of materials of density 2.67 g/cm , and some long-wavelength offsets can be produced by differences uetween the real compensation geometries and those assumed uy tne simple Airy-HeisKanen compensation model.)
It is important to note that an isostatic residual anomaly does not necessarily imply an isostatic imualance. A dense uody within the crust with a widtn less tnan about 200 km can be perfectly and completely compensated at depth and it will still exnibit a pronounced isostatic residual high. An example of this is given in Simpson and otners (1983u). Thus gravity studies by themselves cannot reveal

very much about the present state of isostatic balance in metamorphic core complexes or other terranes in the region. Isostatic residual anomalies do reveal a great deal about lateral density contrasts within the crust, however, and the most profitable approach seems to be to assume that isostatic balance has been attained. Most anomalies can then be satisfactorily modeled by bodies placed within the crust and their compensating roots. If a region were, in fact, undercompensated or overcompensated, the effect would appear, because of its depth, as a low-amplitude, long-wave length anomaly relative to the size of the present study area.
Regional context
The gravity field for the Crossman Peak Wilderness Study Area is put into regional perspective by examination of the Bouguer and residual Bouguer gravity maps of Arizona (West, 1972; Aiken, 1975; Lysonski, 1980; Lysonski and others, 1980; Aiken and otfiers, 1981), the Bouguer and isostatic residual gravity maps of California (Oliver, 1980; Oliver and others, 1980; Roberts and others, 1981), and the Bouguer and residual Bouguer maps of the Needles 1° by 2° quadrangle (Chapman and Rietman, 1978; Lysonski and others, 1981). The regional gravity compilation of the Basin and Range province and accompanying filtered maps is also quite useful (Hildenbrand and Kucks, 1982).
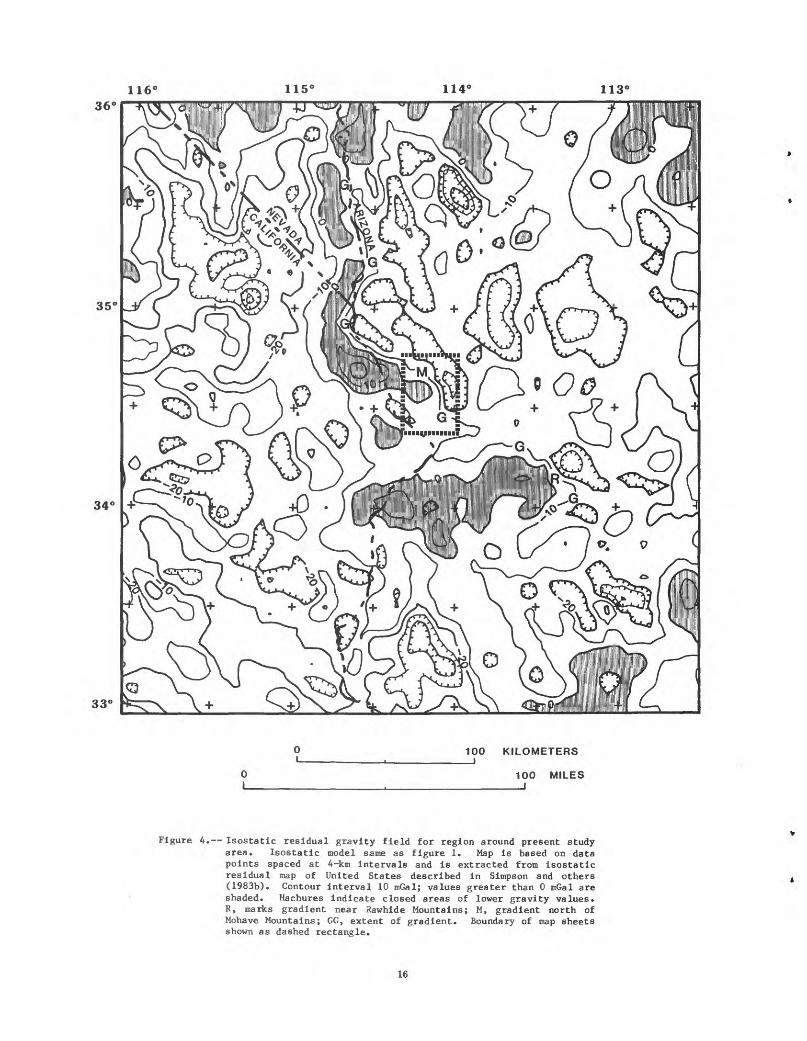
The Crossman Peak Wilderness Study Area is at the south end of a continuous belt of high anomalies that extends north along the Colorado River for approximately 100 mi. The belt can be traced in figure 4, which shows the isostatic residual gravity field in the vicinity of the wilderness study area extracted from a regional, 4-km data grid (Simpson and others, 1983b). The gravity high over the wilderness study area is similar to highs found in the Whipple Mountains 20 mi to the southwest and in the Chemehuevi and Sacramento Mountains 20 to 30 mi to the northwest. These highs are, in fact, all part of the previously mentioned celt, which bifurcates in the Chemehuevi Mountains; one branch con tinues southeastward to the wilderness study area and another continues southward to the western Whipple Mountains. The belt ends as a continuous feature in this bifurcation, but after a gap, a possible continuation can be traced for perhaps 200 to 250 mi to the southeast as a succession of irregular high residual gravity anomalies that are in part coincident with the "magnetic belt" discussed by Klein (1982).
The composite belt of highs to the north and to the southeast of the wilderness study area coincides closely with the locations of metamorphic core complexes (Coney, 1980; Armstrong, 1982) and with a proposed belt of Laramide thrusting (Drewes, 1978). The gravity highs may De caused Dy mafic dikes or mafic intrusive bodies exposed in the western Whipple, Chemehuevi, Sacramento Mountains, and Crossman Peak area. Tne gravity high in the western Whipple Mountains lies over a large mafic to ultramafic igneous complex (G. A. Davis, oral commun., 1983). The general coincidence of gravity highs and aeromagnetic highs also suggests mafic intrusive rocks.
Alternatively, the gravity highs could be caused oy higher than normal densities of the Precambrian rocks, some of which have been elevated from midcrustal or lower crustal depths exposed in the core complexes. Either doming or thrusting could have elevated entire crustal sections to produce an overall density increase. Sufficient regional density information on Precambrian basement rocks is not yet available to test this hypothesis.
To the west of the belt of highs along the Colorado River, gravity highs and lows in the Mojave Desert region are moderate in amplitude and generally correlate with the positions of ranges and basins. The residual gravity field in the Basin and Range province just to the east of the wilder ness study area is also rather subdued.
Available seismic refraction data for nearby parts of Arizona offer few clues to the subsurface structure. Langston and Helmberger (1974) modeled a profile between the Nuclear Test Site, Nev. and Phoenix, Ariz., which passes about 45 mi east of the wilderness study area. In spite of an attempt to find indications of an intermediate-velocity lower crustal layer, they conclude that the data is most adequately
fit by a uniform crustal velocity of b.i km/s over a mantle velocity of 7.9 km/s at a depth of 30 Km.
Sinno and others (1981) analyzed a profile extending from Parker, Ariz. (20 mi south of the wilderness study area) to Globe, Ariz. and arrived at a different model: an upper crustal layer (v=6.05 km/s) to a depth of i4 Kin, a lower crustal layer (v=6.40 Km/s) to the Mono at 23- to 25-Km depth, with an upper mantle velocity under the Mono of 7.6 / km/s. A low-velocity layer mignt exist in the crust at about 10-km depth, but could not be verified from existing data. Sinno and his coautnors argue, on the oasis of the shallow Mono, low mantle velocity, and high heat flow, that the lithosphere in central Arizona has tninnea from 40 to 24 km in the past 5 m.y.
Densities of exposed units
Hand samples of the important lithologies were supplied by Keith tloward ana John Nakata for density measurements. The results of the measurements are shown in taole 3.
Samples of Precamorian gneisses and granitoid TOCKS have densities that range from 2.60 to 2.80 g/cm 3 and nave an average value of 2.t>9 g/cm . This is not far from the assumed Bouguer reduction density of 2.67 g/cm , althougn the collection of samples is probably not statistically repre sentative of the volumes present. There is a wiae variation in the densities of individual units. The Proterozoic augen gneiss and its protolitn has an average density of 2.66 g/cm , whereas a darK Precamwian quartz monzodiorite found in the vicinity of the large aeromagnetic high just south of the wilderness study area has an average of 2.76 g/cm .
The overall density of the crystalline basement exposed in the ranges is further complicated oy tne presence of dikes of Precambrian to Tertiary age, which may consti tute as much as 20 percent of the oasement volume. The more mafic of these dikes have densities that exceed the average gneissic density oy approximately 0.1 to 0.3 itable 3). Perhaps the high gravity anomalies over the stuay area and neighboring ranges are produced Dy these mafic igneous components. Similar dike swarms and mafic intrusions are found in the Chemehuevi, Sacramento, and western Whipple Mountains (Davis and others, 1982; John, 1982; Spencer and Turner, 1982).
The Tertiary volcanic materials consist of flows and poorly consolidated pyroclastic material. No density deter minations were made on the volcanic TOCKS, out determina tions from similar deposits in southern Arizona (Oppenaeiiner.. 1980) have values that range from 2.1o to 2.7a g/cm depending upon the percentage of unconsolidated material, with an average of 2.47 g/cm for 111 samples.
Sedimentary fill in basins can have a wide range of densities depending on the nature of the material, the degree of compaction, cementation, presence of ground water in the pore spaces, and age. Oppenheimer (1980) gives a range of densities from 1.81 g/cm to 2.58 g/cm 3 for 323 samples of Cenozoic basin fill from southern Arizona and an average value of 2.12 g/cm 3 . A oulk density log from a 12,a71-ft- deep well south of Tucson, Ariz. (Oppenheimer, 1980), shows densities of 2.1 g/cm near the surface increasing to values greater than 2.6 g/crn near the bottom, and an average value of 2.41 g/cm 3 . Maoey (1956, I960) and Rotstein and otners (1976) also discuss appropriate densities for oasins in the Mohave Desert area.
Gravity anomalies
The most important density contrast in tne study area is between sedimentary deposits, including those of volcanic origin, and the crystalline basement rocks exposed in tne ranges. As a result, gravity higns tend to overlie areas expos ing crystalline rocks, whereas the lows overlie the sediment- filled valleys. The coincidence of a broaa smooth aeromag netic low with a gravity low is another good indicator of tne presence of low-density, nonmagnetic sedimentary fill. As a rough estimate of the thicKness of sedimentary fill in a oasin, an infinite slab with a density contrast of 0.3 g/cm , would produce a 1-mGal anomaly for every 260 ft of thickness.
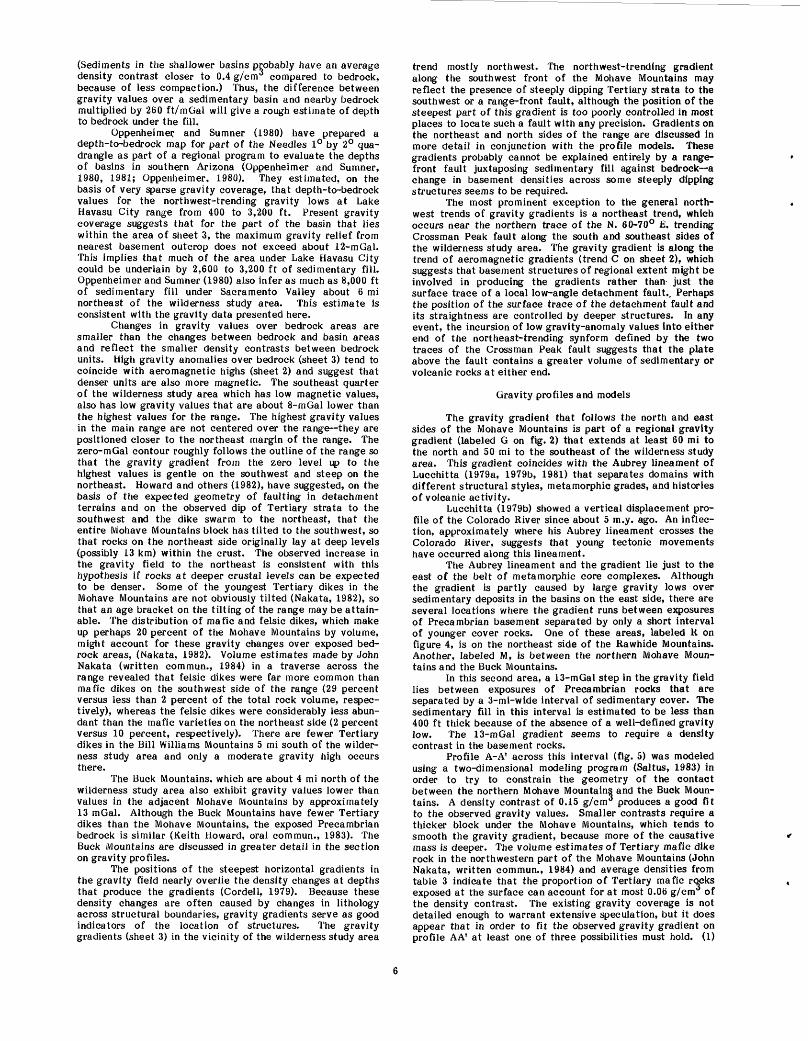
(Sediments in the shallower basins probably have an average density contrast closer to 0.4 g/cm compared to bedrock, because of less compaction.) Thus, the difference between gravity values over a sedimentary basin and nearby bedrock multiplied by 260 ft/mGal will give a rough estimate of depth to bedrock under the fill.
Oppenheimer. and Sumner (1980) have prepared a depth-to-bedrock map for part of the Needles 1° by 2° qua drangle as part of a regional program to evaluate the depths of basins in southern Arizona (Oppenheimer and Sumner, 1980, 1981; Oppenheimer. 1980). They estimated, on the basis of very sparse gravity coverage, that depth-to-bedrock values for the northwest-trending gravity lows at Lake Havasu City range from 400 to 3,200 ft. Present gravity coverage suggests that for the part of the basin that lies within the area of sheet 3, the maximum gravity relief from nearest basement outcrop does not exceed about 12-mGal. This implies that much of the area under Lake Havasu City could be underlain by 2,600 to 3,200 ft of sedimentary fill. Oppenheimer and Sumner (1980) also infer as much as 8,000 ft of sedimentary fill under Sacramento Valley about 6 mi northeast of the wilderness study area. This estimate is consistent with the gravity data presented here.
Changes in gravity values over bedrock areas are smaller than the changes between bedrock and basin areas and reflect the smaller density contrasts between bedrock units. High gravity anomalies over bedrock (sheet 3) tend to coincide with aeromagnetic highs (sheet 2) and suggest that denser units are also more magnetic. The southeast quarter of the wilderness study area which has low magnetic values, also has low gravity values that are about 8-mGal lower than the highest values for the range. The highest gravity values in the main range are not centered over the range they are positioned closer to the northeast margin of the range. The zero-mGal contour roughly follows the outline of the range so that the gravity gradient from the zero level up to the highest values is gentle on the southwest and steep on the northeast. Howard and others (1982), have suggested, on the basis of the expected geometry of faulting in detachment terrains and on the observed dip of Tertiary strata to the southwest and the dike swarm to the northeast, that the entire Mohave Mountains block has tilted to the southwest, so that rocks on the northeast side originally lay at deep levels (possibly 13 km) within the crust. The observed increase in the gravity field to the northeast is consistent with this hypothesis if rocks at deeper crustal levels can be expected to be denser. Some of the youngest Tertiary dikes in the Mohave Mountains are not obviously tilted (Nakata, 1982), so that an age bracket on the tilting of the range may be attain able. The distribution of mafic and felsic dikes, which make up perhaps 20 percent of the Mohave Mountains by volume, might account for these gravity changes over exposed bed rock areas, (Nakata, 1982). Volume estimates made by John Nakata (written commun., 1984) in a traverse across the range revealed that felsic dikes were far more common than mafic dikes on the southwest side of the range (29 percent versus less than 2 percent of the total rock volume, respec tively), whereas the felsic dikes were considerably less abun dant than the mafic varieties on the northeast side (2 percent versus 10 percent, respectively). There are fewer Tertiary dikes in the Bill Williams Mountains 5 mi south of the wilder ness study area and only a moderate gravity high occurs there.
The Buck Mountains, which are about 4 mi north of the wilderness study area also exhibit gravity values lower than values in the adjacent Mohave Mountains by approximately 13 mGal. Although the Buck Mountains have fewer Tertiary dikes than the Mohave Mountains, the exposed Precambrian bedrock is similar (Keith Howard, oral commun., 1983). The Buck Mountains are discussed in greater detail in the section on gravity profiles.
The positions of the steepest horizontal gradients in the gravity field nearly overlie the density changes at depths that produce the gradients (Cordell, 1979). Because these density changes are often caused by changes in lithology across structural boundaries, gravity gradients serve as good indicators of the location of structures. The gravity gradients (sheet 3) in the vicinity of the wilderness study area
trend mostly northwest. The northwest-trending gradient along the southwest front of the Mohave Mountains may reflect the presence of steeply dipping Tertiary strata to the southwest or a range-front fault, although the position of the steepest part of this gradient is too poorly controlled in most places to locate such a fault with any precision. Gradients on the northeast and north sides of the range are discussed in more detail in conjunction with the profile models. These gradients probably cannot be explained entirely by a range- front fault juxtaposing sedimentary fill against bedrock a change in basement densities across some steeply dipping structures seems to be required.
The most prominent exception to the general north west trends of gravity gradients is a northeast trend, which occurs near the northern trace of the N. 60-70° E. trending Crossman Peak fault along the south and southeast sides of the wilderness study area. The gravity gradient is along the trend of aeromagnetic gradients (trend C on sheet 2), which suggests that basement structures of regional extent might be involved in producing the gradients rather than- just the surface trace of a local low-angle detachment fault.. Perhaps the position of the surface trace of the detachment fault and its straightness are controlled by deeper structures. In any event, the incursion of low gravity-anomaly values into either end of the northeast-trending synform defined by the two traces of the Crossman Peak fault suggests that the plate above the fault contains a greater volume of sedimentary or volcanic rocks at either end.
Gravity profiles and models
The gravity gradient that follows the north and east sides of the Mohave Mountains is part of a regional gravity gradient (labeled G on fig. 2) that extends at least 60 mi to the north and 50 mi to the southeast of the wilderness study area. This gradient coincides with the Aubrey lineament of Lucchitta (1979a, 1979b, 1981) that separates domains with different structural styles, metamorphic grades, and histories of volcanic activity.
Lucchitta (1979b) showed a vertical displacement pro file of the Colorado River since about 5 m.y. ago. An inflec tion, approximately where his Aubrey lineament crosses the Colorado River, suggests that young tectonic movements have occurred along this lineament.
The Aubrey lineament and the gradient lie just to the east of the belt of metamorphic core complexes. Although the gradient is partly caused by large gravity lows over sedimentary deposits in the basins on the east side, there are several locations where the gradient runs between exposures of Precambrian basement separated by only a short interval of younger cover rocks. One of these areas, labeled R on figure 4, is on the northeast side of the Rawhide Mountains. Another, labeled M, is between the northern Mohave Moun tains and the Buck Mountains.
In this second area, a 13-mGal step in the gravity field lies between exposures of Precambrian rocks that are separated by a 3-mi-wide interval of sedimentary cover. The sedimentary fill in this interval is estimated to be less than 400 ft thick because of the absence of a well-defined gravity low. The 13-mGal gradient seems to require a density contrast in the basement rocks.
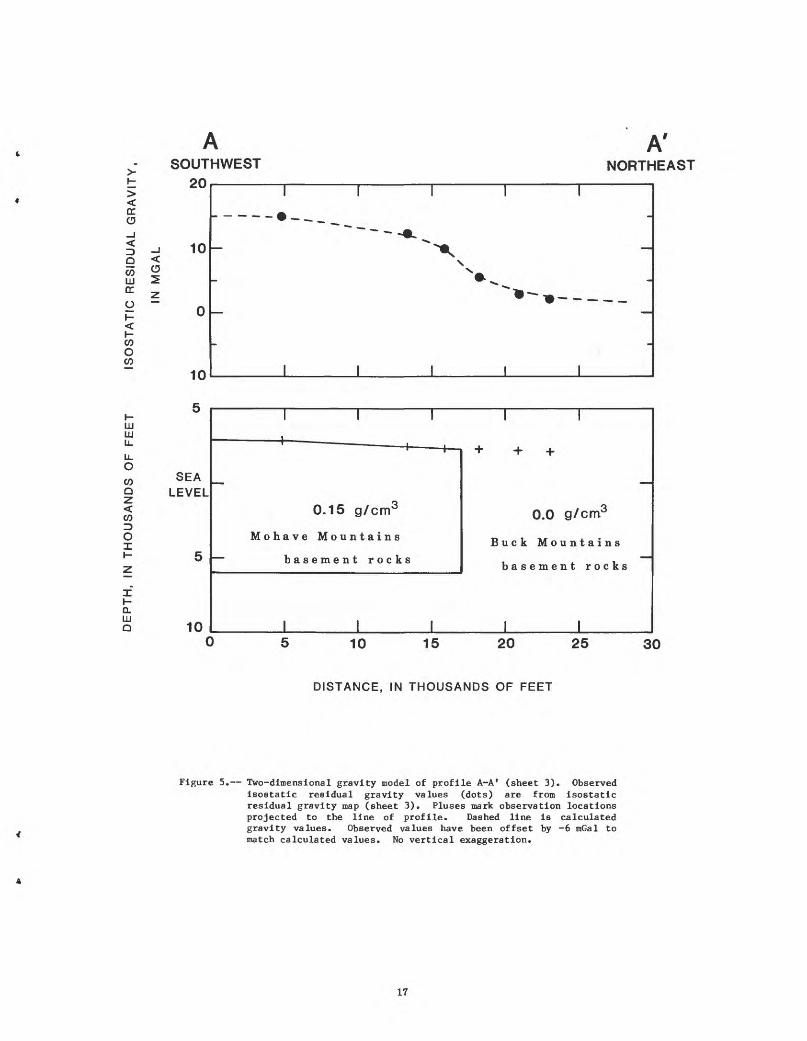
Profile A-A' across this interval (fig. 5) was modeled using a two-dimensional modeling program (Saltus, 1983) in order to try to constrain the geometry of the contact between the northern Mohave Mountains and the Buck Moun tains. A density contrast of 0.15 g/cm** produces a good fit to the observed gravity values. Smaller contrasts require a thicker block under the Mohave Mountains, which tends to smooth the gravity gradient, because more of the causative mass is deeper. The volume estimates of Tertiary mafic dike rock in the northwestern part of the Mohave Mountains (John Nakata, written commun., 1984) and average densities from table 3 indicate that the proportion of Tertiary mafic rocks exposed at the surface can account for at most 0.06 g/cm of the density contrast. The existing gravity coverage is not detailed enough to warrant extensive speculation, but it does appear that in order to fit the observed gravity gradient on profile AA1 at least one of three possibilities must hold. (1)

There must be a greater proportion of Tertiary mafic material in the subsurface. (2) There must be a difference in average density of the Precambrian rocks forming the north eastern part of the Mohave Mountains compared to those forming the Buck Mountains, either because of lithologic variations or because of a higher grade of metamorphism in the rocks of the Mohave range reflecting their origin at greater crustal depth. (3) Or rocks exposed in either range could be part of a thin allochthouous plate with the true causative density contrasts underlying the plate or plates. The gravity gradient across A-A1 has been fitted by a steeply dipping contact at the end of a semi-infinite slab 8,000 ft thick (fig. 5). The direction of the steep dip on the contact cannot be specified on the basis of the available gravity data the dip of the contact is only constrained by the modeling to about 30° from vertical.
A second profile B-B' about 3 mi to the east was modeled (fig. 6) with the help of depth-to-bedrock estimates obtained from Schlumberger electrical soundings (R. J. Bisdorf and J. K. Otton, written commun., 1983). Using reasonable estimates for the sediment densities, much of the low anomaly that lies over the Dutch Flat area can be explained by the thicknesses of sedimentary fill estimated from the electrical soundings. However, the sharp gradient that occurs over the range front cannot be easily accounted for by sediments alone. The 10-mGal of gravity relief at the range front would require an approximately 2,000-ft thickness of sedimentary fill within 0.5 mi of the range front. This is far more than the electrical soundings indicate. Again, a density contrast between basement units must be assumed to explain the observed gravity gradient. The model used in figure 6 shows the contact dipping under the range, which helps the fit slightly, but as before, all that can be said with certainty is that the dip appears to be steep.
The detachment geometry model proposed by Howard and others (1982), in which low-angle normal (detachment) faults structurally separate the Mohave and Buck ranges, does not fit the fault geometry shown in figure 6. It is, of course, possible that the Mohave Mountains and Buck Mountains do stand in an upper plate-lower plate detachment relation, but the gravity data would still seem to require a steeply dipping contact separating domains of different density, starting at depths probably not greater than 1,000-2,000 ft and extending to depths of 7,000-10,000 ft (assuming a contrast of 0.15 to 0.1 g/cm**). If low-angle normal faulting is the case, the near-coincidence of the proposed surface trace of this fault with the position of the steeply dipping density contrast still needs to be explained.
The curvature of the gravity gradient (fig. 4) makes a strike-slip fault unlikely. It could perhaps mark a normal or reverse fault contact. A belt of thrust faulting associated with Laramide (Cretaceous and Early Tertiary) deformation has been proposed to run through the region in which the wilderness study area lies (Drewes, 1978; Keith, 1979; Keith, 1980; Reynolds and others, 1980). A large northwest-trending reverse fault in the Rawhide and Buckskin Mountains is inferred to have a middle or late Tertiary age (Shackelford, 1976; Reynolds, 1980; Otton, 1981) since it cuts the low-angle detachment surface. Most authors prefer an extensional origin for detachment faulting, but it is interesting to specu late that the detachment process and the doming of the core complexes were somehow caused by middle Miocene compres sion that perhaps reactivated older structures related to earlier compressional events rather than by underlying exten sion. In a compressional environment, the more deformed and tilted rocks of the Mohave Mountains may have been thrust up a ramp with the less deformed rocks of the Buck Moun tains in the footwall of the fault. The.importance of a thrust relation for mineral resources, though speculative, lies in the possibility that the exposed Precambrian rocks of the wilder ness study area may overlie younger rocks, including even the Paleozoic sedimentary section.
CONCLUSIONS
1. The aeromagnetic anomalies within the wilderness study area are in agreement with susceptibilities measured from samples collected on the ground. Basement types exhibit a
wide range of magnetization values. Most of the positive aeromagnetic anomalies in and around the wilderness study area are attributed to Precambrian gneisses and granitoids or to Tertiary igneous rocks.
2. Negative magnetic anomalies along the northeastern side of the wilderness study area (sheet 1) are greatly attenuated when the magnetic field is reduced to the pole (sheet 2), suggesting that these lows are largely polarization effects rather than indicators of alteration that has destroyed mag netite.
3. The generally lower levels of aeromagnetic intensity in the southeast corner of the wilderness study area that remain even after reduction-to-the-pole could reflect less magnetic Precambrian lithologies, less magnetic Tertiary dikes, or diffuse alteration that has destroyed magnetite. A small overlap between this area of low aeromagnetic intensity and areas of alteration is defined by Light and others (1983b, fig. 3) on the basis of remote sensing and geochemistry.
4. Regional northeast-trending lineaments defined by the aeromagnetic data pass just to the north and south of the wilderness study area. These lineaments may overlie funda mental zones of weakness in the Precambrian basement, because they lie along the strike of northeast-trending base ment structures described on the Colorado Plateau and in the Colorado mineral belt. In these areas the zones of weakness have localized later intrusions and mineralization.
5. Shorter northwest-trending lineaments are also apparent in the aeromagnetic data. These trends seem to be related to tilted blocks of Precambrian and volcanic rocks in an upper plate context. These blocks were presumably tilted as they slumped down listric normal faults that merged into the extensive subhorizontal detachment surface (or surfaces) so that the northwest-trending aeromagnetic grain is indirectly reflecting the presence of these listric normal faults. The consistency of this grain over a wide area reflects the remarkable consistency of strike for these listric normal faults.
6. A moderate isostatic residual gravity high (10-12 mGal) exists over the wilderness study area. The highest gravity values occur along the northeastern flank of the Mohave Mountains and are offset about 1 to 2 mi northeast of the crest of the range. The range appears to have been tilted on its side as a large block with greater original depths of burial toward the northeast (Howard and others, 1982). The higher densities implied along the northeastern flank may reflect higher grades of metamorphism correlating with an estimated original depth in the crust on the order of 10 km; higher densities may also be caused by numerous Tertiary mafic dikes.
7. A sharp west- to northwest-trending gravity gradient follows along the north and northeast sides of the Mohave Mountains. The high gravity values over the Mohave Moun tains drop across this gradient to more normal regional values in the Buck Mountains about 3 mi to the north. Two-dimen sional gravity models across this gradient require the presence of a steeply dipping basement density contrast under this gradient, extending to depths on the order of 7,000-10.000 ft (for assumed density contrasts of 0.15 to 0.1 g/cnV3 ).
Sedimentary fill under Dutch Flat may account for part of the gradient, but is not thick enough close to the range front to completely explain it. A steeply dipping density contrast in the basement at the range front seems to be required. Because the gradient continues to the north and southeast for many miles, separates different geologic domains (Lucchitta, 1979a), and parallels a proposed thrust-fault belt (Drewes, 1978), it probably indicates a significant tectonic boundary. If the gradient marks a reverse fault along the north and northeast margins of the wilderness study area, then younger rocks, including the Paleozoic sedimentary section, may exist at depth under the wilderness study area.

8. A northeast-trending gradient along the southern part of the wilderness study area is close to the northern trace of the Crossman Peak detachment fault. The lower gravity values to the south of the gradient probably reflect absence of Tertiary mafic dikes and the presence of sedimentary and volcanic units in the upper plate rocks above the Crossman Peak detachment. A northeast-trending aeromagnetic linea ment close to this gradient suggests that basement structure may control the location of the surface trace of the Cross man Peak fault.
REFERENCES CITED
Aiken, C.L.V., 1975, Residual Bouguer gravity anomaly map of Arizona: Laboratory of Geophysics, Department of Geosciences, University of Arizona, Tucson, scales 1:500,000 and 1:1,000,000.
Aiken, C.L.V., 1976, Analysis of the gravity anomalies in Arizona: Tucson, Ariz., University of Arizona, Ph.D. dissertation, 127 p.
Aiken, C.L.V., Lysonski, J.C.. Sumner, J.S., and Hahman, W.R., Sr., 1981, A series of 1:250,000 complete residual Bouguer gravity anomaly maps of Arizona: Arizona Geological Society Digest, v. 13, p. 31-38.
Armstrong, R.L., 1982, Cordilleran metamorphic core complexes from Arizona to southern Canada: Annual Review of Earth and Planetary Science, v. 10, 129-154.
Baranov, V., 1957, A new method for interpretation of aeromagnetic maps: Pseudo-gravimetric anomalies: Geophysics, v. 22, p. 359-383.
Baranov, V., and Naudy, H., 1964, Numerical calculation of the formula of reduction to the magnetic pole: Geophysics, v. 29, p. 67-79.
Brill, K.G., Jr., and Nuttli, O.W., 1983, Seismicity of the Colorado lineament: Geology, v. 11, p. 20-24.
Byerly, P.E., and Stolt, R.H., 1977, An attempt to define the Curie point isotherm in northern and central Arizona: Geophysics, v. 42, p. 1394-1400.
Chapman, R.H., and Rietman, J.D., 1978, Bouguer gravity map of California, Needles sheet: California Division of Mines and Geology, scale 1:250,000.
Coney, P.J., 1980, Cordilleran metamorphic core complexes: an overview, m Crittenden, M.D., Jr., Coney, P.J., and Davis, G.H., eds., 1980, Cordilleran metamorphic core complexes: Geological Society of America Memoir 153, p. 7-31.
Cordell, Lindrith, 1979, Gravimetric expression of graben faulting in Santa Fe County and the Espanola Basin, New Mexico: New Mexico Geologic Society Guidebook, 30th Field Conference, Santa Fe County, p. 5.9-64.
Davis, G.A., Anderson, J.L., Frost, E.G., Shackelford, T.J., 1980, Mylonitization and detachment faulting in the Whipple-Buckskin-Rawhide Mountains terrane, southeastern California and western Arizona, in Crittenden, M.D., Jr., Coney, P.J., and Davis, G.H., eds., 1980, Cordilleran metamorphic core complexes: Geological Society of America Memoir 153, p. 79-129.
Davis, G.A., Anderson, J.L., Martin, D.L., Krummenacher, Daniel, Frost, E.G., and Armstrong, R.L., 1982, Geologic and geochronologic relations in the lower plate of the Whipple detachment fault, Whipple Mountains, southeastern California: A progress report; HI Frost, E.G., and Martin, D.L., eds., Mesozoic- Cenozoic tectonic evolution of the Colorado River region, California, Arizona, and Nevada: San Diego, Cordilleran Publishers, p. 408-432.
Davis, G.H., 1978, Monocline fold pattern of the Colorado Plateau, jn Matthews, Vincent III, ed., Laramide folding associated with basement block faulting in the western United States: Geological Society of America Memoir 151, p. 215-233.
Drewes, Harald, 1978, The Cordilleran erogenic belt between Nevada and Chihuahua: Geological Society of America Bulletin, v. 89, p. 641-657.
Frost. E.G., and Martin, D.L., 1982, Comparison of Mesozoic compressional tectonics with mid-Tertiary detachment faulting in the Colorado River area, California,
Arizona, and Nevada, m Cooper, J.D., compiler, Guidebook Geologic excursions in the California desert: 78th Annual Meeting of the Cordilleran Section of the Geological Society of America, Anaheim, Calif., April 19-21, 1982, p. 113-159.
Gage, T.B., and Simpson, R.W., 1983, Principal facts for 904 gravity stations in and near the Chemehuevi Mountains and Crossman Peak Wilderness Study Areas, San Bernardino County, California, and Mohave County, Arizona: U.S. Geological Survey Open-File Report 83-806, 33 p.
Geodata International, Inc., 1979, Aerial radiometric and magnetic survey, Needles national topographic map, California and Nevada: U.S. Department of Energy Report GJ BX-114 (79).
Grant, F.S., and West, G.F., 1965, Interpretation theory in applied geophysics: New York, McGraw-Hill Book Co., 584 p.
Harland, W.B., Cox, A.V., Llewellyn, P.G., Pickton, C.A.G., Smith, A.G., and Walters, R., 1982, A geologic time scale: Cambridge, Cambridge University Press, 131 p.
Heiskanen, W.A., and Moritz, Helmut, 1967, Physical geodesy: San Francisco, W. H. Freeman, 364 p.
Hildenbrand, T.G., 1983, FFTFIL: a filtering program based on two-dimensional Fourier analysis of geophysical data: U.S. Geological Survey Open-File Report 83-237, 61 p.
Hildenbrand, T.G., and Kucks, R.P., 1982, A description of colored gravity maps of the Basin and Range province, southwestern United States: U.S. Geological Survey Open-File Report 82-500, 10 p.
Hildenbrand, T.G., and Kucks, R.P., 1983, Digital colored magnetic-anomaly map of the Basin and Range province: U.S. Geological Survey Open-File Report 83-189, 17 p.
Howard, K.A., Goodge, J.W., and John, B.E., 1982, Detached crystalline rocks of the Mohave, Buck, and Bill Williams Mountains, western Arizona, in Frost, E.G., and Martin, D.L., eds., Mesozoic-Cenozoic tectonic evolution of the Colorado River region, California, Arizona, and Nevada: San Diego, Cordilleran Publishers, p. 377-392.
Howard, K.A., and John, B.E., 1983, Extensional faulting through the upper crust, California-Arizona border abs. : Geological Society of America Abstracts with Programs, v. 15, no. 5, p. 309.
International Association of Geodesy, 1971, Geodetic reference system 1967: International Association of Geodesy Special Publication 3, 116 p.
John, B.E., 1982, Geologic framework of the Chemehuevi Mountains, southeastern California: hi Frost, E.G., and Martin, D.L., eds., Mesozoic-Cenozoic tectonic evolution of the Colorado River region, California, Arizona, and Nevada: San Diego, Cordilleran Publishers, p. 317-325.
John, B.E., and Howard, K.A., 1982, Multiple low-angle Tertiary faults in the Chemehuevi and Mohave Mountains, California and Arizona [abs.]: Geological Society of America Abstracts with Programs, v. 14, p. 175-176.
Keith, S.B., 1979, The great southwestern Arizona overthrust oil and gas play: Fieldnotes from the State of Arizona, Bureau of Geology and Mineral Technology, v. 9, no. 1, p. 10-14.
Keith, S.B., 1980, The great southwestern Arizona overthrust oil and gas play drilling commences: Fieldnotes from the State of Arizona, Bureau of Geology and Mineral Technology, v. 10, no. 1, p. 1-8.
Kelley, V.C., 1955, Regional tectonics of the Colorado Plateau and relationship to the origin and distribution of uranium: University of New Mexico Publications in Geology, no. 5, 120 p.
Kelley, V.C., and Clinton, N.J., 1960, Fracture systems and tectonic elements of the Colorado Plateau: University of New Mexico Publications in Geology, no. 6, 104 p.
Klein, D.P., 1982, Regional gravity and magnetic evidence for a tectonic weakness across southwestern Arizona, in Frost, E.G., and Martin, D.L., eds., Mesozoic-Cenozoic

tectonic evolution of the Colorado Kiver region. California, Arizona, and Nevada: San Diego, Cordilleran Publishers, p. 61-67.
Langston, C.A., and Helmberger, D.V., 1974, Interpretation of body and Rayleigh waves from NTS to Tucson: Bulletin of the Seismological Society of America, v. 64, p. 1919-1929.
Light, T.D., Chazin, Barbara, and Detra, D.E., 1983a, Geochemical data for the Crossman Peak Wilderness Study Area (5-7B), Mohave County, Arizona: U.S. Geological Survey Open-File Report 83-581, 36 p.
Light, T.D., Marsh, S.P., and Kaines, G.L., 1982, Mineralization in the Crossman Peak area, Mohave Mountains, Arizona jabs.]: Geological Society of America Abstracts with Programs, v. 14, no. 4, p. 180-181.
Light, T.D., and McDonnell, J.R., Jr., 1983, Mineral investigation of the Crossman Peak Wilderness Study Area, Mohave County, Arizona: U.S. Bureau of Mines Open-File Report MLA 82-83, 133 p.
Light, T.D., Pike, J.E., Howard, K.A., McDonnell, J.R., Jr., Simpson, R.W., Raines, G.L., Knox, R.D., Wilshire, H.G., and Pernokas, M.A., 1983b, Mineral resource potential map of the Crossman Peak Wilderness Study Area (5-7B), Mohave County, Arizona: U.S. Geological Survey Miscellaneous Field Studies Map MF-1602-A, scale 1:48,000.
Lucchitta. Ivo, 1979a, Origin of a regional northwest-trending lineament, west-central Arizona [abs.]: Geological Society of America Abstracts with Programs, v. 11, no. 3, p. 89.
Lucchitta, Ivo, 1979b, Late Cenozoic uplift of the southwestern Colorado Plateau and adjacent lower Colorado River region: Tectonophysics, v. 61, p. 63-95.
Lucchitta, Ivo, and Suneson, Neil, 1981, Observations and speculations regarding the relations and origins of mylonitic gneiss and associated detachment faults near the Colorado Plateau boundary in western Arizona: U.S. Geological Survey Open-File Report 81-503, p. 53-55.
Lysonski, J.C., 1980, The IGSN71 residual Bouguer gravity anomaly map of Arizona: Tucson, Ariz., University of Arizona, M.S. thesis, 74 p.
Lysonski, J.C., Aiken, C.L.V., and Sumner, J.S., 1981, The complete residual Bouguer gravity anomaly map Needles: Arizona Bureau of Geology and Mineral Technology, Tucson, Arizona, scale 1:250,000.
Lysonski, J.C., Sumner, J.S., Aiken, C.L.V., and Schmidt, J.S., 1980, The complete residual Bouguer gravity anomaly map of Arizona (IGSN71): Laboratory of Geophysics, Department of Geosciences, University of Arizona, Tucson, scales 1:500,000 and 1:1,000,000.
Mabey, D.R., 1956, Geophysical studies in the intermontane basins of southern California: Geophysics, v. 21, p. 839-853.
Mabey, D.R., 1960, Gravity survey in the western Mojave Desert, California: U.S. Geological Survey Professional Paper 316-D, p. D50-D73.
Morelli, C., ed., 1974, The international gravity standardization net, 1971: International Association of Geodesy Special Publication, no. 4, 194 p.
Nakata, J.K., 1982, Preliminary report on diking events in the Mohave Mountains, Arizona, in Frost, E.G., and Martin, D.L., eds., Mesozoic-Cenozoic tectonic evolution of the Colorado River region, California, Arizona, and Nevada: San Diego, Cordilieran Publishers, p. 85-90.
Oliver, H.W., ed., 1980, Interpretation of the gravity map of California: California Division of Mines and Geology Bulletin 205, 52 p.
Oliver, H.W., Chapman, R.H., Biehler, Shawn, Robbins, S.L., Hanna, W.F., Griscom, Andrew, Beyer, L.A., and Silver, E.A., 1980, Gravity map of California and its continental margin: California Division of Mines and Geology, Geologic Data Map Series, Map 3, scale 1:750,000.
Oppenheimer, J.M., 1980, Gravity modeling of the alluvial basins, southern Arizona: Tucson, Ariz., University of Arizona, M.S. thesis, 81 p.
Oppenheimer, J.M., and Sumner, J.S., 1980, Depth-to-bedrock map, Basin and Range province, Arizona: Laboratory of Geophysics, Department of Geosciences, University of Arizona, Tucson, scales 1:250,000, 1:500,000, and 1:1,000,000.
Oppenheimer, J.M., and Sumner, J.S., 1981, Gravity modeling of the basins in the Basin and Range province. Arizona: Arizona Geological Society Digest, v. 13, p. 111-116.
Otton, J.K., 1981, Structural geology of the Date Creek Basin area, west-central Arizona, ui Tectonic framework of the Mojave and Sonoran Deserts, California and Arizona: U.S. Geological Survey Open-File Report 81-503, p. 82-84.
Pike, J.E.N., 1983, Composition of Tertiary volcanic rocks, Mohave Mountains, Arizona [abs.]: Geological Society of America Abstracts with Programs, v. 15, no. 5, p. 304.
Pike, J.E.N., and Hansen, V.L., 1982, Complex Tertiary stratigraphy and structure, Mohave Mountains, Arizona: A preliminary report, m Frost, E.G., and Martin, D.L.^ eds., Mesozoic-Cenozoic tectonic evolution of the Colorado River region, California, Arizona, and Nevada: San Diego, Cordilleran Publishers, p. 91-96.
Plouff, D., 1977, Preliminary documentation for a FORTRAN program to compute gravity terrain corrections based on topography digitized on a geographic grid: U.S. Geological Survey Open-File Report 77-534, 45 p.
Raines, G.L., 1983, Preliminary map of limonitic hydrothermal alteration for portions of the Needles 1° x 2° quadrangle, Arizona and California: U.S. Geological Survey Open-File Report 83-421, scale 1:250,000.
Reynolds, S.J., 1980, Geologic framework of west-central Arizona, in Jenney, J.P., and Stone, Claudia, eds., Studies in western Arizona: Arizona Geological Society Digest, v. 12, p. 1-16.
Reynolds, S.J., Keith, S.B.. and Coney, P.J., 1980, Stacked overthrusts of Precambrian crystalline basement and inverted Paleozoic sections emplaced over Mesozoic strata, west-central Arizona, HI Jenney, J.P., and Stone, Claudia, eds., Studies in western Arizona: Arizona Geological Society Digest, v. 12, p. 45-51.
Roberts, C.W., Jachens, R.C., and Oliver, H.W., 1981, Preliminary isostatic residual gravity map of California: U.S. Geological Survey Open-File Report 81-573, 5 sheets, scale 1:750,000.
Rotstein, Y., Combs, J., and Biehler, S., 1976, Gravity investigation in the southeastern Mojave Desert, California: Geological Society of America Bulletin, v. 87, p. 981-993.
Saltus, R.W., 1983, Hypermag an interactive, two- dimensional gravity and magnetic modeling program: U.S. Geological Survey Open-File Report 83-241, 28 p. and appendices.
Saltus, R.W., 1984, A description of colored gravity and terrain maps of the southwestern Cordillera: U.S. Geological Survey Open-File Report 84-95, 9 p.
Sauck, W.A., 1972, Compilation and preliminary interpretation of the Arizona aeromagnetic map: Tucson, Ariz., University of Arizona, Ph.D. dissertation, 161 p.
Sauck, W.A., and Sumner. J.S., 1970, Residual aeromagnetic map of Arizona: Laboratory of Geophysics, Department of Geosciences, University of Arizona, Tucson, scales 1:500,000 and 1:1,000,000.
Shackelford, T.J., 1976, Structural geology of the Rawhide Mountains, Mohave County, Arizona: Los Angeles, Calif., University of Southern California, Ph.D. dissertation, 175 p.
Shoemaker, E.M., Squires, R.L., and Abrams, M.J., 1978, Bright Angel and Mesa Butte fault systems of northern Arizona, m Smith, R.B., and Eaton, G.P., eds., Cenozoic tectonics and regional geophysics of the
Western Cordillera: Geological Society of America Memoir 152, p. 341-367.
Silver, L.T., and Anderson, T.H., 1983, Further evidence and analysis of the role of the Mojave-Sonora megashear(s) in Mesozoic Cordilleran tectonics [abs.]: Geological Society of America Abstracts with Programs, v. 15, no. 5, p. 273.
Simpson, R.W., Jachens, R.C., and Blakely, R.J., 1983a, AIRYROOT: a FORTRAN program for calculating the gravitational attraction of an Airy isotatic root out to 166.7 km: U.S. Geological Survey Open-File Report 83-883, 66 p.
Simpson, . R.W., Saltus, R.W., Jachens, R.C., and Godson, R.H., 1983b, A description of colored isostatic gravity maps and a topographic map of the conterminous United States available as 35 mm slides: U.S. Geologi cal Survey Open-File Report 83-884, 16 p.
Sinno, Y.A., Keller, G.R., and Sbar, M.L., 1981, A crustal seismic refraction study in west-central Arizona: Journal of Geophysical Research, v. 86, p. 5023-5038.
Spencer, J.E., and Turner, R.D., 1982, Dike swarms and low- angle faults, Homer Mountain and the northwestern Sacramento Mountains, southeastern California, in Frost E.G., and Martin, D.L., eds., Mesozoic-Cenozoic tectonic evolution of the Colorado River region, California, Arizona, and Nevada: San Diego, Cordilleran Publishers, p. 97-107.
Tweto, Ogden, and Sims, P.K., 1963, Precambrian ancestry of
the Colorado mineral belt: Geological Society ofAmerica Bulletin, v. 74, p. 991-1014.
U.S. Geological Survey, 1981, Aeromagnetic map of theNeedles 1° by 2" quadrangle, California and Arizona:U.S. Geological Survey Open-File Report 81-85, scale1:250,000.
Vacquier, V., Steenland, N.C., Henderson, R.G., and Zietz, I.,1951, Interpretation of aeromagnetic maps:Geological Society of America Memoir 47, 151 p.
Warner, L.A., 1978, The Colorado lineament a middlePrecambrian wrench fault system: Geological Societyof America Bulletin, v. 89, p. 161-171.
Webring, Michael, 1981, M1NC: a gridding program based onminimum curvature: U.S. Geological Survey Open-FileReport 81-1224, 41 p.
West, R.E., 1972, A regional Bouguer gravity anomaly map ofArizona: Tucson, Ariz., University of Arizona, Ph.D.dissertation, 186 p.
Wilshire, H.G., Reneau, S.L., Schellentragor, G.W., andBarmore, R.L., 1983, Quaternary geomorphology of theMohave Mountains, western Arizona [abs]: GeologicalSociety of America Abstracts with Programs, v. 15,no. 5, p. 387.
Zietz, Isidore, 1982, Composite magnetic anomaly map of theUnited States Part A: conterminous United States:U.S. Geological Survey Geophysical Investigations MapGP-954-A, scale 1:2,500,000.
10
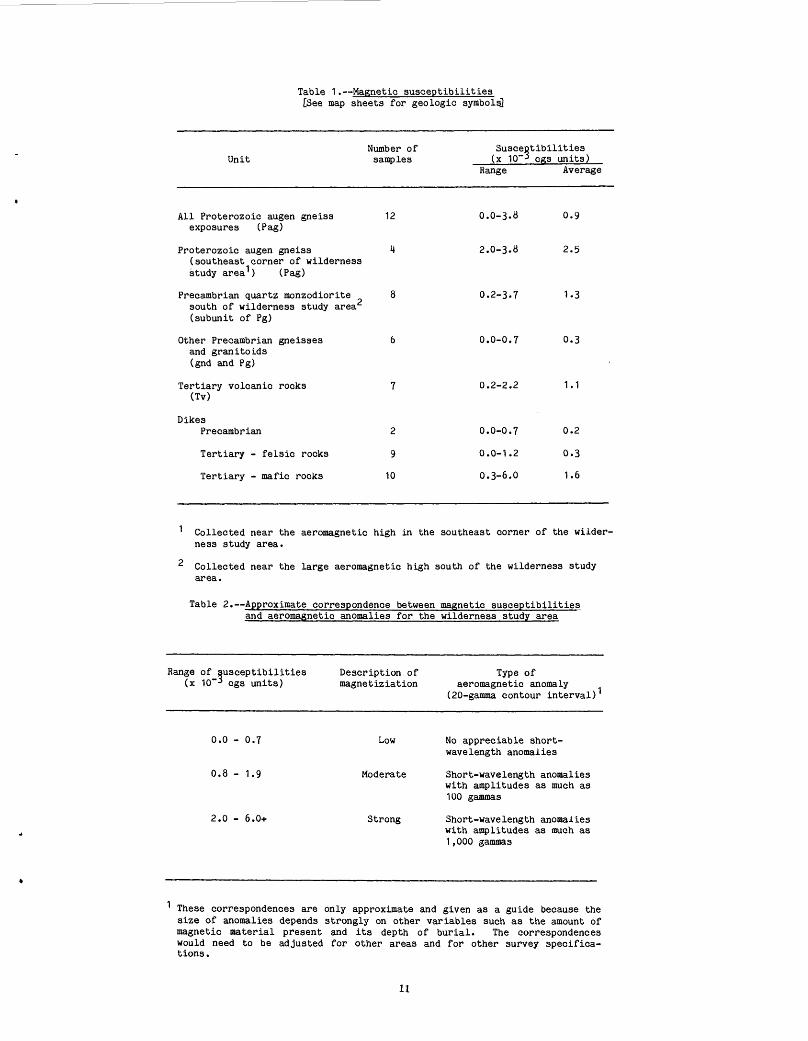
Table 1. Magnetic susceptibilities [See map sheets for geologic symbols]
UnitNumber of samples
Susceptibilities (x 10~3 cgs units)
Range Average
All Proterozoic augen gneiss 12 0.0-3.8 0.9 exposures (Pag)
Proterozoic augen gneiss 4 2.0-3.8 2.5 (southeast corner of wilderness study area') (Pag)
Precambrian quartz monzodiorite 8 0.2-3.7 1.3 south of wilderness study area (subunit of Pg)
Other Precambrian gneisses 6 0.0-0.7 0.3 and granitoids (gnd and Pg)
Tertiary volcanic rocks 7 0.2-2.2 1.1 (Tv)
DikesPrecambrian 2 0.0-0.7 0.2
Tertiary - felsic rocks 9 0.0-1.2 0.3
Tertiary - mafic rocks 10 0.3-6.0 1.6
1 Collected near the aeromagnetic high in the southeast corner of the wilder ness study area.
2 Collected near the large aeromagnetic high south of the wilderness study area.
Table 2. Approximate correspondence between magnetic susceptibilities and aeromagnetic anomalies for the wilderness study area
Range of susceptibilities Description of Type of(x 10~3 cgs units) magnetiziation aeromagnetic anomaly
(20-gamma contour interval)
0.0 - 0.7 Low No appreciable short- wavelength anomalies
0.8 - 1.9 Moderate Short-wavelength anomalieswith amplitudes as much as 100 gammas
2.0 - 6.0+ Strong Short-wavelength anomalieswith amplitudes as much as 1,000 gammas
These correspondences are only approximate and given as a guide because the size of anomalies depends strongly on other variables such as the amount of magnetic material present and its depth of burial. The correspondences would need to be adjusted for other areas and for other survey specifica tions .
11

Table 3. Densities [See map sheets for geologic symbols]
UnitNumber of samples
Densities (g^cm3 )
Range Average
Proterozoic augen gneiss (Pag)
Precambrian quartz monzodiorite south of the wilderness study area 1 (subunit of gnd)
Other Precambrian gneisses and granitoids (gnd and Pg)
11 2.60-2.76 2.6b
2.69-2.80 2.76
2.63-2.72 2.65
Tertiary volcanics
Dikes:
Precambrian
Tertiary - felsic rocks
Tertiary - mafic rocks
Cenozoic sedimentary fill in basins2
111
7
11
10
323
2.15-2.75
2.91-3.01
2.50-2,67
2.79-2.96
1.81-2.58
2.U7
2.96
2.61
2.1*6
2.12
Collected near the large aeromagnetic high south of the wilderness study area
2 Western Arizona; from Oppenheimer (1980).
12
114° 00'
34°45' -
34°30' -
CROSSMAN PEAK WILDERNESS STUDY
AREA
Figure 1. Location of Crossman Peak Wilderness Study Area (5-7B), Mohave County, Ariz.
13

1 1
5°
00'
14
°30
'13°3
0'
S i^"
"^
<P
""fc-' ,*
*
^~
^
5
%
Are
ao
fsh
ee
ts
1-
ST
EP
LA
DD
ER
M
OU
NT
AIN
S'
xH.i(-
BU
CK
^
J: M
OU
NT
AIN
S-i
'^
"'"i
/liii
///«
/ ?
'//
'-^M
OH
AV
E"^
MOU
NTAI
NS i
AR
TIL
LE
RY
M
OU
NT
AIN
SR
AW
HID
E
^\»H
""//
X
MO
UN
TA
INS
\""
<i,
~
',,
..\
*
'
' I
I I
I '
\x
x ^^i
^\ \
v
' * *
WH
IPP
LE
'''^
/V^N
o^ '"
'"""
""//
, M
OU
NT
AIN
S
' f//f ^
"""M
dilU
H^
MO
UN
TA
IN
RIV
ER
SID
E ^
ll"
Figu
re 2. Lo
cati
ons
of geographic fe
atur
es di
scus
sed
in th
e text.

114° 22.5' 114° 00'
34° 45'
34°
22.5'
10 KILOMETERS
10 MILES
Figure 3. leoetatlc regional gravity field for map area of sheet 3 based on local Airy-Heiskanen model of compensation with depth to bottom of root at 25 km for sea-level elevations, density contrast across bottom of root O.A g/cm . Contour interval is 2 mGal. Area same as sheet 3. Thia regional gravity field was subtracted from Bouguer gravity field to give isostatic residual gravity field shown on sheet 3. Details of preparation given in text.
15
116' 115' 114' 113'36'
35'
34'
33'
100 KILOMETERS
100 MILES _I
Figure A. Isostatic residual gravity field for region around present study area. Isostatic model same as figure 1. Map is based on data points spaced at A-km intervals and is extracted from isostatic residual map of United States described in Simpson and others (1983b). Contour interval 10 mGal; values greater than 0 mGal are shaded. Hachures indicate closed areas of lower gravity values. R, marks gradient near Rawhide Mountains; M, gradient north of Mohave Mountains; GG, extent of gradient. Boundary of map sheets shown as dashed rectangle.
16
H-
>
cco
<Q
COLUCC
O1-
1-coOCO
;SOUT
20
_j 10^o2>z
0
m
V A'HWEST NORTHEAST
I I I I I
~ ~ ~ "~~~~~ ~~--~ _
"^ \
_ w« » .^9 **~ *^ -_ _
w ~~
~ ~
'
I I I I I
111LULL
CO Q
CODOI
I I- Q.LU Q
u
SEALEVEL
5
10
I I I I I
h-
0.15 g/cm3
Mohave Mountains
basement rocks
+ + +
0.0 g/cm3
Buck Mountains
basement rocks
I I I I I10 15 20 25 30
DISTANCE, IN THOUSANDS OF FEET
Figure 5. Two-dimensional gravity model of profile A-A 1 (sheet 3). Observed isostatic residual gravity values (dots) are from isostatic residual gravity map (sheet 3). Pluses mark observation locations projected to the line of profile. Dashed line is calculated gravity values. Observed values have been offset by -6 mGal to match calculated values. No vertical exaggeration.
17
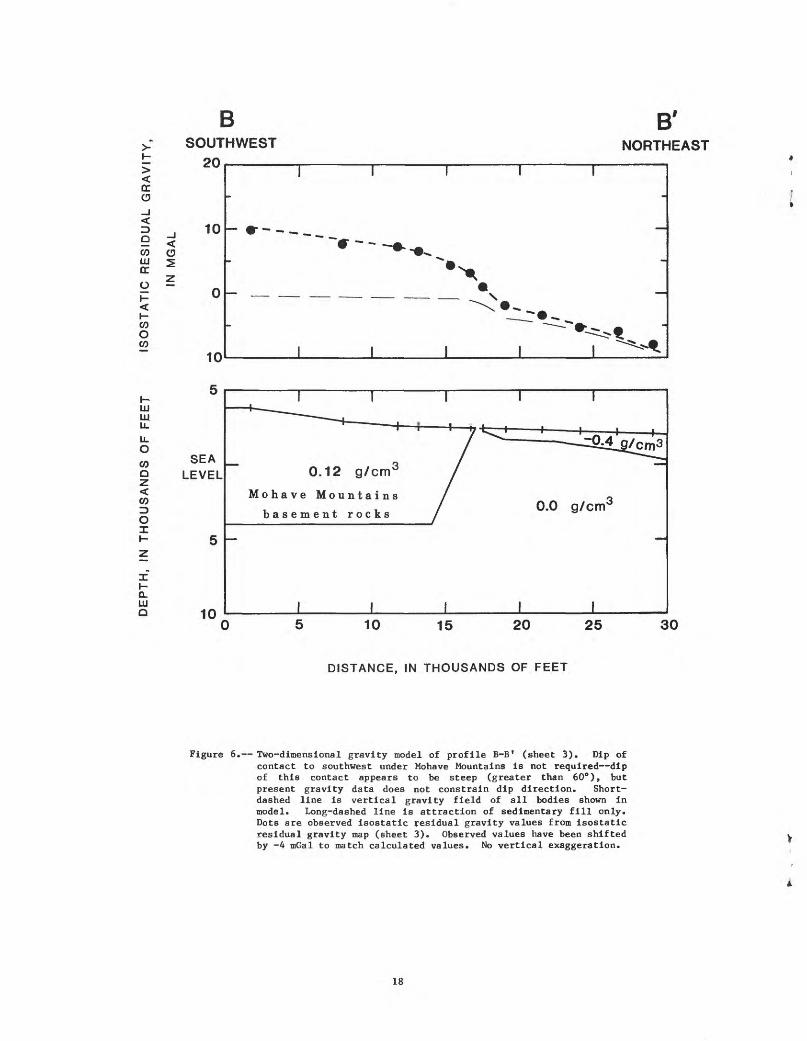
BSOUTHWEST
20
B'
NORTHEAST
oro
1 *CO O£ so ^
CO O CO
10
10
m m
COQ
CO3 oX
Q. UJ Q
0.12 g/cm
Mohave Mountains
basement rocks
10
DISTANCE, IN THOUSANDS OF FEET
Figure 6. Two-dimensional gravity model of profile B-B 1 (sheet 3). Dip of contact to southwest under Mohave Mountains is not required dip of this contact appears to be steep (greater than 60°), but present gravity data does not constrain dip direction. Short- dashed line is vertical gravity field of all bodies shown in model. Long-dashed line is attraction of sedimentary fill only. Dots are observed isostatic residual gravity values from isostatic residual gravity map (sheet 3). Observed values have been shifted by -4 mGal to match calculated values. No vertical exaggeration.
18