by order of the air force manual 65-502 secretary …
TRANSCRIPT

BY ORDER OF THE
SECRETARY OF THE AIR FORCE
AIR FORCE MANUAL 65-502
30 OCTOBER 2018
Financial Management
INFLATION
COMPLIANCE WITH THIS PUBLICATION IS MANDATORY
ACCESSIBILITY: Publications and forms are available for downloading or ordering on the
e-Publishing website at www.e-Publishing.af.mil.
RELEASABILITY: There are no releasability restrictions on this publication.
OPR: SAF/FMCE
Supersedes: AFI 65-502, 13 May 2015
Certified by: SAF/FMC
(Ms. Pamela C. Schwenke)
Pages: 29
This manual implements AFPD 65-5, Cost and Economics, by setting guidelines for inflation
adjustments in the Air Force Planning, Programming, Budgeting and Execution System (PPBES)
and other Air Force analysis/reporting. It applies to individuals/organizations at all levels who
apply inflation as described in this manual, including Air Force Reserve and Air National Guard
(ANG) units, except where noted otherwise. This manual dictates how to apply the inflation and
escalation rates provided by the Office of the Under Secretary of Defense (Comptroller)
(OUSD(C)) and describes how the Deputy Assistant Secretary of the Air Force for Cost and
Economics (SAF/FMC) generates inflation indices and distributes them to the field for converting
both constant and then-year dollars. Ensure all records created as a result of processes prescribed
in this publication are maintained in accordance with Air Force Manual 33-363, Management of
Records, and disposed of in accordance with the Air Force Records Disposition Schedule located
in the Air Force Records Information Management System. Refer recommended changes and
questions about this publication to the Economics and Business Management Directorate
(SAF/FMCE) using AF Form 847, Recommendation for Change of Publication; route AF Form
847s from the field through the appropriate functional chain of command. The authorities to waive
wing/unit level requirements in this publication are identified with a Tier (“T-0, T-1, T-2, T-3”)
number following the compliance statement. See AFI 33-360, Publications and Forms
Management, for a description of the authorities associated with the Tier numbers. This publication
may be supplemented at any level, but all direct Supplements must be routed to the Office of
Primary Responsibility for this publication for coordination prior to certification and approval. The

2 AFMAN65-502 30 OCTOBER 2018
use of the name or mark of any specific manufacturer, commercial product, commodity, or service
in this publication does not imply endorsement by the Air Force.
SUMMARY OF CHANGES
The content of this document remains unchanged from the previous version. Changes were made
to spell out acronyms and office symbols where appropriate, remove jargon, and identify waiver
authorities for directive statements (tiering).
AFMAN65-502 30 OCTOBER 2018 3
Chapter 1
INTRODUCTION
1.1. Overview. Inflation is an often discussed topic which, in practice, can cause much confusion.
In simplest terms, inflation is the increase in the general price level over time. It is an average,
which means that while most individual prices may rise (e.g., labor, cars, food, etc.), they may rise
at different rates, and some prices may actually fall (e.g., technology). Since not all prices increase
at the same rate, there are clearly different reasons for prices to change. Inflation is only one of
these reasons. Other reasons prices may change include competition, the cost of factors of
production, changes in quality, and changes in taxes and regulations. These other variables also
alter a product’s supply and/or demand curves. In this paragraph and throughout this manual, price
is generically referred to as the payment (typically considered dollars) made in exchange for goods
and services.
1.2. Definition. Office of Management and Budget Circular A-94, Guidelines and Discount
Rates for Benefit-Cost Analysis of Federal Programs, defines inflation as the proportionate rate of
change in the general price level, as opposed to the proportionate increase in a specific price.
1.3. Background. Inflation refers to the change in value of the currency (e.g., the dollar) relative
to all other goods. If the general price level is rising, then the same number of dollars buys fewer
goods; therefore, the value of the dollar is decreasing. The inflation index is intended to measure
the decrease in the value of the dollar … nothing else. Since the value of the dollar decreases from
year to year, a dollar in one year is not the same as the dollar in another year. “Normalizing” for
inflation means applying the inflation index to cost data in order to remove the effect of inflation.
The result of normalizing is that all dollars, regardless of the year, will have the same value.
1.3.1. Causes of Price Changes. The price of a good or service can change for two broad
categories of reasons: (1) inflation (i.e., changes in the value of the dollar) and (2) changes in
the market (i.e., supply and demand) for the good or service. For this manual, “Market
changes” are changes in value that would occur even if all trade was done by barter (i.e.,
without the benefit of dollars or other currency).
1.3.1.1. Cause of Inflation. Inflation is usually caused by an increase in the money supply.
More specifically, inflation is caused by an increase in the volume of money and credit
relative to available goods resulting in a rise in the general price level. When the money
supply increases at a faster rate than the number of goods and services available for
purchase in the economy, the result is usually inflation. Attachment 3, section A3.1,
provides a more detailed explanation of the cause of inflation.
1.3.1.2. Market Changes (Supply and Demand). Anything that moves the supply and/or
demand curve for a good or service will change the equilibrium price for that good or
service. Examples of things that move these curves include, but are not limited to:
productivity increases; technological advances; quality changes; cost of inputs; customer
preferences; prices of complementary or substitute goods; patent expirations; taxes and
regulations. Market changes are important since they can create changes in individual
prices that are above or below the level of inflation.
1.3.1.2.1. After prices are normalized (i.e., adjusted) to remove inflation, there may
still be a change in price from one year to the next. This price change that is not due to

4 AFMAN65-502 30 OCTOBER 2018
inflation is referred to as the “real” change in price, because it no longer includes the
distortion caused by the devaluation of the dollar. Real price changes are caused by
changes in the market for a good/service (i.e., actual, or real, changes in the economy).
1.3.2. Effect of Inflation and Why It’s Important. Changes in the value of the dollar (i.e.,
inflation) distort comparisons of prices and expenditures over time. By obscuring patterns and
causes of cost increases, inflation increases the difficulty of making appropriate decisions.
Also, planning and executing programs become more difficult when inflation is higher, less
anticipated, and/or more volatile.
1.3.2.1. Two examples of why considering inflation is important:
1.3.2.1.1. Dollars spent in different years have different purchasing power due to
inflation. This makes it difficult to compare the cost of competing weapon system
investments (with different obligation profiles) over time.
1.3.2.1.2. Inflation raises the difficulty in determining the cause of increasing costs
and, consequently, in managing organizations and resources. For example, when a
commander sees supply costs increase from $100K to $110K in one year, he or she will
likely inquire into the cause. There are at least four possible reasons for cost growth,
each requiring different corrective action: (1) was inflation 10 percent, (2) did the unit
use 10 percent more supplies because of mission growth, (3) did the unit use 10% more
supplies because they were less efficient, or (4) did the price of specific supplies (e.g.,
oil) increase? Furthermore, the $10K increase could be a combination of reasons.
Clearly, the difficulty of the management process can be greatly affected by the amount
and volatility of inflation.
1.3.3. How the U.S. Government Sets Inflation Rates. Three Executive Branch offices work
together to develop economic forecasts for the current presidential administration to include a
forecast of the Gross Domestic Product (GDP) price index: the Office of Management and
Budget (OMB), the Department of the Treasury, and the Chairman of the Council of Economic
Advisers (CEA). Federal agencies, including the Department of Defense, use the gross
domestic product price index forecast as the inflation forecast for planning purposes and when
preparing budget documents.
1.3.3.1. After the economic forecasts are complete, the Office of Management and Budget
(OMB) provides the inflation forecast to the Office of the Under Secretary of Defense
(Comptroller) (OUSD(C)). OUSD(C) then passes the inflation rates to the Deputy
Assistant Secretary of the Air Force for Cost and Economics (SAF/FMC), who in-turn uses
the inflation rates to calculate the Air Force inflation indices. SAF/FMC converts the
Office of Secretary of Defense provided inflation rates to Air Force inflation indices using
a standard mathematical procedure. Therefore, compliance with Air Force inflation indices
is equivalent to complying with the OUSD(C) inflation rates. The Air Force inflation
indices are produced and disseminated via the Air Force Portal for use by Air Force
personnel.

AFMAN65-502 30 OCTOBER 2018 5
Chapter 2
ROLES AND RESPONSIBILITIES
2.1. SAF/FMC is the Air Force Office of Primary Responsibility (OPR) for inflation
matters. SAF/ FMC:
2.1.1. Prepares inflation and specific price indices based on guidelines provided by Office of
Management and Budget via OUSD(C).
2.1.2. Makes appropriation-specific inflation and specific price indices available for all
Secretariat and Air Staff offices (e.g., Deputy Assistant Secretary of the Air Force for Budget
(SAF/FMB)), major commands (MAJCOM), Field Operating Agencies (FOA), and Direct
Reporting Units (DRU).
2.1.3. Loads the inflation and specific price indices onto the Air Force Portal.

6 AFMAN65-502 30 OCTOBER 2018
Chapter 3
INFLATION ADJUSTMENT REQUIREMENTS
3.1. Office of Management and Budget Circular A-11, Preparation, Submission, and
Execution of the Budget, requires inflation to be considered in resource planning activities
such as budget preparation, life-cycle cost estimates, etc. OMB Circular A-94 provides specific
guidance on inflation assumptions. In accordance with the above OMB circulars, Air Force
Policy Directive 65-5, Cost and Economics, mandates that SAF/FMC develop Air Force inflation
indices.
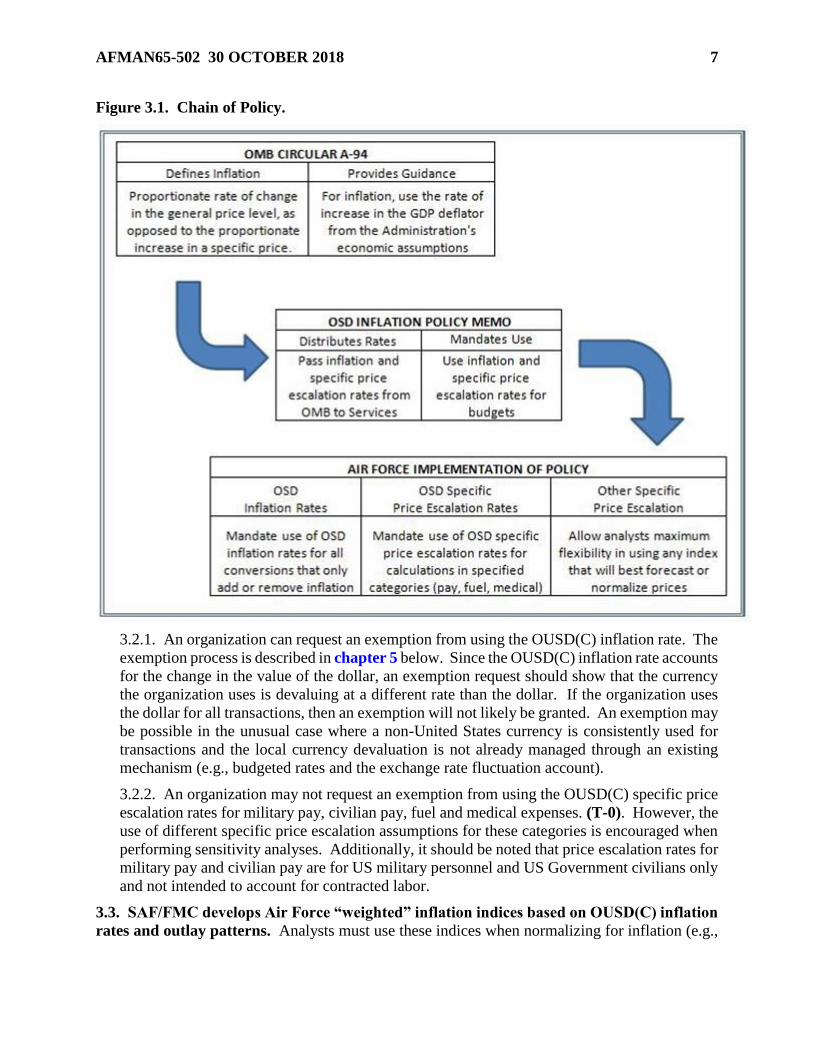
3.2. To help develop Air Force inflation indices OUSD(C) provides three things to
SAF/FMC: (1) inflation rates (rates of change in the general price level), (2) appropriation-
specific outlay rates, and (3) specific price escalation rates for military pay, civilian pay, fuel, and
medical. Outlay Profiles are disseminated within the Department of Defense by OUSD(C) and
are used in developing weighted indices. See Appendix A2.2.2 for more details.
SAF/FMC uses the inflation rates to produce the “raw” inflation indices. Further, SAF/FMC
uses the inflation rates and the appropriation-specific outlay rates to produce the “weighted”
inflation indices. Additionally, SAF/FMC uses the specific price escalation rates to produce the
specific price indices for military pay, civilian pay, fuel, and medical expenses. Normally,
OUSD(C) revises and publishes inflation and specific price escalation rates annually. When the
rates are published, they typically include instruction on where they must be used. For example,
the OUSD(C) Inflation Guidance as of December 2010 stated that “these rates are to be reflected
in the Fiscal Year 2012 President’s Budget submission, as well as supporting congressional
justification materials.” See figure 3.1 below for a depiction of the process flow from OMB to
the Air Force.
AFMAN65-502 30 OCTOBER 2018 7
Figure 3.1. Chain of Policy.
3.2.1. An organization can request an exemption from using the OUSD(C) inflation rate. The
exemption process is described in chapter 5 below. Since the OUSD(C) inflation rate accounts
for the change in the value of the dollar, an exemption request should show that the currency
the organization uses is devaluing at a different rate than the dollar. If the organization uses
the dollar for all transactions, then an exemption will not likely be granted. An exemption may
be possible in the unusual case where a non-United States currency is consistently used for
transactions and the local currency devaluation is not already managed through an existing
mechanism (e.g., budgeted rates and the exchange rate fluctuation account).
3.2.2. An organization may not request an exemption from using the OUSD(C) specific price
escalation rates for military pay, civilian pay, fuel and medical expenses. (T-0). However, the
use of different specific price escalation assumptions for these categories is encouraged when
performing sensitivity analyses. Additionally, it should be noted that price escalation rates for
military pay and civilian pay are for US military personnel and US Government civilians only
and not intended to account for contracted labor.
3.3. SAF/FMC develops Air Force “weighted” inflation indices based on OUSD(C) inflation
rates and outlay patterns. Analysts must use these indices when normalizing for inflation (e.g.,

8 AFMAN65-502 30 OCTOBER 2018
when converting then-year dollars to base-year or constant year dollars) unless an exemption has
been approved as described in paragraph 2.1.1. (T-0). When performing cost estimates, analysts
should forecast costs as accurately as possible by including all causes of price change, not just
inflation. Therefore, analysts should use a specific price index (or whatever methodology provides
the best forecast) to estimate future costs. The specific price index includes both real price changes
and inflation-based changes. As a result, the inflation-based price change is implicitly included in
a specific price index.
3.4. OUSD(C) prescribes price escalation rates for a few specific expense categories such as
military pay, civilian pay, fuel and medical. SAF/FMC uses these prescribed rates to produce
specific price indices. As specific price indices, they should not be confused with inflation indices.
These specific price indices are to be used in forecasting. For other categories of expenditures
(e.g., aircraft parts, contract labor, etc.), the analyst must either choose or develop the price index
that will most accurately forecast future requirements. After building a then-year estimate with an
appropriate price index, the analyst may need to calculate a corresponding constant-year cost
estimate. When removing the effects of inflation (normalizing to a constant-year dollar), the Air
Force inflation indices must be used. (T-0).
3.4.1. Historically, fuel and pay accounts have been converted to what was called a “constant-
year dollar” using the same price index that was used to forecast. This is inconsistent with the
term “constant-year dollar” because it normalizes for more than just inflation. Instead, this
technique is more consistent with the term “constant price” (see Attachment 1, Terms).
Generally speaking, fuel and pay accounts are treated as if they do not have outlays beyond
the year of appropriation. Therefore, when normalizing for inflation alone (i.e., removing the
effects of only inflation for fuel and pay accounts), the raw inflation index must be used. (T-
0).

AFMAN65-502 30 OCTOBER 2018 9
Chapter 4
INDEX USE AND DOCUMENTATION
4.1. Apply the following when using specific price indices and inflation indices (T-2), (see
attachment 2 for details on how to use inflation indices):
4.1.1. Cite the source and date of the inflation indices and specific price indices used. (T-2).
If the index was developed by an in-house analyst, explain the methodology. (T-2).
4.1.2. Use the current SAF/FMC indices for the most relevant appropriation category for the
program (or program element). (T-1). SAF/FMC provides inflation indices for the major
appropriation categories (listed in Attachment 4) and specific price indices for fuel, military
pay and civilian pay. SAF/FMC recommends using the Air Force Inflation Calculator, an
Excel© add-in, for inflation conversions. SAF/FMC updates this program annually. The
program is located on SAF/FMC’s site on the Air Force Portal.
4.1.2.1. If the program (or element of a program) does not exactly match one of the
appropriation categories listed in Attachment 4, select an appropriation category that
would be expected to have a similar outlay profile as the program under consideration.
4.1.2.2. The inflation and specific price indices currently in effect are posted on the Air
Force Portal. They will remain in effect until superseded by a subsequent SAF/FMC
publication.
4.1.3. The use of different inflation and specific price escalation assumptions is encouraged
when performing sensitivity analyses.
4.1.4. When developing then-year cost estimates, analysts should use information and
methodologies with the highest probability of accurately estimating the budget authority that
will be required. Subsequent to developing the then-year cost estimates, conversion between
then-year and constant-year dollars will be performed using the current Air Force inflation
indices (unless an exception is approved by OUSD(C)). (T-0).
4.2. Specific Price Indices.
4.2.1. A specific price index measures the total change in price of a good or service (or a
basket of goods or services) over a period of time. As such, it includes both real price changes
and changes due to inflation. As mentioned earlier, the prices of goods rise and fall at different
rates. Consequently, specific price indices tend to be narrowly focused on a specific good or
industry. Specific price indices are used to make then-year to then-year price conversions. For
example, a price index conversion from Fiscal Year 2000 to Fiscal Year 2010 takes the price
of an item in Fiscal Year 2000 and converts it to the price one would expect to pay for that
same item in Fiscal Year 2010.
4.2.2. Finding or developing and then applying specific price indices requires analyst
judgment. There is no index that will be applicable in all situations.
4.2.3. When selecting a specific price index, the analyst should choose the index that will most
accurately predict the future cost behavior of the program under consideration. Some ideas
that may be useful when forecasting program costs using specific price indices are mentioned
below.

10 AFMAN65-502 30 OCTOBER 2018
4.2.3.1. If possible, the analyst may want to develop a specific price index based on
information from the program under consideration. Examples include specific price
indices derived from the program’s historical data (where the historic data is an indicator
of future cost behavior), or a forward pricing rate agreement (FPRA) from the program.
4.2.3.2. Specific price indices are developed by companies who forecast economic trends
and conditions. Companies may forecast specific commodity price indices (e.g., Global
Insight© Titanium Index) or specific price indices that are an industry-level composite
(e.g., Global Insight© Aircraft Engine and Engine Parts Index).
4.2.3.3. US Government agencies, to include organizations within the Department of
Defense, produce specific price indices. For example, the Bureau of Labor Statistics
develops Producer Price Indices (PPI) for many goods and services.
4.2.4. Price data exists in many different forms. Some examples are: raw prices for each year,
rate of change from one year to the next, prices indexed to a base year, and a total price for a
project across many years. Note: The term base year here should not be confused with “base-
year dollar.” In this context, the base year of an index refers to the year of the index from which
the percent change in price is calculated. “Base-year dollar” refers to dollars that have been
normalized for inflation to a particular year of significance (e.g., program start date).
Paragraphs A3.3 through A3.3.1.2 of this manual provides additional information. When
analyzing the historical data, the analyst needs to carefully consider the form of the data (e.g,
Constant Year dollar, Constant Price, Then Year dollar).
4.2.5. The analyst will need to determine whether or not to weight a specific price index using
outlays. When using historical obligation data to build a price index, the outlay profile is
already included in the data. In this case, the resulting price index is already weighted and no
further weighting is necessary. (Historical data may be used for items such as parts and
supplies that are purchased frequently over many years). Otherwise, the analyst will need to
use judgment to determine if the index requires weighting. For example, Bureau of Labor
Statistics Producer Price Indices (and Global Insight forecasts) should be weighted because of
the form of the data collected for the index.
4.2.6. When developing estimates of the annual budget authority required on a specific
program, the analyst is encouraged to use the appropriate price escalation coupled with
appropriate outlay rates. Outlay rates can be determined by examining such things as: the
unique contract terms (e.g., spend plan), commodity specific outlays (e.g., space vs. aircraft),
or outlay rates provided by OUSD(C). Subsequent to developing the time-phased budget
estimate, use current Air Force inflation indices to convert between then-year and constant-
year dollars, (unless an exception is approved by OUSD(C)). (T-0).
4.3. When using a Cost Estimating Relationship (CER) or historical analogy, the analyst
should evaluate the data to determine whether constant-year data or then-year data will
ultimately yield the most accurate price forecast. Any price adjustment from one then-year to
another then-year should carefully consider the most applicable specific price index.
4.3.1. When receiving data, ensure the data owner clarifies how the data has been normalized.
Data received may be characterized as constant year, but the data may not have been
normalized in a way that is consistent with the definition in this Air Force Manual. Whenever
receiving data, the analyst should also obtain information on how the data was normalized.

AFMAN65-502 30 OCTOBER 2018 11
Chapter 5
EXEMPTION PROCESS
5.1. When requesting an exemption from use of the inflation rates published by the Office
of Secretary of Defense for calculating constant-year dollars, apply the following guidance.
5.1.1. Forward a request for exemption to the Major Command (MAJCOM)-level Financial
Management office (FM). The MAJCOM/FM must concur with the request. Headquarters Air
Force organizations will submit directly to the SAF/Deputy Assistant Secretary for Cost and
Economics.
5.1.2. MAJCOM/FMs will forward to SAF/FMC if they concur with the request
5.1.3. SAF/FMC coordinates and obtains appropriate Secretariat and Air Staff coordination.
5.1.4. SAF/FMC forwards the request to OUSD(C) for approval.
5.2. The request should include the following items:
5.2.1. Proposed rates, sources, methodologies and justification for why the rates are more
appropriate.
5.2.2. Comparison between OUSD(C) rates (or SAF/FMC indices) and the proposed rates,
with an indication of the impact on the program.
JOHN P. ROTH
Assistant Secretary of the Air Force
(Financial Management and Comptroller)

12 AFMAN65-502 30 OCTOBER 2018
Attachment 1
GLOSSARY OF REFERENCES AND SUPPORTING INFORMATION
References
AFMAN 33-363, Management of Records, 1 March 2008
AFPD 65-5, Cost and Economics, 5 August 2008
DoD FMR 7000.19, Glossary, December 2008
Friedman, M. Wincott Memorial Lecture. London. 16 September, 1970
Mankiw, N. G. Macroeconomics. New York: Worth Publishers, 2007
OMB Circular A-11, Preparation, Submission, and Execution of the Budget, 18 Aug 2011
Prescribed Forms
None
Adopted Forms
AF Form 847, Recommendation for Change of Publication
Abbreviations and Acronyms
AFI—Air Force Instruction
AFMAN—Air Force Manual
AFPD—Air Force Policy Directive
AFRIMS—Air Force Records Information Management System
BY—Base-Year
CEA—Council of Economic Advisors
CER—Cost Estimating Relationship
CY—Constant-Year
DRU—Direct Reporting Unit
FM—Financial Management
FOA—Forward Operating Agency
FYDP—Future Years Defense Plan
GDP—Gross Domestic Product
M—Money Supply
MAJCOM—Major Command
MRE—Meal, Ready to Eat
O&M—Operations and Maintenance

AFMAN65-502 30 OCTOBER 2018 13
OPR—Office of Primary Responsibility
OUSD(C)—Office of the Under Secretary of Defense (Comptroller)
P—Prices
PPBES—Planning Programing Budgeting and Execution System
RDS—Records Disposition Schedule
RDT&E—Research Development Test and Evaluation
SAF/FMB—Deputy Assistant Secretary of the Air Force for Budget
SAF/FMBO—Budget Operations Directorate
SAF/FMC—Deputy Assistant Secretary of the Air Force for Cost and Economics
SAF/FMCE—Economics and Business Management Directorate
SAR—Selected Acquisition Reports
TOA—Total Obligation Authority
TY—Then-Year
V—Velocity of Money
Y—Real Gross Domestic Product
Terms
Adopted Form—A form used (required) in a publication other than the prescribing publication.
Air Staff—Headquarters Air Force Offices below the Secretariat level (under and including the
Chief of Staff, USAF).
Base Year—a point of reference representing a fixed price level; usually defined as the fiscal year
in which a program was initially funded. The notion of expressing program costs in a specified
Base-Year is equivalent to expressing those costs in Constant-Year Dollars of the same year.
Base-Year Dollar—the dollar's value at the midpoint (April 1) of a Base Year and implies this
value throughout the Base Year. When cost estimates are stated in Base-Year Dollars, it is implicit
that the overall purchasing power of the dollar has remained constant over the time period being
costed.
Constant Prices—expressing the value of an item in the price of a particular year by normalizing
for market changes applicable to that price. Note that constant prices are different from constant
year dollars. With constant year dollars, the dollars are adjusted only for inflation. With constant
prices, market price changes over time (including, but not limited to inflation) are normalized.
Constant price adjustments are made using a specific price index whereas constant year dollar
adjustments are made using the inflation index. Constant prices can be expressed as (CPXX)
where XX is the year in which the prices are being expressed. Also, for any value expressed in
constant prices, the analyst must document the index used to normalize the prices (e.g., Global
Insight©, Producer Price Index 3364, updated 11 Dec 2013). Constant Prices may be used for cost
estimating and analysis (e.g., Cost Estimating Relationship development).

14 AFMAN65-502 30 OCTOBER 2018
Constant—Year Dollar—the value or purchasing power of a dollar in any specific year, which
may or may not be the Base Year. Constant-Year dollars do not contain any adjustments for
inflationary changes that occurred or are forecast to occur outside of the Base Year. Constant-
Year Dollars are not influenced by Outlay Profiles (Expenditure Patterns). Also known as Real
Dollars. Note: The Air Force definition for constant-year dollars is consistent with definitions of
constant-year dollars in both the economics and finance communities (sources: Farlex Financial
Dictionary, Wall Street Words, Investopedia, Minneapolis Federal Reserve Bank
http://www.minneapolisfed.org/glossary.cfm#i, Macroeconomics textbook by Mankiw).
Cost Estimating Relationship (CER)—an equation used to estimate a given cost element using
an established relationship with one or more independent variables. The relationship may be
mathematically simple or it may involve a complex equation (often derived from regression
analysis of historical systems or subsystems). CERs should be current, applicable to the system
or subsystem in question, and appropriate for the range of data being considered.
Direct Reporting Unit—has a specialized and restricted mission, and is directly subordinate to
the Chief of Staff, United States Air Force or to Chief of Staff’s representative on the Air Staff.
Equilibrium Price—the price at which the supply of a good equals the demand for that same
good.
Escalate—generally means to increase. Costs can escalate for reasons other than inflation (e.g.,
increase in a building’s maintenance costs due to age).
Inflation—a rise in the general price level caused by an increase in the volume of money and
credit relative to the available goods. Inflation is usually measured by a broad-based (general)
price index such as the implicit deflator for Gross Domestic Product.
Nominal Growth—refers to the year-to-year change in program funding as expressed in then-
year dollars. Nominal growth includes both real growth and inflation.
Nominal Price—the price of a good or service expressed in Then-Year Dollars.
Normalization—when applied to inflation, it is the elimination of inflationary or deflationary
impacts contained within historical cost data. Inflation normalization means conversion of Then-
Year dollar amounts to program Base-Year Dollar amounts or Constant-Year Dollar amounts.
Outlay—the amount of checks issued or other payments made (including advances to others), net
of refunds and reimbursements. The terms ‘expenditure’ and ‘net disbursement’ are frequently
used interchangeably with the term ‘outlay.’ Gross outlays are disbursements and net outlays are
disbursements (net of refunds) minus reimbursements collected. There is a time lag between
budgeting funds (congressional appropriations), contracting for goods and services, the receipt of
the goods and services and payment for the goods and services. This time lag often results in
payments of monies over several fiscal years, with each year’s cost influenced by inflation specific
to that year. Each major appropriation has a distinct outlay profile (expenditure pattern), based
upon historical obligation to outlay experience by fiscal year.
Outlay Profile—reflects the rate at which funds in each appropriation are expected to be expended
based on historical experience. Outlay Profiles are implicitly considered in the budgetary concept
of Then-Year Dollars. Outlay Profiles are disseminated within Department of Defense by Office
of the Under Secretary of Defense (Comptroller) and are used in developing Weighted
(Composite) Inflation Indices. Also known as Spendout Rate or Expenditure Profile.

AFMAN65-502 30 OCTOBER 2018 15
Outyears—the years after the first year of a budget or analysis.
Program Element—PEs describe all forces, activities and support required to accomplish the Air
Force mission with associated costs.
Raw Inflation Indices—are used to convert from Base-Year (Constant-Year) Dollars in one fiscal
year to Base-Year (Constant-Year) Dollars in another fiscal year. Raw Inflation Indices are not
influenced by Outlay Profiles.
Raw Inflation Rate—reflects the relative change in general price level occurring from the mid-
point of one fiscal year (April 1) to the mid-point of the next fiscal year.
Real Growth—refers to the year-to-year change in program funding as expressed in Constant-
Year Dollars. Since real growth is expressed in Constant-Year Dollars, it excludes inflation. It is
usually displayed as a percentage and is computed by dividing the Constant-Year Dollars in one
year by that of the previous year and subtracting 1.000.
Sensitivity Analysis—Sensitivity analysis is a repetition of an analysis with different quantitative
values for cost or highly variable ground rules and assumptions to determine their effects for
comparison with the results of the basic analysis. It is a tool that can be used for assessing the
extent to which costs and benefits are sensitive to changes in key factors.
Specific Price Escalation—the change in the nominal price of a good or service (i.e., the total
change in price) over a period of time. It includes the effects of inflation and the market, and is
measured by a specific price index.
Specific Price Index—measures changes in the price of a precisely defined good/service or a
basket of goods/services over time. For example, a price index conversion from Fiscal Year 2000
to Fiscal Year 2010 will yield the price one could expect to pay in 2010 for a good originally
purchased in 2000. Price indices are used to make then-year to then-year conversions.
Then-Year Dollar—reflects the amount of funding needed (expected to be needed) when the
expenditure for goods and services were (are expected to be) made. All Planning Programming
Budgeting and Execution System documents use Then-Year Dollars to properly reflect the Total
Obligation Authority (TOA) that must be appropriated during a specific fiscal year if sufficient
funds are to be available to pay for the goods and services when received. For AF Comptroller
purposes, Then-Year Dollars are identical to current dollars; they are known as nominal or budget
dollars. If Then-Year Dollars are written with a specific year (e.g. Then Year 11$), then those
dollars reflect the amount of funding needed if the funds for all goods and services were obligated
in the year used (e.g. Fiscal Year 2011 for Then Year 11$).
Total Obligation Authority (TOA)—the financial requirement of the Future Years Defense Plan
(FYDP), or any component thereof, necessary to support the approved program. The total budget
authority received and posted in the accounting system supporting an organization’s approved
program. Total Obligation Authority includes the anticipated reimbursements an organization
expects to earn plus the organization’s direct budget authority.
Weighted Inflation Indices—inflation indices computed by combining Outlay Profiles with Raw
Inflation Indices to include the lag effect on inflation of expending funds over a multi-year period.
(Note: Expenses for personnel and fuel are generally either not outlayed in subsequent years, or
are not inflated when outlayed beyond the fiscal year of obligation. Therefore, these expenses do
not use weighted inflation indices.)

16 AFMAN65-502 30 OCTOBER 2018
Attachment 2
USING INFLATION INDICES
A2.1. Selecting the appropriate index.
A2.1.1. Raw inflation indices would be used to make the following conversions:
Table A2.1. Raw Index Uses.
FROM TO POSSIBLE REASON
FOR CONVERSION
Base-Year (BY) Base-Year When re-baselining a program
or to isolate changes in a
program solely due to inflation
Constant-Year
(CY) Constant-Year
Base-Year Constant-Year
Constant-Year Base-Year
A2.1.2. Weighted inflation indices would be used to make the following conversions:
Table A2.2. Weighted Index Uses.
FROM TO POSSIBLE REASON
FOR CONVERSION
Base-Year* Then-Year* (TY) To convert a real-dollar
analysis into a budget request Constant-Year* Then-Year*
Then-Year Base-Year To convert historic budget data
into constant dollars for
analysis Then-Year Constant-Year
<< CAUTION *See paragraph A2.1.2.2 CAUTION >>
A2.1.2.1. TY to TY conversion is purposely omitted from Table A2.2. Inflation indices
only adjust for inflation. To adjust for any and all other potential changes in a TY dollar
to TY dollar conversion (such as real economic price changes as discussed in paragraph
1.3.1.2.1 of this AFMAN), a specific price index (not an inflation index) should be used.
Note: An inflation index would only be appropriate for TY to TY conversion if there were
no real economic price changes in the item over time. It is highly unusual for a good’s price
changes to exactly match the OSD inflation index.
A2.1.2.2. Caution should be exercised when using a weighted index to convert from Base-
Year or CY Dollars to TY Dollars. As stated above, inflation indices only adjust for
inflation. As such, the analyst must separately account for all other potential causes for
changes in price that could occur over time (such as real economic price changes as
discussed in paragraph 1.3.1.2.1 of this AFMAN).
A2.1.2.2.1. If converting expenditure data from the year of expenditure to a base year,
raw indices should be used even though the expenditure data is then-year. The
expenditure is in the year the expenditure/outlay occurred and does not have a
subsequent outlay profile.

AFMAN65-502 30 OCTOBER 2018 17
A2.1.2.3. Outlay rates make the indices service unique. A Service’s indices should be
applied only to expenses within that Service (e.g., do not use AF indices to normalize Navy
funding).
A2.1.2.4. Chart A2.1 illustrates when to use a raw index, a weighted index, or a price
index.
Figure A2.1. Chart Inflation and Price Index Use.
A2.2. Examples of Dollar Conversions Using the Inflation Indices.
A2.2.1. Dollar Conversions Using Raw Inflation Indices. Converting constant dollars from
one year into constant dollars of another year is a two-step process. An example is provided
in table A2.3 below. The first step is to convert your dollar value to the base year of the
inflation index. This is done by dividing the dollar value by the index value that corresponds
to the year in which the dollar is currently expressed. The second step is to convert that newly
acquired inflation indexed base-year dollar value into the year in which the dollar needs to be
expressed. To do this, simply multiply the newly computed BY dollar value times the index
value for the year into which you want to convert.
A2.2.1.1. General formula for converting dollars using raw inflation indices (The variables
“i” and “j” represent fiscal years, e.g., FY05 and FY10):

18 AFMAN65-502 30 OCTOBER 2018
A2.2.1.2. Dollar conversion examples using raw inflation indices are below:
Table A2.3. Raw Inflation Conversions.
RAW INFLATION CONVERSIONS (BY2000)
Year 1998 1999 2000 2001 2002 2003 2004 2005 2006 2007 2008
Raw Index 0.978 0.986 1.000 1.016 1.032 1.049 1.071 1.093 1.116 1.140 1.164
2004
Convert BY2000 $500 to CY2004* B Y2000 Index CY2004
$500 X 1.071 = $535.50
2005
Convert CY2005 $500 to CY2002* C Y2005 Index CY2000 $500 / 1.093 = $457.46
2002
C Y2000 Index CY2002
$ 457.46 X 1.032 = $472.10
* CY is Constant Year
A2.2.2. Dollar Conversions Using Weighted Inflation Indices.
A2.2.2.1. In order to convert CY Dollars of one year into TY Dollars of the same or
another year, use a weighted inflation index with a base year that is the same as the year
FROM which you are converting. Then multiply the constant-dollar amount by the
weighted index for the desired then-year.
A2.2.2.2. As noted in paragraph A2.1.2.2, exercise caution when using a weighted index
to convert from a constant-dollar of one year to a then-year dollar of another year. Since
inflation indices only adjust for inflation, the analyst using this approach is only adding
inflation (to include inflation in the outlay profile) to the CY dollar. Any other market
changes in price that occur between the initial year and the year to which the analyst is
converting are not included in this calculation. As a result, if the price of the estimated
product grows faster than inflation, the estimate will be understated.
A2.2.2.3. There are three scenarios when using an inflation index to convert from CY
Dollars to TY Dollars is applicable. The first scenario is when inflation (to include the
outlay profile) is the only change in price between the initial year and the year to which the
analyst is converting. (In this scenario, the price change over the time period is expected
to exactly mirror inflation). The second scenario is when the CY Dollar was previously
converted from the same TY Dollar to which the analyst is now converting. In this case,
the same inflation index must be used in the conversion from the CY Dollars to TY Dollars
as was originally used to convert from the same TY Dollars to CY Dollars. The third
scenario is when converting from CY Dollars to TY Dollars of the same year. In this case,

AFMAN65-502 30 OCTOBER 2018 19
the conversion is only accounting for the obligation profile. Below is how constant-year
dollars are converted to then-year dollars:
A2.2.2.4. In order to convert TY Dollars into CY Dollars of the same or other year, use a
weighted
inflation index with a base year that is the same as the year TO which you are converting. Then,
divide the TY Dollar amount by the weighted index value for the then-year, below is the general
formula.
A2.2.2.5. Dollar conversion examples using weighted inflation indices are below:
Table A2.4. Weighted Inflation Conversions**.
WEIGHTED INFLATION CONVERSIONS (Base Year of Index is BY2000)
Year 199
8
1999 2000 2001 2002 2003 2004 2005 2006 2007 2008 Weighted Index 0.98
3 0.994 1.00
8 1.024 1.041 1.060 1.082 1.10
5 1.128 1.152 1.176
2004
Convert BY2000 $500 to TY2004***
BY2000
Index TY2004 Dollars Value Dollars $500 X 1.082 = $541.00
2004 Convert TY2004 $541 to
CY2000* TY200
4 Index CY200
0 Dollars Value Dollars $541 / 1.082 = $500
2005 Convert TY2005 $500 to
CY2000* TY200
5 Index CY200
0 Dollars Value Dollars
$500 / 1.105 = $452.49
* CY is Constant Year
** << CAUTION >> After converting a dollar figure from a TY Dollar to a CY Dollar, the
inflation indices should not be used to convert that CY Dollar to a different TY Dollar. See
paragraph A2.1.2.1 for information on then-year to then-year conversions.
** << CAUTION >> See paragraph A2.1.2.2 for a caution on BY to TY conversions.
A2.3. Examples of Dollar Conversions Using Specific Price Indices.
A2.3.1. Specific price indices are used to make TY to TY conversions. Making a TY to TY
conversion is a two-step process. The first step is to divide the dollar amount by the price
index value for the year from which you want to convert. The second step is to multiply the
result from step 1 by the price index value for the year to which you want to convert.

20 AFMAN65-502 30 OCTOBER 2018
Table A2.5. Price Index Conversions.
PRICE INDEX (TY to TY) CONVERSIONS (BY2000)
Year 1998 1999 2000 2001 2002 2003 2004 2005 2006 2007 2008
Price Index 0.978 0.986 1.000 1.016 1.032 1.049 1.071 1.093 1.116 1.140 1.164
2005
Convert TY2005 $500 to TY2002* T Y2005 Index TY2000 $500 / 1.093 = $457.46
2002
T Y2000 Index TY2002
$ 457.46 X 1.032 = $472.10
*The index used in these calculations was calculated from the TY values. As a result,
calculations using this index allow for a direct TY to TY conversion. One example of this type
of index is the fuel index (fuel does not have an outlay profile beyond the year of appropriation).
AFMAN65-502 30 OCTOBER 2018 21
Attachment 3
ADVANCED TOPICS IN INFLATION
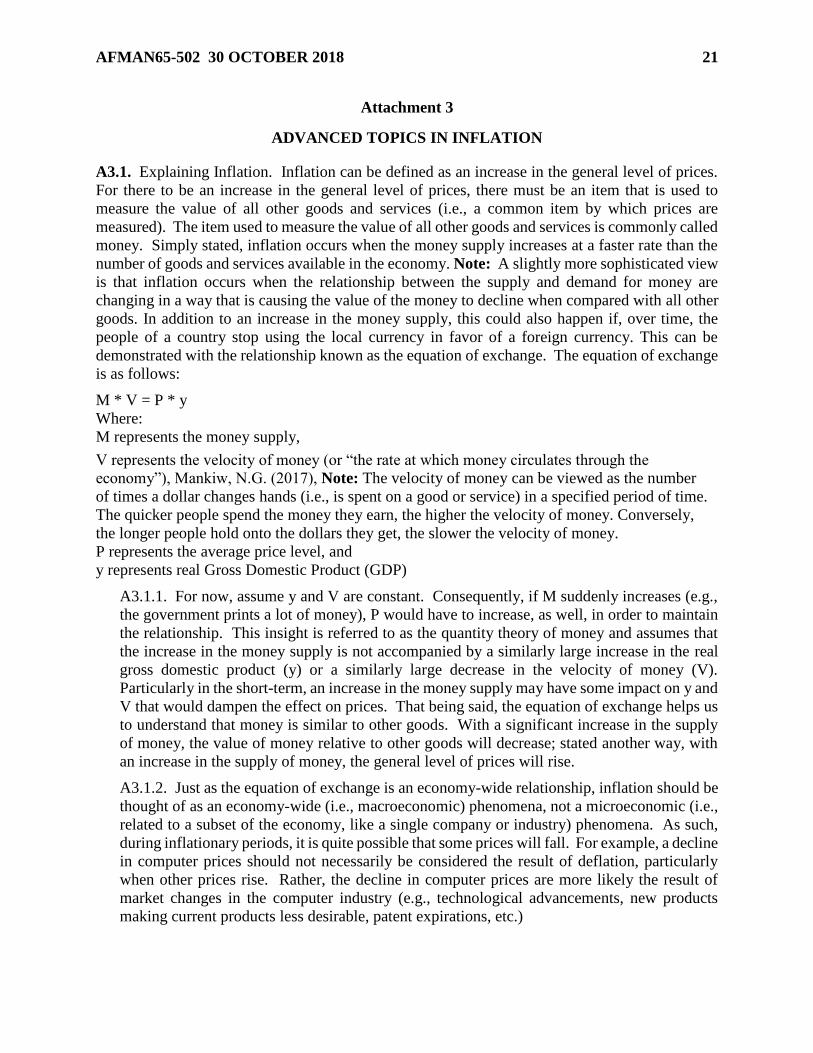
A3.1. Explaining Inflation. Inflation can be defined as an increase in the general level of prices.
For there to be an increase in the general level of prices, there must be an item that is used to
measure the value of all other goods and services (i.e., a common item by which prices are
measured). The item used to measure the value of all other goods and services is commonly called
money. Simply stated, inflation occurs when the money supply increases at a faster rate than the
number of goods and services available in the economy. Note: A slightly more sophisticated view
is that inflation occurs when the relationship between the supply and demand for money are
changing in a way that is causing the value of the money to decline when compared with all other
goods. In addition to an increase in the money supply, this could also happen if, over time, the
people of a country stop using the local currency in favor of a foreign currency. This can be
demonstrated with the relationship known as the equation of exchange. The equation of exchange
is as follows:
M * V = P * y
Where:
M represents the money supply,
V represents the velocity of money (or “the rate at which money circulates through the
economy”), Mankiw, N.G. (2017), Note: The velocity of money can be viewed as the number
of times a dollar changes hands (i.e., is spent on a good or service) in a specified period of time.
The quicker people spend the money they earn, the higher the velocity of money. Conversely,
the longer people hold onto the dollars they get, the slower the velocity of money.
P represents the average price level, and
y represents real Gross Domestic Product (GDP)
A3.1.1. For now, assume y and V are constant. Consequently, if M suddenly increases (e.g.,
the government prints a lot of money), P would have to increase, as well, in order to maintain
the relationship. This insight is referred to as the quantity theory of money and assumes that
the increase in the money supply is not accompanied by a similarly large increase in the real
gross domestic product (y) or a similarly large decrease in the velocity of money (V).
Particularly in the short-term, an increase in the money supply may have some impact on y and
V that would dampen the effect on prices. That being said, the equation of exchange helps us
to understand that money is similar to other goods. With a significant increase in the supply
of money, the value of money relative to other goods will decrease; stated another way, with
an increase in the supply of money, the general level of prices will rise.
A3.1.2. Just as the equation of exchange is an economy-wide relationship, inflation should be
thought of as an economy-wide (i.e., macroeconomic) phenomena, not a microeconomic (i.e.,
related to a subset of the economy, like a single company or industry) phenomena. As such,
during inflationary periods, it is quite possible that some prices will fall. For example, a decline
in computer prices should not necessarily be considered the result of deflation, particularly
when other prices rise. Rather, the decline in computer prices are more likely the result of
market changes in the computer industry (e.g., technological advancements, new products
making current products less desirable, patent expirations, etc.)

22 AFMAN65-502 30 OCTOBER 2018
A3.1.3. The existence of inflation does not mean that the prices of all goods and services will
rise evenly. Differences in the supply and demand for different goods in the economy cause
the prices of some goods to rise faster than others. As a result, price changes in a particular
program (such as those seen in forward pricing rate agreements) are unlikely to be solely due
to inflation, but rather they are a combination of inflation and other market forces.
A3.1.4. If a program has reliable/accurate information on future price changes, for example
escalation clauses in a contract, that information should be used to build the then-year cost
estimate. In order to obtain the base-year cost, inflation should be backed out using the
SAF/FMC inflation indices. This method should produce both the most accurate then-year
cost estimate possible and a base-year cost estimate that includes only “real” price changes
resulting from other market forces.
A3.2. Measuring Inflation. There are several methods of measuring inflation. A simplified
example of one method is described below. (Other methods use a geometric mean which will not
be discussed in this AFMAN).
A3.2.1. Assume our economy contains only three commodities: Meals, Ready to Eat (MRE);
bullets; and combat boots. Further assume that: (1) these commodities account for 70, 20, and
10 percent of expenditures, respectively, (2) these proportions are stable over time, and (3) the
quality of the three items is constant. Finally, assume Year 1 in Table A3.1 below is the base
year, 2000. Table A3.1 provides additional information:
Table A3.1. Raw Inflation Example.
Year
Price per
MRE
Price per
Package
of Bullets
Price
per pair
of Boots
Aggregate
(i.e., Wtd
Average)
Price
Annual
Inflation
(Yr-to-
Yr
Change)
Compound
Inflation
(Cumulative
Change)
Raw
(i.e., Compound)
Inflation Index
1- 2000
$2.00 $5.00 $20.00 $4.40 --- --- ---
2- 2001
$2.05 $5.10 $20.35 $4.49 2.05% 2.05% 1.0205
3- 2002
$2.15 $5.35 $20.50 $4.625* 3.01% 5.11% 1.0511
4- 2003
$2.25 $5.45 $20.65 $4.73 2.27% 7.50% 1.0750
5- 2004
$2.30 $5.50 $21.25 $4.835* 2.22% 9.89% 1.0989
* For calculation purposes, fractional cents were shown in the table.
A3.2.2. Calculating inflation rates.
A3.2.2.1. The Aggregate Price (i.e., the “General Price Level”). Raw inflation rates
measure changes in the general price level from year to year. Theoretically, the aggregate
price is the weighted average price of all goods and services sold in the economy. In
practice, it is generally the weighted average price of a representative basket of goods
purchased by the “average” consumer. In our rather limited economy of three
commodities, it is the weighted average of the prices of our three commodities. The

AFMAN65-502 30 OCTOBER 2018 23
weights are provided in paragraph A3.2.1. The aggregate, or weighted average, price is
calculated as follows:
Aggregate Price = price of MREs * 0.7 + price of Bullets * 0.2 + price of Boots * 0.1
So, for Year 1 (the year 2000 in Table A2.1), the calculation is:
Aggregate Price = $2.00 * 0.7 + $5.00 * 0.2 + $20.00 * 0.1 = $4.40
A3.2.2.2. Calculating Annual Raw Inflation Rates. Inflation is an economy-wide measure
of the general change in price level, which in our very limited economy is the percent
change in aggregate price from year to year. The inflation rate for a given year, say year i,
is calculated by a 2-step process: (1) subtract the aggregate price in the prior year (i.e., year
i-1) from the aggregate price in year i (the year for which inflation is being calculated),
then (2) divide the resulting number by the previous year’s (i.e., year i-1) aggregate price.
Example calculations using numbers from the table are:
A3.2.2.3. Calculating Compound Raw Inflation Rates. While an annual inflation rate
measures the percent change in aggregate price from year to year, a compound inflation
rate measures the cumulative percent change in aggregate price for a time period generally
longer than one year. The compound inflation rate is calculated by subtracting the
aggregate price at the beginning of the period from the aggregate price at the end of the
period. The resulting number is then divided by the aggregate price at the beginning of the
period. Example calculations using numbers from the table are:
A3.3. Calculating inflation indices. The first step in building an inflation index is to establish a
base year. The base year will be the point of reference from which inflation to all other years is
measured.
A3.3.1. Base Year. Using inflation indices requires an understanding of the term “base year.”
There are two base years to consider: (1) the inflation index’s base year, and (2) the program’s
base year.
A3.3.1.1. The base year in an inflation index (or a price index) is the year in which the
value (i.e., purchasing power) of the dollar is set. The base year in a raw index will always
have an index value of one (i.e., 1.0000) because 1.0000 dollar will buy one dollar’s worth
of goods/services in that year. It is the year by which all index values for other years in the
index are measured. The base year for a weighted index will not have a value of 1.0000
because the outlay profile is considered when calculating the index. (Theoretically, it is
possible for the weighted index in the base year to be 1.0000, but it can only happen if the

24 AFMAN65-502 30 OCTOBER 2018
raw inflation indices for all years in the outlay profile are 1.0000 [i.e., there has been no
inflation in all years in the outlay profile.])
A3.3.1.2. The base year for a program is usually defined as the fiscal year in which a
program was initially funded or re-baselined. It is a point of reference representing a fixed
price level for the program.
A3.3.2. Calculating a raw (compound) inflation index. A raw inflation index measures
compound inflation, and as such may also be referred to as a compound inflation index. This
index measures inflation from the base year to the year of interest and provides a simple way
to calculate changes in cost due to inflation. The raw inflation index is calculated by dividing
the aggregate price in the year for which inflation is being calculated by the aggregate price in
the base year. Note: You may notice that you will get the same answer if you calculate the
compound inflation rate for the period from the base year to the year of interest and add 1.0.
Example calculations using numbers from the table are:
A3.3.2.1. The inflation index provides a simple way to calculate changes in cost due to
inflation. For example, given the base-year price, to estimate the price of a good at some
point in the future, say Year 4, and simply multiply the price of the good in the base year
by the inflation index for the desired year (i.e., year 4).
Applying this formula to estimate the price of bullets in Year 4 due to inflation:
However, when looking in Table A2.1 above, the price of bullets in Year 4 was $5.45, not
$5.375.
How can that be? This means that of the 45 cent increase in price over the three years from Year
1 to Year 4, $0.375 was due to inflation and $0.075 was due to other market related causes (e.g.,
shortage of supply of bullets, increase in demand, increase in cost of inputs, etc.).
A3.3.2.2. The inflation index also provides a simple way to convert a future-year cost
estimate (CE), say in Year 5, to a base-year cost estimate. To estimate the base-year price
of a good given the future-year cost estimate, simply multiply the price of the good in the
future year (i.e., Year 5) by the inflation index for the base year, then divide by the inflation
index for the future year (i.e., Year 5). For example:
Applying this formula to estimate the base-year price of boots given a Year 5 cost estimate:
However, when looking in Table A3.1 above, the price of boots in the base year was $20.00, not
$19.34.

AFMAN65-502 30 OCTOBER 2018 25
How can that be? This means that if inflation were the only thing affecting the price of boots, we
would expect the base year price to be $19.34. That is, inflation alone would have caused the
price of boots to rise $1.89 over the four-year period. But in reality, since the price actually only
increased $1.25, ($21.25 - $20.00), or $0.64 less than what would have been caused by inflation
alone, there were other market forces at work that prevented the price from rising the full $1.89.
Some possible reasons are weakening demand for boots, productivity increases, reduction in the
number of production regulations, patent expirations, lower producer taxes, etc. All of these
would decrease upward pressure on the price of boots over the four years from Year 1 to Year 5.
A3.3.2.3. This concludes the methodology used to calculate a raw (compound) inflation
index.
A3.3.3. Developing a weighted inflation index. The weighted inflation index differs from the
raw inflation index in that it takes into account when the funds leave the Treasury (when the
outlay occurs). For example, an organization is provided a certain amount of funding in its
Operations and Maintenance (O&M) account each fiscal year. These O&M funds must either
be obligated by the end of the fiscal year or returned to the Treasury. While the funds must be
obligated in that fiscal year, the funds do not have to be outlayed (i.e., expended, or leave the
Treasury) within the fiscal year. The outlay can, and many times does, occur after the close of
the fiscal year. It is similar to a credit card purchase where the purchase obligating payment
is made during the fiscal year, but the check actually paying the bill and settling the debt occurs
after the fiscal year ends. With the nature of government purchases, though, sometimes
projects implemented take several years to complete and are committed to without knowing
the exact cost. As a result, sometimes funds are obligated in one fiscal year, but don’t actually
pay (outlay) until several years later.
A3.3.3.1. Due to the fact that outlays often occur in a different year than obligations, the
Air Force produces and uses weighted inflation indices. The theory behind a weighted
index is that contractors determine the funding needed for a project knowing that part of
the project accomplishment will happen in a subsequent year and as a result, will require
more funding due to inflation. The government, in turn, looks at previous outlay rates to
determine historically what percentage of the outlay occurred in the year the funding was
appropriated and what percentage belongs in each subsequent year. While the operation
and maintenance appropriation will be used as an example, all appropriations are handled
the same way, although they each have their own unique outlay profile. These outlay
profiles are then used to create the weighted inflation indices. A set of notional outlay rates
can be seen in Table A3.2. Each number is a percentage. Notice that each row in the table
adds up to 100 percent.

26 AFMAN65-502 30 OCTOBER 2018
Table A3.2. Notional Outlay Rates.
OUSD(C) Outlay Rates (Notional)
Budget Account Year 1 Year 2 Year 3 Year 4 Year 5 Year 6 Year 7
3400 O&M 59.81 32.15 5.25 2.79
3600 RDT&E 58.15 34.53 4.55 1.04 1.73
3300 MILCON AF 14.00 47.40 30.50 4.00 1.50 2.60
3830 MILCON ANG 8.80 50.70 23.40 10.00 4.00 3.10
3730 MILCON AFR 8.50 55.00 27.50 5.30 2.00 1.70
3010 Aircraft Procurement Special 82.18 17.82
3010 Aircraft Procurement Other 20.00 40.00 18.30 10.60 5.30 5.80
3020 Missile Procurement Special 19.91 57.21 22.88
3020 Missile Procurement Other 28.21 33.54 24.34 7.25 3.99 2.67
3080 Other Procurement Special 57.05 34.57 8.38
3080 Other Procurement Other 23.66 22.23 21.21 19.46 7.97 3.71 1.76
A3.3.3.2. Using the outlay table and the raw inflation indices above, we can develop a
weighted index for the operation and maintenance appropriation (as well as all other
appropriation categories listed). Because the weighted index accounts for expenditures
occurring in years after the obligation, the weighted index value for Fiscal Year 2000
allows calculation of the actual amount of funding required to pay for obligations occurring
in Fiscal Year 2000. Table A3.3 contains the basic information that is needed to calculate
the weighted index for the year 2000.
Table A3.3. Information Needed to Calculate a Weighted Index.
YEAR YEAR OUTLAY INDEX
1 2000 59.81% 1.0000
2 2001 32.15% 1.0205
3 2002 5.25% 1.0511
4 2003 2.79% 1.0750
A3.3.3.3. The first step in developing a weighted inflation index is to divide the outlay
percentage by the raw inflation index. This converts the funding spent in years subsequent
to the appropriation year to a base year (“Year 1”) value.
A3.3.3.4. The second step is to add the base year values just calculated. This provides the
true value of $1 that will be obligated in “Year 1” and outlayed according to the outlay
profile. As seen in Table A3.4 below, the dollar obligated in “Year 1” is really only worth
98.90 cents (in “Year 1” BY dollars) because the value of that dollar was eroded by
inflation during the time represented by the outlay profile.
A3.3.3.5. Performing this drill provides a ratio used to perform the third and final step in
calculating the weighted index value for “Year 1.” Knowing that $1 budgeted for “Year 1”
only has the spending power of 98.90 cents, we can determine how much we need to budget
in “Year 1” to have $1 spending power. As a result, for the third step use the relationship
that $1 is to .9890 as the variable X is to $1. Putting that in a formula yields:*

AFMAN65-502 30 OCTOBER 2018 27
Algebraic manipulation yields:
A3.3.3.6. This means the weighted inflation index for Operations and Maintenance (3400)
for the year 2000 is 1.0111. The calculations can be seen in Table A3.4 below.
Table A3.4. Weighted Index Calculation.
3400
Outlay
Profile
Divided
By
Raw
Inflation
Index
Equals
$1 in BY
2000
Terms
Weighted
Inflation
Index
1 59.81% / 1 = 0.5981
1.0111
2 32.15% / 1.0205 = 0.3150
3 5.25% / 1.0511 = 0.0499
4 2.79% / 1.0750 = 0.0260
1 Divided
By
0.9890 Equals
A3.3.3.7. Generalized formula for converting between Then Year and Constant Year.
With the conversion formulas in paragraphs A2.2.2.3 and A2.2.2.4, the analyst had to use
the weighted inflation index with a base year that was the same as the Constant-Year
Dollar. The formulas below are more generic in that they allow the analyst to use any
weighted inflation index, but also require the use of a raw inflation index when converting
between Then Year and Constant Year dollars. The first formula shows the conversion
from Then-Year Dollars to Constant-Year Dollars.
With a simple algebraic manipulation, we can also generically show the formula for converting
Constant-Year Dollars to Then-Year Dollars.
A3.4. The difference between Inflation and The Time Value of Money.
A3.4.1. Discount rates and inflation rates are often a source of confusion. Discount rates (or
interest rates that are greater than zero) exist because people prefer to have something today as
opposed to waiting to have the item. To get the item earlier, people have to borrow against
future income and are willing to pay a positive interest rate in order to obtain the item.
A3.4.2. Discount rates and the Air Force. The Air Force corporately prefers consumption
today in that it would rather have a capability today than to wait. The market mechanism that
measures the value of money over time is the interest rate. A positive interest rate indicates
that people (and the Air Force) value consumption today more than future consumption.

28 AFMAN65-502 30 OCTOBER 2018
Looking at this relationship in reverse, having $100 today is more valuable than having $100
one year from now because earning interest on the $100 now will yield more than $100 a year
from now. The discount rate dictated by OMB Circular A94 is the treasury rates of various
maturity lengths. The reason the treasury rates are used is that if the funding is not spent, the
Federal deficit will be lower and some interest payments will not be incurred.
A3.4.3. Inflation however, is not concerned with investments. As described in this manual,
inflation rates are the result of changes in the general price level over time.
A3.4.4. Three terms that explain common ways of expressing funds are as follows:
A3.4.4.1. Then-Year Dollars - These are dollars that reflect inflation from year to year.
These are the type of dollars you would expect to see in a budget.
A3.4.4.2. Constant-Year Dollars - These are dollars that are expressed in terms of a
particular year (i.e. base year). These dollars do not reflect changes due to inflation. They
are also called real dollars.
A3.4.4.3. Constant-Year Dollars Discounted - These dollars are similar to the constant
year dollars in that they do not reflect changes in inflation. In addition, these dollars are
discounted to better make a comparison of dollars from different years, noting that a dollar
today is worth more than a dollar in the future because today’s dollar can be invested for a
return in excess of the dollar.
A3.4.4.4. For additional information on discount rates and discounting, see Air Force
Manual 65-506.
A3.5. Contrasting Inflation and Specific Price changes
A3.5.1. Types of Indices: Inflation Index and Specific Price Index. An inflation index
measures the general change in price level for all goods and services (i.e., from the growth in
the money supply relative to goods and services). A common general price index measurement
is the gross domestic product deflator. Conversely, a specific price index measures changes
in the nominal price of a good or service over a time period. It accounts for the entire change
in the price of a particular good, regardless of the cause (inflation and/or market).
A3.5.2. Specific Price Escalation vs. Inflation: Specific price escalation is an increase in the
price of a particular good or service (or sub-group of goods and services) over time. Specific
price escalation is distinct from inflation in that inflation is intended to measure the average
change in price across all goods and services.
A3.5.3. Rates vs. Indices: The Services receive rates from Office of Secretary of Defense and
turn those rates into indices. The indices have a benchmark year against which all other years
are measured. As such, the indices measure change from that benchmark year. The rates
received from Office of Secretary of Defense measure change from one year to the next instead
of being benchmarked to a certain year.

AFMAN65-502 30 OCTOBER 2018 29
Attachment 4
MAJOR AIR FORCE APPROPRIATIONS
3010 – Aircraft Procurement: Provides for fabricating and procuring aircraft weapon systems,
modifications, direct ground support equipment, aircraft industrial facilities, investment-type
spares, war consumables, miscellaneous aircraft requirements, and technical data.
3020 – Missile Procurement: Provides for fabricating and procuring missile weapon systems,
operational space systems, modifications, investment-type spares, component improvements,
missile industrial facilities, miscellaneous missile requirements, site activation, and technical
data.
3021 – Space Procurement: Provides for construction, procurement, and modification of
spacecraft, launch services, and related equipment (including ground control and communication
equipment) and training devices.
3080 – Other Procurement: Provides for procurement of direct and indirect ground weapon
support material (vehicular equipment; electronic and telecommunications equipment, including
cryptologic equipment; other installation maintenance and support equipment), installation-
procured local purchase equipment industrial preparedness measures, equipment modifications,
and spares and repair parts. Includes installation and emplacement of equipment, testing of
production items, and technical data and handbooks procured with end item equipment.
3300 – Military Construction: Provides for acquiring, constructing, installing, and equipping
temporary or permanent public works, military installations, and facilities for the Regular Air
Force. Includes planning and design, major construction inside and outside the U.S., minor
construction, and support activities.
3400 – Operations and Maintenance: Provides for financing day-to-day operations and
maintenance costs of AF activities. These funds include monies for civilian pay, contract
services for maintenance of equipment and facilities, fuel, supplies, modification kit installation,
and repair of parts for weapon systems and equipment. Note: The Inflation Calculator separates
out the Fuel and Civilian Pay portions of the operation and maintenance appropriation.
3500 – Military Personnel Appropriation: Provides for military personnel costs, such as pay
and allowances; retired pay accrual of officers, enlisted personnel and cadets; subsistence of
enlisted personnel; permanent change of station; unemployment benefits; and survivor benefits.
Military pay does have an outlay profile, but it is not used to develop weighted indices because
military member pay is generally not adjusted for inflation when pay is distributed in a
subsequent year from the year the obligation to the government was incurred.
3600 – Research, Development, Test, and Evaluation (RDT&E): Provide RDT&E for
advanced technology development, strategic programs, tactical programs, intelligence and
communications programs, and Defense-wide mission support; and for operating and
maintaining research and development (R&D) facilities and a technology base.
3730 – Military Construction Air Force Reserve: Provides for the acquisition, construction,
expansion, rehabilitation, and conversion of facilities for the training and administration of the
Air Force Reserve. Its sub-elements include planning and design, major construction, minor
construction, and support activities.
3830 – Military Construction Air National Guard (ANG): Provides for the acquisition,
construction, expansion, rehabilitation, and conversion of facilities for the training and
administration of the ANG. Its sub-elements include planning and design, major construction,
minor construction, and support activities.