by grace joy gakii
TRANSCRIPT

EFFECT OF WORKING CAPITAL MANAGEMENT IN THE
PROFITABILITY OF SMALL AND MEDIUM ENTERPRISES:
A CASE STUDY OF RETAIL OUTLETS AT TWO RIVERS MALL
BY
GRACE JOY GAKII
UNITED STATES INTERNATIONAL UNIVERSITY-AFRICA
SUMMER 2020

THE EFFECT OF WORKING CAPITAL MANAGEMENT IN THE
PROFITABILITY OF SMALL AND MEDIUM ENTERPRISES:
A CASE STUDY OF RETAIL OUTLETS AT TWO RIVERS MALL
BY
GRACE JOY GAKII
A Research Project Report Submitted to the Chandaria School of Business in Partial
Fulfilment of the Requirement for the Degree of Masters in Business Administration
(MBA)
UNITED STATES INTERNATIONAL UNIVERSITY-AFRICA
SUMMER 2020
ii
STUDENT’S DECLARATION
I, the undersigned, declare that this is my original work and has not been submitted to any
other college, institution, or university other than the United States International
University Africa for academic credit.
Signed ____________________________ Date _________________________
Grace Joy Gakii (ID No: 655885)
This research project report has been presented for examination with my approval as the
appointed supervisor.
Signed ____________________________ Date _________________________
Dr. George Achoki
Signed ____________________________ Date _________________________
Dean, Chandaria School of Business

iii
COPYRIGHT
Copyright © Grace Joy Gakii, 2020
All Rights Reserved

iv
ABSTRACT
The purpose of the study was to determine the effect of working capital management on
the profitability of Small and Medium Enterprises (SMEs). The study sought to answer
the following research questions; How does inventory management practices affect
profitability of SMEs at Two Rivers Mall? What is the effect of receivables management
practices on the profitability of SMEs at Two Rivers Mall? and, How does payables
management practices affect profitability of SMEs at Two Rivers Mall?
The research design applied in this study was descriptive research design. This research
design was used so as to cast light on the working capital practices employed by the
SMEs through a process of data collection. It involved observing and describing the
behaviour of the population without influencing it in any way. The population in the
study was composed of all the 45 SMEs that were at the Two Rivers Mall. The sample
frame for this study was composed of all the trading tenants at the Two Rivers Mall, and a
census sampling technique was applied due to the size of the population. This gave the
study a sample size of 45 SMEs. Self-administered questionnaires were used to collect the
study data, and the drop and pick method of data collection was used in the study.
Quantitative data analysis was used in the study where the data obtained was coded and
analysed using Statistical Package for the Social Sciences (SPSS). Descriptive analysis
that included percentage frequencies, means and standard deviations, as well as
inferential statistics composed of correlation analysis as well as simple regressions were
used, and data was presented in the form of diagrams and tables.
The study revealed that a single unit increase in inventory management practices could
result in the SMEs’ profitability increase by a mean index of 0.660 or 66%. It revealed
that a single unit increase in receivables management practices could result in the SMEs’
profitability increase by a mean index of 0.489 or 48.9%. The study also revealed that a
single unit increase in payables management practices could result in the SMEs’
profitability increase by a mean index of 0.462 or 46.2%.

v
The study concluded that the SMEs have installed inventory control systems which
facilitate their ability to keep accurate inventory records. Good inventory management
practices have led to increased profit margins for the firms. The SMEs have aged
accounts receivables report to help in management of accounts receivable, thus
minimizing the experience of bad debt losses. This and other receivables practices has led
to increased profitability of the firms. These SMEs understand that payables management
policy affects their profitability and have employed optimal payables practices to increase
their profitability.
The study recommended that the managers and owners of the SMEs at Two Rivers Mall
develop effective strategic policies that will provide a guideline on inventory, receivable
and payables management. This would be used to train and guide the staff members and
ensure that the SMEs hold onto optimal inventory, receivable and payables levels that
will minimize costs, and maximize their profitability and operating cash flows.

vi
ACKNOWLEDGEMENT
I would like to acknowledge my supervisor Dr. George Achoki who has been patient with
me and guided me throughout this process. His constant support and guidance steered me
through this study, and I am very grateful.
To my family and friends, as well as my colleagues at work, your support in my pursuit
of education has been tremendous and has really pushed me to do my best. I would like to
sincerely thank you and appreciate you all for the support. May the Almighty God bless
all of you and thank you.

vii
DEDICATION
This research project report is dedicated to my Mum for her wise counsel.
You are the best!

viii
TABLE OF CONTENTS
STUDENT’S DECLARATION ....................................................................................... ii
COPYRIGHT ................................................................................................................... iii
ABSTRACT ...................................................................................................................... iv
ACKNOWLEDGEMENT ............................................................................................... vi
DEDICATION................................................................................................................. vii
TABLE OF CONTENTS .............................................................................................. viii
LIST OF FIGURES ...........................................................................................................x
LIST OF TABLES ........................................................................................................... xi
LIST OF ABBREVIATIONS ........................................................................................ xii
CHAPTER ONE ................................................................................................................1
1.0 INTRODUCTION........................................................................................................1
1.1 Background of the Study ...............................................................................................1
1.2 Statement of the Problem ...............................................................................................4
1.3 Purpose of the Study ......................................................................................................5
1.4 Research Questions ........................................................................................................5
1.5 Justification of the Study ...............................................................................................6
1.6 Scope of the Study .........................................................................................................6
1.7 Definition of Terms........................................................................................................7
1.8 Chapter Summary ..........................................................................................................7
CHAPTER TWO ...............................................................................................................8
2.0 LITERATURE REVIEW ...........................................................................................8
2.1 Introduction ....................................................................................................................8
2.2 Inventory Management Practices and Profitability ........................................................8
2.3 Receivables Management Practices and Profitability ..................................................12
2.4 Payables Management Practices and Profitability .......................................................18
2.5 Chapter Summary ........................................................................................................23
CHAPTER THREE .........................................................................................................24
3.0 RESEARCH METHODOLOGY .............................................................................24
3.1 Introduction ..................................................................................................................24
3.2 Research Design...........................................................................................................24

ix
3.3 Population and Sampling Design .................................................................................24
3.4 Data Collection Methods .............................................................................................26
3.5 Research Procedure ......................................................................................................26
3.6 Data Analysis Methods ................................................................................................27
3.7 Chapter Summary ........................................................................................................27
CHAPTER FOUR ............................................................................................................28
4.0 RESULTS AND FINDINGS .....................................................................................28
4.1 Introduction ..................................................................................................................28
4.2 General Information and Response Rate .....................................................................28
4.3 Inventory Management Practices and Profitability ......................................................31
4.4 Receivables Management Practices and Profitability ..................................................36
4.5 Payables Management Practices and Profitability .......................................................43
4.6 Chapter Summary ........................................................................................................48
CHAPTER FIVE .............................................................................................................49
5.0 DISCUSSIONS, CONCLUSIONS AND RECOMMENDATIONS ......................49
5.1 Introduction ..................................................................................................................49
5.2 Summary ......................................................................................................................49
5.3 Discussions ..................................................................................................................50
5.4 Conclusions ..................................................................................................................57
5.5 Recommendations ........................................................................................................58
REFERENCES .................................................................................................................60
APPENDICES ..................................................................................................................68
APPENDIX I: RESEARCH AUTHORIZATION LETTER .......................................68
APPENDIX II: NACOSTI RESEARCH PERMIT ......................................................69
APPENDIX III: QUESTIONNAIRE .............................................................................70

x
LIST OF TABLES
Table 3.1 Target Population ...............................................................................................25
Table 4.1 Descriptive Analysis: Inventory Management Practices and Profitability ........32
Table 4.2 Correlation Analysis: Inventory Management Practices and Profitability ........33
Table 4.3 Model Summary: Inventory Management Practices and Profitability ..............34
Table 4.4 ANOVA: Inventory Management Practices and Profitability ...........................34
Table 4.5 Coefficients: Inventory Management Practices and Profitability ......................35
Table 4.6 Descriptive Analysis: Receivables Management Practices and Profitability ....38
Table 4.7 Correlation Analysis: Receivables Management Practices and Profitability ....40
Table 4.8 Model Summary: Receivables Management Practices and Profitability ...........40
Table 4.9 ANOVA: Receivables Management Practices and Profitability .......................41
Table 4.10 Coefficients: Receivables Management Practices and Profitability ................41
Table 4.11 Descriptive Analysis: Payables Management Practices and Profitability .......44
Table 4.12 Correlation Analysis: Payables Management Practices and Profitability .......45
Table 4.13 Model Summary: Payables Management Practices and Profitability ..............45
Table 4.14 ANOVA: Payables Management Practices and Profitability ..........................46
Table 4.15 Coefficients: Payables Management Practices and Profitability .....................46

xi
LIST OF FIGURES
Figure 4.1 Response Rate ..................................................................................................28
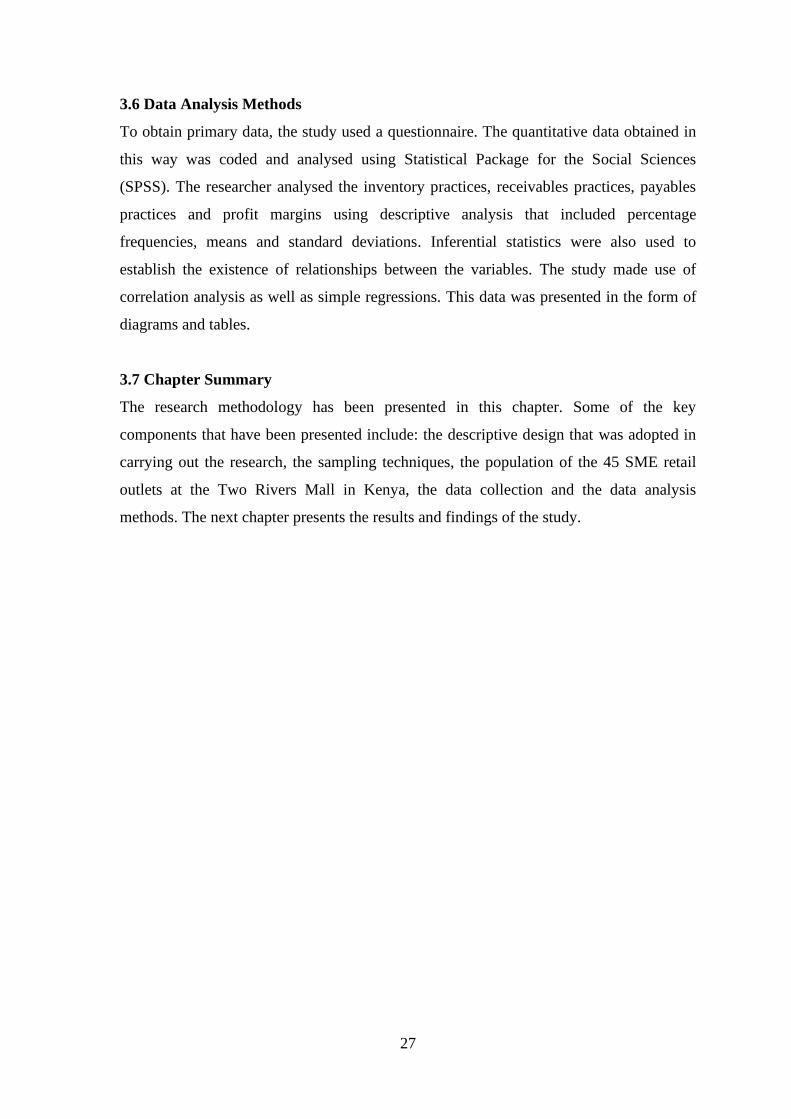
Figure 4.2 Gender ..............................................................................................................29
Figure 4.3 Level of Education ...........................................................................................29
Figure 4.4 Years Worked ...................................................................................................30
Figure 4.5 Position in the SMEs ........................................................................................30
Figure 4.6 Inventory Management Practice Effect ............................................................36
Figure 4.7 Inventory Management Practices Challenges ..................................................36
Figure 4.8 Receivables Management Practice Effect ........................................................42
Figure 4.9 Receivables Management Practices Challenges ...............................................42
Figure 4.10 Payables Management Practice Effect ...........................................................47
Figure 4.11 Payables Management Practices Challenges ..................................................47
xii
LIST OF ABBREVIATIONS
AR: Accounts Receivable
AP: Accounts Payable
ANOVA: Analysis of Variance
CBK: Central Bank of Kenya
CCC: Cash Conversion Cycle
EOQ: Economic Order Quantity
GDP: Gross Domestic Product
GLS: Generalized Least Squares
GWCL: Ghana Water Company Ltd
KNBS: Kenya National Bureau of Statistics
NACOSTI National Commission for Science, Technology and Innovation
NWC: Net Working Capital
NSE: Nairobi Securities Exchange
NYSE: New York Stock Exchange
OLS: Ordinary Least Squares
SMEs: Small and Medium Enterprises
SPSS: Statistical Package for the Social Sciences
UK: United Kingdom
US: United States
WC: Working Capital
WCM: Working Capital Management
ROA: Return on Asset
1
CHAPTER ONE
1.0 INTRODUCTION
1.1 Background of the Study
Working capital is an important element in corporate financial management. It is
considered so primarily because it directly affects the profitability of the firm (Ullah,
Zahid, Khan, and Islam, 2018). Corporate finance traditionally focuses on the role that
long-term financing decisions play in the functioning of a business. In fact, researchers
have particularly offered empirical findings analysing capital investments, capital
structure, dividend policies or company value, among other topics. Yet, a significant
portion of a firm’s capital structure is represented by short-term assets and other resources
that mature in less than a year. This implies that the financial management of a business
hinges on the management of its short-term operations which then drive to the long-term
goals (Kasozi, 2017). According to Aktas, Croci and Petmezas (2015), Efficient Working
Capital Management (WCM) translates into superior performance because it allows firms
to redeploy underutilised corporate resources to high-value use. According to Singh and
Kumar (2017) a firm has to maintain a proper level of investment in working capital to
avoid the uncertain cash inflow and outflow situation. Suitable liquidity and profitability
scenarios are the main two objectives of WCM but not at the cost of one another. Thus,
each enterprise should make a trade-off between these two objectives to enhance the
efficiency of WCM (Singh and Kumar, 2017).
The management of working capital and the role it plays in advancing financial
performance continues to steer debate among scholars and practitioners alike. The current
thrust of empirical study on the relationship between working capital management and
financial performance is directed towards informing policy on the appropriate current
asset-liability mix which maximizes a firm’s profitability while minimizing its risk
(Jajongo and Makori, 2013). Further, it is notable that a significant portion of the existing
research concentrates on developed rather than on developing economies (Qurashi and
Zahoor, 2017; Samiloglu and Akgun, 2016). The question then arises on whether the
working capital methodologies used on firms in the developed economies apply to firms
within the developing economies whose contrasting economic conditions affect them in
distinct ways.

2
At the same time, there is a massive debate in the existing literature as to which level of
working capital is good for the firm. Arguments exist on supporting both for holding high
and low amount of working capital. One study established that the nature of the
relationship between working capital level and firm profitability depends on the particular
WCM approach preferred by a firm (Afrifa and Padachi, 2016). The consensus is that low
investment in working capital (aggressive policies) may result in outcomes such as loss of
sales and disruptions in the production process, leading to lower profitability. A firm can
apply aggressive policy of WCM by decreasing investment in both the accounts
receivable and inventory. Reducing inventory cost leads to higher firm profitability
because of a decrease in inventory holding costs (Afrifa and Padachi, 2016).
In contrast, a conservative WCM strategy (signifying higher investment in working
capital) may lead to boosting sales by increasing both inventories and trade receivables in
order to increase profitability (Afrifa and Padachi, 2016). Majority of the empirical
studies relating WCM with profitability support the fact that aggressive policy enhances
profitability. One study investigating 65 Pakistani companies for the period between 2005
– 2009 found significant correlation with market value and firm profitability and the
various components of working capital (Alam, Ali, Rehman and Akram, 2011). Another
study analyzing the relationship between WCM and profitability documented a positive
coefficient with Cash Conversion Cycle (CCC), using of a sample of 88 New York Stock
Exchange (NYSE) listed United States (US) manufacturing firms for the period of 2005
to 2007 (Gill, Biger and Mathur, 2010). From their standpoint, the higher the CCC, the
higher the profitability of the firm.
Banos-Cabellero, Garcia-Teruel and Martinez-Solano (2014), focuses on Spanish SMEs
and documents a concave relationship between Net Working Capital (NWC) and firm
performance. Afrifa, Tauringana and Tingbani (2015) investigate the relationship
between Cash Conversion Cycle (CCC) and the profitability of United Kingdom (UK)
Small and Medium-Sized Enterprises (SMEs). Evidence from the study reveals an inverse
U-shape relationship between CCC and Return on Assets (ROA). Tauringana and Afrifa
(2013) examined a relationship to inspect the relative significance of WCM, measured by
cash conversion cycle and its components that are inventory, Account Receivable (AR),
and Account Payable (AP) to the profitability of listed SMEs. By applying the panel data
regression analysis, they concluded that AP and AR are important for the profitability of
3
SMEs (Tauringana & Afrifa, 2013). Likewise, Wasiuzzaman (2015) also documented the
relationship between working capital investment and firm value based on Malaysia by
using data from 192 firms over a period of 8 years (from year 2000 to 2007). Results of
multiple regression analysis indicate that firm value is considerably increased by
progresses in WCM and specifically factual for financially constrained firms. Hence, this
study also suggests, to evaluate a firm, investors should not only focus on firm’s capital
structure, dividend and investment policies but also their working capital strategy in order
to pick the suitable investment alternatives (Wasiuzzaman, 2015).
In Kenya, recent literature on working capital is by Mathuva (2015), whose findings were
that profitable firms on the Kenyan market were found to take less time in collecting cash
from their customers, thereby enforcing low average collection period. Profitability is the
primary goal of all business ventures. A company’s profitability is the ability of a
business to make gains from operations. Profit is a company’s revenue net the expenses
involved in the revenue generation (Hofstrand, 2013). Without profitability a business
will not survive for a long time. It is therefore important that any business keeps track of
both the current and past profitability.
Profitability is measured using the income and expenses from the business. Income
represents money generated from the various activities of the business. One of the ratios
that is used in measuring profitability of a business or company’s performance is the
gross profit margin (Hofstrand, 2013). Gross profit margin measures company's
manufacturing and distribution efficiency during the production process. It is a
measurement of how much of each dollar of a company's revenue is available to cover
overhead, other expenses and profits. The ideal level of gross profit margin depends on
the type of industries, the length of time the business has been in operation and other
factors. A high gross profit margin indicates that the company can make a reasonable
profit, so long as the company or business keeps the overhead cost in control.
On the other hand, a low gross margin indicates that the business is unable to control its
production cost (Hofstrand, 2013). Measuring profitability is the most important step to
measure the success of a business. A business which is not profitable cannot survive for
long. Conversely, a business that is highly profitable will always have a reasonable
turnover and is able to reward its owners with a large return on their investment.

4
Increasing profitability should therefore be one of the most important tasks of the
business managers. Managers should constantly look for ways to improve running of the
business so that profitability can be improved. SMEs play key roles in various economies
worldwide. SMEs are the backbone of all economies and their importance as an impetus
to economic development especially in developing economies cannot be over-
emphasized. They serve as dynamic forces and agents of change as they stimulate
economic growth.
1.2 Statement of the Problem
Working capital is an important component in the financial decision of the company. An
optimal working capital management is reached through a trade- off between profitability
and liquidity. This study aimed to provide empirical evidence about the effects of
working capital management on the profitability of SMEs at Two Rivers Mall.
Traditionally, the corporate finance literature has studied long-term financial decisions
like investments, capital structure, company valuation or dividends. However,
management of short-term assets and liabilities deserves a careful analysis since working
capital management has an important effect on the firm’s profitability as well as its risk.
Consequently, to minimize risk and to improve the overall performance, financial
executives must monitor continuously each of working capital components, i.e.,
receivables, inventories, and payables. An optimal level of working capital management
would be reached by achieving a balance between liquidity and profitability. In fact, if the
company adopts a working capital management policy with an excessive level of current
assets, the risk of liquidity may be reduced. Conversely, the company bears the
opportunity cost of funds that may have been invested in long term assets. Though the
effect of working capital management on profitability is important, only a few empirical
studies have been conducted to observe this relationship.
In the Kenya government blueprint for 2020, the government acknowledged the need for
SMEs to be strengthened to move to a middle- income country (Republic of Kenya,
2010). According to a national survey done by Kenya National Bureau of Statistics
(KNBS) in 2016 SMEs contributed 33.8 percent to national Gross Domestic Product
(GDP) in 2015 and 81.1 percent of employment. The survey established that there were
1.56 million SMEs licensed by county governments while the unlicensed business
5
identified from the households were 5.85 million. A total of 2.2 million SMEs was closed
in the last five years, 2016 inclusive. The closed businesses consisted of majority of
SMEs which accounted for 73.5 percent. On average the businesses closed at 3.8 years.
A survey by the Kenya National Bureau of Statistics released in 2018 indicated that
approximately 400,000 micro small and medium enterprises do not celebrate their second
birthday and very few SMEs reach their fifth birthday, leading to concerns of
sustainability in this critical sector. While opening the SME Financing Africa Forum
2018 in May last year, Central Bank of Kenya (CBK) Governor Patrick Njoroge pointed
out that 46% of Kenya’s SMEs close within a year of founding. This being the case, the
study intends to investigate whether these closures could be attributed to poor working
capital management, with a focus on the SMEs that are located at the Two Rivers Mall.
Therefore, this research investigated enterprises in Two Rivers Mall in order to find out
the best working capital practices that were in use, with a view of identifying capital
management gaps and proposing the best practices to be adopted to ensure business
growth, profitability, expansion and longevity.
1.3 Purpose of the Study
The purpose of the study was to examine the effects of management of working capital on
the profitability of SMEs.
1.4 Research Questions
This study sought to answer the following research questions:
1.4.1 How does inventory management practices affect profitability of SMEs at Two
Rivers Mall?
1.4.2 What is the effect of receivables management practices on the profitability of SMEs
at Two Rivers Mall?
1.4.3 How does payables management practices affect profitability of SMEs at Two
Rivers Mall?
1.5 Justification of the Study
This study attempts to highlight the role of working capital management in the
profitability of SMEs in Kenya. This study may be of use to the following parties:

6
1.5.1 Small and Medium Enterprises
The recommendations and findings of this study may help SMEs understand the effects of
working capital management on profitability so as to enhance growth and success.
1.5.2 Business Advisors
The financial sector is a dynamic industry that is characterised by a highly changing
environment. Information that was gathered during the study may be used by business
advisors in their work as it cuts across a broad spectrum of businesses. Equally, the study
may be used by other firms such as microfinance institutions.
1.5.3 Makers of Policy
One of the pillars of Vision 3030 is the economic pillar. SMEs play a vital role in the
realization of this pillar. The study may provide findings that could be used by
policymakers to propose government interventions and policies that could promote
economic growth and achievement of vision 2030.
1.5.4 Researchers and Scholars
Other scholars and researchers may find this study important because it may be used as a
basis for empirical review. Additionally, the study offers suggestions for further studies
that may be conducted in this area.
1.6 Scope of the Study
The target population of the study was the 45 SMEs who were at the time trading at the
Two Rivers Mall. The study aimed at examining financial data from the retail outlets for
the period 2018 to 2019. The study involved the administration of questionnaires
personally. The study was carried out in a span of three months in the first half of 2020.
1.7 Definition of Terms
1.7.1 Working Capital Management
Management of working capital is defined as all management actions and decisions that
ordinarily influence the size and effectiveness of the working capital. Therefore, the aim
of working capital is to optimally manage current assets and current liabilities such that

7
an acceptable level of net-working capital can be achieved (Umoren and Udo, 2015).
AlShubiri (2011) defined working capital as the amount of a business current assets that
are being financed by long-term debts and/or equity.
1.7.2 Profitability
An enterprise must make profit from all its business activities. Profitability shows how
efficiently the management uses all the resources available in the market. Profitability in
the words of Onyam, Usang and Enyisi (2015) means the ability to make profit from all
the business activities of an organization, company, firm, or an enterprise.
1.7.3 Small and Medium Enterprises
Small and medium-sized enterprises are non-subsidiary, independent firms which employ
fewer than a given number of employees. This number varies across countries. The most
frequent upper limit designating an SME is 250 employees, as in the European Union.
However, some countries set the limit at 200 employees, while the United States
considers SMEs to include firms with fewer than 500 employees. Small firms are
generally those with fewer than 50 employees, while micro-enterprises have at most 10,
or in some cases 5, workers (OECD, 2005).
1.8 Chapter Summary
This chapter presents a background on working capital management and its role in the
profitability of SMEs. The chapter entails the background of the study, statement of the
problem, purpose of the study, research questions, justification of the study, scope of the
study and a definition of key terms. Chapter two presents literature reviewed based on
research questions. Chapter three is the research methodology. Chapter four presents the
results and figures of the study, and chapter five is the discussions, conclusions, and
recommendations of the study.

8
CHAPTER TWO
2.0 LITERATURE REVIEW
2.1 Introduction
This chapter presents the empirical review of the independent and dependent variables.
The subsequent sections examine international and local studies on this. This study has
three independent variables: inventory management, receivables management and
payables management. It aims to determine the impact of these variables on the
profitability of SMEs. Sound working capital management is crucial to the survival of an
organization. It is also imperative for the growth of an organization. The management of
inventory, receivables and payables is a significant component of a firm’s working capital
management. This present study empirically examines the effect of efficiency of working
capital management on the firm’s profitability of SMEs. The study examines one key
indicator of the profitability of SMEs, the gross profit margin.
2.2 Inventory Management Practices and Profitability
2.2.1 Inventory Management Practices
Deveshwara and Dhawal (2013) proposed that inventory management is a method that
companies use to organize, store, and replace inventory, to keep an adequate supply of
goods at the same time minimizing cost. According to Stevenson (2010), Inventory
Management is defined as a framework employed in firms in controlling its interest in
inventory. It includes the recording and observing of stock level, estimating future
request, and settling on when and how to arrange. An effective and efficient management
inventory flow across the value chain is one of the key factors for success of large and
small enterprises. The challenge in managing inventory is to balance the trade-off
between the supplies of inventory with demand. Ideally a company wants to have enough
inventories to satisfy the demands of its customers no lost sales due to inventory stock-
outs. On the other hand, the company does not want to have too much inventory staying
on hand because of the cost of carrying inventory. Inventory decisions are high risk and
high impact for the supply chain management of an organization.
Excessive inventories are one of the most important problems faced by many companies
all over the world. Inventories are engaged funds, and when unproductive, freeze high
capital of the company. Inventories also cause an increase in costs associated with their
maintenance and service. This is especially important today, when the rising cost of

9
operations and increase competition in the market eliminate companies which are not
effective in costs reduction (Ganas and Hyz, 2015). However, the question of whether
inventory reduction has been achieved and whether it has been beneficial to firm’s
performance have not been subject to systematic investigation. One study by Ganas and
Hyz (2015) in Greece examines Greek inventories using data from the SME sector in the
region of Epirus in Greece. The study selected a selection of small and medium
enterprises because these companies are the basis of the economy of Greece in general. It
assumed that improper management of inventories is one of the main reasons behind
failure or poor financial performance of many Greek SMEs. This study hypothesized that
there is a positive relationship between inventory management and firm performance.
This study was conducted on a sample of financial data for 612 firms over the ten years
period. By employing correlation and regression techniques the impact of inventory
management and firm’s profitability was found to be significantly negative. This led to
the conclusion that less profitable firms have worst inventory management measures.
Therefore, managers can create profits for their companies by managing efficiently the
inventories and their components’ measures, leading to an optimum level.
Ashok (2013) investigated the existence of relationship between stock management and
how profitable an enterprise is, in the context of organizations under cement sector in
India. The independent variable in the investigation, earnings prior to interest as well as
tax was employed as a proxy for profitability and the existence of any significant
relationship between stock management and how profitable a company becomes was
conducted using five leading cement manufacturing organizations in India. The
investigation applied regression analysis in ascertaining the effect of stock conversion
period on profit before interest and tax. The results indicated the existence of a
statistically significant but negative linear relationship between stock conversion period
and profit before interest and tax. The investigation revealed that how profitable an
organization becomes has a statistically negative relationship with stock management.
Another study by Atnafu and Balda (2018) examined the impact of inventory
management practice on firms’ competitiveness and organizational performance from
micro and small enterprises in Ethiopia. The finding of this study implies that enhanced
competitive advantage and increased organizational performance could have improved
the levels of inventory management practice. The increased competitiveness of a firm

10
may enable a firm to implement a higher level of inventory management practice due to
the need to outperform its competitors constantly and keep its competitive position. On
the other hand, enhanced organizational performance provides a firm increased capital to
implement various scientific inventory management techniques. To this end, the study
provided empirical evidence to support the literature regarding the impact of inventory
management practices.
The impact of working capital management on profitability was investigated by Agha,
Mba and Mhil (2014). The authors used data collected from Glaxo Smith Kline listed
pharmaceutical company in Karachi Stock Exchange for the years 1996-2011. Return on
assets ratio had been used for the measurement of profitability, while accounts receivable
turnover, creditors turnover, inventory turnover, and current ratio for the measurement of
working capital. The study found that the Working Capital (WC) significantly affects
firm's profitability, and profitability can be enhanced through minimizing inventory
turnover, accounts receivable ratio, and through reducing creditors' turnover ratio. In
addition, the study found that no significant effect of current ratio on the profitability of
firms.
Akinyomi (2014) examined the association between inventory management and the
profitability of Nigerian manufacturing firms. Information for the study was obtained
from secondary sources, specifically the audited financial statements of the
manufacturing companies for the period 2008 to 2012. Return on equity was used as a
proxy for profitability, while inventory conversion period was used as a proxy for
inventory management. Findings from the analysis revealed the existence of statistically
no significant relationship between stock management and the profitability of
manufacturing companies.
Kung’u (2016) studied the effects of inventory control on the profitability of industrial
and allied firms in Kenya. The results of the study showed that when firms maintain good
inventory control systems, the firms’ profits are high. The firms should install modern
inventory control systems such as economic order quantity and just in time. These
inventory control systems help firms maintain optimal inventory levels. Maintaining
optimal inventory levels reduces cost of possible interruptions or loss of business due to
scarcity of products at the same time it reduces high cost of maintaining stock. Cost of
11
high stock includes stock theft, expiry, insurance, and storage. In light of Economic Order
Quantity (EOQ) model, costs must be maintained at minimal level between stock holding
and ordering. The firms should also be able to put in place an effective stock management
system that ensures reliable sales forecast to be used in order purposes. The findings of
inventory control on profitability of manufacturing firms in Kenya showed that finance
managers of manufacturing firms take precautions to ensure that their firms maintain
ideal levels of inventories of both raw materials and finished goods. This may have led to
increased profitability of manufacturing firms in Kenya and therefore it can be concluded
that there exists a positive and significant relationship between inventory control and
profitability.
A study carried out by Mathuva (2010) on the influence of working capital management
components on corporate profitability found that there exists a highly significant positive
relationship between the period taken to convert inventories into sales and profitability.
This meant that firms maintained sufficiently high inventory levels which reduced costs
of possible interruptions in the production process and loss of business due to scarcity of
products.
Mwaura (2017) carried out a study on the effect of inventory turnover on the financial
performance of medium and large retail supermarkets in Kenya. The study adopted
descriptive cross-sectional research design. The data to be collected included sales, cost
of goods, current assets and liabilities, total assets, total liabilities, profit before interest
and tax, closing inventory balance and net profit for each year. The results were analysed
using stata software. The data collected covered the years 2012 - 2016. From the results
of correlation analysis, there is a strong positive and statistically significant correlation
between inventory turnover and financial performance of medium and large retail
supermarkets in Kenya.
2.2.2 Profitability
Anser and Malik (2013) study investigated how cash conversion cycle affects the firms’
profitability of listed manufacturing companies of Pakistan. The study took into
consideration 5 years financial statements data starting from 2007 to 2011. Results

12
showed that manufacturing companies are having low average return on asset and high
average return on equity with reasonable average cash conversion cycle. Regression
results after adjusting for heteroskedasticity of data to minimize the effects of outliers,
showed that cash conversion cycle having significantly inverse association with both
return on assets and equity indicating that the lesser the cash conversion cycle the greater
would be the profitability, measured through return on assets and equity.
Muturi (2015) investigated the effects of cash conversion cycle on profitability of Tea
Factories in Meru. A census method was used to collect primary data from all the seven
tea factories in the county for a period of five years starting from 2009 to 2013. The
correlation and regression analyses were used to analyse and describe the nature of the
relationship between CCC and the firm’s profitability. A lot of literature has pointed out
that efficient management of cash has significantly influenced the firm’s profitability.
This study found out that the CCC significantly negatively affects the tea firm’s
profitability.
Mohamed (2013) studied the effect of cash conversion cycle on the profitability of firms
listed on the Nairobi Securities Exchange. The relation between the firm’s cash
conversion cycle and its profitability is examined using dynamic panel data analysis for a
sample of firms listed on The NSE for the period from 2008 to 2012. The analysis is
applied at the levels of the full sample and divisions of the sample by industry and by
size. The results indicated that there is a significant and negative relationship between the
cash conversion cycle and return on asset. The firms with shorter cash conversion cycles
are more likely to be profitable than firms with longer cash conversion cycles.
2.3 Receivables Management Practices and Profitability
2.3.1 Receivables Management Practices
Accounts receivable represents money owed to a business in return for goods already
delivered or services already rendered. Proper maintenance of accounts receivable helps
an organization maintain customer loyalty, track customer credit and uncollected profits.
However, many organizations nowadays encounter numerous challenges regarding their
invoicing and accounts receivable process (Munene and Tibbs, 2018)

13
Receivable management is an important fact of financial management, this is because
excessive level of current assets and low level of current assets may lead to negative
effect on a firm’s profitability and difficulties in mediating smooth operation (Duru,
Ekwe and Okpe, 2014).
According to Deloof (2013) management of accounts receivables which aims at
maintaining an optimal balance between each of the accounts receivables components,
that is, cash, receivables, inventory and payables is a fundamental part of the overall
corporate strategy to create value and is an important source of competitive advantage in
businesses. The management of accounts receivable is largely influenced by the credit
policy and collection procedure of a firm. Accounts receivable represents the rate at
which the firm collects payments from its customers (Sharma and Kumar 2011).
The key principles of accounts receivable management that a firm should adhere to are
ageing of accounts receivable, evaluating the potential customers ability to pay using
criteria such as integrity of the customer, financial soundness, collateral to be pledged and
current economic conditions should be analysed, establishment of credit terms and limits,
collection of trade credit, assessment of default risk and responsibility and the financing
of accounts receivable until it has been paid by the purchaser (Schaum, 2011).
Shin and Soenen (2013) observed that a well-managed enterprise normally keeps average
collection period normally lesser than average payment period so as to minimize
investment in receivables and also honour its short time obligations on time minimizing
cost of funds. Average payment period is basic test of the business’s good or bad activity
or operation and its important symbol for making good planning for increase or decrease
working capital efficiently. This is because working capital is more effected from sundry
debtors and sundry creditors.
Pais and Gama (2015) examined the effects of working capital management on the
profitability of Portuguese firms. Panel regressions and instrumental variables were used
to model a sample of 6,063 Portuguese SMEs, covering the period 2002-2009. Results
indicated that a reduction in the inventories held and in the number of days that firms take
to settle their commercial liabilities and to collect payments from its customers are
associated to higher corporate profitability.

14
Ramana, Ramakrishnaiah and Chengalrayulu (2013) studied the impact of managing
receivables on the working capital and profitability of cement companies in India.
Ramana et al. found that selected companies from cement industry were efficient in
managing their receivables and this was reflected in lower collection period. The efficient
receivables management was found to have a positive impact on both working capital and
profitability.
Venkata, Ramakrishnaiah and Chengalrayulu (2013), in their study “impact of receivables
management on working capital and profitability: A study of selected cement companies
in India”, collected their data from the Annual Reports of the selected cement companies
from 2001 -2010. The ratios which highlight the efficiency of receivables management
viz, receivables to current assets ratio, receivable to total assets ratio, receivable to sales
ratio, receivable to turnover ratio, average collection period, working capital ratio,
profitability ratio were analysed using Analysis of Variance (ANOVA) statistical tools to
know the impact of working capital on profitability of the selected cement companies.
The investigation revealed that the receivable management across cement industry is
efficient and showed significant impact of working capital on profitability.
Ksenija (2013), investigated how public companies listed at the regulated market in the
republic of Serbia managed their accounts receivable during recession times. A sample of
108 firms was used. The accounts receivables policies were examined in the crisis period
of 2008- 2011. The short-term effects were tested, and the study showed that between
accounts receivables and two dependent variables on profitability, return on total asset
and operating profit margin, there is a positive but no significant relation. This suggests
that the impact of receivables on firm’s profitability changes in times of crisis.
Kakeeto, Timbirimu, Kiizah and Olutayo (2016) studied the effects of account receivable
management and organizational profitability in Mbale Uganda. By testing the hypothesis:
Accounts Receivable Management has a significant positive effect on organizational
profitability. Using a descriptive research design and a case study strategy, they collected
data from the respondents in terms of the two variables. The findings revealed that
revealed that accounts receivable management positively affected organizational
profitability.

15
Akinleye and Adebowale (2019) examined account receivable management and
performance of manufacturing firms in Nigeria. Specifically, the study analysed the effect
of book value of accounts receivable on return on capital employed of manufacturing
firms in Nigeria. It also examined the effect of anticipated bad debt on profitability of
manufacturing firms in Nigeria and analysed the effect of sales growth on return on
capital employed of manufacturing firms in Nigeria. The study sampled 10 manufacturing
firms from the Nigerian Stock Exchange covering a period of 10 years spanning from
2007 to 2016. The study concluded that, accounts receivable has the capacity to
significantly impede the level of performance of manufacturing firms in Nigeria,
especially when measured in terms of return on capital employed. Also, increase in the
anticipated bad debt does not significantly contribute to improved performance of
manufacturing firms in Nigeria. Finally, the study established that though sales growth
has positive impact on performance of manufacturing firms, such positive impact is not a
significant guarantee for improved return on capital employed.
Oware, Samanhyia and Ampong (2015), demonstrated that when a firm does not invest
well in the collection of account receivable then the probability that a firm will stagnate
as a result of very poor account receivables levels and debt accumulation would be high.
This is clearly shown on how the operations of Ghana Water Company Ltd (GWCL) were
affected. When accounts receivable takes a long time to be collected; it becomes
impossible investing in production for your next order. Uncollected amounts tie up
working capital unreasonably and may lead to long business cycles.
Dirie and Ayuma (2018) studied the effect of accounts receivable management on the
financial performance of Small and medium firm enterprises in Mogadishu city in
Somalia. The specific objectives of the study were to investigate the impact of cash flow
management, credit management and credit policy management on financial performance
which are the vital elements of whole concept of account receivable management. The
results reveal for cash flow management, debt management, credit policy management
and inventory management were found to have positive significant correlations on
financial performance at 5% level of significance. The results imply that cash flow
management, credit policy management, inventory management significantly influenced
financial performance of the SME’s in Mogadishu Somalia.

16
Munene and Tibbs (2018) sought to determine the effects of accounts receivable
management on financial performance of Embu Water and Sanitation Company limited,
Embu County, Kenya. The objective of the study was to examine the effects of inventory
turnover period, average payment period, cash conversion period and average collection
period on financial performance of Embu Water and Sanitation Company Limited. The
study used secondary data which was obtained from the accounts and finance
departments. Inventory turnover period, average payment period, cash conversion period
and average collection period was all found to have a positive effect on financial
performance of Embu Water and Sanitation Company Limited.
Mbula, Memba and Njeru (2016) investigated the effect of accounts receivable on
financial performance of firms funded by Government Venture Capital in Kenya. They
found that there is a positive relationship between accounts receivables and financial
performance of firms funded by government venture capital in Kenya.
Lyani (2017) examined the relationship between Accounts Receivable Management
Practices and organizational growth and revealed that efficient Accounts receivable
management practices, when adopted by SMEs lead to growth. However, the study
focused on SMEs in Kakamega County, Kenya
2.3.2 Profitability
Iyewumi, Remy and Omotayo (2015) investigated the relationship between working
capital management and firm’s profitability in the oil and gas sector in Nigeria. The study
is based on secondary data collected from a sample of two listed oil firms in Nigeria for
the period 1995 to 2011. The results of correlation analysis and Ordinary Least Squares
(OLS) estimation technique provide that firm’s profitability in Nigeria is affected by; the
working capital management components which are; cash conversion cycle, average
days’ receivables, average days payables, average days inventories. Second, size of the
firm is equally another important variable found to affect the profitability of firms.
Sabo, Rabi, Usman, Fatima and Tjjani (2015) examined the impact of working capital
management on corporate profitability of 7 listed firms in Nigeria for the periods of 2008
to 2012. The results of descriptive statistics and Generalized Least Squares (GLS)

17
regression analysis confirmed a positive relationship among average collection period,
current ratio and the size of the firm with profitability and a negative relationship with
inventory turnover period and average payment period.
Nzioki, Kimeli, Abudho and Nthiwa, (2013) analysed the effects of working capital
management on the profitability of 9 manufacturing firms listed on the NSE. The result of
multiple regression and correlation analyses revealed that gross operating profit was
positively correlated with average collection period and average payment period but
negatively correlated with cash conversion cycle. The relationship between inventory
turnover in days and gross operating profit was insignificant.
Rehman, Khan and Khokhar (2014) researched the determinants of profitability of
petrochemical companies in Saudi Arabia. They examined the relationship of net profit
margin with creditors’ velocity, long-term debt to equity ratio, debtors’ turnover ratio,
inventory turnover ratio and total assets turnover ratio. The study found that creditors
velocity, long-term debt to equity ratio, inventory turnover ratio and total assets turnover
ratio have a significant relationship with profitability measured using net profit margin.
However, debtors’ turnover ratio did not show any significant relationship with net profit
margin.
Jindal (2017) established in his empirical study on the commercial vehicle industry in
India, done for the period 2009 to 2016 that there was evidence that an increase in the
debtors’ turnover will increase the profitability of the firm. Thus, the efficient
management of accounts receivables increases profitability.
Quayyum (2012) studied the relationship between corporate profitability and working
capital management. She found a positive relationship between the two variables for all
industries included in her study except for the food and allies’ industries in the Dhaka
Stock Exchanges in Bangladesh.
Afeef (2011) examined the relationship between corporate profitability and working
capital management. The study used a sample of 131 companies listed in the Athens
Stock. The study showed that there were significant returns between profitability,
measured through gross operating profit, and the cash conversion cycle. It is found that

18
the manager should be efficient enough in handling the cash conversion cycle and
keeping optimum level of account receivables, account payables and inventory.
2.4 Payables Management Practices and Profitability
2.4.1 Payables Management Practices
Accounts payable is an account that represents a company's obligation to pay off a short-
term debt to its creditors or suppliers. Accounts payable are suppliers whose invoices for
goods or services have processed but who have not yet been paid. Organizations often
regard the amount owing to creditors as a source of free credit. Accounts payable ratio
represents the rate firms pay to their suppliers. It is one of the major sources of secured
short-term financing (Gitman, 2009). Payables management forms a critical component of
the supply chain, under the area of procurement. As companies have become more aware
of the competitive advantages of supply chain management from cost efficiency, product
differentiation and value-added services so too has the task of managing the relationship
between payables and suppliers become fundamentally important (Ashok, 2013).
Afrifa (2016) used unbalanced panel data regression analysis on 6,926 non-financial
small and medium enterprises in UK from 2004 to 2013. The results suggest that firms
should consider their cash flow when making decision on working capital investment. To
improve performance, firms with limited cash flow should reduce their working capital
investment. However, firms with available cash flow should raise their working capital
investment.
Yahaya (2016) carried out a study on effects of working capital management on the
financial performance of the pharmaceutical firms in Nigeria. The study covered a period
of eight years 2006 to 2013. Data for the study was collected through secondary sources
using annual financial reports and bulletins of Nigeria stock exchange of the various firms
covering the period under study. The study found that average payment period was
significantly and positively related with financial performance.
Kumaraswamy (2016) investigated the impact of working capital on financial
performance of Gulf Cooperation Council Firms for a period of 2008-2014. Four
hypotheses pertaining to average payment period components were investigated using
linear regression models. The study identified positive relationship between average

19
payment period with profitability and a negative relationship amid average collection
period and firm profitability.
Madugba and Ogbonnaya (2016) investigated the effects of average payment period and
financial performance: evidence from manufacturing companies in Nigeria. The study
employed multiple regressions in analysing the data sourced from the published financial
statements of the firms under the study. A significant outcome of the study is that
Average Payment Period impacts on both earnings per share and return on capital
employed. The implication is that efficient management average payment period will
improve the financial performance of the manufacturing firms.
Madishetti and Kibona (2013) investigated the impact of average collection period and
average payment period on SMEs profitability in Tanzania. The study was carried out
using dependent variable as gross operating profit and independent variables as average
collection period and average payment period employing relevant information of 38
Tanzanian SMEs for the period from 2006 to 2011. The study employed regression
analysis to determine the impact of average collection period and average payment period
on gross operating profit taking current ratio, size of the firm, financial debt ratio as
control variables. The results indicated that there was a significant negative relationship
between average collection period and profitability. Positive relationship was observed
between average payment period and gross operating profit.
Igwebuike and Nankwo (2018) determined the impact of average payments period on
profitability of quoted insurance companies in Nigeria. The study was carried out using
Return on Assets as dependent variable and Average Payments Period as explanatory
variable. Return on Assets was used as a measure of profitability Data was collected from
the annual financial reports of 20 sampled insurance companies. For testing the
hypothesis, multiple regression technique was used. Current ratio, fixed financial total
asset ratio, debt asset ratio, growth and size were incorporated in the model as control
variables. The results indicated that Average Payments Period has a significant negative
impact on profitability. Based on the findings, the study recommended that Nigerian
insurance companies should endeavour to reduce their number of days accounts payables
optimally and concentrate on reducing the high variability in the average payables period
to enhance their corporate profits.

20
Nwakaego and Ikechukwu (2016) examined the effect of management of accounts
payable on the financial performance of Industrial domestic manufacturing companies in
Nigeria. They collected data from the financial reports of the companies. The study
showed that the relationship between accounts payable ratio and profitability is
statistically positive and significant. Nwakaego and Ikechukwu (2015) examined the
effect of the management of accounts payable on the profitability of brewery companies
in Nigeria. The variables included, accounts payable, debt ratio and sales growth rate.
Secondary sources of data were used for the period 2000-2011. The hypotheses were
tested using multiple regression analytical tools. The results showed that accounts payable
had negative but non- significant relationship with profitability ratio of the companies
under brewery manufacturing companies in Nigeria. Debt ratio had positive and
significant relationship, while sales growth rate was negative and significant with the
profitability ratio of Brewery companies in Nigeria.
Ullah, Islam and Khair (2017) examined the relationship between working capital
management and profitability of SMEs from Bangladesh. 10 SMEs were selected for the
period of 2013-2015.The study concluded that there is no significant relationship between
Accounts Payable and Return on Assets. Moodley and Muller (2017) examined the
management of payables and the return to investors of listed South African companies
over the period 1986 to 2014. The results of the study indicated that for those companies
in industries that have a significant investment in payables, there is a significant positive
association between changes in payable days and shareholder return.
Muchina and Kiano (2011) analysed the influence of working capital management on
firms’ profitability in Kenya. They used fixed panel data of 232 firms. The result
indicated that the average debtor day, stock turnover period and the cash conversion cycle
are significantly affecting the profitability of the firms. They found out also that the
manufacturing firms are in general facing problems with their collection and payment
policies.
Gakure, Cheluget, Onyango and Keraro (2012) analysed the relationship between
working capital management and performance of 15 manufacturing firms listed at the
NSE from 2006 to 2010. They used secondary data from a sample of 18 companies at the

21
NSE. A regression model was used to establish the relationship between the dependent
variable and the independent variables. Pearson’s correlation and regression analysis were
used for the analysis. The results indicated that there is a strong negative relationship
between firm’s performance and liquidity of the firm. The study found that there is a
negative coefficient relationship between accounts collection period, average payment
period, inventory holding period and profitability while the cash conversion cycle was
found to be positively correlated with profitability. However, the effects of the
independent variables except the average payment period were not statistically significant
though the overall model was statistically significant.
Achode and Rotich (2016) examined the effects of accounts payable on financial
performance of publicly listed manufacturing companies at NSE, Kenya. Census
sampling technique was employed, and the study used secondary data, which was
obtained from the companies’ statistics and journals at the NSE. A multiple regression
model was used to test the relationship between the Accounts payable and firm
performance. The results from this research suggested that in most of the manufacturing
firms listed at the NSE, there was a direct positive relationship between AP and the
dependent variable, Profitability and Liquidity,
2.4.2 Profitability
Tauringana and Afrifa (2013) examined 133 alternative investment market listed SMEs
during 2005-2009 by employing panel data regression analysis and a questionnaire
survey. They find that the management of accounts payable and accounts receivable is
important for SMEs profitability.
Tran, Abbott and Yap (2017) studied the relationship between working capital
management and profitability in Vietnamese small- and medium-sized enterprises and
find an increase in firms’ profitability from decreasing the number of days of accounts
receivable, accounts inventories and accounts payable to an optimal minimum.
Obeidat and Jawabri (2016) investigated whether the management of WC affects the
profitability of listed construction equipment firms in Abu Dhabi Securities Exchange.
Data of all listed construction equipment firms in Abu Dhabi Securities Exchange over
the period 2006-2013, had been used in the analysis. Rate of return on total assets had
22
used as an efficient measure of profitability. Inventory management had been measured
through number of days inventory outstanding, and receivables management had been
measured through the collection period in days. Moreover, number of days payables are
outstanding is used to measure payables management. The study concluded that inventory
management significantly affects the profitability of listed construction equipment firms
which agrees with the findings of prior related researchers. The study did not find a
significant effect of receivables management on the profitability of listed construction
equipment firms in Abu Dhabi Securities Exchange. This conclusion is not in agreement
with the conclusion of some prior research. The disagreement between this conclusion
and the conclusions of some prior similar research may be attributed to the nature of the
construction equipment firms, and to the values of the society, where selling on account
are made to selected good customers. The study also concluded that payables
management has no significant effect on profitability of listed construction firms in Abu
Dhabi Securities Exchange. This conclusion is not in agreement with prior related
research. This disagreement may be attributed to the credit policy, where only few
business organizations deal with credit sales.
Kaur and Singh (2013) carried out a study regarding the improvement of the value of
firms through WC. The objective of the study was to analyse the WC performance and its
impact on the value of firms. The authors analysed 164 Indian manufacturing companies
over the period of 2000-2010. The key finding of this study is that efficient management
of WC significantly affects the profitability of firms. In more details, the study found that
there is a wide opportunity to improve the efficiency and profitability of 145 firms among
the total of 164, through the improvement of working capital management.
Nzioki et al. (2013), investigated the impact of WCM on the profitability of industrial
listed firms on NSE. They claimed that the efficient management of WC is a vital issue
for firms' survival and profitability. The study analysed 9 manufacturing listed firms in
NSE, using correlation and multiple regression methods. The study shows that the gross
operating profit is positively correlated with both of average collection period and
average payment period. The study also found a negative correlation between gross
operating profit and cash conversion cycle. The study did not show a significant
correlation between gross operating profit and inventory turnover in days.

23
2.5 Chapter Summary
This chapter has presented a review of literature regarding the relationship between
inventory management, receivables management, payables management and profitability
of SMEs in various countries. The empirical review has provided measures used and
conclusions of studies. Effective working capital management assists a firm in achieving
improved liquidity through the management of the components of receivables, inventory,
and payables. The next chapter presents the research methodology of the study.

24
CHAPTER THREE
3.0 RESEARCH METHODOLOGY
3.1 Introduction
This chapter focuses on the methodology and approaches that were used to collect data
for this research. First, it discusses the research design. Second, it outlines the target
population. Third, it discusses the sample size and sampling procedure. Fourth, it outlines
the data collection procedure and lastly it discusses the data analysis technique.
3.2 Research Design
According to Kothari (2010), research design is the conceptual structure within which
research is conducted, it constitutes the blueprint for the collection, measurement and
analysis of data, as such the design includes an outline of what the researcher will do.
According to Sekeran (2010), a research design is overall plan that is adopted in
conducting a study in order to meet the objectives. In this respect, a research design aims
at answering the research questions of a given study.
In this study, descriptive research design was applied. As noted by Mugenda and
Mugenda (2008) a descriptive research design is defined a systematic empirical approach
where the researcher has no control of the independent variables of the study. In this
respect, the observations about independent variables are done in their natural settings.
This study therefore viewed that a descriptive research design was the most suitable for
data analysis, in data collection and analysis in order to assess the role of working capital
management on the profitability of SMEs in Kenya.
3.3 Population and Sampling Design
3.3.1 Population
Target population refers to all items that a given study wishes to make inferences about.
In research, a population is defined as the total number of units from which a researcher
seeks to select a sample to carry out a study (Cooper & Schindler, 2014). According to
Mugenda and Mugenda (2008) a target population entails all items, units, elements, or
people that form the analysis of the study. This study had a target population of all the 45
small and medium enterprises that were at the Two Rivers Mall.

25
Table 3.1 Target Population
Population Category-Retail Outlets Number of Outlets Percentage
Food and Beverage 4 9
Fashion 22 49
Footwear 3 6
Electronics 3 6
Home zone 3 6
Healthcare, Hair and Beauty 3 6
Arts/ Crafts Culture 4 9
Jewelers 4 9
Total 45 100
Source: Field Survey (2020)
3.3.2 Sampling Design
A sample design is a definite plan for obtaining a sample from a given population. It
refers to the technique or the procedure the researcher would adopt in selecting items for
the sample (Kothari, 2010). A sample design is therefore the framework that serves as the
basis for the selection of a sample survey.
3.3.2.1 Sampling Frame
For this study, a sample frame is defined as the list of all elements that form a population
from which a sample is drawn (Kothari, 2004). The sampling frame is closely related to
the population. According to Cooper & Schindler, (2014) the sampling frame is the list of
elements from which the sample is drawn. The sample frame for this study was composed
of all the trading tenants at the Two Rivers Mall.
3.3.2.2 Sampling Technique
Sampling technique is defined as the way in which a group of potential respondents are
selected as part of a sample size upon which a study is conducted (Cooper & Schindler,
2014). The sampling technique is used to choose the respondents. According to Kothari
(2004), for a target population of less than 100 elements, a census is most appropriate
technique. Since this study was only composed of only 45 retail outlets, a census study
was conducted. The researcher used purposive sampling procedure to select staff
26
depending on their ability to easily analyse and understand the problem of the study. This
was because the researcher believed it was convenient and time saving.
3.3.2.3 Sample Size
Since a researcher cannot feasibly conduct a research on an entire population, particularly
if the population is too large. As such using a sample to represent the population is the
most desirable scientific way of representing a population in a study. According to
Cooper and Schindler (2014), a sample size should adequately represent the population.
Mugenda and Mugenda (2008) define a sample size as the unit representation of a
population under a study. This means that if a population is large, a researcher can select
a small sample that is scientific and use it to represent the entire population. According to
Mugenda and Mugenda (2008), a sample should comprise between 10-30% of the
population, and a good population sample should be at least 10% and not more than 30%
of the entire population. In this study, the researcher conducted a census study of the
population.
3.4 Data Collection Methods
Drop and pick questionnaires and a checklist of documentary review were the essential
data instruments that the researcher used to collect data. The questionnaire comprised of
two parts. The first part was to collect background information on gender, age, education
and working experience. The second part composed structured questions based on the
research questions to collect data from the respondents.
3.5 Research Procedure
To be able to carry out the above study, the researcher first got a letter of authorization
from United States International University - Africa. Once this had been obtained, the
researcher sought to get letters of authority from the National Commission for Science,
Technology and Innovation (NACOSTI) as well as the Institutional Review Board. Once
the approvals were in place, an introductory letter was sent to all the operational
managers of the sampled retail outlets introducing the researcher and the purpose of the
study, as well as permission and co-operation from the respondents. After this, a research
assistant was hired to go out in the field and collect raw data.
27
3.6 Data Analysis Methods
To obtain primary data, the study used a questionnaire. The quantitative data obtained in
this way was coded and analysed using Statistical Package for the Social Sciences
(SPSS). The researcher analysed the inventory practices, receivables practices, payables
practices and profit margins using descriptive analysis that included percentage
frequencies, means and standard deviations. Inferential statistics were also used to
establish the existence of relationships between the variables. The study made use of
correlation analysis as well as simple regressions. This data was presented in the form of
diagrams and tables.
3.7 Chapter Summary
The research methodology has been presented in this chapter. Some of the key
components that have been presented include: the descriptive design that was adopted in
carrying out the research, the sampling techniques, the population of the 45 SME retail
outlets at the Two Rivers Mall in Kenya, the data collection and the data analysis
methods. The next chapter presents the results and findings of the study.

28
CHAPTER FOUR
4.0 RESULTS AND FINDINGS
4.1 Introduction
This chapter focuses on the study results and findings. The chapter follows the
chronology of the questionnaire, and it presents results and findings for general
information and response rate, results for inventory management practices and
profitability, receivables management practices and profitability, and payables
management practices and profitability. These are presented using diagrams and tables.
4.2 General Information and Response Rate
This segment of chapter provides the response rate of the study, as well as the biodata of
the respondents. It focuses on the respondents’ gender, level of education, years they have
been working in the SME sector as well as their position in the firm.
4.2.1 Response Rate
Forty-five questionnaires were distributed and upon cleaning the data, 39 were valid
while 6 were not. This provided the study with a response rate of 86.6% which was
sufficient as shown in Figure 4.1.
Figure 4.1 Response Rate
4.2.2 General Information
4.2.2.1 Gender
The respondents were requested to indicate their gender for research purposes, and Figure
4.2 indicates that 77% were male and 23% were female. The results indicate that majority
of the SME owners/ staff at Two Rivers Mall were male. This may be explained by the
nature of the SME sector in the country.
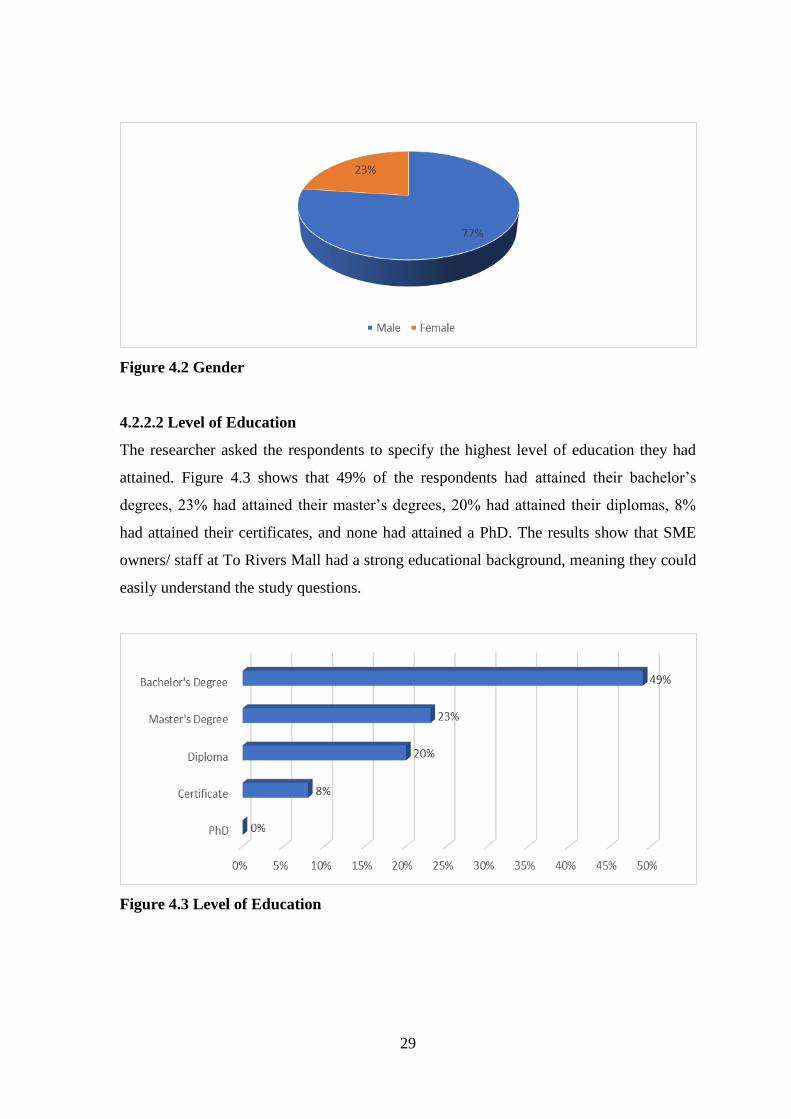
29
Figure 4.2 Gender
4.2.2.2 Level of Education
The researcher asked the respondents to specify the highest level of education they had
attained. Figure 4.3 shows that 49% of the respondents had attained their bachelor’s
degrees, 23% had attained their master’s degrees, 20% had attained their diplomas, 8%
had attained their certificates, and none had attained a PhD. The results show that SME
owners/ staff at To Rivers Mall had a strong educational background, meaning they could
easily understand the study questions.
Figure 4.3 Level of Education

30
4.2.2.3 Years Worked
The study was interested in establishing the number of years that the respondents had
worked for their respective SME organizations. Figure 4.4 indicates that 36% of the
respondents had been with their firms for 10 years and above, 31% had been with their
respective firms for 1-3 years, 20% for 7-9 years, and 13% for 4-6 years. The results
indicate that most majority of the respondents had worked for their respective firms for
over 10 years, and this made them best candidates for this study.
Figure 4.4 Years Worked
4.2.2.4 Position in the SMEs
The respondents were asked to indicate the position they held within their SME. Figure
4.5 shows that 41% of the respondents were managers, 38% were directors, 18% were in
finance, and 3% were regular staff. This shows that all levels of employees were captured
in the study, providing comprehensive results.
Figure 4.5 Position in the SMEs
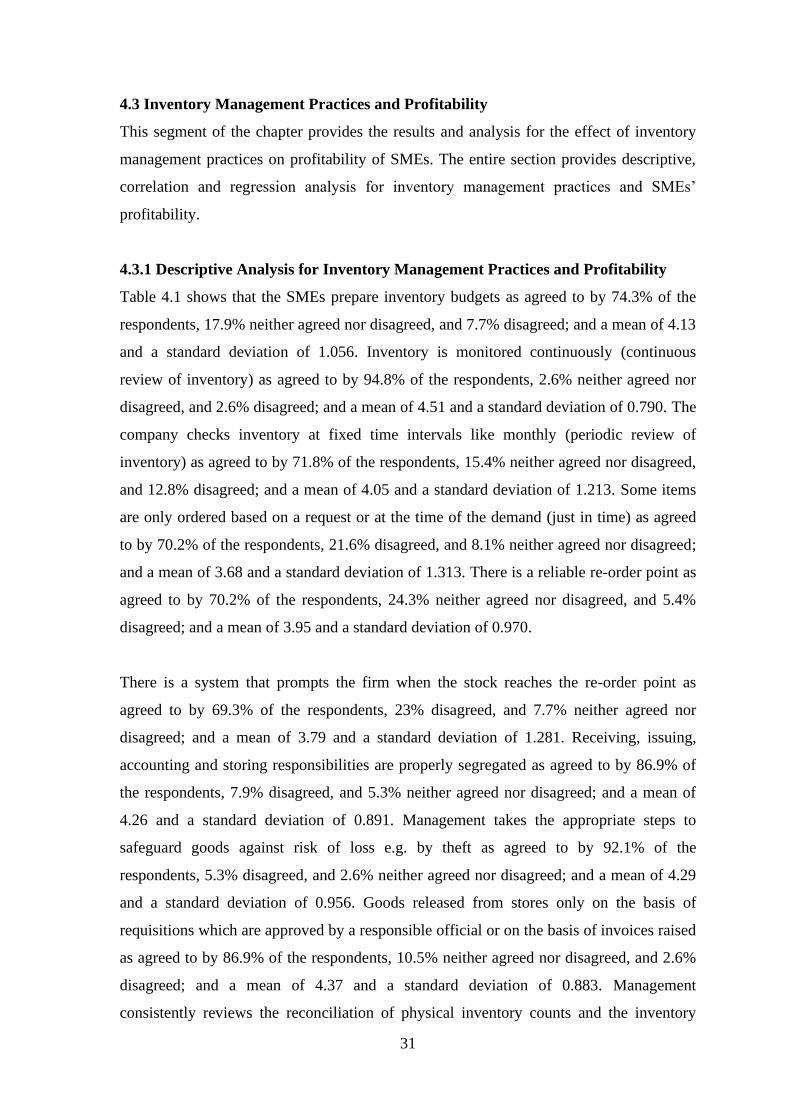
31
4.3 Inventory Management Practices and Profitability
This segment of the chapter provides the results and analysis for the effect of inventory
management practices on profitability of SMEs. The entire section provides descriptive,
correlation and regression analysis for inventory management practices and SMEs’
profitability.
4.3.1 Descriptive Analysis for Inventory Management Practices and Profitability
Table 4.1 shows that the SMEs prepare inventory budgets as agreed to by 74.3% of the
respondents, 17.9% neither agreed nor disagreed, and 7.7% disagreed; and a mean of 4.13
and a standard deviation of 1.056. Inventory is monitored continuously (continuous
review of inventory) as agreed to by 94.8% of the respondents, 2.6% neither agreed nor
disagreed, and 2.6% disagreed; and a mean of 4.51 and a standard deviation of 0.790. The
company checks inventory at fixed time intervals like monthly (periodic review of
inventory) as agreed to by 71.8% of the respondents, 15.4% neither agreed nor disagreed,
and 12.8% disagreed; and a mean of 4.05 and a standard deviation of 1.213. Some items
are only ordered based on a request or at the time of the demand (just in time) as agreed
to by 70.2% of the respondents, 21.6% disagreed, and 8.1% neither agreed nor disagreed;
and a mean of 3.68 and a standard deviation of 1.313. There is a reliable re-order point as
agreed to by 70.2% of the respondents, 24.3% neither agreed nor disagreed, and 5.4%
disagreed; and a mean of 3.95 and a standard deviation of 0.970.
There is a system that prompts the firm when the stock reaches the re-order point as
agreed to by 69.3% of the respondents, 23% disagreed, and 7.7% neither agreed nor
disagreed; and a mean of 3.79 and a standard deviation of 1.281. Receiving, issuing,
accounting and storing responsibilities are properly segregated as agreed to by 86.9% of
the respondents, 7.9% disagreed, and 5.3% neither agreed nor disagreed; and a mean of
4.26 and a standard deviation of 0.891. Management takes the appropriate steps to
safeguard goods against risk of loss e.g. by theft as agreed to by 92.1% of the
respondents, 5.3% disagreed, and 2.6% neither agreed nor disagreed; and a mean of 4.29
and a standard deviation of 0.956. Goods released from stores only on the basis of
requisitions which are approved by a responsible official or on the basis of invoices raised
as agreed to by 86.9% of the respondents, 10.5% neither agreed nor disagreed, and 2.6%
disagreed; and a mean of 4.37 and a standard deviation of 0.883. Management
consistently reviews the reconciliation of physical inventory counts and the inventory

32
records as agreed to by 92.3% of the respondents, 5.1% disagreed, and 2.6% neither
agreed nor disagreed; and a mean of 4.49 and a standard deviation of 0.790.
Table 4.1 Descriptive Analysis: Inventory Management Practices and Profitability
SD D A SA NA
M
Std.
Dev % % % % %
The company prepares inventory budgets 2.6 5.1 17.9 25.6 48.7 4.13 1.056
Inventory is monitored continuously.
Continuous review of inventory.
2.6 0 2.6 33.3 61.5 4.51 .790
The company checks inventory at fixed
time intervals (e.g. monthly). Periodic
review of inventory.
5.1 7.7 15.4 20.5 51.3 4.05 1.213
Some items are only ordered based on a
request or at the time of the demand. Just
in time
10.8 10.8 8.1 40.5 29.7 3.68 1.313
There is a reliable re-order point. 2.7 2.7 24.3 37.8 32.4 3.95 .970
There is a system that prompts you when
the stock reaches the re-order point.
5.1 17.9 7.7 30.8 38.5 3.79 1.281
Receiving, issuing, accounting and
storing responsibilities are properly
segregated.
0 7.9 5.3 39.5 47.4 4.26 .891
Management takes the appropriate steps
to safeguard goods against risk of loss
e.g. by theft
5.3 0 2.6 44.7 47.4 4.29 .956
Goods released from stores only on the
basis of requisitions which are approved
by a responsible official or on the basis
of invoices raised
2.6 0 10.5 31.6 55.3 4.37 .883
Management consistently reviews the
reconciliation of physical inventory
counts and the inventory records.
0 5.1 2.6 30.8 61.5 4.49 .790
A demand forecast states the needed
inventory that helps to overcome the
fluctuations in demand for our firm.
2.6 7.7 28.2 35.9 25.6 3.74 1.019
The firm has installed an inventory
control system
0 2.6 7.7 38.5 51.3 4.38 .747
The firm keeps accurate inventory
records.
0 2.6 5.3 36.8 55.3 4.45 .724
You have in place training programs to
educate staff in inventory management
practices
5.3 13.2 18.4 42.1 21.1 3.61 1.128
Good inventory management practices
have increased profit margins
2.6 2.6 10.3 35.9 48.7 4.26 .938
A demand forecast states the needed inventory that helps to overcome the fluctuations in
demand for our firm as agreed to by 61.5% of the respondents, 28.2% neither agreed nor

33
disagreed, and 10.3% disagreed; and a mean of 3.74 and a standard deviation of 1.019.
The firm has installed an inventory control system as agreed to by 89.8% of the
respondents, 7.7% neither agreed nor disagreed, and 2.6% disagreed; and a mean of 4.38
and a standard deviation of 0.747. The firm keeps accurate inventory records as agreed to
by 92.1% of the respondents, 5.3% neither agreed nor disagreed, and 2.6% disagreed; and
a mean of 4.45 and a standard deviation of 0.724. The firm has in place training programs
to educate staff in inventory management practices as agreed to by 63.2% of the
respondents, 18.5% disagreed, and 18.4% neither agreed nor disagreed; and a mean of
3.61 and a standard deviation of 1.128. Good inventory management practices have
increased profit margins as agreed to by 84.6% of the respondents, 10.3% neither agreed
nor disagreed, and 5.2% disagreed; and a mean of 4.26 and a standard deviation of 0.938.
4.3.2 Correlation Analysis for Inventory Management Practices and Profitability
The study conducted a correlation analysis between inventory management practices and
profitability of SMEs with the aim of understanding the sequence and strength of the
existing relationship between the variables, and the results were as shown in Table 4.2.
The table indicates that inventory management practices were very significant to
profitability of the SMEs (r=0.698, p<0.01). This showed that there existed a strong,
positive and statistically significant relationship between inventory management practices
and profitability of SMEs.
Table 4.2 Correlation Analysis: Inventory Management Practices and Profitability
SMEs
Profitability
Inventory Management
Practices
SMEs Profitability
Pearson Correlation
Sig. (2-tailed)
1
Inventory
Management Practices
Pearson Correlation
Sig. (2-tailed)
.698**
.000
1
** Correlation is significant at the 0.01 level (2-tailed)

34
4.3.3 Regression Analysis for Inventory Management Practices and Profitability
4.3.3.1 Model Summary for Inventory Management Practices and Profitability
The study conducted a regression analysis with the aim of describing the existing
statistical relationship between inventory management practices and profitability of
SMEs. Table 4.3 presents the results of the regression model summary, and the R square
value of 0.488 in the table, indicates that 48.8% of the variability of SMEs’ profitability
could be elucidated by inventory management practices, and the residual 51.2% could be
accounted for by additional factors that were not covered in this study.
Table 4.3 Model Summary: Inventory Management Practices and Profitability
Model R R Square Adjusted R Square Std. Error of the Estimate
1 .698ª .488 .474 .36896
a. Predictors: (Constant), Inventory Management Practices
4.3.3.2 Analysis of Variance (ANOVA) for Inventory Management Practices and
Profitability
The study carried out an Analysis of Variance (ANOVA) with the aim of determining the
level of variability between inventory management practices and profitability of SMEs as
well as test the significance of the relationship between the variables. Table 4.4 shows the
ANOVA between inventory management practices and profitability of SMEs. The great F
value of 35.207 df (1,37) <0.01 indicates that the regression analysis was significant for
the study because there existed a statistically significant variance between inventory
management practices and profitability of SMEs.
Table 4.4 ANOVA: Inventory Management Practices and Profitability
Model Sum of Squares df Mean Square F Sig.
1 Regression
Residual
Total
4.793
5.037
9.829
1
37
38
4.793
.136
35.207 .000ª
a. Predictors: (Constant), Inventory Management Practices
b. Dependent Variable: Profitability of SMEs
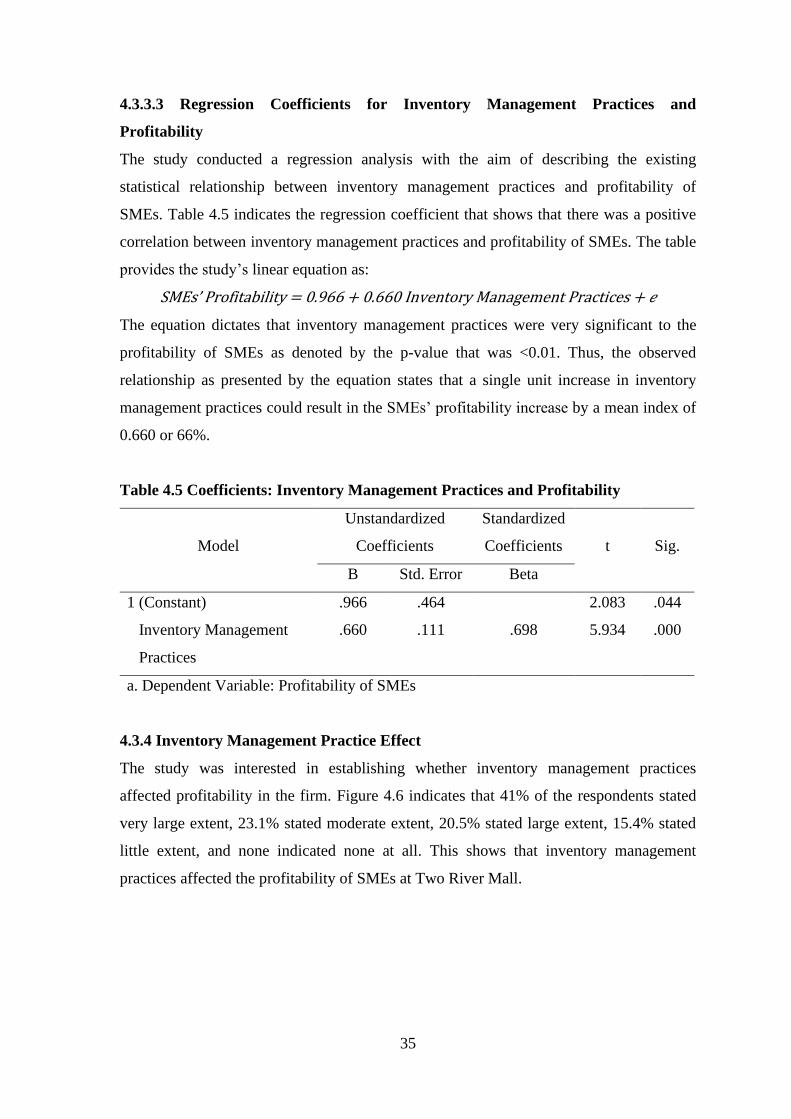
35
4.3.3.3 Regression Coefficients for Inventory Management Practices and
Profitability
The study conducted a regression analysis with the aim of describing the existing
statistical relationship between inventory management practices and profitability of
SMEs. Table 4.5 indicates the regression coefficient that shows that there was a positive
correlation between inventory management practices and profitability of SMEs. The table
provides the study’s linear equation as:
SMEs’ Profitability = 0.966 + 0.660 Inventory Management Practices + 𝑒
The equation dictates that inventory management practices were very significant to the
profitability of SMEs as denoted by the p-value that was <0.01. Thus, the observed
relationship as presented by the equation states that a single unit increase in inventory
management practices could result in the SMEs’ profitability increase by a mean index of
0.660 or 66%.
Table 4.5 Coefficients: Inventory Management Practices and Profitability
Model
Unstandardized
Coefficients
Standardized
Coefficients
t
Sig.
B Std. Error Beta
1 (Constant)
Inventory Management
Practices
.966
.660
.464
.111
.698
2.083
5.934
.044
.000
a. Dependent Variable: Profitability of SMEs
4.3.4 Inventory Management Practice Effect
The study was interested in establishing whether inventory management practices
affected profitability in the firm. Figure 4.6 indicates that 41% of the respondents stated
very large extent, 23.1% stated moderate extent, 20.5% stated large extent, 15.4% stated
little extent, and none indicated none at all. This shows that inventory management
practices affected the profitability of SMEs at Two River Mall.
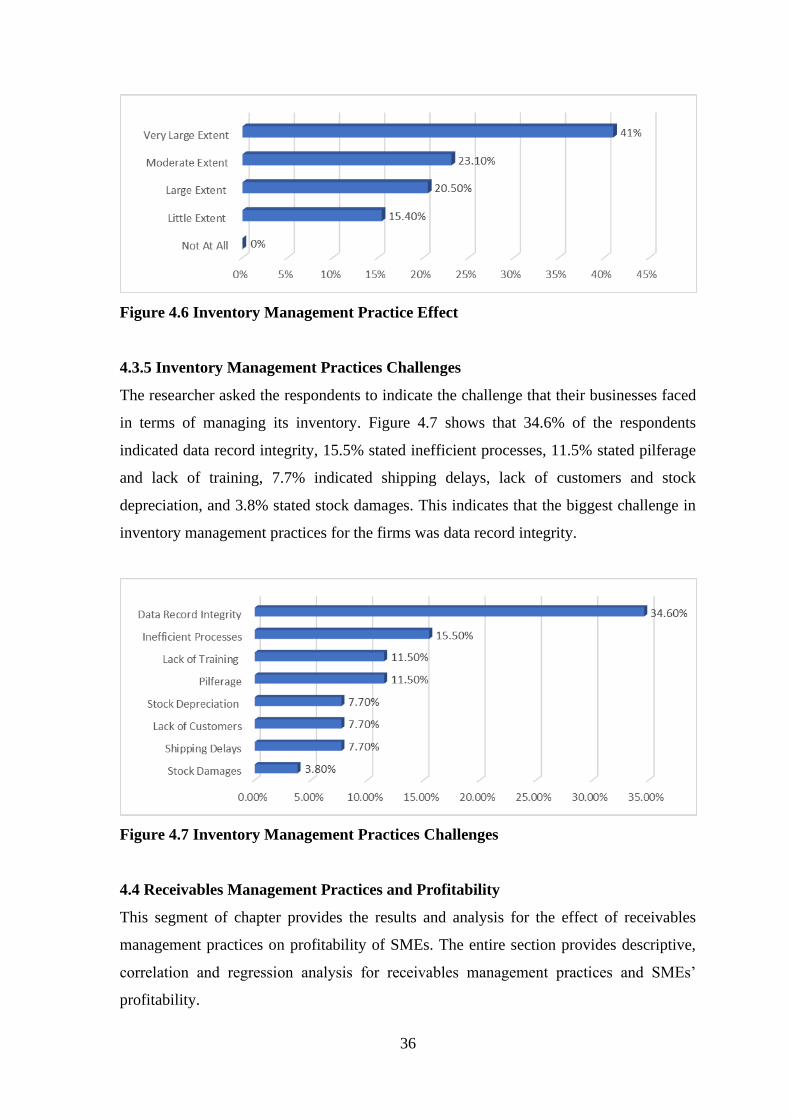
36
Figure 4.6 Inventory Management Practice Effect
4.3.5 Inventory Management Practices Challenges
The researcher asked the respondents to indicate the challenge that their businesses faced
in terms of managing its inventory. Figure 4.7 shows that 34.6% of the respondents
indicated data record integrity, 15.5% stated inefficient processes, 11.5% stated pilferage
and lack of training, 7.7% indicated shipping delays, lack of customers and stock
depreciation, and 3.8% stated stock damages. This indicates that the biggest challenge in
inventory management practices for the firms was data record integrity.
Figure 4.7 Inventory Management Practices Challenges
4.4 Receivables Management Practices and Profitability
This segment of chapter provides the results and analysis for the effect of receivables
management practices on profitability of SMEs. The entire section provides descriptive,
correlation and regression analysis for receivables management practices and SMEs’
profitability.
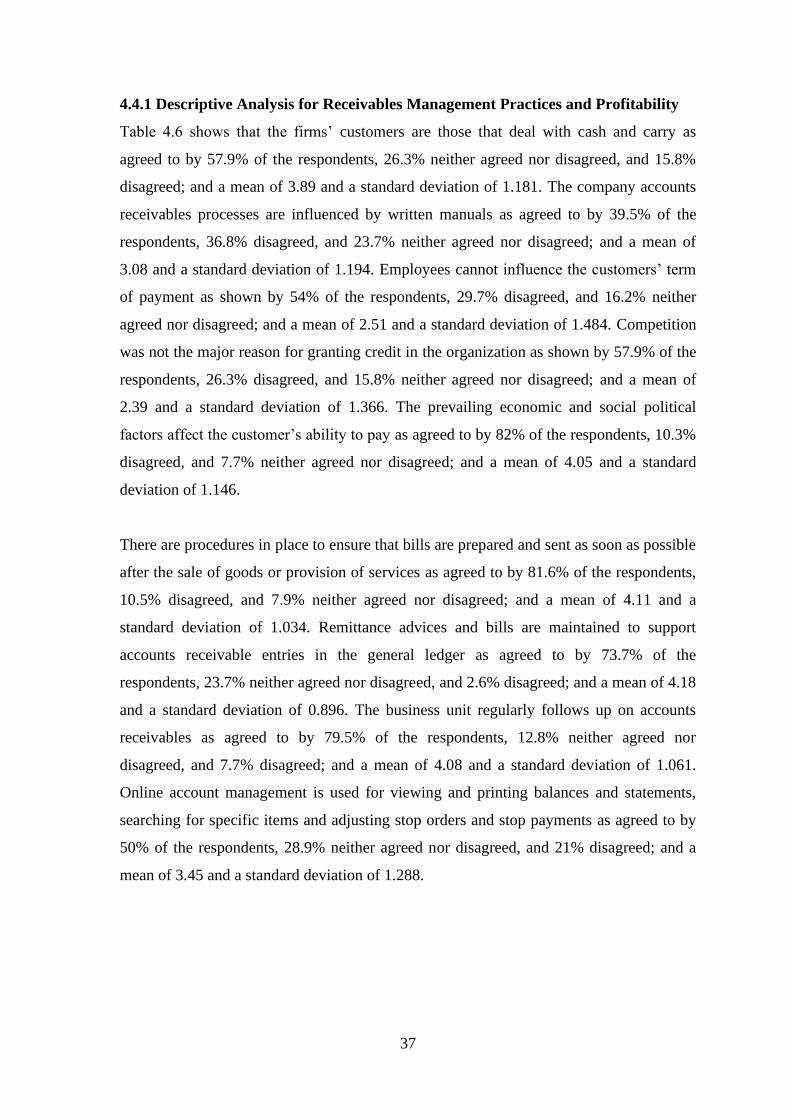
37
4.4.1 Descriptive Analysis for Receivables Management Practices and Profitability
Table 4.6 shows that the firms’ customers are those that deal with cash and carry as
agreed to by 57.9% of the respondents, 26.3% neither agreed nor disagreed, and 15.8%
disagreed; and a mean of 3.89 and a standard deviation of 1.181. The company accounts
receivables processes are influenced by written manuals as agreed to by 39.5% of the
respondents, 36.8% disagreed, and 23.7% neither agreed nor disagreed; and a mean of
3.08 and a standard deviation of 1.194. Employees cannot influence the customers’ term
of payment as shown by 54% of the respondents, 29.7% disagreed, and 16.2% neither
agreed nor disagreed; and a mean of 2.51 and a standard deviation of 1.484. Competition
was not the major reason for granting credit in the organization as shown by 57.9% of the
respondents, 26.3% disagreed, and 15.8% neither agreed nor disagreed; and a mean of
2.39 and a standard deviation of 1.366. The prevailing economic and social political
factors affect the customer’s ability to pay as agreed to by 82% of the respondents, 10.3%
disagreed, and 7.7% neither agreed nor disagreed; and a mean of 4.05 and a standard
deviation of 1.146.
There are procedures in place to ensure that bills are prepared and sent as soon as possible
after the sale of goods or provision of services as agreed to by 81.6% of the respondents,
10.5% disagreed, and 7.9% neither agreed nor disagreed; and a mean of 4.11 and a
standard deviation of 1.034. Remittance advices and bills are maintained to support
accounts receivable entries in the general ledger as agreed to by 73.7% of the
respondents, 23.7% neither agreed nor disagreed, and 2.6% disagreed; and a mean of 4.18
and a standard deviation of 0.896. The business unit regularly follows up on accounts
receivables as agreed to by 79.5% of the respondents, 12.8% neither agreed nor
disagreed, and 7.7% disagreed; and a mean of 4.08 and a standard deviation of 1.061.
Online account management is used for viewing and printing balances and statements,
searching for specific items and adjusting stop orders and stop payments as agreed to by
50% of the respondents, 28.9% neither agreed nor disagreed, and 21% disagreed; and a
mean of 3.45 and a standard deviation of 1.288.
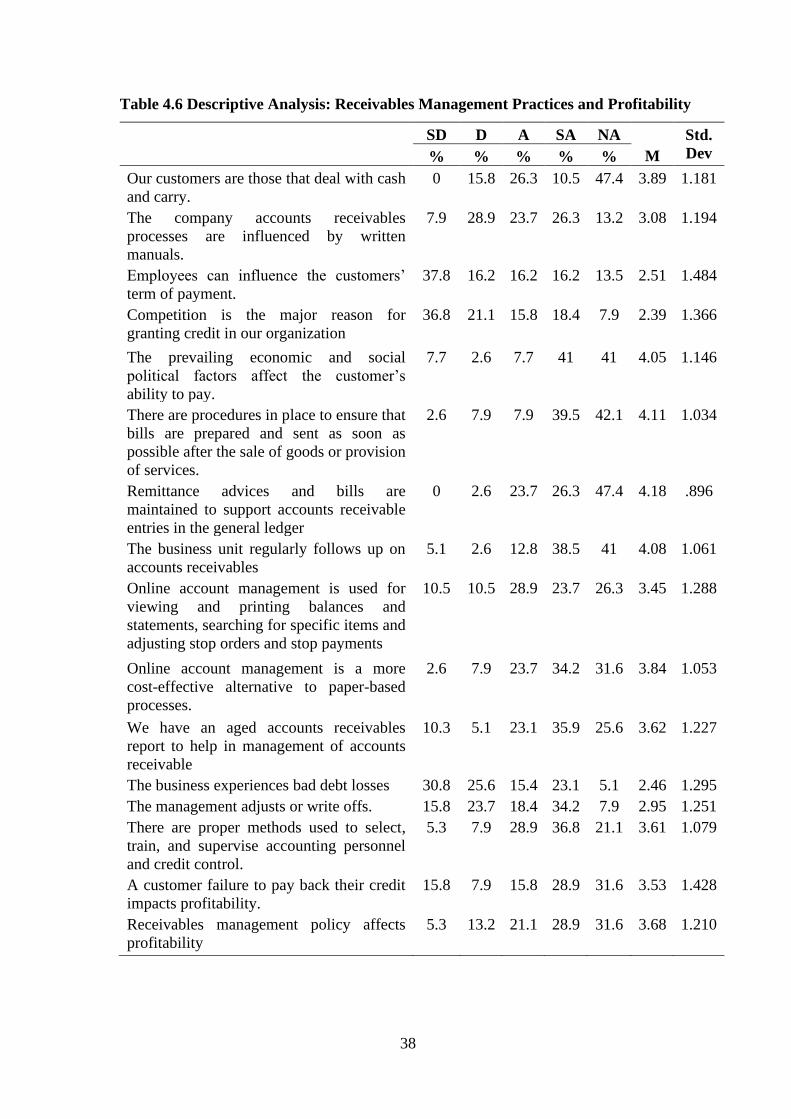
38
Table 4.6 Descriptive Analysis: Receivables Management Practices and Profitability
SD D A SA NA
M
Std.
Dev % % % % %
Our customers are those that deal with cash
and carry.
0 15.8 26.3 10.5 47.4 3.89 1.181
The company accounts receivables
processes are influenced by written
manuals.
7.9 28.9 23.7 26.3 13.2 3.08 1.194
Employees can influence the customers’
term of payment.
37.8 16.2 16.2 16.2 13.5 2.51 1.484
Competition is the major reason for
granting credit in our organization
36.8 21.1 15.8 18.4 7.9 2.39 1.366
The prevailing economic and social
political factors affect the customer’s
ability to pay.
7.7 2.6 7.7 41 41 4.05 1.146
There are procedures in place to ensure that
bills are prepared and sent as soon as
possible after the sale of goods or provision
of services.
2.6 7.9 7.9 39.5 42.1 4.11 1.034
Remittance advices and bills are
maintained to support accounts receivable
entries in the general ledger
0 2.6 23.7 26.3 47.4 4.18 .896
The business unit regularly follows up on
accounts receivables
5.1 2.6 12.8 38.5 41 4.08 1.061
Online account management is used for
viewing and printing balances and
statements, searching for specific items and
adjusting stop orders and stop payments
10.5 10.5 28.9 23.7 26.3 3.45 1.288
Online account management is a more
cost-effective alternative to paper-based
processes.
2.6 7.9 23.7 34.2 31.6 3.84 1.053
We have an aged accounts receivables
report to help in management of accounts
receivable
10.3 5.1 23.1 35.9 25.6 3.62 1.227
The business experiences bad debt losses 30.8 25.6 15.4 23.1 5.1 2.46 1.295
The management adjusts or write offs. 15.8 23.7 18.4 34.2 7.9 2.95 1.251
There are proper methods used to select,
train, and supervise accounting personnel
and credit control.
5.3 7.9 28.9 36.8 21.1 3.61 1.079
A customer failure to pay back their credit
impacts profitability.
15.8 7.9 15.8 28.9 31.6 3.53 1.428
Receivables management policy affects
profitability
5.3 13.2 21.1 28.9 31.6 3.68 1.210

39
Online account management is a more cost-effective alternative to paper-based processes
as agreed to by 65.8% of the respondents, 23.7% neither agreed nor disagreed, and 10.5%
disagreed; and a mean of 3.84 and a standard deviation of 1.053. The firms have an aged
accounts receivables report to help in management of accounts receivable as agreed to by
61.5% of the respondents, 23.1% neither agreed nor disagreed, and 15.4% disagreed; and
a mean of 3.62 and a standard deviation of 1.227. The businesses do not experience bad
debt losses as shown by 56.4% of the respondents, 28.2% disagreed, and 15.4% neither
agreed nor disagreed; and a mean of 2.46 and a standard deviation of 1.295. The
management makes adjustments or write offs as agreed to by 42.1% of the respondents,
39.5% disagreed, and 18.4% neither agreed nor disagreed; and a mean of 2.95 and a
standard deviation of 1.251.
There are proper methods used to select, train and supervise accounting personnel and
credit control as agreed to by 57.9% of the respondents, 28.9% neither agreed nor
disagreed, and 13.2% disagreed; and a mean of 3.61 and a standard deviation of 1.079. A
customer failure to pay back their credit impacts profitability as agreed to by 60.5% of the
respondents, 23.7% disagreed, and 15.8% neither agreed nor disagreed; and a mean of
3.53 and a standard deviation of 1.428. Receivables management policy affects
profitability as agreed to by 60.5% of the respondents, 21.1% neither agreed nor
disagreed, and 18.5% disagreed; and a mean of 3.68 and a standard deviation of 1.210.
4.4.2 Correlation Analysis for Receivables Management Practices and Profitability
The study conducted a correlation analysis between receivables management practices
and profitability of SMEs with the aim of understanding the sequence and strength of the
existing relationship between the variables, and the results were as shown in Table 4.7.
The table indicates that receivables management practices were very significant to
profitability of the SMEs (r=0.535, p<0.01). This showed that there existed a strong,
positive and statistically significant relationship between receivables management
practices and profitability of SMEs.
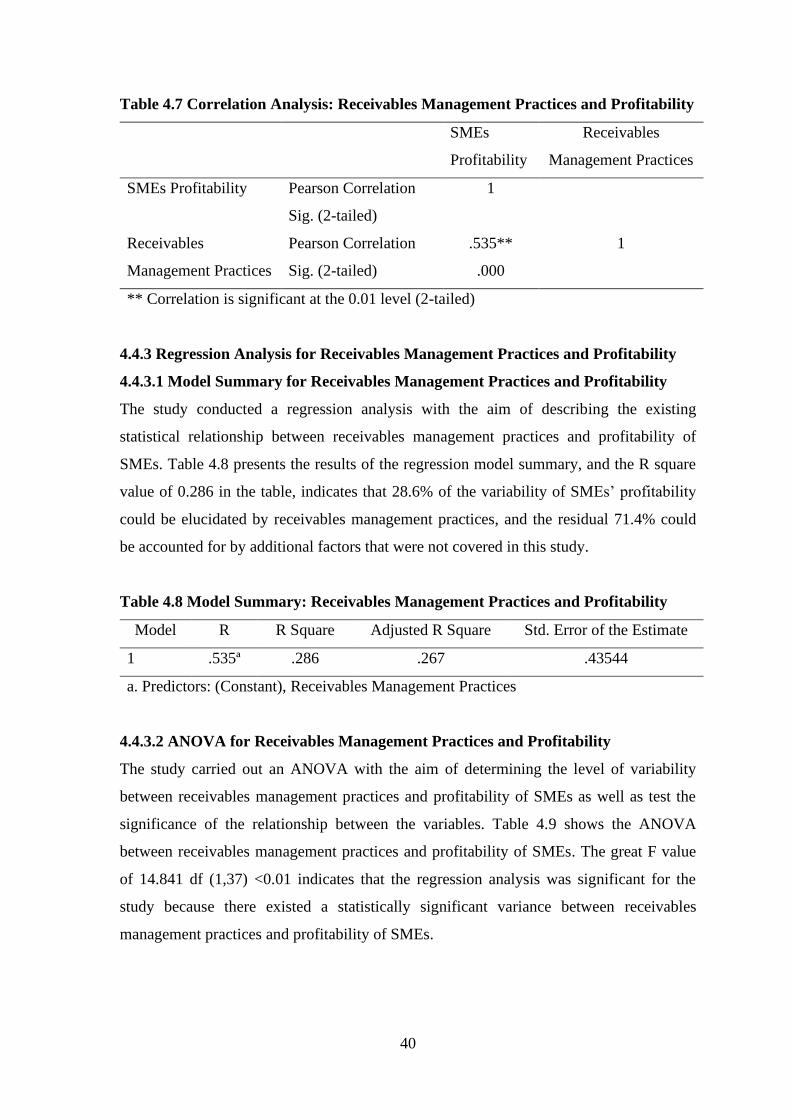
40
Table 4.7 Correlation Analysis: Receivables Management Practices and Profitability
SMEs
Profitability
Receivables
Management Practices
SMEs Profitability
Pearson Correlation
Sig. (2-tailed)
1
Receivables
Management Practices
Pearson Correlation
Sig. (2-tailed)
.535**
.000
1
** Correlation is significant at the 0.01 level (2-tailed)
4.4.3 Regression Analysis for Receivables Management Practices and Profitability
4.4.3.1 Model Summary for Receivables Management Practices and Profitability
The study conducted a regression analysis with the aim of describing the existing
statistical relationship between receivables management practices and profitability of
SMEs. Table 4.8 presents the results of the regression model summary, and the R square
value of 0.286 in the table, indicates that 28.6% of the variability of SMEs’ profitability
could be elucidated by receivables management practices, and the residual 71.4% could
be accounted for by additional factors that were not covered in this study.
Table 4.8 Model Summary: Receivables Management Practices and Profitability
Model R R Square Adjusted R Square Std. Error of the Estimate
1 .535ª .286 .267 .43544
a. Predictors: (Constant), Receivables Management Practices
4.4.3.2 ANOVA for Receivables Management Practices and Profitability
The study carried out an ANOVA with the aim of determining the level of variability
between receivables management practices and profitability of SMEs as well as test the
significance of the relationship between the variables. Table 4.9 shows the ANOVA
between receivables management practices and profitability of SMEs. The great F value
of 14.841 df (1,37) <0.01 indicates that the regression analysis was significant for the
study because there existed a statistically significant variance between receivables
management practices and profitability of SMEs.

41
Table 4.9 ANOVA: Receivables Management Practices and Profitability
Model Sum of Squares df Mean Square F Sig.
1 Regression
Residual
Total
2.814
7.015
9.829
1
37
38
2.814
.190
14.841 .000ª
a. Predictors: (Constant), Receivables Management Practices
b. Dependent Variable: Profitability of SMEs
4.4.3.3 Regression Coefficients for Receivables Management Practices and
Profitability
The study conducted a regression analysis with the aim of describing the existing
statistical relationship between receivables management practices and profitability of
SMEs. Table 4.10 indicates the regression coefficient that shows that there was a positive
correlation between receivables management practices and profitability of SMEs. The
table provides the study’s linear equation as:
SMEs’ Profitability = 1.986 + 0.489 Receivables Management Practices + 𝑒
The equation dictates that receivables management practices were very significant to the
profitability of SMEs as denoted by the p-value that was <0.01. Thus, the observed
relationship as presented by the equation states that a single unit increase in receivables
management practices could result in the SMEs’ profitability increase by a mean index of
0.489 or 48.9%.
Table 4.10 Coefficients: Receivables Management Practices and Profitability
Model
Unstandardized
Coefficients
Standardized
Coefficients
t
Sig.
B Std. Error Beta
1 (Constant)
Receivables Management
Practices
1.986
.489
.449
.127
.535
4.419
3.852
.000
.000
a. Dependent Variable: Profitability of SMEs

42
4.4.4 Receivables Management Practice Effect
The study was interested in establishing whether receivables management practices
affected profitability in the firm. Figure 4.8 indicates that 29.7% of the respondents stated
large extent, 24.4% stated very large extent, 21.6% stated little extent, 13.5% stated
moderate extent, and 10.8% indicated none at all. This shows that receivables
management practices affected the profitability of SMEs at Two River Mall.
Figure 4.8 Receivables Management Practice Effect
4.4.5 Receivables Management Practices Challenges
The researcher asked the respondents to indicate the challenge that their businesses faced
in terms of managing its receivables. Figure 4.9 shows that 21.7% was cash payment,
17.4% stated bad debt and customers closing down, 13% stated lack of automation and
lack of trained personnel, 8.7% stated cash reconciliation, and 4.4% stated price changes
and good customer relations. This indicates that the biggest challenge in receivables
management practices for the firms was cash payment.
Figure 4.9 Receivables Management Practices Challenges

43
4.5 Payables Management Practices and Profitability
This segment of the chapter provides the results and analysis for the effect of payables
management practices on profitability of SMEs. The entire section provides descriptive,
correlation and regression analysis for payables management practices and SMEs’
profitability.
4.5.1 Descriptive Analysis for Payables Management Practices and Profitability
Table 4.11 shows that the businesses do not make purchases only on cash basis as shown
by 64.1% of the respondents, 20.5% neither agreed nor disagreed, and 15.4% disagreed;
and a mean of 2.23 and a standard deviation of 1.307. The businesses do not make
purchases only on credit as shown by 64.1% of the respondents, 20.5% neither agreed nor
disagreed, and 15.4% disagreed; and a mean of 2.18 and a standard deviation of 1.275.
The business takes advantage of discount facilities by paying creditors promptly as agreed
by 58.9% of the respondents, 28.2% neither agreed nor disagreed, and 12.9% disagreed;
and a mean of 3.77 and a standard deviation of 1.111.
The business settles accounts payable on the last day that the payment is due as agreed by
38.4% of the respondents, 38.5% neither agreed nor disagreed, and 23.1% disagreed; and
a mean of 3.13 and a standard deviation of 1.218. The business uses computers to manage
accounts payable as agreed by 82.1% of the respondents, 10.3% disagreed, and 7.7%
neither agreed nor disagreed; and a mean of 4.15 and a standard deviation of 1.040. The
businesses did not lack trained personnel to manage accounts payables as shown by
74.3% of the respondents, 15.4% neither agreed nor disagreed, and 10.2% disagreed; and
a mean of 1.92 and a standard deviation of 1.156.
After paying all the expenses, the businesses get their profits as shown by 54% of the
respondents, 24.3% neither agreed nor disagreed, and 21.6% disagreed; and a mean of
2.38 and a standard deviation of 1.341. The business failure to pay creditors credit
impacts profitability and increases the risk of bankruptcy as shown by 41% of the
respondents, 30.7% disagreed, and 28.2% neither agreed nor disagreed; and a mean of
3.13 and a standard deviation of 1.380. Payables management policy affects profitability
as agreed to by 53.8% of the respondents, 25.6% neither agreed nor disagreed, and 20.5%
disagreed; and a mean of 3.46 and a standard deviation of 1.189.

44
Table 4.11 Descriptive Analysis: Payables Management Practices and Profitability
SD D A SA NA
M
Std.
Dev % % % % %
The business makes purchases only on
cash basis
38.5 25.6 20.5 5.1 10.3 2.23 1.307
The business makes purchases only on
credit
41 23.1 20.5 7.7 7.7 2.18 1.275
The business takes advantage of discount
facilities by paying creditors promptly
2.6 10.3 28.2 25.6 33.3 3.77 1.111
The business settles accounts payable on
the last day that the payment is due.
15.4 7.7 38.5 25.6 12.8 3.13 1.218
The business uses computers to manage
accounts payable.
2.6 7.7 7.7 35.9 46.2 4.15 1.040
The business lacks trained personnel to
manage accounts payables
48.7 25.6 15.4 5.1 5.1 1.92 1.156
After paying all our expenses, we do not
get any profits
37.8 16.2 24.3 13.5 8.1 2.38 1.341
The business failure to pay creditors
credit impacts profitability and increases
the risk of bankruptcy.
17.9 12.8 28.2 20.5 20.5 3.13 1.380
Payables management policy affects
profitability
7.7 12.8 25.6 33.3 20.5 3.46 1.189
4.5.2 Correlation Analysis for Payables Management Practices and Profitability
The study conducted a correlation analysis between payables management practices and
profitability of SMEs with the aim of understanding the sequence and strength of the
existing relationship between the variables, and the results were as shown in Table 4.12.
The table indicates that payables management practices were significant to profitability of
the SMEs (r=0.458, p<0.01). This showed that there existed a strong, positive, and
statistically significant relationship between payables management practices and
profitability of SMEs.

45
Table 4.12 Correlation Analysis: Payables Management Practices and Profitability
SMEs
Profitability
Payables Management
Practices
SMEs Profitability
Pearson Correlation
Sig. (2-tailed)
1
Payables Management
Practices
Pearson Correlation
Sig. (2-tailed)
.458**
.000
1
** Correlation is significant at the 0.01 level (2-tailed)
4.5.3 Regression Analysis for Payables Management Practices and Profitability
4.5.3.1 Model Summary for Payables Management Practices and Profitability
The study conducted a regression analysis with the aim of describing the existing
statistical relationship between payables management practices and profitability of SMEs.
Table 4.13 presents the results of the regression model summary, and the R square value
of 0.210 in the table, indicates that 21% of the variability of SMEs’ profitability could be
elucidated by payables management practices, and the residual 79% could be accounted
for by additional factors that were not covered in this study.
Table 4.13 Model Summary: Payables Management Practices and Profitability
Model R R Square Adjusted R Square Std. Error of the Estimate
1 .458ª .210 .189 .45806
a. Predictors: (Constant), Payables Management Practices
4.5.3.2 ANOVA for Payables Management Practices and Profitability
The study carried out an ANOVA with the aim of determining the level of variability
between payables management practices and profitability of SMEs as well as test the
significance of the relationship between the variables. Table 4.14 shows the ANOVA
between payables management practices and profitability of SMEs. The great F value of
9.848 df (1,37) <0.01 indicates that the regression analysis was significant for the study
because there existed a statistically significant variance between payables management
practices and profitability of SMEs.

46
Table 4.14 ANOVA: Payables Management Practices and Profitability
Model Sum of Squares df Mean Square F Sig.
1 Regression
Residual
Total
2.066
7.763
9.829
1
37
38
2.066
.210
9.848 .003ª
a. Predictors: (Constant), Payables Management Practices
b. Dependent Variable: Profitability of SMEs
4.5.3.3 Regression Coefficients for Payables Management Practices and Profitability
The study conducted a regression analysis with the aim of describing the existing
statistical relationship between payables management practices and profitability of SMEs.
Table 4.15 indicates the regression coefficient that shows that there was a positive
correlation between payables management practices and profitability of SMEs. The table
provides the study’s linear equation as:
SMEs’ Profitability = 2.340 + 0.462 Payables Management Practices + 𝑒
The equation dictates that payables management practices were very significant to the
profitability of SMEs as denoted by the p-value that was <0.01. Thus, the observed
relationship as presented by the equation states that a single unit increase in payables
management practices could result in the SMEs’ profitability increase by a mean index of
0.462 or 46.2%.
Table 4.15 Coefficients: Payables Management Practices and Profitability
Model
Unstandardized
Coefficients
Standardized
Coefficients
T
Sig.
B Std. Error Beta
1 (Constant)
Payables Management
Practices
2.340
.462
.438
.147
.458
5.340
3.138
.000
.003
a. Dependent Variable: Profitability of SMEs
4.5.4 Payables Management Practice Effect
The study was interested in establishing whether payables management practices affected
profitability in the firm. Figure 4.10 indicates that 26.2% of the respondents stated
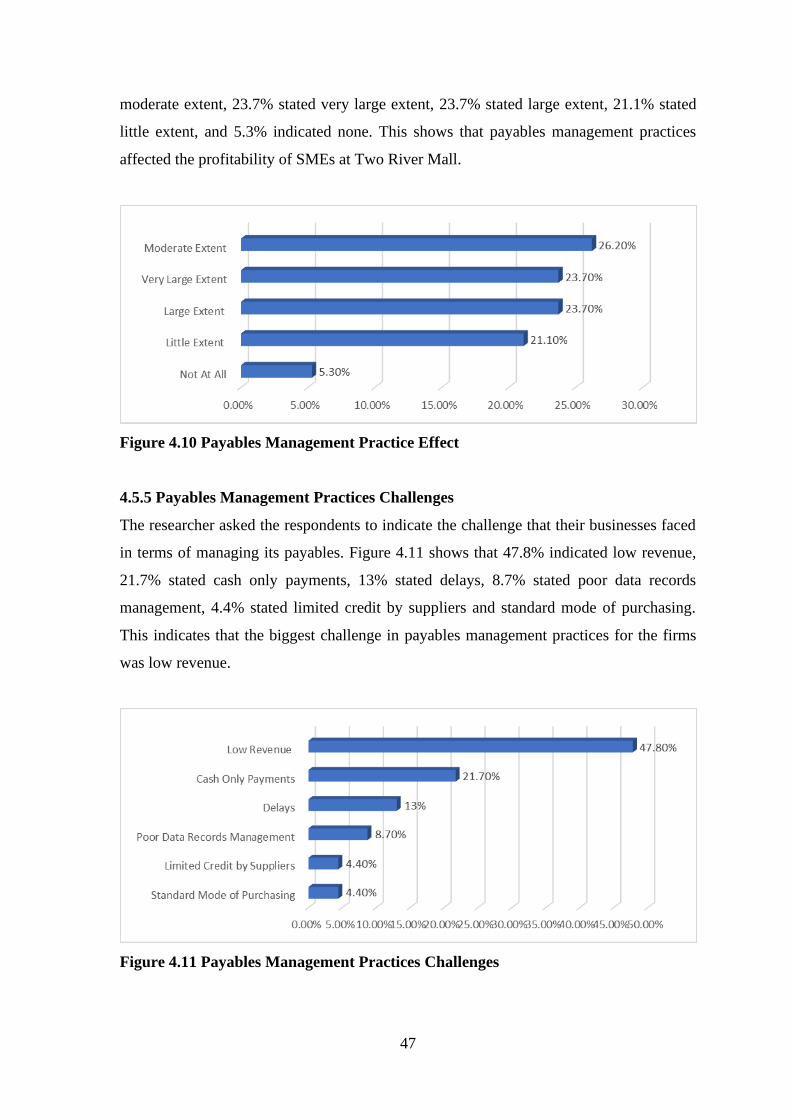
47
moderate extent, 23.7% stated very large extent, 23.7% stated large extent, 21.1% stated
little extent, and 5.3% indicated none. This shows that payables management practices
affected the profitability of SMEs at Two River Mall.
Figure 4.10 Payables Management Practice Effect
4.5.5 Payables Management Practices Challenges
The researcher asked the respondents to indicate the challenge that their businesses faced
in terms of managing its payables. Figure 4.11 shows that 47.8% indicated low revenue,
21.7% stated cash only payments, 13% stated delays, 8.7% stated poor data records
management, 4.4% stated limited credit by suppliers and standard mode of purchasing.
This indicates that the biggest challenge in payables management practices for the firms
was low revenue.
Figure 4.11 Payables Management Practices Challenges
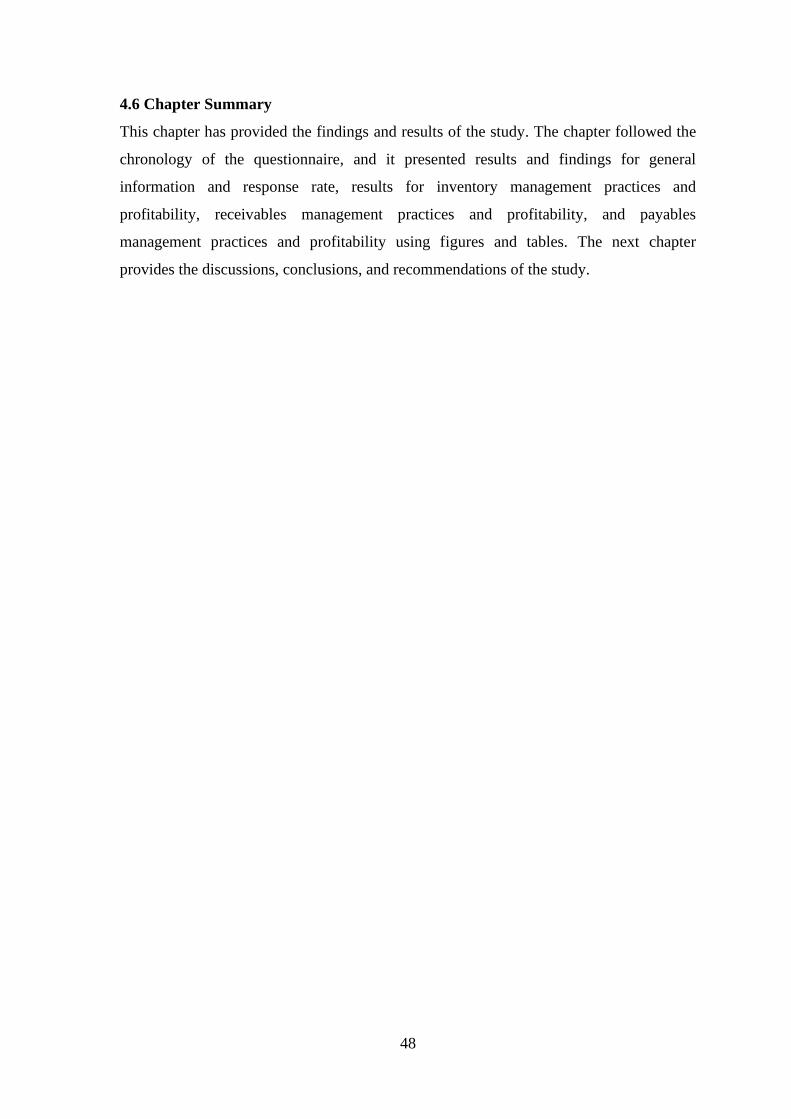
48
4.6 Chapter Summary
This chapter has provided the findings and results of the study. The chapter followed the
chronology of the questionnaire, and it presented results and findings for general
information and response rate, results for inventory management practices and
profitability, receivables management practices and profitability, and payables
management practices and profitability using figures and tables. The next chapter
provides the discussions, conclusions, and recommendations of the study.
49
CHAPTER FIVE
5.0 DISCUSSIONS, CONCLUSIONS AND RECOMMENDATIONS
5.1 Introduction
This chapter concludes the study by providing the Summary of the study findings, as well
as the Discussions based on the study findings. The chapter also provides the study
Conclusions and Recommendations for improvement and those for further research
studies based on the limitations of the study.
5.2 Summary
The purpose of the study was to determine the effect of working capital management on
the profitability of Small and Medium Enterprises. The study sought to answer the
following research questions: How does inventory management practices affect
profitability of SMEs at Two Rivers Mall? What is the effect of receivables management
practices on the profitability of SMEs at Two Rivers Mall? and, How does payables
management practices affect profitability of SMEs at Two Rivers Mall?
The research design applied in this study was descriptive research design. The study
population was composed of all the 45 SMEs that were at the Two Rivers Mall. The
sample frame for this study was composed of all the trading tenants at the Two Rivers
Mall, and a census sampling technique was applied due to the size of the population. This
gave the study a sample size of 45 SMEs. Self-administered questionnaires were used to
collect the study data, and the drop and pick method of data collection was used in the
study. Quantitative data analysis was used in the study where that data obtained was
coded and analysed using Statistical Package for the Social Sciences (SPSS). Descriptive
analysis that included percentage frequencies, means and standard deviations, as well as
inferential statistics composed of correlation analysis as well as simple regressions were
used, and data was presented in the form of figures and tables.
The study showed that SMEs prepare inventory budgets which is continuously monitored.
SMEs checks inventory at fixed time intervals, although there are some items are only
ordered based on a request or at the time of the demand using the just-in-time system,
although there are reliable re-order points. SMEs at Two Rivers Mall have a system that
prompts the firm when the stock reaches the re-order point, and the receiving, issuing,
accounting, and storing responsibilities of the inventory are properly segregated.
50
Management takes the appropriate steps to safeguard goods against risk of loss like theft,
through the release of goods from stores only on the basis of requisitions which are
approved by a responsible official or based on invoices raised.
The study revealed that the customers who frequent SMEs at Two Rivers Mall deal with
cash and carry. The SMEs’ accounts receivables processes are influenced by written
manuals, and employees cannot influence the customers’ term of payment. The prevailing
economic and social political factors affect the customer’s ability to pay, and hence the
SMEs have procedures in place to ensure that bills are prepared and sent as soon as
possible after the sale of goods or provision of services. Remittance advices and bills are
maintained to support accounts receivable entries in the general ledger, as well as having
regular follows up on accounts receivables. Online account management is used for
viewing and printing balances and statements, searching for specific items and adjusting
stop orders and stop payments, which is a more cost-effective alternative to paper-based
processes.
The study showed that the SMEs at Two Rivers Mall do not make purchases only on cash
basis and neither do they make purchases using credit only. They take advantage of
discount facilities by paying creditors promptly, and they settle accounts payable on the
last day that the payment is due. These SMEs use computers to manage accounts payable
since they do not lack trained personnel to manage their accounts payables. After paying
all the expenses, the businesses get their profits, and they do understand that failure to pay
creditors credit may impact their profitability and increase their risk of bankruptcy. These
SMEs understand that payables management policy affects their profitability.
5.3 Discussions
5.3.1 Inventory Management Practices and Profitability
The study showed that the SMEs prepare inventory budgets. This result agrees with
Deveshwara and Dhawal (2013) who proposed that inventory management is a method
that companies use to organize, store, and replace inventory, to keep an adequate supply
of goods at the same time minimizing cost. Inventory in the SMEs is monitored
continuously (continuous review of inventory). This agrees with Ganas and Hyz (2015)
whose study showed that less profitable firms have worst inventory management

51
measures. Therefore, managers can create profits for their companies by managing
efficiently the inventories and their components’ measures, leading to an optimum level.
The company checks inventory at fixed time intervals like monthly (periodic review of
inventory). The results of the study are supported by Atnafu and Balda (2018) whose
results showed that increased competitiveness of a firm may enable a firm to implement a
higher level of inventory management practice due to the need to outperform its
competitors constantly and keep its competitive position. Some items are only ordered
based on a request or at the time of the demand (just in time). This agrees with Kung’u
(2016) whose study showed that when firms maintain good inventory control systems, the
firms’ profits are high, thus, firms should install modern inventory control systems such
as economic order quantity and just in time.
There is a reliable re-order point, and there is a system that prompts the firm when the
stock reaches the re-order point. The study result is supported by Kung’u (2016) whose
study showed that, firms should also be able to put in place an effective stock
management system that ensures reliable sales forecast to be used in order purposes. The
findings of inventory control on profitability of manufacturing firms in Kenya showed
that finance managers of manufacturing firms take precautions to ensure that their firms
maintain ideal levels of inventories of both raw materials and finished goods.
Receiving, issuing, accounting, and storing responsibilities are properly segregated. This
agrees with Akinyomi (2014) who examined the association between inventory
management and the profitability of Nigerian manufacturing firms, and his study revealed
the existence of statistically no significant relationship between stock management and
the profitability of manufacturing companies. The study showed that management takes
the appropriate steps to safeguard goods against risk of loss like theft. The result is in
agreement with Kung’u (2016) who studied the effects of inventory control on the
profitability of industrial and allied firms in Kenya and discovered that the cost of high
stock includes stock theft, expiry, insurance and storage.
Goods released from stores only based on requisitions which are approved by a
responsible official or on the basis of invoices raised. This result agrees with Mathuva
(2010) whose study indicated that there exists a highly significant positive relationship

52
between the period taken to convert inventories into sales and profitability. This study
revealed that management consistently reviews the reconciliation of physical inventory
counts and the inventory records. This result is supported by Kung’u (2016) whose study
showed that inventory control on profitability of manufacturing firms in Kenya showed
that finance managers of manufacturing firms take precautions to ensure that their firms
maintain ideal levels of inventories of both raw materials and finished goods.
A demand forecast states the needed inventory that helps to overcome the fluctuations in
demand for our firm. This result is supported by Mathuva (2010) whose study showed
that firms maintained sufficiently high inventory levels which reduced costs of possible
interruptions in the production process and loss of business due to scarcity of products.
The firm has installed an inventory control system and keeps accurate inventory records,
and they have in place training programs to educate staff in inventory management
practices. This result is in tandem with Kung’u (2016) findings of inventory control on
profitability of manufacturing firms in Kenya that showed that firms need to be able to
put in place an effective stock management system that ensures reliable sales forecast to
be used in order purposes.
Good inventory management practices have increased profit margins. This study result is
supported by Mwaura (2017) who carried out a study on the effect of inventory turnover
on the financial performance of medium and large retail supermarkets, and found that
there is a strong positive and statistically significant correlation between inventory
turnover and financial performance of medium and large retail supermarkets in Kenya.
Agha, Mba and Mhil (2014) investigated the impact of WCM on profitability, they found
that the Working Capital (WC) significantly affects firm's profitability, and profitability
can be enhanced through minimizing inventory turnover, accounts receivable ratio, and
through reducing creditors' turnover ratio.

53
5.3.2 Receivables Management Practices and Profitability
The firms’ customers are those that deal with cash and carry. The study result is
supported by Sharma and Kumar (2011) who note that the management of accounts
receivable is largely influenced by the credit policy and collection procedure of a firm.
Accounts receivable represents the rate at which the firm collects payments from its
customers. The study revealed that the company accounts receivables processes are
influenced by written manuals. This is in agreement with Deloof (2013) who states that
management of accounts receivables which aims at maintaining an optimal balance
between each of the accounts receivables components, that is, cash, receivables, inventory
and payables is a fundamental part of the overall corporate strategy to create value and is
an important source of competitive advantage in businesses.
Employees cannot influence the customers’ term of payment. This is also noted by
Schaum (2011) who states that, the key principles of accounts receivable management
that a firm should adhere to are ageing of accounts receivable, evaluating the potential
customers ability to pay using criteria such as integrity of the customer, financial
soundness, collateral to be pledged and current economic conditions should be analysed,
establishment of credit terms and limits, collection of trade credit, assessment of default
risk and responsibility and the financing of accounts receivable until it has been paid by
the purchaser.
Competition was not the major reason for granting credit in the organization. This is in
agreement with Deloof (2013) who states that management of accounts receivables which
aims at maintaining an optimal balance between each of the accounts receivables
components, that is, cash, receivables, inventory and payables is a fundamental part of the
overall corporate strategy to create value and is an important source of competitive
advantage in businesses. The study indicated that the prevailing economic and social
political factors affect the customer’s ability to pay. This is supported by Shin and Soenen
(2013) who observed that, a well-managed enterprise normally keeps average collection
period normally lesser than average payment period so as to minimize investment in
receivables and also honour its short time obligations on time minimizing cost of funds.
There are procedures in place to ensure that bills are prepared and sent as soon as possible
after the sale of goods or provision of services. This result agrees with Shin and Soenen

54
(2013) who state that, the average payment period is basic test of the business’s good or
bad activity or operation and its important symbol for making good planning for increase
or decrease working capital efficiently. This is because working capital is more effected
from sundry debtors and sundry creditors. Remittance advices and bills are maintained to
support accounts receivable entries in the general ledger. This agrees with Ramana et al.
(2013) who studied the impact of managing receivables on the working capital and
profitability of cement companies in India, and found that efficient receivables
management was found to have a positive impact on both working capital and
profitability.
The business unit regularly follows up on accounts receivables. This result is supported
by Pais and Gama (2015) who studied the effects of working capital management on the
profitability of SMEs in Portuguese, and their results indicated that a reduction in the
inventories held and in the number of days that firms take to settle their commercial
liabilities and to collect payments from its customers are associated to higher corporate
profitability. Online account management is used for viewing and printing balances and
statements, searching for specific items and adjusting stop orders and stop payments, and
it is a more cost-effective alternative to paper-based processes. The result of the study
agrees with Oware et al. (2015) whose study demonstrated that when a firm does not
invest well in the collection of account receivable then the probability that a firm will
stagnant as a result of very poor account receivables levels and debt accumulation would
be high.
The firms have an aged accounts receivables report to help in management of accounts
receivable. The results of the study disagree with Munene and Tibbs (2018) who observed
that, proper maintenance of accounts receivable helps an organization maintain customer
loyalty, track customer credit and uncollected profits, however, many organizations
nowadays encounter numerous challenges in regard to their invoicing and accounts
receivable process. The study indicated that the businesses do not experience bad debt
losses.
The study showed that management adjusts or write offs, and that there are proper
methods used to select, train and supervise accounting personnel and credit control. This
agrees with Duru et al. (2014) who state that, receivable management is an important fact
55
of financial management, this is because excessive level of current assets and low level of
current assets may lead to negative effect on a firm’s profitability and difficulties in
mediating smooth operation. A customer failure to pay back their credit impacts
profitability. The study result is supported by Sharma and Kumar (2011) who note that
the management of accounts receivable is largely influenced by the credit policy and
collection procedure of a firm. Accounts receivable represents the rate at which the firm
collects payments from its customers.
The study showed that receivables management policy affects profitability. This agrees
with Kakeeto et al. (2016) who studied the effects of account receivable management and
organizational profitability, and their findings revealed that revealed that accounts
receivable management positively affected organizational profitability. Mbula et al.
(2016) investigated the effect of accounts receivable on financial performance of firms
funded by Government Venture Capital in Kenya. They found that there is a positive
relationship between accounts receivables and financial performance of firms funded by
government venture capital in Kenya.
5.3.3 Payables Management Practices and Profitability
The businesses do not make purchases only on cash basis, neither do they make purchases
only on credit. The result agrees with Afrifa (2016) who states that firms should consider
their cash flow when making decision on working capital investment. To improve
performance, firms with limited cash flow should reduce their working capital
investment. The business takes advantage of discount facilities by paying creditors
promptly. This study result is in tandem with Gitman (2009) who states that,
organizations often regard the amount owing to creditors as a source of free credit.
Accounts payable ratio represents the rate firms pay to their suppliers. It is one of the
major sources of secured short-term financing.
The business settles accounts payable on the last day that the payment is due. This result
agrees with Ashok (2013) who states that, companies have become more aware of the
competitive advantages of supply chain management from cost efficiency, product
differentiation and value-added services so too has the task of managing the relationship
between payables and suppliers become fundamentally important. The business uses
computers to manage accounts payable. The study result is supported by Madugba and

56
Ogbonnaya (2016) whose investigated the effects of average payment period and
financial performance, and it found that, efficient management average payment period
will improve the financial performance of the manufacturing firms.
The businesses did not lack trained personnel to manage accounts payables. The result
agrees with Ashok (2013) who states that, companies have become more aware of the
competitive advantages of supply chain management from cost efficiency, product
differentiation and value-added services so too has the task of managing the relationship
between payables and suppliers become fundamentally important. After paying all the
expenses, the businesses get their profits. The result agrees with Madishetti and Kibona
(2013) who investigated the impact of average collection period and average payment
period on SMEs profitability in Tanzania and found that there was a significant negative
relationship between average collection period and profitability. Positive relationship was
observed between average payment period and gross operating profit.
The business failure to pay creditors credit impacts profitability and increases the risk of
bankruptcy. The result is supported by Gitman (2009) who notes that, accounts payable is
an account that represents a company's obligation to pay off a short-term debt to its
creditors or suppliers. Accounts payable are suppliers whose invoices for goods or
services have processed but who have not yet been paid. Organizations often regard the
amount owing to creditors as a source of free credit.
Payables management policy affects profitability. This result is supported by Yahaya
(2016) who carried out a study on effects of working capital management on the financial
performance of the pharmaceutical firms in Nigeria, and found that average payment
period was significantly and positively related with financial performance. Igwebuike and
Nankwo (2018) also studied the impact of average payments period on profitability of
quoted insurance companies in Nigeria, their study result indicated that Average
Payments Period has a significant negative impact on profitability.
5.4 Conclusions
5.4.1 Inventory Management Practices and Profitability
The study concludes that SMEs prepare inventory budgets which is continuously
monitored. SMEs checks inventory at fixed time intervals, although there are some items
are only ordered based on a request or at the time of the demand using the just-in-time

57
system, although there are reliable re-order points. SMEs at Two Rivers Mall have a
system that prompts the firm when the stock reaches the re-order point, and the receiving,
issuing, accounting and storing responsibilities of the inventory are properly segregated.
Management takes the appropriate steps to safeguard goods against risk of loss like theft,
through the release of goods from stores only on the basis of requisitions which are
approved by a responsible official or on the basis of invoices raised. Management
consistently reviews the reconciliation of physical inventory counts and the inventory
records using a demand forecast that indicates the needed inventory fir the SMEs. The
study concludes that the SMEs have installed an inventory control system which
facilitates their ability to keep accurate inventory records, as well as training programs
that educate staff in inventory management practices. As a result, the good inventory
management practices of these SMEs have led to increased profit margins.
5.4.2 Receivables Management Practices and Profitability
The study concludes that the customer who frequent SMEs at Two Rivers Mall deal with
cash and carry. The SMEs’ accounts receivables processes are influenced by written
manuals, and employees cannot influence the customers’ term of payment. The prevailing
economic and social political factors affect the customer’s ability to pay, and hence the
SMEs have procedures in place to ensure that bills are prepared and sent as soon as
possible after the sale of goods or provision of services. Remittance advices and bills are
maintained to support accounts receivable entries in the general ledger, as well as having
regular follows up on accounts receivables. Online account management is used for
viewing and printing balances and statements, searching for specific items and adjusting
stop orders and stop payments, which is a more cost-effective alternative to paper-based
processes. The firms have an aged accounts receivables report to help in management of
accounts receivable, thus minimizing the experience bad debt losses. The management
makes adjustments or write offs, and proper methods are used to select, train and
supervise accounting personnel and credit control. A customer failure to pay back their
credit impacts on profitability for these SMEs, thus, receivables management policy
affects their profitability.
5.4.3 Payables Management Practices and Profitability
The study concludes that the SMEs at Two Rivers Mall do not make purchases only on
cash basis and neither do they make purchases using credit only. They take advantage of
58
discount facilities by paying creditors promptly, and they settle accounts payable on the
last day that the payment is due. These SMEs use computers to manage accounts payable
since they do not lack trained personnel to manage their accounts payables. After paying
all the expenses, the businesses get their profits, and they do understand that failure to pay
creditors credit may impact their profitability and increase their risk of bankruptcy. These
SMEs understand that payables management policy affects their profitability.
5.5 Recommendations
5.5.1 Recommendations for Improvement
5.5.1.1 Inventory Management Practices and Profitability
The study recommends the managers and owners of the SMEs at Two Rivers Mall to
ensure that they develop effective strategic policies that will provide a guideline on
inventory management. This would be used train and guide the staff members and ensure
that the SMEs hold onto optimal inventory levels that will minimize costs and maximize
their profitability and operating cash flows.
5.5.1.2 Receivables Management Practices and Profitability
The study recommends that the managers and owners of the SMEs at Two Rivers Mall
should engage suppliers who can allow longer credit terms. They should also engage
those customers who allow short payment terms. They should also enhance their cash
flow management by adapting a more and sitting policy on their cash flow management,
as well as enhance their debt management which will help in improving their firm
performance. This will facilitate the SMEs ability to identify the relationship between
accounts receivables management and firms’ financial performance in the long run.
59
5.5.1.3 Payables Management Practices and Profitability
The study recommends the managers and owners of the SMEs at Two Rivers Mall to
evaluate their accounts payable management practices to determine if they are optimising
on the possible benefits that can be derived from payables. The SME managers should be
thoroughly trained on working capital management skills by undergoing continuous
development programme through interactive symposiums, conferences, and open forums.
5.5.2 Recommendations for Further Research
The focus of this study was on examining the role of working capital management on the
profitability of SMEs, particularly inventory management practices, receivables
management practices, and payables management practices. The study was limited
geographically to Two Rivers Mall, and specifically, the 45 SMEs who were at the time
trading at the Two Rivers Mall. In this regard, the study recommends that similar studies
be conducted on other SMEs within Nairobi and other regions in the country, and also
recommends that the scope of research be widened to capture other factors apart from the
three that have been discussed in this study.

60
REFERENCES
Achode, B.M. & Rotich, G. (2016). Effects of accounts Payable as Source of Financing
on Performance of Listed Manufacturing Firms at the Nairobi Securities
Exchange. International Journal of Research Studies in Agricultural Sciences
(IJRSAS) Volume 2, Issue 4, 2016, PP 24-32.
Agha, H., Mba, & Mphil, (2014). "Impact of Working Capital Management on
Profitability", European Scientific Journal, 10 (1), 374-381.
Alshubiri, F.N. (2011). The Effect of Working Capital Practices on Risk Management
Evidence from Jordan. Global Journal of Business Research, 5(1), 39-54.
Afeef, M. (2011). Analyzing the impact of working capital management on the
profitability of SME’s in Pakistan. International Journal of Business and Social
Science, 2(22), 173-183.
Afrifa, G. A., & Padachi, K. (2016). Working capital level influence on SME
profitability. Journal of Small Business and Enterprise Development, 23(1), 44-
63.
Afrifa, G., Tauringana, V. & Tingbani, I., (2015). Working capital management and
performance of listed SMEs. Journal of Small Business & Entrepreneurship, 27
(6).
Afrifa, G. A. (2016), Net working capital, cash flow and performance of UK SMEs.
Review of Accounting and Finance,15 (1) pp. 21 – 44.
Alam, H., Ali, L., Rehman, C., & Akram, M. (2011). Impact of working capital
management on profitability and market valuation of Pakistani firms. European
Journal of Economics, Finance & Administrative Sciences, 32, 48-54.
Aktas, N., Croci, E. & Petmezas, D. (2015). Is working capital management value
enhancing? Evidence from firm performance and investments. Journal of
Corporate Finance, 30, 98-113.
Akinyomi, J. (2014). Effect of inventory management on profitability: Evidence from the
Nigerian manufacturing sector. International Journal of Management and
Accounting Sciences. 1. 7-16.
Akinleye, G.T. & Adebowale, J.O. (2019). Account Receivables’ Management and
Performance of Manufacturing Firms. International Journal of Economics &
Business ,5(1), 18 - 27.

61
Anser, R., & Malik, Q. A. (2013). Cash conversion cycle and firm’s profitability–a study
of listed manufacturing companies of Pakistan. IOSR Journal of Business and
Management, 8(2), 83-87.
Ashok, P. (2013). Relationship between Inventory Management and Profitability -- An
Empirical Analysis of Indian Cement Companies. Asia Pacific Journal of
Marketing and Management Research. 107-120.
Atnafu, D. & Balda, A. (2018). The impact of inventory management practice on firms’
competitiveness and organizational performance: Empirical evidence from micro
and small enterprises in Ethiopia. Cogent Business & Management 5: 1503219
Baños-Caballero, S., García-Teruel, P. J., & Martínez-Solano, P. (2014). Working capital
management, corporate performance, and financial constraints. Journal of
Business Research, 67(3), 332-338
Cooper, D. & Schindler, P. (2014). Business Research Methods. New York. McGraw
Hill.
Deloof, M., & Jegers, M. (2013). Trade credit, product quality, and intra group trade:
some European evidence. Journal of Financial Management, 25, 33-43.
Deveshwar, A., & Dhawal, M. (2013). Inventory management delivering profits through
stock management. World Trade Centre, Dubai: Ram University of Science and
Technology.
Dirie, A.O. & Ayuma, C. (2018). Effect of Accounts Receivables Management on
Financial Performance in Small and Medium firms in Mogadishu, Somalia.
International Journal of Management and Commerce Innovations ISSN 2348-
7585 (Online) Vol. 6, Issue 1, pp: (378-383).
Duru, A. N., Ekwe, M. C., & Okpe, I. I. (2014). Accounts receivable management and
corporate performance of companies in the food & beverage industry: evidence
from Nigeria. European Journal of Accounting Auditing and Finance Research,
2(10), 34-47.
Gitman, L. J. (2009). Principles of managerial finance (12th ed.). Bostos, MA: Pearson
Prentice Hall.
Gakure, R., Cheluget, K.J. Onyango, J.A, & Keraro, V. (2012). Working capital
management and profitability of manufacturing firms listed at the Nairobi stock
exchange. Prime Journal of Business Administration and Management (BAM),
2(9), 680-686.

62
Ganas, I. & Hyz, A. (2015). Inventory Management and its Impact on Firms'
Performance: An Empirical study in the region of Epirus, Greece.
Gill, A., Biger, N., & Mathur, N. (2010). The relationship between working capital
management and profitability. Evidence from the United States. Business and
Economics Journal, 2, 1-9.
Hofstrand, (2013). Firm Profitability. Research Journal of Firm Profitability’s, 6, (2013),
6-7.
Iyewumi, T. A., Remy, H., & Omotayo, M. (2015). Working capital management and
firm’s profitability: the case of oil and gas industry in Nigeria. Journal of
Electronics and Computer Science, 2(3), 1-21
Igwebuike, A. & Nwankwo, S. (2018). Impact of Average Payments Period on the Return
on Assets of Quoted Insurance Companies in Nigeria. European Journal of
International Management. 10. 1-10.
Jagongo, A. O., & Makori, D. M. (2013). Working capital management and firm
profitability. Empirical from manufacturing and construction firms listed on the
Nairobi Securities Exchange. International Journal of Accounting and Taxation,
1(1), 1-14.
Jindal, D., & Jain, S. (2017). Effect of Receivables Management on Profitability: A Study
of Commercial Vehicle Industry in India. management, 2(2), 246-255.
Kaur, H. V., & Singh, H., (2013). "Managing Efficiency and Profitability Through
Working Capital: An Empirical Analysis of BSE 200 Companies"; Asian Journal
of Business Management, 4, (2), 197207.
Kakeeto, F,Timbirimu, M., Kiizah, P., & Olutayo, O. (2016). Accounts Receivable
Management and Organizational Profitability as a Function of Employee
Perception in Gumutindo Coffee Cooperative Enterprise Limited (GCCE), Mbale,
District Uganda. IOSR Journal of Economics and Finance,7(6), 31-37.
Kasozi, J. (2017). The effect of working capital management on profitability: a case of
listed manufacturing firms in South Africa. Investment Management and Financial
Innovations, 14(2-2), 336-346.
Ksenija, D.M. (2013). Impact of Accounts Receivable management on profitability
during the financial crises: Evidence from Serbia, UDC 658.155.497 pg 1-11.

63
Kothari, C.R. (2004). Research Methodology, methods and techniques (2nd ed.). India,
Jaipur: New Age International Limited Publishers.
Kothari,C. (2010). Research Methodology: Methods and Techniques, 2nd Ed. New Age,
New Delhi India: International Publishers.
Kumaraswamy, S. (2016). Impact of Working Capital on Financial Performance of Gulf
Cooperation Council Firms. International Journal of Economics and Financial
Issues, 6(3), 1136-1143.
Kung’u, J. N. (2016). Effects of inventory control on profitability of industrial and allied
firms in Kenya. IOSR Journal of Economics and Finance, 7 (1), 9-15.
Lyani, M. N. (2017). Relationship between Accounts Receivable Management Practices
and Growth of Small and Medium Enterprises in Kakamega County, Kenya
(Doctoral dissertation, COHRED-JKUAT).
Mbula, K. J., Memba, S. F., & Njeru, A. (2016). Effect of Accounts Receivable on
Financial Performance of Firms Funded by Government Venture Capital in
Kenya. Journal of Economics and Finance, 7(1), 62-69.
Madishetti, S., & Kibona, D., (2013). “Impact of Receivables and Payables Management
on the Profitability of SMEs in Tanzania”, Arth Prabhand: A Journal of
Economics and Management", 2 (3), 9-21.
Madugba, J. U., & Ogbonnaya, A. K. (2016). Working capital management and financial
performance: evidence from manufacturing companies in Nigeria. European
Journal of Accounting, Auditing and Finance Research, 4, 98-106.
Mathuva, D.M. (2010). “The Influence of Working Capital Management Components on
Corporate Profitability: A Survey on Kenyan Listed Firms”, Research Journal of
Business Management, Vol. 4 ppl-11.
Mathuva, D. (2015). The Influence of working capital management components on
corporate profitability.
Mohamed, A. S. (2013). The Effect of Cash Conversion Cycle on the Profitability of
Firms Listed on the Nairobi Securities Exchange (Doctoral dissertation, School of
Business, University of Nairobi).
Moodley, T., Ward, M. & Muller, C. (2017). The relationship between the management
of payables and the return to investors, South African Journal of Accounting
Research, 31:1, 35-43,
64
Munene, F. & Tibbs, C. Y. (2018). Accounts receivable management and financial
performance of Embu Water and Sanitation Company Limited, Embu County,
Kenya. International Academic Journal of Economics and Finance, 3(2), 216-240.
Muturi, H. M. (2015). Effects of Cash Conversion Cycle on Profitability of Tea Factories
in Meru County, Kenya. International Journal of Economics, Commerce and
Management, 3(8), 552-563.
Muchina,,S.& Kiano, E. (2011). Influence of working capital management on firm’s
profitability: A case SMES in Kenya, International Business management, 5, (5),
279 – 286.
Mugenda, O. & Mugenda, A. (2008). Research Methods: Quantitative and Qualitative
Approaches. Nairobi. Africa Centre for Technology Studies.
Mwaura, C. N. (2017). The Effect of Inventory Turnover on the Financial Performance of
Medium and Large Retail Supermarkets in Kenya (Doctoral dissertation, School
of Business, University of Nairobi).
Nzioki, P. M., Kimeli, S. K., Abudho, M. R., & Nthiwa, J. M., (2013). "Management of
Working Capital and its Effect on Profitability of Manufacturing Companies
Listed on Nairobi Securities Exchange (NSE), Kenya", International Journal of
Business and Finance Management Research, 1 (4), 35-42.
Nwakaego, A. D., & Ikechukwu, I.O. (2015). Payable Management on Corporate
Profitability of Brewery Manufacturing Companies in Nigeria. Journal of
Research in Business and Management Volume 3 ~ Issue 9 (2015) pp: 07-14.
Nwakaego, A. D., & Ikechukwu, I.O. (2016). Management of Accounts Payable on the
Financial Performance of Industrial/ Domestic Manufacturing Companies in
Nigeria. IOSR Journal Of Humanities And Social Science, 21(7), 54-61.
Obeidat, I.M., & Jawabri, A. (2016). The Impact of Working Capital Management on the
Profitability of Construction Equipment Firms: Evidence from Listed
Construction Equipment Firms in Abu Dhabi Stock Exchange. International
College Journal of Accounting and Finance Vol. 16(8) 135.
Oware, K.M., Samanhyia, S. & Ampong, G.O.A. (2015). Assessment of Risk and
Challenges of Debt Management Practices in Organizations: A Case Study of

65
Ghana Water Company Limited, International Journal of Economics, Commerce
and management,3(9).
Onyam, E.G., Usang, I.E. & Enyisi, S.A., (2015). The impact of human resource
accounting on the profitability of a firm empirical evidence from Access Bank of
Nigeria Plc. Journal of Accounting and Research, 3(7), 76-94.
Pais, M. A., & Gama, P. M. (2015). Working capital management and SMEs profitability:
Portuguese evidence. International Journal of Managerial Finance, 11(3), 341-358.
Paul, M. N., Stephen, K. K., Marcella, R. A. & Janiffer, M. N. (2013). Management of
working capital and its effect on profitability of manufacturing companies listed
on Nairobi securities exchange (NSE), Kenya. IJBFMR, 1(1) 35-42.
Qurashi, M., & Zahoor, M. (2017). Working Capital Determinants for the UK
Pharmaceutical Companies Listed on FTSE 350 Index. International Journal of
Academic Research in Accounting, Finance and Management Sciences, 7(1), 11-
17.
Quayyum, S. T. (2012). Relationship between working capital management and
profitability in context of manufacturing industries in Bangladesh. International
Journal of Business & Management, 7(1), 58-69.
Ramana, N. V., Ramakrishnaiah, K., & Chengalrayulu, P. (2013). Impact of Receivables
Management on working Capital and profitability: A study on select cement
companies in India. Internafional Journal of Markefing & Research, 2(3), 163-
171.
Rehman, M. Z, Khan M. N. & Khokhar, I. (2014). “Select Financial Ratios as a
Determinant of Profitability Evidence from Petrochemical Industry in Saudi
Arabia,” European Journal of Business and Management, vol. 6, no. 6, pp. 187-
196.
Samiloglu, F., & Akgun, A. (2016). The relationship between working capital and
profitability: Evidence from Turkey. Business and Economics Research Journal,
7(2), 1-14.
Sabo, M., Rabi’U, S. J., Usman, S. K., Fatima, B. I., & Tjjani, H. A., (2015). The effect of
working capital management on corporate profitability: evidence from Nigerian
food product firms. Applied Finance and Accounting, 1(2), 55-63.
Schaum, M. (2011). Financial Management. Pauline’s Publications Africa. 2nd Edition.
Sekeran, U. & Bougie, R. (2010). Research Methods for Business: A Skill Building
Approach. 5th Ed. New Jersey. John Wiley and Sons.
66
Singh, H. P., & Kumar, S. (2017). Working capital requirements of manufacturing SMEs:
evidence from emerging economy. Review of International Business and Strategy,
27(3), 369-385.
Sharma, A. K., & Kumar, S. (2011). Effect of working capital management of firm
profitability. Empirical evidence from India. Global Business Review, 12(1), 59-
173.
Shin, H. H. & Soenen, L. (2013). Efficiency of working capital and corporate
profitability. Financial Practice and Education, 8(2), 37-45.
Stevenson, B. (2010). Operations management (10th ed.). New York: Mc Graw Hill
Publishing.
Tauringana, V., & Adjapong Afrifa, G. (2013). The relative importance of working
capital management and its components to SMEs' profitability. Journal of Small
Business and Enterprise Development, 20(3), 453-469.
Tran, Hien, et.al. (2017), “How Does Working Capital Management Affect the
Profitability of Vietnamese Small- and Medium-sized Enterprises?”, Journal of
Small Business and Enterprise Development, 24 (1): 2-11.
Ullah GMW, Zahid A, Khan I, Islam MN (2018). Working Capital Management and
SME Profitability: Empirical Evidence from Bangladesh. Global Journal of
Management and Business, 5(2): 094-099.
Ullah, G. M. W., Islam, M.D. N. & Khair, I.B., (2017). Effects of Working Capital
Management on SMEs Profitability: Evidence from Bangladesh. 4th International
Conference on Business Finance and Management on 13th - 14th July 2017, in
Bangkok, Thailand.
Umoren, A.O. & Udo, E. J. (2015). Working Capital Management and the Performance
of Selected Deposit Money Banks in Nigeria. British Journal of Economics,
Management & Trade 7(1): 23-31.
Venkata N.R, Ramakrishnaiah R, and Chengalrayulu P, (2013). International journal of
marketing, financial management and management research vol. 2, no.3.
Wasiuzzaman, S. (2015). Working capital and firm value in an emerging market.
International Journal of Managerial Finance, 11(1), 60-79.
Yahaya, A. (2016). Effects of working capital management on the financial performance
of the pharmaceutical firms in Nigeria. International Journal of Economics,
Commerce and Management United Kingdom, 4(4).

67
APPENDICES
APPENDIX I: RESEARCH AUTHORIZATION LETTER

68
APPENDIX II: NACOSTI RESEARCH PERMIT

69
APPENDIX III: QUESTIONNAIRE
This is a study on the effect of working capital management on the profitability of SMEs
in Kenya: A case study of retail outlets at Two Rivers Mall. This questionnaire aids to
assists in data collection for academic purpose. All information obtained, will be handled
with high level of confidentiality. Do not incorporate identification or names in the
questionnaire. Kindly answer all questions by putting a tick (√) in the appropriate bracket.
Section A: General Information
1. What is your gender?
Male [ ]
Female [ ]
2. What is your highest level of education attained?
Certificate [ ]
Diploma [ ]
Bachelor’s Degree [ ]
Masters Degree [ ]
PhD [ ]
3. How long have you been working in the SME sector in Kenya?
1-3 years [ ]
4-6 years [ ]
7-9 years [ ]
Above 10 years [ ]
4. What is your position in this firm?
Director [ ]
Manager [ ]
Finance Team [ ]
Other [ ] ________________________________________
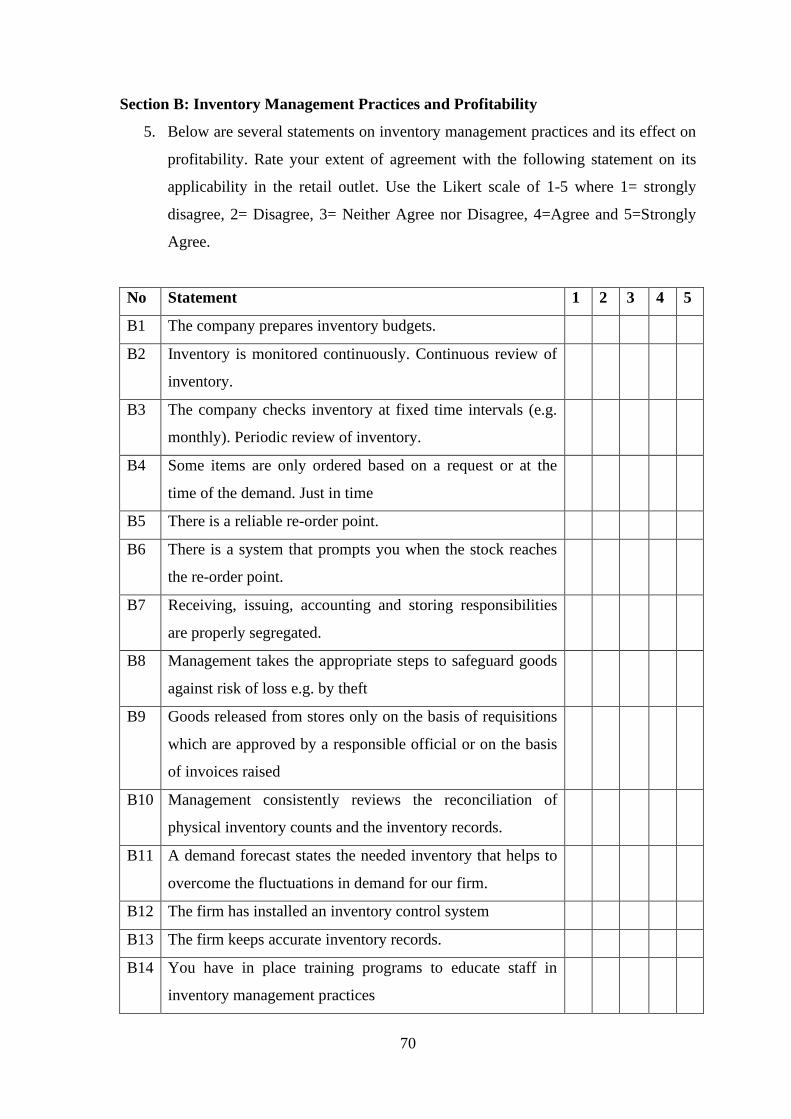
70
Section B: Inventory Management Practices and Profitability
5. Below are several statements on inventory management practices and its effect on
profitability. Rate your extent of agreement with the following statement on its
applicability in the retail outlet. Use the Likert scale of 1-5 where 1= strongly
disagree, 2= Disagree, 3= Neither Agree nor Disagree, 4=Agree and 5=Strongly
Agree.
No Statement 1 2 3 4 5
B1 The company prepares inventory budgets.
B2 Inventory is monitored continuously. Continuous review of
inventory.
B3 The company checks inventory at fixed time intervals (e.g.
monthly). Periodic review of inventory.
B4 Some items are only ordered based on a request or at the
time of the demand. Just in time
B5 There is a reliable re-order point.
B6 There is a system that prompts you when the stock reaches
the re-order point.
B7 Receiving, issuing, accounting and storing responsibilities
are properly segregated.
B8 Management takes the appropriate steps to safeguard goods
against risk of loss e.g. by theft
B9 Goods released from stores only on the basis of requisitions
which are approved by a responsible official or on the basis
of invoices raised
B10 Management consistently reviews the reconciliation of
physical inventory counts and the inventory records.
B11 A demand forecast states the needed inventory that helps to
overcome the fluctuations in demand for our firm.
B12 The firm has installed an inventory control system
B13 The firm keeps accurate inventory records.
B14 You have in place training programs to educate staff in
inventory management practices

71
B15 Good inventory management practices have increased profit
margins
6. To what extent does the inventory management practice affect profitability in the
firm?
Not at all [ ] Little Extent [ ] Moderate Extent [ ]
Large Extent [ ] Very Large Extent [ ]
7. What challenge(s) is the business facing in managing its inventory?
__________________________________________________________________
__________________________________________________________________
__________________________________________________________________
__________________________________________________________________
__________________________________________________________________
Section C: Receivables Management Practices and Profitability
8. Below are several statements on receivables management practices and their effect
on profitability. Rate your extent of agreement with the following statement. Use
the Likert scale of 1-5 where 1= strongly disagree, 2= Disagree, 3= Neither Agree
nor Disagree, 4=Agree and 5=Strongly Agree.
No: Statement 1 2 3 4 5
C1 Our customers are those that deal with cash and carry.
C2 The company accounts receivables processes are influenced
by written manuals.
C3 Employees can influence the customers’ term of payment.
C4 Competition is the major reason for granting credit in our
organization
C5 The prevailing economic and social political factors affect
the customer’s ability to pay.
C6 There are procedures in place to ensure that bills are
prepared and sent as soon as possible after the sale of goods
or provision of services.

72
C7 Remittance advices and bills are maintained to support
accounts receivable entries in the general ledger
C8 The business unit regularly follows up on accounts
receivables
C9 Online account management is used for viewing and
printing balances and statements, searching for specific
items and adjusting stop orders and stop payments
C10 Online account management is a more cost-effective
alternative to paper-based processes.
C11 We have an aged accounts receivables report to help in
management of accounts receivable
C12 The business experiences bad debt losses
C13 The management makes adjustments or write offs.
C14 There are proper methods used to select, train and supervise
accounting personnel and credit control.
C15 A customer failure to pay back their credit impacts
profitability.
C16 Receivables management policy affects profitability
9. To what extent does receivables management practice affect profitability of the
enterprise?
Not at all [ ] Little Extent [ ] Moderate Extent [ ]
Large Extent [ ] Very Large Extent [ ]
10. What challenge(s) is the business facing in managing its accounts receivable?
__________________________________________________________________
__________________________________________________________________
__________________________________________________________________
__________________________________________________________________
__________________________________________________________________

73
Section D: Payables Management Practices and Profitability
11. Below are several statements on payables management practices and its effect on
profitability. Rate your extent of agreement with the following statement. Use the
Likert scale of 1-5 where 1= strongly disagree, 2= Disagree, 3= Neither Agree nor
Disagree, 4=Agree and 5=Strongly Agree.
No: Statement 1 2 3 4 5
D1 The business makes purchases only on cash basis
D2 The business makes purchases only on credit
D3 The business takes advantage of discount facilities by
paying creditors promptly
D4 The business settles accounts payable on the last day that the
payment is due.
D5 The business uses computers to manage accounts payable.
D6 The business lacks trained personnel to manage accounts
payables
D7 After paying all our expenses, we do not get any profits
D8 The business failure to pay creditors credit impacts
profitability and increases the risk of bankruptcy.
D9 Payables management policy affects profitability
12. To what extent does payables management influence the profitability of the firm?
Not at all [ ] Little Extent [ ] Moderate Extent [ ]
Large Extent [ ] Very Large Extent [ ]
13. What challenge(s) is the business facing in managing its accounts payable?
__________________________________________________________________
__________________________________________________________________
__________________________________________________________________
__________________________________________________________________
__________________________________________________________________
THANK YOU