by clyde stickney and hervé stolowy - core.ac.uk · 3 literature review some areas of accounting...
TRANSCRIPT

Survey of financial statement analysis courses in Europe and the United States
By Clyde Stickney and Hervé Stolowy
Clyde P. StickneyThe Signal Companies Professor of ManagementAmos Tuck School of Business AdministrationDartmouth CollegeHanover, NH [email protected].
Hervé Stolowy*Professor of AccountingHEC School of Management1, rue de la Libération78351 – Jouy-en-Josas Cedex – [email protected]
Third draft – November 10, 2000
* Corresponding author
1
Survey of financial statement analysis courses in Europe and the United States
Abstract
The paper reports the results of a survey of the content and learning materials used in
courses in financial statement analysis in Europe and the United States. Courses in Europe
and undergraduate courses in the U.S. exhibit similar characteristics with respect to course
content (heavy emphasis on basic tools of analysis). Graduate courses in the U.S. place
heavier emphasis on coverage of generally accepted accounting principles and on
applications of basic analytical tools. Differences in course content appear related to where
the financial statement analysis course lodges within the accounting curriculum.
Résumé
Ce papier présente les résultats d’une étude portant sur le contenu et les instruments
pédagogiques utilisés dans des cours d’analyse financière en Europe et aux Etats-Unis. Les
cours européens et les cours “undergradute” américains présentent des caractéristiques
similaires au regard du contenu (accent mis sur les outils de base de l’analyse financière).
Les cours “graduate” américains insistent davantage sur le traitement des principes
comptables et sur l’application des outils d’analyse. Les différences dans le contenu des
cours peut s’expliquer par la localisation du cours dans le cursus d’enseignement de la
comptabiité financière.
Keywords
Accounting education – financial statement analysis – Europe – U.S. – graduate – undergraduate
Acknowledgements
We wish to thank the academics and institutions who responded to our questionnaire. The financial support
of the Research Centre of the HEC School of Management is gratefully acknowledged. Hervé Stolowy would
also like to thank Michel Tenenhaus, Professor of Statistics at HEC, for his much appreciated help, Yuan
Ding (HEC) for his helpful comments and Anne Jeny, doctoral student at HEC, for her able research
assistance. Data used in this project are available from the authors upon request.
2
Introduction: Interest for financial statement analysis education
The congruence between the expectations of academics, practitioners and students about
the objectives of accounting education has been much debated. In this context, it is always
interesting to study how one area of accounting education is being taught.
This paper reports the results of a survey conducted during the summer of 1998 to
study the content and structure of courses in financial statement analysis (FSA) at
academic institutions in Europe and the United States. No particular hypothesised
differences between these geographical locations motivate our study. Rather, our interest
stems from a perceived increased interest in courses in financial statement analysis at both
the undergraduate and graduate levels and a desire to obtain a pulse of the status of the
course in these two localities. Forces leading to increased interest in this course in recent
years include the growth in five-year accounting programs in the U.S., expanded interest in
security valuation and investments both domestically and globally, increased interest in
capital markets research by academicians, and the appearance during the 1990s of several
new textbooks on financial statement analysis (Stickney 1990; White, Sondhi, and Fried
1994; Rees 1990; Samuels, Brayshaw and Craner 1995; Palepu, Bernard, and Healy 1996;
Haskins, Ferris, and Selling 1996; Blake and Amat 1996; Laidler and Donaghy 1998).
This research may be of interest to accounting departments wanting to add an FSA
course to their curriculum or the departments desiring to “benchmark” an existing FSA
course.
The remainder of our paper proceeds as follows. The first section presents a review of
the relevant literature. Section 2 describes the research methodology, including the
questionnaire used. Section 3 presents our results, focusing on the prevalence of FSA
course, its content, and assignment materials. Section 4 suggests some limitations of our
study and directions for future research and Section 5 presents the conclusions.

3
Literature review
Some areas of accounting education have been subject to numerous surveys dealing with
what is being taught or what should be taught. For example, several articles on
international accounting education have been published emphasising the
internationalisation of the accounting curriculum and the necessity to cover both
comparative aspects and accounting dimensions of multinational enterprises (see namely
Stolowy and Tenenhaus, 1998).
In the governmental accounting area, Miller and Van Daniker (1999) conducted a
survey to uncover the changes that have been taken place in government accounting
education during the past five years and those that will likely occur during the next five
years.
Paradoxically, the field of financial statement analysis has not been explored a lot.
Prober and Sherman (1988) presented the results of a survey of undergraduate accounting
departments in schools which have received AACSB accreditation or whose accounting
program has itself been separately accredited by the AACSB to determine how FSA was
being covered in their curriculae. They showed that although most schools do cover the
topic, a large percentage do not include important aspects of the subject such as the
significance of user objectives, footnote disclosures, or trend analysis in their presentation.
At that time, Prober and Sherman encouraged expanded coverage of FSA topics in existing
accounting courses.
About ten years later, Koehn and Hallam (1999) carried out a survey on the
pervasiveness and attributes of stand-alone FSA courses at both an undergraduate and
graduate level in the US. This paper provided demographic data of survey participants as
well as information regarding motivations for offering the course, classroom materials,
instructional methods and topic analysis. However, in comparison with this survey, our
paper compares the US and Europe, and put also more emphasis on the difference between
undergraduate and graduate programs.
4
Methodology
SAMPLE
A questionnaire was sent to each school listed in the U.S. portion of the Accounting
Faculty Directory, compiled by James R. Hasselback (1998). In almost all cases, the
questionnaire was sent to the individual designated as the head of the accounting group.
With regard to the European population, the questionnaire was sent to each European-
member academic institution in the European Accounting Association (EAA) and the
European Finance Association (EFA). Several academics from the same institution were
contacted in some cases to increase the likelihood of receiving a response to the
questionnaire. We asked the correspondent to have the individual most familiar with the
subject at that institution fill out the questionnaire. We did not include more than one
response from any single institution when we received more than one, unless the responses
related to different courses. Questionnaires were sent to institutions in 27 countries. The 27
countries sampled include 14 member countries of the European Union (Austria, Belgium,
Denmark, Finland, France, Germany, Greece, Ireland, Italy, Netherlands, Portugal, Spain,
Sweden and United Kingdom) and 13 other countries (Croatia, Cyprus, Czech Republic,
Estonia, Hungary, Iceland, Malta, Norway, Poland, Russia, Slovenia, Switzerland and
Turkey). A breakdown of the number of questionnaires/ syllabi received by country in
Europe is given in table 1.
5
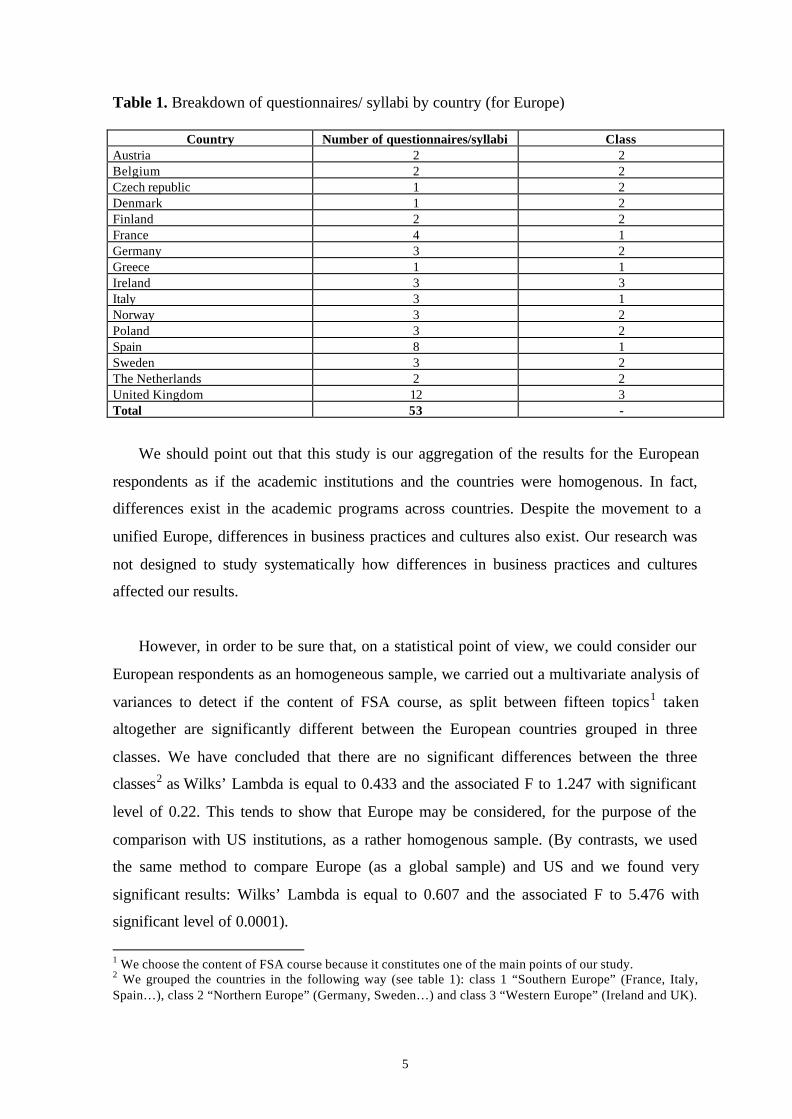
Table 1. Breakdown of questionnaires/ syllabi by country (for Europe)
Country Number of questionnaires/syllabi ClassAustria 2 2Belgium 2 2Czech republic 1 2Denmark 1 2Finland 2 2France 4 1Germany 3 2Greece 1 1Ireland 3 3Italy 3 1Norway 3 2Poland 3 2Spain 8 1Sweden 3 2The Netherlands 2 2United Kingdom 12 3Total 53 -
We should point out that this study is our aggregation of the results for the European
respondents as if the academic institutions and the countries were homogenous. In fact,
differences exist in the academic programs across countries. Despite the movement to a
unified Europe, differences in business practices and cultures also exist. Our research was
not designed to study systematically how differences in business practices and cultures
affected our results.
However, in order to be sure that, on a statistical point of view, we could consider our
European respondents as an homogeneous sample, we carried out a multivariate analysis of
variances to detect if the content of FSA course, as split between fifteen topics1 taken
altogether are significantly different between the European countries grouped in three
classes. We have concluded that there are no significant differences between the three
classes2 as Wilks’ Lambda is equal to 0.433 and the associated F to 1.247 with significant
level of 0.22. This tends to show that Europe may be considered, for the purpose of the
comparison with US institutions, as a rather homogenous sample. (By contrasts, we used
the same method to compare Europe (as a global sample) and US and we found very
significant results: Wilks’ Lambda is equal to 0.607 and the associated F to 5.476 with
significant level of 0.0001).
1 We choose the content of FSA course because it constitutes one of the main points of our study.2 We grouped the countries in the following way (see table 1): class 1 “Southern Europe” (France, Italy,Spain…), class 2 “Northern Europe” (Germany, Sweden…) and class 3 “Western Europe” (Ireland and UK).
6
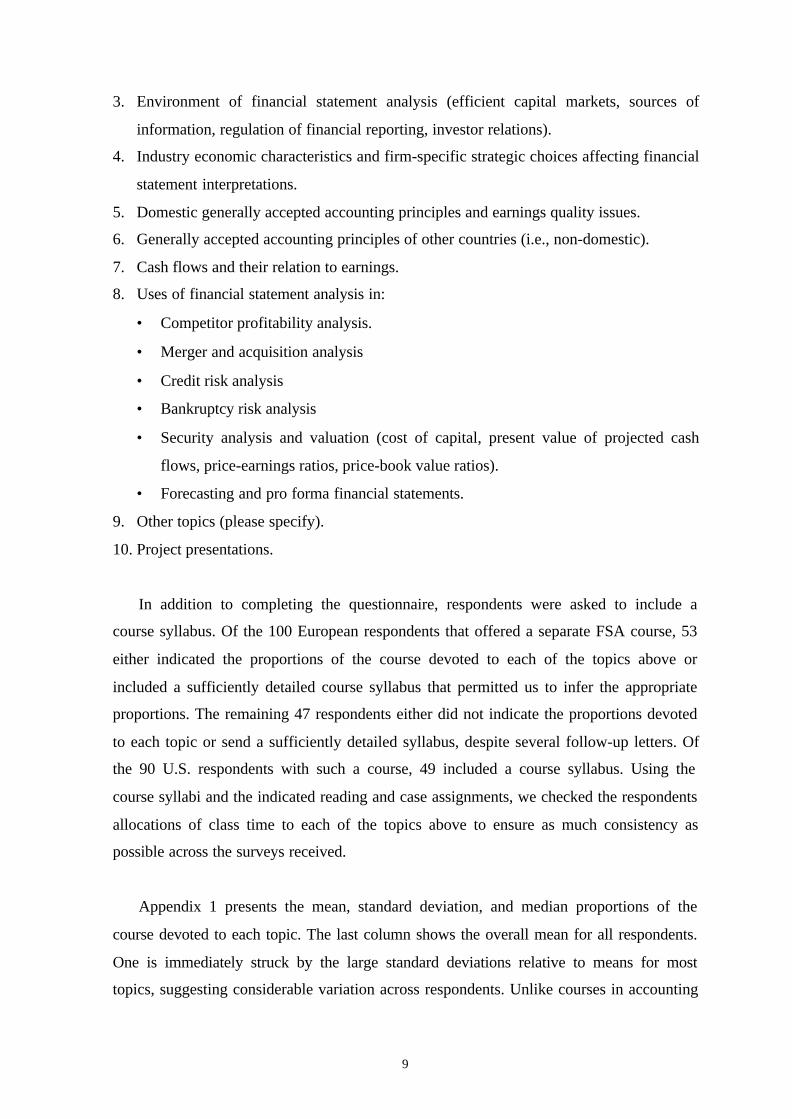
SURVEY INSTRUMENT
The specific questions addressed to participants in the survey are as follows:
1. Does your institution offer a separate course in financial statement analysis?
2. What proportion of class time do you devote to each of several topics (discussed
below).
3. What is the relative emphasis of the course on domestic companies versus companies
headquartered in other countries?
4. Do you require students to perform an integrative analysis of one or more companies as
a separate project distinct from day-to-day assignments?
5. Do you use a single required textbook, multiple required textbooks, multiple
recommended textbooks, or some other approach to reading assignments?
6. To what extent do you require students to read articles from the professional analyst
literature?
7. To what extent do you require students to read articles from the academic literature?
The sections below discuss the specifics of the questionnaire more fully and present
the survey results.
RESPONSE RATE
The number of questionnaires sent and the response rates were as follows (table 2):
Table 2. Response rate
This study(Europe)
This study(United States)
Prober andSherman
(1988)
Koehn andHallam (1999)
Questionnaire's Sent 425 827 219 362Responses Received 184 336 100 163Response Rate 43.3% 40.6% 45.6% 45%Number of syllabi/questionnaires 53 90 - -
This idea of grouping is debatable (see an example of discussion on classification of countries in Nobes andParker [1998, p. 55]). By simplification, we divided Europe into three geographical areas.

7
Thus, the response rates were similar and rather satisfactory, if compared to previous
surveys.
Results
PREVALENCE OF FSA COURSE
The initial question asked of respondents was whether their institution offered a separate
FSA course (as opposed to including FSA materials as part of other courses). The results
were as follows (table 3):
Table 3. Prevalence of FSA course
Europe United StatesTotal Responses Received 184 336Respondents Indicating a Separate FSA Course 100 90Percentage of Institutions with Separate FSA Course 54.3% 26.8%
The significantly smaller percentage of U.S. institutions with a separate FSA course
was somewhat of a surprise. Part of the explanation lies in the makeup of the U.S. sample.
Approximately one third of the U.S. respondents were from four-year colleges with four or
fewer faculty members in accounting according to Hasselback's directory. It is unlikely
that such schools offer a full range of accounting courses. Courses in FSA at the
undergraduate level frequently build on core accounting principles courses and usually
appear either as electives for seniors or as required courses in five-year programs. Colleges
with limited offerings in accounting often do not have accounting majors. The high
proportion of such schools in the U.S. sample probably explains in part the lower overall
proportion of respondents with a separate FSA course. In Europe, the statistics confirm that
FSA is a well-developed course taught in more that one-half of our sample.
Respondents in the U.S. were then asked to indicate the level (undergraduate versus
graduate) where they offered the FSA course. Of the 90 U.S. respondents, 23 indicated that
they offered a separate FSA course at the undergraduate level only, 44 indicated that they
offered such a course at the graduate level only, and 23 indicated that they offered a course
at both the undergraduate and graduate levels. Thus, the course is more prevalent at the
graduate (59 courses) than at the undergraduate level (31 courses), although a significant

8
number of schools offer the course at the undergraduate level. It would be interesting to
study changes in the prevalence of the FSA course over time.
Business education in Europe makes less of a distinction between undergraduate and
graduate programs than in the U.S. Some countries, such as the UK, have a system similar
that in the U.S., with a clear distinction between undergraduate and graduate programs.
Other countries simply designate their programs as professional degree programs in
accounting. Italy and France, for example, grant a Baccalauréat degree when students
complete high school. When such students study in a business school during the next five
years, they are considered graduate students, although they are younger (23 year old on
average when they complete their studies) and have less work experience than graduate
students in the U.S.
As a consequence of these differences in the educational systems in Europe, we did not
ask respondents to distinguish between undergraduate and graduate courses in the
European sample.
CONTENT OF FSA COURSE
We asked respondents who offered a separate FSA course to indicate the proportion of the
course devoted to each of several topics. Respondents in the U.S. were asked to indicate
whether the course described was offered at the undergraduate or the graduate level. Thus,
we were able to compare course offerings in both Europe and the U.S. and then to compare
undergraduate and graduate courses in the U.S.
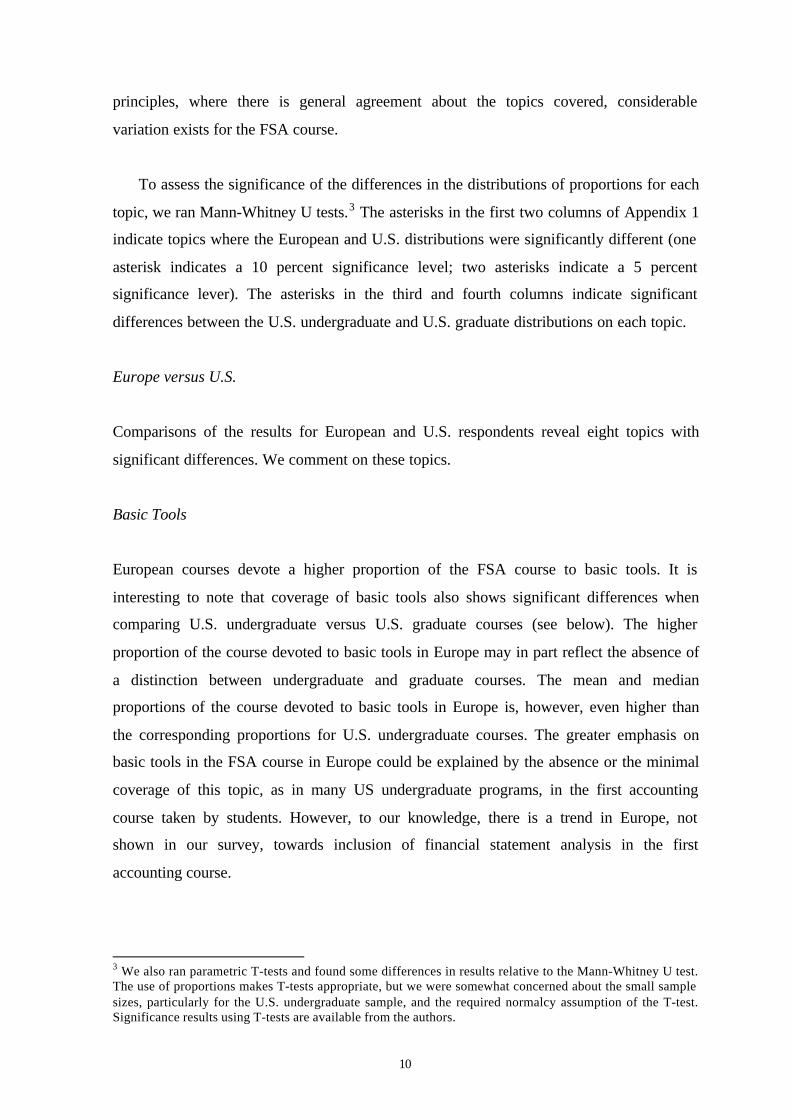
The topic categories and the brief description included in the survey instrument are as
follows:
1. Review of financial accounting (financial statements, notes, audit opinion).
2. Basic tools and concepts of financial statement analysis (common size and trend
statement, financial statement ratios, profit margin, asset turnover, rates of return,
operating and financial leverage, growth and working capital needs, alternatives
measures of performance).
9
3. Environment of financial statement analysis (efficient capital markets, sources of
information, regulation of financial reporting, investor relations).
4. Industry economic characteristics and firm-specific strategic choices affecting financial
statement interpretations.
5. Domestic generally accepted accounting principles and earnings quality issues.
6. Generally accepted accounting principles of other countries (i.e., non-domestic).
7. Cash flows and their relation to earnings.
8. Uses of financial statement analysis in:
• Competitor profitability analysis.
• Merger and acquisition analysis
• Credit risk analysis
• Bankruptcy risk analysis
• Security analysis and valuation (cost of capital, present value of projected cash
flows, price-earnings ratios, price-book value ratios).
• Forecasting and pro forma financial statements.
9. Other topics (please specify).
10. Project presentations.
In addition to completing the questionnaire, respondents were asked to include a
course syllabus. Of the 100 European respondents that offered a separate FSA course, 53
either indicated the proportions of the course devoted to each of the topics above or
included a sufficiently detailed course syllabus that permitted us to infer the appropriate
proportions. The remaining 47 respondents either did not indicate the proportions devoted
to each topic or send a sufficiently detailed syllabus, despite several follow-up letters. Of
the 90 U.S. respondents with such a course, 49 included a course syllabus. Using the
course syllabi and the indicated reading and case assignments, we checked the respondents
allocations of class time to each of the topics above to ensure as much consistency as
possible across the surveys received.
Appendix 1 presents the mean, standard deviation, and median proportions of the
course devoted to each topic. The last column shows the overall mean for all respondents.
One is immediately struck by the large standard deviations relative to means for most
topics, suggesting considerable variation across respondents. Unlike courses in accounting
10
principles, where there is general agreement about the topics covered, considerable
variation exists for the FSA course.
To assess the significance of the differences in the distributions of proportions for each
topic, we ran Mann-Whitney U tests.3 The asterisks in the first two columns of Appendix 1
indicate topics where the European and U.S. distributions were significantly different (one
asterisk indicates a 10 percent significance level; two asterisks indicate a 5 percent
significance lever). The asterisks in the third and fourth columns indicate significant
differences between the U.S. undergraduate and U.S. graduate distributions on each topic.
Europe versus U.S.
Comparisons of the results for European and U.S. respondents reveal eight topics with
significant differences. We comment on these topics.
Basic Tools
European courses devote a higher proportion of the FSA course to basic tools. It is
interesting to note that coverage of basic tools also shows significant differences when
comparing U.S. undergraduate versus U.S. graduate courses (see below). The higher
proportion of the course devoted to basic tools in Europe may in part reflect the absence of
a distinction between undergraduate and graduate courses. The mean and median
proportions of the course devoted to basic tools in Europe is, however, even higher than
the corresponding proportions for U.S. undergraduate courses. The greater emphasis on
basic tools in the FSA course in Europe could be explained by the absence or the minimal
coverage of this topic, as in many US undergraduate programs, in the first accounting
course taken by students. However, to our knowledge, there is a trend in Europe, not
shown in our survey, towards inclusion of financial statement analysis in the first
accounting course.
3 We also ran parametric T-tests and found some differences in results relative to the Mann-Whitney U test.The use of proportions makes T-tests appropriate, but we were somewhat concerned about the small samplesizes, particularly for the U.S. undergraduate sample, and the required normalcy assumption of the T-test.Significance results using T-tests are available from the authors.

11
Economics/Strategy
Exhibit 1 indicates that U.S. courses devote a higher proportion of the course to
consideration of the economics and strategies of businesses than the European
counterparts. One possible explanation is that several recently published textbooks in the
U.S. place a heavy emphasis on integrating economic and strategic considerations into the
interpretation of financial ratios (for example, Palepu, Bernard, and Healy (1996); Stickney
(1990)).
Domestic GAAP
Although consideration of domestic GAAP comprises an important part of the FSA course
in both the Europe and the U.S., the proportion in the U.S. is significantly higher. An
examination of the proportions for U.S. undergraduate versus U.S. graduate courses
suggests that the higher overall U.S. proportion results from the greater emphasis on
GAAP in graduate courses. A common practice in U.S. MBA programs is to offer a single
second-level financial accounting course that includes both GAAP not covered in the
initial course and tools of financial statement analysis. The more typical structure in U.S.
undergraduate programs is to offer advanced GAAP courses and FSA course separately.
The European course structure more closely resembles that found in U.S. undergraduate
programs.
12
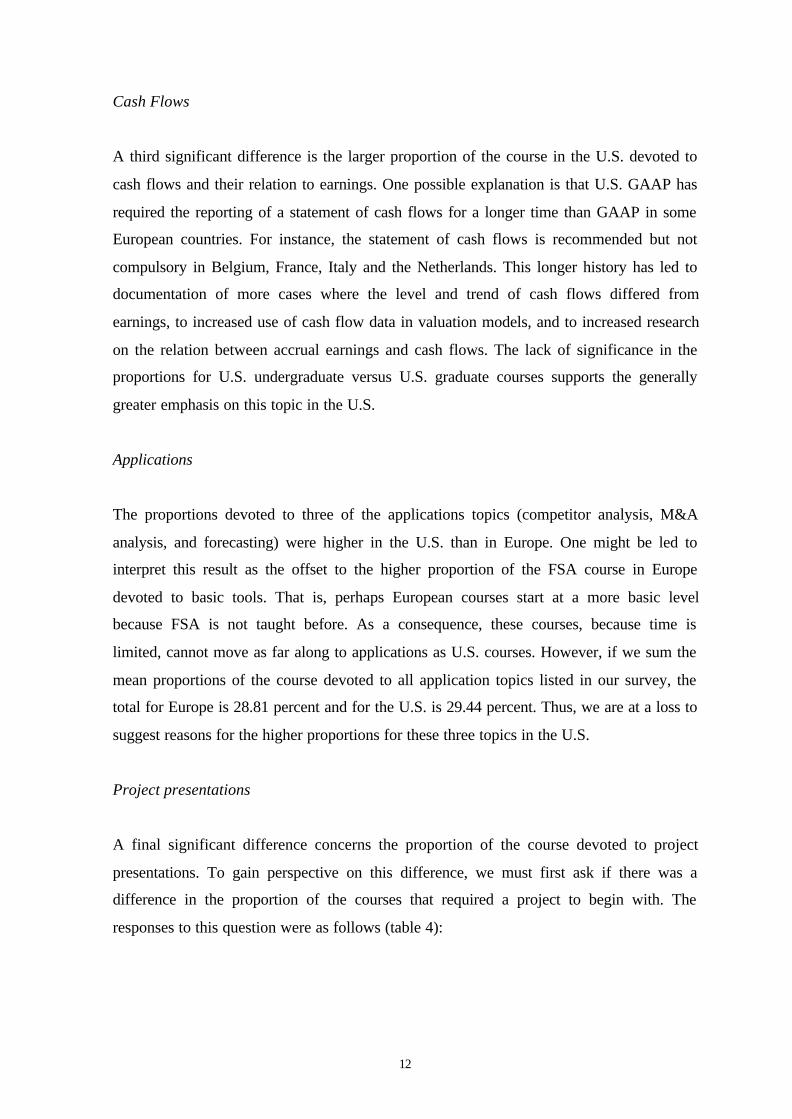
Cash Flows
A third significant difference is the larger proportion of the course in the U.S. devoted to
cash flows and their relation to earnings. One possible explanation is that U.S. GAAP has
required the reporting of a statement of cash flows for a longer time than GAAP in some
European countries. For instance, the statement of cash flows is recommended but not
compulsory in Belgium, France, Italy and the Netherlands. This longer history has led to
documentation of more cases where the level and trend of cash flows differed from
earnings, to increased use of cash flow data in valuation models, and to increased research
on the relation between accrual earnings and cash flows. The lack of significance in the
proportions for U.S. undergraduate versus U.S. graduate courses supports the generally
greater emphasis on this topic in the U.S.
Applications
The proportions devoted to three of the applications topics (competitor analysis, M&A
analysis, and forecasting) were higher in the U.S. than in Europe. One might be led to
interpret this result as the offset to the higher proportion of the FSA course in Europe
devoted to basic tools. That is, perhaps European courses start at a more basic level
because FSA is not taught before. As a consequence, these courses, because time is
limited, cannot move as far along to applications as U.S. courses. However, if we sum the
mean proportions of the course devoted to all application topics listed in our survey, the
total for Europe is 28.81 percent and for the U.S. is 29.44 percent. Thus, we are at a loss to
suggest reasons for the higher proportions for these three topics in the U.S.
Project presentations
A final significant difference concerns the proportion of the course devoted to project
presentations. To gain perspective on this difference, we must first ask if there was a
difference in the proportion of the courses that required a project to begin with. The
responses to this question were as follows (table 4):

13
Table 4. Separate project
Europe U.S.Total
U.S.Undergraduate
U.S.Graduate
Observed dataYes 29 74 26 48No 18 16 5 11Total 47 90 31 59No answer 6 0 0 0Total 53 90 31 59PercentagesYes 62% 82% 84% 81%No 38% 18% 16% 19%
A Chi-square test showed statistical significance (at a level of .01) to the difference in
proportions for Europe versus the U.S. but no significance for U.S. undergraduate versus
U.S. graduate. Thus, separate projects appear to be a popular learning tool in most FSA
courses in the United States. The lower proportion for European institutions may reflect a
history of greater emphasis on lecture-based education. It may also reflect the use of
multiple case studies as opposed to a single, large project to develop FSA skills.
Thus, the greater use of projects in the U.S. may explain in part the larger proportion of
the course devoted to oral presentations of projects. Another possible explanation is the
recent increased emphasis in the U.S. on developing effective oral communication skills.
U.S. Undergraduate versus U.S. Graduate.
Seven topics show significant differences when comparing U.S. undergraduate versus U.S.
graduate courses. Six of these seven differences appear related to a common explanation.
Undergraduate courses devote more time to review of financial accounting and basic tools
and graduate courses devote more time to specific applications (merger and acquisition
analysis, credit analysis, bankruptcy prediction, and security valuation). These differences
occur because of where the FSA course falls in the student's education. The FSA course at
the undergraduate level is often the student's first in-depth exposure to the tools of financial
statement analysis. The course frequently serves as a synthesising experience after
accounting students have completed accounting principles courses in their junior and
senior years. Initial coverage of the basic tools often occurs in the undergraduate course,
whereas graduate courses in FSA are usually second-year electives in MBA programs.
MBA students often experience initial exposure to the basic tools in a first-year accounting
14
or finance course. It is not surprising that undergraduate courses devote more of their time
to review and introduction of the basic tools. Applications of the tools to specific analysis
settings often use case studies of actual companies and require integrative skills across
several business disciplines. The use of case studies is typically found more commonly in
graduate programs.
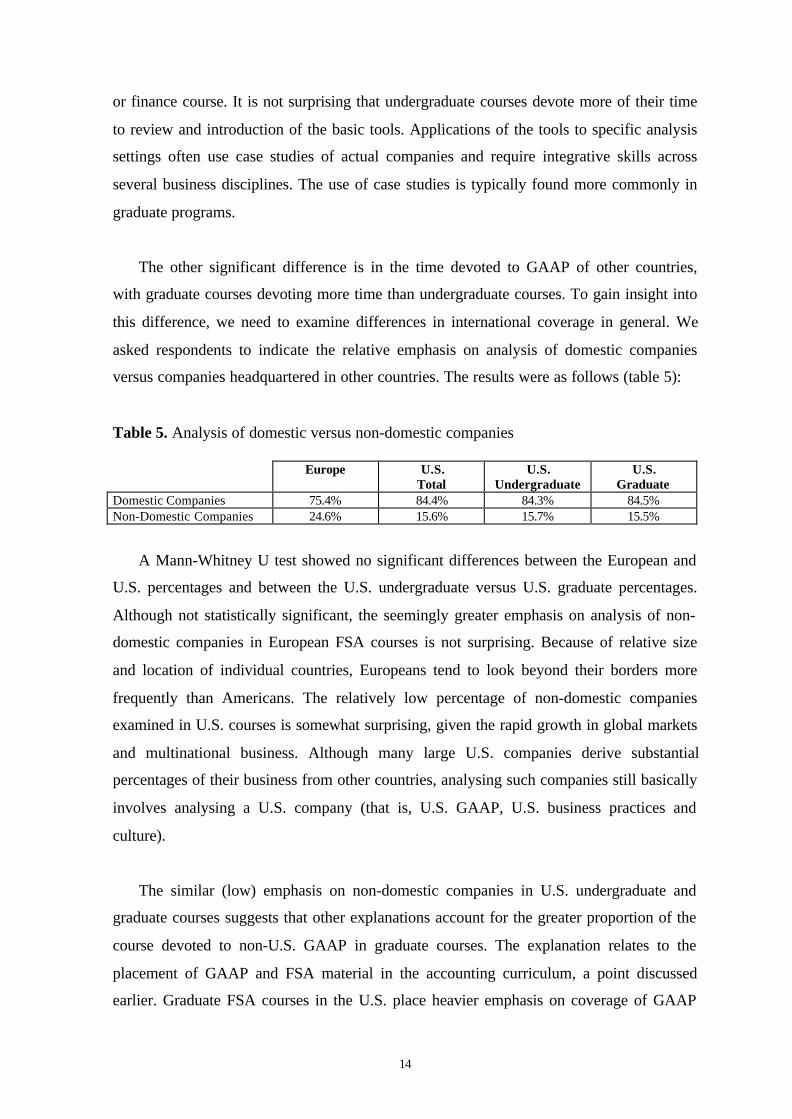
The other significant difference is in the time devoted to GAAP of other countries,
with graduate courses devoting more time than undergraduate courses. To gain insight into
this difference, we need to examine differences in international coverage in general. We
asked respondents to indicate the relative emphasis on analysis of domestic companies
versus companies headquartered in other countries. The results were as follows (table 5):
Table 5. Analysis of domestic versus non-domestic companies
Europe U.S.Total
U.S.Undergraduate
U.S.Graduate
Domestic Companies 75.4% 84.4% 84.3% 84.5%Non-Domestic Companies 24.6% 15.6% 15.7% 15.5%
A Mann-Whitney U test showed no significant differences between the European and
U.S. percentages and between the U.S. undergraduate versus U.S. graduate percentages.
Although not statistically significant, the seemingly greater emphasis on analysis of non-
domestic companies in European FSA courses is not surprising. Because of relative size
and location of individual countries, Europeans tend to look beyond their borders more
frequently than Americans. The relatively low percentage of non-domestic companies
examined in U.S. courses is somewhat surprising, given the rapid growth in global markets
and multinational business. Although many large U.S. companies derive substantial
percentages of their business from other countries, analysing such companies still basically
involves analysing a U.S. company (that is, U.S. GAAP, U.S. business practices and
culture).
The similar (low) emphasis on non-domestic companies in U.S. undergraduate and
graduate courses suggests that other explanations account for the greater proportion of the
course devoted to non-U.S. GAAP in graduate courses. The explanation relates to the
placement of GAAP and FSA material in the accounting curriculum, a point discussed
earlier. Graduate FSA courses in the U.S. place heavier emphasis on coverage of GAAP

15
(both domestic and non-domestic) in general than undergraduate courses. Undergraduate
courses typically cover GAAP in intermediate and advanced accounting principles courses.
Graduate programs either have separate courses in GAAP and FSA or combine them into a
single course. The greater emphasis on GAAP in FSA graduate courses reflects attempts to
cover both GAAP and FSA in a single course. The high standard deviations around the
mean for the time devoted to GAAP reflects the inclusion of GAAP in either a separate
course or included in the FSA course.
Results Across Topics
The last column of Exhibit 1 shows the overall mean for each topic for the combined
European and U.S. samples. One might view the first four topics (review, basic tools,
environment, and industry/strategy characteristics) as the building blocks for effective
analysis. The sum of the overall means for these four topics is 42.29 percent of the course.
The topics relating to domestic GAAP, non-domestic-GAAP, and cash flows versus
earnings encompass data issues and relevant variables for analysis. The sum of the overall
means for these three topics is 22.98 percent. The six applications topics sum to 29.21
percent. Table 6 reports these summed means for the various respondent groups. With the
exception of project presentations, FSA courses in Europe show greater similarity to U.S.
undergraduate courses than U.S. graduate courses in the proportion of time devoted to
various topics.
Table 6. Mean proportions of course devoted to broad categories of topics
Total U.S. U.S. OverallEurope U.S. Under Grad. Mean
Building Blocks (review, basic tools, environment,industry characteristics)
48.30 38.74 45.10 35.41 42.29
Data Issues and Relevant Variables (domesticGAAP, non-domestic GAAP, cash flows versusearnings)
19.08 25.28 22.81 26.58 22.98
Applications 28.80 29.44 25.26 31.64 29.21
Other Topics 1.18 0.70 0.39 0.86 0.88
Project Presentation 2.63 5.83 6.45 5.51 4.65
Total 100.00 100.00 100.00 100.00 100.00
16
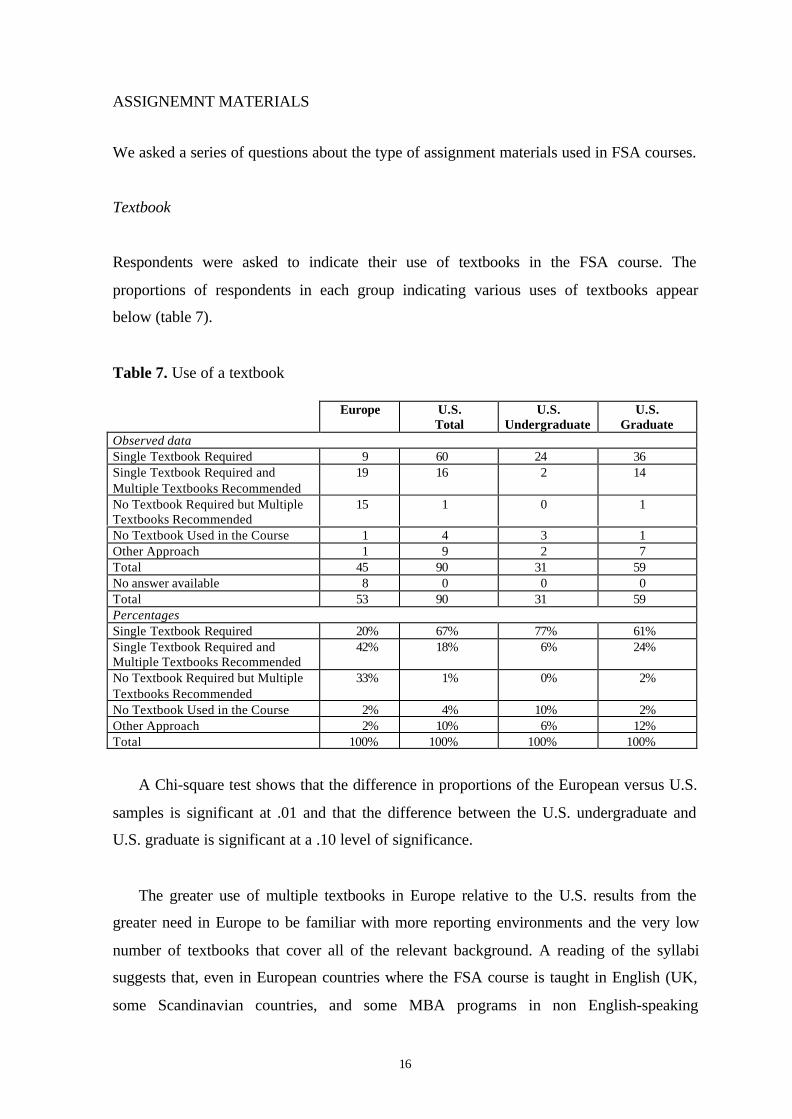
ASSIGNEMNT MATERIALS
We asked a series of questions about the type of assignment materials used in FSA courses.
Textbook
Respondents were asked to indicate their use of textbooks in the FSA course. The
proportions of respondents in each group indicating various uses of textbooks appear
below (table 7).
Table 7. Use of a textbook
Europe U.S.Total
U.S.Undergraduate
U.S.Graduate
Observed dataSingle Textbook Required 9 60 24 36Single Textbook Required andMultiple Textbooks Recommended
19 16 2 14
No Textbook Required but MultipleTextbooks Recommended
15 1 0 1
No Textbook Used in the Course 1 4 3 1Other Approach 1 9 2 7Total 45 90 31 59No answer available 8 0 0 0Total 53 90 31 59PercentagesSingle Textbook Required 20% 67% 77% 61%Single Textbook Required andMultiple Textbooks Recommended
42% 18% 6% 24%
No Textbook Required but MultipleTextbooks Recommended
33% 1% 0% 2%
No Textbook Used in the Course 2% 4% 10% 2%Other Approach 2% 10% 6% 12%Total 100% 100% 100% 100%
A Chi-square test shows that the difference in proportions of the European versus U.S.
samples is significant at .01 and that the difference between the U.S. undergraduate and
U.S. graduate is significant at a .10 level of significance.
The greater use of multiple textbooks in Europe relative to the U.S. results from the
greater need in Europe to be familiar with more reporting environments and the very low
number of textbooks that cover all of the relevant background. A reading of the syllabi
suggests that, even in European countries where the FSA course is taught in English (UK,
some Scandinavian countries, and some MBA programs in non English-speaking

17
countries), the instructor used multiple textbooks. Our interpretation is that the textbooks
available in English tended to emphasise reporting in the U.S. instead of European
reporting.
The heavier use of multiple textbooks in graduate, relative to undergraduate, courses in
the U.S. probably reflects the less directed approach to graduate education (that is,
graduate students are encouraged to seek other explanations of topics studied) and the
absence of a single textbook that meets the more varied objectives of this course found at
the graduate level.
Readings from the professional analyst literature
Respondents were asked to indicate the number of articles from the professional analyst
literature that students were assigned to read in the course. The proportion in each category
appears below (table 8).
Table 8. Number of readings from the professional analyst literature
Europe U.S.Total
U.S.Undergraduate
U.S.Graduate
Observed dataNone 25 19 11 81 to 5 articles 14 49 16 336 to 10 articles 5 12 2 10More than 10 articles 0 9 2 7Total 44 89 31 58No answer available 9 1 0 1Total 53 90 31 59PercentagesNone 57% 21% 35% 14%1 to 5 articles 32% 55% 52% 57%6 to 10 articles 11% 13% 6% 17%More than 10 articles 0% 10% 6% 12%Total 100% 100% 100% 100%
Chi-square tests show that the differences between Europe and the U.S. are significant
at a .01 level and the differences between the U.S. undergraduate and U.S. graduate are
significant at the .10 level.
The use of articles from the professional literature in European courses is more similar
(although different) to the pattern for U.S. undergraduate courses than for U.S. graduate

18
courses. This result is consistent with the heavier emphasis of both European and U.S.
undergraduate courses on the basic tools of analysis. The heavier use of readings from the
professional analyst literature in U.S. graduate, relative to undergraduate, courses reflects
in part the desire in graduate courses to stretch student learning beyond the textbook and in
part to the likely higher proportion of students at the graduate level taking the FSA course
as preparation for a financial analyst position.
Readings from the academic literature
Respondents were also asked to indicate their use of readings from the academic literature
using the same categories as above. The results are as follows (table 9).
Table 9. Number of readings from the academic literature
Europe U.S.Total
U.S.Undergraduate
U.S.Graduate
Observed dataNone 21 43 19 241 to 5 articles 13 37 10 276 to 10 articles 7 6 0 6More than 10 articles 3 1 0 1Total 44 87 29 58No answer available 9 3 2 1Total 53 90 31 59PercentagesNone 48% 49% 66% 41%1 to 5 articles 30% 43% 34% 47%6 to 10 articles 16% 7% 0% 10%More than 10 articles 7% 1% 0% 2%Total 100% 100% 100% 100%
Chi-square tests show the differences between Europe and the U.S. to be significant at
a .10 level and between the U.S. undergraduate and graduate significant at the same level.
The responses for the European sample in this case are more similar to the U.S.
graduate response than to the U.S. undergraduate response. European courses appear to
make even heavier use of articles from the academic literature than U.S. graduate courses.
This result seems inconsistent with the greater similarity of European FSA courses with
U.S. undergraduate courses. One possible explanation is that FSA textbooks in the U.S.
incorporate more of the academic literature than is the case with textbooks in Europe.
Instructors compensate for any such difference by assigning articles from the academic

19
literature. Another possible explanation is that the academic literature in Europe is more
applied than in the U.S., so that some articles that appear in the academic literature in
Europe would appear in professional analyst literature in the U.S.
Limitations and directions for future research
One limitation of this study is that the results portray a snapshot of the FSA course at a
moment in time. Perhaps another interesting question is how this course has changed in
recent years and is expected to change in the near future. Koehn and Hallam (1999) report
that a major driver for schools to add an FSA course is student demand. Interest in business
education in general and investment analysis in particular around the world will likely lead
to increased interest in FSA courses. Changes in information technologies and
globalisation of capital markets will likely affect the content of such courses.
We also deliberately decided not to enter the field of prescriptions because this study is
a description of what is and we think it would be pure speculation to predict changes in the
future. We also restricted the references to the literature available in the English language.
One other limitation of the topical part of our study could have been the influence of
cultural and language differences across countries in completing the questionnaire,
especially in Europe. We avoided this difficulty by checking systematically the
questionnaires with the corresponding syllabi, which allowed us to reach reasonable
homogeneity in the way the questionnaires were completed.
We explored the question of the separate FSA course with figures on the percentages
of institutions giving this course (see above). We also noticed that the link between an FSA
course and the first accounting course is important and could explain some of our results.
In this context, it should be interesting to address the issue of effectiveness. For example,
how does the specific coverage of FSA, or its particular positioning within the overall
curriculum, impact on pedagogic effectiveness?

20
Conclusion
With the exception of project presentations, we found that FSA courses in Europe show
greater similarity to U.S. undergraduate courses than U.S. graduate courses in the
proportion of time devoted to various topics. The absence of a distinction between
undergraduate and graduate education in most European countries may partly explain this
result. A second explanation is that the FSA course in both European and U.S.
undergraduate programs is often the initial exposure of students to FSA tools and concepts,
whereas the graduate FSA course in the U.S. is often a second exposure to financial
statement analysis.

21
References
Blake, J., and Amat., O. (1996) Interpreting Accounts. London: International ThomsonPublishing.
Haskins, M.E., Ferris, K.R. and Selling T.I. (1996) International Financial Reporting andAnalysis - A contextual Emphasis. Chicago: Richard D. Irwin.
Hasselback, J.R. (1998) Prentice Hall Accounting Faculty Directory. Upper Saddle River,NJ: Prentice Hall.
Koehn, J.L. and Hallam, J.J. (1999) A Course Survey of Financial Statement Analysis,Issues in Accounting Education 14(3) August, 413-421.
Laidler, J. and Donaghy, P. (1998) Understanding UK Annual Reports & Accounts.London: International Thomson Publishing.
Miller, G.J. and Van Daniker, R.P. (1999) Trends in government accounting educationapproaching the new Millennium, The Government Accountants Journal (Spring)48(1), 12-18.
Nobes, C. and Parker, R. (1998) Comparative International Accounting. London: PrenticeHall, 5th edition.
Palepu, K.G., Bernard, V.L., and Healy, P.M. (1996) Business Analysis & Valuation.Cincinnati, Ohio: South-Western Publishing Company.
Prober, L.M. and Sherman, W.R. (1988) Financial Statement Analysis in theUndergraduate Accounting Curriculum, The Accounting Educators’ Journal Fall,106-118.
Rees, B. (1995). Financial Analysis. London: Prentice Hall, 2nd edition (first edition 1990).
Samuels, J.M., Brayshaw, R.E. and Craner, J.M. (1995) Financial Statement Analysis inEurope. London: Chapman & Hall.
Stickney, C.P. (1990) Financial Statement Analysis A Strategic Perspective. San Diego,California: Harcourt Brace Jovanovich Publisher.
Stolowy, H. and Tenenhaus, M. (1998) International Accounting Education in WesternEurope, The European Accounting Review 7(2), 289-314.
White, G.I., Sondhi, A.C. and Fried. D. (1994) The Analysis and Use of FinancialStatements. New York: John Wiley & Sons.

22
Appendix 1Mean, Standard Deviation, and Median Proportions of Financial Statement Analysis Course
Devoted to Selected Topics
Mean Standard Deviation Median Total U.S. U.S. Total U.S. U.S. Total U.S. U.S. Overall
Europe U.S. Under Grad. Europe U.S. Under Grad. Europe U.S. Under Grad. MeanReview 9.29 8.02 11.06** 6.42** 9.97 7.35 8.60 6.10 5.50 5.00 10.00 5.00 8.49Basic Tools 26.96** 16.84** 20.26** 15.05** 16.15 9.03 9.62 8.23 23.08 15.00 20.00 15.00 20.60Environment 8.63 6.56 7.00 6.32 9.01 5.25 5.09 5.37 6.67 5.00 5.00 5.00 7.33Economics/ Strategy 3.42** 7.32** 6.77 7.61 4.62 6.12 6.09 6.17 0.00 5.00 5.00 5.00 5.87Domestic GAAP 9.86** 13.18** 11.61 14.00 13.51 13.21 12.01 13.83 5.30 10.00 10.00 10.00 11.95Non-domestic GAAP 3.35 3.28 1.77** 4.07** 5.25 4.85 4.33 4.95 0.00 1.00 0.00 5.00 3.30Cash Flows 5.87** 8.82** 9.42 8.51 6.58 4.79 5.28 4.53 4.80 10.00 10.00 10.00 7.73Applications: Competitor Analysis 2.03** 3.04** 3.58 2.76 5.13 3.88 3.84 3.91 0.00 1.50 3.00 0.00 2.67 M&A Analysis 2.92* 3.49* 2.52* 4.00* 4.75 3.83 3.14 4.08 0.00 3.00 1.00 5.00 3.28 Credit Analysis 4.74 4.09 3.76** 4.26** 6.27 4.98 7.07 3.48 3.00 4.50 1.00 5.00 4.33 Bankruptcy Prediction 5.19 2.86 1.66** 3.48** 6.48 3.39 2.58 3.61 3.34 2.00 0.00 3.00 3.72 Security Valuation 9.18 9.09 6.94* 10.23* 8.35 7.38 4.95 8.19 7.69 9.00 6.00 10.00 9.13 Forecasting 4.75** 6.87** 6.81 6.91 6.14 4.93 5.19 4.84 0.00 5.00 5.00 5.00 6.09Other Topics 1.18 .70 .39 .86 3.23 3.12 2.16 3.53 0.00 0.00 0.00 0.00 .88Project Presentations 2.63** 5.83** 6.45 5.51 5.21 8.38 10.87 6.80 0.00 0.00 0.00 0.00 4.65Number of Respondents 53 90 31 59
*Significant at .10.**Significant at .05.