by caroline w. m’mbui
TRANSCRIPT

EFFECT OF PERFORMANCE APPRAISAL ON EMPLOYEE JOB SATISFACTION IN KENYA REVENUE AUTHORITY
BYCAROLINE W. M’MBUI
UNIVERSITY OF NAiEQBl o w e r k a b e t e
A RESEARCH PROJECT SUBMITTED IN PARTIAL FULFILMENT OF THE REQUIREMENTS FOR THE DEGREE OF MASTER IN BUSINESS ADMINISTRATION (MBA), SCHOOL OF BUSINESS,
UNIVERSITY OF NAIROBI
NOVEMBER 2011

DECLARATION
This project is my original work and has not been submitted in this or any other university.
Signature: OMW Date: Kom
Caroline W. M’Mbui D61/70643/2008
This project has been submitted for examination with my approval as the university supervisor.
Signature:
Ms. Muindi Florence Kagendo School of Business, University of Nairobi.

ACKNOWLEDGEMENTFirst of all I would like to thank Almighty God who gave me the opportunity and strength to complete my higher education.
I also thank my supervisor Ms. Florence K. Muindi and moderator Mr. Maalu for their time, patience and guidance they gave me towards completion of this work. I also appreciate the work done by my lectures in MBA program and the entire university fraternity.
Special thanks to my brother Robinson Mbui, my boss Betty Wachira and my colleague Anne Loko for their support and encouragement.
.

DEDICATIONThis work is dedicated to my dear parents Mr and Mrs Mbui for taking me to school; to my husband Bernard Kago and my son Austin Muchiri for their patience and support.
iii

ABSTRACT
Effective performance system can lead an organization to take strides towards success but an ineffective performance appraisal system can seal the fate of the organization by creating chaos and confusion from the top management to bottom in the organization. Organizations have continued with the performance appraisal system without establishing whether it has an effect on the employee job satisfaction. The Kenya Revenue Authority conducts performance appraisal for its employees using the objective approach, which focuses on individual goals and objectives but does not assess the skills and abilities required of the employee to perform their duties. However, this is not an appropriate use of performance appraisal system, because the main outcome of this system is the determination of the appropriateness of the pay increase. The objective of this study was to establish the effect of performance appraisal system on employee job satisfaction at the Kenya Revenue Authority.
The research was conducted in the form of a case study which sought to find the effect of performance appraisal on employee job satisfaction in Kenya Revenue Authority. The study focused on KRA staff based in Nairobi. Both primary and secondary data was used. The data was collected from one hundred and twenty two employees who were selected through stratified sampling approach. The data was analyzed using both descriptive and inferential specifically the mean score, standard deviation, Pearson correlation, and chi square tests were used. The findings were presented using charts and tables.
The findings of the study show that performance appraisal helps KRA and individual employees meet set targets, however there is a lack of job satisfaction. The staff are not satisfied because the management does not use the performance appraisal to determine salary increments, rewards/penalties, promotions, fringe benefits, training needs and career growth opportunities. In conclusion the findings have indicated a positive and significant relationship between performance appraisals and job satisfaction.
IV

LIST OF ABBREVIATIONS
KRA-Kenya Revenue Authority PA- Performance Appraisal MBO-Management by Objective
HR-Human Resource
JSS-job satisfaction survey
JDI-job descriptive index
MSQ-Minnesota satisfaction questionnaire
CSD-Custom Service Department
DTD-LTO-Domestic Taxes Department- Large Taxpayers Office DTD-DR-Domestic Taxes Department- Domestic Revenue I&E-Investigation & Enforcement RTD-Road transport Department SSD-Support services Department
v

TABLE OF CONTENTS
Declaration......................................................................................................................................i
Acknowledgements........................................................................................................................ii
Dedication.................................................................................................................................... iii
Abstract.........................................................................................................................................iv
List of Abbreviations.....................................................................................................................v
Table of Contents..........................................................................................................................vi
List of Tables..................................................................................................................................x
List of Figures............................................................................................................................. xii
CHAPTER ONE: INTRODUCTION........................................................................................11.1 Background............................................................................................................................ 1
1.1.1 Performance Appraisal...................................................................................................3
1.1.2 Performance Appraisal System....................................................................................... 4
1.1.3 Job Satisfaction............................................................................................................... 5
1.2 Kenya Revenue Authority....................................................................................................... 71.3 Statement of the Problem......................................................................................................... 81.4 Objective of the Study......................................................................................................... 101.5 Significance of the Study...................................................................................................... 10
VI

C H A P T E R T W O : L IT E R A T U R E R E V IE W 12
2.1 Performance Appraisal......................................................................................................... 12
2.2 Methods of Performance appraisal........................................................................................ 14
2.2.1 Management by Objective.......................................................................................... 14
2.2.2 Graphic Rating Method.............................................................................................. 15
2.2.3 Trait Rating................................................................................................................. 15
2.3 Performance Appraisal System............................................................................................ 16
2.4 Job Satisfaction.................................................................................................................... 17
2.5 Models of Job Satisfaction................................................................................................... 18
2.6 Factors affecting Job Satisfaction........................................................................................... 21
2.7 Performance Appraisal and Job Satisfaction.......................................................................... 22
CHAPTER THREE: RESEARCH METHODOLOGY........................................................ 253.1 Research Design.....................................................................................................................25
3.2 Target Population...................................................................................................................25
3.3 Sample and Sampling Procedure............................................................................................ 25
3.4 Data Collection.......................................................................................................................26
3.5 Data analysis..........................................................................................................................27
CHAPTER FOUR: DATA ANALYSIS, FINDINGS AND INTERPRETATION... 284.1 Introduction............................................................................................................................28
4.2 Demographic Information............................... 284.2.1 Gender of respondents............................................................................................. 294.2.2 Age of Respondents......................................................................................................29
vii

4.2.3 Education level of Respondents....................................................................................30
4.2.4 Years worked...........................................................................................................314.2.5 Distribution of staff per Department............................................................................32
4.2.6 Distribution of respondents on Grade..........................................................................33
4.3 Performance appraisal............................................................................................................34
4.3.1 Awareness of Performance Appraisal System............................................................. 34
4.3.2 Respondent Involvement in Performance Appraisal Process...................................... 35
4.3.3 Awareness of Rewards/penalties for the various categories of performance rating......36
4.4 Performance Appraisal as a management tool........................................................................37
4.5 Respondents opinion on Job satisfaction................................................................................ 41
4.6 Correlation between Performance Appraisal and Job satisfaction.......................................... 44
4.7 Cross tabulation on performance appraisal and demographic factors........................... 444.7.1 Gender and performance appraisal............................................................................... 45
4.7.2 Age and performance appraisal...................................................................................46
4.7.3 Education level and performance appraisal...................................................................46
4.7.4 Years worked and performance appraisal.................................................................... 47
4.7.5 Department and performance appraisal.......................................................................48
4.7.6 Grade and performance appraisal................................................................................49
4.8 Cross Tabulations on Job Satisfaction and Demographic Variables...........................504.8.1 Gender and Job satisfaction.........................................................................................50
4.8.2 Age and Job satisfaction..............................................................................................51
4.8.3 Education level and Job satisfaction.......... ..................................................................52
4-8.4 Years worked and Job satisfaction...............................................................................52
4- 8.5 Department and Job satisfaction..................................................................................53
viii

4.8.6 Grade and Job satisfaction 54
CHAPTER FIVE: SUMMARY OF FINDINGS, CONCLUSION AND RECOMMENDATION............................................................................................................565.1 Introduction............................................................................................................................56
5.2 Summary and discussion of findings...................................................................................... 56
5.3 Conclusion..............................................................................................................................59
5.4 Recommendation....................................................................................................................60
REFERENCES....................................................................................................................... 61
APPENDICES
IX

LIST OF TABLESTable 3.3 Sample Size.............................................................................................................. 26
Table 4.2.2 Age of Respondents..............................................................................................38
Table 4.2.3 Education level of Respondents.......................................................................... 39
Table 4.2.4 Years worked........................................................................................................ 40
Table 4.2.5 Distribution of staff per Department................................................................... 41
Table 4.2.6 Distribution of respondents on Grade................................................................ 42
Table 4.3.2 Respondent Involvement in Performance Appraisal Process.......................... 44
Table 4.3.3 Awareness of Rewards/penalties for the various categories of performance rating... 45
Table 4.4 Performance Appraisal as a management tool.................................................... 47
Table 4.5 Respondents opinion on Job satisfaction.............................................................50
Table 4.6 Correlation between Performance Appraisal and Job satisfaction................... 52
Table 4.7.1 Gender and performance appraisal................................................................... 53
Table 4.7.2 Age and performance appraisal.........................................................................54
Table 4.7.3 Education level and performance appraisal..................................................... 55
Table 4.7.4 Years worked and performance appraisal.........................................................56
Table 4.7.5 Department and performance appraisal............................................................57
Table 4.7.6 Grade and performance appraisal......................................................................58
Table 4.8.1 Gender and Job satisfaction............................................................................... 59
Table 4.8.2 Age and Job satisfaction.....................................................................................59
Table 4.8.3 Education level and Job satisfaction................................................................. 60
Table 4.8.4 Years worked and Job satisfaction.................................................................... 61
x

Table 4.8.5 Department and Job satisfaction
Table 4.8.6 Grade and Job satisfaction
XI

LIST OF FIGURESFigure 4.2.1 Gender of respondents.......................................................................................37
Figure 4.3.1 Awareness of the Performance appraisal process..........................................43
XII

CHAPTER ONE: INTRODUCTION
1.1 Background
Employee performance appraisal, whereby a superior evaluates and judges the work performance of subordinates has become one of the most common management practices utilized in the organizations in Kenya. There are a number of factors which impact on employee performance and job satisfaction. These are the personality, values, attitudes, perceptions, ability and motivation of each individual employee. These factors are not interdependent in their effect on employee performance and satisfaction. There are a number of strategies which have been proposed involving performance appraisal, reward and recognition systems. The focus of most organizations in the world is to optimize employee performance and job satisfaction which if appropriately implemented will translate into improved organizational performance, Khan (2005).
— Performance appraisal remains a widespread and common practice in the world despite documented criticisms of the process by the practitioners and the researchers alike, Ingraham and Jacgcxobson (2001). Effective performance system can lead an organization to take strides towards success but an ineffective performance appraisal system can seal the fate of the organization by creating chaos and confusion from the top management to bottom in the organization, Khan (2005). Dimba and K'Obonyo (2009), they argue that appraisal systems are positively and significantly correlated with performance of the employees in the organization.

According to Robbin et. al (1998), employee performance is moderated by their personality, values, attitudes and ability of the individual which in combination affect their perceptions and motivation and ultimately influence employee performance. They further state that focusing on biographical characteristics such as age, gender, marital status and seniority does not provide accurate, reproducible evidence of links to improve performance and job satisfaction. They outline that it’s important for the employee’s to possess the requisite skills and abilities to perform their duties, but caution that even the most skilled may not perform or be satisfied with their job, thus they recommend a multifaceted approach to improve and maintain job satisfaction if long-term results are envisaged.
Performance appraisal system is one of the most widely researched areas in organization psychology, Murphy and Cleveland (1991), researchers have developed and practitioners have implemented various changes to the evaluation of the appraisal systems and procedures in an effort to improve on the accuracy and perceived fairness of the process, Banks and Murphy (1985). However, according to Church (1985), in spite of the attention and resources applied to the practice, dissatisfaction with the process still abounds and the systems are often viewed by employees as inaccurate and unfair.
Organizations have continued with the performance appraisal system without establishing whether it has an effect on the employee job satisfaction. The Kenya Revenue Authority conducts performance appraisal for its employees using the objective approach, which focuses on individual goals and objectives but does not assess the skills and abilities required of the employee to perform their duties. However, Fisher (1997) argues that this
2

is not an appropriate use of performance appraisal system, because the main outcome of this system is the determination of the appropriateness of the pay increase.
Considering the fact that literature on performance appraisal fails to agree on the effective way of employee job satisfaction and most of the studies have been conducted in developed countries, with limited research conducted in Kenya and given that the Kenya Revenue Authority has the responsibility of collecting all government revenues in the country there is need to establish the effect of performance appraisal system on employee job satisfaction at Kenya Revenue Authority. Therefore the question is, how effective is the current performance appraisal system on employee job satisfaction at the Kenya Revenue Authority?
1.1.1 Performance Appraisal
According to Terry and Franklin (2003), performance appraisal is the periodic evaluation of an employee's performance measured against the job's stated or presumed requirements. On the other hand Young (1996), defines performance appraisal as an evaluation and grading exercise undertaken by the organization on all its employees either periodically or annually, on the outcomes of performance based on the job content, job requirement and personal behavior in the position. One way to review the performance and the potential of staff is through a system of performance appraisal. It is important that members of the organization know exactly what is expected of them and the yardsticks by which their performance and results will be measured. Mullins (1996), substantiates the necessity of an effective appraisal scheme by saying that it can identify
3

an individual’s strengths and weaknesses and indicate how such strengths may best be utilized and weaknesses overcome.
Longenecker (1997), posits that most organization throughout the world use performance appraisal with varying degrees of success, as a tool to achieve a variety of human resource management objectives. Organizations use different tools and have a number of goals for performance appraisal often resulting in some confusion as to the true purpose of the performance appraisal systems. However at its core the performance appraisal process allows an organization to measure and evaluate an individual employee’s behavior and accomplishments over a specific period of time, Wiese and Buckley (1998). This view is consistent with Coutts and Schneider (2004) who argues that, performance appraisal is a vital component of a broader set of human resource practices, it is the mechanism for evaluating the extent to which each employee’s day to day performance is linked to the goals established by the organization.
1.1.2 Performance Appraisal systemYosuf (2003) defines Performance appraisal systems as the processes and procedures involved in implementing, managing, and communicating the events involved in performance appraisal. In many cases it is a formal process and is a part of the personnel management policy. Numerous organizations employ a formal or informal assessment system that measures employee performance and contribution, Carroll and Schneier, (1982). Coens and Jenkins (2000) suggest that performance appraisal is a mandated process in which, for a specified period of time, all or a group of an employee's work behaviors or traits are individually rated, judged, or described by a rater and the results
4

are kept by the organization. Karol (1996) considered performance appraisal to include a communication event scheduled between a manager and an employee expressly for the purposes of evaluating that employee's past job performance and discussing relevant areas for future job performance.Performance appraisal is a formal management system that provides for the evaluation of the quality of an individual's performance in an organization, Yusof (2003). Performance appraisal has the means to evaluate an employee's current and past performances relative to the employee’s performance standards. It is a process which involves creating work standards, evaluate employee’s actual performance to those work standards and giving feedback to employee’s so as to motivate him or her to improve the job performance or eliminate performance deficiency. In addition to that Terrence and Joyce (2004) stated that some potential aims of performance appraisal might include identifying behavior of job. Vicky (2002), Terrence and Joyce (2004), have outlined some of the appraisal methods which include ranking, trait scales, critical incident, narrative, criteria based, management by objectives and work planning.
1.1.3 Job SatisfactionLocke and Lathan (1976), defines job satisfaction as pleasurable or positive emotional state resulting from the appraisal of one’s job or job experience. Job satisfaction is a result of employee’s perception of how well their job provides those things that are viewed as important. Vroom (1964) defines job satisfaction as affective orientation on the part of individuals toward work roles they presently occupy. According to Mitchell and Lasan (1987) it is generally recognized in the organizational behavior field that job satisfaction is the most important and frequently studied attitude. While Luthan (1998)
5

posited that there are three important dimensions to job satisfaction. First it is an emotional response to a job situation, thus it cannot be seen but can only be inferred. Secondly it is determined by how well outcome meet or exceed expectations and thirdly job satisfaction represents several related attitudes which are most important characteristics of a job about which people have effective response.
Job satisfaction is so important in that its absence often leads to lethargy and reduced organizational commitment, Levinson (1997), Mason (1997). Alexander et. al (1997) and Jamal (1997) argues that lack of job satisfaction is a predictor of quitting a job. Sometimes workers may quit from public to private sector and vice versa. At other times the movement is from one profession to another that is considered a greener pasture. The later is common in countries grappling with dwindling economy and its concomitant such as poor conditions of service and late payment of salaries, Nwagwu (1997). In such countries people tend to migrate to better and consistently paying jobs Fafunwa (1971).
According to Adeyemo (2000) job satisfaction is controlled by factors external to the worker. From this point of view satisfaction on a job might be motivated by the nature of the job, its pervasive social climate and the extent to which workers peculiar needs are met. The working conditions that are similar to local and international standards, Osagbemi (2000), and the extent to which they resemble work conditions of other professions in the locality. Other inclusions are availability of power and status, pay satisfaction, promotion opportunities and task clarity, Bolarin (1993), Gemenxhenandez et. al (1997). However, MacDonald (1996), O'Toole (1980), argue in favour of the control of job satisfaction by factors intrinsic to the workers. Their arguments are based
6

on the idea that the workers deliberately decide to find satisfaction in their jobs and perceive them as worthwhile.
Mackenna (2005) argues that job satisfaction is associated with how well our personal expectations at work are in line with outcomes. The idea of organization as a social system requires that some benefits are received by its participants as well as its customers and clients. Therefore it helps to show the extent to which the organization meets the needs of the employees. According to Iancevich et. al (2005), the measures of satisfaction include employee attitudes, turnover, absenteeism and grievances.
1.2 Kenya Revenue AuthorityThe Kenya Revenue Authority (KRA) was established by an act of parliament; cap. 469 on 1st July, 1995 for the purpose of enhancing effective tax administration and sustainability in revenue collection. Since its inception, revenue has increased dramatically which has enabled the government to provide much needed services to its citizenry. Over 90 percent of the Kenyan budget funding comes from local taxes collected by Kenya Revenue Authority. The functions of the authority are to collect and account for all revenues and provide advice on matters relating to administration of tax in the country. The authority is headed by a commissioner general and it is divided into five departments. The members of staff are divided into management staff KRA 1-10 and the non management staff 11-16 with a workforce of about 4300 members of staff. The performance appraisal guide for the Kenya Revenue Authority views the staff performance appraisal as an important management tool which enables the employer andthne employee to establish the extent to which organizational and departmental goals are
7

achieved, staff performance meet set targets and goals and individual capacity, competencies learning and growth are developed. KRA carries out appraisals for the management staff KRA 1-10 based on the balanced score card and the non-management staff KRA 11-16. The appraisal period covers one year from July 1st to 30th June the following year, mid-year appraisal are done in order to accord the appraisee and the supervisor the opportunity to review the progress.
1.3 Statement of the problemEffective performance appraisal system can lead an organization to take strides towards success but an ineffective performance appraisal system can seal the fate of the organization by creating chaos and confusion from the top management to bottom in the organization, Khan (2005). An effective appraisal system can identify an individual’s strengths and weaknesses and indicate how such strengths may be utilized and weaknesses overcome to realize the organizations success, Mullin (1996). This ensures that the best employees are retained by the organization therefore leading to customer satisfaction and effective succession planning, Mellon (2006). There is a relationship between performance appraisal and job satisfaction because employees will be more satisfied when they feel the appraisal system is fair for the work they have done and the rewards are for genuine contributions and consistent with the reward policies of the organization, Ishigaki (2004). Effective appraisal system makes workers more satisfied and committed to their jobs, Luthans (1998).
According to Edwards and Wright (2001), there is a direct link between performance aPpraisal and firm performance but Katou and Budhwar (2006), argue that performance
8

appraisal system do not lead directly to business performance but influence employee motivation and its these employee outcomes which ultimately influence performance. Ramsay (1991), Savey and Syme (1996), Larking and Larking (1996), argue that good communication between managers and their immediate subordinates serves to enhance employee satisfaction, commitment and performance. Further Robbin et al (1998), find increased employee satisfaction when their immediate supervisor is perceived as understanding, friendly and to be interested in their employees’ opinion.
Most organizations have continued with the performance appraisal system without establishing whether it has an effect on the employee job satisfaction and Kenya Revenue Authority is not an exception. The Kenya Revenue Authority conducts performance appraisal for its employees using the objective approach, which focuses on individual goals and objectives but does not assess the skills and abilities required of the employee to perform their duties. However, Fisher (1997) argues that this is not an appropriate use of performance appraisal system, because the main outcome of this system is the determination of the appropriateness of the pay increase.
Awori (2007) carried out the study on performance appraisal practices in state corporations in Kenya; the findings show that State Corporations use performance appraisal to improve work performance and that the most commonly used performance appraisal is management by objectives as opposed to the balanced scorecard, self review, peer review and upward appraisal. Muhindi (2005), in his study on the impact of performance appraisal on Moi University employees, found out that there is little impact °1 performance appraisal on the employees of Moi University. Magutu (2009), in his
9

study on the effectiveness of performance appraisal system in Kenya a case of Kabarak University, established that performance appraisal system is the only tangible metric way by which an organization can know the level of performance of its diverse employees.
Considering the fact that literature on performance appraisal fails to agree on the effective way of employee job satisfaction and given that the Kenya Revenue Authority has the responsibility of collecting all government revenues in the country there is need to establish the effect of performance appraisal system on employee job satisfaction at Kenya Revenue Authority. Therefore the question is, how effective is the performance appraisal system on employee job satisfaction at the Kenya Revenue Authority? The purpose of this study was to determine if the appraisal system at the Kenya Revenue Authority has an effect on employee job satisfaction.
1.4 Objective of the studyThe objective of the study was to establish the effect of performance appraisal system on employee job satisfaction at the Kenya Revenue Authority.
1.5 Significance of the studyThe research emanated from the fact that, Kenya Revenue Authority has been conducting performance appraisal on its employees for many years. With this continued appraisal there is need to establish if the performance appraisal system used has an effect on the employee job satisfaction. This study therefore is important since if the current appraisal system is found to be inadequate, then the policy makers will be advised to shift to a m°re appropriate method that can influence employee performance and job satisfaction. This study will also contribute to the knowledge base on human resource management in
10

the areas of Performance Appraisal and job satisfaction. In addition, the study will also benefit other organizations (both Public and Private) in coming up with an effective Performance Appraisal System. The citizens of Kenya who may be interested in the area of Performance Appraisal will also benefit from the study. Finally, the study will help other researchers who might want to undertake research in the area of staff appraisal, performance and job satisfaction.
11

CHAPTER TWO: LITERATURE REVIEW
2.1 Performance AppraisalPerformance appraisal is a process by which a superior evaluates and judges the work performance of a subordinate, Yosuf (2003). Performance appraisal systems include the processes and procedures involved in implementing, managing, and communicating the events involved in performance appraisal. In many cases it is a formal process and is a part of the personnel management policy. Numerous organizations employ a formal or informal assessment system that measures employee performance and contribution (Carroll & Schneier, 1982). Coens and Jenkins (2000) suggest that performance appraisal is a mandated process in which, for a specified period of time, all or a group of an employee's work behaviors or traits are individually rated, judged, or described by a rater and the results are kept by the organization. Karol (1996) considered performance appraisal to include a communication event scheduled between a manager and an employee expressly for the purposes of evaluating that employee's past job performance and discussing relevant areas for future job performance.
DeNisi, Cafferty, and Meglino (1984) indicated that performance appraisal is an exercise in social perception and cognition embedded in an organizational context requiring both formal and implicit judgment. A variety of components may be included in the Performance appraisal process. Landy and Farr (1980) presented a model of performance Ppraisal that included 13 interacting factors: position characteristics, organization
characteristics, the purpose of the rating, the rating process, scale development, the rating12

instrument, rater and rate characteristics, the observation and storage of performance data, the retrieval and judgment of that performance, analysis of this information, performance description and in the end, personnel action.
Mohrman et. al (1989), there are four activities in the performance appraisal cycle in organizations; defining what performance is or should be, measuring and evaluating performance, feeding information about that performance back to the individual and providing information to other organizational systems that use it. Latham and Wexley (1981) listed similar requisite components but added a review of legal requirements, development of an appraisal instrument, selection and training of observers, and praise or reward for performance. Regardless of the definition or the specific components included, performance appraisal in most organizations is formal, structured, and required. The process is generally defined to include an interview between the rater and the ratee as well as performance documentation required by the formal evaluation system. One descriptor left out of most definitions is that performance appraisal is often dreaded by participants. Folger and Lewis (1993) suggest that performance appraisals typically engender the same degree of enthusiasm as paying taxes.
Khan (2005), argues that performance appraisal is significant in helping management to carry out administrative decisions regarding promotion and pay increase. However according to Fisher et. al (1997), performance appraisal system should be used as an employee development tool to identify areas of skill and ability deficiency to improve
13

focus for training and development, because the possession of appropriate skills and abilities are key elements in improving individual performance.
2.2 Methods of Performance Appraisal
According to Daley (1992) there are various performance appraisal types used in different organisations. These include the objective technique, graphic rating scale, trait rating scale showing how they are applied in different organisations.
2.2.1 Management by Objectives techniqueDrucker (1954), defines objective technique also referred to as management by objectives (MBO) as a process whereby the employees and the superiors come together to identify common goals, the employees set their goals to be achieved, the standards to be taken as the criteria for measurement of their performance and contribution and deciding the course of action to be followed. The essence of MBO is participative goal setting, choosing course of actions and decision making. An important part of the MBO is the measurement and the comparison of the employee’s actual performance with the standards set. Ideally, when employees themselves have been involved with the goal setting and the choosing the course of action to be followed by them, they are more likely to fulfil their responsibilities. However, Oberg (1972) posits that even though the employees are consulted, in many cases the management ends up imposing its standards and objectives, which some cases demoralizes the employees. Daley (1992), argues that the advantages of the objective technique can be nullified through misapplied or ^appropriate appraisal interview. It can also lead to an entire organizations credibility being damaged along with having adverse consequences for productivity.
14

2.2.2 Graphic rating scaleOberg (1972) states that this technique has two variations, first variation of this method involves a manager writing an essay about what they consider to be an overall assessment of an employee's performance. It is important to note that nothing obligates the manager to justify anything within their assessment. The second variation has the manager rating the employee using a list of terms such as "above average; fair; or poor." He further cautions the appraisal content is not necessarily job related. Managers subjectively choose their evaluation criteria. The subjectivity of this method denies employees reliable feedback about their performance. The lack of objectivity and assessment of relevant performance criteria may hinder an employee's ability to improve job performance, and further hinders the organization's potential to optimize employee capacity, consequently impeding overall organizational improvement. Phillip (1990) points out that an absence of objective measures by which to determine performance levels is an invitation to tension-ridden employee-employer relations, because employees and managers often hold diametric views about which performance inputs/ outputs ought to be evaluated and what evaluative judgments ought to be made about those performance inputs/ outputs.
2.2.3 Trait Rating
Oberg (1972) argues that at the center of this method is a list of personality/ disposition traits to which the appraiser must assign a numerical rating or a descriptive rating of adjectives. Traits may include items such as cooperation, motivation, flexibility, and attitude. This approach assumes that one can define and rate traits objectively, but in practice, traits are too broadly defined and so are the criteria for evaluating each trait.
15

Because the trait approach is unreliable and invalid, it is highly questionable as to whether it is able to offer any useful information about employee performance and development. Furthermore, because of its reliance on erroneous assumptions, the trait method is likely to be de-motivating to employees and create tension between employees and managers.
2.3 Performance Appraisal System
According to Grote (1996) Performance appraisal is not an event, it is a process. These events happen in a predictable and sequential fashion, with one completed before the next begins. Yee and Chen (2010) defines the process of Performance appraisal as the setting up of standards which will be used as the base to compare the actual performance of the employee’s. These steps requires setting up the criteria to judge the performance of the employee’s as successful or unsuccessful and the degrees of their contribution to the organizational goals and objectives, these standards should be clear, easily understandable and in measurable terms. Performance appraisal is used by organizations to reward and develop the human resource of the organization so that they can run smoothly.
There is a significant amount of agreement that there is an ideal cycle that if followed will produce superior results. An organization’s overall performance management system begins with establishing performance standards which is setting up of the standards which will be used as the base to compare the actual performance, then communication ° f ^ e set standards by management to all the employees, then measuring of the actual Performance that is the work done by the employees during the specified period of time.
16

It is the most difficult part of the performance appraisal process; it is a continuous process which involves monitoring the performance throughout the year. Followed by comparing the actual performance with the desired performance, the actual performance is compared with the desired or the standard performance. The comparison tells the deviations in the performance of the employees from the standards set which in turn is followed by discussing the results and finally decision making is the last step of the process. Decisions are taken either to improve the performance of the employees, take the required corrective actions, or the related HR decisions like rewards, promotions, demotions, transfers etc. (www.appraisals.naukrihub.com)
2.4 Job SatisfactionA review of the literature indicates that there is no general agreement on the definition or the determinants of job satisfaction. Job satisfaction has been studied as the outcome of some factors or as the cause of some consequences, such as job performance, absenteeism, labour market mobility, and general life satisfaction (Staples & Higgins, 1998).
Vroom (1964) defines job satisfaction as affective orientation on the part of individuals toward work roles they presently occupy. Job satisfaction is a result of employee’s perception of how well their job provides those things that are viewed as important. Locke and Lathan (1976), defines job satisfaction as pleasurable or positive emotional state resulting from the appraisal of one’s job or job experience. Daniel et al (1997) !dentify five effective factors of job satisfaction which includes anxiety, comfort,
17

depression, pleasure, positive effect, kindness and anger, which they claim can capture better the subtleties of emotional experience at work.
Locke's (1976) theory is the most famous job satisfaction model. The main premise in this theory is that satisfaction is determined by a discrepancy between what one wants in a job. Further the theory states that how much one values a given facet moderates how satisfied/dissatisfied one becomes when expectations are/aren’t met. When a person values a particular facet of a job, his satisfaction is more greatly impacted both positively when expectations are met compared to one who does not value that facet.
According to Jackson (2007), it is a general theory that suggests that people have innate dispositions that cause them to have tendencies toward a certain level of satisfaction, regardless of one’s job. The approach has been a better explanation of job satisfaction in light of the evidence that job satisfaction tends to be stable over time and across careers and jobs. Judge (1998) argued that there are four core self evaluations that determine one’s disposition towards job satisfaction and these are self-esteem, general self efficacy, locus of control and neuroticism. This model states that higher levels of self esteem and general self efficacy lead to higher work satisfaction and having and internal locus of control leads to higher job satisfaction and finally lower levels of neuroticism leads to job satisfaction.
2.5 Models of job satisfactionVarious models have been constructed to explain what makes people satisfied with their job. Some studies view it as a cause of some consequences for instance studies done by
18

Podsakoff and Williams (1986), and Freeman (1978), whereas other theories view satisfaction as an outcome of some factors, (Locke, 1976, p. 1302).
The Affect Theory Locke (1976) is arguably the most famous job satisfaction model. The main premise of this theory is that satisfaction is determined by a discrepancy between what one wants in a job and what one has in a job. Further, the theory states that how much one values a given facet of work (e.g. the degree of autonomy in a position) moderates how satisfied/dissatisfied one becomes when expectations are/aren’t met. When a person values a particular facet of a job, his satisfaction is more greatly impacted both positively (when expectations are met) and negatively (when expectations are not met), compared to one who doesn’t value that facet.
Another well-known job satisfaction theory is the Dispositional Theory it is a very general theory that suggests that people have innate dispositions that cause them to have tendencies toward a certain level of satisfaction, regardless of one’s job. This approach became a notable explanation of job satisfaction in light of evidence that job satisfaction tends to be stable over time and across careers and jobs. A significant model that narrowed the scope of the Dispositional Theory was the Core Self-evaluations Model, proposed by Judge in 1998. Judge argued that there are four Core Self-evaluations that determine one's disposition towards job satisfaction: self-esteem, general self-efficacy, locus of control, and neuroticism. This model states that higher levels of self-esteem (the value one places on his self) and general self-efficacy (the belief in one’s own competence) lead to higher work satisfaction. Having an internal locus of control; (believing one has control over her\his own life, as opposed to outside forces having
19

control) leads to higher job satisfaction. Finally, lower levels of neuroticism lead to higher job satisfaction
In addition Herzberg’s Two-factor theory also attempts to explain satisfaction and motivation in the workplace. This theory states that satisfaction and dissatisfaction are driven by different factors - motivation and hygiene factors, respectively. Motivating factors are those aspects of the job that make people want to perform, and provide people with satisfaction. These motivating factors are considered to be intrinsic to the job, or the work carried out. Motivating factors include aspects of the working environment such as pay, company policies, supervisory practices, and other working conditions.
While Hertzberg's model has stimulated much research, researchers have been unable to reliably empirically prove the model, with Hackman & Oldham suggesting that Hertzberg's original formulation of the model may have been a methodological artifact. Furthermore, the theory does not consider individual differences, conversely predicting all employees will react in an identical manner to changes in motivating/hygiene factors. Finally, the model has been criticized in that it does not specify how motivating/hygiene factors are to be measured.
Finally, Hackman & Oldham proposed the Job Characteristics Model, which is widely used as a framework to study how particular job characteristics impact on job outcomes, including job satisfaction. The model states that there are five core job characteristics (skill variety, task identity, task significance, autonomy, and feedback) which impact three critical psychological states (experienced meaningfulness, experienced responsibility for outcomes, and knowledge of the actual results), in turn influencing
20

work outcomes (job satisfaction, absenteeism, work motivation, etc.). The five core job characteristics can be combined to form a motivating potential score for a job, which can be used as an index of how likely a job is to affect an employee's attitudes and behaviors. A meta-analysis of studies that assess the framework of the model provides some support for the validity of the Job Characteristic Model.
2.6 Factors affecting Job Satisfaction
Employee job satisfaction is dependent on various factors; according to the Affect theory, job satisfaction is determined by a discrepancy between what one wants in a job and what one has in a job. Satisfaction on the performance appraisal depends on the supervisor’s perception on the performance appraisal and the accuracy with which a supervisor rates the employee’s performance. On the other hand, the core self-evaluation model argues that there are four Core Self-evaluations that determine one’s disposition towards job satisfaction: self-esteem, general self-efficacy, locus of control, and neuroticism. In addition, Hertzberg’s theory shows that job satisfaction is caused, on the one hand, by a set of factors related to the work itself, such as nature of job, achievement in the work, possibilities of personal growth and recognition, and promotion opportunities, on the other hand, job dissatisfaction is a result of —conditions that surround the doing of the job such as (physical) working conditions, salary, company policies, job security, quality of supervision, and relations with others.
Researchers have also come up with various models to assess job satisfaction; these include the job satisfaction survey (JSS), Spector (1985), the job descriptive index (JDI),Smith et al (1969), the Minnesota satisfaction questionnaire(MSQ), Weiss et al (1967)
21

among others. The JSS assesses nine facets of job satisfaction as well as overall satisfaction namely; pay promotion, supervision, fringe benefits, contingent rewards, operating conditions, co-workers, nature of work and communication. The JDI on the other hand assesses five facets which are work, pay, promotion, supervision, and coworkers. Whereas the MSQ assesses 20 facets namely; activity, independence, variety, social status, supervision, moral values, security, social service, authority, ability utilization, company policies and practices, compensation, advancement, responsibility, creativity, working conditions, coworkers, recognition and achievement.
2.7 Performance Appraisal and job satisfactionSavey and Syme (1996), while carrying out a study on hospital pharmacists found that
satisfaction with issues such as appropriate evaluation systems, rather than with pay or job security correlated best with increased organization commitment. According to Edwards and Wright (2001), there is a direct link between performance appraisal and firm performance but Katou and Budhwar (2006), argue that performance appraisal system do not lead directly to business performance but influence employee motivation and its these employee outcomes which ultimately influence performance. Ramsay (1991), Savey and Syme (1996), Larking and Larking (1996), argue that good communication between managers and their immediate subordinates serves to enhance employee satisfaction, commitment and performance. Further Robbin et al (1998), find increased employee satisfaction when their immediate supervisor is perceived as understanding, friendly and to be interested in their employees opinion.
2 2

Robbin et. al (1998), argue that employee performance is moderated by their personality, values, attitudes and ability of the individual which in combination affect their perceptions and motivation and ultimately influence employee performance. According to Khan (2005), performance appraisal is significant in helping management to carry out administrative decisions regarding promotion and pay increase. However according to Fisher et. al (1997), performance appraisal system should be used as an employee development tool to identify areas of skill and ability deficiency to improve focus for training and development, because the possession of appropriate skills and abilities are key elements in improving individual performance. Savey and Syme (1996), while carrying out a study on hospital pharmacists found that satisfaction with issues such as appropriate evaluation systems, rather than with pay or job security correlated best with increased organization commitment.
In a study on Effectiveness of Training on Staff performance (2007), Maragwa identified Performance appraisal as one of the tools used to identify training and development needs. The aim of Performance appraisal is to improve individual performance. Other benefits are improving motivation and morale; clarifying expectations and reduction of ambiguity in performance; determining rewards; identifying training and developmental capabilities; improving communication; selecting employees for promotion; managing careers; counseling; discipline; planning remedial action; and setting goals and targets.
Muthuo (2010) noted that performance appraisal has a positive impact on their Performance. Performance appraisal gives employees job satisfaction and effectiveness •The results indicated that majority of the officers reported that it helps the ministry to
23

achieve its targets, performance appraisal leads to employee effectiveness however its prone to failure when there is lack of commitment from the top management. Both the manager and the supervisor should provide feedback for the process to be effective. However her findings revealed that performance appraisal alone should not be used for assessment because it does not address some issues like motivation and the work environment.
In her study on Performance Improvement in the Civil Service (2004), Marangu noted that performance management is a formal process through which employees and their supervisors/managers world over jointly define goals, major areas of responsibilities in terms of the expected results and the use of these measures as guides for future performance and subsequent review of performance. Performance appraisal may therefore be said to be a continuous process which entails setting direction and standards, monitoring and measuring of performance. Marangu noted that motivation is an aspect of management that requires human behaviour to be manipulated in order to harmonize an individual employee’s goals to those of the organization.
Therefore well motivated employees are those who work along clearly defined goals and who take action which will result in these goals being met. Employees who manage to motivate themselves seek, find and carry out work that satisfies their needs. However majority of employees need to be motivated by the management through pay, praise, promotion, transfer, training and development in order to improve their performance.
24

CHAPTER THREE: RESEARCH METHODOLOGY
3.1 Research designThe research was conducted in the form of a case study. The researcher settled on a case study since it provides in-depth investigation of the phenomena to facilitate a better understanding and interpretation of the research objective.
3.2 Target populationThe study focused on KRA staff in Nairobi as the population of the study. The authority has approximately 4300 employees. The total number of employees in Nairobi is 1214 distributed in six departments namely Custom Service Department (CSD) with 206 employees, Domestic Taxes Department- Large Taxpayers Office (DTD-LTO) with 196, Domestic Taxes Department- Domestic Revenue (DTD-DR) with 302, Investigation & Enforcement (I&E) with 83, Road transport Department (RTD) with 39 and Support services Department (SSD) with 388 employees.
3.3 Sample and Sampling procedureA sample is a subset of the population and sampling is the process of collecting information from a sample. The researcher used stratified sampling method where the sample frame was divided into strata and a sample was taken from each stratum. This method always achieves greater precision and ensures better coverage of the population. The sample size was proportionately allocated according to the size of the stratum. The dements selected to represent each sub-group was based on its size and the nature of itscharacteristics
25
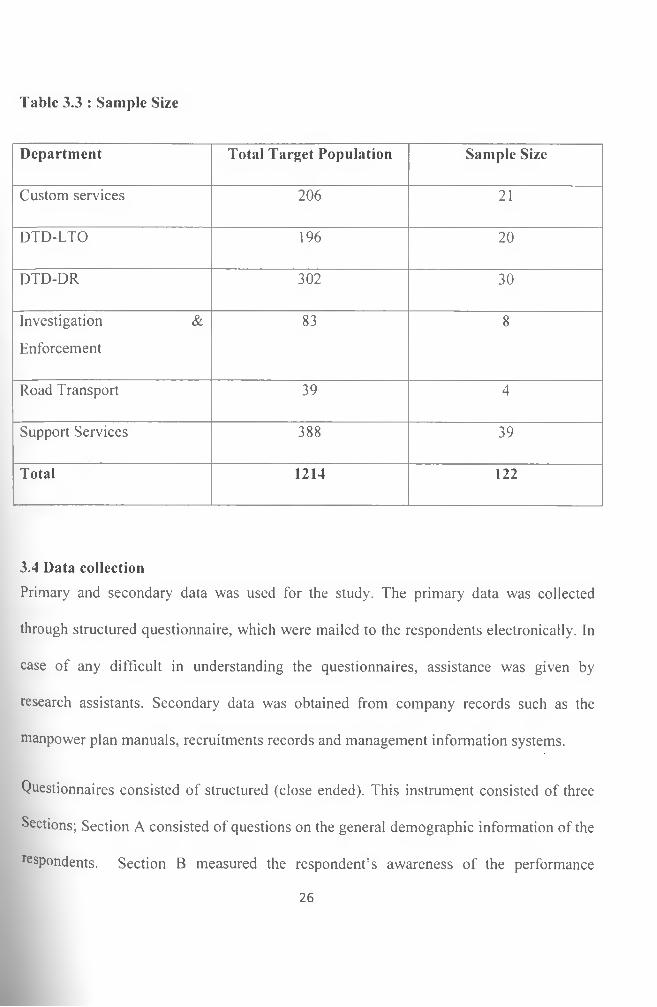
Table 3.3 : Sample Size
Department Total Target Population Sample Size
Custom services 206 21
DTD-LTO 196 20
DTD-DR 302 30
Investigation & Enforcement
83 8
Road Transport 39 4
Support Services 388 39
Total 1214 122
3.4 Data collectionPrimary and secondary data was used for the study. The primary data was collected through structured questionnaire, which were mailed to the respondents electronically. In case of any difficult in understanding the questionnaires, assistance was given by research assistants. Secondary data was obtained from company records such as the manpower plan manuals, recruitments records and management information systems.
Questionnaires consisted of structured (close ended). This instrument consisted of three Sections; Section A consisted of questions on the general demographic information of the respondents. Section B measured the respondent’s awareness of the performance
26
appraisal process and the main objectives of the Performance Appraisal process in KRA. It was adopted from KRA management policy and it covers six areas. These include: setting of targets, communicating targets, measuring actual performance, comparing actual performance with set standards, decision making and feedback on performance. The study adopted a 5 point Likert scale the values were ranging from 1-5. Each respondent will be asked to rate each item on the response scale. 1= Strongly Disagree, 2 = Disagree, 3 = Undecided, 4= Agree, 5= Strongly Agree.
Section C of the questionnaire will measure the respondent’s job satisfaction. This section will be constructed based on the Vroonr s Expectancy theory. Reference will also made to a similar research on performance appraisal by Maragwa. . This scale will consist of Likert values ranging from 1-5. Each respondent will be asked to rate each item on the scale. (1 = Extremely Dissatisfied, 2 = Dissatisfied, 3 = Neutral, 4 =Satisfied, 5 = Extremely Satisfied,)
3.5 Data AnalysisData will be analyzed using both descriptive and inferential statistics. The tools to be used will consist of the mean scores, standard deviation and Pearson correlation. The data will be interpreted and inferences made and presented descriptively using charts, tables, percentages in reference to a number of selected variables such as age, years of experience and level of education. I will then apply the Pearson’s Product Moment (Orodho, 2005) to calculate the co-efficient of correlation between the responses of the
and job satisfaction.
27

CHAPTER FOUR: DATA ANALYSIS, FINDINGS ANDINTERPRETATION
4.1 Introduction
This chapter presents the results of the research. Both qualitative and quantitative statistical methods were used in analyzing the data. In particular, frequencies, means, standard deviations, chi-square tests and Pearson correlation were used to test the significance of the respondents' responses. This analysis is presented in three main sections. Section 1 covers the respondents" background information. Section II gives a descriptive statistical analysis of the obtained data with regard to the research variables. Section III covers the discussion and analysis of the research objectives. In addition cross tabulations on respondent’s gender, age, education level and years worked and grade are presented.
The objective of this study was to establish the effect of performance appraisal system on employee job satisfaction at the Kenya Revenue Authority.
Three hundred questionnaires were distributed of which one hundred and twenty two were filled and collected as described giving an overall response rate of 100%.
4.2 Demographic InformationThis section of the questionnaire sought to collect information on the respondents’ gender, age, level of education, length of service, department and grade. This was analyzed and illustrated below.
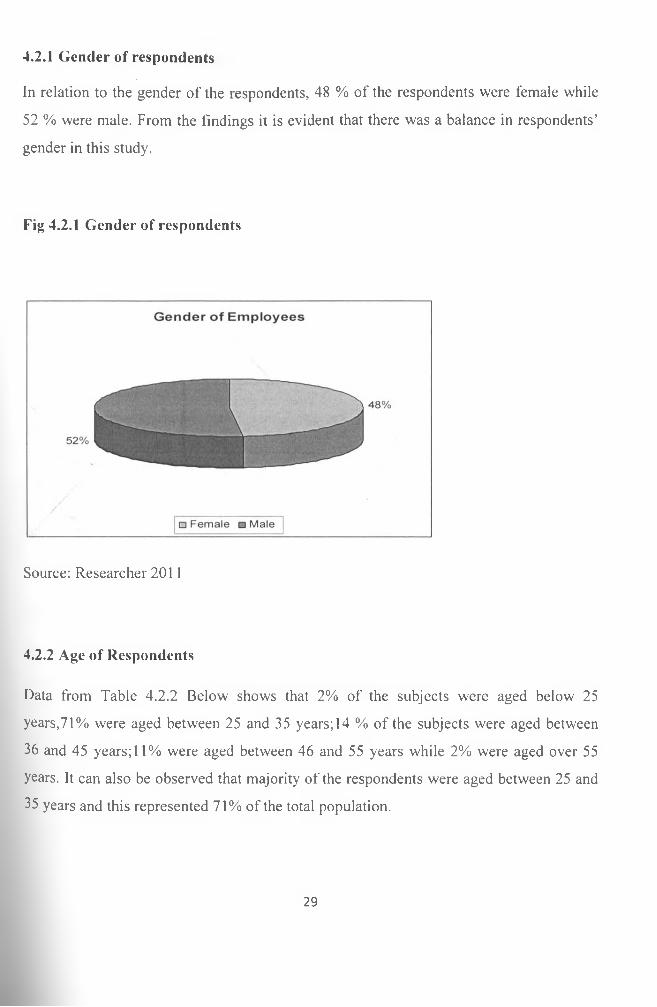
In relation to the gender of the respondents, 48 % of the respondents were female while 52 % were male. From the findings it is evident that there was a balance in respondents’ gender in this study.
4.2.1 Gender of respondents
Fig 4.2.1 Gender of respondents
Source: Researcher 2011
4.2.2 Age of Respondents
Data from Table 4.2.2 Below shows that 2% of the subjects were aged below 25 years,71% were aged between 25 and 35 years; 14 % of the subjects were aged between 36 and 45 years; 11% were aged between 46 and 55 years while 2% were aged over 55 years. It can also be observed that majority of the respondents were aged between 25 and 35 years and this represented 71% of the total population.
29

Table 4.2.2 Age of RespondentsAge Frequency Percent
Below 25 years 3 2
25-35 years 87 71
36-45 years 17 14
46-55 years 13 11
Over 55 years 2 2
Total 122 100
Source: Researcher 2011
This shows that majority of the staff are relatively young and in their most productive phase and hence the Authority should ensure that they are highly satisfied in their job to achieve high tax collection rates.
4.2.3 Education level of Respondents
In relation to their different levels of education, table 4. Revealed that 19.7 % of the subjects were holders of the diploma level of education, 50.8 % had attained the bachelors degree 29.5% had attained the masters level of education. Half of the employees had attained the bachelor's degree and this represented 50.8 % of the total population.

Table 4.2.3 Education level of RespondentsLevel of Education Frequency Percent
Diploma 24 19.7
Degree 62 50.8
Masters Degree 36 29.5
Total 122 100.0
Source: Researcher 2011
This shows that KRA staff are of high level of education and can be explained by the fact that for the last ten years or so, KRA has been recruiting persons with at least a university degree as the minimum education level into the graduate trainee program.
4.2.4 Years worked
Table 4.2.4 depicts the number of years the subject’s had been in employment. Twenty two (18%) reported they had been working in KRA for a period of less than five years’ 53% reported that they had been in employment for between 5-10 years, 15% said they had been in employment for a period of between 11-15 years and another 10% reported that they had been in employment for between 16- 20 years, while 4 % indicated they had been in employment for a period of more than 20 years. Trends observed indicated that from the sample of 122 respondents, majority (53%) of the employees had been working in KRA for duration of between 5-10 years.

Table 4.2.4 Years workedYears worked Frequency Percent
Less than five years 22 18
5-10 years 65 53
11-15 years 18 15
16-20 years 12 10
Above 20 years 5 4
Total 122 100
Source: Researcher 2011
This can be attributed to the fact that majority of the staff fall in grade 8-10 which is the entry level for the graduate trainees, thus this shows that they have been with the Authority for a relatively short time since completion of their two year graduate training program, they have also gathered a lot of skills in revenue collection
4.2.5 Distribution of staff per Department
In relation to the department, 17% of the respondents came from the Customs Services Department, 25% were from the Domestic Taxes (DR) Department, 16% were from the Domestic Taxes (LTO) Department, 32% came from Support Services Department and 3% reported that they were in the Road Transport Department while 7% said they were in the Investigation and Enforcement Department.
32

Table 4.2.5 Distribution of staff per DepartmentDepartment Frequency Percent
Customs Services 21 17
Domestic Taxes - DR 30 25
Domestic Taxes - LTO 20 16
Support Services 39 32
Road Transport 4 3
Investigation and Enforcement 8 7
Total 122 100
Source: Researcher 2011
From this study majority of the staff are in support services which is a non revenue department, this can be explained by the fact that support services department comprises of several functions such as Human resource, finance, marketing, projects, information technology and so on. However, the revenue departments cumulatively carry the bulk of the staff.
4.2.6 Distribution of respondents on Grade
Table 4.2.6 displays the responses on data obtained on the employee grades, it is evident that majority(40%) of the respondents were in grade 10. (8%) were in grade 4-5, 18% reported that they were in grade 6-7 while 34% indicated that they were in grade 8-9.
33

Table 4.2.6 Distribution of respondents on GradeGrade Frequency Percent
4-5 10 8
6-7 22 18
8-9 42 34
10 48 40
Total 122 100
Source: Researcher 2011
Grade 10 had the highest number of respondents because this grade absorbs all the graduate trainees after training school. Majority of the staff are in the lower management level and are therefore involved in the day to day controlling and direction of revenue collection functions.
4.3 Performance appraisal
This section of the questionnaire sought to measure staff awareness and involvement in the performance appraisal process.
4.3.1 Awareness of Performance Appraisal System
Questionnaires were sent to the respondents to gather data on the KRA performance appraisal system. When asked to state if they were aware of the KRA performance aPpraisal system, it was noted that 97.5% of the respondents said yes while only 2.5% Sported that they were not aware of the KRA performance appraisal system.
34

Fig 4.3.1 Awareness of the Performance appraisal process
A w a r e n e s s o f t h e P e r f o r m a n c e a p p r a i s a l p r o c e s s
2%
98%
□ Yes □ No
Source: Researcher 2011
This implies that majority of the respondents are aware of the K.RA performance appraisal system since they are all appraised twice in a year.
4.3.2 Respondent Involvement in Performance Appraisal Process
The respondents were also asked to state the stage at which they are involved in the performance appraisal process. It was observed that 24% reported that they are involved in setting of targets, 16% indicated communicating targets, 76% said they were involved in measuring actual performance, 39% listed comparing actual performance with set standards, 28% were involved in providing feedback on performance while 8% indicated that they were involved in decision making. A number of staff are involved in several stages of the performance appraisal; with the senior management respondents reporting that they were involved in all the stages of performance appraisal. Trends observed revealed that majority (76%) of the respondents are involved in measuring actual performance through making of monthly reports on performance.
35

Table 4.3.2 Respondent Involvement in Performance Appraisal ProcessStage of Performance Appraisal Frequency Percent
Setting of targets 29 24
Communicating targets (expectation and standards)
19 16
Measuring actual performance 93 76
Comparing actual performance with set standards
48 39
Providing feedback on performance 34 28
Decision making ( taking corrective measures)
10 8
Source: Researcher 2011/
From the findings it is evident that senior management is involved in all the stages of performance appraisal. It emerged that majority of the employees were involved only in the measuring of actual performance. However the findings indicate that only 39% of the staff were involved in comparing actual performance with set standards which is a crucial stage of performance appraisal and it should involve all parties.
4.3.3 Awareness of Rewards/penalties for the various categories of performance rating
In relation to the rewards/penalties for the various categories of performance rating in KRA, the results indicate that majority (87.7%) of the respondents are aware of the rewards/penalties for the various categories of performance rating. However it was noted
36

that 4.9% reported that they were not aware while 7.4% were not sure of rewards/penalties for the various categories of performance rating in KRA (i.e. Commendation, salary increment, bonus, caution and termination of service).
Table 4.3.3 Awareness of Rewards/penalties for the various categories of performance rating
Response Frequency Percent
Yes 107 87.7
No 6 4.9
Not sure 9 7.4
Total 122 100.0
Source: Researcher 2011
This implies that majority of the employees are aware of the rewards/penalties for the various categories of performance rating. Awareness of the said rewards/penalties may play a role in boosting staff satisfaction; however failure to honor the stated rewards/penalties may have a negative effect on satisfaction.
4 .4 P e r fo r m a n c e A p p r a is a l a s a m a n a g e m e n t to o l
A five point Likert Scale was used to rate the respondents’ opinion on whether performance appraisal in KRA helps meet organizational and individual objectives, whether there is sufficient training on performance appraisal as a management tool in addition the level of professionalism supervisors keep while appraising staff and finally whether staff receive feedback on how they were appraised. Eleven items comprised the

performance appraisal process from which a total score was obtained. The range was strongly agree (5) to strongly disagree (1). The scores of strongly disagree had been taken to present a variable which had a mean of 0 to 1.5 on the Likert scale. The score of disagree had been taken to represent a variable which had a mean of 1.6 to 2.5 on the Likert scale. The score of undecided had been taken to represent a variable which had a mean of 2.6 to 3.5 on the Likert scale. The score of agree had been taken to represent a variable which had a mean of 3.6 to 4.5 on the Likert scale. The score of strongly agree had been taken to represent a variable which had a mean of 4.6 and above on the Likert scale.
38

Table 4.4 Performance Appraisal as a management toolITEM
MeanStd.
Deviation
1 Performance appraisal ensures that KRA goals are achieved 3.6393 .90056
2 Performance appraisal helps individual staff meet set targets and goals 3.8197 .72746
3 Performance appraisal identifies skills, gaps and developmental needs 3.5000 .88374
4 Performance appraisal assists staff to know their level of performance 3.7459 .84854
5 Performance appraisal is used in KRA to determine rewards/penalties for performance 2.5082 1.00615
6/ '
HR offers sufficient training on Performance appraisal system in KRA 2.6230 .92108
7 Actual performance is rated based on set targets in KRA 3.5492 .98838
8 The Performance appraisal method used in KRA is professional, objective and fair 3.1967 1.08055
9 The supervisor rates my performance accurately 3.6721 .94862
10 The frequency with which the Performance appraisal is conducted in KRA is sufficient 3.5984 .93296
11 Timely feedback is given on Performance appraisal in KRA 2.5984 1.14025
Source: Researcher 2011
39

The finding in table 4.4 shows that the staff agrees to the following aspects; performance appraisal helps individual staff meet set targets and goals, (mean of 3.8197), secondly that performance appraisal assists staff to know their level of performance (mean of 3.745), that their supervisor’s rates their performance accurately (mean of 3.672), and finally performance appraisal ensures that KRA goals are achieved (mean of 3.6393).
The results indicate that staff were undecided on the following aspects; whether the frequency with which the performance appraisal is conducted in KRA is sufficient (mean of 3.598), whether actual performance is rated based on set targets in KRA (mean of 3.54), whether performance appraisal identifies skills, gaps and developmental needs (mean of 3.500), whether the performance appraisal method used in KRA is professional, objective and fair (mean of 3.196) and finally on whether HR offers sufficient training on performance appraisal system in KRA (mean of 2.623).
However the staff disagree that timely feedback is given on performance appraisal in KRA (mean of 2.598) and that performance appraisal is used in KRA to determine rewards/penalties for performance (mean of 2.508).
The findings indicate that there is high variation in the standard deviation on the respondents’ opinion on performance appraisal as a management tool. Majority of the items recorded a high standard deviation value of >0.9. This implies that the ratings are spread out over a large range of values thus a significant difference on the respondents’ opinion on performance appraisal as a management tool. Therefore there seems to be no consensus in the responses.
The disparity in the standard deviation can be attributed to the significant differences in*he employees’ age, years worked in KRA, department and their grades. It is evident that
40

majority of the staff are relatively young and in their most productive phase .This same category of employees also fall in grade 8-10 which is the entry level for the graduate trainees, thus this shows that they have been with the Authority for a relatively short time since completion of their two year graduate training program and they have also gathered a lot of skills in human resource processes.
4 .5 R e s p o n d e n t s o p in io n o n J o b s a t is fa c t io n
The second variable of this study was job satisfaction. There were fourteen statements to assess participants’ job satisfaction. The range was strongly agree (5) to strongly disagree (1). The scores of strongly disagree had been taken to present a variable which had a mean of 0 to 1.5 on the Likert scale. The score of disagree had been taken to represent a variable which had a mean of 1.6 to 2.5 on the Likert scale. The score of undecided had been taken to represent a variable which had a mean of 2.6 to 3.5 on the Likert scale. The score of agree had been taken to represent a variable which had a mean of 3.6 to 4.5 on the Likert scale. The score of strongly agree had been taken to represent a variable which had a mean of 4.6 and above on the Likert scale.
41

Table 4.5 Respondents opinion on Job satisfactionIT E M M ean Std. D eviation
1 S alary increm en ts are linked to perfo rm ance rating2.2213 1.18888
2 R ew ard s/P en a ltie s are based on skills , co m petencies and perfo rm ance.
2 .3 68 9 1.08484
3 Am sa tis fied w ith fringe benefits 2 .3197 .92053
4 P rom otions are linked to pe rfo rm an ce rating 2 .3 63 6 1.09545
5 M y su p erv iso r is accu rate in m easu rin g actual pe rfo rm an ce ag ainst set targe ts
3 .4793 .91378
6 1 am satisfied w ith m y superv iso rs rating 3 .5537 .99121
7 1 am en cou rag ed to speak out w hen 1 d isag ree w ith my sup erv iso rs decisio n
3 .3306 1.16468
8 Am satisfied w ith co m m un ica tion on perfo rm ance w ith in the o rgan iza tio n
3 .0909 .99163
9 M y pe rfo rm an ce ta rge ts are w ell co m m u n icated to m e 3 .5207 1.11130
10 W ork done is based on set ob jectives 3 .2727 1.08781
11 K R A has op p o rtu n ities for ca reer grow th2 .9174 1.06916
12 K R A puts em p h asis on s ta f f tra in in g 2.5041 1.00932
13 I en joy w o rk ing w ith co -w o rkers 3 .9752 .82121
14 Am satisfied w ith the pe rfo rm an ce m anagem ent policy and gu id e lin es
3 .1736 .93700
Source: Researcher 2011
42

The finding in table 4.5 shows that staff only agreed that they enjoy working with coworkers (mean of 3.97). The staff were undecided on whether they are satisfied with their supervisor’s rating (mean of 3.553), on whether their performance targets are well communicated to them (mean of 3.52), staff were also undecided on their supervisors accuracy in measuring actual performance against set targets (mean of 3.479), results show that staff are undecided on whether they are encouraged to speak out when they disagree with their supervisors’ decision (mean of 3.33), staff were also undecided on whether work done is based on set objectives (mean of 3.27) in addition staff were undecided on the performance management policy and guidelines(mean of 3.173), the staff undecided on communication about performance within the organization (mean of 3.09) and finally on whether KRA has opportunity for career growth ( mean of 2.917).
Staff disagree that salary increments are linked to performance rating (mean of 2.221).It was noted that they also disagree that rewards/Penalties are based on skills, competencies and performance (mean of 2.3689).Trends show that the staff are not satisfied with fringe benefits (mean of 2.319). Data obtained revealed that staff disagree that promotions are linked to performance rating (mean of 2.363), and finally when asked if KRA puts emphasis on staff training, the staff disagreed (mean of 2.50).
The findings indicate that there is high variation in the standard deviation on the respondents’ job satisfaction. This was so because out of the fourteen statements, thirteen of the statements recorded a high standard deviation value of >0.9.This implies that significant difference on the respondents’ job satisfaction.
The high variation in the standard deviation on the respondents’ job satisfaction can beattributed to the significant differences on the employees demographic factors namely;gender, age, years worked in KRA, department and grade which gives an indication thatthe employees' expectations have not been met by the management
43

The objective of this study was to establish the effect of performance appraisal system on employee job satisfaction at the Kenya Revenue Authority. A correlation was done between the performance appraisal scores and the job satisfaction scores to establish the effect of appraisal system on employee job satisfaction.
4.6 Correlation between Performance Appraisal and Job satisfaction
Table 4.6 Correlation between Performance Appraisal and Job satisfaction
Performance Appraisal Job satisfaction
Performance Appraisal Pearson Correlation 1
Job satisfaction Pearson Correlation .746** 1
** P=< 0.01 Source: Researcher 2011
The results indicate that there is a positive correlation between the KRA appraisal system and employee job satisfaction (r =.746) (p<0.05) at 0.05 level of significance.
4.7 Cross tabulation on performance appraisal and demographic factors
Cross tabulation were done between the employees’ performance appraisal and demographic factors .To test the significance of the findings, Pearson chi-square was done on the responses.
44

4.7.1 Gender and performance appraisalCross tabulation done on the respondents gender in relation to the performance appraisal indicate that 29 respondents of which (15 were male while 14 were female) scored in the low understanding level, among the 65 who scored average (34 were male while 31 were fem ale).
Table 4.7.1 Gender and performance appraisal
Performanceappraisal
Female Male TOTAL
Low understanding 15 14 29
Pearson Chi- Square
21.776(p=0.151)
Averageunderstanding 34 31 65
High understanding 10 18 28
Total 59 63 122
Source: Researcher 2011
The results imply that only 28 scored in the high understanding level of which 10 were male while 18 were female. It was noted that the gender differences on the performance appraisal scores were not statistically significant, (x =21.776, df =16, p = >0.05). Thus there are not significant gender differences on the employees’ ratings on the PA because p >0.05.
45

4.7.2 Age and performance appraisalTable 4.7.2 Depicts that respondents aged between 25-35 years scored high on performance appraisal compared to the other respondents. In relation to average understanding, employees aged between 25-35 scored highly, followed by employees aged between 46-55 years of age. Pearson chi-square was done on the responses. (x2=88.354, df =64. p = <0.05). Thus there are significant differences on the employees ratings on the performance appraisal based on their age (p <0.05).
Table 4.7.2 Age and performance appraisal
Performanceappraisal
Below25years
25-35years
36-45years
46-55years
Over55years
Total
Low understanding 30 8 0 1 39
PearsonChi-Square
88.354(p=0.024)
Average understanding 3 32 7 12 1 55
High understanding 25 2 1 0 28
Total 3 87 17 13 2 122
Source: Researcher 2011
4.7.3 Education level and performance appraisal
The respondents who had bachelors’ degree scored high on performance appraisal followed by the respondents who had the masters’ level of education. To test the significance of the findings, Pearson chi-square was done on the responses. (x:=43.265, df =32, p = >0.05).Thus it emerged that there are not significant differences on the employees ratings on the performance appraisal based on their education levels(p > 0.05).
46

Table 4.7.3 Education level and performance appraisalPerformanceappraisal
Diploma Degree Masters Total
Low understanding 7 17 6 30
Pearson Chi- Square
43.265(p=0.088)
Averageunderstanding 9 24 15 48
High understanding 8 21 15 44
Total 24 62 36 122
Source: Researcher 2011
4.7.4 Years worked and performance appraisal
The results indicate that respondents who had worked for duration of between 5-10 years scored more on the high understanding level. In the average understanding, employees who had been working for duration of between 5-10 years also scored more on the performance appraisal. Therefore in relation to years worked, (x2= 1.0622, df =64, p = <0.05). Thus there are significant differences on the employees ratings on the performance appraisal based on the number of years worked (p < 0.05).
47

Table 4.7.4 Years worked and performance appraisalPerformanceappraisal
Less than five years
5-10years
11-15years
16-20years
Above 20 years
Total
Low understanding 8 10 8 6 3 35
Average understanding 9 29 7 2 0 47
High understanding 5 26 3 4 2 40
Total 22 65 18 12 5 122
Pearson Chi-Square= 1.0622(p=0.001)
Source: Researcher 2011
4.7.5 Department and performance appraisal
Cross tabulation on performance appraisal per department indicate that the support department had more respondents who recorded high understanding of the performance appraisal system followed by domestic taxes. In the average understanding level, employees form support services recorded the highest understanding followed by DR. The results indicate that there are significant differences on performance appraisal ratings across the 6 departments. (x:=1.1380, df =64, p = <0.05). Thus there are significant differences on the employees ratings on the performance appraisal based on the department (p < 0.05).

Table 4.7.5 Department and performance appraisalPerformanceappraisal
Customs DR LTO Support RoadTransport
l&E Total
Lowunderstanding 7 10 7 4 1 3 32
Averageunderstanding 10 15 9 19 1 4 58
Highunderstanding 4 5 4 16 2 1 32
Total 21 30 20 39 4 8 122
Pearson Chi-Square-1.138E2, (p=0.000)
Source: Researcher 2011
4.7.6 Grade and performance appraisal
Cross tabulation on performance appraisal across the grade indicate that respondents in grade 4-5, had the highest number of respondents in the high understanding level followed by grade 8-9 and grade 10. In the average understanding level grade 10 had the highest number of employees followed by grade 8-9. Pearson chi-square was done on the responses. (x2=17.500 df =92, p = <0.05).Thus there are significant differences on the employees ratings on performance appraisal based on their grades (p < 0.05).

I able 4.7.6 Grade and performance appraisalPerformance appraisal 4-5 6-7 8-9 10 TOTAL
Low understanding 13 17 30
Average understanding 14 20 22 56
High understanding 10 8 9 9 36
Total 10 22 42 48 122
Pearson Chi-Square 17.500 (p=0.041 )
Source: Researcher 2011
4.8 Cross Tabulations on Job Satisfaction and Demographic Variables
Cross tabulation were done on job satisfaction and the employee’s demographic information to locate for differences in job satisfaction. The results obtained indicate that there are significant differences in employee job satisfaction based on their demographic characteristics like gender, ages, years worked and their departments.
4.8.1 Gender and Job satisfaction
In terms of gender, more female than male recorded high Job satisfaction scores.2(x =40.680, df =23, p = <0.05). Thus there are significant differences on the employees’
ratings on the Job satisfaction based on their gender.
50

Table 4.8.1 Gender and Job satisfactionJob satisfaction FEMALE MALE TOTAL
Low satisfaction 15 15 30
Pearson Chi- Square
40.680(p=0.013)
Averagesatisfaction 34 41 75
High satisfaction 10 7 17
Total 59 63 122
Source: Researcher 2011
4.8.2 Age and Job satisfaction
Respondents aged between 25-35 years recorded the highest Job satisfaction scores in the average and high satisfaction level. The results indicate that there are significant differences on job satisfaction ratings based on respondents’ age. (x2=1.536, df =92, p = <0.05).
Table 4.8.2 Age and Job satisfaction
Job satisfaction
Below 25 years
25-35years
36-45years
46-55years
Over 55 years
Total
Low satisfaction 0 23 7 4 1 35
Average satisfaction 1 40 6 6 1 54
High satisfaction 2 24 4 3 0 33Total 3 87 17 13 2 122
Pearson Chi-Square 1.536E2(p=0.000)
Source: Researcher 2011
51

4.8.3 Education level and Job satisfactionIn relation to education level it is evident that the degree holders had the highest number of respondents in the average and high satisfaction level. Pearson chi-square was done on the responses. (x2=70.006, df =46, p = <0.05).Thus there are significant differences on the employees ratings on job satisfaction based on their education levels.
Table 4.8.3 Education level and Job satisfaction
Job satisfaction Diploma Degree Masters Total
Low satisfaction 5 13 13 31
Pearson Chi- Square
70.006(p=0.013)
Averagesatisfaction 10 28 14 52
High satisfaction 9 21 9 39
Total 24 62 36 122
Source: Researcher 20 11
4.8.4 Years worked and Job satisfaction
Data on number of years worked, respondents who had worked for duration of between 5-10 years recorded the highest number of respondents in the average and high satisfaction level. In relation to years worked, (x2=1.935, df =92, p = <0.05). Thus there are significant differences on the employees ratings on job satisfaction based on the number of years worked.
52

Table 4.8.4 Years worked and Job satisfactionJob satisfaction Less than
fiveyears
5-10 years 11-15years
16-20years
Above 20 years
Total
Low satisfaction 8 10 8 6 3 35
Average satisfaction 9 29 7 2 0 47
High satisfaction 5 26 3 4 2 40
Total 22 65 18 12 5 122
Pearson Chi-Square= 1.935E2(p=0.000)
Source: Researcher 2011
4.8.5 Department and Job satisfaction
Job satisfaction ratings indicate that support services department had the highest number of respondents who scored in the high satisfaction level followed by LTO. In the average satisfaction level employees from DR recorded the highest satisfaction followed by support. The results indicate that there are significant differences on job satisfaction ratings across the 6 departments.

Table 4.8.5 Department and Job satisfactionJobsatisfaction
Customs DR
LTO SupportRoad
Transport
I&E
TOTAL
Lowsatisfaction 6 10 10 9 1 1 37
Averagesatisfaction 9 15 3 13 1 4 45
Highsatisfaction 6 5 7 17 2 3 40
Total 21 30 20 39 4 8 122
Pearson Chi-Square-1Ai55E2, (p=0.04)
Source: Researcher 2011/
4.8.6 Grade and Job satisfaction
Cross tabulation on job satisfaction across the grade indicate that respondents in grade 6- 7 and grade 10 had the highest number of respondents in the high satisfaction level. Pearson chi-square was done on the responses, (x =1.957 df =92, p = <0.05).Thus there are significant differences on the employees ratings on job satisfaction based on their grades.
54

Table 4.8.6 Grade and Job satisfactionJob satisfaction 4-5 6-7 8-9 10 TOTAL
Low satisfaction 0 6 20 32 58
Average satisfaction 6 10 18 10 44
High satisfaction 4 6 4 6 20
Total 10 22 42 48 122
Pearson Chi-Square 1.957E2 (p=0.000)
Source: Researcher 2011
/
55

CHAPTER FIVE: SUMMARY OF FINDINGS, CONCLUSION ANDRECOMMENDATION
5.1 Introduction
The study sought to determine the effect of performance appraisal system on employee job satisfaction on the staff of Kenya Revenue Authority. One hundred and twenty two questionnaires were distributed, and all the 122 questionnaires were returned, giving an overall response rate of 100%.The objective of this study was to establish the effect of performance appraisal system on employee job satisfaction at the Kenya Revenue Authority.
5.2 Summary and discussion of findings
From the findings it is evident that there was a balance in respondents’ gender in this study. The data also revealed that majority of the staff are relatively young and in their most productive phase and hence the Authority should ensure that they are highly satisfied in their job to achieve high tax collection rates. In addition the findings show that KRA staff are of high level of education and can be explained by the fact that for the last ten years or so, KRA has been recruiting persons with at least a university degree as the minimum education level into the graduate trainee program. The findings also show that majority of staff fall in grade 8-10 which is the entry level for the graduate trainees, thus this shows that they have been with the Authority for a relatively short time since
56

completion of their two year graduate training program, they have also gathered a lot of skills in revenue collection. From this study majority of the staff are in support services which is a non revenue department, this can be explained by the fact that support services department comprises of several functions such as Human resource, finance, marketing, projects, information technology and so on. However, the revenue departments cumulatively carry the bulk of the staff. Grade 10 had the highest number of respondents because this grade absorbs all the graduate trainees after training school. Majority of the staff are in the lower management level and are therefore involved in the day to day controlling and direction of revenue collection functions.
In relation to performance appraisal; majority of the respondents are aware of the KRAperformance appraisal system since they are all appraised twice in a year. From the/findings it is evident that senior management is involved in all the stages of performance appraisal. It emerged that majority of the employees were involved only in the measuring of actual performance. However the findings indicate that the staff were involved in comparing actual performance with set standards which is a crucial stage of performance appraisal and it should involve all parties. The findings also show that majority of the employees are aware of the rewards/penalties for the various categories of performance rating. Awareness of the said rewards/penalties may play a role in boosting staff satisfaction; however failure to honor the stated rewards/penalties may have a negative effect on satisfaction. The findings indicate that there is high variation in the standard deviation on the respondents’ opinion on performance appraisal as a management tool.
57

Majority of the items recorded a high standard deviation value of >0.9. This implies that the ratings are spread out over a large range of values thus a significant difference on the respondents’ opinion on performance appraisal as a management tool. Therefore there seems to be no consensus in the responses.
Majority of the staff expressed a lack of satisfaction in their job since they disagreed that salary increments are linked to performance rating, rewards/Penalties are based on skills, competencies and performance. The staff are also not satisfied with fringe benefits. Moreover staff disagree that promotions are linked to performance rating. The staff were also undecided various on whether their supervisors accuracy in measuring actual performance against set targets, on communication of targets and opportunities for career growth. The findings indicate that there is high variation in the standard deviation on the respondents’ job satisfaction. This was so because out of the fourteen statements, thirteen of the statements recorded a high standard deviation value of >0.9.This implies that significant difference on the respondents’ job satisfaction.
Cross tabulation between performance appraisal and the demographic factors reveal that there was a significant difference between performance appraisal and the following demographic factors age, number of years worked, department and the grade. Furthermore there was significant difference between all the demographic factors and job satisfaction. A correlation was done between the performance appraisal scores and the
58

job satisfaction scores to establish the effect of appraisal system on employee job satisfaction. The results indicate that there is a positive correlation between the KRA appraisal system and employee job satisfaction
5.3 Conclusion
Overall the findings of this research have shown that performance appraisal as a tool helps KRA to achieve its goals. It emerged that performance appraisal helps individual staff to meet the set targets and staff to know their level of performance. From the results it was noted that staff felt that performance appraisal is not used to determine rewards/penalties. On performance, the research indicates that HR does not offer sufficient training on the performance appraisal system and that they do not give timely feedback.
The findings gave an indication that there is lack of job satisfaction. The staff are not satisfied because the management does not use the performance appraisal to determine salary increments, rewards/penalties, promotions, fringe benefits, training needs and career growth opportunities. It emerged that staff enjoy working with co-workers which gives and indication that there is good teamwork.
In conclusion the findings have indicated a positive and significant relationship between performance appraisals and job satisfaction.
59

5.4 Recommendation
The researcher recommends various elements that must be addressed in relation to the performance appraisal and job satisfaction since performance appraisal is used by organizations to reward and develop the human resource of the organization so that they can run smoothly. Even though the staff are involved and are aware of the performance appraisal as a management tool, they require training on the tool. In addition the performance appraisal system should be reviewed to ensure that rewards and penalties are linked to employee performance and also timely feedback to staff regarding their appraisal.
The management should use performance appraisal to determine salary increments, rewards/penalties, promotions, fringe benefits, training needs and career growthopportunities.
/
60

REFERENCES
Ahmad, M.S. (1998). P erform ance appraisal M anagem ent. Anmol Publications,
New Delhi.
Awori, B.W. (2005). P erform ance A ppraisa l p ractices in the state corporation. Unpublished MBA research paper, University of Nairobi
Bandura, A. (1977). Socia l learning theory. Englewood Cliffs, New Jersey, Prentice Hall
Bolarin, T. A. (1993). Late payment of teachers salary at its affects the quality of
education in Lagos State Academy Schools: A Social -Psychological perspective.
Journal o f N ationa l A ssocia tion o f E ducation Teachers, 6(1), 11-15 .
Coutts, L.M., & Schneider, F.W. (2004). Police Officer Performance appraisal systems.
How good are they? P olicing an International Journal o f po lice strategies
& M anagem ent, 27(1), 67-81.
Daley, M. D. (1992). P erform ance A ppraisa l in the Public sector: Technicpies and
applications'. Quorum Books, West port.
^ Edwards, P., & M. Wright. (2001). High-involvement work systems and performance
Outcomes: The strength of variable, contingent and context bound relationships.
In ternational jo u rn a l o f H um an Resource M anagem ent, 12(4), 568-58561
Ezeai, S.I. (1998). R esearch m ethods: A realistic approach. Ibadan Elohim Publishers.
Fafunmwa, A.B. (1971). N ew perspective in education. London: Macmillan Education
Limited.
Fisher,C.D.S., Choenfeldt,C.F., & Shaw,J.B. (1997). Perform ance A p p ra isa l H um an
R esource M anegem ent, (3ld ed.). Houghton Mifflin, Boston,
Folger,R., and Cropanzano,R., (1998). O rganizational ju s tic e a n d H um an Resource
M anagem ent. Thousands oaks, CA:sage.
Geiger, M, Cooper, EA, Hussein, I, O'Connell, B.T, Power, J, Raghunandan, K., Rama,
D.V.& Sanchez, G (1998). Using expectancy theory to access students motivation: A n In ternational replication issues in accuracy education , 13(1), 139- 156
Gomez-Hernsndez,R,Max,J.Ev.Rosier ,T.,Paradiso,S Robinson R,G. (1997) Social
Impairment and depression after traumatic brain injury, A rchives o f physica l
M edicine a n d rehabilita tion 78(12), 132-136.
Grote Dick (1996). The com plete guide to Perform ance A ppraisa l. Amacom New York
Higgins,E.T. (1997). Beyond pleasure and pain. A m erican psycho logist, 52( 12), 1280-
1300.
Hackman, J.R. and Oldman, G.R. (1976). Motivation through the design of work: Test of62

theory. Organizational Behaviour and Human Performance, 16, 250-279.
Issac, R.G., Zerbe, W.J., & Pitt, D.C.(2001). Leadership and motivation: The effective
application of expectancy theory. Journal o f m anageria l Issues, 13(2), 212
Jamal, M. (1997).Job stress, satisfaction and mental health: An empirical examination of
Self employed and non employed Canadians. Journa l o f Sm all Business
M anagem ent 35(4), 48- 57
Koontz, H., & Weirich, H. (2007). Essentials o f m anagem ent. (7lh ed.). Tata McGraw Hill
Katou, A., & Budhwar, P. (2006). Human Resource Management systems on
organizational performance: A test of mediating model in the Greek manufacturing context. In ternational jo u rn a l o f H um an R esource M anagem ent,
17(7), 1223-1253
Larkin, T.J &Larkin, S.1996, R eaching a nd changing fro n tlin e em ployees ', Harvard
Business Review, May - June, pp.95-104
Luthans, F.(1998). O rganiza tional behavior. ( 8th ed.). Boston: Irwin Me graw-hill
Muhindi C.M. (2005), Thesis on the impact o f perform ance appraisal on M oi University
em ployees. Unpublished MBA research paper, Moi University
63

Maragwa, J.G. (2007). A Thesis on E ffectiveness o f Training on S ta f f Perform ance
Im provem ent: A Case S tudy o f the M inistry o f S tate fo r Public Service.
Unpublished MBA research paper, Jomo Kenyatta University of Agriculture and
Technology
Marangu, K. (2004). A Thesis on Perform ance Im provem ent in K enya C ivil Service.
Unpublished MBA research paper, Jomo Kenyatta University of Agriculture and
Technology
Muthuo, A.(2010). E ffect o f perform ance appraisal on m otivation: A Case S tudy o f the
M inistry o f S ta te fo r Public Service. Unpublished MBA research paper, Jomo Kenyatta University of Agriculture and Technology
Mitchell, T.R. & Lason, J.R. (1987). People in organization. (3rd ed). New York :
Mcgraw-hill
Nwagwu,C.C.(1997). The environment of crisis in the Nigerian education system.
Journal o f com parative education, 33(1), 87-95.
Oshagbemi,T.(2000). How satisfied are academics with their primary tasks of teaching
research And administration and management. In ternational sustainable in
higher education , 1 (2), 124-136.
O'Toole, A. (1980). Work in an area of Show economic growth. Technological
fo reca s tin g a n d Socia l Cahnge, 16(4), 277-33064

Orodho , J.A. (2005). E lem ents o f Education and Social Science R esearch Method.
Nairobi, Masola Publishers
Philips,J.S( 19194).Evolution of effective career outcomes: A Field study of academic
Librarians.College and Research Libraries 55(6), 541-549
Robbins, S.P Millett, B, Caciop, R &Waters-Marsh,T 1998.O rganisational Behavior
: L ead ing a nd m anaging in A ustralia and Nealand. Prentice hall Sydney.
Ramsay, H.( 1991). Re-inventing the wheel? A review of the Development in
performance of employee involvement; H um an R esource M anagem net
Journal, 1(4), 1-22.
.Savery, L.& Syme, P.(1996). Organizational commitment and Hospital Pharmasist
Journa l O f M anagem ent D evelopm ent, 15( 1), 14-22.
Shepherd, J.A.( 1993).Productivity loss in performance Groups : Motivation Analysis
P sychologica l B ulle ting , 113 (1), 67-81.
Skarlicki,D.P., & Folger,R (1997). Retaliation in the work place : The roles of
Distributive procedural, & interractional justice. Journa l o f app lied Psychology,
82 (3), 4 34 -4 43 .
Skinner B.F, (1953). Science a nd H um an B ehaviour .Newyork Free Press
Spector E. P. (1985) Job satisfaction; A pplica tion . Assessm ent, C auses a nd65

C onsequences. Sage Publication, New delhi
Solomon, J.B. 2001. Performance and personality impressions Cues as predictors of
athletic performance: an extension of expectancy theory. In ternational Journal o f
Sports P sycho logy , 32 (1), 80-100.
Tyler, T.O. (1989) - The Psychology of Procedural Practice: A test of the Group Value
Model. Jou rn a l o f P ersonality and Social P sycho logy , 57 (5), 830-838.
Van Earde, W. & Thierry, H. (1996).Vrooms expectancy models and work related
cretaria: A meta analysis. Journal o f app lied P sycho logy , 81(5), 575 -586
Vroom, V.H. (1964). W ork a n d m otivation. Newyork, NY : Wiley..
Yong Alex KB 1996. M alaysian hum an resource m anagem ent. Kuala Lumpur Malaysian
Institute of Management.
www.appraisals.naukrihub.com
66

Appendices 1QUESTIONNAIRE
SECTION A. GENERAL INFORMATION
1. What is your gender? (tick one) Female ( ) Male ( )2. What is your age bracket? (tick one)
Below 25 years ( ) 25-35 years ( ) 36-45 years ( ) 46-55 years ( ) Over 55 years( )•
3. Highest level of Education (tick one)College Certificate ( ) Diploma ( ) Degree ( ) Masters Degree ( ) Other ( )
4. Years worked for KRA (tick one)
Less than five years ( ) 5-10 years ( ) 11 -15 years ( ) 16-20 years ( )Above 20 years( )
5. Department (tick one)
D ep a rtm en t T ick on e
Customs Services
Domestic Taxes - DR
Domestic Taxes - LTO
Support Services
Road Transport
Investigation and Enforcement
6. KRA grade (tick one) 1 - 5 ( ) 6 - 10 ( ) 11 - 16 (

S E C T IO N B: P E R F O R M A N C E A P P R A IS S A L
1. Are you aware of the KRA performance appraisal (PA) system?Yes ( ) No ( ) Not Sure ( )
2. Performance Appraisal is a process, at what stage are you involved in the process (tick
where applicable).
S ta ge T ick w h ere a p p licab le
Setting of targets
Communicating targets (expectation and standards)
Measuring actual performance
Comparing actual performance with set standards
Providing feedback on performance
Decision making ( taking corrective measures)
3. Are you aware of the rewards/penalties for the various categories of performance rating in KRA? i.e. (Commendation, salary increment, bonus, caution and termination of service).
Yes ( ) No ( ) Not Sure ( )

4. P e r f o r m a n c e a p p ra is a l is an im p o r ta n t m a n a g e m e n t to o l w h ic h e n a b le s th e e m p lo y e r an d
e m p lo y e e to m e e t th e s e t o b je c t iv e s . P le a s e r e s p o n d to th e lis t b e lo w b y t ic k in g
a p p ro p r ia te ly .
Key
PA- P e r f o r m a n c e A p p r a is a l
S A - S t r o n g l y A g re e , A - A g re e , UD- U n d e c id e d , D -D is a g re e , S D -S tr o n g ly D is a g re e
ITEM SA A UD D SD1 P A e n s u r e s th a t K R A g o a ls a re a c h ie v e d
2 P A h e lp s in d iv id u a l s t a f f m e e t s e t ta rg e ts a n d g o a ls
3 P A id e n t i f ie s s k i l ls , g a p s a n d d e v e lo p m e n ta l n e e d s
4 P A a s s is t s s t a f f to k n o w th e ir le v e l o f p e r fo rm a n c e
5 P A is u s e d in K R A to d e te rm in e r e w a rd s /p e n a l t ie s fo r p e r f o r m a n c e
6 H R o f f e r s s u f f ic ie n t t r a in in g o n P A s y s te m in K R A
7 A c tu a l p e r f o r m a n c e is ra te d b a se d o n s e t ta r g e ts in K R A
8 T h e P A m e th o d u s e d in K R A is p ro fe s s io n a l , o b je c t iv e a n d fa ir
9 T h e s u p e r v i s o r ’s r a te s m y p e r f o r m a n c e a c c u ra te ly
10 T h e f re q u e n c y w ith w h ic h th e P A is c o n d u c te d in K R A is s u f f ic ie n t
11 T im e ly f e e d b a c k is g iv e n o n P A in K R A

S E C T IO N C: JO B S A T IS F A C T IO N
5. B e lo w is a l is t o f s ta te m e n ts . K in d ly ra te y o u r s a t i s fa c t io n in r e la t io n to th e fo l lo w in g
a s p e c ts . P le a s e re s p o n d to th e m b y t ic k in g a p p ro p r ia te ly .
Key
S A - S t r o n g l y A g re e , A -A g re e , U D - U n d e c id e d , D -D is a g re e , S D -S tr o n g ly D is a g re e
I T E M S A A U D I) S D
1 S a la ry in c re m e n ts a re l in k e d to p e r f o r m a n c e r a t in g
2 R e w a rd s /P e n a l t ie s a re b a se d o n s k i l ls , c o m p e te n c ie s a n d p e r f o r m a n c e .
3 A m s a t i s f ie d w ith f r in g e b e n e f i ts
4 P r o m o tio n s a r e l in k e d to p e r fo rm a n c e ra t in g
5 M y s u p e r v is o r is a c c u r a te in m e a s u r in g a c tu a l p e r f o r m a n c e a g a in s t s e t ta rg e ts
6 I a m s a t i s f ie d w ith m y s u p e r v is o r s r a t in g
7 1 a m e n c o u r a g e d to s p e a k o u t w h e n 1 d is a g re e w ith m y s u p e r v is o r s d e c is io n
8 A m s a t is f ie d w ith c o m m u n ic a t io n o n p e r fo rm a n c e w ith in th e o r g a n iz a t io n
9 M y p e r f o r m a n c e ta rg e ts a re w e ll c o m m u n ic a te d to m e
10 W o rk d o n e is b a s e d o n s e t o b je c t iv e s
11 K R A h a s o p p o r tu n i t ie s fo r c a re e r g ro w th
12 K R A p u ts e m p h a s is o n s t a f f t r a in in g
13 I e n jo y w o rk in g w ith c o -w o rk e r s
14 A m s a t is f ie d w ith th e p e r fo rm a n c e m a n a g e m e n t p o lic y a n d g u id e l in e s
