buy funkwerk ag - kalliwoda ag_kalliwoda_analysis.pdf · telematics funkwerk eurotelematik gmbh •...
TRANSCRIPT
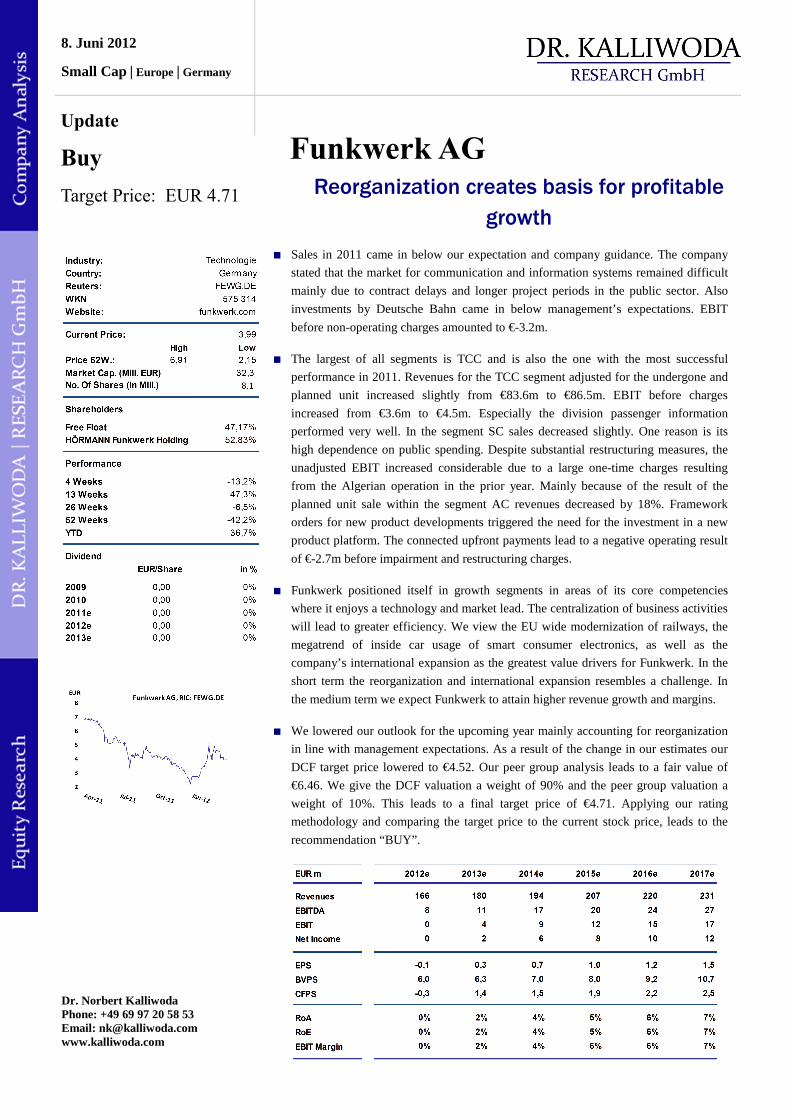
∎ Sales in 2011 came in below our expectation and company guidance. The company
stated that the market for communication and information systems remained difficult
mainly due to contract delays and longer project periods in the public sector. Also
investments by Deutsche Bahn came in below management’s expectations. EBIT
before non-operating charges amounted to €-3.2m.
∎ The largest of all segments is TCC and is also the one with the most successful
performance in 2011. Revenues for the TCC segment adjusted for the undergone and
planned unit increased slightly from €83.6m to €86.5m. EBIT before charges
increased from €3.6m to €4.5m. Especially the division passenger information
performed very well. In the segment SC sales decreased slightly. One reason is its
high dependence on public spending. Despite substantial restructuring measures, the
unadjusted EBIT increased considerable due to a large one-time charges resulting
from the Algerian operation in the prior year. Mainly because of the result of the
planned unit sale within the segment AC revenues decreased by 18%. Framework
orders for new product developments triggered the need for the investment in a new
product platform. The connected upfront payments lead to a negative operating result
of €-2.7m before impairment and restructuring charges.
∎ Funkwerk positioned itself in growth segments in areas of its core competencies
where it enjoys a technology and market lead. The centralization of business activities
will lead to greater efficiency. We view the EU wide modernization of railways, the
megatrend of inside car usage of smart consumer electronics, as well as the
company’s international expansion as the greatest value drivers for Funkwerk. In the
short term the reorganization and international expansion resembles a challenge. In
the medium term we expect Funkwerk to attain higher revenue growth and margins.
∎ We lowered our outlook for the upcoming year mainly accounting for reorganization
in line with management expectations. As a result of the change in our estimates our
DCF target price lowered to €4.52. Our peer group analysis leads to a fair value of
€6.46. We give the DCF valuation a weight of 90% and the peer group valuation a
weight of 10%. This leads to a final target price of €4.71. Applying our rating
methodology and comparing the target price to the current stock price, leads to the
recommendation “BUY”.
Reorganization creates basis for profitable
growth
8. Juni 2012
Small Cap | Europe | Germany
Update
Buy
Target Price: EUR 4.71
Funkwerk AG
Dr. Norbert Kalliwoda [email protected] Phone: +49 (69) 97 20 58 53 www.kalliwoda.com
Dr. Norbert Kalliwoda Phone: +49 69 97 20 58 53 Email: [email protected] www.kalliwoda.com

2 Funkwerk AG | Update | June 2012
Dr. Kalliwoda Research GmbH | Update
Inhalt
1 Company Profile ....................................................................................................................... 3
2 SWOT Analyse ......................................................................................................................... 4
3 Current Developments ............................................................................................................. 5
3.1 Reorganisation .............................................................................................................................5
3.2 Group Results ..............................................................................................................................5
3.3 Segments......................................................................................................................................6
4 Stock .......................................................................................................................................... 8
5 Conclusion ................................................................................................................................. 8
6 Financial Statements ................................................................................................................ 9
6.1 Profit and Loss Statement ............................................................................................................9
6.2 Balance Sheet ............................................................................................................................10
6.3 Cash Flow Statement .................................................................................................................11
7 Valuation ................................................................................................................................. 12
7.1 DCF-Model................................................................................................................................12
7.2 WACC .......................................................................................................................................13
7.3 Fair Value – Sensitivities ...........................................................................................................13
7.4 Peer Group Analysis ..................................................................................................................14
8 Contakt .................................................................................................................................... 15
9 DISCLAIMER ........................................................................................................................ 15

3 Funkwerk AG | Update | June 2012
Dr. Kalliwoda Research GmbH | Update
1 CompanyProfile
Funkwerk AG is a mid-sized technology company specializing in solution-oriented information, communications and security systems. The company’s products are based on the state-of-the-art principals of radio and communication technology and data processing to improve security and comfort and help reduce customer costs. The mission is to maintain a high degree of flexibility in reacting to customer requests coupled with leading technological expertise. The focus is on high-end solution and services. The services of Funkwerk AG are structured into the three divisions that are subdivided into further business units.
Business Segments and Units
Traffic & Control Communication (TCC)
Security Communication (SC)
Automotive Communication (AC)
Infrastructure Rolling Stock Video Security Solutions Security Automotive
Product Areas / Entities / Core Products (Market Ranking)
Stationary Communication Systems
Hörmann Funkwerk Kölleda GmbH
• DIKOS 310: voice operation management system (#1 GER, #3 EU)
Management Systems
Funkwerk Information Technologies GmbH
• Allister: Signaling technolgy for interlocking systems (best price and quality)
• Employee training systems for operation control and signaling technology (Top 3)
Information Systems
Funkwerk Information Technologies Karlsfeld GmbH & Microsyst Systemelectronic GmbH
• Customer information display, timetable & road & route (Top 3)
Mobile radio systems
Hörmann Funkwerk Kölleda GmbH
• Inside train radio systems based on GSM-R standard unique feature is SIL2 approval; (#3 EU)
• Handhelds for usage in inside trains and shunnting operations, focX voice and data (#1 EU @ 70%)
Video Systems
Funkwerk plettac electronic GmbH
• Production of high end cameras, pan-tilt heads and domes (Top 3 supplier)
• Monitor solutions
Property Protection
Funkwerk plettac electronic GmbH
• Management systesm for video montoring and surveillance (#1GER)
• Video image analysis:
o ARGOSCAN hard shoulder release for less traffic jams
o Traffic analysis
o Privacy masking
o Motion detection & object analysis
• Consulting, projecting, training, system support and maintenance
Personal Security
Funkwerk Security Communications GmbH
• TSS & DSS: Security communication platforms on TETRA & DECT standard: e.g. functions of localization, alarm, video feed, documentation; easily integratable
• OCP radio messaging system
Radio Equipment for Security Functions
Funkwerk Security Communications GmbH
• Specialized DECT and TETRA handsets: Explosion proof e.g. ATEX certified, personal security functions (50% of GER penal facilities), medical or office reliable communication (Top 3 in GER)
• OEM for DECT devices
Vehicle Equipment
Funkwerk Dabendorf GmbH
• High frequency technology: compensor and combiner (#1world)
• Mobile phone into vehicle: Wireless secure operation and charging via universal phonebox over car antenna (#1 GER);
• Communication products: Vehicle WLAN router; eCall unit; Connectivity Unit for CE devies
Telematics
Funkwerk eurotelematik GmbH
• Fleet management systems also web based and satellige system developement
Strategic Market Positioning
• Integrated system supplier for rail operators and other system suppliers
• Complete system provider for rail operators and train manufacturers
• Integrated system supplier
• Specific sector solutions
• Distribution network of 30 partners in 13 countries
• Tier 1 system supplier to production lines via close partnerships
• Development Partners
Growth Drivers
• Increasing use of software solution for information
• Increasing traffic & role of ressource efficient transportation
• Interlocking systems reach age limit 31000 in Germany2012 (SIL2)
• Shunting operations in Western EU
• GSM-R standard rollout in EU of about 150t km
• Expanding capability range of handheld devices and device systems
• Network-based video technology and usage to control ressources and efficiency in processes
• Videoanalytic sensoric for smart user support
• Expansion of service, consulting business and network technologies
• Globally steadily increasing security requirements (3 to 10% annually)
• Expanding customer base of handheld devices
• Growing # of CE devices
• Growing use of CE devices in the car; electronic interior becomes a purchasing argument when buying a car
Customer Segments
• Public Rail and Transport Operators
• Rail Transport / Manufacturers
• Infrastructure Operators (e.g. energy, fire departments)
• Companies
• Institutions & Authorities
• Energy Suppliers
• Car (Premium) and Lorry Manufacturers
• Transport Companies

4 Funkwerk AG | Update | June 2012
Dr. Kalliwoda Research GmbH | Update
2 SWOTAnalysis
Strength
Weaknesses
• The high expertise and experience in the areas
of high frequency technology resembles a competitive
advantage and entry barrier.
• Funkwerk is a specialist with decades of experience in niche markets such as railway
information systems, handhelds for personal security
and mobile phone car integration. Thereby the
company is able to offer innovative, unique customized
solutions for various interfaces and modules.
• Innovation is a core company focus with the R&D
budget amounting to 10% of revenues and more than
1/5 of all employees being active in the area.
• A high inventory level due to warranty
replacement contracts up to ten years binds capital and
could result in future impairment losses.
• A high sector concentration in the segments
TCC and SC and their dependence on public sector
increases business risk.
• A high individual customer concentration, as one customer accounts for more than 10% of revenue
and several others come close to 10%, increases
business risk.
Opportunities
Threads
• Product upgrades through higher level
certification and expanding capabilities, e.g.
Allister SIL 2, TETRA and DECT devices, HD
cameras, strengthen position and open new markets.
• Railway infrastructure modernization like
the GSM-R standard rollout in EU and the
modernization of aging interlocking systems means that
railway operators need to upgrade their stationary and
mobile train systems. We view the company's position
in these areas as excellent to profit from this trend.
• Megatrends like increasing use of CE devices in the
car, increasing global security levels, and use of
network based video to make processes more efficient
spurs demand for Funkwerk products and solutions.
• International expansion leads to a growth in
revenues, larger margins through scale effects and
diversification benefits with respect to the customer
base. New risk in the form of tax, achieving technology
norms, law and foreign exchange provide challenges.
• The orientation as system solution provider is in our view an attractive strategy as available
knowledge can be used to move up in the value chain,
while at the same time the dependence on technology
innovations decreases.
• Reorganization and outsourcing should
unleash synergies, increase efficiency and ultimately
lead to higher margins.
• The Risk of losing technology leadership is
generally high in a young communications sector where
technology changes fast and the pressure is high to
produce consistent innovations and bring them to the
market in a timely manner at an adequate pricing level.
• A Supply shortage, due to short lead times of the
cyclical electronic component industry and dynamic
product cycles, could evolve, if resources are not
available in the case of unexpected developments. This
could lead to missed opportunities, a drop in margins
facing higher prices or even losing technology
leadership if a competitor manages the supply shortage
in a better manner.
• Investments in the Algerian project are not
likely to be retrieved.

5 Funkwerk AG | Update | June 2012
Dr. Kalliwoda Research GmbH | Update
3 CurrentDevelopments
3.1 Reorganization
In 2011 Funkwerk AG performed a reorganization of its company structure from a pure management holding to a corporation where central business functions of all segments are now managed by central units. Within its business segments the company focuses on areas where its core competencies give it a technology lead in markets with strong margins and growth prospects. As a result of the reorganization Funkwerk AG sold its enterprise communication segment (€28m sales; 140 employees) including subsidiaries, as well as the unit Alpha Meß-Steuer-Regeltechnik GmbH (TCC; €17m sales; 120 employees). It is in the process of selling Funkwerk Avionics GmbH (AC; €3,3m sales; 24 employees) and the sports unit of the Funkwerk Information Technologies Karlsfeld GmbH (TCC; €1,5m sales). Further sales may follow.
Funkwerk AG employed a platform strategy centralizing business activities. Bundling purchase activities will increase volume and lower price. Centralized financing activities will give the corporation a better bargaining position against credit institutions.
Production capacity will be shifted among facilities across all business units according to needs resulting in a higher utilization of facilities. The adaption of a lean management organization will be subsequently inaugurated for large volume production processes and ultimately lead to faster production and running times as well as lower inventory. The use of technology and product platforms, as well as the introduction of competence centers for key technologies like GSM-R, TETRA, DECT, will foster the exchange of knowhow across all areas and breed innovation. The centralization of labor, development, reporting and IT will further create synergies. The company will consequently outsource standard tasks and perform permanent optimization in order to reach a high level of assembly efficiency. A next step will be the outsourcing of the production of standard components to suppliers.
The distribution strategy is focused on internationalization via partnerships. The company will present the full product spectrum of all its business units when approaching new markets and partners. Funkwerk AG plans to position itself increasingly as a solution-oriented system provider.
3.2 GroupResultsSales in 2011 came in below our expectation and company guidance. The company stated that the market for communication and information systems remained difficult mainly due to contract delays and longer project periods in the public sector. Also investments by Deutsche Bahn came in below management’s expectations. EBIT before non-operating charges came in at €-3.2m.
Labor costs share on total revenues remained stable, as many of the employees leaving were from the low-wage sector, while at the same time overall wage levels increased. A number of 285 employees left the company in the context of restructuring and 70 employees were laid off in order to tighten labor activities.
Costs of material dropped stronger than revenues due to apparently a high share of material costs of sold TCC unit and the unleashing of synergies by centralizing purchasing efforts. These factors even offset an input price increase triggered by the earthquake in Japan which is one of Funkwerk supply markets.
Company Results Company Guidance
2010 2011 ∆ (%) 2011 ∆ (%) 2011 ∆ (%)
Sales (adjusted) 168,6 164,6 (2,4) 167,2 (1,6) 170,0 (3,2)
EBIT (adjusted) (1,7) (3,2) (88,2) (1,8) (75,8) sma l l los s
EBIT (14,9) (13,1) 12,1 -- -- -- --
Our EstimateGroup Results (in €m)

6 Funkwerk AG | Update | June 2012
Dr. Kalliwoda Research GmbH | Update
The financial loss increased, due to costs connected to the issuance of debt capital. In March 2011 Funkwerk concluded a syndicate loan agreement. As the reorganization became evident the terms of the agreements were renegotiated. The overall size of the loan was lowered to a €10m money market loan and €40m in guaranteed credit lines. The terms of the agreement were relaxed. The state guarantees were dropped, the proceeds from the sold business units are now at free disposal for the company and stockholders are free to decide on a dividend. The exact terms of the agreement are to be negotiated and as of such the exact covenants are not yet known.
Provisions for taxes included a reserve for a higher than expected tax repayment, which the company appealed against. The adjusted net loss amounted to €-8.3m versus €-16.5m in the prior year. Accordingly adjusted EPS improved from €-2.0 to €-1.0 as the number of shares outstanding remained unchanged.
As a result of the income loss cash from operations were negative. Cash from investing activities evened out as proceeds from the business sales offset investments, such as the new developed product platform in the segment AC. The financing cash flow increased by the amount of the new short term money market loan. The liquidity cushion improved to €18m.
3.3 Segments
The largest of all segments is TCC and is also the one with the most successful performance in 2011. Revenues for the TCC segment adjusted for the undergone and planned unit increased slightly from €83.6m to €86.5m. EBIT before charges increased from €3.6m to €4.5m. Funkwerk succeeded in the segment TCC with substantial new orders from DB, international market entries and new product developments and placements in 2011. Especially the division passenger information performed very well.
In the segment SC sales decreased slightly. One reason is its high dependence on public spending. Despite substantial restructuring measures, the unadjusted EBIT increased considerable due to large one-time charges resulting from the Algerian operation in the prior year.
TCC SC AC
2010 2011 ∆ (%) 2010 2011 ∆ (%) 2010 2011 ∆ (%)
Sales (adjusted) 83,6 86,5 3,5 57,4 55,5 (3,3) 27,6 22,6 (18,1)
EBIT (adjusted) 3,6 4,5 25,0 (3,9) (4,5) (15,4) (1,1) (2,7) (145,5)
EBIT 1,1 0,4 (63,6) (13,7) (6,2) 54,7 (2,1) (6,9) (228,6)
Segment Results (in €m)
Group Results and Estimates
Absolute numbers in €m, Margins relative to total revenues; Values adjusted for non-recurring items
Source: Funkwerk AG, Dr. Kalliwoda Research © 2012
4,7%4,6%
0,0% 2,1%
306,4 307,8
230,9
175,5 171,2171,2 173,5187,4
9,7% 9,6%
3,1% 2,7%
4,6%6,0%
0%
2%
4%
6%
8%
10%
12%
14%
16%
18%
20%
2007 2008 2009 2010 2011 2012e 2013e
0
50
100
150
200
250
300
350
Operating Margin EBITDA Margin Total Revenue
49,0% 46,5% 49,6% 51,4% 49,0%
30,0% 31,7%39,9% 36,1% 36,5%
13,6% 14,3%
17,2%13,8% 14,0%
4,9% 5,1%
5,0%4,0%
4,6%
51% 50%
36,4% 36,0%
13,0% 13,0%
4,6% 3,9%
0%
20%
40%
60%
80%
100%
120%
2007 2008 2009 2010 2011 2012e 2013e
Costs of Materials Labor Other Expenses D&A

7 Funkwerk AG | Update | June 2012
Dr. Kalliwoda Research GmbH | Update
Mainly because of the result of the planned unit sale within the segment AC revenues decreased by 18%. Framework orders for new product developments triggered the need for the investment in a new product platform. The connected upfront payments lead to a negative operating result of €-2.7m before impairment and restructuring charges.
Concluding from the below product development table Funkwerk AG managed to build substantial order backlog in 2011 where first revenue flows will come already in 2012. Within the next year several geograhpic market entries and new product placements are in the pipeline.
CURRENT SEGMENT DEVELOPMENT OVERVIEW
TCC SC AC
Infrastructure Rolling Stock Video Security Solutions Security Automotive
2011 Product Development and Orders
• DB follow-up order from for Allister SLI 4 in Bremen start 2013
• Orders for Allister SLI2 from five European countries
• DB Order of software migration of the eight operating centers to a new hardware platform in 09/2012 (PRISMA)
• DB order to provide control systems with modern interfaces
• Market entry of focX handhelds with an order of 2000# of ÖBB until 2016, 1st # Q1/2011
• First GSM-R orders from India (180#, 5y + after sale service), Turkey, Latvia
• DB order to upgrade audio information system at 50% main-line stations in GER
• Delivery of a 148 RIU ETCS train safety systems to Siemens
• Argoscan software with camera solution order for highway hard sholder lane release
• Large order from european central bank for full video surveillance system
• Expansion of existing order from Nürnberg for wireless LAN camera solution system enabling driverless operation of underground lines and surveillaince
• Power plant of RWE with personal emergency call system
• D4 Office handheld launch with telephony and messaging for all DECT networks
• ATEX certification for highest class of TETRA heandhelds, new orders of explosion-proof device by French energy supplier and Norway oil plattform
• Over 75% of personal emergency call systems tenders won
• Three new Orders for new product development amounting to €100m. 1) mobile integration units for car manufacturer 2) telematic devices for a lorry manufacturer 3) coupling chamber for car manufacturer to optimize mobile pohne reception
• Large Order from Telematik DeTeFleet: 6000 cars fore fleet management
• Innovation in Audi A3 antenna coupling
2011 Strategic Measures
• Focus on train and railway business
• Sale of Alpha Meß-Steuer-Regeltechnik GmbH
• Lean management production
• Restructuring measures in centralizing production (e.g. Cameras: closing Fürth moving it to Salzgitter), lean management, and purchasing
• 17 new international partners added
• Abandoning of aftersales-devision
• Reducing unit costs, optimizing inventory
Company Guidance
• Accreditation of Allister SIL2 in 2012
• New orders for Allister SIL2 & SIL4
• roll-out in Australia, France
• Market entry in US with “clean cab radio” in 2013
• Follow up orders from train manufacturers
• Sale of Funkwerk Information Technologies Karlsfeld GmbH
• Market entry of FAC960 (analog camera), VNS (LAN Transmission), OptiSave (video management system for small & midsized corporations), FAC 4000 IP into HD market
• Expansion of service and consulting busines
• Expansion of DECT OEM-business
• Placement of D4 Office
• Completion and market entry of Dect-over-IP-System
• Assertion of market dominance in penal facilities
• Compensor for various manufacturers
• Development of products for new orders (end 2013) and winning more manufacturers for these
• Sale of Funkwerk Avionics GmbH

8 Funkwerk AG | Update | June 2012
Dr. Kalliwoda Research GmbH | Update
4 Stock
Stock Price Performance Shareholder Structure
Source: ThomsonReutersKnowledge, Dr. Kalliwoda Research Source: Funkwerk AG
5 Conclusion
Funkwerk positioned itself in growth segments in areas of its core competencies where it enjoys a technology and market lead. The centralization of business activities will lead to greater efficiency. We view the EU wide modernization of railways, the megatrend of inside car usage of smart consumer electronics, as well as the company’s international expansion as the greatest value drivers for Funkwerk. In the short term the reorganization and international expansion resembles a challenge. In the medium term we expect Funkwerk to attain higher revenue growth and margins.
We lowered our outlook for the upcoming year mainly accounting for reorganization in line with management expectations.
As a result of the change in our estimates our DCF target price lowered to €4.52. Our peer group analysis leads to a fair value of €6.46. We give the DCF valuation a weight of 90% and the peer group valuation a weight of 10%. This leads to a final target price of €4.71. Applying our rating methodology and comparing the target price to the current stock price, leads to the recommendation “BUY”.
20,0%
40,0%
60,0%
80,0%
100,0%
120,0%
Funkwerk AG TecDax DAX
47,2%
52,8%
Float
HÖRMANN Funkwerk
Holding GmbH
Old 2012 New 2012 Old 2013 New 2013
Sales 219,8 166,21 227,5 179,51
EBIT 0,6 0,02 1,5 3,90
Estimate & Guidance (in €m)
2011 level
0
high single digit growth
positive
Our Estimate Our EstimateCompany Guidance
2012 2013
Company Guidance

9 Funkwerk AG | Update | June 2012
Dr. Kalliwoda Research GmbH | Update
6 FinancialStatements
6.1 ProfitandLossStatement
Profit & Loss Statement
Figures in mio. € 2007 2008 2009 2010 2011 2012e 2013e 2014e 2015e 2016e 2017e
Revenues 291 290 218 169 165 166 180 194 207 220 231Other Revenue 16 18 12 7 7 7 8 9 9 10 10Total Revenue 306 308 231 175 171 174 187 202 217 230 241Costs of Revenue (143) (137) (102) (82) (80) (80) (84) (89) (95) (101) (106)Labor Costs (92) (98) (92) (63) (62) (63) (68) (70) (73) (75) (77)Other Operating Expenses (42) (45) (68) (38) (34) (23) (24) (26) (28) (30) (31)Depreciation and Amortization (15) (16) (11) (7) (8) (8) (7) (8) (8) (9) (10)Operating Income 14 13 (43) (15) (13) 0 4 9 12 15 17Financial Profit / Loss (2) (2) (2) (2) (2) (0) (1) (1) (1) (1) (1)Earnings Before Taxes 12 11 (45) (17) (15) (0) 3 8 11 14 17Provisions for Income Tax (7) (3) 4 (6) (4) 0 (1) (2) (3) (4) (5)Net Incom After Taxes 6 8 (41) (23) (19) (0) 2 6 8 10 12Minority Interest 1 0 (0) 0 0 0 0 0 0 0 0Extraordinary Items and Adjustments 0 0 0 (2) 3 0 0 0 0 0 0Net Income 6 8 (41) (25) (16) (0) 2 6 8 10 12
Profit & Loss (Growth Rate YoY)
Revenues 20% (0%) (25%) (23%) (2%) 1% 8% 8% 7% 6% 5%Other Revenue 128% 12% (29%) (45%) (3%) 10% 8% 8% 7% 6% 5%Total Revenue 23% 0% (25%) (24%) (2%) 1% 8% 8% 7% 6% 5%Costs of Revenue 16% (5%) (26%) (19%) (3%) (0%) 6% 6% 7% 6% 5%Labor Costs 29% 6% (5%) (31%) (1%) 1% 7% 4% 3% 3% 2%Other Operating Expenses 36% 8% 53% (45%) (10%) (34%) 8% 8% 7% 6% 5%Depreciation and Amortization 20% 3% (27%) (38%) 11% 3% (9%) 8% 8% 7% 6%Operating Income 43% (8%) n.m. (65%) (12%) n.m. n.m. 129% 34% 24% 17%Financial Profit / Loss 576% (1%) 14% (24%) 33% (78%) 74% (22%) 0% (6%) (9%)Earnings Before Taxes 27% (10%) n.m. (63%) (8%) (97%) n.m. 170% 36% 25% 18%Provisions for Income Tax 138% (50%) n.m. n.m. (41%) n.m. n.m. 170% 36% 25% 18%Net Incom After Taxes (17%) 36% n.m. (44%) (17%) (98%) n.m. 170% 36% 25% 18%Minority Interest n.m. (64%) n.m. n.m. n.m. n.m. n.m. n.m. n.m. n.m. n.m.Extraordinary Items and Adjustments n.m. n.m. n.m. n.m. n.m. n.m. n.m. n.m. n.m. n.m. n.m.Net Income (6%) 27% n.m. (39%) (36%) (97%) n.m. 170% 36% 25% 18%
Profit & Loss (% of Total Revenues)
Revenues 95% 94% 95% 96% 96% 96% 96% 96% 96% 96% 96%Other Revenue 5% 6% 5% 4% 4% 4% 4% 4% 4% 4% 4%Total Revenue 100% 100% 100% 100% 100% 100% 100% 100% 100% 100% 100%Costs of Revenue (47%) (44%) (44%) (47%) (47%) (46%) (45%) (44%) (44%) (44%) (44%)Labor Costs (30%) (32%) (40%) (36%) (36%) (36%) (36%) (35%) (34%) (33%) (32%)Other Operating Expenses (14%) (15%) (30%) (21%) (20%) (13%) (13%) (13%) (13%) (13%) (13%)Depreciation and Amortization (5%) (5%) (5%) (4%) (5%) (5%) (4%) (4%) (4%) (4%) (4%)Operating Income 5% 4% (19%) (9%) (8%) 0% 2% 4% 6% 6% 7%Financial Profit / Loss (1%) (1%) (1%) (1%) (1%) (0%) (0%) (0%) (0%) (0%) (0%)Earnings Before Taxes 4% 4% (19%) (9%) (9%) (0%) 2% 4% 5% 6% 7%Provisions for Income Tax (2%) (1%) 2% (3%) (2%) 0% (0%) (1%) (2%) (2%) (2%)Net Incom After Taxes 2% 3% (18%) (13%) (11%) (0%) 1% 3% 4% 4% 5%Minority Interest 0% 0% (0%) 0% 0% 0% 0% 0% 0% 0% 0%Extraordinary Items and Adjustments 0% 0% 0% (1%) 2% 0% 0% 0% 0% 0% 0%Net Income 2% 3% (18%) (14%) (9%) (0%) 1% 3% 4% 4% 5%
Dr. Kalliwoda | Research © 2012
Fiscal Year

10 Funkwerk AG | Update | June 2012
Dr. Kalliwoda Research GmbH | Update
6.2 Balance Sheet
Balance Sheet
Figures in mio. € 2007 2008 2009 2010 2011 2012e 2013e 2014e 2015e 2016e 2017e
Assets
Current assets
Cah and Cash Equivalents 18 25 22 12 17 22 19 21 24 30 38Short Term Investments 1 1 1 4 12 9 9 9 9 9 9Receivables 75 74 44 36 39 32 34 37 40 42 44Inventory 52 46 43 44 36 29 31 33 35 37 39Prepaid Expenses 0 2 1 1 0 1 1 1 1 1 1Other Current Assets 5 4 3 4 17 3 3 3 3 3 4
Sum current assets 150 153 114 100 121 95 97 103 112 122 135
Non-current assets
Property, Plant and Equipment 19 19 17 14 12 8 8 9 10 10 11Intangible Assets 46 28 23 26 19 21 23 25 27 28 30Goodwill 0 19 10 9 5 5 5 5 5 5 5Long Term Investments 0 0 2 0 0 0 0 0 0 0 0Defered Income Taxes 13 0 2 0 0 0 0 0 0 0 0Other Long Term Assets 0 0 0 0 0 0 0 0 0 0 0
Sum Non-Current Assets 77 67 54 50 37 35 37 39 42 44 46
Total Assets 227 220 168 150 158 130 133 142 153 166 180
Equity and Liabilities
Current Liabilities Accounts Payable 29 34 23 29 28 24 28 30 32 34 35Accruals 19 20 22 26 21 21 22 23 24 24 25Short Term Debt 2 0 2 0 13 19 13 13 13 13 13Other Current Liabilities 27 19 17 15 33 3 3 3 3 4 4
Sum Current Liabilities 77 74 65 71 95 66 66 69 72 75 77
Non-Current Liabilities
Non-Current Loans 0 0 0 0 0 0 2 2 2 2 2Deferred Tax Liabilities 15 3 0 1 1 1 1 1 1 1 1Other Non-Current Liabilities 12 14 14 13 13 14 14 14 14 14 14
Sum Non-Current Liabilities 27 17 14 14 14 15 17 17 17 17 17
Shareholders' Equity Subscribed Capital 71 71 71 72 72 72 72 72 72 72 72Retained earnings 53 59 18 -7 -23 -23 -21 -15 -7 3 14Other Equity 0 0 0 0 0 0 0 0 0 0 0
Sum Equity 123 130 89 64 49 48 51 56 64 74 86
Total Equity and Liabilities 227 220 168 150 158 129 133 14 2 153 166 180
Dr. Kalliwoda | Research © 2012
Fiscal Year

11 Funkwerk AG | Update | June 2012
Dr. Kalliwoda Research GmbH | Update
6.3 Cash Flow Statement
Cash Flow Statement
Figures in mio. € 2007 2008 2009 2010 2011 2012e 2013e 2014e 2015e 2016e 2017e
1. Cash from Operating Activities
Net Profit before Tax 12 11 (45) (17) (15) (0) 3 8 11 14 17
Amortization and Depreciation 15 16 22 11 13 8 7 8 8 9 10Non-cash Items (2) (0) 8 17 (3) 0 0 0 0 0 0Change in Working Capital (15) (0) 22 (7) (1) (10) 1 (4) (5) (6) (6)
Cash from Operating Activities 15 26 7 4 (6) (2) 12 12 15 18 20
2. Cash from Investment Activities
Capital Expenditures (20) (20) (15) (12) (11) (10) (10) (10) (11) (11) (12)Other Investing Cash Flow Items (9) 5 2 (1) 11 11 0 0 0 0 0
Cash from Investment Activities (30) (15) (12) (13) (1) 1 (10) (10) (11) (11) (12)
3. Cash from Finacing Activities
Financing Cash Flow Items 0 (0) 0 0 0 (0) (1) (1) (1) (1) (1)Dividends Paid Out (3) (2) 0 0 0 0 0 0 0 0 0Issuance (Retirement) of Stock -- -- -- 0 0 0 0 0 0 0 0Issuance (Retirement) of Debt 2 (2) 2 (2) 12 6 (4) 0 0 0 0
Cash from Finacing Activities (1) (4) 2 (2) 12 6 (5) (0) (1) (1) (1)
4. Cash at End of Period
Foreign Exchange Effects 0 0 0 0 0 0 0 0 0 0 0Changes in Cash (16) 8 (3) (10) 6 5 (3) 2 4 6 8Cash at Beginning of Period 34 18 25 22 12 18 23 20 21 25 31Cash at End of Period 18 25 22 12 18 23 20 21 25 31 39
Dr. Kalliwoda | Research © 2012
Fiscal Year
12 Funkwerk AG | Update | June 2012
Dr. Kalliwoda Research GmbH | Update
7 Valuation
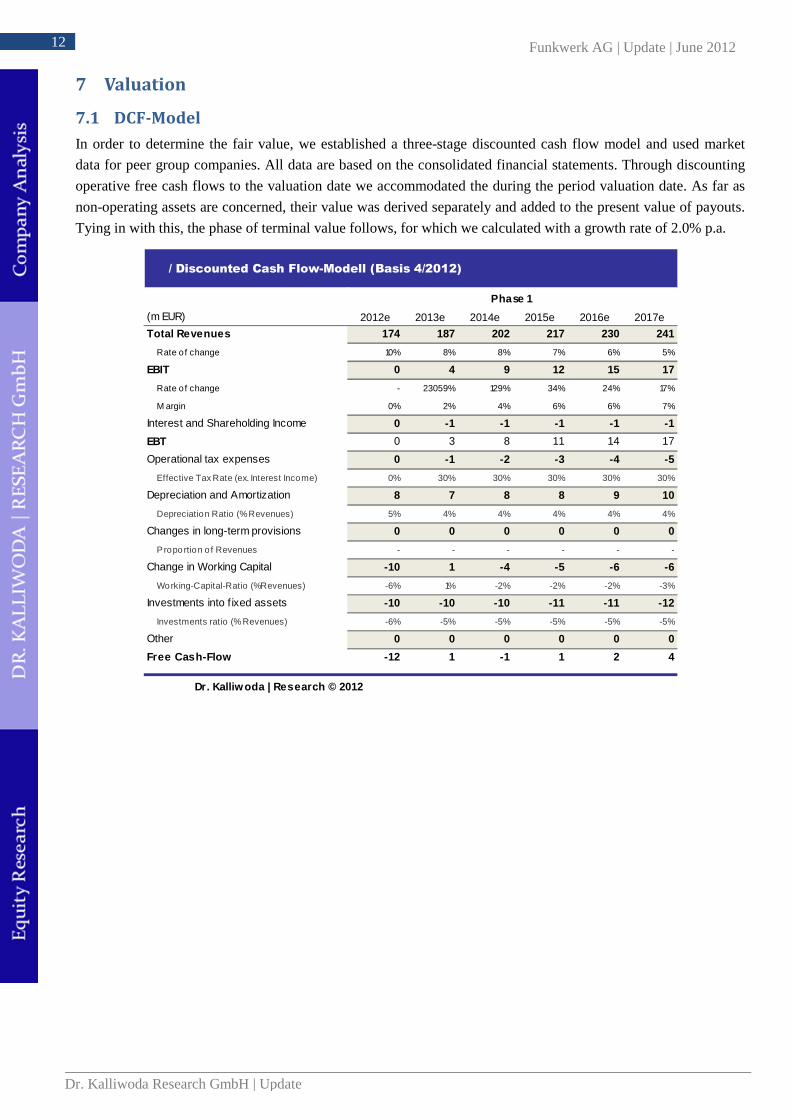
7.1 DCF-Model In order to determine the fair value, we established a three-stage discounted cash flow model and used market
data for peer group companies. All data are based on the consolidated financial statements. Through discounting
operative free cash flows to the valuation date we accommodated the during the period valuation date. As far as
non-operating assets are concerned, their value was derived separately and added to the present value of payouts.
Tying in with this, the phase of terminal value follows, for which we calculated with a growth rate of 2.0% p.a.
/ Discounted Cash Flow-Modell (Basis 4/2012)
Phase 1
(m EUR) 2012e 2013e 2014e 2015e 2016e 2017e
Total Revenues 174 187 202 217 230 241
Rate of change 10% 8% 8% 7% 6% 5%
EBIT 0 4 9 12 15 17
Rate of change - 23059% 129% 34% 24% 17%
M argin 0% 2% 4% 6% 6% 7%
Interest and Shareholding Income 0 -1 -1 -1 -1 -1
EBT 0 3 8 11 14 17
Operational tax expenses 0 -1 -2 -3 -4 -5
Effective Tax Rate (ex. Interest Income) 0% 30% 30% 30% 30% 30%
Depreciation and Amortization 8 7 8 8 9 10
Depreciation Ratio (% Revenues) 5% 4% 4% 4% 4% 4%
Changes in long-term provisions 0 0 0 0 0 0
P roportion o f Revenues - - - - - -
Change in Working Capital -10 1 -4 -5 -6 -6
Working-Capital-Ratio (%Revenues) -6% 1% -2% -2% -2% -3%
Investments into f ixed assets -10 -10 -10 -11 -11 -12
Investments ratio (% Revenues) -6% -5% -5% -5% -5% -5%
Other 0 0 0 0 0 0
Free Cash-Flow -12 1 -1 1 2 4
Dr. Kalliwoda | Research © 2012

13 Funkwerk AG | Update | June 2012
Dr. Kalliwoda Research GmbH | Update
7.2 WACC
The discount rate was calculated by deriving the weighted average cost of capital. We assume that the target capital structure will not change in the subsequent business years.
Adjustments for debt to current interest were not made. Risk free
profitability is based on the average profitability of the 30-year
Treasury bond.
Figuring a risk prime follows the capital asset pricing model
(CAPM) and covers in particular the systemic risks (market risk
prime esp. company specific risk). The beta value we used to
identify the company specific risk is based on the performance of
the reference index DAX.
7.3 Fair Value – Sensitivities
The modification of the action parameter in terminal value is shown below in the sensitivity analysis. It shows
variance in our derived fair value in variant scenarios.
Sensitivity analysis Fair value per share Sensitivity analysis Market capitalization( EUR) Discount rate (EUR m) Discount rate
ß = 1,2 9,46% 9,71% 9,96% 10,21% 10,46% ß = 1,2 9,46% 9,71% 9,96% 10,21% 10,46%1,0% 4,62 4,48 4,34 4,21 4,09 1,0% 37 36 35 34 331,5% 4,72 4,57 4,42 4,29 4,16 1,5% 38 37 36 35 342,0% 4,84 4,67 4,52 4,37 4,24 2,0% 39 38 36 35 342,5% 4,97 4,79 4,62 4,47 4,32 2,5% 40 39 37 36 353,0% 5,12 4,92 4,75 4,58 4,42 3,0% 41 40 38 37 36
Gro
th
Gro
th
WACC Assumptions
Growth Propositions
Long-Term grow th rate / Inflation 2,0%
Assimilation Phase (from 2015) 5 Jahre
Revenue grow th in the beginning 5,0%
Margin development (p.a.) +1 BP
Equity Cost
Long-Term risk-free rate 4,5%
Market Risk Premium 6,0%
Beta of the Company 1,20
Equity Cost 11,7%
Debt Cost
Debt Cost (before tax) 8,0%
Tax rate on Debt interest 30,0%
Debt Cost (after tax) 5,6%
Equity Value 32
Market Value of Debt 13
Gearing (Market Values) 40,1%
WACC 9,96%
14 Funkwerk AG | Update | June 2012
Dr. Kalliwoda Research GmbH | Update
7.4 Peer Group Analysis
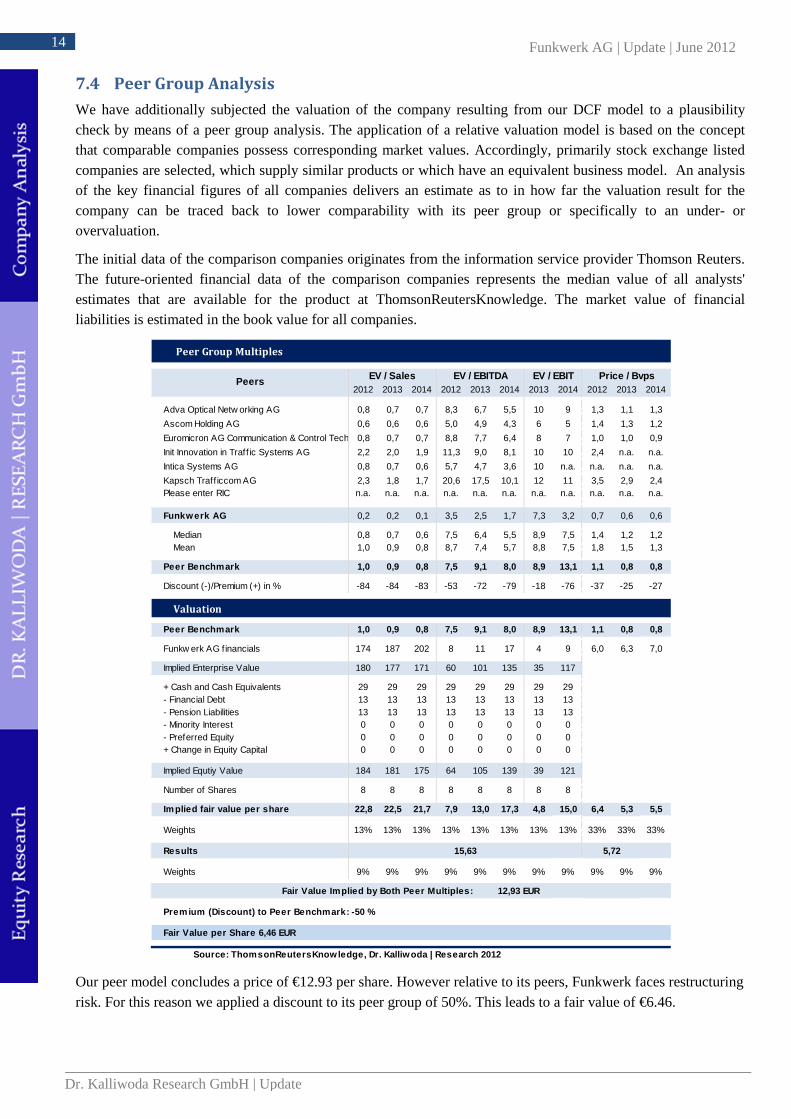
We have additionally subjected the valuation of the company resulting from our DCF model to a plausibility check by means of a peer group analysis. The application of a relative valuation model is based on the concept that comparable companies possess corresponding market values. Accordingly, primarily stock exchange listed companies are selected, which supply similar products or which have an equivalent business model. An analysis of the key financial figures of all companies delivers an estimate as to in how far the valuation result for the company can be traced back to lower comparability with its peer group or specifically to an under- or overvaluation.
The initial data of the comparison companies originates from the information service provider Thomson Reuters. The future-oriented financial data of the comparison companies represents the median value of all analysts' estimates that are available for the product at ThomsonReutersKnowledge. The market value of financial liabilities is estimated in the book value for all companies.
Our peer model concludes a price of €12.93 per share. However relative to its peers, Funkwerk faces restructuring risk. For this reason we applied a discount to its peer group of 50%. This leads to a fair value of €6.46.
Peer Group Multiples
2012 2013 2014 2012 2013 2014 2013 2014 2012 2013 2014
Adva Optical Netw orking AG 0,8 0,7 0,7 8,3 6,7 5,5 10 9 1,3 1,1 1,3
Ascom Holding AG 0,6 0,6 0,6 5,0 4,9 4,3 6 5 1,4 1,3 1,2
Euromicron AG Communication & Control Technology0,8 0,7 0,7 8,8 7,7 6,4 8 7 1,0 1,0 0,9
Init Innovation in Traff ic Systems AG 2,2 2,0 1,9 11,3 9,0 8,1 10 10 2,4 n.a. n.a.
Intica Systems AG 0,8 0,7 0,6 5,7 4,7 3,6 10 n.a. n.a. n.a. n.a.
Kapsch Traff iccom AG 2,3 1,8 1,7 20,6 17,5 10,1 12 11 3,5 2,9 2,4Please enter RIC n.a. n.a. n.a. n.a. n.a. n.a. n.a. n.a. n.a. n.a. n.a.
Funkwerk AG 0,2 0,2 0,1 3,5 2,5 1,7 7,3 3,2 0,7 0,6 0,6
Median 0,8 0,7 0,6 7,5 6,4 5,5 8,9 7,5 1,4 1,2 1,2Mean 1,0 0,9 0,8 8,7 7,4 5,7 8,8 7,5 1,8 1,5 1,3
Peer Benchmark 1,0 0,9 0,8 7,5 9,1 8,0 8,9 13,1 1,1 0,8 0,8
Discount (-)/Premium (+) in % -84 -84 -83 -53 -72 -79 -18 -76 -37 -25 -27
Valuation
Peer Benchmark 1,0 0,9 0,8 7,5 9,1 8,0 8,9 13,1 1,1 0,8 0,8
Funkw erk AG f inancials 174 187 202 8 11 17 4 9 6,0 6,3 7,0
Implied Enterprise Value 180 177 171 60 101 135 35 117
+ Cash and Cash Equivalents 29 29 29 29 29 29 29 29- Financial Debt 13 13 13 13 13 13 13 13- Pension Liabilities 13 13 13 13 13 13 13 13- Minority Interest 0 0 0 0 0 0 0 0- Preferred Equity 0 0 0 0 0 0 0 0+ Change in Equity Capital 0 0 0 0 0 0 0 0
Implied Equtiy Value 184 181 175 64 105 139 39 121
Number of Shares 8 8 8 8 8 8 8 8
Implied fair value per share 22,8 22,5 21,7 7,9 13,0 17,3 4,8 15,0 6,4 5,3 5,5
Weights 13% 13% 13% 13% 13% 13% 13% 13% 33% 33% 33%
Results
Weights 9% 9% 9% 9% 9% 9% 9% 9% 9% 9% 9%
Source: ThomsonReutersKnow ledge, Dr . Kalliwoda | Research 2012
Premium (Discount) to Peer Benchmark: -50 %
Fair Value per Share 6,46 EUR
Fair Value Implied by Both Peer Multiples: 12,93 EUR
5,72
Peers EV / Sales EV / EBITDA EV / EBIT Price / Bvps
15,63

15 Funkwerk AG | Update | June 2012
Dr. Kalliwoda Research GmbH | Update
8 Contact
Funkwerk AG Im Funkwerk 5 D-99625 Köl leda/Thüringen
Phone: + 49 (0) 3635 – 600 - 346 Telefax: + 49 (0) 3635 – 600 - 507 Head of IR: Jörg Reichenbach E-Mail : i [email protected]
Primary Research │Fair Value Analysis │International Roadshows
Rüsterstraße 4a 60325 Frankfurt Tel.: 069-97 20 58 53 www.kalliwoda.com
Head: Dr. Norbert Kalliwoda E-Mail: [email protected]
CEFA-Analyst; University of Frankfurt/Main; PhD in Economics; Dipl.-Kfm.
Sectors: IT, Software, Electricals & Electronics, Mechanical Engineering, Logistics, Laser, Technology, Raw Materials
Sven Bedbur E-Mail: [email protected]
Dipl.-Kfm. Analyst; University of Frankfurt/Main
Sectors: IT Services & Software, Financial Services, Mining & Exploration
Michael John E-Mail: [email protected]
Dipl.-Ing. (Aachen) Sectors: Chemicals, Chemical Engineering, Basic Metals, Renewable Energies, Laser/Physics
Dr. Thomas Krassmann E-Mail: [email protected]
Dipl.-Geologist, M.Sc.;University of Göttingen & Rhodes University, South Africa;
Sectors: Raw Materials, Mining, Precious Metals, Gem stones.
Maximilian F. Kaessens E-Mail: [email protected]
Bachelor of Science in Business Administration (Babson College (05/2012), Babson Park, MA (US))
Sectors: Financials, Real Estate
Dr. Christoph Piechaczek E-Mail: [email protected]
Dipl.-Biologist; Technical University Darmstadt; Univ. Witten-Herdecke.
Sectors: Biotech & Healthcare; Medical Technology Pharmaceutical
Dr. Erik Schneider E-Mail: [email protected]
Dipl.-Biologist; Technical University Darmstadt; Univ. Hamburg.
Sectors: Biotech & Healthcare; Medical Technology Pharmaceutical
David Schreindorfer E-Mail: [email protected]
MBA, Economic Investment Management; Univ. Frankfurt/ Univ. Iowa (US).
Sectors: IT/Logistics; Quantitative Modelling
Hellmut Schaarschmidt; E-Mail: [email protected]
Dipl.-Geophysicists; University of Frankfurt/Main.
Sectors: Oil, Regenerative Energies, Specialities Chemicals, Utilities
Robin-Andreas Braun E-Mail: [email protected]
Junior-Analyst; University of Frankfurt/Main (2012)
Sectors: Support Research and Quantitative Approach
Patrick Bellmann E-Mail: [email protected]
Junior-Analyst; WHU - Otto Beisheim School of Management, Vallendar (2012)
Sectors: Support Research and Quantitative Approach
Nele Rave E-Mail: [email protected]
Lawyer; Native Speaker, German School London,
Translations English
Also view Sales and Earnings Estimates: DR. KALLIWODA │ RESEARCH on Terminals of Bloomberg, Thomson Reuters, vwd group and Factset
Analyst of this research: Dr. Norbert Kalliwoda, CEFA
16 Funkwerk AG | Update | June 2012
Dr. Kalliwoda Research GmbH | Update
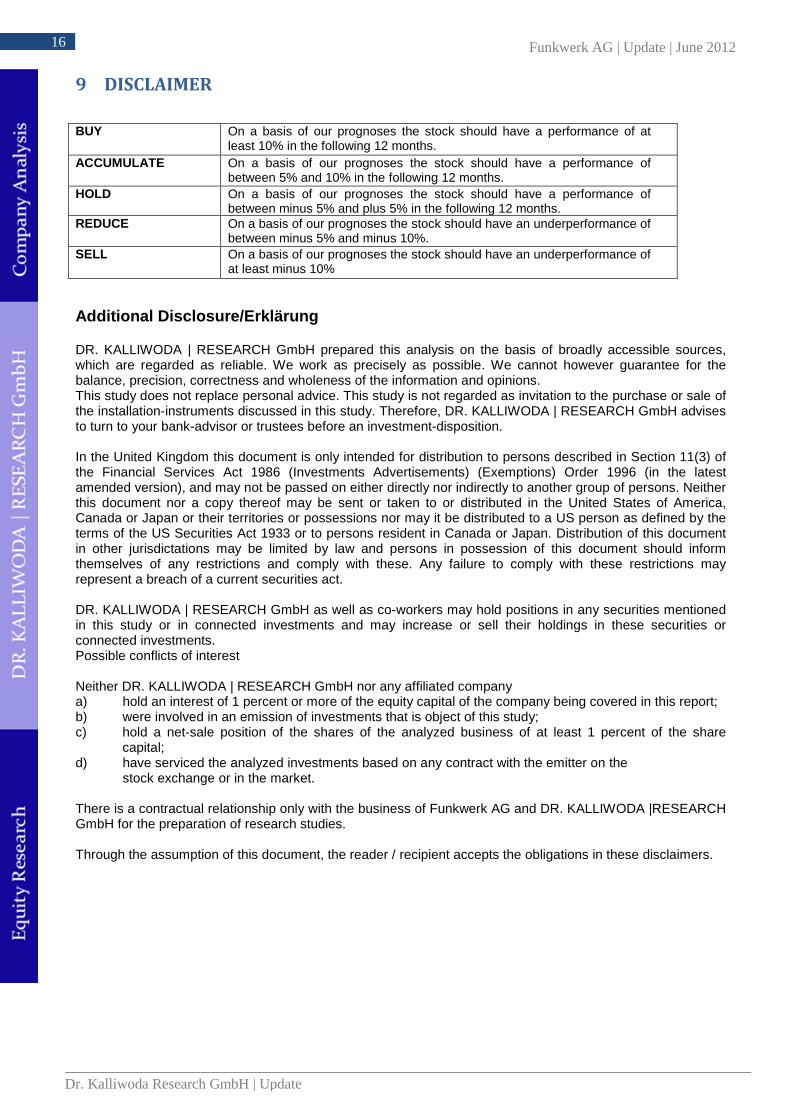
9 DISCLAIMER
BUY On a basis of our prognoses the stock should have a performance of at least 10% in the following 12 months.
ACCUMULATE On a basis of our prognoses the stock should have a performance of between 5% and 10% in the following 12 months.
HOLD On a basis of our prognoses the stock should have a performance of between minus 5% and plus 5% in the following 12 months.
REDUCE On a basis of our prognoses the stock should have an underperformance of between minus 5% and minus 10%.
SELL On a basis of our prognoses the stock should have an underperformance of at least minus 10%
Additional Disclosure/Erklärung DR. KALLIWODA | RESEARCH GmbH prepared this analysis on the basis of broadly accessible sources, which are regarded as reliable. We work as precisely as possible. We cannot however guarantee for the balance, precision, correctness and wholeness of the information and opinions. This study does not replace personal advice. This study is not regarded as invitation to the purchase or sale of the installation-instruments discussed in this study. Therefore, DR. KALLIWODA | RESEARCH GmbH advises to turn to your bank-advisor or trustees before an investment-disposition. In the United Kingdom this document is only intended for distribution to persons described in Section 11(3) of the Financial Services Act 1986 (Investments Advertisements) (Exemptions) Order 1996 (in the latest amended version), and may not be passed on either directly nor indirectly to another group of persons. Neither this document nor a copy thereof may be sent or taken to or distributed in the United States of America, Canada or Japan or their territories or possessions nor may it be distributed to a US person as defined by the terms of the US Securities Act 1933 or to persons resident in Canada or Japan. Distribution of this document in other jurisdictations may be limited by law and persons in possession of this document should inform themselves of any restrictions and comply with these. Any failure to comply with these restrictions may represent a breach of a current securities act. DR. KALLIWODA | RESEARCH GmbH as well as co-workers may hold positions in any securities mentioned in this study or in connected investments and may increase or sell their holdings in these securities or connected investments. Possible conflicts of interest Neither DR. KALLIWODA | RESEARCH GmbH nor any affiliated company a) hold an interest of 1 percent or more of the equity capital of the company being covered in this report; b) were involved in an emission of investments that is object of this study; c) hold a net-sale position of the shares of the analyzed business of at least 1 percent of the share
capital; d) have serviced the analyzed investments based on any contract with the emitter on the stock exchange or in the market. There is a contractual relationship only with the business of Funkwerk AG and DR. KALLIWODA |RESEARCH GmbH for the preparation of research studies. Through the assumption of this document, the reader / recipient accepts the obligations in these disclaimers.

17 Funkwerk AG | Update | June 2012
Dr. Kalliwoda Research GmbH | Update
DISCLAIMER
The information and opinions in this analysis were prepared by DR. KALLIWODA | RESEARCH GmbH. The information herein is believed by DR. KALLIWODA | RESEARCH GmbH to be reliable and has been obtained from public sources believed to be reliable. With the exception of information about DR. KALLIWODA | RESEARCH GmbH, DR. KALLIWODA | RESEARCH GmbH makes no representation as to the accuracy or completeness of such information. Opinions, estimates and projections in this report constitute the current judgement of the author as of the date of this analysis. They do not necessarily reflect the opinions, projection, forecast or estimate set forth herein, changes or subsequently becomes inaccurate, except if research on the subject company is withdrawn. Prices and availability of financial instruments also are subject to change without notice. This report is provided for informational purposes only. It is not to be construed as an offer to buy or sell or a solicitation of an offer to buy or sell any financial instruments or to participate in any particular trading strategy in any jurisdiction. The financial instruments discussed in this report may not be suitable for all investors and investors must make their own investment decision using their own independent advisors as they believe necessary and based upon their specific financial situations and investment objectives. If a financial instrument is denominated in a currency other than an investor´s currency, a change in exchange rates may adversely affect the price or value of, or the income derived from, the financial instrument, and such investor effectively assumes currency risk. In addition, income from an investment may fluctuate and the price or value of financial instruments described in this report, either directly or indirectly, may rise or fall. Furthermore, past performance is not necessarily indicative of future results. This report may not be reproduced, distributed or published by any person for any purpose without DR. KALLIWODA | RESEARCH GmbH´s prior written consent. Please cite source when quoting.