buy aarti drugs pharma 15 january 201 8...cagr over fy17-fy20e. the company also supplies specialty...
TRANSCRIPT

In the interest of timeliness, this document is not edited.
Centrum Equity Research is available on Bloomberg, Thomson Reuters and Fact Set
Benefits of economies of scale We initiate coverage on Aarti Drugs (ADL), with Buy rating and TP of Rs940 (25% upside). ADL is a leading player in the domestic APIs and markets over 30 products. The company has strong presence in Asia, Latin America, Europe and Africa. ADL is the market leader in Ciprofloxacin, Metronidazole and Celecoxib in the domestic market. We expect ADL to achieve 14% revenue, 15% EBITDA and 19% net profit CAGR over FY17-FY20E. The company also supplies Specialty Chemicals and intermediates for APIs. We have valued the stock on our conservative 5-year AOCF/EV yield of 4.15% to arrive at target price of Rs940. Key risks to our assumptions include slowdown of the domestic pharma market and regulatory issues for its manufacturing facilities.
� Leading domestic player: ADL is a leading supplier of APIs and intermediates and derives 64% of its revenues from domestic market and 36% from exports. Its exports are to Asia (47% export revenues), L. America (28%), Europe (17%), Africa (7%) and N. America (1%). ADL has entered in the manufacture of formulations as forward integration strategy and derives 13% revenues from the formulation business. The company has strong presence in anti-infective, anti-diabetic, NSAIDs and gastro-intestinal segments with a range of products. ADL offers a basket of over 30 APIs and 10 intermediates and has developed a pipeline of 30 new APIs over last 5 years. The increase in capacity for Ciprofloxacin and Metformin would benefit the company. We expect the company to perform well due to overall growth across geographies and benefits of economies of scale.
� EBIDTA to expand at 15% CAGR: We expect 15% CAGR in EBIDTA during FY17-FY20E due to good growth of its existing products, new product launches and over 75% capacity utilisation. We expect the company’s EBIDTA margin to decline from 15.8% in FY17 to 15.5% in FY18 due to GST issues and increase to 16.5% in FY20. The margin improvement in FY19 and FY20 would be due to the change in product mix, additional capacities of Ciprofloxacin and Metformin, economies of scale, high margin new product introduction and expected reduction in the material cost. ADL has commenced the manufacture of an intermediate of Ciprofloxacin which would significantly reduce the material cost of Ciprofloxacin.
� Net profit to grow at 19% CAGR: We expect ADL’s net profit to grow by 19%CAGR during FY17-FY20E due to strong sales growth and margin expansion. We expect ADL to benefit from its presence over the entire pharma value chain. The appreciation of rupee against dollar is likely to reduce imported raw material cost. However, it would impact export revenues.
� Valuation and key risks: We see strong scope for re-rating and ADL using our conservative five-year AOCF/EV yield method to arrive at a TP of Rs940, implying an upside of 25% over CMP. We expect the company to report RoE of 23% and RoCE of 15% for FY20. ADL outscores many of its peers due to its efficacious presence in the domestic and emerging markets and its integration across the value chain. Key risks to our call include slowdown in the domestic market and regulatory risks for its manufacturing facilities located at Tarapur, Sarigam and Baddi.
Target Price Rs940 Key Data
Bloomberg Code ARTD IN
CMP* Rs755 Curr Shares O/S (mn) 23.9 Diluted Shares O/S(mn) 23.9 Upside (Downside) 25% Mkt Cap (Rsbn/USDmn) 18/284.1
Price Performance (%)* 52 Wk H / L (Rs) 785/447.8
1M 6M 1Yr 5 Year H / L (Rs) 874.9/64.7
ARTD IN 37.1 37.3 21.7 Daily Vol. (3M NSE Avg.) 29800
Nifty 4.3 9.0 28.3
*as on 12th January 2018, Source: Bloomberg, Centrum Research
Shareholding pattern (%)*
Sept’17 June’17 Mar’17 Dec'16
Promoter 62.5 62.7 62.5 62.3
FIIs 4.5 4.5 4.5 4.1
DIIs 0.7 0.7 0.7 0.6
Others 32.3 32.1 32.3 33.0
Source: BSE, *as on 12th January 2018
Trend in EBIDTA margin (%)
Source: Company, Centrum Research Estimates
RoCE and RoE %
Source: Company, Centrum Research Estimates
Rannjit Kapadia, [email protected]; 91 22 4215 9645
Y/E Mar (Rs mn) Revenue YoY (%) EBIDTA EBIDTA (%) Adj. PAT YoY (%) DEPS Rs. RoE (%) RoCE (%) P/E (x) EV/EBIDTA (x)
FY16 11,349 3.7 1,748 15.4 686 (11.1) 29.3 20.6 12.8 20.2 10.8
FY17 11,952 5.3 1,891 15.8 805 17.3 34.4 21.0 12.4 16.2 9.4
FY18E 12,001 0.4 1,860 15.5 793 (1.5) 33.9 18.2 10.8 16.0 9.3
FY19E 14,769 23.1 2,375 16.1 1,065 34.3 45.6 21.3 12.9 16.6 9.4
FY20E 17,542 18.8 2,898 16.5 1,338 25.6 57.2 22.8 14.6 13.2 7.7
Source: Company Reports, Centrum Research Estimates
12
13
14
15
16
17
18
0
500
1000
1500
2000
2500
3000
3500
FY08
FY09
FY10
FY11
FY12(s)
FY13(s)
FY14(s)
FY15
FY16
FY17
FY18E
FY19E
FY20E
RS m
nEBIDTA EBIDTA margin % - RHS
0
5
10
15
20
25
30
FY08
FY09
FY10
FY11
FY12(s)
FY13(s)
FY14(s)
FY15
FY16
FY17
FY18E
FY19E
FY20E
Rs mn
RoCE % RoE %
Pharma Initiating Coverage 15 January 2018
INDIA
BUY Aarti Drugs

2 Aarti Drugs
Table of Contents
Presence over the entire value chain ............................................................................................................... 3
Balanced business model ................................................................................................................................................................... 3
Company Evolution .............................................................................................................................................................................. 5
Major products marketed ................................................................................................................................................................... 6
Capacity Expansion .............................................................................................................................................................................. 7
Margin Expansion ................................................................................................................................................................................. 7
Major growth drivers ........................................................................................................................................................................... 8
Import Alert-US FDA ............................................................................................................................................................................ 8
Global markets-good future potential .......................................................................................................... 10
Leading supplier of APIs to MNC pharma ..................................................................................................... 10
New Products –Growth Drivers ...................................................................................................................... 11
Infrastructure-complying global standards .................................................................................................. 11
World class manufacturing facilities ............................................................................................................................................. 11
Quality control-complying global standards ........................................................................................................................... 11
R & D-company’s backbone ............................................................................................................................................................. 12
Effluent Treatment- preserving ecology ..................................................................................................................................... 12
Global API Industry structure ......................................................................................................................... 13
Global market-growth driven by pharmerging countries ..................................................................................................... 13
Domestic market ................................................................................................................................................................................. 13
SWOT analysis .................................................................................................................................................. 13
Competition-domestic & global ..................................................................................................................... 14
Subsidiary –forward integration .................................................................................................................... 14
Financial Analysis ............................................................................................................................................ 15
Strong growth of revenues, profitability and cash flow ........................................................................................................ 15
Margin improvement ......................................................................................................................................................................... 15
Net profit improvement .................................................................................................................................................................... 17
Capex-backbone of future growth ................................................................................................................................................ 17
Capex-future plans ............................................................................................................................................................................. 18
The year wise details of the capex are as follows: .................................................................................................................... 18
Intangibles ............................................................................................................................................................................................. 19
Buyback of shares ............................................................................................................................................................................... 19
Working Capital Cycle improvement ........................................................................................................................................... 19
Interest cost-likely to increase ........................................................................................................................................................ 20
Foreign Exchange Exposure ............................................................................................................................................................ 20
Quarterly Financials ........................................................................................................................................ 21
Q2FY18- Performance affected by GST ....................................................................................................................................... 21
Valuations, recommendation and risks ......................................................................................................... 23
Cash flow method ............................................................................................................................................................................... 23
P/E method ............................................................................................................................................................................................ 23
Upside possibilities ............................................................................................................................................................................. 24
Business Risks ....................................................................................................................................................................................... 24
Company Background ..................................................................................................................................... 25
Corporate Governance-highlighting the finer points .................................................................................. 26
Independent directors’ representation on the company board ......................................................................................... 26
Compensation to promoters of ADL ............................................................................................................................................ 26
Independent directors profile and compensation .................................................................................................................. 27
Related party transactions ............................................................................................................................................................... 27
Contingent liabilities .......................................................................................................................................................................... 27
Promoter ownership trend .............................................................................................................................................................. 28
Auditors .................................................................................................................................................................................................. 29
Annexures ........................................................................................................................................................ 30
Financials – consolidated-historical .............................................................................................................. 32
Financials -consolidated ................................................................................................................................. 33

3 Aarti Drugs
Presence over the entire value chain
Balanced business model
Aarti Drugs (ADL) has presence over the entire pharma value chain starting from chemicals to Intermediates to API and formulations. Being present over the entire value chain, the company derives benefits of vertical integration and hence can compete in the domestic and global markets. The company currently manufactures and markets over 30 APIs, ~ 20 Specialty Chemicals and Intermediates of 10 APIs. It has core competency in the manufacture of APIs. ADL has presence in over 10 therapeutic segments as a de-risking strategy. The list of Specialty Chemicals marketed by ADL is in Appendix-1.
Being a major player in API, the company commenced the manufacture of formulations as forward integration strategy. For FY17, ADL derived 81% of its revenues from API, 13% from Formulations, 3% from Intermediates and 3% from Specialty Chemicals. Hence, the majority of revenue of 81% is derived from the API business. The increase in capacities for Ciprofloxacin and Metformin would enhance its API revenues. We expect the increase in formulation business due to additional capacities and value addition for its customers. ADL has developed 30 new APIs through its R & D efforts which would get commercialised in future. Moreover, the company is working on import substitution. These initiatives would increase the overall margin of the company. The details of the sales composition in FY17 are shown in the following chart:
Exhibit 1: Sales Composition-FY17
Source: Company Reports
ADL has presence in over ten therapeutic segments namely: anti-infective, antidiarrheal, anti-inflammatory (NSAIDs), anti-fungal, anti-diabetic and CVS. Out of these anti-fungal, anti-diabetic and CVS are lifestyle segments having good growth. ADL has developed various APIs over the years based on the demand forecast, technological development, product quality, competition and profitability. The company has created capacities to cater the domestic and global demand in these segments.
ADL derived 39% of its revenues from anti-infective segment, 21% from the antidiarrheal segment and 12% from anti-inflammatory segments. These three segments collectively contributed 72% of the FY17 revenues. The choice of therapeutic segments was based on the demand forecast, availability of cost effective technology, competing products and payback period. The therapeutic segment wise sales composition for FY17 was as follows:
81%
13%3% 3%
API
Formulations
Specialty Chemicals
Intermediates

4 Aarti Drugs
Exhibit 2: Therapeutic category wise sales-FY17
Source: Company Reports
ADL has a balanced business model and has strong presence in the domestic pharma market (64% of revenues) and global markets (36% of revenues). The company has global footprints in Asia, Latin America Europe and African pharma markets. Having presence over the entire value chain, several therapeutic categories and presence in over 100 global markets with over 300 customers, ADL is not dependent on any particular therapeutic category, geography or customer. For FY17, ADL derived 64% of its revenues from the domestic market and 36% from exports. The same has been indicated in the following chart:
Exhibit 3: Export revenues-FY17
Source: Company Reports
The company derived 47% of its export revenues from Asia, 28% from Latin America, 17% from Europe, 7% from Africa and 1% from N. America in FY17. These four major regions contributed 99% of exports of ADL in FY17. The company currently exports its goods to over 100 countries globally and hence has low dependence on any particular country. ADL derived 1% of its revenue from N. America as its manufacturing facility at Tarapur is under Import Alert by US FDA from March’15. The following chart shows ADL’s region wise exports in FY17 to major export destinations:
39%
21%
12%
7%
8%
5%
8%
Antiinfective
Antidiarrheal
Anti-inflammatory
Anti fungal
Anti-diabetic
CVS
Others
64%
36%
Domestic
Exports

5 Aarti Drugs
Exhibit 4: Region wise Exports-FY17
Source: Company Reports
Company Evolution
Background: ADL was set up in 1984 by the promoters who were classmates graduated in Chemical Engineering from University Department of Chemical Technology (UDCT), Mumbai. Being technocrats, the promoters were able to develop non-infringing, cost efficient manufacturing processes for several APIs namely Metronidazole, Metronidazole benzoate, Niacin, Niacinamide (vitamin B6) etc. During that period, majority of APIs were imported from European countries and China as the API industry was in the nascent stage in India. With the increase in revenues and profitability, the promoters ventured into new products and ploughed back the profits in the existing business to grow in size and attain economies of scale.
Entry into API manufacturing: ADL started gaining market share for the above mentioned APIs due to import substitution. The company also developed new APIs based on the technical capabilities of the promoters. ADL simultaneously introduced new products which were developed in- house. With the growing demand, consistent quality and timely supply, the company was able to enlarge the product portfolio, customer base, geographies and gained the market share. ADL also entered the global market and currently has presence in over 100 countries in Asia, Latin America, Europe and Africa.
Market leadership: Over the last 5 years, ADL has developed a basket of over 30 APIs and intermediates for 10 APIs. These APIs are in lifestyle therapeutic segments and hence have higher margin. We expect the company’s margin to improve due to high margin new product launches and higher capacity utilisation. ADL is the market leader in Ciprofloxacin (antibacterial), Metronidazole (antidiarrheal) and Celecoxib (NSAIDs) and has developed several other products in these therapeutic segments. The company also supplies intermediates for 10 APIs and ~20 Specialty Chemicals. ADL is expanding its Ciprofloxacin and Metformin capacities to cater domestic and global demand. We expect the company to benefit from this expansion.
Strong chemistry background: ADL derives technical support from its promoters who are chemical engineers and have sound chemistry background. This helps them to undertake manufacture of complex APIs involving various chemical reactions. We expect the company to manufacture complex APIs in the lifestyle segments which face low competition in the domestic and global markets.
Backward integration: ADL commissioned the plant to manufacture Cyclopropylamine (CPA), which is used in the manufacture of Ciprofloxacin and Enrofloxacin. With this backward integration, ADL will be able to substantially reduce the material cost of Ciprofloxacin and Enrofloxacin.
Forward integration to formulations: During FY14, the company entered into the formulation segment as forward integration strategy and currently supplies generic formulations to its existing and new customers. The formulation business generated 13% of consolidated revenues in FY17. ADL’s formulation facility is located at Baddi.
Environmental protection: ADL has installed effluent treatment plants at each of its manufacturing facility. The company treats all solid and liquid wastes to make them environmental friendly thereby protecting the ecology.
Core competency: ADL is pioneer in the manufacture of APIs , Intermediates and Specialty Chemicals. The promoters are technocrats with over 30 years of experience in the API industry in developing cost efficient, non-infringing manufacturing processes for APIs. The company manufactures patent-expired APIs and formulations and hence is not involved in the patent litigation. We expect the company to develop difficult
47%
28%
17%
7% 1%
Asia
Latin America
Europe
Africa
N. America

6 Aarti Drugs
to manufacture APIs , which would result in higher revenues and margin improvement. ADL’s manufacturing facilities are approved by WHO GMP and hence can export to several countries.
Major products marketed
ADL manufactures and markets APIs across various therapeutic categories. For FY17, the company derived 39% of revenues from anti-infective segment, 21% from antidiarrheal segment, 12% from NSAIDs, 7% from antifungal, 8% from antidiabetic, 5% from CVS and 8% from other segments. The company markets a range of products across each of these segments and hence not dependent on any particular therapeutic category or product.
The company’s products confirm to the specifications of various pharmacopoeia and hence have good export potential. ADL has filed Drug Master File (DMF) and Certificate of Suitability (CoS) to market its products in the developed markets. The company manufactures patent expired products using non-infringing process and hence is not subjected to patent litigation. ADL honours the patents across various countries. The company has developed over 30 new products in last five years and has a strong new product pipeline. As majority of new products are in the lifestyle segment, they command higher margin.
The new product selection is based on the disease profile in various countries, currently marketed products, market size, growth rate, patent status, competition-local and global, price control and affordability.
The details of major products marketed, their therapeutic category and registration details are tabulated in the following table:
Exhibit 5: Major products marketed
Product Therapeutic category Specifications EDMF COS US DMF
Aceclofenac anti-inflammatory BP/EP Y Y
Celecoxib anti-inflammatory EP/USP Y Y Y
Diclofenac sodium anti-inflammatory BP/EP/USP Y
Diclofenac potassium anti-inflammatory BP/EP/USP Y
Diclofenac diethylamine anti-inflammatory BP Y
Diclofenac resinate anti-inflammatory Y
Diclofenac epotamine anti-inflammatory Y
Nimesulide anti-inflammatory BP/EP Y Y Y
Clopidogrel bisulphate Cardioprotectant USP Y
Ticlopidine HCl Cardioprotectant BP/EP/USP Y Y Y
Telmisartan Cardioprotectant BP/EP/USP
Metronidazole antidiarrheal BP/EP/USP Y
Metronidazole benzoate antidiarrheal BP/EP/USP Y
Ornidazole antidiarrheal
Y
Secnidazole antidiarrheal
Y
Tinidazole antidiarrheal BP/EP/USP Y
Diloxanide furoate antidiarrheal BP
Ketoconazole antifungal BP/EP/USP Y
Tolnaftate antifungal BP/EP/USP Y
Raloxifene HCl anti-arthritis BP/USP Y
Y
Ciprofloxacin anti-infective BP/EP/USP Y Y Y
Enrofloxacin base anti-infective EP/USP Y
Gatifloxacin sesquihydrate anti-infective IP
Levofloxacin anti-infective USP Y
Moxifloxacin anti-infective BP/EP/USP Y
Norfloxacin anti-infective USP
Ofloxacin anti-infective BP/EP/USP Y
Metformin anti-diabetic BP/EP/USP Y Y Y
Pioglitazone HCl anti-diabetic
Rivastigmine tartrate Alzeihmer's disease USP Y
Y
Zolpidem tartrate sedative BP/EP Y Y
Niacin vitamin BP/EP/USP Y
Acamprosate alcoholic addiction BP/EP/USP Y
Source: Company Website

7 Aarti Drugs
Capacity Expansion
ADL is increasing its Ciprofloxacin capacity to 2,100TPA from 1,620TPA (30% increase) and its Metformin capacity to 14,400TPA from 7,200TPA (100% increase) to cater the increasing demand for these products in the domestic and global markets. We expect the additional capacity of Ciprofloxacin to generate revenues of Rs343mn in FY18 and Rs686mn in FY19. We expect the additional capacity of Metformin to generate revenues of Rs378mn in FY18 and Rs756mn in FY19. The Ciprofloxacin API demand in the domestic market is growing at over 20% and Metformin at over 15% per annum. The demand for Ciprofloxacin is likely to increase due to unhygienic conditions, flood and drought situations, epidemics and contaminated food and water leading to various infections. The demand for Metformin is likely to increase due to the increase in the diabetic population. Moreover, Metformin would find additional demand from its anti-ageing properties.
The details of the same are as follows:
Exhibit 6: Capacity Expansion
Product (in TPA) Current capacity Expanded capacity Revenues FY18 Revenues FY19
Ciprofloxacin 1,620 2,100 343 686
Metformin 7,200 14,400 378 756
Total 8,820 16,500 721 1,442
Source: Company, Centrum Research
Margin Expansion
We expect improvement in EBIDTA margin for ADL based on the following events:
� Backward integration of manufacture of intermediates: ADL has commissioned the plant to manufacture of Cyclopropylamine (CPA) which is an intermediate used in the manufacture of Q acid for Ciprofloxacin and Enrofloxacin. With CPA facility going on stream, ADL is likely to reduce its material cost for Ciprofloxacin and Enrofloxacin. Currently, Ciprofloxacin contributes ~19% to the revenues of ADL. We expect ADL to benefit from the backward integration.
� Forward integration in the manufacture of formulations: ADL has set up a manufacturing facility at Baddi for the manufacture of formulations as its forward integration strategy. As formulations involve value addition, the overall margins are likely to improve due to forward integration.
� Benefits of economies of scale: The company has created global size of manufacturing facilities and hence benefits from the economies of scale involving raw materials procurement, manufacturing expenses and distribution.
� Technological breakthrough: ADL has developed several non-infringing processes for the manufacture of APIs and Intermediates. The company has achieved higher yield and improved quality resulting in higher margins. We expect the company to continue cost control measures to improve the margins.
� Optimise product mix: ADL manufactures and markets over 30 APIs and intermediates across 100 countries of the globe. These products have different margin profile. We expect the company to optimise the margin through proper sales mix.
� Increase in capacity utilisation for all its manufacturing facilities: The capacity utilisation of ADL ranged from 66-81% during FY11 to FY17 with an average capacity utilisation of 76%. This has led to optimise the cost of manufacture for its products. We expect ADL margins to improve due to higher capacity utilisation. The company has over the years increased its capacities for various products in anticipation of higher demand. The increase in capacity utilisation would lead to better absorption of overheads resulting in margin improvement. ADL’s capacity utilisation was 76% during FY11-FY17 and 79% during FY13-FY17 indicating higher capacity utilisation. We expect ADL to achieve over 75% capacity utilisation in future to optimise its cost. The details of capacity expansion is indicated in the following table:
Exhibit 7: Capacity Utilisation (%)
Year (in Kg) Installed capacity Production Cap. Utilisation % Captive cons. Net of captive
FY17 22,582 17,463 77.3 4,053 13,410
FY16 18,584 14,288 76.9 2,717 11,571
FY15 15,065 12,069 80.1 2,637 9,432
FY14 14,460 11,482 79.4 2,358 9,124
FY13 29,544 23,964 81.1 2,277 21,687
FY12 29,016 20,963 72.2 2,250 18,713
FY11 26,280 17,434 66.3 1,363 16,071
Source: Company Reports, Centrum Research

8 Aarti Drugs
Major growth drivers
The major growth drivers for ADL are as follows:
� New product launches: ADL currently markets over 30 APIs and has developed additional 30 APIs, Intermediates and Specialty Chemicals over the last five years. The company is likely to launch new APIs in the lifestyle segment thereby widening its product offerings and margins.
� Approval for formulations in UK & Ireland: ADL has received Marketing Authorisation (MA) for Zolpidem tablets and Celecoxib tablets in UK and Ireland. We expect these approvals to generate additional revenues for the company.
� Entry into new segments: The company has presence over a wide range of therapeutic segments ranging from anti-infective, antidiabetic, antifungal, antidiarrheal, NSAIDs and CVS. The company is likely to derive growth from the fast growing lifestyle segments namely anti-diabetic, antifungal, antiulcerant and CVS. We also expect the company to enter into new therapeutic segments, where it does not have presence.
� Filing of DMFs and ANDAs: The company has filed 17 DMFs with US FDA and few ANDAs with EU in order to serve the customers in the regulated markets. We expect the company to supply APIs and Intermediates to global generic formulators.
� Long term supply arrangements: We expect ADL to enter into long-term supply arrangements with domestic and global formulators for the supply of APIs, Intermediates and Specialty Chemicals for their formulation requirements.
� Backward integration: ADL has backwardly integrated for the manufacture of intermediates required for the manufacture of Ciprofloxacin, Enrofloxacin, Ofloxacin, Levofloxacin, Norfloxacin, Nimesulide, Celecoxib and Ketoconazole. This has led to lower dependence of intermediates from China. We expect the company to benefit from the captive use and sale of Intermediates.
� Forward integration: The company has entered into the manufacture of high margin formulations as forward integration thereby reducing the cost and offering value added products to its customers. ADL has entered into partnership with established distributor in UK. ADL’s 100% subsidiary-Pinnacle has commenced filing ANDAs in UK and Ireland. We expect ADL margins to improve as the company is low cost producer of formulations.
Import Alert-US FDA
ADL currently derives 1% of its revenues by volume from the US generic market as its manufacturing unit at Tarapur received Import Alert from US FDA dated 23rd March’15 for one its manufacturing facilities. However, the company clarified that the second facility was delisted from the US FDA website couple of years ago. The Import Alert has impacted the company’s plans to export APIs to the US market. ADL’s E-22 facility at Tarapur is the US FDA compliant facility. This facility received warning letter from US FDA in July’13 and was re-inspected in August’14. The company had submitted four responses starting from August’14 to February’15 and has completed the remedial measures. ADL has carried out substantial automation and enhanced IT infrastructure for its US FDA facility to address data integrity issues and spent Rs10mn on the same. ADL has also conducted third- party audit by US based consultants. The company is likely to invite US FDA for re-inspection in Q4FY18.
The major issues raised by the US FDA in the warning letter dated 30th July’13 were:
� Failure to record all activities at the time they were performed. In two instances, the manufacturing step was recorded in the batch record before it occurred.
� The company failed to review and investigate production and QC Laboratory deviations. Deviations pertaining to laboratory equipment failures were not investigated.
� Failure to maintain laboratory control records with complete data derived from all tests conducted including examination and assays.
� Failure to implement access controls and audit trails for laboratory computer systems. The quality control personnel shared the same username and password for the operating systems.

9 Aarti Drugs
In 2012, the company recorded more than 30 power interruptions during processes but quality officials did not investigate whether the power interruptions affected samples in the quality control stability chamber.
ADL has filed seventeen DMFs with US FDA and plans to partner in ANDAs filing after clearance of the manufacturing facility by US FDA. Majority of these DMFs are in the lifestyle segments and hence have higher margins. The details of the same are shown in the following table:
Exhibit 8: List of DMFs filed with US FDA
Sr. No. Date of filing Product Therapeutic Category
1 16.5.2006 Zolpidem tartrate CNS, sedative
2 1.6.2006 Metoprolol succinate CVS
3 17.7.2006 Ciprofloxacin HCl anti-infective
4 13.9.2006 Terbinafine HCl dermatological
5 14.12.2006 Niacin vitamin
6 30.4.2007 Loratadine anti-allergic
7 28.8.2007 Nimesulide NSAIDs
8 1.2.2008 Metformin HCl USP anti-diabetic
9 22.5.2008 Raloxifen HCl osteoporosis
10 6.10.2008 Hydroxyzine HCl sedative
11 30.12.2008 Ticlopidine HCl CVS
12 1.4.2009 Rivastigmine base Alzheimer's disease
13 31.7.2009 Rivastigmine Hydrogen tartrate Alzheimer's disease
14 9.10.2009 Celecoxib osteoarthritis, NSAIDs
15 3.4.2012 Diclofenac epolamine NSAIDs
16 3.7.2012 Pioglitazone HCl anti-diabetic
17 29.9.2015 Rofecoxib osteoarthritis, NSAIDs
Source: US FDA website, Centrum Research

10 Aarti Drugs
Global markets-good future potential
India is the second largest supplier of generic APIs to the US market with 25.4% market share. India is also increasing API supplies to Europe with 19.2% market share. API exports have grown at 14.7% between 2007-2008 and 2012-2013. India is emerging as preferred manufacturing hub for high quality APIs. The export of API to regulated markets is expected to grow to 51% by 2018-2019. India supplies 20% global generic drugs in terms of volume. ADL has launched various new products in the domestic and global markets. The company is one of the lowest cost producers in India and enjoys economies of scale.
ADL derived 36% of its revenues from Exports in FY17. The company’s exports were 43% of consolidated revenues in FY11 and fell to 36% in FY17 due to higher sales in the domestic market and Import Alert imposed by US FDA in March’15 for the US market. We expect the export share at 36% in FY18 and decline to 33% of revenues in FY20 due to higher domestic growth. The same has been indicated in the following chart:
Exhibit 9: Exports & Export share %
Source: Company Reports, Centrum Research
ADL supplies its products to several global pharma companies. ADL’s export was Rs4.2bn in FY17. The company’s major customers are located in Asia, L. America , Europe and Africa. The top 10 global customer accounted for Rs1.0bn or ~25% of total exports in FY17. The largest customer Sanofi Aventis Pakistan accounted for 5.3% of exports. Hence, ADL does not have major dependence on any customer.
Leading supplier of APIs to MNC pharma
ADL has over 30 years of experience in API manufacturing and derived 81% of its revenues from API business and 13% from its formulations business in FY17. The company manufactures several APIs at its WHO GMP and EU GMP approved facilities at Tarapur and Sarigam and supplies to the domestic and MNC pharma companies. The company also manufactures and supplies Specialty Chemicals and intermediates. ADL has developed 30 new products in last 5 years. ADL’s major API customers in the domestic market include: J.B. Chemicals & Pharmaceuticals, Abbott Healthcare Private Ltd, Medley Pharma, Cadila Healthcare, Cipla, Torrent Pharma, Hetero Pharma, Alkem Labs, Sanofi India, Merck, Teva Pharma, Pfizer, Bayer, Clariant Chemicals etc.
ADL generated Rs6.7bn from domestic sales in FY17. The top 10 domestic customers accounted Rs1.1bn or 17% of the domestic revenues. The largest domestic customer J.B. Chemicals & Pharmaceuticals contributed 3.3% to ADL’s domestic revenues.
ADL derives ~13% of its revenues from the supply of formulations. The company has commenced manufacture of formulations for its existing clients as forward integration strategy in FY15. ADL supplies its formulations to the following pharma companies: Cipla, Abbott India, Merck, Alembic Pharma, Lupin and Wockhardt.
ADL’s total revenues from the sale of APIs and formulations were Rs11.24bn in FY17 of which domestic sales accounted for Rs7.0bn and exports were Rs4.24bn. The top 10 product sales (API & Formulations) were 74% and hence the company has high dependence on the top 10 products. Among the top 10 products the anti-infective accounted for ~39% of total revenues.
30
35
40
45
-
1,500
3,000
4,500
6,000
FY11 FY12(s) FY13(s) FY14(s) FY15 FY16 FY17 FY18E FY19E FY20E
Rs mn
Exports Exports as % of cons. Revenues - RHS

11 Aarti Drugs
New Products –Growth Drivers
ADL has a rich pipeline of 13 products under development. These products are difficult to manufacture and are in the lifestyle segment and hence command a higher margin.
The details of the new products, their brand names and patent holder are shown in the following table:
Exhibit 10: New Products under development
Product Therapeutic category Patented product Patent holder
Atorvastatin cholesterol reducer Lipitor Pfizer
Colesevelam cholesterol reducer Welchol Daiichi Sankyo
Dabigatran anticoagulant Pradaxa Boehringer Ingelheim
Dronedarone CVS Multaq Sanofi Aventis
Olmesartan CVS Olmecip Daiichi Sankyo
Valsartan CVS Diovan Novartis
Sitagliptin anti-diabetic Januvia MSD
Teneligliptin anti-diabetic Tenelia Mitsubishi Pharma
Acamprosate alcoholism treatment Campral Forest Labs
Sevelamer kidney dialysis Renagel Sanofi Aventis
Duloxetine anti-depressant Cymbalta Eli Lilly
Loxoprofen sodium anti-inflammatory Loxonin Daiichi Sankyo
Mesalamine anti-inflammatory Mesalazine Disphar International
Source: Company, Centrum Research
Infrastructure-complying global standards
World class manufacturing facilities
ADL has established 10 world class manufacturing facilities for API and intermediates of which 8 are in Tarapur and 2 in Sarigam. These facilities are approved by global regulatory agencies. The E-22 facility is built as per US FDA standards but has received Import Alert from US FDA in March’15. The company has submitted CAPA (Corrective and Preventive Action) to US FDA. In addition to these, the company has one formulation facility at Baddi. The details of manufacturing facilities and their regulatory approval status are indicated in the following table:
Exhibit 11: Manufacturing facilities
Unit no. Location Certification
E-22 Tarapur TGA-Australia, EUGMP, WHO-GMP, FDA Canada, US FDA (import alert)
G-60 Tarapur ANVISA-Brazil, WHO-GMP,COFEPRIS-Mexico, FDA Russia
E-21 Tarapur WHO GMP, Korean FDA
N-198 Tarapur EU GMP, WHO-GMP, ISO, Japanese Accreditation
K-40 Tarapur WHO GMP, COFEPRIS-Mexico
W-61 Tarapur EU GMP, WHO-GMP
E-120 Tarapur WHO GMP
E-9/3 Tarapur ISO
2902-04 Sarigam WHO GMP
211/213 Sarigam WHO GMP, COFEPRIS-Mexico
Source: Company website
Quality control-complying global standards
ADL has established state-of-the art Quality Control (QC) Laboratories with sophisticated analytical instruments at all of its manufacturing facilities. The company has received WHO GMP certification. ADL adheres to high quality standards as its products are competitive in the international markets. The QC labs carry out all types of analysis namely: raw materials, in-process samples, packing materials, finished products, stability study testing, impurity profile, method validation etc.

12 Aarti Drugs
R & D-company’s backbone
ADL’s R & D centre is located at Tarapur is recognised by Department of Science & Industry Research, Government of India. The centre carries out R & D activities for product development, scale up and transfer to manufacturing and develops non-infringing routes of synthesis. It has developed over 30 new products in the last 5 years. ADL has currently 13 APIs under development at various stages. The company has recovered all inorganic salts from Metronidazole waste. ADL has over 30 years of experience and has developed expertise in various reactions. The company has over 50 scientists working in R & D.
The R & D expenditure for ADL was 0.9% of revenues between FY08-FY17. ADL is eligible for 150% weighted average deduction of R & D expenses. We expect the company to increase the R & D expenditure to create a strong pipeline of products for future growth.
The detail of R & D expenses is indicated in the following chart:
Exhibit 12: R & D Expenses
Source: Company Reports, Centrum Research
Effluent Treatment- preserving ecology
ADL has installed common facility for effluent treatment and is likely to achieve ‘Zero discharge’ for organic contaminated effluent. The company has installed ‘Multiple Effect Evaporators’ and Incinerator for treating liquid effluent. ADL has plans to develop ‘Green Process’ with the help of innovative technologies. All the ADL’s plants are designed with appropriate waste management systems. The company carries out safe disposal of solid and liquid waste. ADL generates steam through a waste heat recovery plant. The company’s effluent treatment plants are well-maintained. We expect the company to effectively treat the solid and liquid process effluents to protect the ecology.
0.0
0.2
0.4
0.6
0.8
1.0
1.2
1.4
1.6
0
20
40
60
80
100
120
140
160
180
FY08 FY09 FY10 FY11 FY12 FY13 FY14 FY15 FY16 FY17
Rs mn
R & D expenses As % of revenues - (RHS)

13 Aarti Drugs
Global API Industry structure
Global market-growth driven by pharmerging countries
The Global API market (including captive consumption) is expected to reach $185bn (Rs11,840bn) by 2020. The number of pharmerging countries has increased from 5 to 21 and healthcare improvement will be their priority. The Indian pharmaceutical market is the third largest in terms of volume and thirteen largest in terms of value. Its revenue is estimated to grow at 15% per annum during 2015-2020 thus outperforming global pharmaceutical industry. By 2020, India is likely to be among top three pharma markets in terms of growth.
India supplies 20% of global generic medicines in terms of volume to the US market. India’s cost of production is significantly lower than that of the US and half of that of Europe. Indian pharma industry has advantage in terms of cost of production, good R & D and technical work force. Over 60,000 generic brands across 60 therapeutic categories, comprising over 500 APIs are marketed in India. Generic drugs are the largest segment of Indian pharma sector with over 70% market share in terms of revenues. India contributes ~2.4% of global pharma industry in value terms and 10% in volume terms. The Indian pharma industry grew at 17.5% CAGR from 2005-2015 and is expected to grow at 15.9% CAGR to $55bn (Rs3,520bn) by 2020.
Domestic market
The domestic pharma market has a healthy growth due to growing population, increasing health awareness, increase in healthcare insurance, increased aged population, changing lifestyle and increasing per capita income. The API industry has grown at direct offset of formulation growth worldwide.
SWOT analysis
ADL’s SWOT analysis is summarised in the following table:
Strengths
� Dedicated management team
� Amongst the lowest cost producer
� Benefits of economies of scale
� Benefits of vertical integration
� Efficient manufacturing systems
� Better documentation, reliability and quality
� Strong regulatory framework
� Customer diversification
� Effective environmental control
� Strong R & D team
Weakness
� Limited product portfolio
� Late entry into formulation business
� Late entry in the largest US generic market
� Import Alert by US FDA for its Tarapur facility in March’15
Opportunities
� Chinese environmental rules getting stringent
� Exports to over 100 countries worldwide
� Commenced export of formulations
� Long-term supply arrangements
� Supply of Specialty Chemicals and Intermediates
� Tie up with European distributor for formulation supplies
Threat
� Competition from China
� Strengthening of the rupee against dollar
Source: Company Reports, Centrum Research

14 Aarti Drugs
Competition-domestic & global
ADL faces stiff competition from API manufacturers in the domestic and global markets. There are over five domestic producers for each API and over 30 formulators for each of the APIs manufactured by the company. ADL faces major global competition from Europe and China. The key differentiating factors are: product quality, purity and timeliness of supplies. For majority of the clients, price is the last consideration. The details of domestic and global customers for each product manufactured by ADL are as follows:
Exhibit 13: Domestic & Global customers
Product Domestic customers Global customers
Ciprofloxacin Cipla, Dr. Reddy's Labs, Sun Bayer-Germany, Uquifa Mexico,
Pharma, J B Chem, Wockhardt Mylan, Quimica Sintetica-France
Metronidazole/ Unichem Labs, FDC Rhone Poulenc, Cordon Pharma,
Metronidazole Benzoate Manav Drugs Signa-Italy, Tianjin Hubei-China
Ofloxacin Sun Pharma, Neuland, Daiichi Sankyo, Bayer-Germany,
Cipla Noramco, Sintetica-France
Metformin USV, Wanbury, Sun Pharma, Merck, Groupe Lipha, Tapi-Puerto
Ipca Labs, Granules India Rico, Farmhispania
Ketoconazole FDC, Gufic Biosciences, Quimica Sintetica, Janssen Pharma,
Piramal Enter, Sharon Bio Esteve Quimica, Albemarle Corp.
Enrofloxacin Base Smruthi Organic, Triveni Mylan
Interchem, S R Chemicals
Levofloxacin Hemihydrate Cipla, Dr. Reddy's Labs, Sun Daiichi Sankyo, Quimica Sintetica,
Pharma, Neuland, Cadila HC Teva Pharma, Mylan, Apotex
Clopidogrel Bisulphate Cipla, Dr. Reddy's Labs, Sanofi Aventis, Chinoin Pharma,
Aurobindo, Wanbury, Ipca Labs BASF, Signa, Teva Pharma
Nimesulide Nutraplus, Unimark Remedies, Procos-Italy
Vital Healthcare
Source: Centrum Research
Subsidiary –forward integration
ADL has a 100% subsidiary Pinnacle Life Science Private Limited (Pinnacle), which is engaged in the manufacture of formulations as a forward integration strategy. Pinnacle had reported minor loss of Rs32mn in FY15 and has turned profitable since FY16. The company generated net profit of Rs25mn and Rs65mn in FY16 and FY17 respectively. It has one formulation manufacturing facility at Baddi, Himachal Pradesh and caters to ADL’s API customers. ADL has commenced formulation exports to cater global requirements. It has registered the formulations in various countries through Pinnacle. ADL has tied up with European distributor on profit sharing basis for its formulation sales. The company has filed two Dossiers with UK MHRA of which one is approved. On a consolidated basis, formulations contributed ~13% to the revenues in FY17. We expect the formulation business to pick up in future due to lower cost structure and benefits of backward integration.
The following table shows the subsidiary’s performance from FY15-FY17:
Exhibit 14: Performance of Subsidiary
Particulars (Rs mn) FY15 FY16 FY17
Share Capital 78 78 78
Reserves & Surplus 36 58 121
Debt & other Liability 330 534 743
Total Liability 444 670 942
Total Assets 444 670 942
Total Income 133 858 1,458
Profit/(Loss) before tax (32) 25 84
Tax expenses 0 0 19
Profit/(loss) after tax (32) 25 65
Source: Annual Reports
15 Aarti Drugs
Financial Analysis
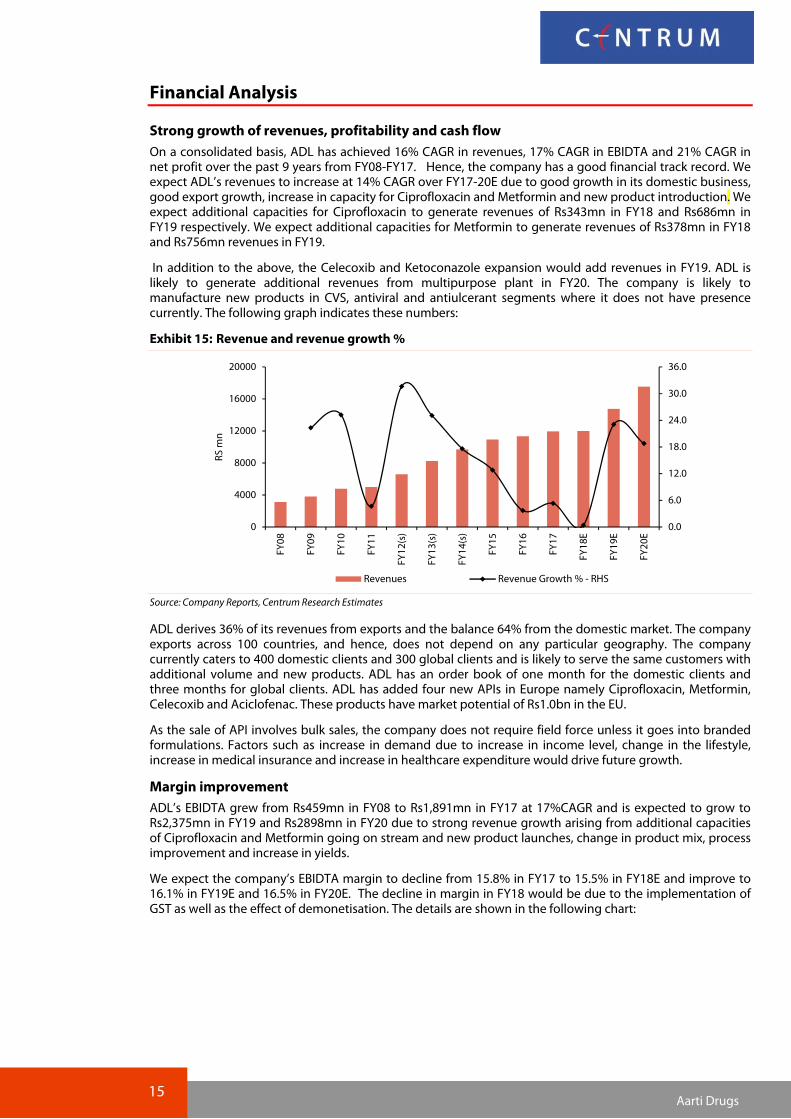
Strong growth of revenues, profitability and cash flow
On a consolidated basis, ADL has achieved 16% CAGR in revenues, 17% CAGR in EBIDTA and 21% CAGR in net profit over the past 9 years from FY08-FY17. Hence, the company has a good financial track record. We expect ADL’s revenues to increase at 14% CAGR over FY17-20E due to good growth in its domestic business, good export growth, increase in capacity for Ciprofloxacin and Metformin and new product introduction. We expect additional capacities for Ciprofloxacin to generate revenues of Rs343mn in FY18 and Rs686mn in FY19 respectively. We expect additional capacities for Metformin to generate revenues of Rs378mn in FY18 and Rs756mn revenues in FY19.
In addition to the above, the Celecoxib and Ketoconazole expansion would add revenues in FY19. ADL is likely to generate additional revenues from multipurpose plant in FY20. The company is likely to manufacture new products in CVS, antiviral and antiulcerant segments where it does not have presence currently. The following graph indicates these numbers:
Exhibit 15: Revenue and revenue growth %
Source: Company Reports, Centrum Research Estimates
ADL derives 36% of its revenues from exports and the balance 64% from the domestic market. The company exports across 100 countries, and hence, does not depend on any particular geography. The company currently caters to 400 domestic clients and 300 global clients and is likely to serve the same customers with additional volume and new products. ADL has an order book of one month for the domestic clients and three months for global clients. ADL has added four new APIs in Europe namely Ciprofloxacin, Metformin, Celecoxib and Aciclofenac. These products have market potential of Rs1.0bn in the EU.
As the sale of API involves bulk sales, the company does not require field force unless it goes into branded formulations. Factors such as increase in demand due to increase in income level, change in the lifestyle, increase in medical insurance and increase in healthcare expenditure would drive future growth.
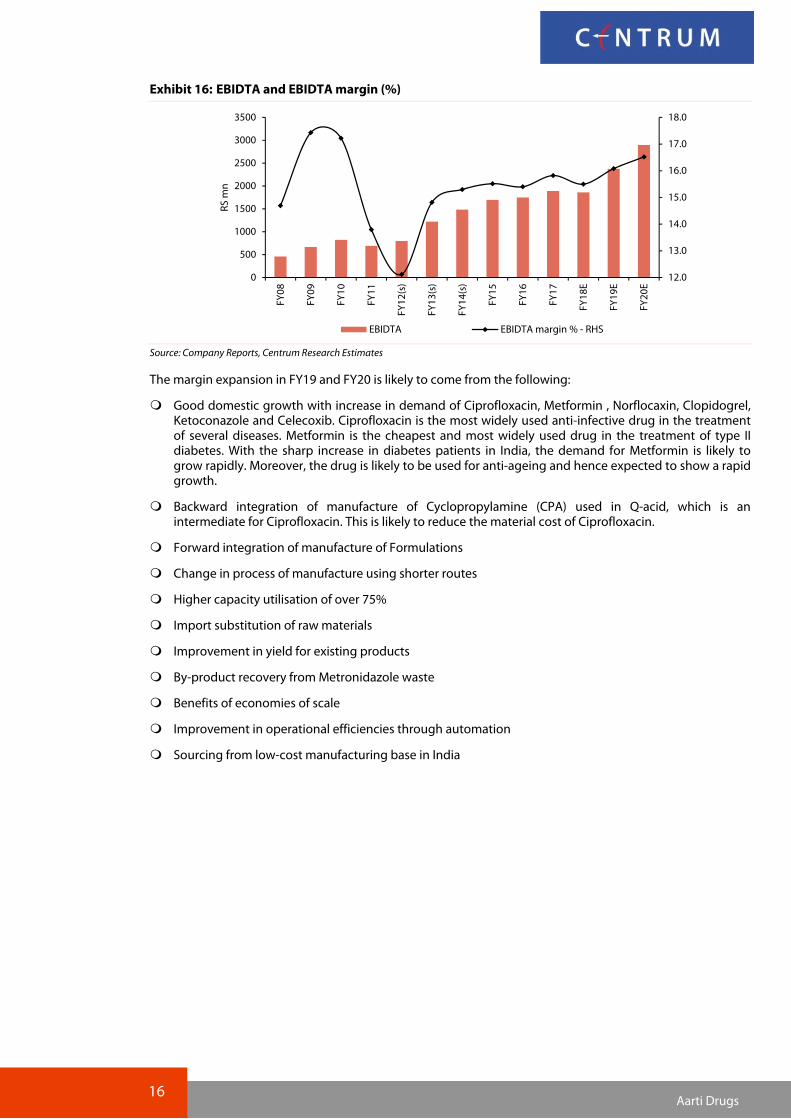
Margin improvement
ADL’s EBIDTA grew from Rs459mn in FY08 to Rs1,891mn in FY17 at 17%CAGR and is expected to grow to Rs2,375mn in FY19 and Rs2898mn in FY20 due to strong revenue growth arising from additional capacities of Ciprofloxacin and Metformin going on stream and new product launches, change in product mix, process improvement and increase in yields.
We expect the company’s EBIDTA margin to decline from 15.8% in FY17 to 15.5% in FY18E and improve to 16.1% in FY19E and 16.5% in FY20E. The decline in margin in FY18 would be due to the implementation of GST as well as the effect of demonetisation. The details are shown in the following chart:
0.0
6.0
12.0
18.0
24.0
30.0
36.0
0
4000
8000
12000
16000
20000
FY08
FY09
FY10
FY11
FY12(s)
FY13(s)
FY14(s)
FY15
FY16
FY17
FY18E
FY19E
FY20E
RS m
n
Revenues Revenue Growth % - RHS
16 Aarti Drugs
Exhibit 16: EBIDTA and EBIDTA margin (%)
Source: Company Reports, Centrum Research Estimates
The margin expansion in FY19 and FY20 is likely to come from the following:
� Good domestic growth with increase in demand of Ciprofloxacin, Metformin , Norflocaxin, Clopidogrel, Ketoconazole and Celecoxib. Ciprofloxacin is the most widely used anti-infective drug in the treatment of several diseases. Metformin is the cheapest and most widely used drug in the treatment of type II diabetes. With the sharp increase in diabetes patients in India, the demand for Metformin is likely to grow rapidly. Moreover, the drug is likely to be used for anti-ageing and hence expected to show a rapid growth.
� Backward integration of manufacture of Cyclopropylamine (CPA) used in Q-acid, which is an intermediate for Ciprofloxacin. This is likely to reduce the material cost of Ciprofloxacin.
� Forward integration of manufacture of Formulations
� Change in process of manufacture using shorter routes
� Higher capacity utilisation of over 75%
� Import substitution of raw materials
� Improvement in yield for existing products
� By-product recovery from Metronidazole waste
� Benefits of economies of scale
� Improvement in operational efficiencies through automation
� Sourcing from low-cost manufacturing base in India
12.0
13.0
14.0
15.0
16.0
17.0
18.0
0
500
1000
1500
2000
2500
3000
3500
FY08
FY09
FY10
FY11
FY12(s)
FY13(s)
FY14(s)
FY15
FY16
FY17
FY18E
FY19E
FY20E
RS m
n
EBIDTA EBIDTA margin % - RHS

17 Aarti Drugs
Net profit improvement
ADL’s net profit expanded from Rs148mn in FY08 to Rs805mn in FY17 at 21%CAGR due to sales growth and margin improvement. The net profit growth declined from 18.9% in FY09 to 17.3% in FY17. We expect the net profit to grow to Rs1.34bn at growth rate of 25.6% in FY20. The same has been indicated in the following chart:
Exhibit 17: Net profit and net profit growth%
Source: Company Reports, Centrum Research Estimates
Healthy Return Ratios
ADL’s RoCE enhanced from 7.1% in FY08 to 12.4% in FY17 due to the improvement in profitability. The company’s RoE is has grown from 13.3% in FY08 to 21.0% in FY17. We expect ADL to report RoCE of 14.6% and RoE of 22.7% for FY20. The company would generate healthy return ratios of over the next two years. The same has been indicated in the following chart:
Exhibit 18: RoE and RoCE %
Source: Company Reports, Centrum Research Estimates
Capex-backbone of future growth
ADL has spent Rs1.09bn on capex in FY17. The company has invested Rs6.63bn on capex during the ten year period FY08-FY17 in augmenting additional capacities to gain from the economies of scale.
ADL’s asset turnover ratio was 1.1x in FY08 reached to peak level of 1.7x in FY13 and declined to 1.4x in FY17. The gross block addition ranged from 91% to 290% of net profit indicating that the company is continuously creating capacities in anticipation of good demand for its products. The same has been shown in the following table:
-40.0
-20.0
0.0
20.0
40.0
60.0
80.0
100.0
120.0
0
200
400
600
800
1,000
1,200
1,400
FY08
FY09
FY10
FY11
FY12(s)
FY13(s)
FY14(s)
FY15
FY16
FY17
FY18E
FY19E
FY20E
Rs mn
Net Profit Growth rate % - RHS
7.1
10.1 11.2
8.8
8.5
13.2 15.4
15.9
12.8
12.4
10.8 12.9 14.6
13.3 15.0
21.1
15.2
13.2
23.5
26.9
27.6
20.6
21.0
18.2
21.3 22.7
0
5
10
15
20
25
30
FY08
FY09
FY10
FY11
FY12(s)
FY13(s)
FY14(s)
FY15
FY16
FY17
FY18E
FY19E
FY20E
Rs mn
RoCE % RoE %
18 Aarti Drugs
Exhibit 19: Asset Turnover Ratio
Particulars (Rs mn) FY08 FY09 FY10 FY11 FY12 FY13 FY14 FY15 FY16 FY17
Gross Block 2,778 3,099 3,325 3,934 4,394 4,791 5,812 6,854 7,255 8,516
Sales 3,124 3,821 4,785 5,009 6,593 8,247 9,700 10,943 11,349 11,952
Asset Turnover (x) 1.1 1.2 1.4 1.3 1.5 1.7 1.7 1.6 1.6 1.4
Gross Block Addition 222 202 257 681 473 600 1,065 1,070 997 1,088
Net Profit 148 176 284 235 224 452 617 772 686 805
Gross Block as % of PAT 150.0 114.8 90.5 289.8 211.2 132.7 172.6 138.6 145.3 135.2
Source: Company Reports, Centrum Research
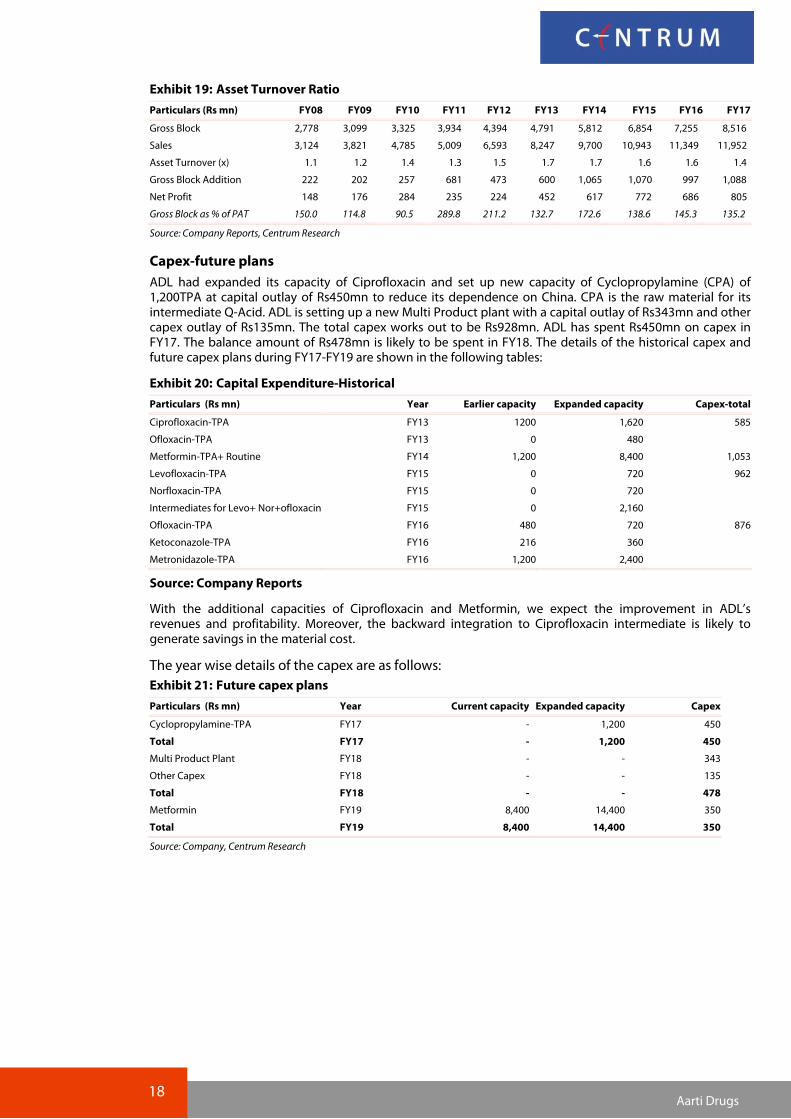
Capex-future plans
ADL had expanded its capacity of Ciprofloxacin and set up new capacity of Cyclopropylamine (CPA) of 1,200TPA at capital outlay of Rs450mn to reduce its dependence on China. CPA is the raw material for its intermediate Q-Acid. ADL is setting up a new Multi Product plant with a capital outlay of Rs343mn and other capex outlay of Rs135mn. The total capex works out to be Rs928mn. ADL has spent Rs450mn on capex in FY17. The balance amount of Rs478mn is likely to be spent in FY18. The details of the historical capex and future capex plans during FY17-FY19 are shown in the following tables:
Exhibit 20: Capital Expenditure-Historical
Particulars (Rs mn) Year Earlier capacity Expanded capacity Capex-total
Ciprofloxacin-TPA FY13 1200 1,620 585
Ofloxacin-TPA FY13 0 480
Metformin-TPA+ Routine FY14 1,200 8,400 1,053
Levofloxacin-TPA FY15 0 720 962
Norfloxacin-TPA FY15 0 720
Intermediates for Levo+ Nor+ofloxacin FY15 0 2,160
Ofloxacin-TPA FY16 480 720 876
Ketoconazole-TPA FY16 216 360
Metronidazole-TPA FY16 1,200 2,400
Source: Company Reports
With the additional capacities of Ciprofloxacin and Metformin, we expect the improvement in ADL’s revenues and profitability. Moreover, the backward integration to Ciprofloxacin intermediate is likely to generate savings in the material cost.
The year wise details of the capex are as follows:
Exhibit 21: Future capex plans
Particulars (Rs mn) Year Current capacity Expanded capacity Capex
Cyclopropylamine-TPA FY17 - 1,200 450
Total FY17 - 1,200 450
Multi Product Plant FY18 - - 343
Other Capex FY18 - - 135
Total FY18 - - 478
Metformin FY19 8,400 14,400 350
Total FY19 8,400 14,400 350
Source: Company, Centrum Research

19 Aarti Drugs
Intangibles
ADL’s intangibles (Process Development - R & D) accounted for 2.1% of GFA in FY08 and increased to 5.8% of GFA in FY09 and declined gradually to 0.9% of GFA in FY17 due to increase in Gross Fixed Assets. The intangibles were Rs74mn or 0.9% of GFA in FY17 which is not significant. This indicates that ADL does not have appreciable intangibles.
The details of the same are as follows:
Exhibit 22: Intangibles
Particulars (Rs mn) FY08 FY09 FY10 FY11 FY12 FY13 FY14 FY15 FY16 FY17
Process Devt-R & D 57 179 179 179 179 179 143 143 74 74
Gross Fixed Assets 2,778 3,099 3,325 3,934 4,394 4,791 5,812 6,854 7,255 8,516
Intangibles as % GFA 2.1 5.8 5.4 4.6 4.1 3.7 2.5 2.1 1.0 0.9
Source: Company Reports, Centrum Research
Buyback of shares
During FY17, ADL bought back 0.36mn shares representing 1.5% of total equity at Rs750 per share (premium of Rs740 per share) aggregating to Rs270mn on a proportionate basis through tender offer. Post-buyback the equity capital has reduced to Rs238.6mn.
For FY18, ADL has announced buyback of 0.275mn shares representing 1.15% of total equity at Rs875 per share aggregating to Rs241mn on a proportionate basis through a tender offer. Post-buyback the equity capital would reduce to Rs236mn. For FY19 and FY20, we have assumed buyback of Rs250mn in each year. The details of buyback and dividend payout (%) are shown in the following table:
Exhibit 23: Buyback of shares
Particulars (Rs mn) FY16 FY17 FY18E FY19E FY20E
Buyback shares-mn 0 0.36 0 0 0
Equity Capital- no. of shares 24.2 23.9 23.6 23.4 23.2
% of Equity Capital 0 1.5 0.0 0.0 0.0
Amount per share Rs. 0 750 0 0 0
Buyback Amount 0 270 241 250 250
Dividend Amount 192 28 43 57 72
Total Payout 192 298 284 307 322
Net profit 686 805 793 1,065 1,338
Payout (%) 28.0 37.0 35.8 28.9 24.0
Source: Company, Centrum Research Estimates
Working Capital Cycle improvement
ADL’s working capital cycle was 136 days in FY08, which came down to 95 days in FY17 with a reduction of 41 days in nine years. This clearly indicates the efficiency in WC Management. The company was able to achieve 13 days reduction in inventory level and 30 days in debtor level during FY08-FY17. The payable declined by 2 days during the similar period. With the reduction in working capital cycle, we expect the company to report healthy performance in the years to come. The details of WC Cycle are indicated in the following table:
Exhibit 24: Exhibit: Working Capital Cycle
Particulars (Rs mn) FY08 FY09 FY10 FY11 FY12 FY13 FY14 FY15 FY16 FY17
Inventory 662 605 644 918 979 1409 1267 1642 1783 2098
Debtors 1,033 1,136 1,160 1,214 1,806 2,157 2,766 3,143 3,317 2,968 Payables 529 537 483 603 938 1,319 1,502 1,667 1,849 1,970 Cash conversion cycle 1,166 1,204 1,321 1,529 1,847 2,247 2,531 3,118 3,251 3,096
No. of days
Inventory 77 58 49 67 54 62 48 55 57 64
Debtors 121 109 88 88 100 95 104 105 107 91
Payables 62 51 37 44 52 58 57 56 59 60
Cash conversion cycle 136 115 101 111 102 99 95 104 105 95
Source: Annual Reports, Centrum Research

20 Aarti Drugs
Interest cost-likely to increase
We expect the increase in working capital for ADL due to the implementation of GST and increase in volumes. ADL’s average interest cost is 7-8% and currently at ~2.8% of the revenues. The company borrows term loans from banks and loans and advances from its directors. All the loans are in Rupees. Any reduction in the interest rates is likely to benefit the company. The company does not have any major interest income.
Foreign Exchange Exposure
ADL derives 36% of its revenues from exports and also imports some of its raw materials, intermediates and capital goods. The company uses forward contracts, options and swaps to hedge against its foreign exchange exposures relating to these transactions. ADL does not enter into any derivative instruments for trading or speculation purposes. The foreign currency transactions are recorded at the exchange rate that approximates the actual rate prevailing on the date of the transaction. Monetary item denominated in foreign currency are translated at year end rates. The premium in case of forward contracts is dealt in P & L account proportionate to the period of contract.
During the year ended March’17, the company has hedged Rs3,480mn (FY16: Rs2,873mn) for its trade related operations aggregating to Rs8,103mn (FY16: Rs8,018mn) after considering natural hedge. We expect the company not to enter into any derivative instruments for trading or speculation. ADL derives the benefit of natural hedge as it imports raw materials, intermediates and capital goods. The imported raw materials and capital goods have risen from 28.0% of revenues in Fy11 to 35.3% of revenues in FY17. This gives a natural hedge against exports. The year wise import of raw materials and capital goods imports is shown in the following table:
Exhibit 25: Import of raw materials and capital goods
Particulars (Rs mn) FY11 FY12 FY13 FY14 FY15 FY16 FY17
Imported materials & cap. Goods 1,404 1,798 2,715 3,451 4,145 4,457 4,216
Material cost 3,342 4,536 5,554 6,625 7,500 7,668 7,805
as % of material cost 42.0 39.6 48.9 52.1 55.3 58.1 54.0
Revenues 5,009 6,593 8,247 9,700 10,943 11,349 11,952
as % of revenues 28.0 27.3 32.9 35.6 37.9 39.3 35.3
Source: Company data, Centrum Research

21 Aarti Drugs
Quarterly Financials
Exhibit 26: Quarterly Financials-consolidated
Particulars (Rs mn) Q3FY16 Q4FY16 Q1FY17 Q2FY17 Q3FY17 Q4FY17 Q1FY18 Q2FY18
P & L
Total revenues 2,687 3,146 3,158 3,422 2,906 3,011 2,772 3,193
Material cost 1,747 2,169 1,913 2,069 1,904 1,919 1,623 2013
Personnel cost 110 122 126 132 127 155 136 143
Other expenses 398 397 638 715 443 464 659 511
Total expenses 2,255 2,688 2,677 2,916 2,474 2,538 2,418 2,667
EBIDTA 432 458 481 506 432 473 354 526
Other income - - - 6 - - 1 0
PBDIT 432 458 481 512 432 473 355 526
Interest 112 115 100 88 91 86 89 80
Depreciation 92 94 96 97 99 92 98 101
Profit before tax 228 249 285 327 242 295 168 345
Tax provision 58 63 86 106 63 88 54 109
PAT before minority interest 170 186 199 221 179 207 114 236
Minority interest - - - - - - - 0
PAT after EO items 170 186 199 221 179 207 114 236
Growth (%)
Revenues NA NA 11.3 25.4 8.2 -4.3 -12.2 -6.7
EBIDTA NA NA 8.8 18.8 - 3.3 -26.4 4.0
Net Profit NA NA 14.4 40.8 5.3 11.3 -42.7 6.8
Margin (%)
EBIDTA 16.1 14.6 15.2 14.8 14.9 15.7 12.8 16.5
Profit before tax 8.5 7.9 9.0 9.6 8.3 9.8 6.1 10.8
Net margin 6.3 5.9 6.3 6.5 6.2 6.9 4.1 7.4
Source: Company, Centrum Research
Q2FY18- Performance affected by GST
For Q2FY18, on a consolidated basis, ADL reported 7%YoY decline in revenues to Rs3.19bn from Rs3.42bn due to uncertainties of GST implementation. ADL’s three API were approved for European markets. The company has received Marketing Authorisation (MA) for Zolpidem tablets and Celecoxib tablets in the UK and Ireland.
ADL’s EBIDTA margin grew by 170bps YoY to 16.5% from 14.8% due to the reduction in other expenses and better realisation of its formulations. The company’s material cost grew by 250bps to 63.0% from 60.5% due to unfavourable product mix and rise in cost of crude based chemicals. Personnel expenses grew by 60bps to 4.5% from 3.9%. Other expenses declined by 490bps to 16.0% from 20.9% due to cost control measures. The company’s interest cost declined by 9% YoY to Rs80mn from Rs88mn due to reduction in working capital. ADL’s tax rate declined to 31.6% from 32.4% of PBT. Net profit grew by 7% YoY to Rs236mn from Rs221mn due to margin improvement and lower tax rate. We expect the company to perform better in H2FY18 as there is re-stocking of API and intermediates by its customers.
On a QoQ basis, there was a strong improvement. Total revenues grew 15%YoY to Rs3.19bn from Rs2.77bn. EBIDTA margin grew by 370bps to 16.5% from 12.8%. Net profit grew by 107% to Rs236mn from Rs114mn. The following table shows the details:

22 Aarti Drugs
Exhibit 27: Q2FY18 results-Consolidated
PARTICULARS (Rs mn) Q2FY18 Q2FY17 YoY% Q1FY18 QoQ%
Total income 3,193 3,422 (6.7) 2,772 15.2
Expenditure
Raw materials 2,013 2,069 (2.7) 1m623 24.0
as % of total income 63.0 60.5 58.5
Personnel expenses 143 132 8.3 136 5.1
as % of total income 4.5 3.9 4.9
Other expenses 511 715 (28.5) 659 (22.5)
as % of total income 16.0 20.9 23.8
Total Expenditure 2,667 2,916 (8.5) 2418 10.3
EBIDTA 526 506 4.0 354 48.6
EBIDTA Margin (%) 16.5 14.8 11.4 12.8 29.0
Other income 0 6 NA 1 NA
PBDIT 526 512 2.7 355 48.2
Forex (gain)/ Loss
Depreciation 101 97 4.1 98 3.1
Interest 80 88 (9.1) 89 (10.1)
PBT 345 327 5.5 168 105.4
Prov. For tax 109 106 2.8 54 101.9
% of PBT 31.6 32.4 32.1 (1.7
PAT 236 221 6.8 114 107.0
Minority Interest 0 0 NA 0 NA
Reported PAT 236 221 6.8 114 107.0
Equity capital 239 239 0.0 239 0.0
EPS Rs.(Rs. 10 Paid up) 9.87 9.25 6.8 4.77 107.0
Source: Company, Centrum Research
Exhibit 28: Sensitivity to key variables
Sensitivity to key variables-FY18E % change % impact on EBIDTA % impact on EPS
Sales 1 6.5 16.1
Material cost 1 (3.9) (9.8)
Source: Centrum Research Estimates
Exhibit 29: Key performance indicators
Key performance indicator FY16 FY17 FY18E FY19E FY20E
Sales growth % 3.7 5.3 0.4 23.1 18.8
Material cost % 67.6 65.3 61.0 60.7 60.4
Source: Company, Centrum Research Estimates

23 Aarti Drugs
Valuations, recommendation and risks
ADL is poised for a good growth due to its strong presence in the domestic API market and other markets of Asia, Latin America, Europe and Africa. We expect the company to report 14% CAGR in revenues, 15% CAGR in EBIDTA and 19% CAGR in net profit over three year period FY17-FY20E led by good growth in anti-infective and anti-diabetic products. We expect ADL to generate additional revenues of Rs343mn in FY18 and Rs686mnin FY19 from the capacity addition for Ciprofloxacin. We expect Rs378mn and Rs756mn revenues for the capacity addition of Metformin in FY18 and FY19 respectively.
We expect the company’s EBIDTA margin to decline to 15.5% in FY18E from 15.8% in FY17 due to the GST impact. We expect the EBIDTA margin to improve to 16.1% in FY19E and improve further to 16.5% in FY20E due to the capacity expansion of Ciprofloxacin and Metformin. We expect ADL to report RoE of 22.7% and RoCE of 14.6% for FY20E. We anticipate the company to generate healthy return ratios in future.
We see strong scope for re-rating and value ADL using our conservative five-year AOCF/EV yield methodology to arrive at a target price of Rs940 with an upside of 25% over CMP.
Alternatively, we have valued ADL using P/E method. At the CMP of Rs755, the stock trades at 16.6x FY19E EPS of Rs45.6 and 13.2x FY20E EPS of Rs57.2. We have valued the stock at 17x March’20E EPS of Rs57.2, with a TP of Rs970. This is based on average P/E of 17.0 for last three years. ADL ranks better than its peers due to its wider product basket in the domestic market and presence in Asia, Latin America, Europe and African markets. ADL is a profit-making, dividend-paying company and is poised for good growth.
Cash flow method
We have used the AOCF/ EV Yield (%) method to capture the real operating earnings. The management has flexibility to utilise the operating cash flow towards capex, dividend pay-out, debt repayment and retained earnings for future use. The valuation tool is AOCF/EV Yield (%) values the company on an Enterprise Value basis which in turn is derived from operating earnings. We average the AOCF on a five-year basis to arrive at a normalised cash flow of the company which reveals the real earnings. Using the cash flow valuation method, we have arrived at a target price of Rs940.
Exhibit 30: Target price calculations
Source: Centrum Research Estimates
P/E method
We have alternatively valued ADL on P/E method by considering average P/E value of 17 for last three years and EPS of Rs57.2 to arrive at target price of Rs970.
Exhibit 31: Target price calculations
Average P/E of last 3 years 17.0
EPS for FY20E 57.3
Target price Rs. 970
Source: Centrum Research Estimates
5 year adj. oper. cash flows (FY16-FY20E) 1,107
5 year adj. oper. cash flows / EV Yield ( %) 4.15
Multiple assigned 24.09
EV 26,671
Net Debt-FY20 (4,782)
Market Cap 21,889
Current target Mkt Cap 18,000
Deviation from current TP 3,953
No. of shares (mn) 23.2
Target Price/share (Rs.) 940
Potential upside (%) 25

24 Aarti Drugs
Upside possibilities
� The steady increase in cash flow would meet future capex requirements and strengthen the balance sheet.
� The Marketing authorisation (MA) for Zolpidem tablets and Celecoxib tablets in the UK and Ireland would improve sales and profitability of ADL.
� We expect margin improvement due to backward integration of Cyclopropylamine (CPA) for its intermediate Q acid. This is expected to reduce the raw material cost of Ciprofloxacin , which contributes ~19% to the total revenues of ADL.
� ADL has multiple revenue streams across the API-domestic and exports, Intermediates, Specialty Chemicals and Formulations and hence is not majorly dependent on any of the segments.
Exhibit 32: 1 year forward EV/EBITDA chart Exhibit 33: 1 year forward P/E chart
Source: Bloomberg, Company, Centrum Research Estimates Source: Bloomberg, Company, Centrum Research Estimates
Exhibit 34: Peer comparison
Sector Mkt Cap (Rs mn)
CAGR FY17-FY19E (%) EBITDA Margin (%) PE (x) EV/EBITDA (x) RoE (%) Div Yield (%)
Rev. EBITDA PAT FY17 FY18E FY19E FY17 FY18E FY19E FY17 FY18E FY19E FY17 FY18E FY19E FY17 FY18E FY19E
Aarti Drugs 18,000 11.1 12.1 15.0 15.8 15.5 16.1 16.2 16.0 16.6 9.4 9.3 9.4 21.0 18.2 21.3 2.2 2.2 1.7
Granules India 36,497 21.2 21.4 27.3 20.8 19.7 20.9 19.3 15.3 10.9 10.5 8.6 6.5 21.0 16.1 17.0 0.6 0.6 0.8
Laurus Labs 57,908 20.1 23.9 32.0 21.9 21.3 23.3 23.7 27.1 17.7 15.2 14.1 11.0 17.9 14.5 17.8 0.3 0.3 0.3
Neuland Labs 7,552 9.0 10.7 13.0 15.4 12.9 15.8 25.9 36.3 18.8 11.6 NA 8.6 16.2 9.0 15.8 NA 0.4 0.5
Source: Company, Centrum Research Estimates Prices as on 12h January 2018; NA- Not Available
Business Risks
� ADL derives 36% of its revenues from exports and hence, is subjected to currency fluctuations. Any appreciation in rupee against the dollar would adversely affect the revenues and profitability of the company. However, the company has natural hedge from the import of raw materials.
� The company faces risk of non-compliance with cGMP regulations for its manufacturing facilities, which may result suspension of exports to some of its markets.
� ADL derives ~19% of its revenues from Ciprofloxacin and ~16% of its revenues from Metronidazole and its salt and has high dependence on these products. Any manufacturing, regulatory or marketing issue for these products may adversely impact sales and profitability of the company.
� The company manufactures patent-expired products for the domestic and global markets. ADL is prohibited to sell these products in the countries where the patents are still valid. Any supplies to the countries where the patents are valid would lead to patent infringement with financial liability.
� Majority of API manufactured by ADL uses crude based raw materials. Sudden increase in the crude price is likely to impact the raw material prices. ADL passes on the increase in raw material prices to its customers with a time lag of ~one quarter.
� ADL’s Tarapur facility E-22 was inspected by US FDA in August’14 and is under Import Alert since March’15 due to non-compliance with cGMP regulations. The company has submitted CAPA (corrective action, preventive action) plan to US FDA and is likely to invite US FDA for re-inspection in Q4FY18.
� ADL faces stiff competition for some of its products from China.
0
4
8
12
16
Dec-10
Jun-11
Dec-11
Jun-12
Dec-12
Jun-13
Dec-13
Jun-14
Dec-14
Jun-15
Dec-15
Jun-16
Dec-16
Jun-17
Dec-17
EV/EBITDA Mean
Mean + Std Dev Mean - Std Dev
0
8
16
24
32
Dec-10
Jun-11
Dec-11
Jun-12
Dec-12
Jun-13
Dec-13
Jun-14
Dec-14
Jun-15
Dec-15
Jun-16
Dec-16
Jun-17
Dec-17
P/E Mean
Mean + Std Dev Mean - Std Dev

25 Aarti Drugs
Exhibit 35: Shareholding pattern (%)
% Holding Sept’17 June’17 March’17 Dec'16
Promoters 62.5 62.7 62.5 62.3
FIIs 4.5 4.5 4.5 4.1
DIIs 0.7 0.7 0.7 0.6
Public 32.3 32.1 32.3 33.0
Source: BSE-Sept’17
None of the promoter’s shares are pledged.
Company Background
Aarti Drugs (ADL) is a leading player manufacturing APIs, Intermediates and formulations for domestic and global markets. The company derived ~87% of its revenues from the API and intermediate business and 13% from the sale of formulations. ADL has ~1,200 employees. The company enjoys benefits of vertical integration and economies of scale. ADL’s manufacturing facilities are approved by various regulatory agencies including WHO GMP. The company has filed 17 DMFs with US FDA.
ADL was established in 1984 by a group of technocrats from Mumbai. The company manufactures and markets over 30 APIs in the domestic and global markets. The company also supplies seventeen Specialty Chemicals and Intermediates to other API manufacturers. The details of the same are indicated in Annexure-1. The company has a strong R & D team engaged in the new product development, process improvement, yield enhancement and development of ‘Green Chemistry.’ ADL has a pipeline of thirteen APIs in the lifestyle segment. The details of the same are indicated in Annexure-2. The details of various brands and their manufacturers in the domestic market for the API marketed by ADL are indicated in Annexure- 3.
ADL conducts training programs for its employees in the area of: Technological Development, Quality System Management, Behavioural Change Modules, Individual and Operational safety, Personality Development, Computerisation of Systems etc. In addition to this, the employees are sent for training/seminars at prominent training institutions for upgrading their skills.
Exhibit 36: Key Management Personnel
Name Position Profile
Prakash M Patil Chairman , Managing Director & CEO
He is a Chemical Engineer with over 40 years of experience in Chemical & Pharmaceutical industry. He has
expertise in product identification, project implementation and manufacturing.
Rashesh C Gogri Managing Director
He is an Industrial Engineer and holds Diploma in Business Management. He is the Managing Director of
ADL and has over 17 years of experience in production, marketing and project management in chemical
industry. He is also the Director of Aarti Industries.
Harshit M Savla
Jt. Managing Director
He holds Bachelor’s Degree in Commerce and has over 30 years of experience in finance, exports and administration. He has played a crucial role in expanding the export market for the company’s products.
Harit P. Shah Whole Time Director He holds Bachelor’s Degree in Commerce. He has over 25 years of experience in handling commercial
functions namely sales, purchase and exports. He looks after domestic sales and exports.
Uday M. Patil Whole Time Director He has good experience in the factory administration work and co-ordination with Government/ Semi-Government departments and agencies.
Rajendra V .Gogri Non-Executive Director
He holds Bachelor’s Degree in Chemical Technology from UDCT, Mumbai and Master’s Degree in Science
from USA. He has rich experience in handling the portfolio of marketing, purchase and other commercial
matters. He is actively involved in export development. He has good knowledge of accounts, finance,
taxation, legal and other commercial matters. He is also the Chairman of Aarti Industries.
Ramdas M. Gandhi Independent Director
He holds L.L.M. Degree and is solicitor by profession. He practised in Bombay High Court for over 55 years.
He is a corporate lawyer and has vast experience In commercial law and corporate law. He is also the
Director of Aarti Industries.
Krishnacharya G. Akamanchi
Independent Director
He holds Master’s Degree and Doctorate in Technology. He is the Professor and Head of Department at
UDCT, Mumbai. He has vast experience in handling industrial projects involving complex processes. He is
involved in the development of new technology. He provides consultancy in emerging areas for various
industries.
Dr. Vilas G. Gaikar Independent Director He holds Doctorate in Technology and has wide experience of over 25 years in the chemical industry.
Bhavesh R. Vora Independent Director
He is a Chartered Accountant by profession with over 27 years of experience in working in the areas of Stock Broking, Audit and Compliances, Derivatives, Futures & Options, Accounting Standards and Internal Management Control and Audit. He is also the Director of Aarti Industries.
Priti. P. Savla Independent Director She is a Chartered Accountant by profession. She is also the Director of Aarti Industries.
Navin C. shah Independent Director He is a Chartered Accountant by profession having over 27 years of experience.
Adhish P Patil CFO
He holds Master’s Degree in Business Administration in Finance along with Degree in Engineering in Information Technology. He has experience in project management and implementing of technology based solutions. He has over 12 years of experience in Finance, Forex, Risk Management and Hedging Strategies.
Source: Company Annual Reports

26 Aarti Drugs
Corporate Governance-highlighting the finer points
Independent directors’ representation on the company board
The board of ADL has equal stregth of independent and promoter directors indicating good corporate goverance. The independent directors add value from their broader business perspective which benefit the company. Higher independence and autonomy of Board of Directors is generally positive for all stakeholders and ADL dispays this trait consistently. We expect the independent directors to participate effectively in voting for Board Resolutions. The details of the same are indicated in the following table:
Exhibit 37: Representation of promoter and independent directors on the ADL Board
Particulars FY11 FY12 FY13 FY14 FY15 FY16 FY17
Aarti Drugs
Total strength 12 12 12 12 12 12 12
Promoter Group directors 4 4 4 5 5 5 5
Promoter -Non Executive 2 2 2 1 1 1 1
Independent directors 6 6 6 6 6 6 6
% share of promoters 50 50 50 50 50 50 50
% share of independent 50 50 50 50 50 50 50
Source: Company Reports, Centrum Research
Compensation to promoters of ADL
ADL promoters drew 4.9% of PBT on an average as their compensation during FY11-FY17. The lowest being 4.1% of PBT in FY17 and the highest of 9.6% of PBT during FY12. The promoters have drawn lower remuneration in order to conserve the resources for future growth of the company. We expect ADL promoters to continue conserving the resources to derive good benefits in future. The details of the same are indicated in the following table:
Exhibit 38: promoter compensation
Name (Rs mn) FY11 FY12 FY13 FY14 FY15 FY16 FY17 FY11-FY17Total
Aarti Drugs
Prakash M. Patil 5.0 11.1 8.6 11.7 11.8 11.6 12.5 72.3
% share of PBT 1.5 3.3 1.3 1.4 1.2 1.2 1.1 1.4
Rashesh C. Gogri 0 0.0 7.9 4.9 11.3 10.7 11.4 46.2
% share of PBT 0.0 0.0 1.2 0.6 1.1 1.1 1.0 0.9
Harshit M.Savla 4.5 10.5 8.0 10.9 11.3 10.7 11.4 67.3
% share of PBT 1.4 3.1 1.2 1.3 1.1 1.1 1.0 1.3
Harit. P. Shah 4.2 10.2 7.8 10.9 11.3 10.7 11.4 66.5
% share of PBT 1.3 3.1 1.2 1.3 1.1 1.1 1.0 1.3
Uday M. Patil 0.4 0.4 0.4 0.5 0.6 0.6 0.6 3.5
% share of PBT 0.1 0.1 0.1 0.1 0.1 0.1 0.1 0.1
Total 14.1 32.2 32.7 38.9 46.3 44.3 47.3 255.8
% share of PBT 4.3 9.6 4.9 4.6 4.6 4.7 4.1 4.9
Source: Company Reports, Centrum Research

27 Aarti Drugs
Independent directors profile and compensation
ADL has six independent directors on its Board. Four of the directors are also on the Board of other pharma/ non-pharma companies. Three of the independent directors are also on the Board of Aarti Industries-a Group Company of ADL. The presence in other industries, gives the board a wider perspective to look beyound the industry. We expect the independent directors to effectively participate in the Board meeting to the best of their knowledge and ability. However, the compensation paid to the independent directors is lower compared to the profit generated by the company. The details of the same are as follows:
Exhibit 39: Independent directors profile and compensation
Name (Rs mn)
Since No. of directorship Companies in which director FY17 as % of
in other cos. in FY17 compensation FY16 PBT
Aarti Drugs
Ramdas M. Gandhi 2012 2 Aarti Industries, Unichem Labs 0.14 0.01
Bhavesh. R. Vora 2012 3 Aarti Inds, Farry Industries, IGC Foils 0.1 0.01
Prof. Krishnacharya G. Akamanchi 2012 Nil NA 0.1 0.01
Dr. Vilas G. Gaikar 2012 Nil NA 0.0 0.00
Navin C. Shah 2012 3 Hind Aluminium Inds, Insecticides India, 0.1 0.01
Anshuni Commercials
Priti P. Savla 2015 1 Aarti industries 0.1 0.01
Total
0.5 0.05
Source: Company Reports, Centrum Research
Related party transactions
ADL’s related party transactions are with its subsidary company, related parties, KMP and relatives of KMP. The major transactions are under employee benefits ranging from 22-35% of the employee cost. Other major head is outstanding unsecured loan from KMP ranging from 0.3% to 7.6% of the loans & advances. We expect that ADL management would have adequate control over the related party transactions.
The details of the same are as follows:
Exhibit 40: Related Party Transactions
Particulars (in %) Relationship FY11 FY12 FY13 FY14 FY15 FY16 FY17
Aarti Drugs
Sales & income from operations subsidiary 0.0 0.0 0.0 0.0 0.0 0.0 0.2
Manufacturing Expenses subsidiary 0.0 0.9 0.2 2.7 1.7 1.4 2.3
Interest subsidiary 0.0 0.0 0.0 0.0 2.0 1.3 1.4
Outstanding payable related parties 0.0 2.2 0.9 1.8 0.9 1.7 2.1
Outstanding receivable related parties 0.0 0.0 0.0 0.0 0.0 0.0 0.0
Outstanding unsecured loan related parties 0.0 0.0 0.0 0.0 5.2 4.4 4.7
Employee benefits Relatives 0.0 0.6 1.1 1.0 0.8 0.9 0.7
Employee benefits KMP 22.0 35.2 32.1 33.0 32.3 29.4 24.7
Employee benefits Relatives of KMP 0.0 1.5 2.8 3.5 2.7 2.0 1.5
Borrowing costs KMP 0.1 0.9 1.0 1.0 1.2 1.8 2.1
Borrowing costs Relatives of KMP 0.0 1.7 1.4 1.3 1.2 0.0 0.0
Unsecured loans accepted KMP 0.0 0.8 0.1 0.4 3.8 0.3 0.0
Unsecured loans repaid KMP 0.0 0.0 0.4 0.0 0.8 0.0 0.0
Unsecured loans repaid Relatives of KMP 0.0 0.2 0.3 0.0 3.4 0.0 0.0
Outstanding unsecured loan KMP 0.3 4.6 2.9 4.2 7.4 7.0 7.6
Total 22.4 48.6 43.2 48.9 63.4 50.2 47.3
Source: Annual Reports
Contingent liabilities
ADL has contingent liabilities amounting to 15% to 24% of its net worth during FY11-FY17. The same has declined from 23% in FY15 to 15% in FY17 due to the reduction in bank guarantees , letter of credit and demand under income tax dispute. The contingent liabilities are mainly arising from bank guarantee and letter of credit, which constitute 5% to 17% of net worth. Since these liabilities are the part of regular course of business, they are not significant. During FY16 and FY17, ADL has extended corporate guarantee of Rs185mn and Rs357mn respectively. This works out to be 5% to 9% of net worth. The corporate guarantee is

28 Aarti Drugs
also the part of the regular course of business. The bank guarantee, letter of ctredit and corporate guarantee are likely to increase with the increase in the size of the business. Excluding the same, the other liabilities are not significant. The details are as follows:
Exhibit 41: Contingent Liabilities
Particulars (Rs mn) FY11 FY12 FY13 FY14 FY15 FY16 FY17
Aarti Drugs
Bank Guarantees, Letter of credit 151 226 269 427 458 379 189
Demand under Income tax dispute 3 25 49 120 113 35 29
Sales tax demand 0 0 0 0 0 2 2
Excise duty, fine and penalty 10 10 10 8 8 4 7
Liability on imported raw material 6 6 16 16 19 26 26
Capital account contracts 70 41 73 21 121 30 18
Corporate Guarantee 0 0 0 0 0 185 357
Total 240 308 417 592 719 661 628
% share of Net Worth 14.7 17.5 20.1 23.6 23.3 18.5 15.3
Source: Annual Reports, Centrum Institution Research
Promoter ownership trend
The promoter holding of ADL has increased gradually to 62.5%% in FY17 from 54.0% in FY11 with a 8.5% increase over a 8 year period. This indicated the faith and confidence of the promoters in the company and its future prospects. The promoter’s holding in FY08 was 48.4% which increased to 53.1% in FY09 and declined to 50.0% in FY10.
The promoter’s shareholding in J.B. Chemicals & Pharmaceuticals (JBCPL) has increased marginally to 55.8% from 55.4% during similar period. In case of FDC, it has increase to 68.9% from 66.4% due to buyback of shares. The promoter’s holding in Unichem Labs has increased to 50.1% in FY17 from 48.7% in FY11 through creeping acquisitions. This indictes that all these pharma company promoters have increased their holdings over the six year period. All the companies have more than 50% promoter’s holding which is comfortable. We expect the promoters of these companies to further consolidate their holdings to re-gain faith and confidence of the minority shareholders.
The details of the same are indicated in the following table:
Exhibit 42: Promoter Holding
Promoter Holding % FY11 FY12 FY13 FY14 FY15 FY16 FY17
Aarti Drugs 54.0 55.6 57.4 59.6 60.1 61.9 62.5
JBCPL 55.4 55.9 55.9 55.9 55.8 55.8 55.8
FDC 66.4 67.0 67.6 68.9 68.9 68.9 68.9
Unichem Labs 48.7 49.6 50.0 50.2 50.1 50.1 50.1
Source: Annual Reports
Exhibit 43: Promoter’s Holdings %
Source: BSE website
48.4
53.1
50.0
54.0
55.6
57.4
59.6 60.1
61.962.5
40
45
50
55
60
65
FY08 FY09 FY10 FY11 FY12 FY13 FY14 FY15 FY16 FY17
%

29 Aarti Drugs
Auditors
ADL paid 0.1% of PBT to its auditors in FY17. The company’s auditors Gokhale & Sathe are also auditors of other renowned companies namely Aarti Industries, Dena Bank, IRB Infrastructure Development and MEP Infrastructure. ADL has also inducted cost auditor Girikrishna Maniar for the cost audit of its manufacturing activities. The company has appointed M/s GBCA & Associates-Chartered Accountants as auditors for the period of one year in August’17. GBCA & Associates are Auditors for Union Bank and Navneet Education currently. The details of the same are as follows:
Exhibit 44: Auditor remuneration
Company (Rs mn) Auditors Name Type Other companies audited Audit Fees -FY17 as % of PBT
Aarti Drugs Gokhale & Sathe Statutory Aarti industries, Dena Bank, 0.97 0.1
IRB Infra Devt, MEP Infrastructure
Girikrishna. S. Maniar Cost
0.3 0.0
Source: Annual Report, Centrum Research
CSR Activities
ADL has spent 2.1% of its net profit on CSR activities during FY15-FY17 in line with the industry. The company has spent the CSR amount in various social activities in education & skill development, healthcare, environment protection, social welfare and promotion of sports and allied trainings. These activities have been carried out at Boisar, Amravati, Palghar and Nashik in Maharashtra and in Vatrak in Gujarat. We expect the company to fulfill its CSR obligations in future for the welfare of the society.
The details of the same are as follows:
Exhibit 45: CSR Activities
Company (Rs mn) Year Amt. spent Amt. Required to spent % of required amt. Net profit as % of net profit
Aarti Drugs
FY15 11.0 12 91.7 772 1.4
FY16 17.5 17 102.9 686 2.6
FY17 18.5 18.5 100.0 805 2.3
Source: Annual reports

30 Aarti Drugs
Annexures
Annexure-1
Exhibit 46: Specialty Chemicals and Intermediates marketed
Sr. No. Product
Specialty chemicals
1 Benzene sulphonamide
2 Benzene sulphonic acid
3 Benzene sulphonic acid methyl ester
4 Benzyl sulphonyl chloride
5 Cipro Q acid
6 Levofloxacin Q acid
7 Methyl nicotinate
8 N-methyl methane sulphonamide
9 N-phenyl benzene sulphonamide
10 Norfloxacin Q Acid
11 Ofloxacin Q acid
12 O-para toluene sulphonamide
13 Ortho/para toluene sulphonic acid methyl ester
14 Para chloro benzene sulphonamide
15 Para chloro benzene sulphonyl chloride
16 Para toluene sulphonamide
17 Para toluene sulphonic acid methyl ester
18 Para toluene sulphonyl chloride
19 Sodium benzene sulphonate
Intermediates for
1 Ciprofloxacin
2 Metronidazole
3 Celecoxib
4 Clopidogrel
5 Diclofenac sodium
6 Ketoconazole
7 Nimesulide
8 Reloxifene
9 Zolpidem
10 Telmisartan
Source: Company website

31 Aarti Drugs
Annexure-2
Exhibit 47: APIs under development
Product Therapeutic category Patented product Patent holder
Atorvastatin cholesterol reducer Lipitor Pfizer
Colesevelam cholesterol reducer Welchol Daiichi Sankyo
Dabigatran anticoagulant Pradaxa Boehringer Ingelheim
Dronedarone CVS Multaq Sanofi Aventis
Olmesartan CVS Olmecip Daiichi Sankyo
Valsartan CVS Diovan Novartis
Sitagliptin anti-diabetic Januvia MSD
Teneligliptin anti-diabetic Tenelia Mitsubishi Pharma
Acamprosate alcoholism treatment Campral Forest Labs
Sevelamer kidney dialysis Renagel Genzyme
Duloxetine anti-depressant Cymbalta Eli Lilly
Loxoprofen sodium anti-inflammatory Loxonin Daiichi Sankyo
Mesalamine anti-inflammatory Mesalazine Disphar International
Source: Company website, Centrum Research
Annexure-3
Exhibit 48: Major APIs and Domestic Brands
API Domestic Brands & Manufacturers
Aceclofenac Arflur-FDC, Aroff-Unichem, Signoflam SR-Lupin, Fortafen-Alembic, Zynac-Zydus Cadila
Celecoxib Celact-Sun Pharma, Celedol-Ipca Labs, Zycel-Zydus Cadila, Revibra-Dr. Reddy's Labs
Diclofenac sodium Delta K-Sun Pharma, Diclonac-Lupin,Voveran-Novartis, Jonac-Zydus Cadila
Diclofenac potassium Cataspa-USV, Diclosef-Sun Pharma
Diclofenac diethylamine Relaxyl-Franco Indian, Unigel-Unichem, Volini Gel-Sun Pharma
Nimesulide Auronim-Aurobindo, Lupisulide-Lupin, Nimegesic-Alembic, Nise-Dr.Reddy's Labs
Clopidogrel bisulphate Aptogrel-Aurobindo, Clodrel-Unichem, Clopilet-Sun Pharma, Clopitab-Lupin
Ticlopidine HCl Ticlop-Zydus Cadila, Tikleen-Ipca Labs, Tilkon-FDC, Tyklid-Torrent
Telmisartan Telday-Torrent, Telista-Lupin, Telma-Glenmark, Telsar-Unichem, Tetan-Alembic
Metronidazole Ivmetro-Torrent,Flagyl-Abbott Healthcare, Metrogyl-J B Chem, Metron-Alkem Labs
Ornidazole Dazolic-Sun Pharma, Entamizole-Abbott India, Orni-Zydus Cadila,Giro-Panacea HC
Secnidazole Ambiform-Glaxo SK, Etisec-Novartis, Flagentyl-Sanofi India, Amitab-Wockhardt
Tinidazole Fasigyn-Pfizer, Tiniba-Zydus Cadila, Tinibid-Sun Pharma
Diloxanide furoate Metron DF-Alkem, Tiniba DF-Zydus Cadila, Wotinex-Wockhardt
Ketoconazole Fungicide-Torrent, Ketozole-Sun Pharma, Nizral-Johnson & Johnson
Tolnaftate Tinaderm-Fulford, Dermitop-Cadila Pharma
Raloxifene HCl Bonmax-Zydus Cadila, Esserm-Torrent, Fiona-Dr. Reddy's Labs, Ralofen-Lupin
Ciprofloxacin HCl Alcipro-Alkem, C OD-Glaxo SK Pharma, Cifran-Sun Pharma, Ciprolet-Dr. Reddy's Labs
Enrofloxacin base Baytril Veterinary-Bayer
Gatifloxacin sesquihydrate Gate-Ajanta Pharma, Gatilox-Sun Pharma, Zigat-FDC, Zymar-Allergan
Levofloxacin Alevo-Alkem, Glevo-Glenmark, L Cin-Lupin, Leon-Dr. Reddy's Labs,Loxof-Sun Pharma
Moxifloxacin Moxif-Torrent, Staxom-Sun Pharma, Moxicip-Cipla
Norfloxacin Alflox-Alkem, Nitdin-lupin, Norbid-Alembic, Norflox-Cipla,Norilet-Dr. Reddy's Labs
Ofloxacin Oflatoon-Zydus Cadila, Oflomil-Glenmark, Olfi-Ipca Labs, Tarivid-Sanofi India
Metformin HCl Cetapin XR-Sanofi India, Dibeta-Torrent , Emnorm-Ipca Labs, Glycomet-USV
Pioglitazone HCl Diavista-Dr. Reddy's Labs, G tase-Unichem, Glizone-Zydus Cadila, Pioglit-Sun Pharma
Rivastigmine tartarate Exelon-Novartis India, Rivadem-Torrent
Zolpidem tartarate Nitrest-Sun Pharma, Sove-Ipca Labs, Stilnoct-Sanofi India, Zolfresh-Abbott India
Niacin Nialip-Dr.Reddy's Labs, Neasyn SR-Torrent
Acamprosate Campral- Merck, Germany (imported)
Source: Centrum Research, IDR

32 Aarti Drugs
Financials – consolidated-historical
Exhibit 49: Income Statement
Y/E Mar (Rs mn) FY11 FY12* FY13* FY14* FY15
Revenues 5,009 6,593 8,247 9,700 10,943
Material cost 3,342 4,536 5,554 6,625 7,500
% of revenues 66.7 68.8 67.3 68.3 68.5
Employee cost 215 249 286 324 380
% of revenues 4.3 3.8 3.5 3.3 3.5
Other Expenses 761 1,009 1,185 1,267 1,365
% of revenues 15.2 15.3 14.4 13.1 12.5
EBIDTA 691 799 1,222 1,484 1,698
EBIDTA margin (%) 13.8 12.1 14.8 15.3 15.5
Depreciation & Amortisation 191 242 260 282 310
EBIT 500 557 962 1,202 1,388
Interest Expenses 171 254 309 372 423
PBT from operations 329 303 653 830 965
Other income 2 31 9 18 32
PBT 331 334 662 848 997
Tax provision 96 110 210 231 225
Effective tax rate (%) 29.0 32.9 31.7 27.2 22.6
Net profit 235 224 452 617 772
Minority interest - - - - -
Reported net profit 235 224 452 617 772
Adj. Net profit 235 224 452 617 772
Source: Company, Centrum Research , * Standalone Results
Exhibit 50: Key Ratios
Y/E Mar (Rs mn) FY11 FY12* FY13* FY14* FY15
Growth Ratios (%)
Revenues 4.7 31.6 25.1 17.6 12.8
EBIDTA (16.1) 15.6 52.9 21.4 14.4
Adj. Net Profit (17.3) (4.7) 101.8 36.5 25.1
Margin Ratios (%)
EBIDTA margin 13.8 12.1 14.8 15.3 15.5
PBT from operations margin 6.6 4.6 7.9 8.6 8.8
Adj. PAT margin 4.7 3.4 5.5 6.4 7.1
Return Ratios (%)
RoCE 8.8 8.5 13.2 15.4 15.9
RoE 15.2 13.2 23.5 26.9 27.6
RoIC 8.9 8.1 13.2 15.2 15.6
Turnover ratios (days)
Gross Block Turnover (x) 1.4 1.6 1.8 1.8 1.7
Debtors 88 100 95 104 105
Creditors 44 52 58 57 56
Inventory 67 54 62 48 55
Cash Conversion Cycle 111 102 99 95 104
Solvency Ratio
Debt-Equity 1.6 1.5 1.4 1.4 1.3
Net Debt-Equity 1.6 1.5 1.4 1.3 1.3
Current Ratio 3.7 2.4 2.2 2.1 2.2
Interest Coverage Ratio 0.3 0.5 0.3 0.3 0.3
Gross Debt/EBIDTA 3.9 3.4 2.4 2.3 2.4
Per Share (Rs)
FDEPS (adjusted) 10.1 9.6 19.3 26.4 33.0
CEPS 18.2 19.9 30.5 38.5 46.3
Book Value 69.9 75.5 88.8 107.3 131.9
Dividend 5.0 5.0 10.0 13.0 8.0
Dividend Payout (%) 29.8 31.3 31.0 29.7 29.3
Valuations (x) (Avg Mkt Cap)
PER 12.9 11.0 8.1 7.5 11.6
P/BV 1.9 1.4 1.8 1.9 2.9
EV/EBIDTA 6.1 5.0 4.0 3.9 7.9
Dividend Yield (%) 4.5 5.5 7.4 7.6 2.4
5-yr Avg AOCF/EV yield(%) NA 5.8 5.9 5.6 2.8
Source: Company, Centrum Research, * Standalone Results
Exhibit 51: Balance Sheet
Y/E Mar (Rs mn) FY11 FY12* FY13* FY14* FY15
Share capital 121 121 121 121 242
Sh. Application money - - - - -
Reserves & surplus 1,512 1,644 1,955 2,388 2,840
Total shareholders Funds 1,633 1,765 2,076 2,509 3,082
Total Debt 2,674 2,727 2,956 3,422 4,160
Minority interest - - - - -
Deferred tax Liab. 227 245 276 311 350
Total Liabilities 4,534 4,737 5,308 6,242 7,592
Gross Block 3,934 4,394 4,791 5,812 6,854
Less: Acc. Depreciation 1,455 1,657 1,878 2,087 2,369
Net Block 2,479 2,737 2,913 3,725 4,485
Capital WIP 104 30 126 83 161
Net Fixed Assets 2,583 2,767 3,039 3,808 4,646
Investments 53 68 50 45 46
Inventories 918 979 1,409 1,267 1,642
Debtors 1,214 1,806 2,157 2,766 3,143
Loans & Advances 383 294 223 293 248
Cash & Bank Balance 53 50 29 43 36
Other assets 29 163 291 274 260
Total Current Assets 2,597 3,292 4,109 4,643 5,329
Trade payable 603 938 1,319 1,502 1,667
Other current Liabilities 66 362 403 555 538
Provisions 30 90 168 197 224
Net Current Assets 1,898 1,902 2,219 2,389 2,900
Total Assets 4,534 4,737 5,308 6,242 7,592
Source: Company, Centrum Research , * Standalone Results
Exhibit 52: Cash Flow
Y/E Mar (Rs mn) FY11 FY12* FY13* FY14* FY15
CF before WC changes 718 821 1,197 1,460 1,691
Working Capital Changes (402) (308) (338) (241) (495)
CF from Operations 205 443 723 953 1,047
Adj OCF (OCF-Interest) 34 189 414 581 624
Change in fixed assets (681) (473) (600) (1,065) (1,070)
Adj. FCF (AOCF-Capex) (647) (284) (186) (484) (446)
CF from Investing (764) (478) (580) (1,047) (1,071)
CF from Financing 525 30 (163) 108 14
Net change in Cash (34) (5) (20) 14 (10)
Source: Company, Centrum Research , * Standalone Results

33 Aarti Drugs
Financials -consolidated
Exhibit 53: Income Statement
Y/E Mar (Rs mn) FY16 FY17 FY18E FY19E FY20E
Revenues 11,349 11,952 12,001 14,769 17,542
Material cost 7,668 7,805 7,320 8,960 10,595
% of revenues 67.6 65.3 61.0 60.7 60.4
Employee cost 448 541 568 669 775
% of revenues 3.9 4.5 4.7 4.5 4.4
Other Expenses 1,485 1,715 2,253 2,765 3,274
% of revenues 13.1 14.3 18.8 18.7 18.7
EBIDTA 1,748 1,891 1,860 2,375 2,898
EBIDTA margin (%) 15.4 15.8 15.5 16.1 16.5
Depreciation & Amortisation 366 384 408 458 522
EBIT 1,382 1,507 1,452 1,917 2,376
Interest Expenses 480 400 325 375 450
PBT from operations 902 1,107 1,127 1,542 1,926
Other income 50 40 21 28 32
PBT 952 1,147 1,148 1,570 1,958
Tax provision 266 342 355 505 620
Effective tax rate (%) 27.9 29.8 30.9 32.2 31.7
Net profit 686 805 793 1,065 1,338
Minority interest - - - - -
Reported net profit 686 805 793 1,065 1,338
Adj. Net profit 686 805 793 1,065 1,338
Source: Company, Centrum Research Estimates
Exhibit 54: Key Ratios
Y/E Mar (Rs mn) FY16 FY17 FY18E FY19E FY20E
Growth Ratios (%) Revenues 3.7 5.3 0.4 23.1 18.8
EBIDTA 2.9 8.2 (1.6) 27.7 22.0
Adj. Net Profit (11.1) 17.3 (1.5) 34.3 25.6
Margin Ratios (%)
EBIDTA margin 15.4 15.8 15.5 16.1 16.5
PBT from operations margin 7.9 9.3 9.4 10.4 11.0
Adj. PAT margin 6.0 6.7 6.6 7.2 7.6
Return Ratios (%)
RoCE 12.8 12.4 10.8 12.9 14.6
RoE 20.6 21.0 18.2 21.3 22.8
RoIC 12.5 12.1 10.8 12.9 14.6
Turnover ratios (days)
Gross Block Turnover (x) 1.6 1.5 1.3 1.5 1.6
Debtors 107 91 92 91 92
Creditors 59 60 61 61 61
Inventory 57 64 65 63 62
Cash Conversion Cycle 105 95 96 94 94
Solvency Ratio
Debt-Equity 1.3 1.1 1.0 0.9 0.8
Net Debt-Equity 1.2 1.1 1.0 0.9 0.7
Current Ratio 2.2 2.1 2.1 2.1 2.1
Interest Coverage Ratio 0.3 0.3 0.2 0.2 0.2
Gross Debt/EBIDTA 2.6 2.4 2.5 2.0 1.7
Per Share (Rs)
FDEPS (adjusted) 29.3 34.4 33.9 45.6 57.2
CEPS 45.0 50.9 51.4 65.2 79.6
Book Value 152.9 175.7 197.4 229.7 273.1
Dividend 6.8 10.7 1.5 2.0 2.5
Dividend Payout (%) incl. Buyback 28.0 37.0 35.8 28.9 24.0
Valuations (x) (Avg Mkt Cap)
PER 20.2 16.2 16.0 16.6 13.2
P/BV 3.9 3.2 2.7 3.3 2.8
EV/EBIDTA 10.8 9.4 9.3 9.4 7.7
Dividend Yield (%) 1.3 2.2 2.2 1.7 1.8
5-yr Avg AOCF/EV yield(%) 2.8 4.3 5.3 4.4 5.0
Source: Company, Centrum Research Estimates
Exhibit 55: Balance Sheet
Y/E Mar (Rs mn) FY16 FY17 FY18E FY19E FY20E
Share capital 242 239 236 234 232
Sh. Application money - - - - -
Reserves & surplus 3,332 3,869 4,378 5,136 6,152
Total shareholders Funds 3,574 4,108 4,615 5,370 6,384
Total Debt 4,497 4,463 4,630 4,850 4,920
Minority interest - - - - -
Deferred tax Liab. 404 475 490 500 520
Total Liabilities 8,475 9,046 9,735 10,720 11,824
Gross Block 7,255 8,516 9,484 10,379 11,254
Less: Acc. Depreciation 2,320 2,706 3,114 3,572 4,094
Net Block 4,935 5,810 6,370 6,807 7,160
Capital WIP 340 143 100 110 120
Net Fixed Assets 5,275 5,953 6,470 6,917 7,280
Investments 46 36 39 41 43
Inventories 1,783 2,098 2,142 2,567 2,998
Debtors 3,317 2,968 3,040 3,700 4,420
Loans & Advances 241 268 285 310 355
Cash & Bank Balance 48 41 121 112 138
Other assets 312 411 475 479 530
Total Current Assets 5,701 5,786 6,063 7,168 8,441
Trade payable 1,849 1,970 2,010 2,480 2,910
Other current Liabilities 545 560 597 651 710
Provisions 153 199 230 275 320
Net Current Assets 3,154 3,057 3,226 3,762 4,501
Total Assets 8,475 9,046 9,735 10,720 11,824
Source: Company, Centrum Research Estimates
Exhibit 56: Cash Flow
Y/E Mar (Rs mn) FY16 FY17 FY18E FY19E FY20E
CF before WC changes 1,745 1,887 1,875 2,395 2,920
Working Capital Changes (212) 72 (120) (590) (758)
CF from Operations 1,333 1,745 1,475 1,380 1,632
Adj OCF (OCF-Interest) 853 1,345 1,150 1,005 1,182
Change in fixed assets (997) (1,071) (925) (905) (885)
Adj. FCF (AOCF-Capex) (144) 274 225 100 297
CF from Investing (988) (1,070) (922) (899) (877)
CF from Financing (333) (682) (683) (712) (952)
Net change in Cash 12 (7) (130) (231) (197)
Source: Company, Centrum Research Estimates

34 Aarti Drugs
Appendix A
Disclaimer
Centrum Broking Limited (“Centrum”) is a full-service, Stock Broking Company and a member of The Stock Exchange, Mumbai (BSE) and National Stock Exchange of India Ltd. (NSE). Our holding company, Centrum Capital Ltd, is an investment banker and an underwriter of securities. As a group Centrum has Investment Banking, Advisory and other business relationships with a significant percentage of the companies covered by our Research Group. Our research professionals provide important inputs into the Group's Investment Banking and other business selection processes.
Recipients of this report should assume that our Group is seeking or may seek or will seek Investment Banking, advisory, project finance or other businesses and may receive commission, brokerage, fees or other compensation from the company or companies that are the subject of this material/report. Our Company and Group companies and their officers, directors and employees, including the analysts and others involved in the preparation or issuance of this material and their dependants, may on the date of this report or from, time to time have "long" or "short" positions in, act as principal in, and buy or sell the securities or derivatives thereof of companies mentioned herein. Centrum or its affiliates do not own 1% or more in the equity of this company Our sales people, dealers, traders and other professionals may provide oral or written market commentary or trading strategies to our clients that reflect opinions that are contrary to the opinions expressed herein, and our proprietary trading and investing businesses may make investment decisions that are inconsistent with the recommendations expressed herein. We may have earlier issued or may issue in future reports on the companies covered herein with recommendations/ information inconsistent or different those made in this report. In reviewing this document, you should be aware that any or all of the foregoing, among other things, may give rise to or potential conflicts of interest. We and our Group may rely on information barriers, such as "Chinese Walls" to control the flow of information contained in one or more areas within us, or other areas, units, groups or affiliates of Centrum. Centrum or its affiliates do not make a market in the security of the company for which this report or any report was written. Further, Centrum or its affiliates did not make a market in the subject company’s securities at the time that the research report was published.
This report is for information purposes only and this document/material should not be construed as an offer to sell or the solicitation of an offer to buy, purchase or subscribe to any securities, and neither this document nor anything contained herein shall form the basis of or be relied upon in connection with any contract or commitment whatsoever. This document does not solicit any action based on the material contained herein. It is for the general information of the clients of Centrum. Though disseminated to clients simultaneously, not all clients may receive this report at the same time. Centrum will not treat recipients as clients by virtue of their receiving this report. It does not constitute a personal recommendation or take into account the particular investment objectives, financial situations, or needs of individual clients. Similarly, this document does not have regard to the specific investment objectives, financial situation/circumstances and the particular needs of any specific person who may receive this document. The securities discussed in this report may not be suitable for all investors. The securities described herein may not be eligible for sale in all jurisdictions or to all categories of investors. The countries in which the companies mentioned in this report are organized may have restrictions on investments, voting rights or dealings in securities by nationals of other countries. The appropriateness of a particular investment or strategy will depend on an investor's individual circumstances and objectives. Persons who may receive this document should consider and independently evaluate whether it is suitable for his/ her/their particular circumstances and, if necessary, seek professional/financial advice. Any such person shall be responsible for conducting his/her/their own investigation and analysis of the information contained or referred to in this document and of evaluating the merits and risks involved in the securities forming the subject matter of this document.
The projections and forecasts described in this report were based upon a number of estimates and assumptions and are inherently subject to significant uncertainties and contingencies. Projections and forecasts are necessarily speculative in nature, and it can be expected that one or more of the estimates on which the projections and forecasts were based will not materialize or will vary significantly from actual results, and such variances will likely increase over time. All projections and forecasts described in this report have been prepared solely by the authors of this report independently of the Company. These projections and forecasts were not prepared with a view toward compliance with published guidelines or generally accepted accounting principles. No independent accountants have expressed an opinion or any other form of assurance on these projections or forecasts. You should not regard the inclusion of the projections and forecasts described herein as a representation or warranty by or on behalf of the Company, Centrum, the authors of this report or any other person that these projections or forecasts or their underlying assumptions will be achieved. For these reasons, you should only consider the projections and forecasts described in this report after carefully evaluating all of the information in this report, including the assumptions underlying such projections and forecasts.
The price and value of the investments referred to in this document/material and the income from them may go down as well as up, and investors may realize losses on any investments. Past performance is not a guide for future performance. Future returns are not guaranteed and a loss of original capital may occur. Actual results may differ materially from those set forth in projections. Forward-looking statements are not predictions and may be subject to change without notice. Centrum does not provide tax advice to its clients, and all investors are strongly advised to consult regarding any potential investment. Centrum and its affiliates accept no liabilities for any loss or damage of any kind arising out of the use of this report. Foreign currencies denominated securities are subject to fluctuations in exchange rates that could have an adverse effect on the value or price of or income derived from the investment. In addition, investors in securities such as ADRs, the value of which are influenced by foreign currencies effectively assume currency risk. Certain transactions including those involving futures, options, and other derivatives as well as non-investment-grade securities give rise to substantial risk and are not suitable for all investors. Please ensure that you have read and understood the current risk disclosure documents before entering into any derivative transactions.
This report/document has been prepared by Centrum, based upon information available to the public and sources, believed to be reliable. No representation or warranty, express or implied is made that it is accurate or complete. Centrum has reviewed the report and, in so far as it includes current or historical information, it is believed to be reliable, although its accuracy and completeness cannot be guaranteed. The opinions expressed in this document/material are subject to change without notice and have no obligation to tell you when opinions or information in this report change.
This report or recommendations or information contained herein do/does not constitute or purport to constitute investment advice in publicly accessible media and should not be reproduced, transmitted or published by the recipient. The report is for the use and consumption of the recipient only. This publication may not be distributed to the public used by the public media without the express written consent of Centrum. This report or any portion hereof may not be printed, sold or distributed without the written consent of Centrum.
The distribution of this document in other jurisdictions may be restricted by law, and persons into whose possession this document comes should inform themselves about, and observe, any such restrictions. Neither Centrum nor its directors, employees, agents or representatives shall be liable for any damages whether direct or indirect, incidental, special or consequential including lost revenue or lost profits that may arise from or in connection with the use of the information.
This document does not constitute an offer or invitation to subscribe for or purchase or deal in any securities and neither this document nor anything contained herein shall form the basis of any contract or commitment whatsoever. This document is strictly confidential and is being furnished to you solely for your information, may not be distributed to the press or other media and may not be reproduced or redistributed to any other person. The distribution of this report in other jurisdictions may be restricted by law and persons into whose possession this report comes should inform themselves about, and observe any such restrictions. By accepting this report, you agree to be bound by the fore going limitations. No representation is made that this report is accurate or complete.

35 Aarti Drugs
The opinions and projections expressed herein are entirely those of the author and are given as part of the normal research activity of Centrum Broking and are given as of this date and are subject to change without notice. Any opinion estimate or projection herein constitutes a view as of the date of this report and there can be no assurance that future results or events will be consistent with any such opinions, estimate or projection.
This document has not been prepared by or in conjunction with or on behalf of or at the instigation of, or by arrangement with the company or any of its directors or any other person. Information in this document must not be relied upon as having been authorized or approved by the company or its directors or any other person. Any opinions and projections contained herein are entirely those of the authors. None of the company or its directors or any other person accepts any liability whatsoever for any loss arising from any use of this document or its contents or otherwise arising in connection therewith.
Centrum and its affiliates have not managed or co-managed a public offering for the subject company in the preceding twelve months. Centrum and affiliates have not received compensation from the companies mentioned in the report during the period preceding twelve months from the date of this report for service in respect of public offerings, corporate finance, debt restructuring, investment banking or other advisory services in a merger/acquisition or some other sort of specific transaction.
As per the declarations given by them, Mr. Ranjit Kapadia, research analyst and and/or any of his family members do not serve as an officer, director or any way connected to the company/companies mentioned in this report. Further, as declared by him, he has not received any compensation from the above companies in the preceding twelve months. He does not hold any shares by him or through his relatives or in case if holds the shares then will not to do any transactions in the said scrip for 30 days from the date of release such report. Our entire research professionals are our employees and are paid a salary. They do not have any other material conflict of interest of the research analyst or member of which the research analyst knows of has reason to know at the time of publication of the research report or at the time of the public appearance.
While we would endeavour to update the information herein on a reasonable basis, Centrum, its associated companies, their directors and employees are under no obligation to update or keep the information current. Also, there may be regulatory, compliance or other reasons that may prevent Centrum from doing so.
Non-rated securities indicate that rating on a particular security has been suspended temporarily and such suspension is in compliance with applicable regulations and/or Centrum policies, in circumstances where Centrum is acting in an advisory capacity to this company, or any certain other circumstances.
This report is not directed to, or intended for distribution to or use by, any person or entity who is a citizen or resident of or located in any locality, state, country or other jurisdiction where such distribution, publication, availability or use would be contrary to law or regulation or which would subject Centrum Broking Limited or its group companies to any registration or licensing requirement within such jurisdiction. Specifically, this document does not constitute an offer to or solicitation to any U.S. person for the purchase or sale of any financial instrument or as an official confirmation of any transaction to any U.S. person unless otherwise stated, this message should not be construed as official confirmation of any transaction. No part of this document may be distributed in Canada or used by private customers in United Kingdom.
The information contained herein is not intended for publication or distribution or circulation in any manner whatsoever and any unauthorized reading, dissemination, distribution or copying of this communication is prohibited unless otherwise expressly authorized. Please ensure that you have read “Risk Disclosure Document for Capital Market and Derivatives Segments” as prescribed by Securities and Exchange Board of India before investing in Indian Securities Market.
Aarti Drugs price chart
Source: Bloomberg, Centrum Research
200
400
600
800
1000
Jan-15 Jul-15 Jan-16 Jul-16 Jan-17 Jul-17 Jan-18
Aarti Drugs Ltd
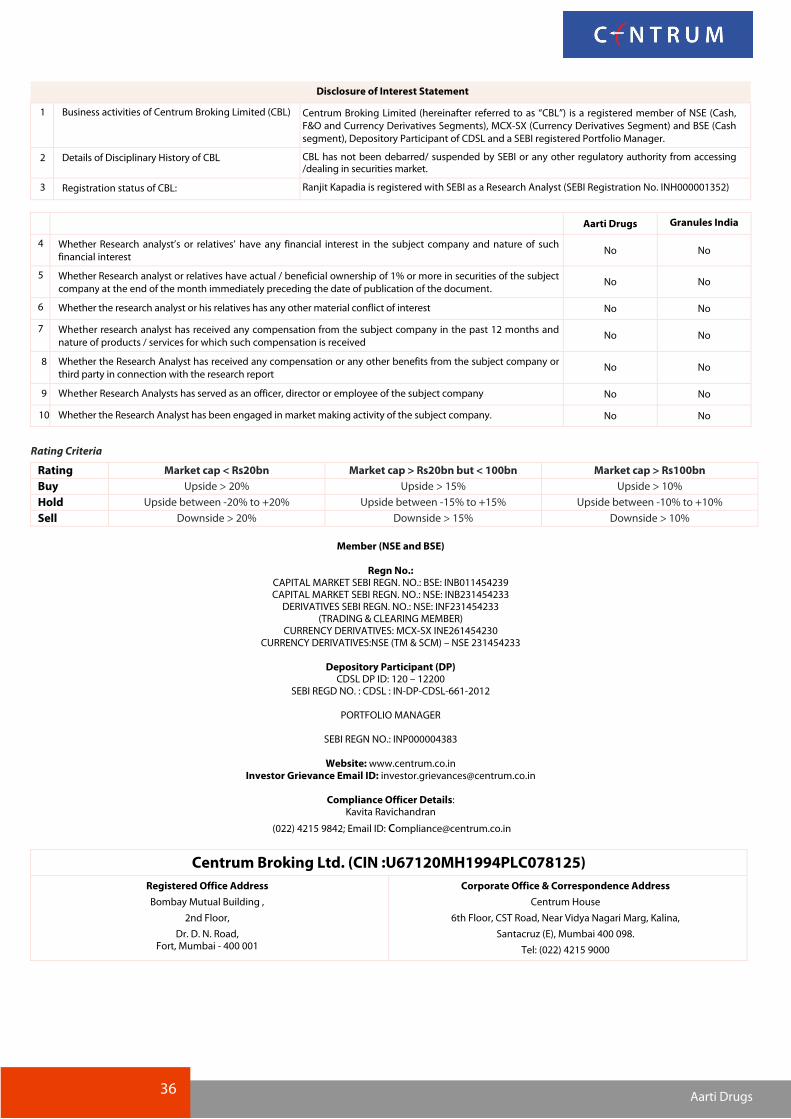
36 Aarti Drugs
Disclosure of Interest Statement
1 Business activities of Centrum Broking Limited (CBL) Centrum Broking Limited (hereinafter referred to as “CBL”) is a registered member of NSE (Cash,
F&O and Currency Derivatives Segments), MCX-SX (Currency Derivatives Segment) and BSE (Cash
segment), Depository Participant of CDSL and a SEBI registered Portfolio Manager.
2 Details of Disciplinary History of CBL CBL has not been debarred/ suspended by SEBI or any other regulatory authority from accessing /dealing in securities market.
3 Registration status of CBL: Ranjit Kapadia is registered with SEBI as a Research Analyst (SEBI Registration No. INH000001352)
Aarti Drugs Granules India
4 Whether Research analyst’s or relatives’ have any financial interest in the subject company and nature of such
financial interest No No
5 Whether Research analyst or relatives have actual / beneficial ownership of 1% or more in securities of the subject
company at the end of the month immediately preceding the date of publication of the document. No No
6 Whether the research analyst or his relatives has any other material conflict of interest No No
7 Whether research analyst has received any compensation from the subject company in the past 12 months and
nature of products / services for which such compensation is received No No
8 Whether the Research Analyst has received any compensation or any other benefits from the subject company or
third party in connection with the research report No No
9 Whether Research Analysts has served as an officer, director or employee of the subject company No No
10 Whether the Research Analyst has been engaged in market making activity of the subject company. No No
Rating Criteria
Rating Market cap < Rs20bn Market cap > Rs20bn but < 100bn Market cap > Rs100bn
Buy Upside > 20% Upside > 15% Upside > 10%
Hold Upside between -20% to +20% Upside between -15% to +15% Upside between -10% to +10%
Sell Downside > 20% Downside > 15% Downside > 10%
Member (NSE and BSE)
Regn No.:
CAPITAL MARKET SEBI REGN. NO.: BSE: INB011454239 CAPITAL MARKET SEBI REGN. NO.: NSE: INB231454233 DERIVATIVES SEBI REGN. NO.: NSE: INF231454233
(TRADING & CLEARING MEMBER) CURRENCY DERIVATIVES: MCX-SX INE261454230
CURRENCY DERIVATIVES:NSE (TM & SCM) – NSE 231454233
Depository Participant (DP) CDSL DP ID: 120 – 12200
SEBI REGD NO. : CDSL : IN-DP-CDSL-661-2012
PORTFOLIO MANAGER
SEBI REGN NO.: INP000004383
Website: www.centrum.co.in Investor Grievance Email ID: [email protected]
Compliance Officer Details:
Kavita Ravichandran
(022) 4215 9842; Email ID: [email protected]
Centrum Broking Ltd. (CIN :U67120MH1994PLC078125)
Registered Office Address
Bombay Mutual Building ,
2nd Floor,
Dr. D. N. Road, Fort, Mumbai - 400 001
Corporate Office & Correspondence Address
Centrum House
6th Floor, CST Road, Near Vidya Nagari Marg, Kalina,
Santacruz (E), Mumbai 400 098.
Tel: (022) 4215 9000