butterfly gandhimathi appliances€¦ · butterfly gandhimathi appliances limited q4 & fy16 ...
TRANSCRIPT

BUTTERFLY GANDHIMATHI APPLIANCES LIMITED
Q4 & FY16 www.butterflyindia.com
RESULTS PRESENTATION

www.butterflyindia.com
Safe Harbour
Certain statements in this presentation concerning our future growth prospects are forward
looking statements, which involve a number of risks and uncertainties that could cause actual
results to differ materially from those in such forward-looking statements. The risks and
uncertainties relating to these statements include, but are not limited to, fluctuations in earnings,
our ability to manage growth, competitive intensity in our industry of operations including those
factors which may affect our cost advantage, wage increases, our ability to attract and retain
highly skilled professionals, sufficient availability of raw materials, our ability to successfully
complete and integrate potential acquisitions, liability for damages on our contracts to supply
products, the success of the companies in which Butterfly Gandhimathi Appliances Ltd has made
strategic investments, withdrawal of governmental fiscal incentives, political instability, legal
restrictions on raising capital or acquiring companies outside India, and unauthorized use of our
intellectual property and general economic conditions affecting our industry. Butterfly
Gandhimathi Appliances Ltd may, from time to time, make additional written and oral forward-
looking statements, including our reports to shareholders. The Company does not undertake to
update any forward-looking statement that may be made from time to time by or on behalf of the
company
3
www.butterflyindia.com
Contents
4
Company Overview 1
Financial Overview
Q4 & FY16 Operating Performance & Highlights
2
3
Outlook 4

www.butterflyindia.com
Company Overview 1

www.butterflyindia.com
About Us..
6
Leading manufacturer of Kitchen and Electrical Appliances
The „Butterfly‟ brand is a highly respected brand synonymous with quality
Headquartered in Tamil Nadu with Pan India presence
Strong R&D focus which has led to several pioneering initiatives and continues to drive in-house development of new products
Healthy Balance Sheet with continuously improving Financial Indicators
Mix of industry growth and Company initiatives has led to traction in Revenues in last few years
Market Leader in India for SS LPG Stoves & Table Top Wet Grinders and major supplier of Mixer Grinders & Pressure Cookers
Established in 1986 by Shri V. Murugesa Chettiar - currently helmed by 2nd and 3rd generation of promoter family
www.butterflyindia.com
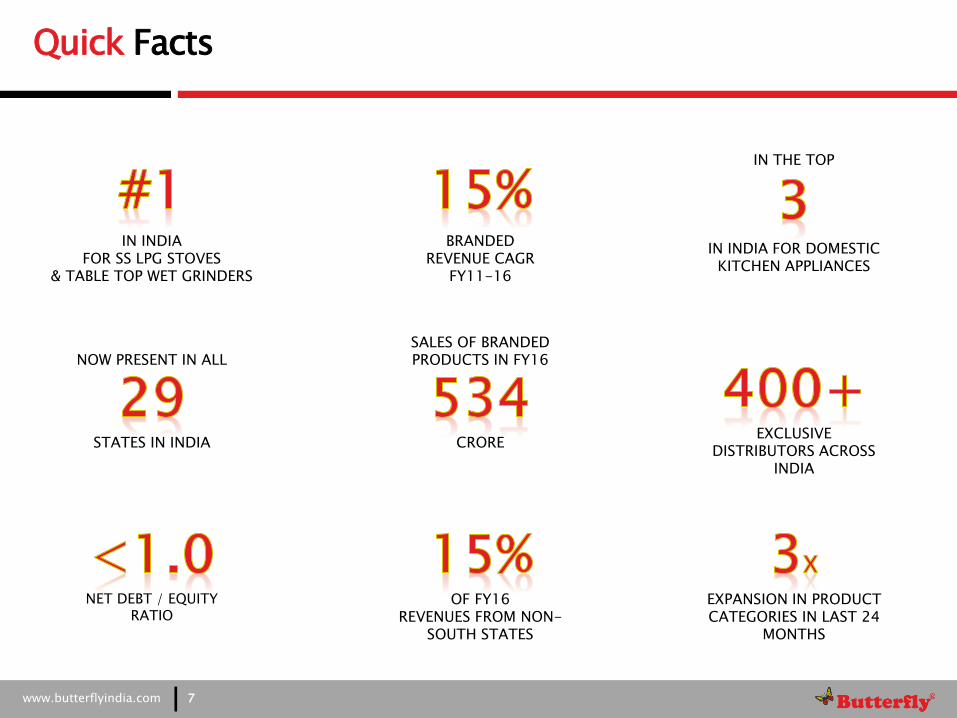
Quick Facts
7
BRANDED
REVENUE CAGR FY11-16
EXCLUSIVE DISTRIBUTORS ACROSS
INDIA
STATES IN INDIA
CRORE
IN INDIA FOR SS LPG STOVES
& TABLE TOP WET GRINDERS
NET DEBT / EQUITY
RATIO
OF FY16
REVENUES FROM NON-SOUTH STATES
IN INDIA FOR DOMESTIC KITCHEN APPLIANCES
IN THE TOP
NOW PRESENT IN ALL
EXPANSION IN PRODUCT CATEGORIES IN LAST 24
MONTHS
SALES OF BRANDED PRODUCTS IN FY16
www.butterflyindia.com
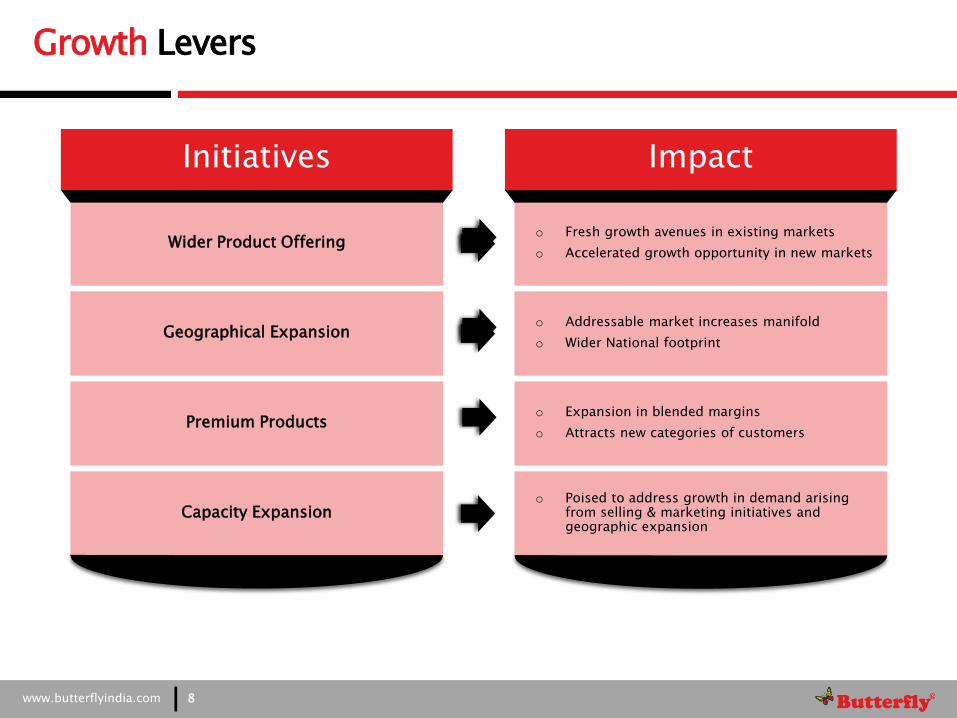
Capacity Expansion
Premium Products o Expansion in blended margins
o Attracts new categories of customers
o Poised to address growth in demand arising from selling & marketing initiatives and geographic expansion
Initiatives
Wider Product Offering
Impact
o Fresh growth avenues in existing markets
o Accelerated growth opportunity in new markets
o Addressable market increases manifold
o Wider National footprint Geographical Expansion
Growth Levers
8
www.butterflyindia.com
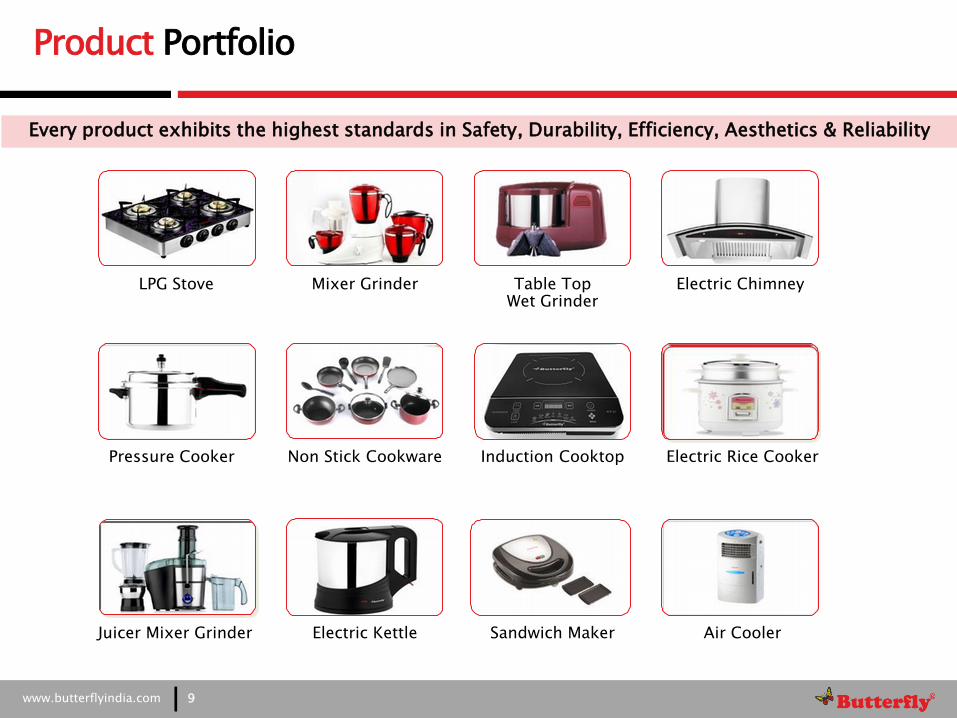
Product Portfolio
9
LPG Stove Table Top Wet Grinder
Pressure Cooker Non Stick Cookware
Mixer Grinder
Induction Cooktop
Electric Kettle Sandwich Maker Juicer Mixer Grinder
Every product exhibits the highest standards in Safety, Durability, Efficiency, Aesthetics & Reliability
Electric Chimney
Electric Rice Cooker
Air Cooler

www.butterflyindia.com
Product Portfolio
10
Other Pioneering Products
Electric Iron Pop-up Toaster
Juicer Hand Blender Washer Water Heater
www.butterflyindia.com
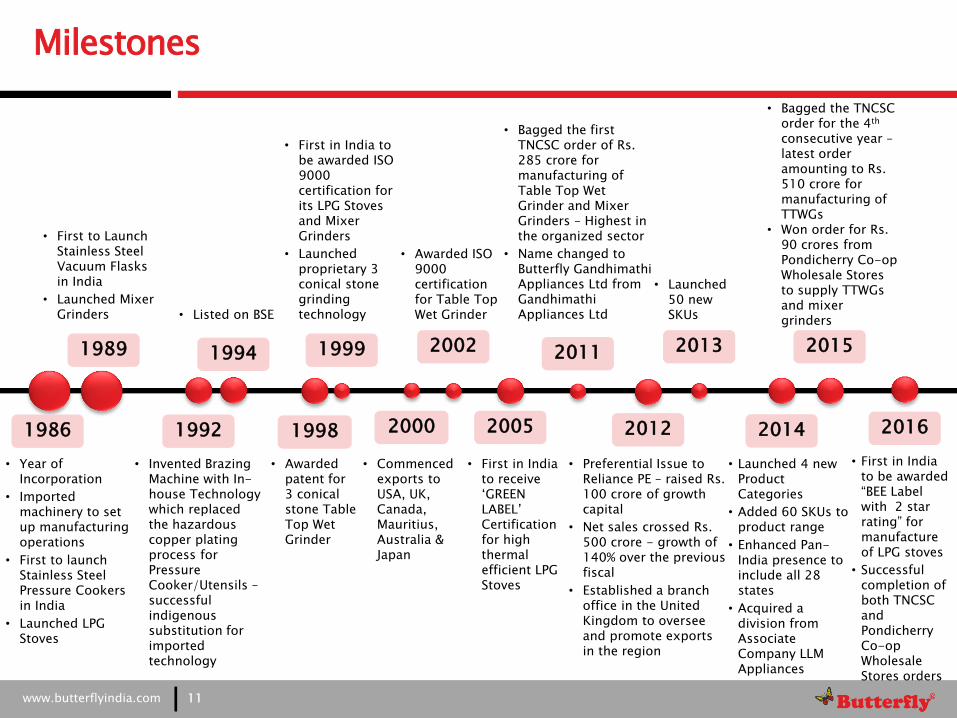
Milestones
11
1986
1999 2011 1989
1992 2000 2012
2013
• Preferential Issue to Reliance PE – raised Rs. 100 crore of growth capital
• Net sales crossed Rs. 500 crore - growth of 140% over the previous fiscal
• Established a branch office in the United Kingdom to oversee and promote exports in the region
• Launched 50 new SKUs
• Bagged the first TNCSC order of Rs. 285 crore for manufacturing of Table Top Wet Grinder and Mixer Grinders – Highest in the organized sector
• Name changed to Butterfly Gandhimathi Appliances Ltd from Gandhimathi Appliances Ltd
• First in India to be awarded ISO 9000 certification for its LPG Stoves and Mixer Grinders
• Launched proprietary 3 conical stone grinding technology
• Year of Incorporation
• Imported machinery to set up manufacturing operations
• First to launch Stainless Steel Pressure Cookers in India
• Launched LPG Stoves
• Listed on BSE
• Invented Brazing Machine with In-house Technology which replaced the hazardous copper plating process for Pressure Cooker/Utensils – successful indigenous substitution for imported technology
• First to Launch Stainless Steel Vacuum Flasks in India
• Launched Mixer Grinders
2014
• Launched 4 new Product Categories
• Added 60 SKUs to product range
• Enhanced Pan-India presence to include all 28 states
• Acquired a division from Associate Company LLM Appliances
2002
• Awarded ISO 9000 certification for Table Top Wet Grinder
2005
• First in India to receive „GREEN LABEL‟ Certification for high thermal efficient LPG Stoves
1994
• Commenced exports to USA, UK, Canada, Mauritius, Australia & Japan
1998
• Awarded patent for 3 conical stone Table Top Wet Grinder
2015
• Bagged the TNCSC order for the 4th consecutive year – latest order amounting to Rs. 510 crore for manufacturing of TTWGs
• Won order for Rs. 90 crores from Pondicherry Co-op Wholesale Stores to supply TTWGs and mixer grinders
2016
• First in India to be awarded “BEE Label with 2 star rating” for manufacture of LPG stoves
• Successful completion of both TNCSC and Pondicherry Co-op Wholesale Stores orders

www.butterflyindia.com
Revenue Profile
12
100% 56%
54% 61% 84% 54%
44%
46% 39%
16%
46%
FY11 FY12 FY13 FY14 FY15 FY16
Branded Sales Govt Order
Annual Revenue (Rs. crore)
807
642
267
839
577
CAGR: 30%
Note: FY15 Government Tender was deferred and combined with FY16 tender which resulted in increased Govt. revenues in FY16
995

www.butterflyindia.com
Government Orders
13
369 331
92
461
FY13 FY14 FY15* FY16
Government Order Sales (Rs. crore)
For the last 4 years in succession, BGMAL won orders in the annual tender of Tamil Nadu Civil Supplies Corporation (TNCSC). In January 2015, the Company bagged orders worth Rs. 510 crore* for supply of Table Top Wet Grinders from TN Govt in CY2016. This order marked the completion of the TN Govt order under the current regime
In August 2015, the Company also bagged orders worth Rs. 90 crore for supply of Table Top Wet Grinders and Mixer Grinders from Pondicherry Co-Op. Wholesale Stores (PCWS)
16.1 15.9
4.5
21.3
3.0 0.7 0.0 3.0
FY13 FY14 FY15 FY16
Products supplied (in lakh units)
TTWG Mixer Grinder
Benefits to BGMAL
• Incremental contribution to profitability, favorable payment terms enabling a positive cash flow business
• Increase in volumes have elevated BGMAL‟s manufacturing and delivery capabilities
• Increased number of users of the Company‟s products has led to an increase in the potential market for the Company
• Creates ready customer base which will materialize at the time of product replacement or upgradation
• Delivery experience has led to innovation and launch of economy models which have aided growth in Branded Sales
Note: Govt. Order for FY15 was received only in Jan, 2015 hence the revenues accrued primarily in FY16.
* The order size for TNCSC has been revised from Rs. 510 crore to Rs. 463 crore
Orders received from
Order size (Rs. Crore)
Completed till-date
(Rs. Crore)
Balance (Rs. Crore)
TNCSC* 463 463 0
PCWS 90 90 0
TOTAL 553 553 0
www.butterflyindia.com
Branded Retail Sales
14
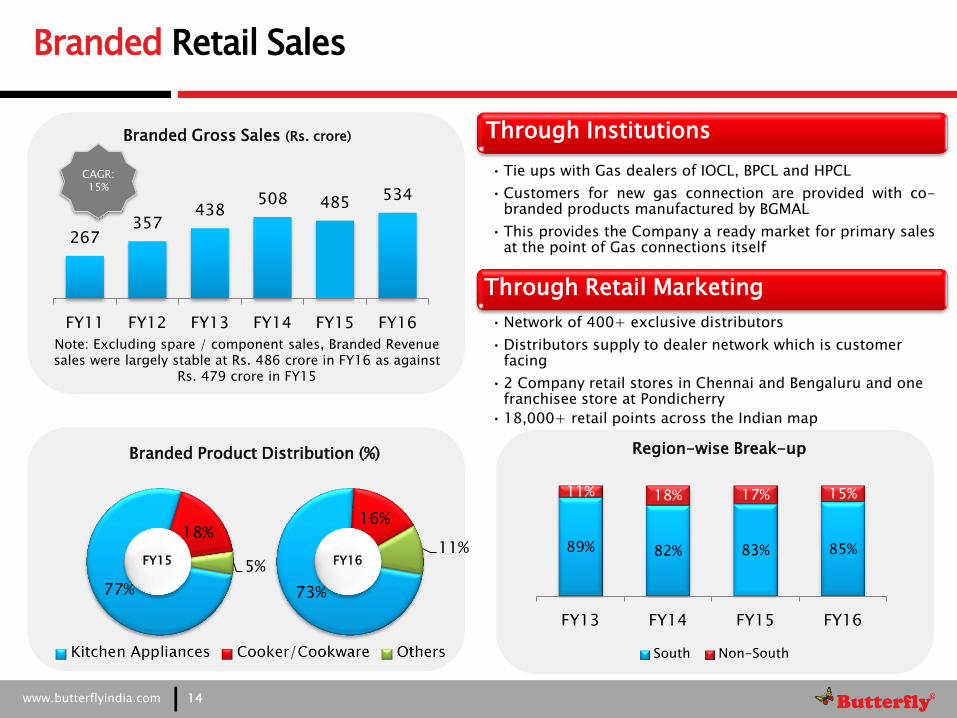
267 357
438 508 485
534
FY11 FY12 FY13 FY14 FY15 FY16
Branded Gross Sales (Rs. crore) Through Institutions
• Tie ups with Gas dealers of IOCL, BPCL and HPCL
• Customers for new gas connection are provided with co-branded products manufactured by BGMAL
• This provides the Company a ready market for primary sales at the point of Gas connections itself
77%
18%
5%
Through Retail Marketing
• Network of 400+ exclusive distributors
• Distributors supply to dealer network which is customer facing
• 2 Company retail stores in Chennai and Bengaluru and one franchisee store at Pondicherry
• 18,000+ retail points across the Indian map
73%
16%
11% FY15 FY16
89% 82% 83% 85%
11% 18% 17% 15%
FY13 FY14 FY15 FY16
Region-wise Break-up
South Non-South
CAGR: 15%
Branded Product Distribution (%)
Note: Excluding spare / component sales, Branded Revenue sales were largely stable at Rs. 486 crore in FY16 as against
Rs. 479 crore in FY15

www.butterflyindia.com
Enhancing Sales and Marketing Efficiency For Better Penetration And Brand Development
Increased Product Categories For Wider Product Portfolio And Higher Market Share
Augmenting Organic Growth
15
6 6 6
20+ 20+ 20+
2011 2012 2013 2014 2015 2016
Product Categories (Nos.)
250 250 320
500 552 554
2011 2012 2013 2014 2015 2016
SKUs (Nos.)
180 180 240
425 359
310
2011 2012 2013 2014 2015 2016
Sales Team (Personnel)
16
46 49 49 37
68
2011 2012 2013 2014 2015 2016
Marketing Spend (Rs. Cr)
www.butterflyindia.com
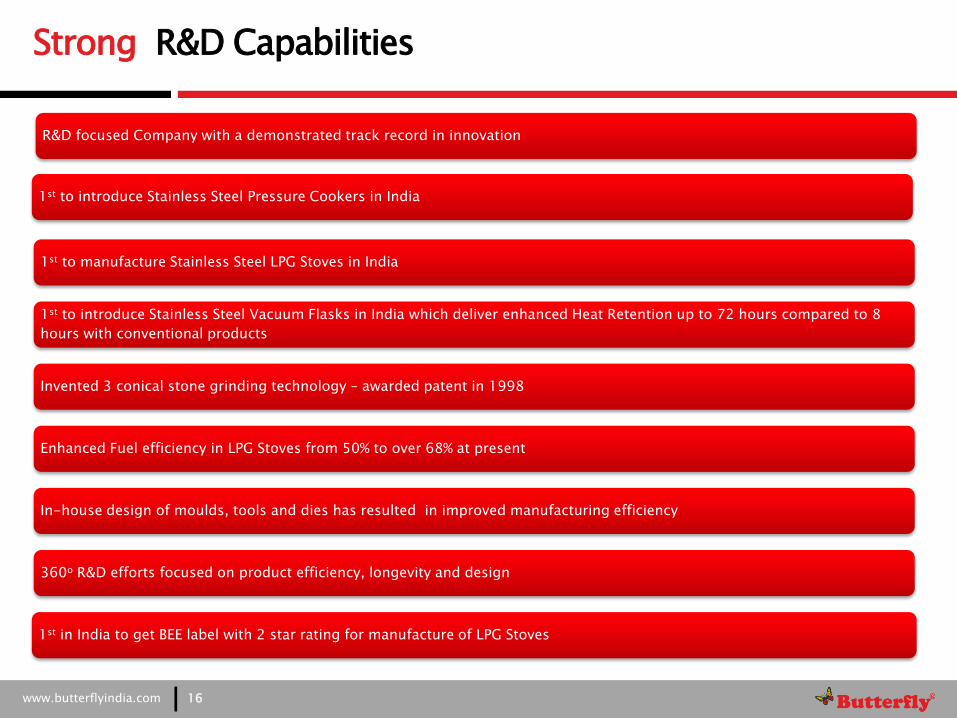
Strong R&D Capabilities
R&D focused Company with a demonstrated track record in innovation
1st to introduce Stainless Steel Pressure Cookers in India
1st to manufacture Stainless Steel LPG Stoves in India
1st to introduce Stainless Steel Vacuum Flasks in India which deliver enhanced Heat Retention up to 72 hours compared to 8
hours with conventional products
Invented 3 conical stone grinding technology – awarded patent in 1998
Enhanced Fuel efficiency in LPG Stoves from 50% to over 68% at present
In-house design of moulds, tools and dies has resulted in improved manufacturing efficiency
360o R&D efforts focused on product efficiency, longevity and design
1st in India to get BEE label with 2 star rating for manufacture of LPG Stoves
16
www.butterflyindia.com
Key Focus Areas
17
• Optimize investment on expansion of distribution network and brand building activities
• Continued focus on enhanced working capital position
• Maximizing cost efficiencies at all levels of operations
• To launch several innovative and ergonomic kitchen and domestic electrical appliances – world class products with immaculate design and added utility features developed through in-house R&D
• To further improve perception of product quality synonymous with the “BUTTERFLY” brand
• Inventory de-stocking efforts undertaken by the Company are nearly complete and is expected to further boost efficiency and cash flow, while also improving the health of the balance sheet
• Long-term growth in primary sales to accrue from the various strategic initiatives undertaken by the Company

www.butterflyindia.com
Financial Overview 2
www.butterflyindia.com
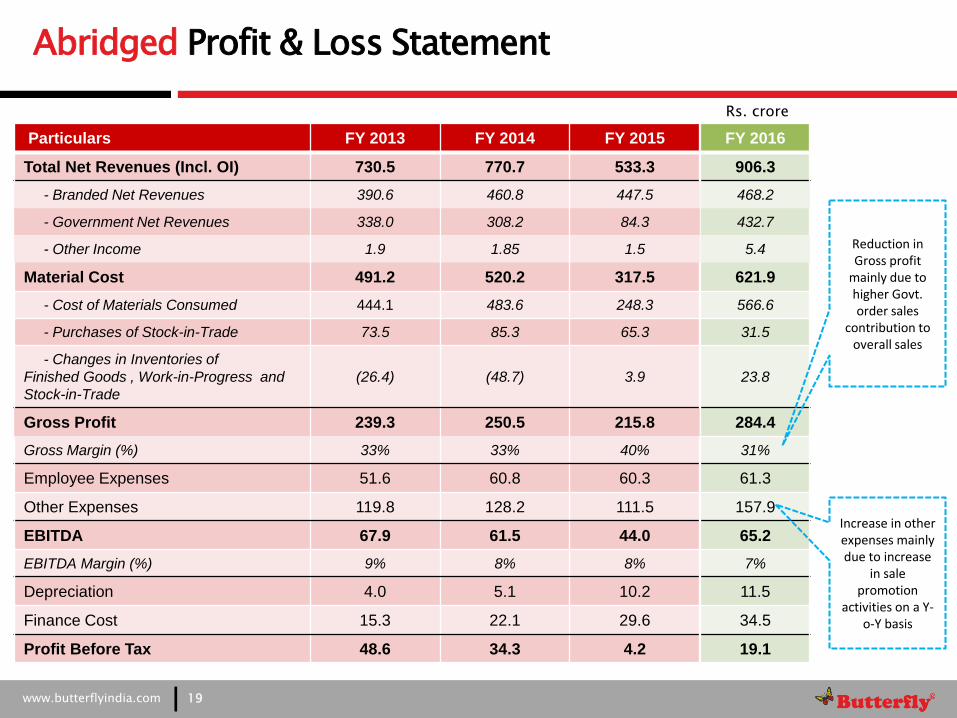
Abridged Profit & Loss Statement
19
Particulars FY 2013 FY 2014 FY 2015
Total Net Revenues (Incl. OI) 730.5 770.7 533.3
- Branded Net Revenues 390.6 460.8 447.5
- Government Net Revenues 338.0 308.2 84.3
- Other Income 1.9 1.85 1.5
Material Cost 491.2 520.2 317.5
- Cost of Materials Consumed 444.1 483.6 248.3
- Purchases of Stock-in-Trade 73.5 85.3 65.3
- Changes in Inventories of
Finished Goods , Work-in-Progress and
Stock-in-Trade
(26.4) (48.7) 3.9
Gross Profit 239.3 250.5 215.8
Gross Margin (%) 33% 33% 40%
Employee Expenses 51.6 60.8 60.3
Other Expenses 119.8 128.2 111.5
EBITDA 67.9 61.5 44.0
EBITDA Margin (%) 9% 8% 8%
Depreciation 4.0 5.1 10.2
Finance Cost 15.3 22.1 29.6
Profit Before Tax 48.6 34.3 4.2
Rs. crore
FY 2016
906.3
468.2
432.7
5.4
621.9
566.6
31.5
23.8
284.4
31%
61.3
157.9
65.2
7%
11.5
34.5
19.1
Increase in other expenses mainly due to increase
in sale promotion
activities on a Y-o-Y basis
Reduction in Gross profit
mainly due to higher Govt. order sales
contribution to overall sales
www.butterflyindia.com
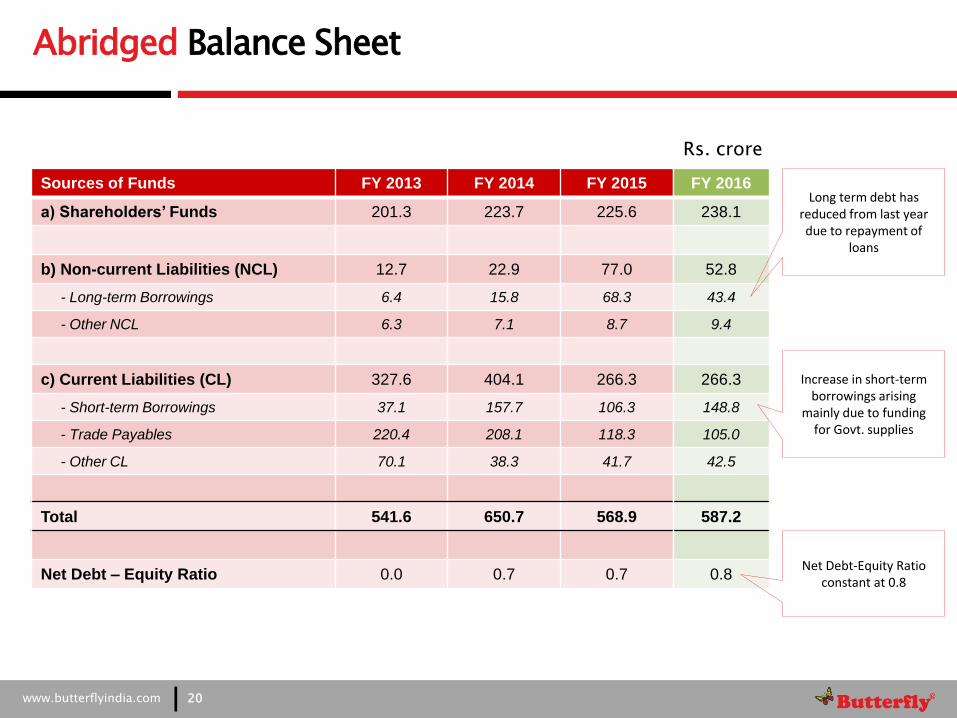
Abridged Balance Sheet
20
Sources of Funds FY 2013 FY 2014 FY 2015
a) Shareholders’ Funds 201.3 223.7 225.6
b) Non-current Liabilities (NCL) 12.7 22.9 77.0
- Long-term Borrowings 6.4 15.8 68.3
- Other NCL 6.3 7.1 8.7
c) Current Liabilities (CL) 327.6 404.1 266.3
- Short-term Borrowings 37.1 157.7 106.3
- Trade Payables 220.4 208.1 118.3
- Other CL 70.1 38.3 41.7
Total 541.6 650.7 568.9
Net Debt – Equity Ratio 0.0 0.7 0.7
Rs. crore
FY 2016
238.1
52.8
43.4
9.4
266.3
148.8
105.0
42.5
587.2
0.8
Long term debt has reduced from last year due to repayment of
loans
Increase in short-term borrowings arising
mainly due to funding for Govt. supplies
Net Debt-Equity Ratio constant at 0.8
www.butterflyindia.com
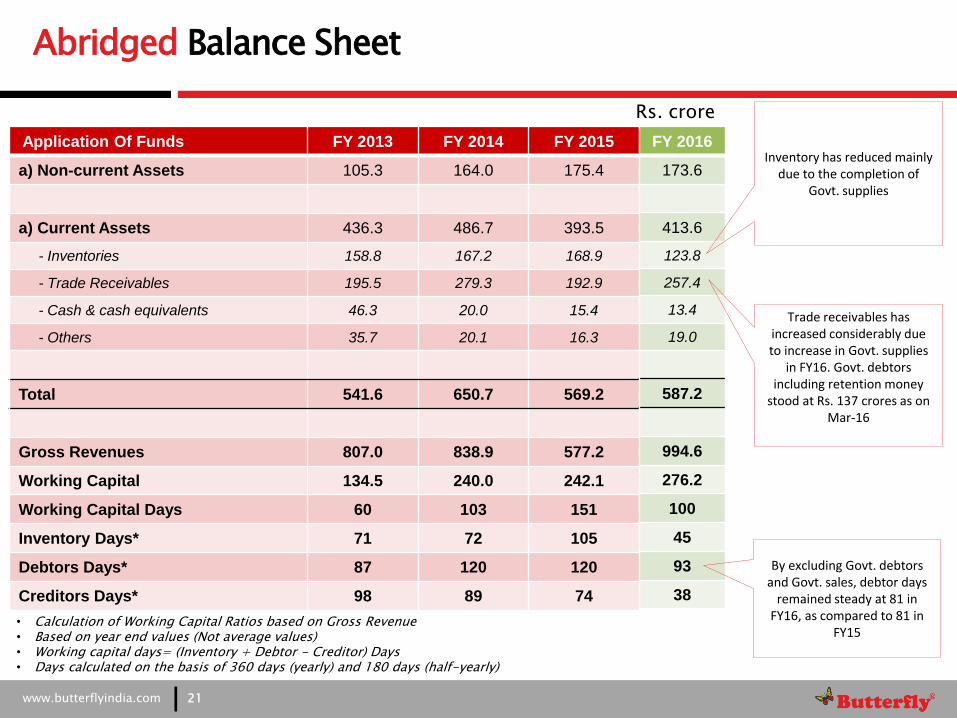
Abridged Balance Sheet
21
Application Of Funds FY 2013 FY 2014 FY 2015
a) Non-current Assets 105.3 164.0 175.4
a) Current Assets 436.3 486.7 393.5
- Inventories 158.8 167.2 168.9
- Trade Receivables 195.5 279.3 192.9
- Cash & cash equivalents 46.3 20.0 15.4
- Others 35.7 20.1 16.3
Total 541.6 650.7 569.2
Gross Revenues 807.0 838.9 577.2
Working Capital 134.5 240.0 242.1
Working Capital Days 60 103 151
Inventory Days* 71 72 105
Debtors Days* 87 120 120
Creditors Days* 98 89 74
• Calculation of Working Capital Ratios based on Gross Revenue • Based on year end values (Not average values) • Working capital days= (Inventory + Debtor - Creditor) Days • Days calculated on the basis of 360 days (yearly) and 180 days (half-yearly)
Rs. crore
FY 2016
173.6
413.6
123.8
257.4
13.4
19.0
587.2
994.6
276.2
100
45
93
38
Inventory has reduced mainly due to the completion of
Govt. supplies
Trade receivables has increased considerably due to increase in Govt. supplies
in FY16. Govt. debtors including retention money
stood at Rs. 137 crores as on Mar-16
By excluding Govt. debtors and Govt. sales, debtor days
remained steady at 81 in FY16, as compared to 81 in
FY15

www.butterflyindia.com
Performance Track Record - Annualized
22
267
642 807 839
577
995
FY11* FY12 FY13 FY14 FY15 FY16
Total Revenue (Rs crore)
27
63 73
62
44
65
FY11* FY12 FY13 FY14 FY15 FY16
EBITDA (Rs crore)
18
44 48
34
4
19
FY11* FY12 FY13 FY14 FY15 FY16
Profit Before Tax (Rs crore)
19
30 33
22
3
12
FY11* FY12 FY13 FY14 FY15 FY16
Profit After Tax (Rs crore)
CAGR: 30%
CAGR: 19%
NOTE : * FY11 was for period of 9 months ended on 31.03.2011. The figures above represent the annualized numbers in order to facilitate a comparison.

www.butterflyindia.com
Key Financials
23
20 20 19
13
2
7
FY11 @ FY12 FY13 FY14 FY15 FY16
Earning Per Share (Rs) - Annualized
43 49
113 125 126
133
FY11 FY12 FY13 FY14 FY15 FY16
Book value per share (Rs)
@ FY11 was for period of 9 months ending 31.03.2011. The figures above represent the annualized numbers in order to facilitate a comparison.
www.butterflyindia.com
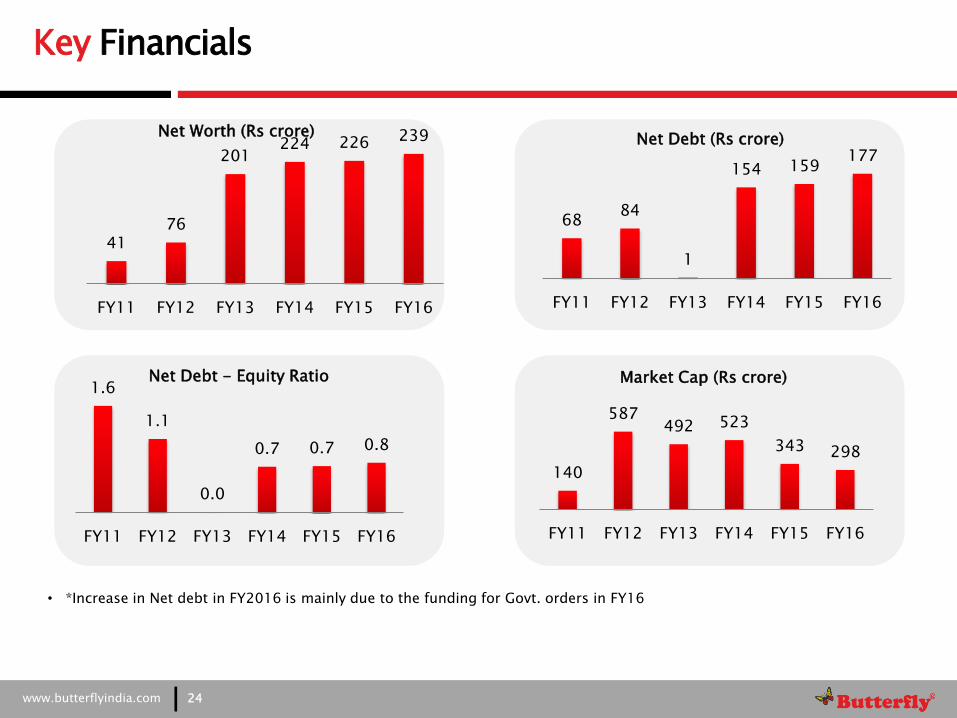
Key Financials
24
41 76
201 224 226 239
FY11 FY12 FY13 FY14 FY15 FY16
Net Worth (Rs crore)
68 84
1
154 159 177
FY11 FY12 FY13 FY14 FY15 FY16
Net Debt (Rs crore)
1.6
1.1
0.0
0.7 0.7 0.8
FY11 FY12 FY13 FY14 FY15 FY16
Net Debt - Equity Ratio
140
587 492 523
343 298
FY11 FY12 FY13 FY14 FY15 FY16
Market Cap (Rs crore)
• *Increase in Net debt in FY2016 is mainly due to the funding for Govt. orders in FY16

www.butterflyindia.com
Q4 & FY16 Operating Performance & Highlights 3

www.butterflyindia.com
• Total Income (Net) during Q4 FY16 stood at Rs. 156.8 crore,
registering a growth of 4.6% Y-o-Y
• Branded sales grew by 58.5% on a Y-o-Y basis to Rs.
104.0 crore in Q4 FY16 due to lower base effect
• EBITDA improved by 17.6% and stood at Rs. 14 crore in Q4
FY16 as against Rs. 11.9 crore in Q4 FY15
• PAT stood at Rs. 0.6 crore in Q4 FY16, translating into an
EPS of Rs. 0.3
Q4 FY16 – Performance highlights
26
65.6 104.0
84.3 52.8
Q4FY15 Q4FY16Branded Sales Govt Order Sales
Total Income (Net) (Rs. crore)
Detailed Performance Overview discussed on Slide 29
0.9
0.6
Q4FY15 Q4FY16
PAT (Rs crore)
11.9
14.0
Q4FY15 Q4FY16
EBITDA (Rs. crore)
149.9 156.8

www.butterflyindia.com
• Total Income (Net) during FY16 stood at Rs. 906 crore
• Within total revenues, Branded Sales was higher by
5.5% on a Y-o-Y basis to Rs. 473.6 crore in FY16
• EBITDA stood at Rs. 65.2 crore in FY16 as against Rs. 44
crore in FY15, registering a growth of 48%
• PAT stood at Rs. 12.4 crore in FY16, translating into an EPS
of Rs. 6.9
• Dividend has been declared at Rs. 1.25 per share
FY16 – Performance highlights
27
449.0 473.6
84.3
432.7
FY15 FY16Branded Sales Govt Order Sales
Total Income (Net) (Rs. crore)
Detailed Performance Overview discussed on Slide 29
2.8
12.4
FY15 FY16
PAT (Rs crore)
44.0
65.2
FY15 FY16
EBITDA (Rs. crore)
533.3
906.3
www.butterflyindia.com
Performance Overview for Q4 & FY16
28
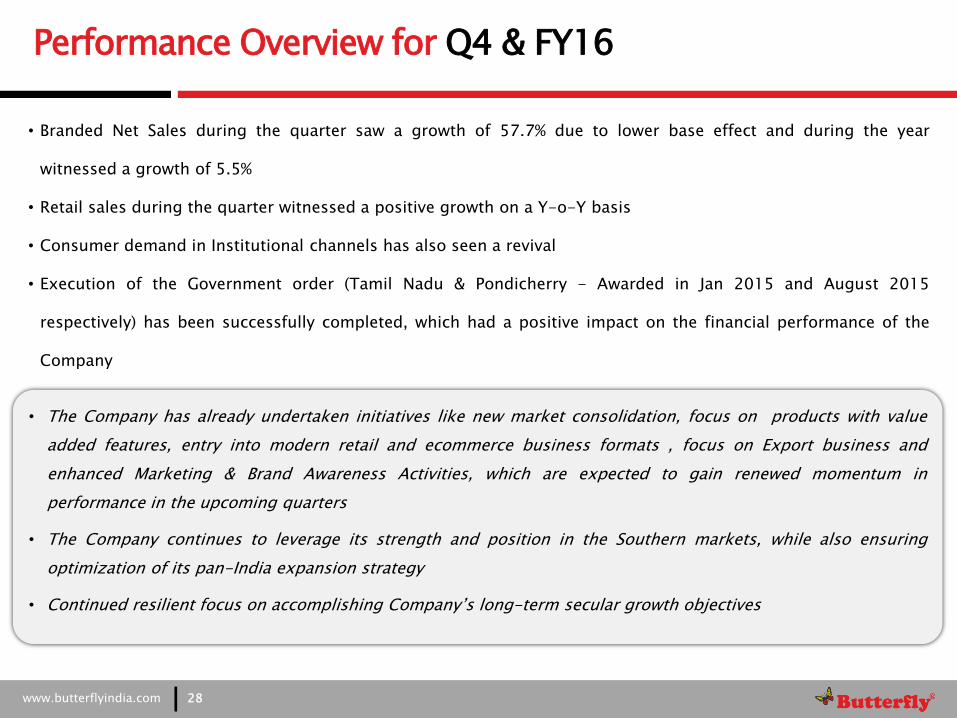
• The Company has already undertaken initiatives like new market consolidation, focus on products with value
added features, entry into modern retail and ecommerce business formats , focus on Export business and
enhanced Marketing & Brand Awareness Activities, which are expected to gain renewed momentum in
performance in the upcoming quarters
• The Company continues to leverage its strength and position in the Southern markets, while also ensuring
optimization of its pan-India expansion strategy
• Continued resilient focus on accomplishing Company‟s long-term secular growth objectives
• Branded Net Sales during the quarter saw a growth of 57.7% due to lower base effect and during the year
witnessed a growth of 5.5%
• Retail sales during the quarter witnessed a positive growth on a Y-o-Y basis
• Consumer demand in Institutional channels has also seen a revival
• Execution of the Government order (Tamil Nadu & Pondicherry - Awarded in Jan 2015 and August 2015
respectively) has been successfully completed, which had a positive impact on the financial performance of the
Company

www.butterflyindia.com
Product Categories
29
Kitchen Appliances
•LPG Stove
•Mixer Grinder
•Table Top Wet Grinder
•Electric Chimney
•Hand Blender
•Induction Cooktop
•Electric Kettle
•Juicer
•Juicer Mixer Grinder
•Slice Toaster
•Sandwich Maker
Cookers/Cookware
•Pressure Cooker
•Non-Stick Cookware
•Electric Rice Cooker
Others
•Air Cooler
•Water Heater (Geyser)
•Other Trading Goods
•Electric Iron

www.butterflyindia.com
Key Highlights
30
• The Retail market demand was subdued for most part of the year. Given the lower base in FY15, the growth is substantial
• Institutional demand witnessed a positive growth
• Fan category has been discontinued from FY16, which contributed to the reduction in Others product category sales on a Y-o-Y basis
Product Q4 FY16 Q3 FY16 Q4 FY15 Y-o-Y Growth
FY16 FY15 Y-o-Y Growth
Branded Market
Kitchen Appliances 85.3 99.0 45.6 87.1% 387.7 367.4 5.5%
Cooker/Cookware 19.4 26.1 11.7 65.8% 86.7 86.5 0.2%
Others 4.4 2.8 8.2 -46.3% 13.1 24.0 -45.4%
Total-Branded 109.1 127.9 65.5 66.6% 487.5 477.9 2.0%
Others (Components / Spares) 4.9 7.3 6.0 -18.3% 46.5 7.1 554.9%
Grand Total 114.0 135.2 71.5 59.4% 534.0 485.0 10.1%
Branded Gross Sales (including excise) (Rs crore)

www.butterflyindia.com
Outlook 4
www.butterflyindia.com
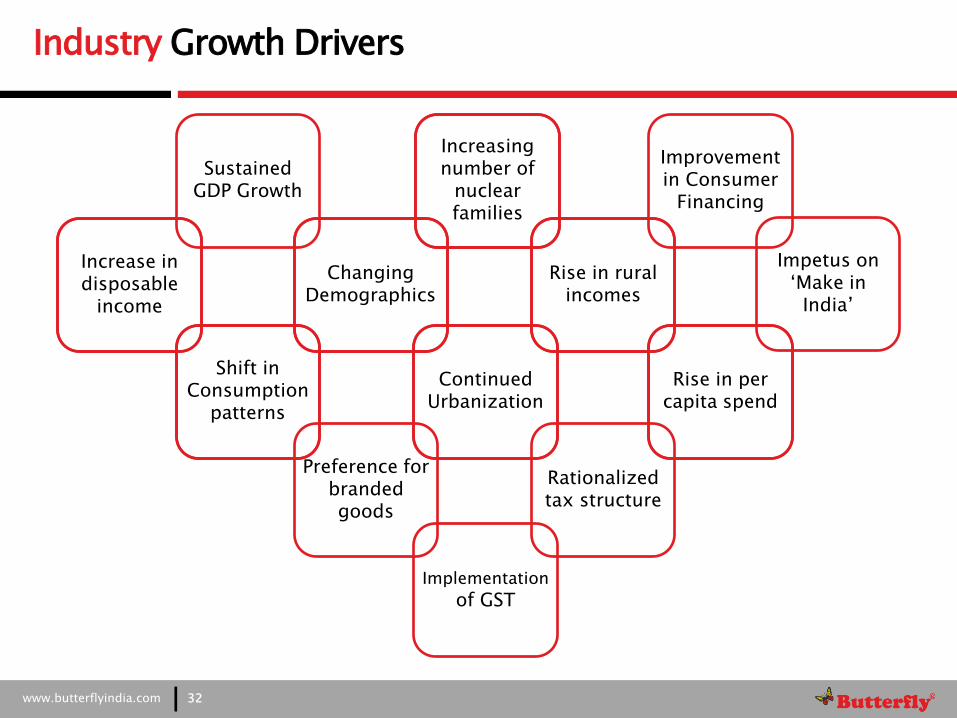
Industry Growth Drivers
32
Increasing number of
nuclear families
Improvement in Consumer
Financing
Sustained GDP Growth
Changing Demographics
Rise in rural incomes
Continued Urbanization
Rise in per capita spend
Rationalized tax structure
Increase in disposable
income
Shift in Consumption
patterns
Preference for branded goods
Impetus on „Make in
India‟
Implementation of GST
www.butterflyindia.com
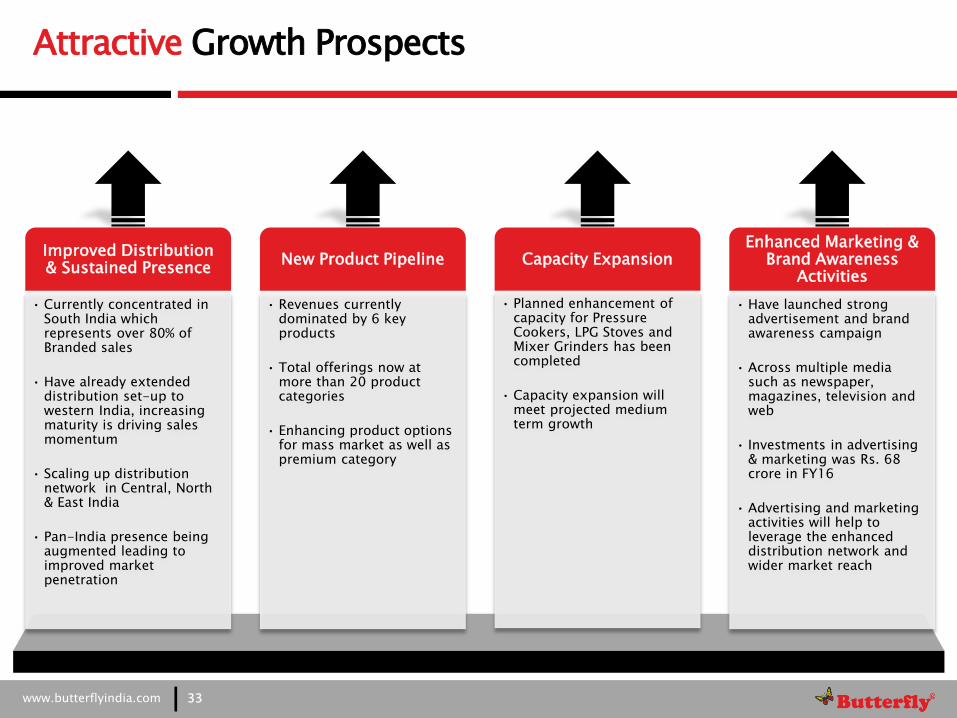
Attractive Growth Prospects
Improved Distribution & Sustained Presence
• Currently concentrated in South India which represents over 80% of Branded sales
• Have already extended distribution set-up to western India, increasing maturity is driving sales momentum
• Scaling up distribution network in Central, North & East India
• Pan-India presence being augmented leading to improved market penetration
New Product Pipeline
• Revenues currently dominated by 6 key products
• Total offerings now at more than 20 product categories
• Enhancing product options for mass market as well as premium category
Capacity Expansion
• Planned enhancement of capacity for Pressure Cookers, LPG Stoves and Mixer Grinders has been completed
• Capacity expansion will meet projected medium term growth
Enhanced Marketing & Brand Awareness
Activities
• Have launched strong advertisement and brand awareness campaign
• Across multiple media such as newspaper, magazines, television and web
• Investments in advertising & marketing was Rs. 68 crore in FY16
• Advertising and marketing activities will help to leverage the enhanced distribution network and wider market reach
33

www.butterflyindia.com
Outlook
34
Retail Channel Sales • The market scenario remained subdued for
most part of the year, especially in Southern markets
• Institutional sales is dependent on release of new LPG gas connections
• Issuance of new LPG gas connections has improved resulting in good growth
Government Order Sales
• As of Q4 FY16, both TNCSC and Pondicherry Co-Op. Wholesale Stores orders has been successfully completed
Institutional Channel Sales
70-75% of Branded Sales in FY16
Retail channel demand will continue to be subdued in the first half of the year and recovery is expected from the second half of FY17
Consumer demand is expected to improve in the coming quarters
Rs. 461 crore No new orders are expected in the near future
25-30% of Branded Sales in FY16
CATEGORY MARKET ENVIRONMENT FY16
CONTRIBUTION OUTLOOK
TOTAL BRANDED SALES
Rs. 488 crore
GROSS REVENUES
Rs. 995 crore
• Component/Spare sales are done only when we have Govt. orders
Component/Spare Sales
No new sales are expected in coming year
Rs. 46 crore

Thank you