businessiq premier profile sm - experian secure control … · e 2 evaluated risk at a glance...
TRANSCRIPT

Training guide
BusinessIQ Premier ProfileSM

Table of contents
1. Identifying Information . . . . . . . . . . . . . . 2
2. Risk Dashboard . . . . . . . . . . . . . . . . . . . . . 3
3. Business Facts . . . . . . . . . . . . . . . . . . . . . . 3
4. Commercial Fraud Shield . . . . . . . . . . . . 4
5. Credit Risk Score and Credit Limit Recommendation . . . . . . . . . . . . . . 4
6. Payment and Legal Summary . . . . . . . . 6
7. Payment Experiences. . . . . . . . . . . . . . . . 7
8. Public Record. . . . . . . . . . . . . . . . . . . . . . . 9
9. Uniform Commercial Code filings. . . . . 9
10. Commercial Finance Relationships . 10
11. Additional Business Facts. . . . . . . . . . 11
12. Inquiries. . . . . . . . . . . . . . . . . . . . . . . . . . 11
13. Company Financial Information . . . . 12
Glossary . . . . . . . . . . . . . . . . . . . . . . . . . . . . . . i
All you need to knowOn the following pages, a sample Premier Profile Report from Experian is provided with detailed explanations on how to read the report and why the information is important. If you don’t understand the term or its “value,” refer to the glossary of terms in the back of this training guide. Once you’ve reviewed this guide, we’re sure you’ll agree that the Premier Profile Report is a valuable tool that will help you make better decisions.
Introduction
Notes:
2
Evaluated risk at a glance
Evaluate risk at a glancePremier Profile Report is designed to quickly highlight the information contributing to a company’s overall risk potential. The report’s unique risk dashboard highlights key performance metrics and potential high-risk alerts. Easy-to-read graphs summarize multiple data points for rapid analysis. Navigational links also are provided to quickly and easily navigate to report details.
The following page identifies key risk elements and definitions of each in relation to your analysis of the business.
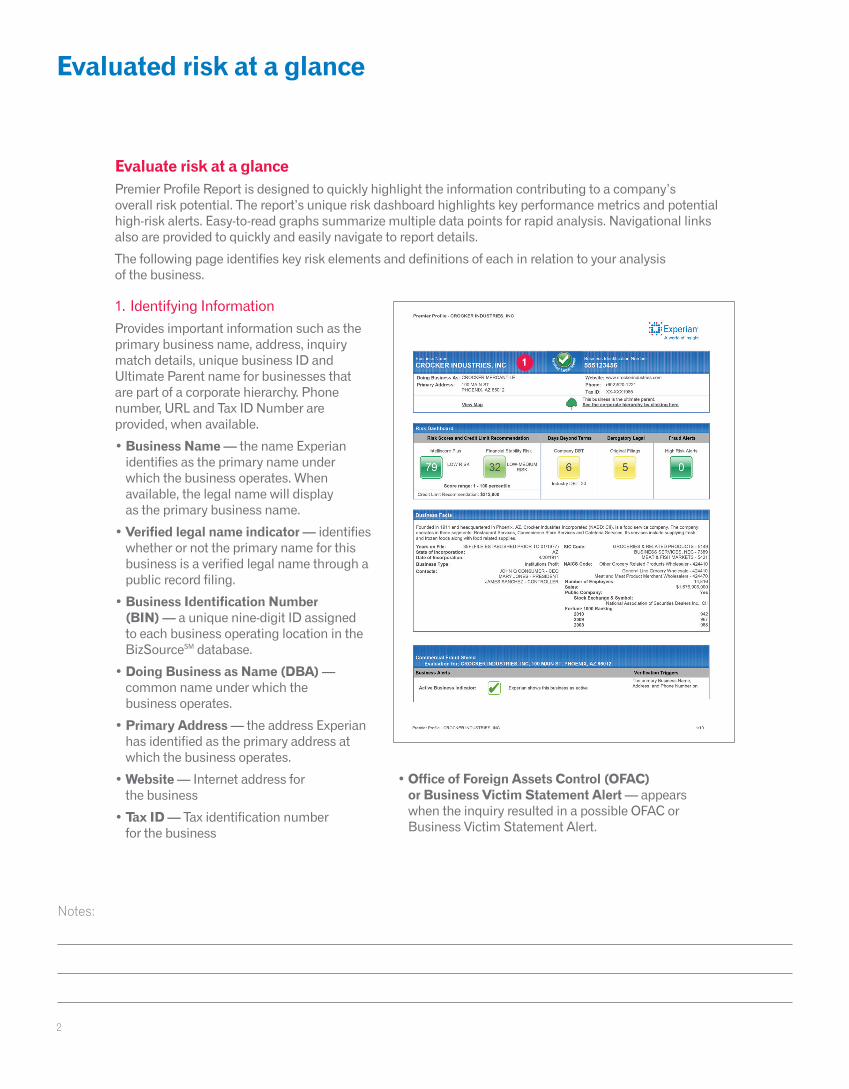
1. Identifying Information Provides important information such as the primary business name, address, inquiry match details, unique business ID and Ultimate Parent name for businesses that are part of a corporate hierarchy. Phone number, URL and Tax ID Number are provided, when available.
• Business Name — the name Experian identifies as the primary name under which the business operates. When available, the legal name will display as the primary business name.
• Verified legal name indicator — identifies whether or not the primary name for this business is a verified legal name through a public record filing.
• Business Identification Number (BIN) — a unique nine-digit ID assigned to each business operating location in the BizSourceSM database.
• Doing Business as Name (DBA) — common name under which the business operates.
• Primary Address — the address Experian has identified as the primary address at which the business operates.
• Website — Internet address for the business
• Tax ID — Tax identification number for the business
1
• Office of Foreign Assets Control (OFAC) or Business Victim Statement Alert — appears when the inquiry resulted in a possible OFAC or Business Victim Statement Alert.

Notes:
3
Evaluated risk at a glance
3. Business Facts Provides key operational facts about the business, including years in business, annual sales, key personnel, Standard Industrial Classification (SIC) codes, North American Industry Classification System (NAICS) codes, number of employees and annual sales. This section also includes a nonprofit indicator or information specific to public companies, such as stock exchange, ticker and Fortune 1000 rankings.
Tip: Business Facts help you better understand the history and size of the business.
• Map/Street View Photograph — In BusinessIQ,SM a View Map link displays a street-level photograph of the business. Where street-level photographs are unavailable, an aerial photograph of the location is displayed.
• Ultimate Parent Name — the name of the business that is the topmost responsible entity within the corporate hierarchy will be shown if the business is part of a larger corporate family. If the inquired upon business is the ultimate parent, a message will be displayed indicating that the business is the ultimate parent
2. Risk Dashboard Highlights summary elements related to risk, payment behavior, public record activity and possible fraudulent activity. The dashboard uses green, yellow and red to provide a glimpse of potential risk associated with the inquired-upon business. Details associated with each of these elements are contained within the profile.
• Intelliscore PlusSM
• Financial Stability Risk Score
• Days Beyond Terms (DBT)
• Derogatory legal filings
• Commercial Fraud ShieldSM
• Credit Limit Recommendation
2
3

Notes:
4
Evaluated risk at a glance
Premier Profile - CROCKER INDUSTRIES, INC 1/10
Evaluation for: CROCKER INDUSTRIES, INC, 100 MAIN ST. PHOENIX, AZ 85012Commercial Fraud Shield
968200896720099422010
Fortune 1000 Ranking National Association of Securities Dealers Inc., CII
Stock Exchange & Symbol: YesPublic Company:
$1,676,906,000Sales: 14,816Number of Employees:
Meat and Meat Product Merchant Wholesalers - 424470General Line Grocery Wholesale - 424410
Other Grocery Related Products Wholesaler - 424410NAICS Code: MEAT & FISH MARKETS - 5421
BUSINESS SERVICES, NEC - 7389GROCERIES & RELATED PRODUCTS - 5149SIC Code:
JOHN Q CONSUMER - CEOMARY JONES - PRESIDENT
JAMES SANCHEZ - CONTROLLER
Contacts: Institutions ProfitBusiness Type:
4/20/1911Date of Incorporation: AZState of Incorporation:
35+ (FILE ESTABLISHED PRIOR TO 01/1977)Years on File:
LOW-MEDIUMRISK32LOW RISK79
Premier Profile - CROCKER INDUSTRIES, INC
Business NameCROCKER INDUSTRIES, INC
Business Identification Number555123456
Doing Business As: CROCKER MERCANTILEPrimary Address: 100 MAIN ST
PHOENIX, AZ 85012
Website: www.crockerindustries.comPhone: (602)520-1221Tax ID: XX-XXX1985
This business is the ultimate parent. See the corporate hierarchy by clicking hereView Map
Risk Dashboard
Risk Scores and Credit Limit Recommendation
Intelliscore Plus Financial Stability Risk
Score range: 1 - 100 percentile
Credit Limit Recommendation: $212,800
Days Beyond Terms
Company DBT
6Industry DBT: 20
Derogatory Legal
Original Filings
5
Fraud Alerts
High Risk Alerts
0
Business Facts
Founded in 1911 and headquartered in Phoenix, AZ, Crocker Industries Incorporated (NASD: CII), is a food service company. The companyoperates in three segments: Restaurant Services, Convenience Store Services and Cafeteria Services. Its services include supplying freshand frozen foods along with food related supplies.
Business Alerts Verification Triggers
Active Business Indicator: Experian shows this business as activeThe primary Business Name,Address, and Phone Number on
Premier Profile - CROCKER INDUSTRIES, INC 2/10
Possible OFAC Match: No OFAC match found
Business Victim Statement: No Victim statements on file
Experian File were reviewed for HighRisk indicators, no High Riskindicators were found.
Credit Risk Score and Credit Limit Recommendation
Credit Risk Score: Intelliscore Plus
This score predicts the likelihood of serious credit delinquencies within the next 12 months. The score uses tradeline and collectionsinformation, public filings as well as other variables to predict future risk. Higher scores indicate lower risk.
Factors lowering the scoreBALANCE OF RECENTLY DELINQUENT COMMERCIAL ACCOUNTSBALANCE OF COMMERCIAL ACCOUNTS AT WORST DELINQUENCYCOMMERCIAL ACCOUNT DELINQUENCY IN LAST 6 MONTHS
Intelliscore Plus Risk AssessmentAction or risk threshold, based onyour company's thresholds:
Intelliscore Plus Industry Risk Comparison78% of businesses indicate a higher likelihood of severedelinquency.
Quarterly Score Trends
The Quarterly Score Trends provide a view of thelikelihood of delinquency over the past 12 months for thisbusiness. The trends will indicate if the score improved,remained stable, fluctuated or declined over the last 12months.
Credit Risk Score: Financial Stability Risk
This score predicts the likelihood of financial stability risk within the next 12 months.The score uses tradeline and collections information, public filings as well as othervariables to predict future risk. Higher scores indicate lower risk.
Please note, this business is publicly traded. Publicly traded companies are requiredto publish financial details including balance sheet, income statement and cash flowinformation that should be considered in conjunction with this score when assessingfinancial stability risk.
Factors lowering the score
The risk class groups scores by risk into ranges of similarperformance. Range 5 is the highest risk, range 1 is thelowest risk.
Industry Risk Comparison31% of businesses indicate a higher likelihood of financialstability risk.
No
No
Current Score: 79
79
Financial Stability Risk Score: 32 Risk Class: 2
32
5. Credit Risk Score and Credit Limit Recommendation
Credit Risk Score: Intelliscore PlusIntelliscore Plus predicts the likelihood of seriously derogatory payment within the next 12 months.
• Intelliscore Plus score — provides a score from 1 to 100. One indicates high risk; 100 indicates low risk. Intelliscore Plus also has two exclusion scores. A 998 displays when there is a bankruptcy within the past two years. A 999 displays when there is not enough information to score a business.
• Factors lowering the score — indicates the factors most influential in lowering the score from a top value of 100.
Tip: Factors lowering the score provide valuable insight into why a business has been assigned a particular score.
4. Commercial Fraud Shield Provides a series of checks to screen for potential indicators of fraudulent activity. These checks examine potential listings on the OFAC warning list; whether or not the business is currently active; if the business is a previous victim of fraud; and whether or not there are potential inconsistencies with the business name, address, phone and Tax ID Number.
Tip: Performing a fraud review is helpful in meeting due diligence and background check requirements related to a client’s identity.
• Active Business Indicator — indicates if Experian shows activity for this business within the BizSource database. To determine active status, Experian® looks at public record filings, including bankruptcy and corporate record status, trade and collection contributor reporting, and recent inquiry activity.
• Possible OFAC Match — screens for possible matches to the U.S. Treasury Department OFAC Specially Designated National (SDN) and Palestinian Legislative Council (PLC) lists.
Note: Any action taken regarding a commercial entity must be based on a complete investigation of the commercial entity and not based solely on the OFAC information.
• Business Victim Statement — Businesses that are victims of fraud can report this to Experian. Once the fraud is reported and verified, a statement is added to the business’s file.
• Verification Triggers — Business identification details (business name, address, phone number and Tax ID) are compared against an extensive database to identify potential inconsistencies.
5
4

Notes:
5
Evaluated risk at a glance
Premier Profile - CROCKER INDUSTRIES, INC 1/10
Evaluation for: CROCKER INDUSTRIES, INC, 100 MAIN ST. PHOENIX, AZ 85012Commercial Fraud Shield
968200896720099422010
Fortune 1000 Ranking National Association of Securities Dealers Inc., CII
Stock Exchange & Symbol: YesPublic Company:
$1,676,906,000Sales: 14,816Number of Employees:
Meat and Meat Product Merchant Wholesalers - 424470General Line Grocery Wholesale - 424410
Other Grocery Related Products Wholesaler - 424410NAICS Code: MEAT & FISH MARKETS - 5421
BUSINESS SERVICES, NEC - 7389GROCERIES & RELATED PRODUCTS - 5149SIC Code:
JOHN Q CONSUMER - CEOMARY JONES - PRESIDENT
JAMES SANCHEZ - CONTROLLER
Contacts: Institutions ProfitBusiness Type:
4/20/1911Date of Incorporation: AZState of Incorporation:
35+ (FILE ESTABLISHED PRIOR TO 01/1977)Years on File:
LOW-MEDIUMRISK32LOW RISK79
Premier Profile - CROCKER INDUSTRIES, INC
Business NameCROCKER INDUSTRIES, INC
Business Identification Number555123456
Doing Business As: CROCKER MERCANTILEPrimary Address: 100 MAIN ST
PHOENIX, AZ 85012
Website: www.crockerindustries.comPhone: (602)520-1221Tax ID: XX-XXX1985
This business is the ultimate parent. See the corporate hierarchy by clicking hereView Map
Risk Dashboard
Risk Scores and Credit Limit Recommendation
Intelliscore Plus Financial Stability Risk
Score range: 1 - 100 percentile
Credit Limit Recommendation: $212,800
Days Beyond Terms
Company DBT
6Industry DBT: 20
Derogatory Legal
Original Filings
5
Fraud Alerts
High Risk Alerts
0
Business Facts
Founded in 1911 and headquartered in Phoenix, AZ, Crocker Industries Incorporated (NASD: CII), is a food service company. The companyoperates in three segments: Restaurant Services, Convenience Store Services and Cafeteria Services. Its services include supplying freshand frozen foods along with food related supplies.
Business Alerts Verification Triggers
Active Business Indicator: Experian shows this business as activeThe primary Business Name,Address, and Phone Number on
Premier Profile - CROCKER INDUSTRIES, INC 2/10
Possible OFAC Match: No OFAC match found
Business Victim Statement: No Victim statements on file
Experian File were reviewed for HighRisk indicators, no High Riskindicators were found.
Credit Risk Score and Credit Limit Recommendation
Credit Risk Score: Intelliscore Plus
This score predicts the likelihood of serious credit delinquencies within the next 12 months. The score uses tradeline and collectionsinformation, public filings as well as other variables to predict future risk. Higher scores indicate lower risk.
Factors lowering the scoreBALANCE OF RECENTLY DELINQUENT COMMERCIAL ACCOUNTSBALANCE OF COMMERCIAL ACCOUNTS AT WORST DELINQUENCYCOMMERCIAL ACCOUNT DELINQUENCY IN LAST 6 MONTHS
Intelliscore Plus Risk AssessmentAction or risk threshold, based onyour company's thresholds:
Intelliscore Plus Industry Risk Comparison78% of businesses indicate a higher likelihood of severedelinquency.
Quarterly Score Trends
The Quarterly Score Trends provide a view of thelikelihood of delinquency over the past 12 months for thisbusiness. The trends will indicate if the score improved,remained stable, fluctuated or declined over the last 12months.
Credit Risk Score: Financial Stability Risk
This score predicts the likelihood of financial stability risk within the next 12 months.The score uses tradeline and collections information, public filings as well as othervariables to predict future risk. Higher scores indicate lower risk.
Please note, this business is publicly traded. Publicly traded companies are requiredto publish financial details including balance sheet, income statement and cash flowinformation that should be considered in conjunction with this score when assessingfinancial stability risk.
Factors lowering the score
The risk class groups scores by risk into ranges of similarperformance. Range 5 is the highest risk, range 1 is thelowest risk.
Industry Risk Comparison31% of businesses indicate a higher likelihood of financialstability risk.
No
No
Current Score: 79
79
Financial Stability Risk Score: 32 Risk Class: 2
32
• Intelliscore Plus risk assessment — provides a default risk assessment message; the field may be customized to display your company’s credit policy message using customized score ranges.
• Intelliscore Plus industry risk comparison — determines the percentage of businesses that have a higher likelihood of becoming severely delinquent compared with this business.
• Quarterly score trends — the average score over the past four quarters. The quarterly score is calculated on a rolling basis. In other words, it’s not tied to calendar quarters. It’s based on the 12 months prior to the inquiry date.
Credit Risk Score: Financial Stability Risk ScoreSM Financial Stability Risk ScoreSM predicts the likelihood of financial stability risk within the next 12 months.
• Financial Stability Risk Score — provides a score from 1 to 100. One indicates high risk; 100 indicates low risk. Financial Stability Risk Score also has two exclusion scores. A 998 displays when there is a bankruptcy within the past two years. A 999 displays when there is not enough information to score a business.
• Factors lowering the score — indicates the factors most influential in lowering the score from a top value of 100.
• Financial Stability Risk Score risk assessment — provides a default risk assessment message.
• Financial Stability Risk Score industry risk comparison — determines the percentage of businesses that have a higher likelihood of financial stability risk compared with this business.
Tip: Highly predictive risk and financial stability scores are critical to making a fast and accurate assessment of risk.
Notes:
6
Evaluated risk at a glance
Premier Profile - CROCKER INDUSTRIES, INC 3/10
YesCautionary UCC filings: 25UCC filings:
$124,937Sum of legal filings: 1Judgment filings: 4Tax Lien filings:
NoBankruptcy:
NET 30,CREDIT,REVOLVEMost frequent industry purchasing terms:
$379,300Highest credit amount extended: $371,300 - $572,5006 month average:
$361,500Continuous trade (37): $294All collections (1):
$391,000All trades (86): $391,173Total trade and collection (87):
Payments are stablePayment Trend Indication:
8Highest DBT Previous 5 Quarters: 8Highest DBT Previous 6 Months: 4Monthly Average DBT: 6Predicted DBT as 09/12/2012 : 6Current DBT:
NUMBER OF COMMERCIAL COLLECTION ACCOUNTSNUMBER OF COMMERCIAL DEROGATORY PUBLIC RECORDSRISK ASSOCIATED WITH THE COMPANY'S INDUSTRY SECTORPAST COMMERCIAL DEROGATORY BALANCE
Credit Limit Recommendation
Credit Limit Recommendation
$212,800
This recommendation compares this business against similar businesses in the Experian businesscredit database. It is based on trade information, industry, age of business and the IntelliscorePlus. The recommendation is a guide. The final decision must be made based on your company'sbusiness policies.
Payment and Legal Filings Summary
Payment Performance Trade and Collection Balance Legal Filings
Industry ComparisonIndustry DBT Range ComparisonThe current DBT of this business is 6. 11% of businesses have a DBT range of 6-15.
DBT NormsAll industry: 10Same industry: 20
Industry Payment ComparisonHas paid sooner than 50% of similar businesses
Payment Trending
DBT Trends
Monthly Payment TrendsPayment Trends Analysis
GROCERIES & RELATED PRODUCTS – 5149Account Status
Days Beyond Terms
DBT for this business: 6
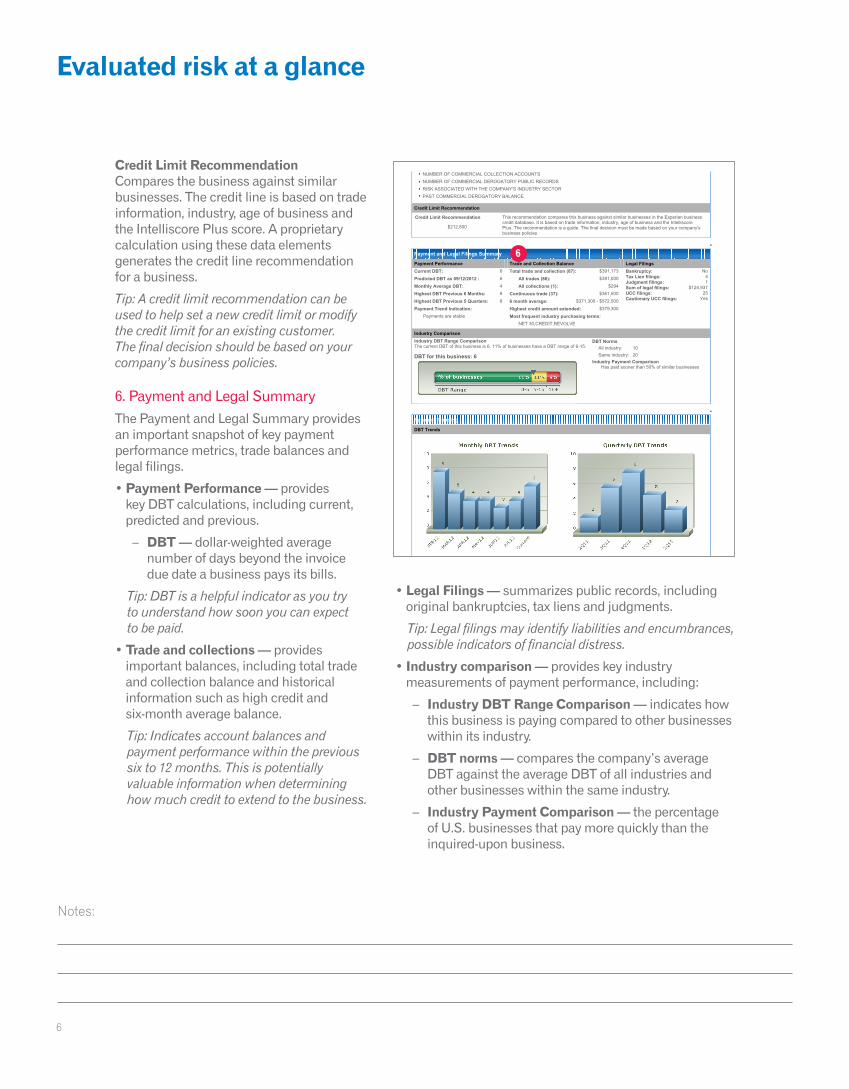
Credit Limit Recommendation Compares the business against similar businesses. The credit line is based on trade information, industry, age of business and the Intelliscore Plus score. A proprietary calculation using these data elements generates the credit line recommendation for a business.
Tip: A credit limit recommendation can be used to help set a new credit limit or modify the credit limit for an existing customer. The final decision should be based on your company’s business policies.
6. Payment and Legal Summary The Payment and Legal Summary provides an important snapshot of key payment performance metrics, trade balances and legal filings.
• Payment Performance — provides key DBT calculations, including current, predicted and previous.
– DBT — dollar-weighted average number of days beyond the invoice due date a business pays its bills.
Tip: DBT is a helpful indicator as you try to understand how soon you can expect to be paid.
• Trade and collections — provides important balances, including total trade and collection balance and historical information such as high credit and six-month average balance.
Tip: Indicates account balances and payment performance within the previous six to 12 months. This is potentially valuable information when determining how much credit to extend to the business.
• Legal Filings — summarizes public records, including original bankruptcies, tax liens and judgments.
Tip: Legal filings may identify liabilities and encumbrances, possible indicators of financial distress.
• Industry comparison — provides key industry measurements of payment performance, including:
– Industry DBT Range Comparison — indicates how this business is paying compared to other businesses within its industry.
– DBT norms — compares the company’s average DBT against the average DBT of all industries and other businesses within the same industry.
– Industry Payment Comparison — the percentage of U.S. businesses that pay more quickly than the inquired-upon business.
6

Notes:
7
Premier Profile - CROCKER INDUSTRIES, INC 4/10
DBTCurDate Reported Industry Business DBT Balance Cur 1-30 31-60 61-90 91+
CURRENT 74% 20 6 $361,500 80% 14% 1% 5%
JUN12 74% 20 4 $430,000 85% 10% 4% 1%
MAY12 74% 20 3 $444,900 87% 11% 1% 1%
APR12 74% 20 4 $572,500 84% 12% 2% 2%
MAR12 74% 20 4 $504,400 83% 13% 2% 2%
FEB12 74% 20 5 $509,700 76% 22% 2%
JAN12 74% 19 8 $495,700 76% 15% 3% 5% 1%
Quarterly Payment Trends
Payment History - Quarterly Averages Account StatusDays Beyond Terms
Quarter Months DBT Balance Cur 1-30 31-60 61-90 91+
Q2 - 12 APR - JUN 3 +$404,100 86% 11% 2% 1%
Q1 - 12 JAN - MAR 5 +$449,900 82% 13% 2% 3%
Q4 - 11 OCT - DEC 8 +$465,500 78% 13% 4% 5%
Q3 - 11 JUL - SEP 6 +$803,000 76% 18% 4% 2%
Q2 - 11 APR - JUN 2 +$692,500 88% 11% 1%
Collection Experiences
Date Placed Status Original Balance Outstanding Balance Date Closed Agency Agency Phone
02/2011 Uncollected $173 $294 07/2011 RECEIVABLE MANAGEMENT SERVICES
(484)242-4000
Trade Payment Summary
Trade Line Type Lines Reported DBT Recent High Credit Balance Current 01-30 31-60 61-90 91+
Continuous 37 6 +$1,417,900 +$361,500 80% 14% 1% 5%
New 4 $14,100 $9,800 100%
Combined Trade 41 6 +$1,432,000 +$371,300 81% 14% 1% 4%
Additional 45 $165,200 $19,700 83% 1% 5% 11%
Total Trade 86 $1,597,200 $391,000 83% 13% 4%
Trade Payment - New and Continuously Reported Trade Details
Payment Experiences(Trade Lines with an (*) after the date are newly reported)
Account StatusDays Beyond Terms
BusinessCategory
DateReported
LastSale
PaymentTerms
Recent HighCredit Balance Cur 1-30 31-60 61-90 91+ Comments
ACCT SVCS 06/2012 VARIED $174,600 $0
BLDG MATRL 07/2012 05/2012 CREDIT $1,100 $300 100%
CHEMICALS 04/2012 03/2010 NET 30 $2,300 $2,300 100%
COMMUNICTN 04/2012 VARIED $58,900 $58,900 75% 24% 1% ACCTCLOSED
ELEC MFG 06/2012 06/2012 VARIED $5,000 $0 SATSFTRY
FACTOR 05/2012* VARIED $0
FARM SUPPL 07/2012 01/2009 CREDIT $0
FINCL SVCS 07/2012 03/2004 NET 30 $500 $0
FINCL SVCS 07/2012 10/2011 REVOLVE $284,100 $0
FINCL SVCS 07/2012 06/2012 VARIED $9,600 $1,100 100% ACCTCLOSED
FOOD 04/2012 VARIOUS $29,400 $7,600 100%
• DBT trends — provides monthly and quarterly views of how many days the business is paying beyond their contractual terms.
– Monthly DBT Trend — the business’s average DBT performance for the previous seven months.
– Quarterly DBT Trend — the business’s average DBT performance for the previous five quarters.
Tip: Evaluating trends helps determine if the business is improving or declining in its payment performance. Changes in DBT over time may reveal that a business is incurring more debt or making progress in paying down outstanding balances. Long-term trending also may identify seasonal patterns that affect the business’s ability to pay.
7. Payment ExperiencesTrade Payment and Collection Information in BusinessIQ Premier ProfileSM provides a timely and accurate view of a business’s credit performance and identifies accounts that were sent to a collection agency. Comprehensive payment information allows easy analysis of whether a business’s ongoing payment behavior is steady, improving or declining. Trade payment information may be used to see how the inquired-upon business pays firms like yours in order to assess both the company’s ability and its willingness to pay.
Tip: Understanding the details associated with payment experiences is a smart way to analyze past payment habits on all trade accounts.
CollectionsExperian’s commercial collections database is the largest in the world. It includes information contributed by collection agencies to Experian. Additional collections information may be found in the Comments column of the Trade Payment section of the profile. Contributed collections are retained for up to six years.
Enables you to identify accounts that have been placed for collections. Recent collections activity may indicate a business’s inability or unwillingness to pay its financial obligations.
7
Evaluated risk at a glance
Notes:
8
Premier Profile - CROCKER INDUSTRIES, INC 4/10
DBTCurDate Reported Industry Business DBT Balance Cur 1-30 31-60 61-90 91+
CURRENT 74% 20 6 $361,500 80% 14% 1% 5%
JUN12 74% 20 4 $430,000 85% 10% 4% 1%
MAY12 74% 20 3 $444,900 87% 11% 1% 1%
APR12 74% 20 4 $572,500 84% 12% 2% 2%
MAR12 74% 20 4 $504,400 83% 13% 2% 2%
FEB12 74% 20 5 $509,700 76% 22% 2%
JAN12 74% 19 8 $495,700 76% 15% 3% 5% 1%
Quarterly Payment Trends
Payment History - Quarterly Averages Account StatusDays Beyond Terms
Quarter Months DBT Balance Cur 1-30 31-60 61-90 91+
Q2 - 12 APR - JUN 3 +$404,100 86% 11% 2% 1%
Q1 - 12 JAN - MAR 5 +$449,900 82% 13% 2% 3%
Q4 - 11 OCT - DEC 8 +$465,500 78% 13% 4% 5%
Q3 - 11 JUL - SEP 6 +$803,000 76% 18% 4% 2%
Q2 - 11 APR - JUN 2 +$692,500 88% 11% 1%
Collection Experiences
Date Placed Status Original Balance Outstanding Balance Date Closed Agency Agency Phone
02/2011 Uncollected $173 $294 07/2011 RECEIVABLE MANAGEMENT SERVICES
(484)242-4000
Trade Payment Summary
Trade Line Type Lines Reported DBT Recent High Credit Balance Current 01-30 31-60 61-90 91+
Continuous 37 6 +$1,417,900 +$361,500 80% 14% 1% 5%
New 4 $14,100 $9,800 100%
Combined Trade 41 6 +$1,432,000 +$371,300 81% 14% 1% 4%
Additional 45 $165,200 $19,700 83% 1% 5% 11%
Total Trade 86 $1,597,200 $391,000 83% 13% 4%
Trade Payment - New and Continuously Reported Trade Details
Payment Experiences(Trade Lines with an (*) after the date are newly reported)
Account StatusDays Beyond Terms
BusinessCategory
DateReported
LastSale
PaymentTerms
Recent HighCredit Balance Cur 1-30 31-60 61-90 91+ Comments
ACCT SVCS 06/2012 VARIED $174,600 $0
BLDG MATRL 07/2012 05/2012 CREDIT $1,100 $300 100%
CHEMICALS 04/2012 03/2010 NET 30 $2,300 $2,300 100%
COMMUNICTN 04/2012 VARIED $58,900 $58,900 75% 24% 1% ACCTCLOSED
ELEC MFG 06/2012 06/2012 VARIED $5,000 $0 SATSFTRY
FACTOR 05/2012* VARIED $0
FARM SUPPL 07/2012 01/2009 CREDIT $0
FINCL SVCS 07/2012 03/2004 NET 30 $500 $0
FINCL SVCS 07/2012 10/2011 REVOLVE $284,100 $0
FINCL SVCS 07/2012 06/2012 VARIED $9,600 $1,100 100% ACCTCLOSED
FOOD 04/2012 VARIOUS $29,400 $7,600 100%
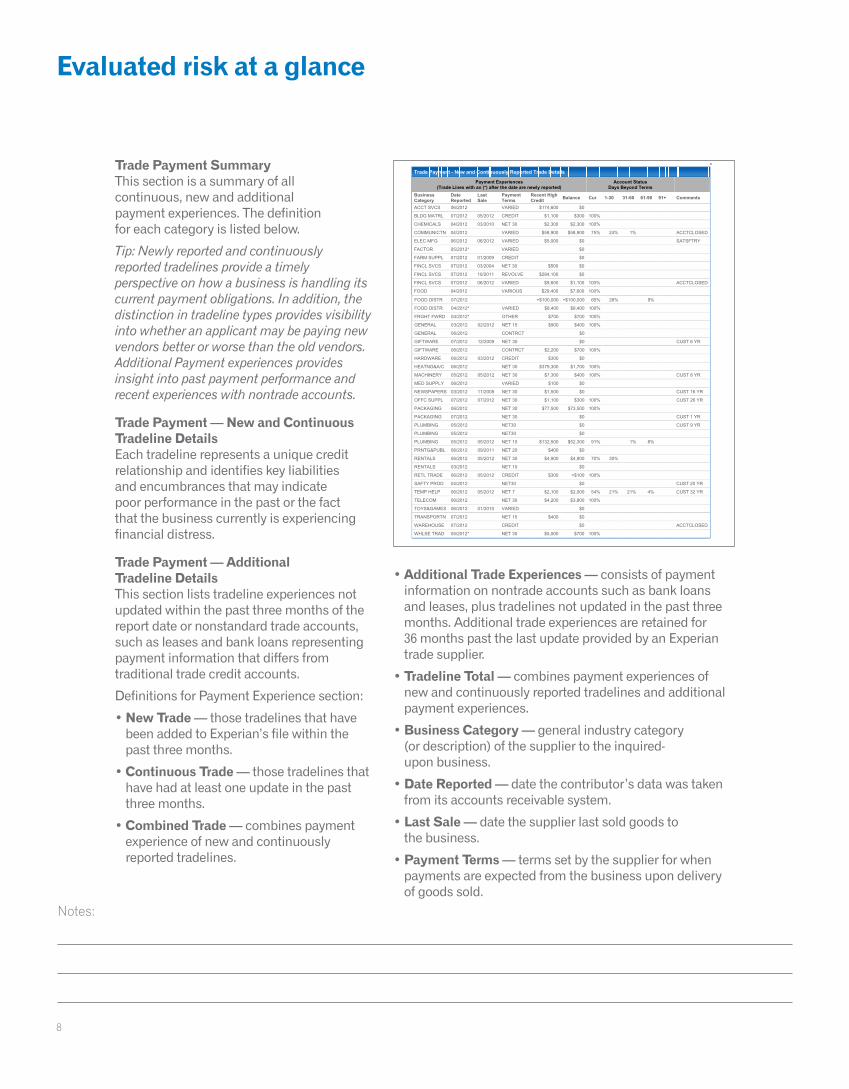
Trade Payment SummaryThis section is a summary of all continuous, new and additional payment experiences. The definition for each category is listed below.
Tip: Newly reported and continuously reported tradelines provide a timely perspective on how a business is handling its current payment obligations. In addition, the distinction in tradeline types provides visibility into whether an applicant may be paying new vendors better or worse than the old vendors. Additional Payment experiences provides insight into past payment performance and recent experiences with nontrade accounts.
Trade Payment — New and Continuous Tradeline DetailsEach tradeline represents a unique credit relationship and identifies key liabilities and encumbrances that may indicate poor performance in the past or the fact that the business currently is experiencing financial distress.
Trade Payment — Additional Tradeline DetailsThis section lists tradeline experiences not updated within the past three months of the report date or nonstandard trade accounts, such as leases and bank loans representing payment information that differs from traditional trade credit accounts.
Definitions for Payment Experience section:
• New Trade — those tradelines that have been added to Experian’s file within the past three months.
• Continuous Trade — those tradelines that have had at least one update in the past three months.
• Combined Trade — combines payment experience of new and continuously reported tradelines.
• Additional Trade Experiences — consists of payment information on nontrade accounts such as bank loans and leases, plus tradelines not updated in the past three months. Additional trade experiences are retained for 36 months past the last update provided by an Experian trade supplier.
• Tradeline Total — combines payment experiences of new and continuously reported tradelines and additional payment experiences.
• Business Category — general industry category (or description) of the supplier to the inquired- upon business.
• Date Reported — date the contributor’s data was taken from its accounts receivable system.
• Last Sale — date the supplier last sold goods to the business.
• Payment Terms — terms set by the supplier for when payments are expected from the business upon delivery of goods sold.
Premier Profile - CROCKER INDUSTRIES, INC 5/10
FOOD 07/2012 NET 21 $137,400 $51,200 100% FOOD DISTR 07/2012 +$100,000 +$100,000 65% 26% 9%
FOOD DISTR 04/2012* VARIED $8,400 $8,400 100%
FRGHT FWRD 04/2012* OTHER $700 $700 100%
GENERAL 03/2012 02/2012 NET 15 $900 $400 100%
GENERAL 06/2012 CONTRCT $0
GIFTWARE 07/2012 12/2009 NET 30 $0 CUST 6 YR
GIFTWARE 06/2012 CONTRCT $2,200 $700 100%
HARDWARE 06/2012 03/2012 CREDIT $300 $0
HEATNG&A/C 06/2012 NET 30 $379,300 $1,700 100%
MACHINERY 05/2012 05/2012 NET 30 $7,300 $400 100% CUST 8 YR
MED SUPPLY 06/2012 VARIED $100 $0
NEWSPAPERS 03/2012 11/2008 NET 30 $1,500 $0 CUST 16 YR
OFFC SUPPL 07/2012 07/2012 NET 30 $1,100 $300 100% CUST 26 YR
PACKAGING 06/2012 NET 30 $77,500 $73,500 100%
PACKAGING 07/2012 NET 30 $0 CUST 1 YR
PLUMBING 05/2012 NET30 $0 CUST 9 YR
PLUMBING 05/2012 NET30 $0
PLUMBING 05/2012 05/2012 NET 10 $132,500 $52,300 91% 1% 8%
PRNTG&PUBL 06/2012 09/2011 NET 20 $400 $0
RENTALS 06/2012 05/2012 NET 30 $4,900 $4,900 70% 30%
RENTALS 03/2012 NET 10 $0
RETL TRADE 06/2012 05/2012 CREDIT $300 <$100 100%
SAFTY PROD 04/2012 NET30 $0 CUST 20 YR
TEMP HELP 06/2012 05/2012 NET 7 $2,100 $2,000 54% 21% 21% 4% CUST 32 YR
TELECOM 06/2012 NET 30 $4,200 $3,800 100%
TOYS&GAMES 06/2012 01/2010 VARIED $0
TRANSPORTN 07/2012 NET 15 $400 $0
WAREHOUSE 07/2012 CREDIT $0 ACCTCLOSED
WHLSE TRAD 05/2012* NET 30 $5,000 $700 100%
Trade Payment - Additional Trade DetailsPayment Experiences
(Trade Lines with an (*) after the date are newly reported)Account Status
Days Beyond TermsBusinessCategory
DateReported
LastSale
PaymentTerms
Recent HighCredit Balance Cur 1-30 31-60 61-90 91+ Comments
ADVERTISNG 08/2011 NET 30 $0
AIR TRANS 07/2009 NET 30 $0 CUST 5 YR
APPAREL 01/2012 OTHER $1,100 $1,100 3% 97%
AUTO RENTL 03/2012 NET 30 $16,000 $0
BANK CARD 06/2012 REVOLVE $25,700 $4,200 100%
BLDG MATRL 05/2011 11/2000 CREDIT $0
CHEMICALS 01/2011 NET 30 $0
CHEMICALS 05/2010 NET 30 $0
CRED CARD 07/2012 01/2009 REVOLVE $0
CRED CARD 07/2012 01/2008 REVOLVE $0
CRED CARD 07/2012 11/2009 REVOLVE $0
CRED CARD 07/2012 12/2009 REVOLVE $0
CRED CARD 08/2010 CONTRCT $7,600 $0
CRED CARD 12/2010 CONTRCT $0
Evaluated risk at a glance

Notes:
9
Premier Profile - CROCKER INDUSTRIES, INC 6/10
CRED CARD 03/2012 CONTRCT $0 CRED CARD 06/2012 03/2012 NET 30 $5,200 $0 ACCTCLOSED
CRED CARD 06/2012 06/2009 NET 30 $13,700 $0 ACCTCLOSED
ELEC SUPLR 01/2012 NET 30 $200 $200 100%
FAB METALS 04/2011 NET 30 $0
FACTOR 09/2011 VARIOUS $0
FACTOR 01/2010 NET 30 $0 CUST 10 YR
FINCL SVCS 02/2011 NET PRX $7,000 $800 100%
FOOD 07/2010 06/2010 VARIED $500 $500 100%
FOOD DISTR 02/2011 02/2011 NET 7 $400 $200 100%
FOOD EQUIP 09/2009 03/2001 $0
GENERAL 09/2009 08/2008 VARIED $0
GENERAL 09/2010 CONTRCT $300 $0
GLASS 08/2011 06/2011 NET 30 $300 $0
INDUS SUPL 01/2010 01/2002 NET 30 $100 $0 CUST 10 YR
INDUS SUPL 02/2011 09/2010 NET 30 $600 $0 CUST 28 YR
INDUS SUPL 02/2011 11/2010 NET 30 $3,300 $200 100% CUST 12 YR
LEASING 07/2012 NET 10 $3,300 $2,400 6% 94%
MACH DISTR 04/2011 09/2010 1/10N30 $1,600 $0 CUST 32 YR
MANUFCTRNG 09/2011 08/2011 NET 30 $7,600 $200 100%
MANUFCTRNG 07/2011 06/2011 NET 30 $400 $200 100%
MISC MANUF 03/2011 03/2011 NET 30 $3,400 $300 100%
OFFC SUPPL 10/2009 06/2000 CREDIT $0 ACCTCLOSED
PACKAGING 02/2012 NET 30 $1,000 $0
PAPER DIST 05/2010 07/2005 NET 30 $0 CUST 9 YR
PAPER DIST 05/2010 05/2010 NET 10 $12,700 $9,400 100% CUST 25 YR
PLUMBING 12/2010 07/2002 NET30 $0
PRNTG&PUBL 05/2011 VARIED $0
RETL TRADE 06/2010 VARIED $0
TRANSPORTN 08/2011 04/2011 NET 15 $53,200 $0
TRNS EQUIP 10/2010 NET 15 $0
Legal Filings
Tax Liens
File Date Filing Type Status Amount Filing Number Jurisdiction
09/19/2011 Federal Tax Lien Released $63,600 FTL11223445 MARICOPA COUNTY SUP CT
Filed by: INTERNAL REVENUE SERVICE
06/21/2010 Federal Tax Lien Filed $63,600 FTL11223445 MARICOPA COUNTY SUP CT
Filed by: INTERNAL REVENUE SERVICE
08/04/2008 State Tax Lien Released $35 20085099232 MARICOPA COUNTY RECORDER
Filed by: STATE OF ARIZONA
05/01/2008 State Tax Lien Filed $35 200885092141 MARICOPA COUNTY RECORDER
MARICOPA COUNTY RECORDER
Filed by: STATE OF ARIZONA
04/04/2008 State Tax Lien Filed $45,076 08JG013382 CLARK COUNTY RECORDER OF DEEDS
Filed by: STATE OF NEVADA
02/14/2007 State Tax Lien Filed $13,226 2007148924
Filed by: STATE OF ARIZONA
• Recent High Credit — highest account balance the business has carried in the past 12 months.
• Balance — sum of all current and past-due amounts rounded to the nearest $100.
• Account Status — shows the balance owed to the reporting supplier as of the date reported. The CUR column shows the percentage of the total account balance that was current at the date reported. The remaining columns show the percentage of the total account balance that was 1 to 30 days, 31 to 60 days, 61 to 90 days, or 91 or more days past due. Balances are rounded to the nearest $100.
• Comments — shows further comments on the status of the account as provided by the data supplier (e.g., WRITE OFF, PROMPT, CUST 1 YR.).
• Newly reported tradeline indicator (*) — An asterisk (*) after the date reported on a tradeline shows that the tradeline has been added to Experian’s business information database within the past three months.
8. Public RecordLegal Filings identify details associated with accounts that have been placed for collections and derogatory public record filings. Filings include filing dates as well as current disposition. Filings are gathered from federal and state jurisdictions nationwide.
• Bankruptcy — Experian displays Chapter 7, 11 and 13 Bankruptcies on commercial credit reports. New filings are added to the Experian database within 24 hours. Experian will display a bankruptcy for nine years and nine months.
• Tax Liens — claims on the property or goods of a business by governmental tax agencies. Experian will display a tax lien for six years and nine months.
• Judgments — court decisions directing a business to make payments to a plaintiff. Experian will display a judgment for six years and nine months.
Tip: Public Record liabilities may allow others to supersede your claim to the business’s assets.
9. Uniform Commercial Code filings BusinessIQ Premier Profile notes the presence of any Uniform Commercial Code (UCC) filings. UCC filings are required whenever a company pledges assets as collateral.
8
Premier Profile - CROCKER INDUSTRIES, INC 7/10
11/14/2011UCC FILED Date: 201151904321Filing Number:
ARIZONA SEC OF STATEJurisdiction:IWIN FOODS, LLC IDSecured Party:
IDAHO FALLS 83401 125 CANYON FORT DR
11/22/2011UCC FILED Date: 201140005983Filing Number:
ARIZONA SEC OF STATEJurisdiction:FOREMOST SPIRITS CORP AZSecured Party:
SEDONA 86339 5983 MESA VIEW CIR
12/14/2011UCC FILED Date: 201154918532Filing Number:
ARIZONA SEC OF STATEJurisdiction:IWIN FOODS, LLC IDSecured Party:
IDAHO FALLS 83401 125 CANYON FORT DR
01/03/2012UCC FILED Date: 2012 1144303Filing Number:
SEC OF STATE DELAWARJurisdiction:BMS CREDIT LLC NEW YORK 10030 Secured Party:
1 NORTH GATTLE DRIVEEQUIP, AFTER ACQUIRED PROP, UNDEFINEDCollateral:
01/30/2012UCC FILED Date: 201231754131Filing Number:
SEC OF STATE AZJurisdiction:MONSOON STATE BANK AZSecured Party:
MESA 85202 483 COLLEGE PARK DR
02/13/2012UCC TERMINATED Date: 201014561234Filing Number:
11/22/2011Original Filing Date: 200914751261Original Filing Number:
AZOriginal Filing State: ARIZONA SEC OF STATEJurisdiction:
FOREMOST SPIRITS CORP AZSecured Party: SEDONA 86339 5983 MESA VIEW CIR
04/27/2012UCC FILED Date: 201248128539Filing Number:
SEC OF STATE AZJurisdiction:MONSOON STATE BANK AZSecured Party:
MESA 85202 483 COLLEGE PARK DR
05/09/2012UCC FILED Date: 201100000311Filing Number:
ARIZONA SEC OF STATEJurisdiction:STAGE COACH DIST INC AZSecured Party:
PHOENIX 85012 118 NW 232ND STREET
05/16/2012UCC FILED Date: 201206543914Filing Number:
SEC OF STATE AZJurisdiction:COYOTE GREETINGS INC AZSecured Party:
SCOTTSDATE 85255 12074 RIVERVIEW TER
06/29/2012UCC FILED Date: 201100000123Filing Number:
ARIZONA SEC OF STATEJurisdiction:STAGE COACH DIST INC AZSecured Party:
PHOENIX 85012 118 NW 232ND STREET
JudgmentsFile Date Plaintiff Status Amount Filing Number Jurisdiction
04/13/2006 MAVALINA PRODUCE Filed $3,000 20060000003 PHOENIX JUST COURT
Uniform Commercial Code (UCC) Filings
UCC Filing Summary
Date Range YearCautionaryUCCs**
TotalFiled
Released /Termination Continuous Amended /
AssignedJUL - PRESENT 2012
JAN - JUN 2012 1 6
JUL - DEC 2011 5 3
JAN - JUN 2011 1 4 1
JUL - DEC 2010 1
PRIOR TO JUL 2010 3 9 1
Total 5 25 4 1 0
** Cautionary UCC Filings include one or more of the following collateral:Accounts, Accounts Receivables, Contract Rights, Hereafter Acquired Property, Inventory, Leases, Notes Receivable or Proceeds.
UCC Details
View Additional UCC Details
9
Evaluated risk at a glance

Notes:
10
Premier Profile - CROCKER INDUSTRIES, INC 7/10
11/14/2011UCC FILED Date: 201151904321Filing Number:
ARIZONA SEC OF STATEJurisdiction:IWIN FOODS, LLC IDSecured Party:
IDAHO FALLS 83401 125 CANYON FORT DR
11/22/2011UCC FILED Date: 201140005983Filing Number:
ARIZONA SEC OF STATEJurisdiction:FOREMOST SPIRITS CORP AZSecured Party:
SEDONA 86339 5983 MESA VIEW CIR
12/14/2011UCC FILED Date: 201154918532Filing Number:
ARIZONA SEC OF STATEJurisdiction:IWIN FOODS, LLC IDSecured Party:
IDAHO FALLS 83401 125 CANYON FORT DR
01/03/2012UCC FILED Date: 2012 1144303Filing Number:
SEC OF STATE DELAWARJurisdiction:BMS CREDIT LLC NEW YORK 10030 Secured Party:
1 NORTH GATTLE DRIVEEQUIP, AFTER ACQUIRED PROP, UNDEFINEDCollateral:
01/30/2012UCC FILED Date: 201231754131Filing Number:
SEC OF STATE AZJurisdiction:MONSOON STATE BANK AZSecured Party:
MESA 85202 483 COLLEGE PARK DR
02/13/2012UCC TERMINATED Date: 201014561234Filing Number:
11/22/2011Original Filing Date: 200914751261Original Filing Number:
AZOriginal Filing State: ARIZONA SEC OF STATEJurisdiction:
FOREMOST SPIRITS CORP AZSecured Party: SEDONA 86339 5983 MESA VIEW CIR
04/27/2012UCC FILED Date: 201248128539Filing Number:
SEC OF STATE AZJurisdiction:MONSOON STATE BANK AZSecured Party:
MESA 85202 483 COLLEGE PARK DR
05/09/2012UCC FILED Date: 201100000311Filing Number:
ARIZONA SEC OF STATEJurisdiction:STAGE COACH DIST INC AZSecured Party:
PHOENIX 85012 118 NW 232ND STREET
05/16/2012UCC FILED Date: 201206543914Filing Number:
SEC OF STATE AZJurisdiction:COYOTE GREETINGS INC AZSecured Party:
SCOTTSDATE 85255 12074 RIVERVIEW TER
06/29/2012UCC FILED Date: 201100000123Filing Number:
ARIZONA SEC OF STATEJurisdiction:STAGE COACH DIST INC AZSecured Party:
PHOENIX 85012 118 NW 232ND STREET
JudgmentsFile Date Plaintiff Status Amount Filing Number Jurisdiction
04/13/2006 MAVALINA PRODUCE Filed $3,000 20060000003 PHOENIX JUST COURT
Uniform Commercial Code (UCC) Filings
UCC Filing Summary
Date Range YearCautionaryUCCs**
TotalFiled
Released /Termination Continuous Amended /
AssignedJUL - PRESENT 2012
JAN - JUN 2012 1 6
JUL - DEC 2011 5 3
JAN - JUN 2011 1 4 1
JUL - DEC 2010 1
PRIOR TO JUL 2010 3 9 1
Total 5 25 4 1 0
** Cautionary UCC Filings include one or more of the following collateral:Accounts, Accounts Receivables, Contract Rights, Hereafter Acquired Property, Inventory, Leases, Notes Receivable or Proceeds.
UCC Details
View Additional UCC Details
Premier Profile - CROCKER INDUSTRIES, INC 8/10
DESERT NATIONAL BANKFinancial Institution: 45 S SONORA BREEZE PHOENIX AZ 85012Address:
(602) 520-1100Phone:UNDISCLOSEDAccount Type:
12/20/2011Date Opened: NO COMMENT AS OF 06/16/2012Account Rating:
Additional Business Facts
Corporate Registration
THE FOLLOWING INFORMATION WAS PROVIDED BY THE STATE OF ARIZONA.State of Origin: AZDate of Incorporation: 04/20/2011Current Status: ActiveBusiness Type: Institutions - UnknownCharter Number: 665433
Competitors
OMNI FOODS, INC
Corporate Linkage
Business Name Location BIN
The inquired upon business, CROCKER INDUSTRIES, INC, is the Ultimate Parent
CROCKER INDUSTRIES, INC 100 MAIN ST - PHOENIX AZ 312845017
Subsidiaries of the inquired upon business:
ABC COMPANY INC 478 ANTON BLVD - COSTA MESA, CA 862731479
FOOD, INC 26843 LONE STAR WY - MCKINNEY, TX 394021789
Branches of the inquired upon business:*
CROCKER INDUSTRIES, INC 101 1ST AVENUE - MCKINNEY, TX 378655532
Inquiries
Summary of InquiriesBusinessCategory JUL12 JUN12 MAY12 APR12 MAR12 FEB12 JAN12 DEC11 NOV11
ADV TV 1
BUREAU 1
CREDTUNION 1
FACTOR 1 HOUSEWARES 1
TELECOM 1
TRANSPORTN 1 1
UTILITY 1
Totals 1 3 2 1 1 1
Commercial Finance Relationships
Banking Relationships
• UCC Profile — The UCC Profile summarizes UCC filings into date ranges to provide at-a-glance views into the filing types and potential risk of the business’s filings. Experian will display a UCC for five years.
Identifies lenders or financial institutions that have secured interest in a particular piece of property. Knowing what property is secured is important.
• Cautionary UCC — Cautionary UCC filings include one or more of the following collateral: accounts, accounts receivable, contracts, hereafter acquired inventory, leases, notes receivable or proceeds. The cautionary message is designed to highlight their presence.
The presence of cautionary UCC filings indicates that the business has pledged key assets to secure financing. Use of these critical assets may indicate that the business is under financial stress.
• Total Filed — total number of UCC filings for this business.
• Released/Termination — number of UCC filings where the secured party is no longer claiming any security interest.
• Continuation — number of UCC filings where the life of the UCC was extended. This occurs when the debt obligation still exists.
• Amended/Assigned — number of filings where a UCC was amended or assigned to another party. An amendment occurs when the debtor or secured party changes the collateral description. An assignment occurs when the secured party transfers all or a portion of its rights in the collateral to another party.
10. Commercial Finance RelationshipsCommercial Finance Relationships — This portion of the BusinessIQ Premier Profile provides banking and insurance information. Additional financial information also may be found within the Trade Payment Information section of the profile.
Tip: Identify financial partners associated with the business or verify business relationships.
More detailed information, including performance, is available through our Small Business Credit ShareSM program. For additional information on this program, contact your Experian account representative.
10
Evaluated risk at a glance

Notes:
11
Premier Profile - CROCKER INDUSTRIES, INC 8/10
DESERT NATIONAL BANKFinancial Institution: 45 S SONORA BREEZE PHOENIX AZ 85012Address:
(602) 520-1100Phone:UNDISCLOSEDAccount Type:
12/20/2011Date Opened: NO COMMENT AS OF 06/16/2012Account Rating:
Additional Business Facts
Corporate Registration
THE FOLLOWING INFORMATION WAS PROVIDED BY THE STATE OF ARIZONA.State of Origin: AZDate of Incorporation: 04/20/2011Current Status: ActiveBusiness Type: Institutions - UnknownCharter Number: 665433
Competitors
OMNI FOODS, INC
Corporate Linkage
Business Name Location BIN
The inquired upon business, CROCKER INDUSTRIES, INC, is the Ultimate Parent
CROCKER INDUSTRIES, INC 100 MAIN ST - PHOENIX AZ 312845017
Subsidiaries of the inquired upon business:
ABC COMPANY INC 478 ANTON BLVD - COSTA MESA, CA 862731479
FOOD, INC 26843 LONE STAR WY - MCKINNEY, TX 394021789
Branches of the inquired upon business:*
CROCKER INDUSTRIES, INC 101 1ST AVENUE - MCKINNEY, TX 378655532
Inquiries
Summary of InquiriesBusinessCategory JUL12 JUN12 MAY12 APR12 MAR12 FEB12 JAN12 DEC11 NOV11
ADV TV 1
BUREAU 1
CREDTUNION 1
FACTOR 1 HOUSEWARES 1
TELECOM 1
TRANSPORTN 1 1
UTILITY 1
Totals 1 3 2 1 1 1
Commercial Finance Relationships
Banking Relationships
11. Additional Business Facts BusinessIQ Premier Profile provides an in-depth look at the business you are evaluating. From how long the business has been in operation and other legal names under which the business operates to corporate hierarchy and competitors, these details provide background on whom you are conducting business.
• Corporate Registration — Details may include state of incorporation, incorporation date, charter number, current status, most recent filing date, and name and address of the registered agent.
• Business License Filings — insight into ownership, names under which the business operates and how long they are licensed to operate.
• Additional DBA Names — Many businesses operate under multiple legal names. This section contains a list of other legal names under which this business operates.
• Competitors — list of businesses this business competes against in the market.
• Corporate Linkage — Linkage occurs when one business has financial and legal responsibility for another. Common linkage identifiers are used to identify these relationships.
Corporate Linkage enables businesses to make better decisions through the identification of relationships within a corporate family.
• Ultimate Parent — topmost responsible member of the family tree.
• Immediate Parent — Parent refers to a business with a subsidiary. The Immediate Parent is the parent company for the business that is the subject of the profile.
• Branches/Alternate addresses — additional locations or alternate addresses for the business that is the subject of this profile.
• Subsidiaries — businesses of which the subject of this profile owns more than 50 percent.
12. Inquiries• Inquiries — provide a summary of all inquiries made
on the business within the past nine months.
• Assess whether the company is actively seeking credit and identify the types of businesses that have been submitting inquiries on the business.
11
12
Evaluated risk at a glance

Notes:
12
Premier Profile - CROCKER INDUSTRIES, INC 9/10
Corporate Financial Information
Balance sheet for fiscal year ending: DEC 31Data current through: 12/31/2011 ($ Thousands)
2011 2010 2009
Cash and equivalent 57,730 17,803 13,606
Receivables - net 26,043 19,857 23,045
Inventory 23,526 25,920 31,087
Other current assets 12,306 13,344 12,522
Total current assets 119,605 76,924 80,260
Fixed assets - net 900,878 961,974 1,002,692
Investments 27,620 23,032 15,936
Other assets 46,218 47,227 48,760
Total assets 1,094,321 1,109,157 1,147,648
Debt due in 1 year 13,571 40,905 93,904
Notes payable 0 0 0
Accounts payable 30,418 29,322 32,220
Taxes payable 10,793 8,708 9,867
Other current liabilities 116,330 114,521 109,814
Total current liabilities 171,112 193,456 245,805
Long term debt 135,716 149,287 176,192
Other liabilities 123,383 128,257 127,945
Net worth 664,110 638,157 597,706
Total liab. and net worth 1,094,321 1,109,157 1,147,648
Operating statement for fiscal year ending: APR 29Data current through: 04/29/2011 ($ Thousands)
2011 2010 2009
Net sales 1,676,906 1,726,804 1,750,512
Cost of goods sold 509,849 516,667 537,085
Gross income on sales 1,167,057 1,210,137 1,213,427
Expenses 1,087,384 1,113,811 1,197,366
Pre-tax income 79,673 96,326 16,061
Taxes 25,510 25,998 21,207
After tax income 54,163 70,328 -5,146
Extraord. inc. & discont'd ops 0 0 0
Net income 54,163 70,328 -5,146
Critical data and ratios for fiscal year ending: APR 29Data current through: 04/29/2011 ($ Thousands)
2011 2010 2009
Net worth 664,110 638,157 597,706
Net working capital -51,507 -116,532 -165,545
• Operating statement — Also known as a profit and loss statement, the operating statement provides details of a company’s sales, cost of sales, operating expenses and net profit/loss.
Tip: An operating statement can quickly help you understand whether a company is profitable or not. By looking at operating statement trends, you can quickly determine whether the company’s revenues are growing or declining and at what rate. Improvements or reductions in gross profit margin and operating expenses also can provide valuable insights into how well a company is managing its costs relative to its revenue. Finally, knowing whether a company is experiencing profitable operations over time can provide a strong indicator of the company’s near- and long-term viability.
13. Company Financial InformationCompany Financial Information provides objective data on the financial health of the business if it is a publicly held company.
• Balance sheet — A balance sheet is a company’s statement of assets, liabilities and net worth. Information is included for up to three fiscal years. You can analyze the current statement or conduct up to a three-year trend analysis of key financial items.
Assets are broken down into two categories:
– Current assets — cash and assets of the business that are likely to be converted to cash in the next 12 months.
– Noncurrent assets — assets of the company that are not expected to be converted to cash in the next 12 months, such as buildings, real estate, fixtures and equipment.
Liabilities also are broken down into two categories:
– Current liabilities — debts the company owes that will likely be paid in the next 12 months, such as accounts payable, current amounts due on long-term debt and accrued taxes.
– Long-term liabilities — debts of the company that are due beyond the next 12 months, such as the amount of a bank loan that is due beyond the next 12 months.
Net worth is calculated by subtracting the company’s total liabilities from its total assets.
Tip: The balance sheet can help you understand a firm’s financial strength and can provide indications of a company’s near- and long-term solvency. Tracking these financial indicators can help you analyze whether a company is likely to become financially stronger or weaker.
13
Evaluated risk at a glance

Notes:
13
• Critical data and ratios — This information helps you understand the relationship between key balance sheet items and how those ratios change over time. Financial ratios typically are divided into three categories:
– Solvency ratios — These ratios provide an indication of a company’s ability to generate cash. They focus mainly on the current assets and current liabilities balance sheet items.
– Current ratio provides a good indication of how much cash a company has or can expect to generate from selling inventory in relation to its obligations that are expected to be paid over the next 12 months.
– Average days sales outstanding gives an indication of how quickly a company collects on its receivables and therefore is a further indicator of a company’s ability to generate cash.
– Debt ratios — These ratios demonstrate how leveraged a business is.
– A high debt-to-equity ratio indicates that the company owes more than it actually owns of the business.
– A low debt-to-equity ratio indicates a company owns more of the business than it owes.
Understanding whether a company is highly leveraged or not is a very important part of any credit analysis, and it is essential to understanding how to manage the credit relationship.
• Operating ratios — These ratios provide insight into a company’s ability to run a profitable and sustainable business.
Premier Profile - CROCKER INDUSTRIES, INC 9/10
Corporate Financial Information
Balance sheet for fiscal year ending: DEC 31Data current through: 12/31/2011 ($ Thousands)
2011 2010 2009
Cash and equivalent 57,730 17,803 13,606
Receivables - net 26,043 19,857 23,045
Inventory 23,526 25,920 31,087
Other current assets 12,306 13,344 12,522
Total current assets 119,605 76,924 80,260
Fixed assets - net 900,878 961,974 1,002,692
Investments 27,620 23,032 15,936
Other assets 46,218 47,227 48,760
Total assets 1,094,321 1,109,157 1,147,648
Debt due in 1 year 13,571 40,905 93,904
Notes payable 0 0 0
Accounts payable 30,418 29,322 32,220
Taxes payable 10,793 8,708 9,867
Other current liabilities 116,330 114,521 109,814
Total current liabilities 171,112 193,456 245,805
Long term debt 135,716 149,287 176,192
Other liabilities 123,383 128,257 127,945
Net worth 664,110 638,157 597,706
Total liab. and net worth 1,094,321 1,109,157 1,147,648
Operating statement for fiscal year ending: APR 29Data current through: 04/29/2011 ($ Thousands)
2011 2010 2009
Net sales 1,676,906 1,726,804 1,750,512
Cost of goods sold 509,849 516,667 537,085
Gross income on sales 1,167,057 1,210,137 1,213,427
Expenses 1,087,384 1,113,811 1,197,366
Pre-tax income 79,673 96,326 16,061
Taxes 25,510 25,998 21,207
After tax income 54,163 70,328 -5,146
Extraord. inc. & discont'd ops 0 0 0
Net income 54,163 70,328 -5,146
Critical data and ratios for fiscal year ending: APR 29Data current through: 04/29/2011 ($ Thousands)
2011 2010 2009
Net worth 664,110 638,157 597,706
Net working capital -51,507 -116,532 -165,545
– The ratio of net profit to net sales provides insight into the company’s ability to generate a healthy profit margin. By looking at this ratio trend over three years, it becomes quickly apparent whether a company, even if profitable, is maintaining sufficiently strong profit margins to remain financially viable in the long term.
– The ratio of net income to net worth provides insight into how well a company is growing the net worth of the business from operations and if there is a sufficient return to finance the business from operations or if additional borrowing may be required.
Evaluated risk at a glance

Notes:
i
Glossary
Account StatusAccount balance and aging of that account as of the last date reported.
Provides you with a summary of the business’s credit activities by trade relationship.
Additional Trade DetailsConsists of payment information on nontrade accounts such as bank loans and leases, plus tradelines not updated in the past three months.
Shows the most current information regarding periodic installment payments and can be indicative of payment problems in the recent past.
BalanceDollar sum of all current and past-due amounts rounded to the nearest $100.
Lets you see the amount of debt the business is carrying with other suppliers.
BankruptciesLegal processes by which the company’s assets are liquidated or by which the company seeks protection from creditors.
Makes you aware of financial distress.
Business CategoryGeneral industry category (or description) of the supplier to the inquired-upon business.
Enables you to identify whether the supplier is a primary or secondary supplier and allows you to compare the business’s payment habits across industries.
Business FactsProvides key operational facts about the business, including years in business, annual sales, key personnel, SIC codes, NAICS codes, number of employees and annual sales. This section also includes a nonprofit indicator or information specific to public companies, such as stock exchange, ticker and Fortune 1000 rankings.
Business Identification NumberA unique nine-digit ID assigned to each business operating location in the BizSource database.
This persistent ID allows BizSource to track all information associated with a business over time, even with address or name changes.
Information about the business’s background is used to further identify the company requesting credit.
Business Victim StatementBusinesses that are victims of fraud can report this to Experian. Once the fraud is reported and verified, a statement is added to the business’s file.
When evaluating a business that was a victim of fraud, it’s important to make sure the information you are reviewing is factual. When there is a question, contacting the business directly for proof may be helpful.
Cautionary UCCCautionary UCC filings include one or more of the following collateral: accounts, accounts receivable, contracts, hereafter acquired inventory, leases, notes receivable or proceeds. The cautionary message is designed to highlight their presence.
The presence of cautionary UCC filings indicates that the business has pledged key assets to secure financing.
Use of these critical assets may indicate that the business is under financial stress.
Combined Trade Combines payment experience of new and continuously reported tradelines.
The significance of identifying newly reported versus continuously reported tradelines is that an applicant may be paying new vendors better or worse than the old vendors.
Glossary

Notes:
ii
Glossary
CommentsAdditional explanations of account status as provided by the data supplier (e.g., WRITE OFF, PROMPT, CUST 1 YR.).
Can help you make a more informed credit decision by highlighting the most derogatory information.
Commercial Fraud ShieldProvides a series of checks to screen for potential indicators of fraudulent activity.
Performing a fraud review is helpful in meeting due diligence and background check requirements related to a client’s identity.
Company Financial Information Financial information provided on publicly held U.S. businesses. Also may include in-depth business background information on privately held firms.
Provides you with an in-depth analysis into a business’s history and allows you to gauge its financial strength in relation to its payment habits.
Continuously reported tradeline or continuously reportedThose tradelines that have had at least one update in the past three months.
Identifies those tradelines that have the most current and relevant information for a credit decision.
Corporate Linkage Linkage occurs when one business has financial and legal responsibility for another. Common linkage identifiers are used to identify these relationships.
Corporate Linkage enables businesses to make better decisions through the identification of relationships within a corporate family.
Credit limit recommendationThe recommendation compares the business against similar businesses. The credit line is based on trade information, industry, age of business and the Intelliscore Plus score. These data elements are then utilized in a proprietary calculation that generates the credit line potential for a business.
A credit limit recommendation can be used to help set a new credit limit or modify the credit limit for an existing customer. The final decision should be based on your company’s business policies.
CurrentPercentage of account that is paid within terms set by a supplier.
Allows you to determine if the company pays other suppliers on time.
Date reportedThe month that the supplier’s data was taken from its accounts receivable system.
Shows you the most current data in Experian’s file.
Days Beyond Terms (DBT)Dollar-weighted average number of days beyond the invoice due date a business pays its bills.
DBT = (Total 1 x 15) + (Total 2 x 45) + (Total 3 x 75) + (Total 4 x 10⁵)
Total dollars outstanding
Total 1 = Total dollars in aged category 1 to 30 days
Total 2 = Total dollars in aged category 31 to 60 days
Total 3 = Total dollars in aged category 61 to 90 days
Total 4 = Total dollars in aged category 91 or more days
Provides a single dollar-weighted average for determining payment status, expressed as the average number of days past “invoice due” date. This is not a subjective rating determined by one individual.
DBT normsCompares the average number of days late the business’s industry is paying all continuously reported tradelines and the average DBT for all industries.
Provides a point of reference for comparison purposes, giving the business’s DBT more context.

Notes:
iii
Glossary
Federal, State and County Tax LiensRepresents claims on the property or goods of a business by governmental tax agencies.
Allows you to determine whether the business has a legal requirement to pay past tax obligations before its other payments.
File established dateDate the first tradelines were contributed and the file was created within Experian’s database.
Shows you the number of years Experian has been collecting data on the business.
Financial Stability Risk ScoreFinancial Stability Risk ScoreSM predicts the likelihood of financial stability risk within the next 12 months.
Helps you determine the risk of business failure
Fortune 1000 RankingProvides three-year history of Fortune 1000 rankings.
Provides insight into current and past rankings of the largest U.S. businesses.
Immediate Parent Parent refers to a business with a subsidiary. The Immediate Parent is the parent company for the business that is the subject of the profile.
Provides insight into the corporate family tree.
Intelliscore PlusPredicts the likelihood of seriously derogatory payment within the next 12 months.
When used in conjuction with the Financial Stability Risk Score, you can determine if a business is likely to pay or is at risk of default
Inquiry informationLists the number of inquiries and types of businesses making inquiries on the company within the past nine months.
Helps you determine if the business is expanding or if current suppliers are limiting their access, forcing the business to shop for new suppliers.
JudgmentsCourt decisions directing a business to make payments to a plaintiff; abstract judgments differ only in that they are prepared by the court recorder’s office.
Shows you if the business is responsible for any payments on a legal matter that can impact its cash flow.
Last SaleDate of last sale to the trade contributor
Lets you see the most recent sale date to the supplier.
Leasing RelationshipsA lease is an agreement wherein, over the term of the lease, the owner permits the use of an asset in exchange for a series of payments.
Legal FilingsCommercial public record information filed with the U.S. legal system.
Shows you the business’s legal liabilities, which may affect its ability to pay.
Matching Branch Address and BIN The branch address and BIN of the business location that most closely match the inquiry.
Identifies other locations of a business and provides additional visibility into how your inquiry matched against the Experian database.
Monthly Payment TrendsView of current month and previous six-month summary of payment behavior changes. Continuously reported tradelines are used to calculate trending.

Notes:
iv
Glossary
North American Industry Classification System (NAICS)Provides up to three industry identifications using the NAICS.
Identifies the industry of the business. This information can be used when making risk assessments.
New Tradeline Reported or Newly ReportedThose tradelines that have been added to Experian’s file within the past three months.
Identifies the most recently added tradelines. Helps to identify how new information may affect conclusions about past payment behavior.
Nonprofit Indicator Indicates that the inquired-upon business is a nonprofit. Experian obtains nonprofit information from Corporate Record filings.
To receive a nonprofit designation, businesses must follow a strict set of operational guidelines.
Office of Foreign Assets Control (OFAC) Screens for possible matches to the U.S. Treasury Department OFAC SDN and PLC lists.
Any action taken regarding a commercial entity must be based on a complete investigation of the commercial entity and not based solely on the OFAC information.
Payment TermsTerms set by the suppliers.
Can be used to determine what credit terms to set.
Monthly Payment TrendsHistorical record of the business’s payment practices in the past six months based on continuously reported information.
Shows you if the business’s payment behavior is improving or deteriorating.
Phone NumberPrimary phone number of the inquired- upon company.
Allows you to validate the account and gives you immediate access to the business for more investigation or for collection purposes.
Primary Business Name The name Experian identifies as the primary name under which the business operates. When available, the legal name will display as the primary business name.
When the primary business name is identified as a legal name, the verified legal name indicator will display.
Public Company Indicator Indicates this business is traded publically.
These companies follow a strict set of guidelines for reporting financials to their shareholders.
Quarterly Payment TrendsA five-quarter (15-month) summary of all the trade experiences reported to Experian for a particular business. Continuously reported tradelines are used to calculate trending.
Provides evaluation of long-term payment behavior and the company’s ability to generate sustained cash flow.
Quarterly Score TrendsThe average score over the past four quarters. The quarterly score is calculated on a rolling basis. In other words, it’s not tied to calendar quarters. It’s based on the 12 months prior to the inquiry date.
Recent High CreditHighest account balance the business has carried in the past 12 months.
Shows you the highest amount of credit other suppliers have extended.

Notes:
v
Glossary
Standard Industrial Classification (SIC Code)The SIC code assigned by the government for a business’s primary business activity.
Identifies the industry of the business. This information can be used when making risk assessments.
Subsidiaries Businesses of which the inquired upon business owns more than 50 percent.
Larger organizations tend to have more complex corporate structures, which often include subsidiaries.
Total TradeCombines payment experiences of new and continuous tradelines and additional payment experiences.
Provides insight into how a business is handling its current and previous payment experiences.
Trade Payment SummaryThis section is a summary of all trade (new, continuous and additional) and collection experiences.
Understanding the details associated with payment experiences is a smart way to analyze payment habits.
Ultimate Parent Topmost responsible member of the family tree.
Corporate structures range in complexity. A family tree may be a simple structure with just branches or a complex subsidiary structure.
Uniform Commercial Code (UCC) filings and amendmentsUCC filings, which are required whenever a business pledges an asset as collateral.
Identifies collateral. Gives you additional bank or financing references and may signal financial instability (i.e., the number of filings pledged with noncapital assets).
Verified Legal Name Indicator Present when the primary name for this business is a verified legal name through a public record filing.
Businesses may operate under various aliases; however, the legal name is the official name the business is registered under with various governmental agencies.
vi
Notes

vii
Notes

viii
Notes

475 Anton Blvd.Costa Mesa, CA 92626T: 1 800 520 1221www.experian.com
© 2013 Experian Information Solutions, Inc. • All rights reserved
Experian and the Experian marks used herein are service marks or registered trademarks of Experian Information Solutions, Inc.
Other product and company names mentioned herein are the property of their respective owners.
04/13 • 6659-CS