business value of agile methods - davidfrico.comdavidfrico.com/rico15k.pdf · business value of...
TRANSCRIPT
Business Value ofAgile Methods
Using ROI & Real OptionsDr. David F. Rico, PMP, CSEP, ACP, CSM, SAFe
Twitter: @dr_david_f_ricoWebsite: http://www.davidfrico.com
LinkedIn: http://www.linkedin.com/in/davidfricoAgile Capabilities: http://davidfrico.com/rico-capability-agile.pdf
Agile Resources: http://www.davidfrico.com/daves-agile-resources.htmAgile Cheat Sheet: http://davidfrico.com/key-agile-theories-ideas-and-principles.pdf
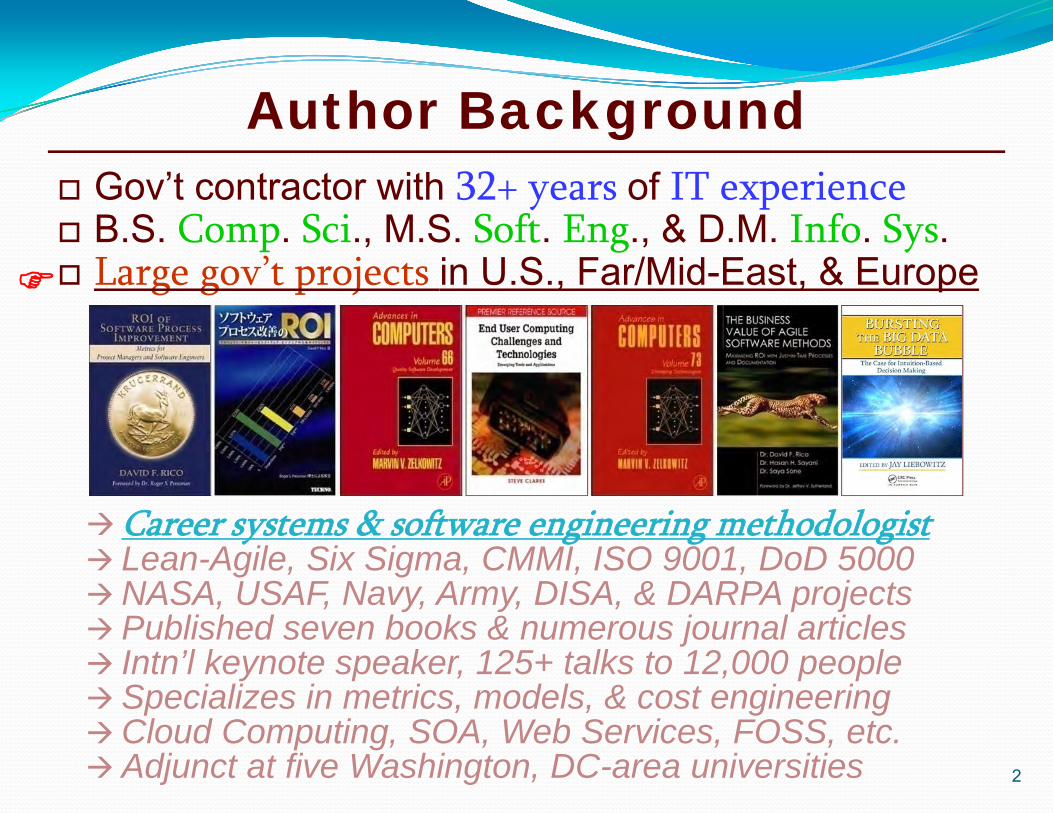
Author Background Gov’t contractor with 32+ years of IT experience B.S. Comp. Sci., M.S. Soft. Eng., & D.M. Info. Sys. Large gov’t projects in U.S., Far/Mid-East, & Europe
2
Career systems & software engineering methodologist Lean-Agile, Six Sigma, CMMI, ISO 9001, DoD 5000NASA, USAF, Navy, Army, DISA, & DARPA projects Published seven books & numerous journal articles Intn’l keynote speaker, 125+ talks to 12,000 people Specializes in metrics, models, & cost engineeringCloud Computing, SOA, Web Services, FOSS, etc. Adjunct at five Washington, DC-area universities
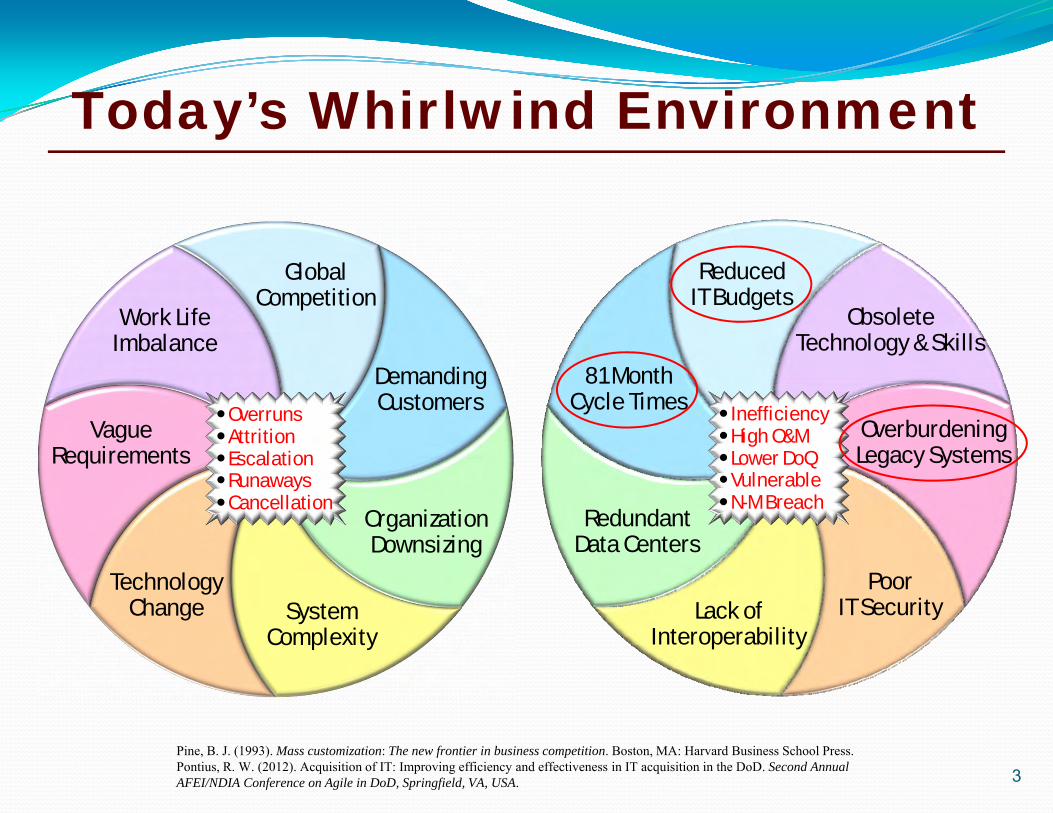
Today’s Whirlwind Environment
3
OverrunsAttritionEscalationRunawaysCancellation
GlobalCompetition
DemandingCustomers
OrganizationDownsizing
SystemComplexity
TechnologyChange
VagueRequirements
Work LifeImbalance
InefficiencyHigh O&MLower DoQVulnerableN-M Breach
ReducedIT Budgets
81 MonthCycle Times
RedundantData Centers
Lack ofInteroperability
PoorIT Security
OverburdeningLegacy Systems
ObsoleteTechnology & Skills
Pine, B. J. (1993). Mass customization: The new frontier in business competition. Boston, MA: Harvard Business School Press.Pontius, R. W. (2012). Acquisition of IT: Improving efficiency and effectiveness in IT acquisition in the DoD. Second Annual AFEI/NDIA Conference on Agile in DoD, Springfield, VA, USA.
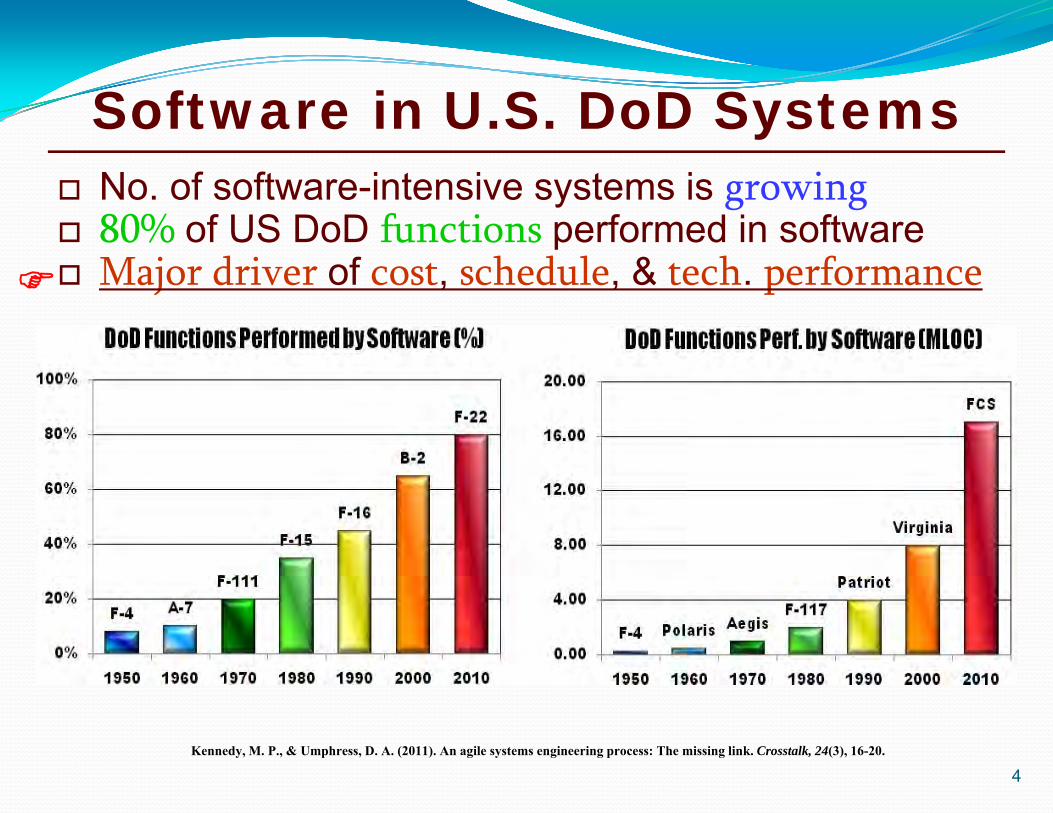
Software in U.S. DoD Systems
Kennedy, M. P., & Umphress, D. A. (2011). An agile systems engineering process: The missing link. Crosstalk, 24(3), 16-20.
No. of software-intensive systems is growing 80% of US DoD functions performed in software Major driver of cost, schedule, & tech. performance
4
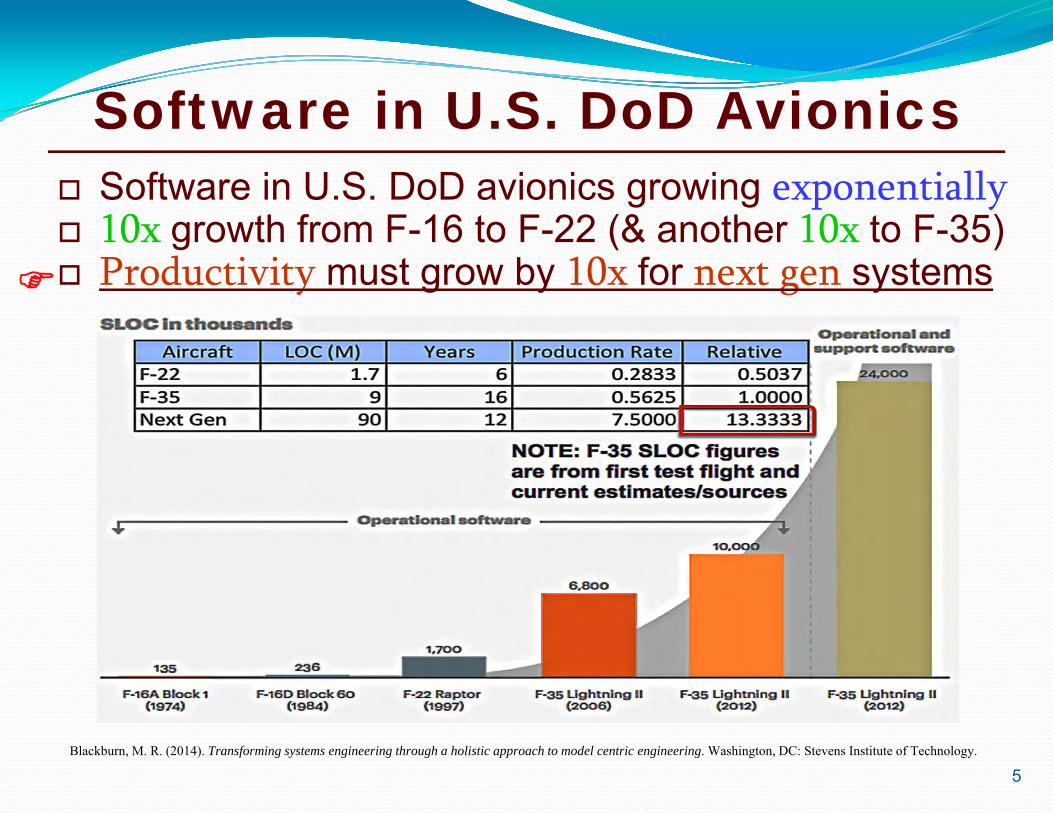
Software in U.S. DoD Avionics
Blackburn, M. R. (2014). Transforming systems engineering through a holistic approach to model centric engineering. Washington, DC: Stevens Institute of Technology.
Software in U.S. DoD avionics growing exponentially 10x growth from F-16 to F-22 (& another 10x to F-35) Productivity must grow by 10x for next gen systems
5
Traditional Projects
6
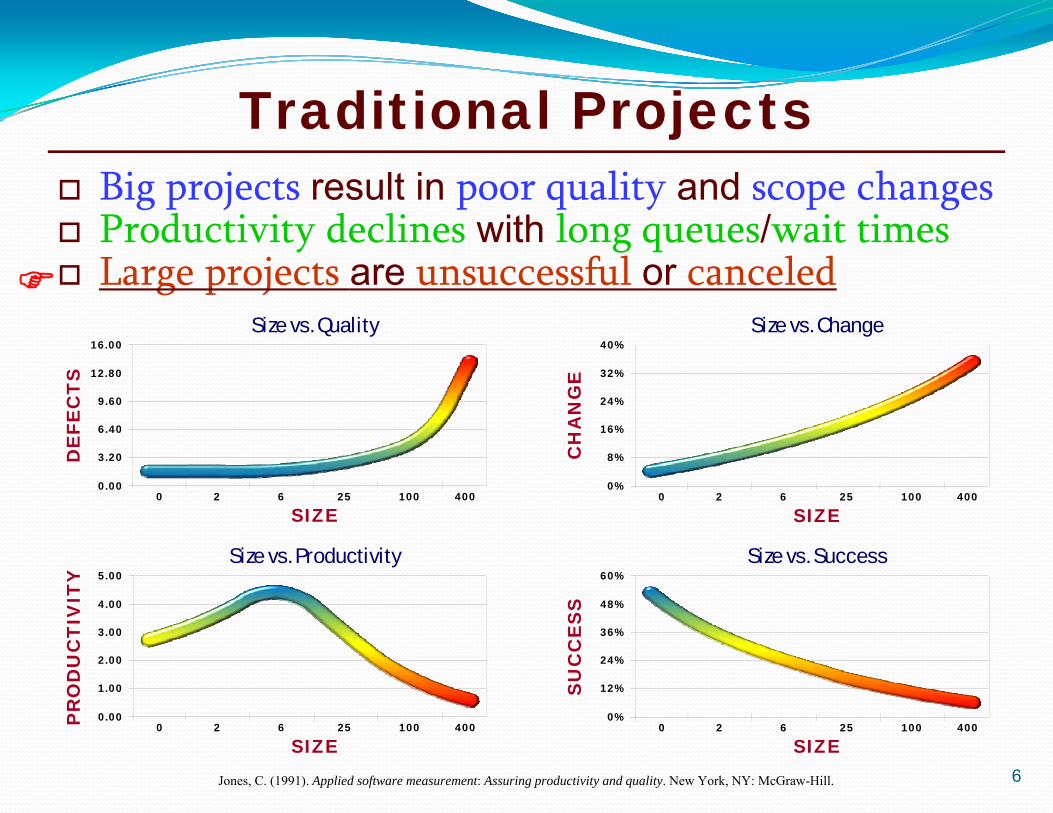
Big projects result in poor quality and scope changes Productivity declines with long queues/wait times Large projects are unsuccessful or canceled
Jones, C. (1991). Applied software measurement: Assuring productivity and quality. New York, NY: McGraw-Hill.
Size vs. Quality
DE
FEC
TS
0.00
3.20
6.40
9.60
12.80
16.00
0 2 6 25 100 400
SIZE
Size vs. Productivity
PR
OD
UC
TIV
ITY
0.00
1.00
2.00
3.00
4.00
5.00
0 2 6 25 100 400
SIZE
Size vs. Change
CH
AN
GE
0%
8%
16%
24%
32%
40%
0 2 6 25 100 400
SIZE
Size vs. SuccessS
UC
CE
SS
0%
12%
24%
36%
48%
60%
0 2 6 25 100 400
SIZE
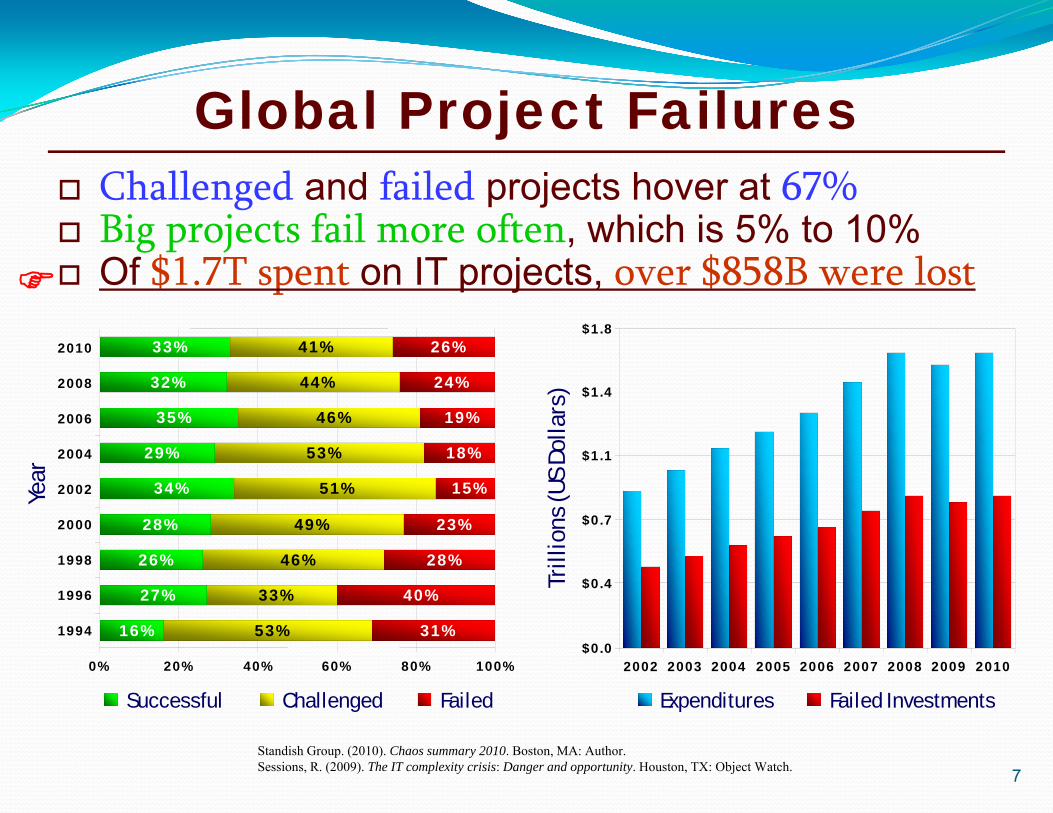
Global Project Failures
7Standish Group. (2010). Chaos summary 2010. Boston, MA: Author.Sessions, R. (2009). The IT complexity crisis: Danger and opportunity. Houston, TX: Object Watch.
Challenged and failed projects hover at 67% Big projects fail more often, which is 5% to 10% Of $1.7T spent on IT projects, over $858B were lost
16% 53% 31%
27% 33% 40%
26% 46% 28%
28% 49% 23%
34% 51% 15%
29% 53% 18%
35% 46% 19%
32% 44% 24%
33% 41% 26%
0% 20% 40% 60% 80% 100%
1994
1996
1998
2000
2002
2004
2006
2008
2010
Year
Successful Challenged Failed
$0.0
$0.4
$0.7
$1.1
$1.4
$1.8
2002 2003 2004 2005 2006 2007 2008 2009 2010
Trill
ions
(US
Dolla
rs)
Expenditures Failed Investments
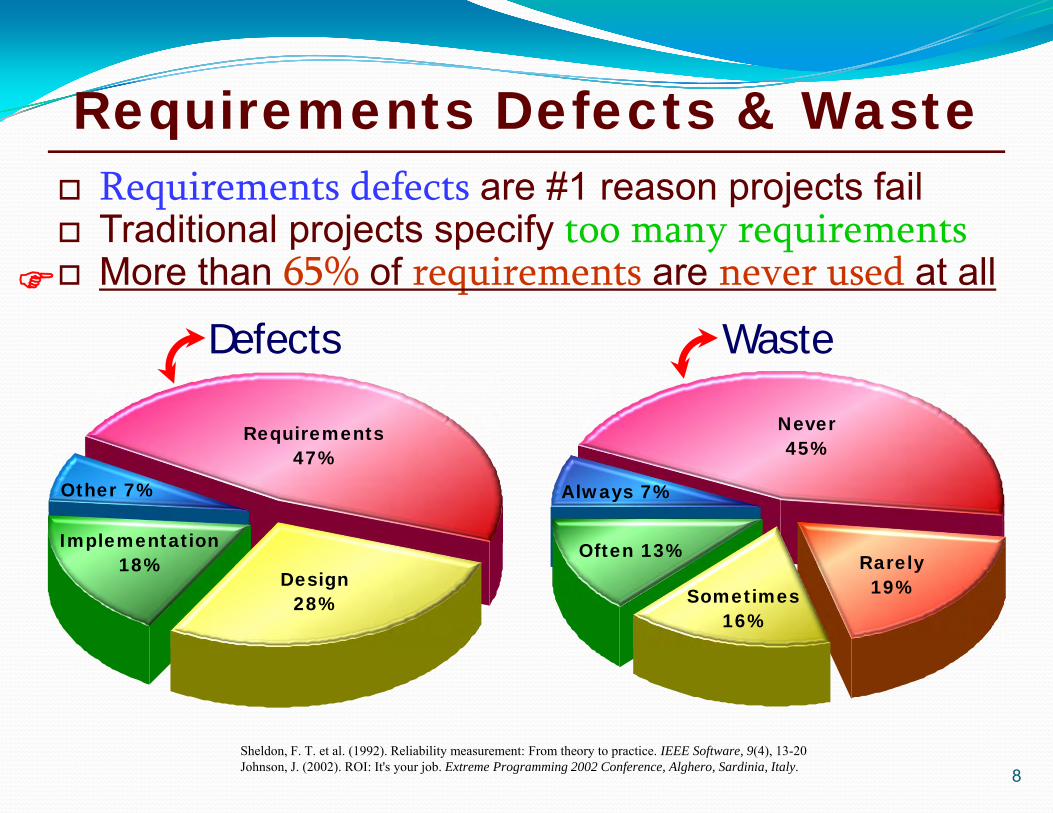
Requirements Defects & Waste
8Sheldon, F. T. et al. (1992). Reliability measurement: From theory to practice. IEEE Software, 9(4), 13-20Johnson, J. (2002). ROI: It's your job. Extreme Programming 2002 Conference, Alghero, Sardinia, Italy.
Requirements defects are #1 reason projects fail Traditional projects specify too many requirements More than 65% of requirements are never used at all
Other 7%
Requirements47%
Design28%
Implementation18%
Defects
Always 7%
Often 13%
Sometimes16%
Rarely19%
Never45%
Waste
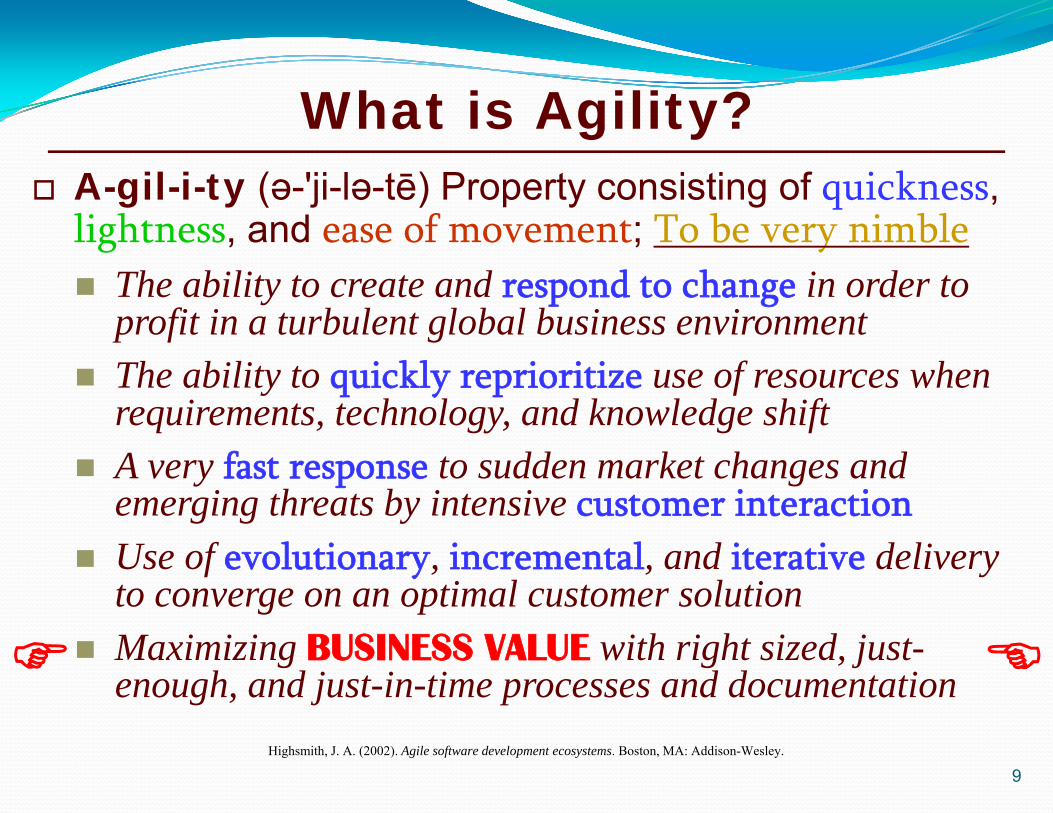
What is Agility? A-gil-i-ty (ә-'ji-lә-tē) Property consisting of quickness,
lightness, and ease of movement; To be very nimble The ability to create and respond to change in order to
profit in a turbulent global business environment The ability to quickly reprioritize use of resources when
requirements, technology, and knowledge shift A very fast response to sudden market changes and
emerging threats by intensive customer interaction Use of evolutionary, incremental, and iterative delivery
to converge on an optimal customer solution Maximizing BUSINESS VALUE with right sized, just-
enough, and just-in-time processes and documentationHighsmith, J. A. (2002). Agile software development ecosystems. Boston, MA: Addison-Wesley.
9
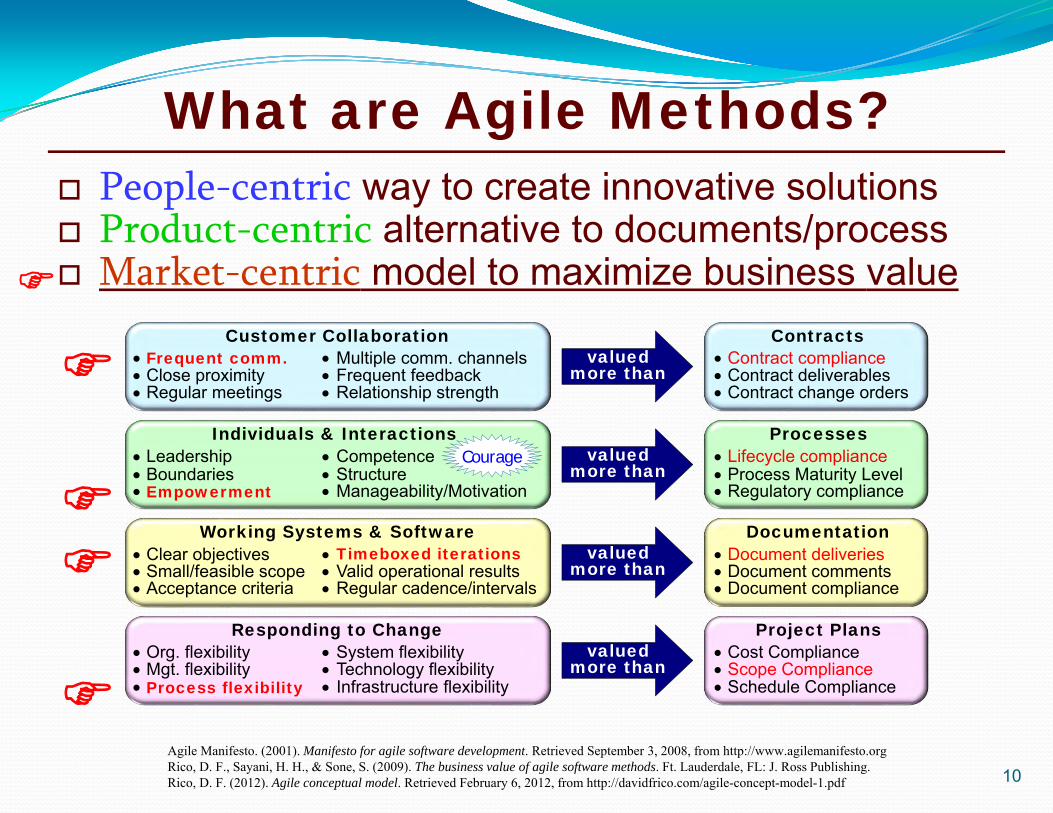
What are Agile Methods?
10
People-centric way to create innovative solutions Product-centric alternative to documents/process Market-centric model to maximize business value
Agile Manifesto. (2001). Manifesto for agile software development. Retrieved September 3, 2008, from http://www.agilemanifesto.orgRico, D. F., Sayani, H. H., & Sone, S. (2009). The business value of agile software methods. Ft. Lauderdale, FL: J. Ross Publishing.Rico, D. F. (2012). Agile conceptual model. Retrieved February 6, 2012, from http://davidfrico.com/agile-concept-model-1.pdf
Customer Collaboration
Working Systems & Software
Individuals & Interactions
Responding to Change
valuedmore than
valuedmore than
valuedmore than
valuedmore than
Contracts
Documentation
Processes
Project Plans
Frequent comm. Close proximity Regular meetings
Multiple comm. channels Frequent feedback Relationship strength
Leadership Boundaries Empowerment
Competence Structure Manageability/Motivation
Clear objectives Small/feasible scope Acceptance criteria
Timeboxed iterations Valid operational results Regular cadence/intervals
Org. flexibility Mgt. flexibility Process flexibility
System flexibility Technology flexibility Infrastructure flexibility
Contract compliance Contract deliverables Contract change orders
Lifecycle compliance Process Maturity Level Regulatory compliance
Document deliveries Document comments Document compliance
Cost Compliance Scope Compliance Schedule Compliance
Courage

NetworkComputer
Operating SystemMiddlewareApplications
APIsGUI
How Agile Works Agile requirements implemented in slices vs. layers User needs with higher business value are done first Reduces cost & risk while increasing business success
11Shore, J. (2011). Evolutionary design illustrated. Norwegian Developers Conference, Oslo, Norway.
Agile Traditional1 2 3 Faster
Early ROI
Lower Costs
Fewer Defects
Manageable Risk
Better Performance
Smaller Attack Surface
Late
No Value
Cost Overruns
Very Poor Quality
Uncontrollable Risk
Slowest Performance
More Security Incidents Seven Wastes1. Rework2. Motion3. Waiting4. Inventory5. Transportation6. Overprocessing7. Overproduction
MINIMIZES MAXIMIZES
JIT, Just-enough architecture Early, in-process system V&V Fast continuous improvement Scalable to systems of systems Maximizes successful outcomes
Myth of perfect architecture Late big-bang integration tests Year long improvement cycles Breaks down on large projects Undermines business success
12
Capability/MMF #1
● Feature 1● Feature 2● Feature 3● Feature 4● Feature 5● Feature 6● Feature 7
Capability/MMF #2
● Feature 8● Feature 9● Feature 10● Feature 11● Feature 12● Feature 13● Feature 14
Capability/MMF #3
● Feature 15● Feature 16● Feature 17● Feature 18● Feature 19● Feature 20● Feature 21
Capability/MMF #4
● Feature 22● Feature 23● Feature 24● Feature 25● Feature 26● Feature 27● Feature 28
Capability/MMF #5
● Feature 29● Feature 30● Feature 31● Feature 32● Feature 33● Feature 34● Feature 35
Capability/MMF #6
● Feature 36● Feature 37● Feature 38● Feature 39● Feature 40● Feature 41● Feature 42
Capability/MMF #7
● Feature 43● Feature 44● Feature 45● Feature 46● Feature 47● Feature 48● Feature 49
1
2 3
4
5 6
7
8 9
10
11 12
13
14 15
16
17 18
19
20 21
Evolving “Unified/Integrated” Enterprise Data Model
“Disparate” LEGACY SYSTEM DATABASES (AND DATA MODELS)
ETL
A A
B C
D E F
G H I J K
A
B C
D E F
A
B C
D E
A
B C
D
A
B C
A
B
“Legacy” MS SQL Server Stovepipes “Inter-Departmental” Linux Blade/Oracle/Java/WebSphere Server
“Leased” DWA/HPC/Cloud Services
Sprint 1 Sprint 2 Sprint 3 Sprint 4 Sprint 5 Sprint 6 Sprint 7
Release
Release
Release
Release
ETL ETL ETL ETL ETL ETL
Bente, S., Bombosch, U., & Langade, S. (2012). Collaborative enterprise architecture: Enriching EA with lean, agile, and enterprise 2.0 practices. Waltham, MA: Elsevier.
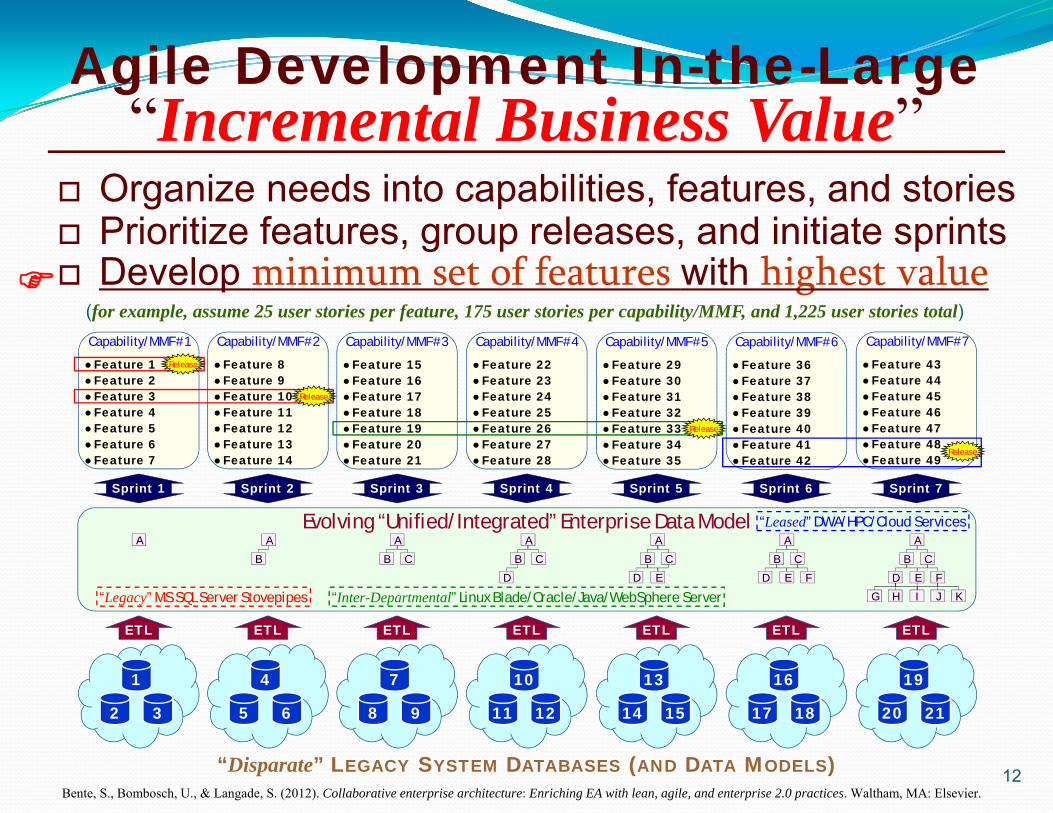
Agile Development In-the-Large“Incremental Business Value”
(for example, assume 25 user stories per feature, 175 user stories per capability/MMF, and 1,225 user stories total)
Organize needs into capabilities, features, and stories Prioritize features, group releases, and initiate sprints Develop minimum set of features with highest value
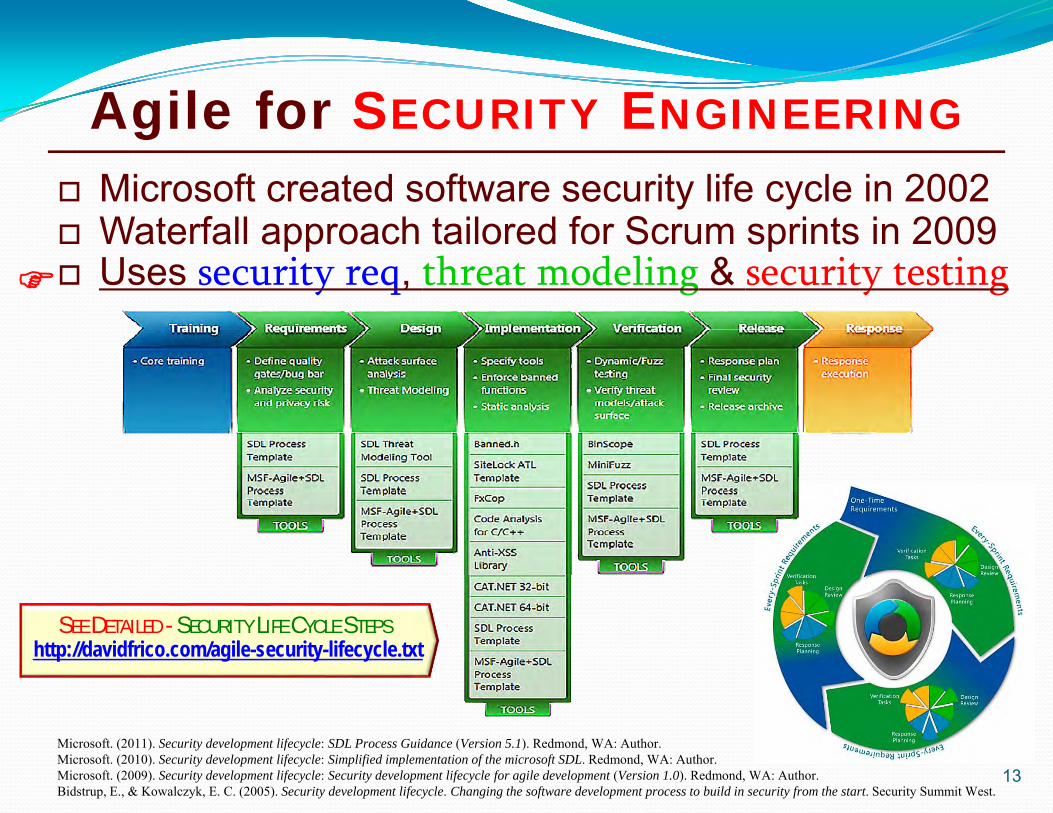
Agile for SECURITY ENGINEERING Microsoft created software security life cycle in 2002 Waterfall approach tailored for Scrum sprints in 2009 Uses security req, threat modeling & security testing
13
Microsoft. (2011). Security development lifecycle: SDL Process Guidance (Version 5.1). Redmond, WA: Author.Microsoft. (2010). Security development lifecycle: Simplified implementation of the microsoft SDL. Redmond, WA: Author.Microsoft. (2009). Security development lifecycle: Security development lifecycle for agile development (Version 1.0). Redmond, WA: Author.Bidstrup, E., & Kowalczyk, E. C. (2005). Security development lifecycle. Changing the software development process to build in security from the start. Security Summit West.
SEE DETAILED - SECURITY LIFE CYCLE STEPShttp://davidfrico.com/agile-security-lifecycle.txt

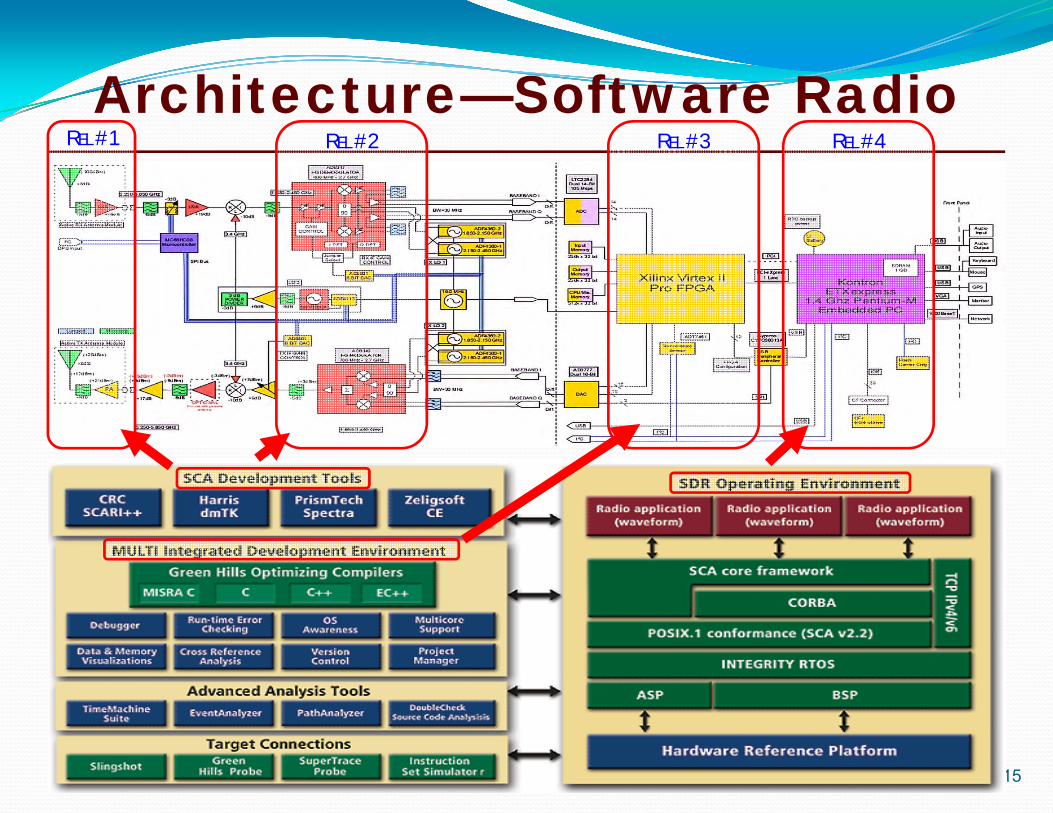
Agile for EMBEDDED SYSTEMS 1st-generation systems used hardwired logic 2nd-generation systems used PROMS & FPGAs 3rd-generation systems use APP. SW & COTS HW
14Pries, K. H., & Quigley, J. M. (2010). Scrum project management. Boca Raton, FL: CRC Press.Pries, K. H., & Quigley, J. M. (2009). Project management of complex and embedded systems. Boca Raton, FL: Auerbach Publications.Thomke, S. (2003). Experimentation matters: Unlocking the potential of new technologies for innovation. Boston, MA: Harvard Business School Press.
● Short Lead● Least Cost● Lowest Risk● 90% Software● COTS Hardware● Early, Iterative Dev.● Continuous V&V
● Moderate Lead● Moderate Cost● Moderate Risk● 50% Hardware● COTS Components● Midpoint Testing● “Some” Early V&V
● Long Lead● Highest Cost● Highest Risk● 90% Hardware● Custom Hardware● Linear, Staged Dev.● Late Big-Bang I&T
AGILE“Software Model”- MOST FLEXIBLE -
NEO-TRADITIONAL“FPGA Model”
- MALLEABLE -
TRADITIONAL“Hardwired Model”
- LEAST FLEXIBLE -
GOAL – SHIFT FROM LATE HARDWARE TO EARLIER SOFTWARE SOLUTION
RISKEmbeddedSystemsMore HWThan SW
STOPCompeting
With HW
STARTCompeting
With SW
Iter
atio
ns, I
nteg
rati
ons,
& V
alid
atio
ns
15
Architecture—Software RadioREL #1 REL #2 REL #3 REL #4
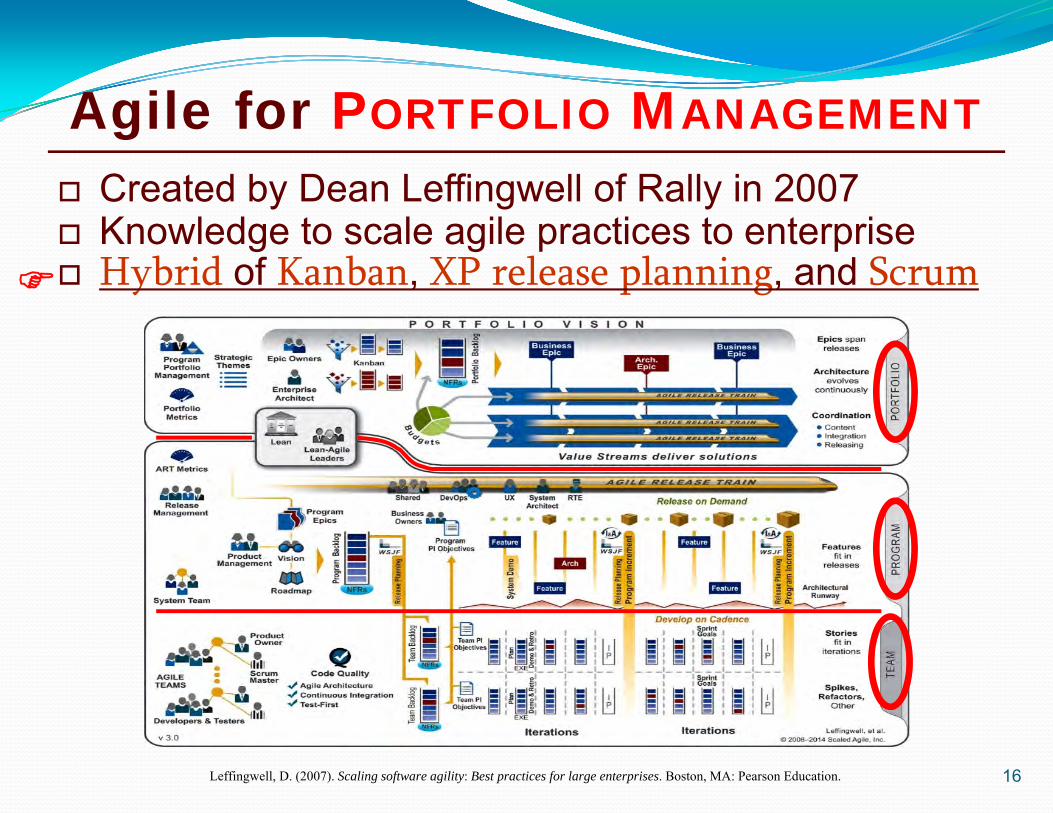
Created by Dean Leffingwell of Rally in 2007 Knowledge to scale agile practices to enterprise Hybrid of Kanban, XP release planning, and Scrum
16Leffingwell, D. (2007). Scaling software agility: Best practices for large enterprises. Boston, MA: Pearson Education.
Agile for PORTFOLIO MANAGEMENT
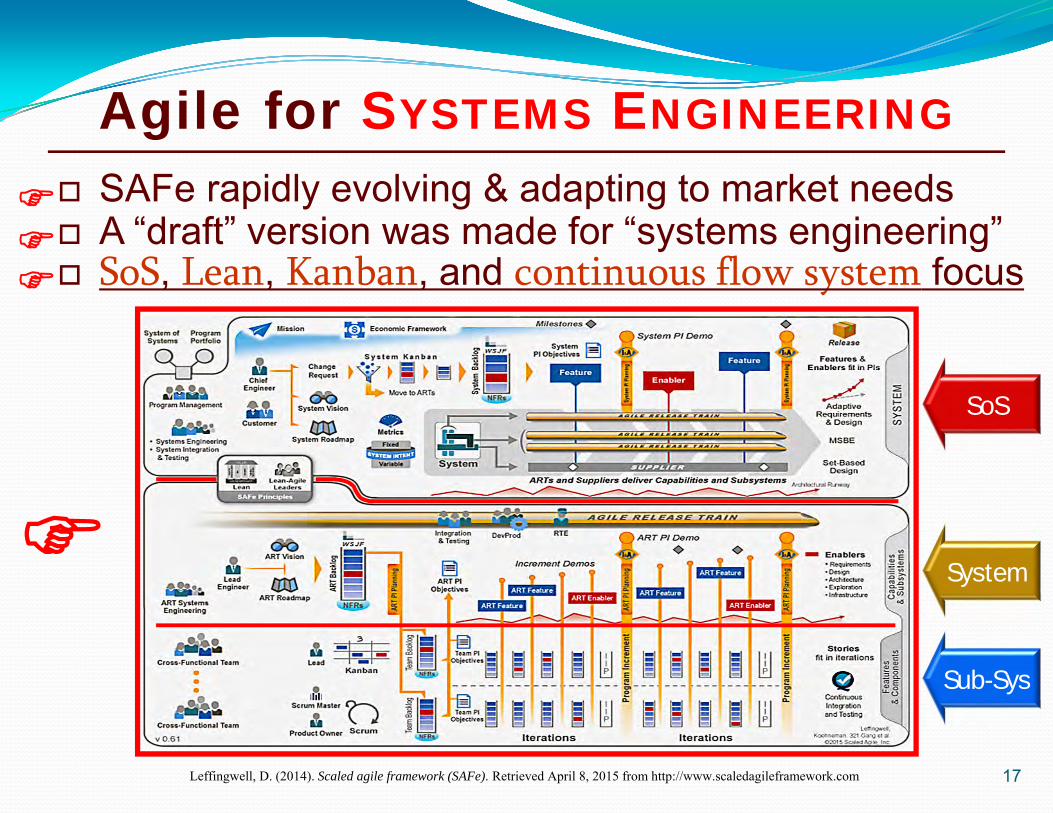
SAFe rapidly evolving & adapting to market needs A “draft” version was made for “systems engineering” SoS, Lean, Kanban, and continuous flow system focus
17Leffingwell, D. (2014). Scaled agile framework (SAFe). Retrieved April 8, 2015 from http://www.scaledagileframework.com
Agile for SYSTEMS ENGINEERING
SoS
System
Sub-Sys
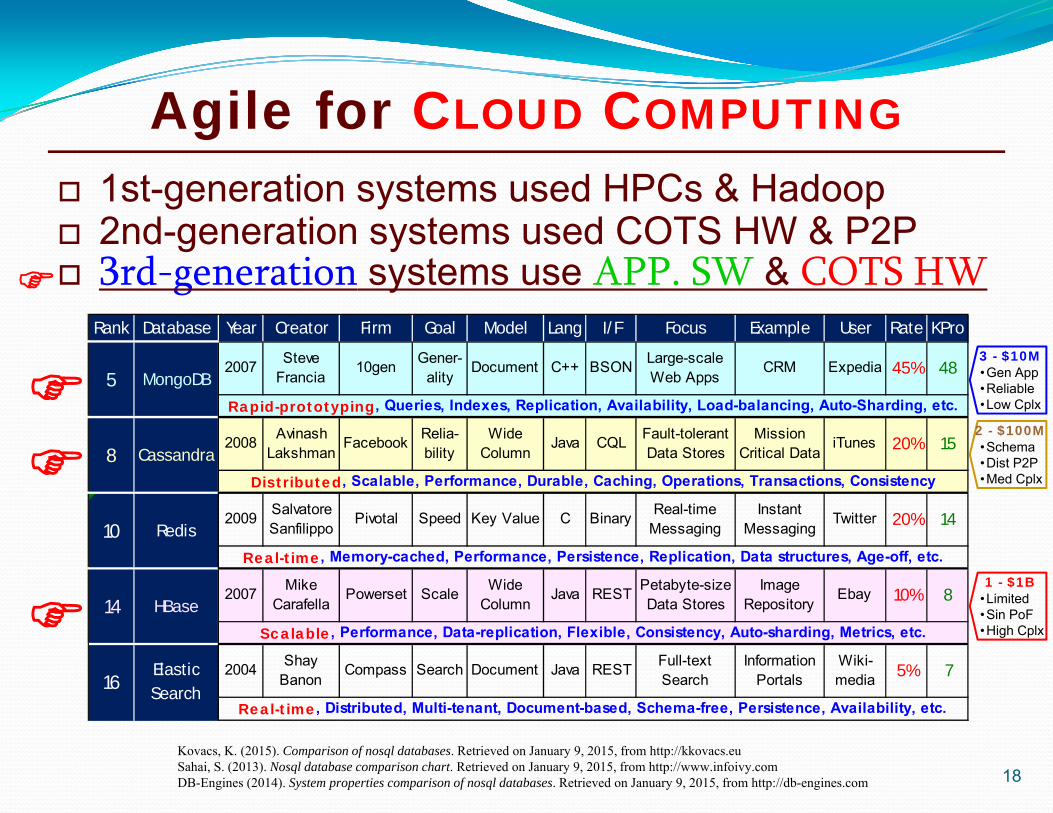
18Kovacs, K. (2015). Comparison of nosql databases. Retrieved on January 9, 2015, from http://kkovacs.euSahai, S. (2013). Nosql database comparison chart. Retrieved on January 9, 2015, from http://www.infoivy.comDB-Engines (2014). System properties comparison of nosql databases. Retrieved on January 9, 2015, from http://db-engines.com
Rank Database Year Creator Firm Goal Model Lang I/F Focus Example User Rate KPro
2007 Steve Francia
10gen Gener-ality
Document C++ BSON Large-scale Web Apps
CRM Expedia 45% 48
2008 Avinash Lakshman
Facebook Relia-bility
Wide Column
Java CQL Fault-tolerant Data Stores
Mission Critical Data
iTunes 20% 15
2009 Salvatore Sanfilippo
Pivotal Speed Key Value C Binary Real-time Messaging
Instant Messaging
Twitter 20% 14
2007 Mike Carafella
Powerset Scale Wide Column
Java REST Petabyte-size Data Stores
Image Repository
Ebay 10% 8
2004 Shay Banon
Compass Search Document Java REST Full-text Search
Information Portals
Wiki-media 5% 7
Real-time, Distributed, Multi-tenant, Document-based, Schema-free, Persistence, Availability, etc.
8
Redis10
HBase14
Rapid-prototyping, Queries, Indexes, Replication, Availability, Load-balancing, Auto-Sharding, etc.
Distributed, Scalable, Performance, Durable, Caching, Operations, Transactions, Consistency
Real-time, Memory-cached, Performance, Persistence, Replication, Data structures, Age-off, etc.
Scalable, Performance, Data-replication, Flexible, Consistency, Auto-sharding, Metrics, etc.
16Elastic Search
MongoDB5
Cassandra
3 - $10M•Gen App•Reliable•Low Cplx
2 - $100M•Schema•Dist P2P•Med Cplx
1 - $1B•Limited•Sin PoF•High Cplx
Agile for CLOUD COMPUTING 1st-generation systems used HPCs & Hadoop 2nd-generation systems used COTS HW & P2P 3rd-generation systems use APP. SW & COTS HW
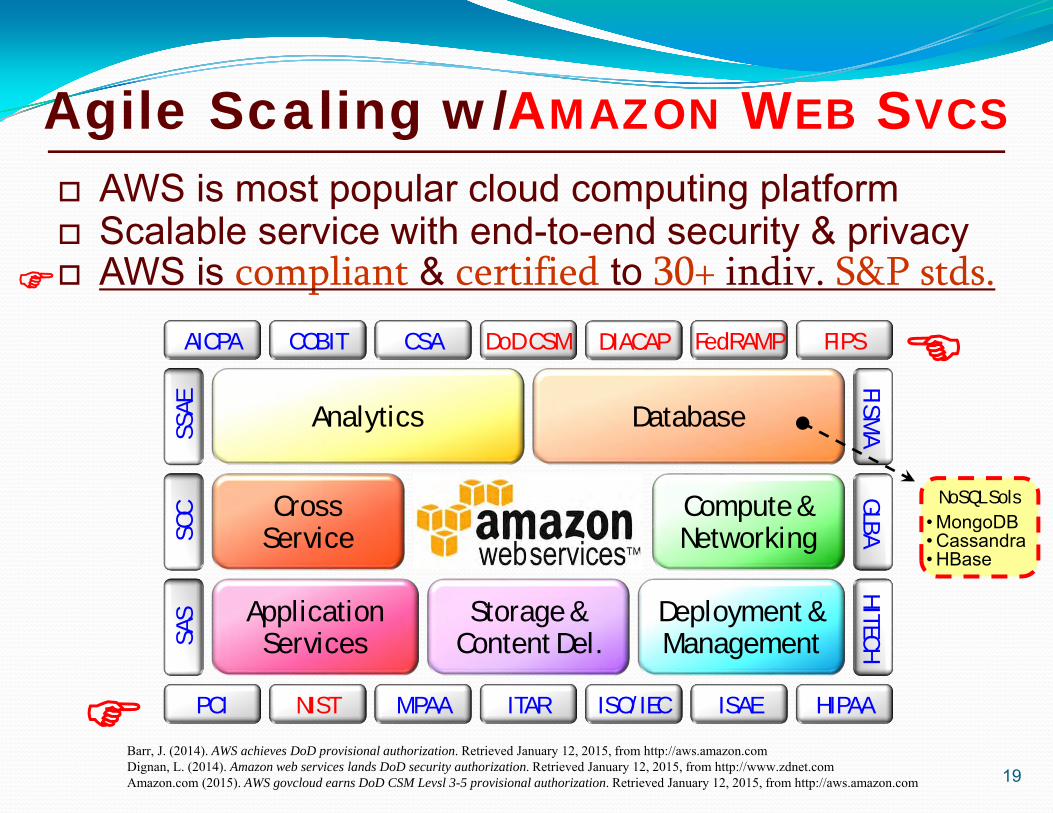
AWS is most popular cloud computing platform Scalable service with end-to-end security & privacy AWS is compliant & certified to 30+ indiv. S&P stds.
19Barr, J. (2014). AWS achieves DoD provisional authorization. Retrieved January 12, 2015, from http://aws.amazon.comDignan, L. (2014). Amazon web services lands DoD security authorization. Retrieved January 12, 2015, from http://www.zdnet.comAmazon.com (2015). AWS govcloud earns DoD CSM Levsl 3-5 provisional authorization. Retrieved January 12, 2015, from http://aws.amazon.com
Analytics DatabaseSSAE
CrossService
Compute &NetworkingSO
C
ApplicationServices
Deployment &Management
Storage &Content Del.
DoD CSM DIACAP FedRAMP FIPSCOBIT CSAAICPA
FISMA
GLBAHITECHSA
S
ITAR ISO/IEC ISAE HIPAANIST MPAAPCI
NoSQL Sols• MongoDB• Cassandra• HBase
Agile Scaling w/AMAZON WEB SVCS
20
Agile Performance MeasurementW
ork
(Sto
ry, P
oint
, Tas
k)or
Eff
ort
(Wee
k, D
ay, H
our)
Time Unit (Roadmap, Release, Iteration, Month, Week, Day, Hour, etc.)
Burndown
Wor
k (S
tory
, Poi
nt, T
ask)
or E
ffor
t (W
eek,
Day
, Hou
r)
Time Unit (Roadmap, Release, Iteration, Month, Week, Day, Hour, etc.)
Cumulative Flow
Wor
k (S
tory
, Poi
nt, T
ask)
or E
ffor
t (W
eek,
Day
, Hou
r)
Time Unit (Roadmap, Release, Iteration, Month, Week, Day, Hour, etc.)
Earned Value Management - EVMCPI
SPI
PPC
APC
Wor
k (S
tory
, Poi
nt, T
ask)
or E
ffor
t (W
eek,
Day
, Hou
r)
Time Unit (Roadmap, Release, Iteration, Month, Week, Day, Hour, etc.)
Earned Business Value - EBV
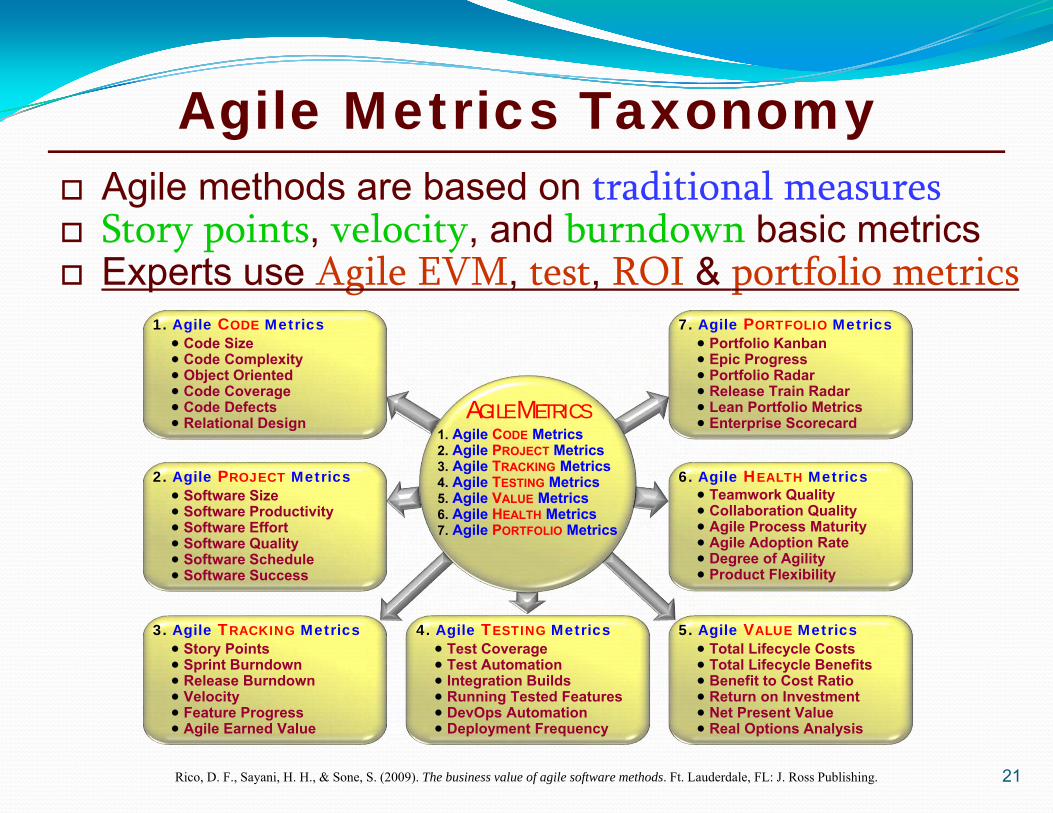
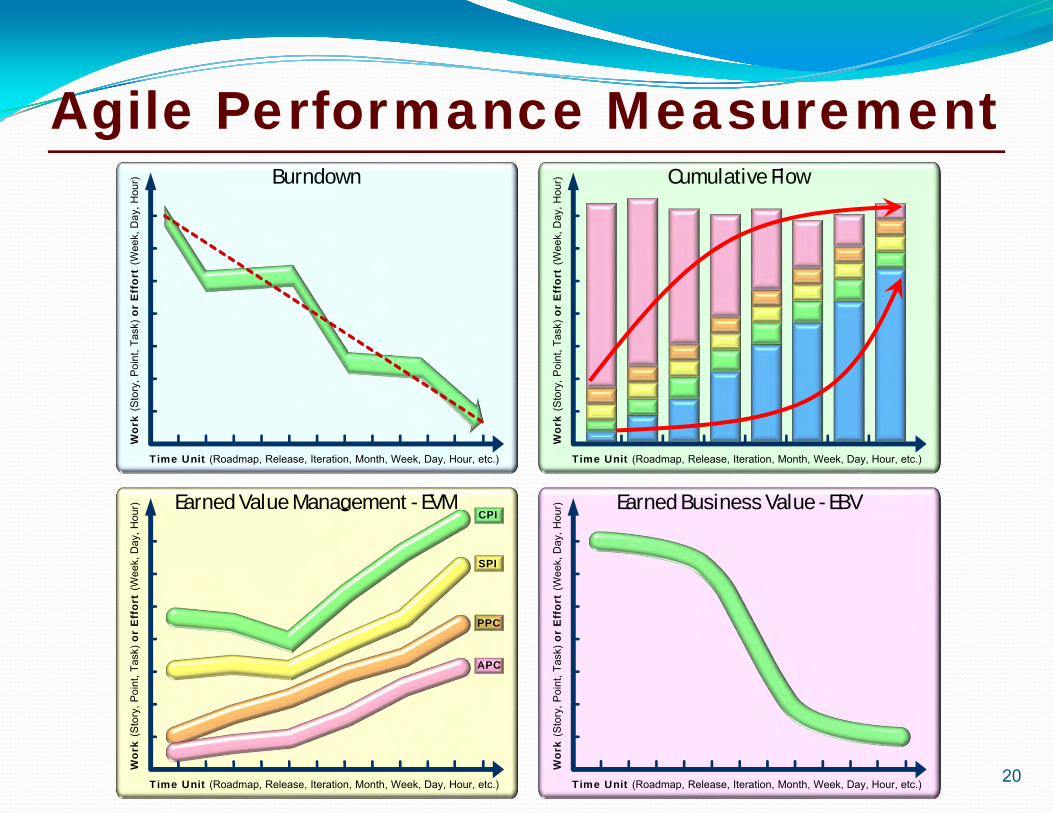
Agile methods are based on traditional measures Story points, velocity, and burndown basic metrics Experts use Agile EVM, test, ROI & portfolio metrics
21Rico, D. F., Sayani, H. H., & Sone, S. (2009). The business value of agile software methods. Ft. Lauderdale, FL: J. Ross Publishing.
AGILE METRICS1. Agile CODE Metrics2. Agile PROJECT Metrics3. Agile TRACKING Metrics4. Agile TESTING Metrics5. Agile VALUE Metrics6. Agile HEALTH Metrics7. Agile PORTFOLIO Metrics
1. Agile CODE Metrics Code Size Code Complexity Object Oriented Code Coverage Code Defects Relational Design
2. Agile PROJECT Metrics Software Size Software Productivity Software Effort Software Quality Software Schedule Software Success
3. Agile TRACKING Metrics Story Points Sprint Burndown Release Burndown Velocity Feature Progress Agile Earned Value
4. Agile TESTING Metrics Test Coverage Test Automation Integration Builds Running Tested Features DevOps Automation Deployment Frequency
7. Agile PORTFOLIO Metrics Portfolio Kanban Epic Progress Portfolio Radar Release Train Radar Lean Portfolio Metrics Enterprise Scorecard
6. Agile HEALTH Metrics Teamwork Quality Collaboration Quality Agile Process Maturity Agile Adoption Rate Degree of Agility Product Flexibility
5. Agile VALUE Metrics Total Lifecycle Costs Total Lifecycle Benefits Benefit to Cost Ratio Return on Investment Net Present Value Real Options Analysis
Agile Metrics Taxonomy
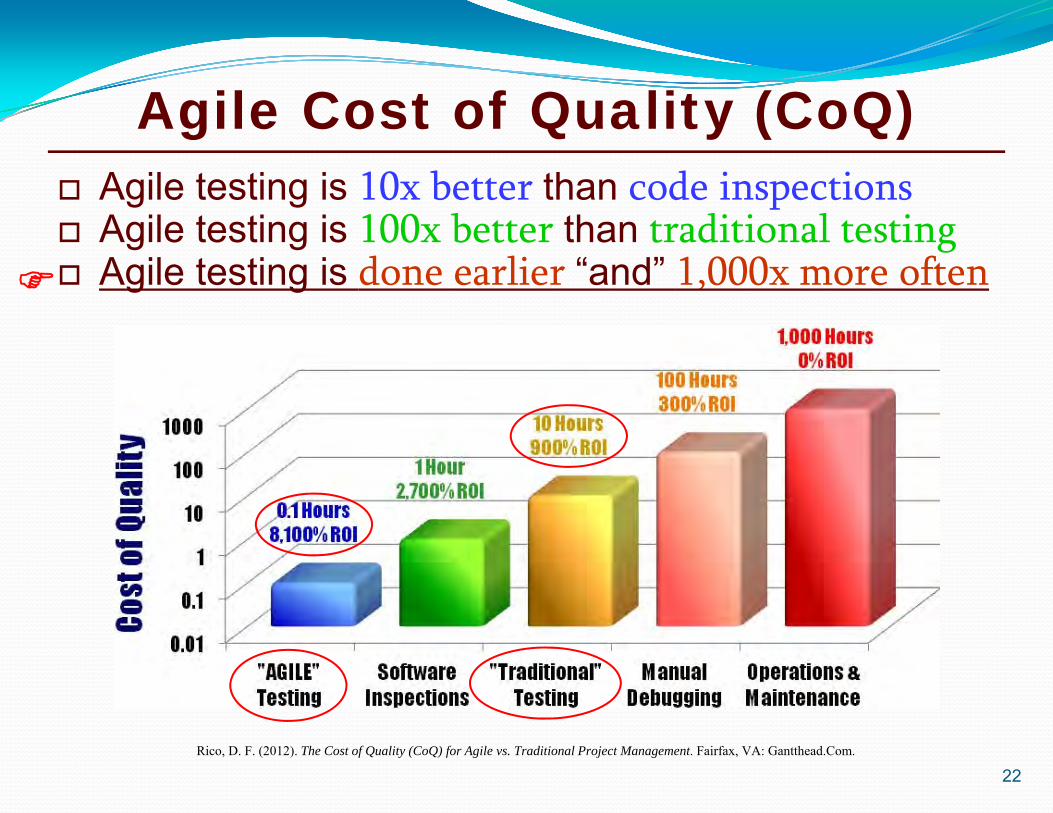
Agile Cost of Quality (CoQ) Agile testing is 10x better than code inspections Agile testing is 100x better than traditional testing Agile testing is done earlier “and” 1,000x more often
22Rico, D. F. (2012). The Cost of Quality (CoQ) for Agile vs. Traditional Project Management. Fairfax, VA: Gantthead.Com.

Agile Cost & Benefit Analysis Costs based on avg. productivity and quality Productivity ranged from 4.7 to 5.9 LOC an hour Costs were $588,202 and benefits were $3,930,631
23Rico, D. F., Sayani, H. H., & Sone, S. (2009). The business value of agile software methods: Maximizing ROI with just-in-time processes and documentation. Ft. Lauderdale, FL: J. Ross Publishing.
d1 = [ln(Benefits Costs) + (Rate + 0.5 Risk2) Years] Risk Years, d2 = d1 Risk Years
5
1i
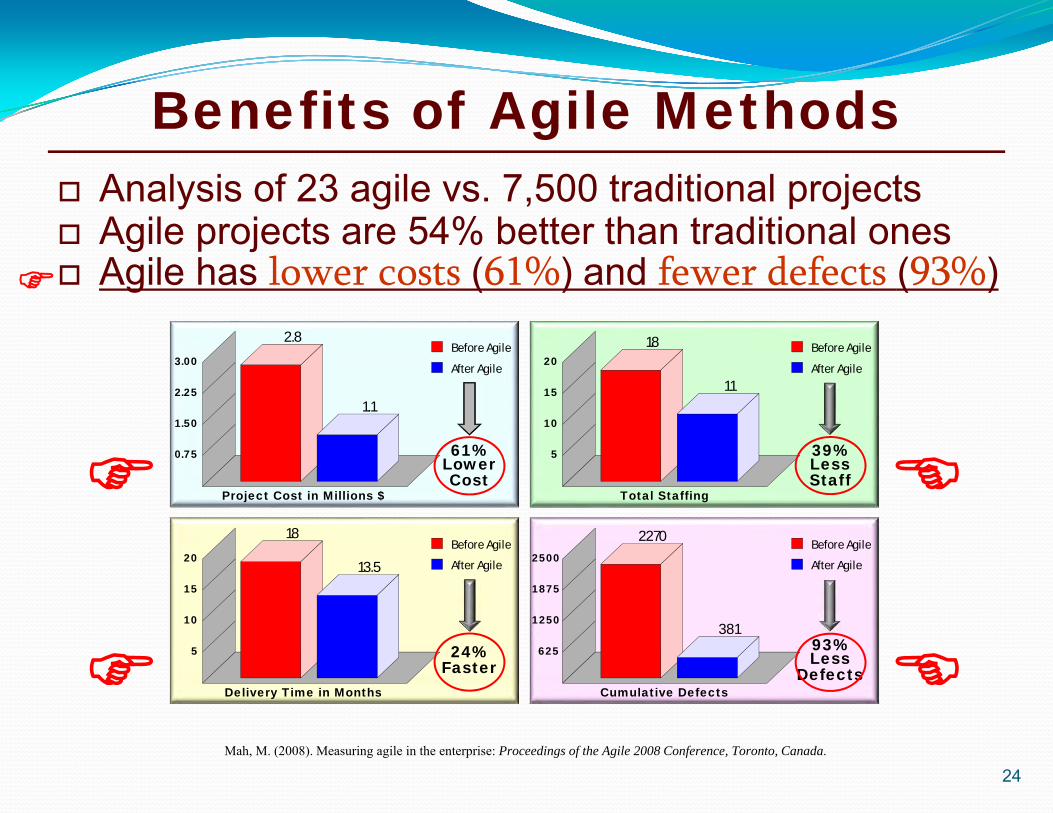
Benefits of Agile Methods Analysis of 23 agile vs. 7,500 traditional projects Agile projects are 54% better than traditional ones Agile has lower costs (61%) and fewer defects (93%)
Mah, M. (2008). Measuring agile in the enterprise: Proceedings of the Agile 2008 Conference, Toronto, Canada.
Project Cost in Millions $
0.75
1.50
2.25
3.00
2.8
1.1
Before Agile
After Agile
61%LowerCost
Total Staffing
18
11
Before Agile
After Agile
39%LessStaff
5
10
15
20
Delivery Time in Months
5
10
15
20
18
13.5
Before Agile
After Agile
24%Faster
Cumulative Defects
625
1250
1875
2500
2270
381
Before Agile
After Agile
93%Less
Defects
24
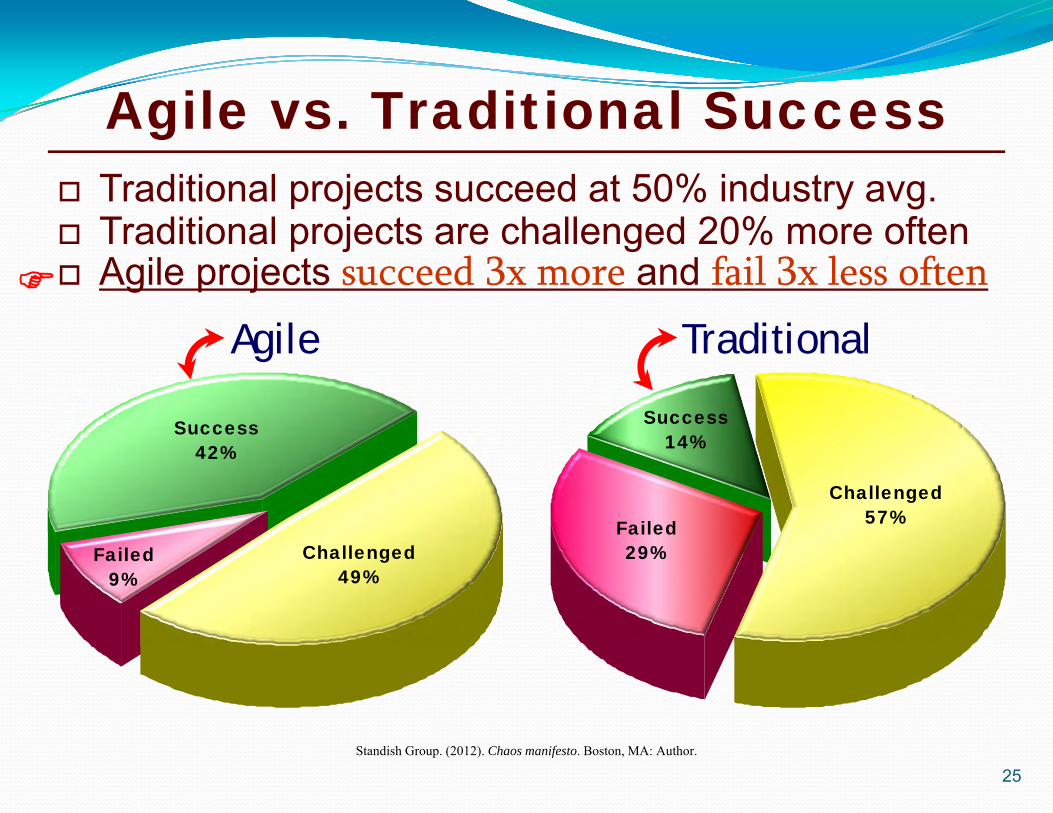
Agile vs. Traditional Success Traditional projects succeed at 50% industry avg. Traditional projects are challenged 20% more often Agile projects succeed 3x more and fail 3x less often
Standish Group. (2012). Chaos manifesto. Boston, MA: Author.
25
Agile Traditional
Success42%
Failed9%
Challenged49%
Success14%
Failed29%
Challenged57%
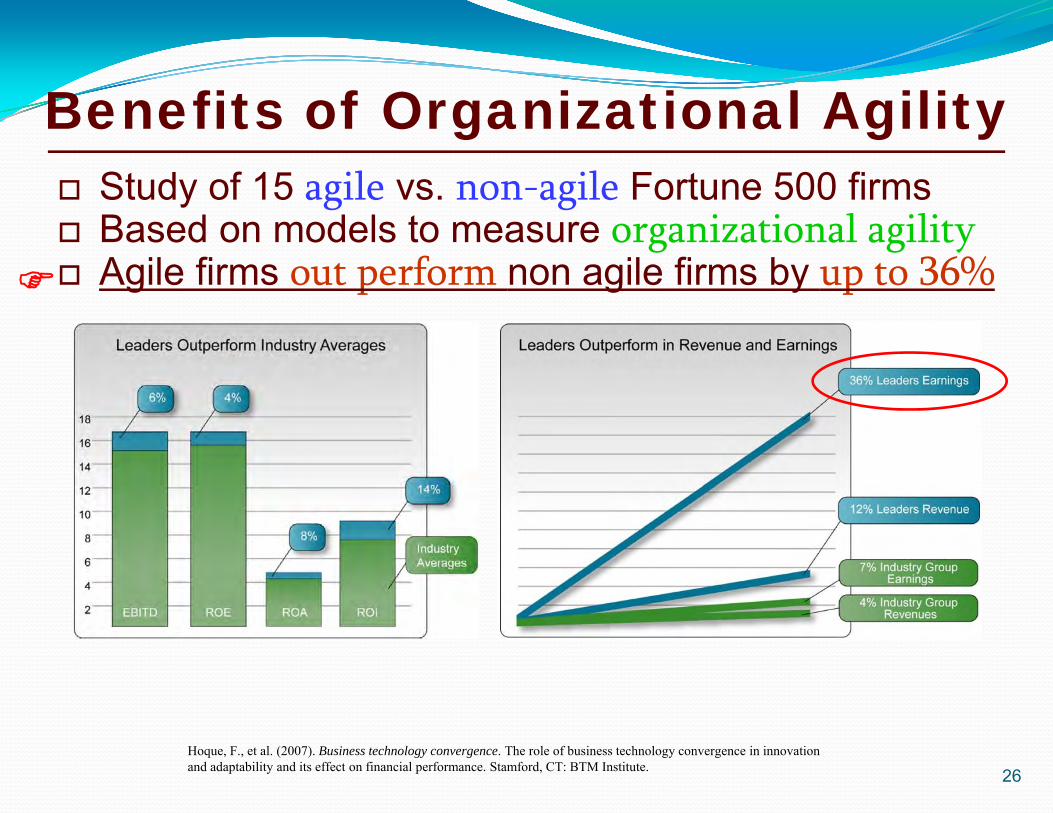
Hoque, F., et al. (2007). Business technology convergence. The role of business technology convergence in innovation and adaptability and its effect on financial performance. Stamford, CT: BTM Institute. 26
Study of 15 agile vs. non-agile Fortune 500 firms Based on models to measure organizational agility Agile firms out perform non agile firms by up to 36%
Benefits of Organizational Agility
Agile Adoption
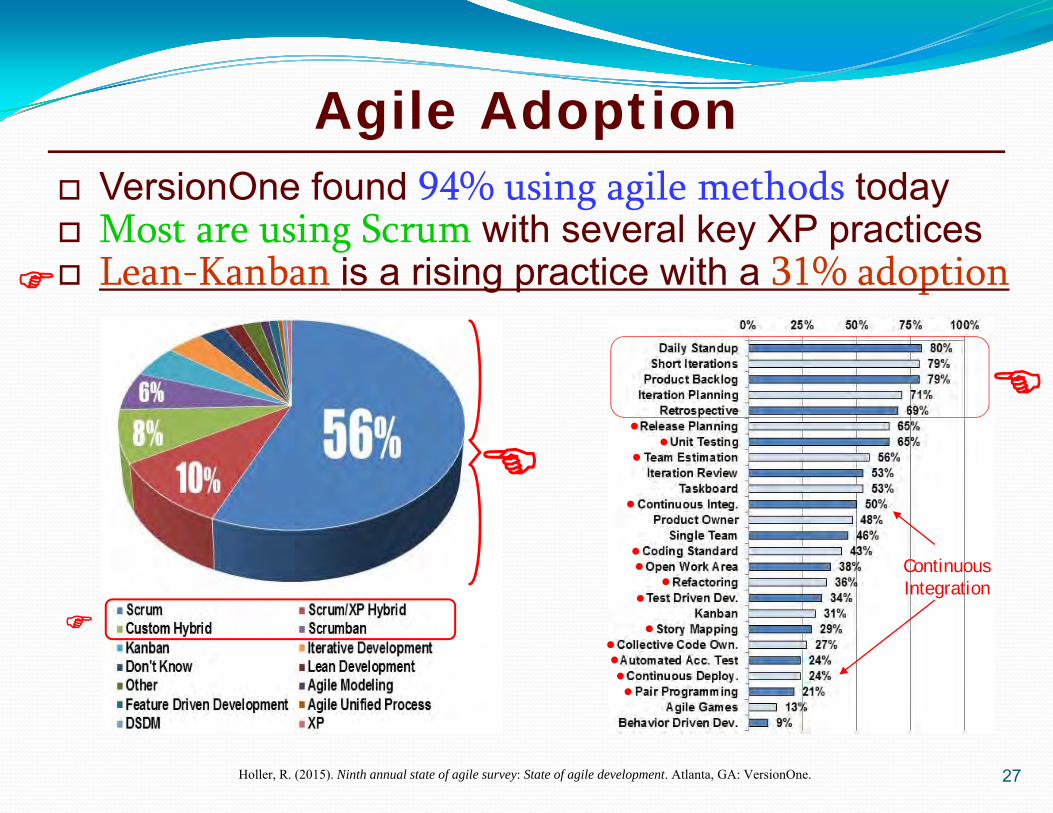
27Holler, R. (2015). Ninth annual state of agile survey: State of agile development. Atlanta, GA: VersionOne.
VersionOne found 94% using agile methods today Most are using Scrum with several key XP practices Lean-Kanban is a rising practice with a 31% adoption
ContinuousIntegration
●●
●
●
●
●
●
●
●
●●
●
●
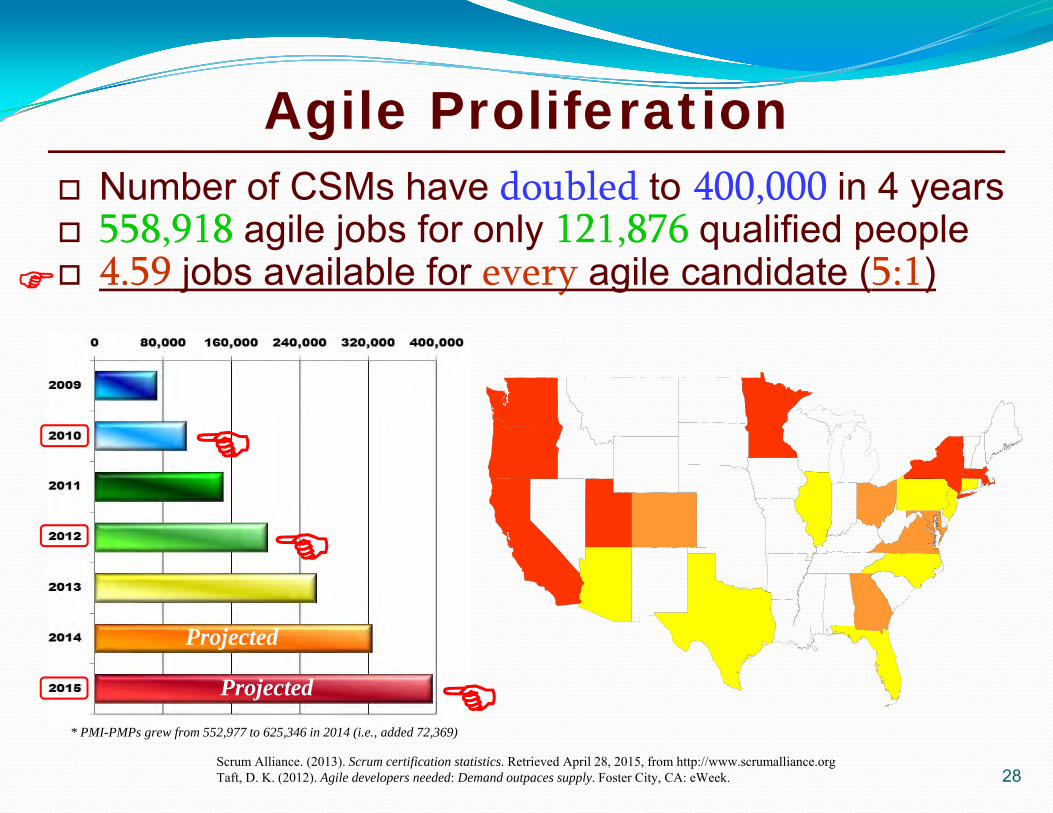
Agile Proliferation
Scrum Alliance. (2013). Scrum certification statistics. Retrieved April 28, 2015, from http://www.scrumalliance.orgTaft, D. K. (2012). Agile developers needed: Demand outpaces supply. Foster City, CA: eWeek. 28
Number of CSMs have doubled to 400,000 in 4 years 558,918 agile jobs for only 121,876 qualified people 4.59 jobs available for every agile candidate (5:1)
Projected
Projected
* PMI-PMPs grew from 552,977 to 625,346 in 2014 (i.e., added 72,369)

Agile in Government
Suhy, S. (2014). Has the U.S. government moved to agile without telling anyone? Retrieved April 24, 2015, from http://agileingov.comPorter, M. E., & Schwab, K. (2008). The global competitiveness report: 2008 to 2009. Geneva, Switzerland: World Economic Forum. 29
U.S. gov’t agile jobs grew by 13,000% from 2006-2013 Adoption is higher in U.S. DoD than Civilian Agencies GDP of countries with high adoption rates is greater
High
Low
Low HighAGILITY
CO
MP
ET
ITIV
EN
ES
S
GOVERNMENT AGILE JOB GROWTH
PE
RC
EN
TAG
E
13,000%
02006 2013YEARS
GOVERNMENT COMPETITIVENESS
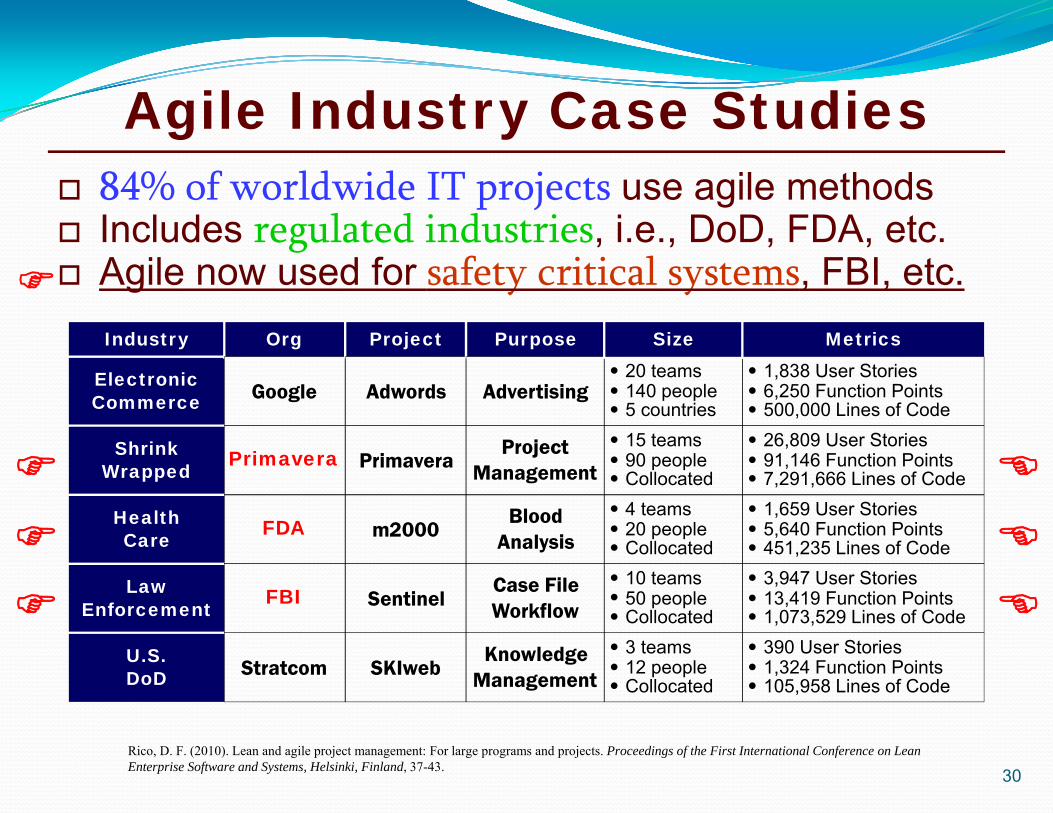
Agile Industry Case Studies 84% of worldwide IT projects use agile methods Includes regulated industries, i.e., DoD, FDA, etc. Agile now used for safety critical systems, FBI, etc.
30
Industry
ShrinkWrapped
ElectronicCommerce
HealthCare
LawEnforcement
Org 20 teams 140 people 5 countries
Size
15 teams 90 people Collocated 4 teams 20 people Collocated 10 teams 50 people Collocated 3 teams 12 people Collocated
U.S.DoD
Primavera
Stratcom
FBI
FDA
Project
Primavera
Adwords
SKIweb
Sentinel
m2000
Purpose
ProjectManagement
Advertising
KnowledgeManagement
Case FileWorkflow
BloodAnalysis
1,838 User Stories 6,250 Function Points 500,000 Lines of Code
Metrics
26,809 User Stories 91,146 Function Points 7,291,666 Lines of Code 1,659 User Stories 5,640 Function Points 451,235 Lines of Code 3,947 User Stories 13,419 Function Points 1,073,529 Lines of Code 390 User Stories 1,324 Function Points 105,958 Lines of Code
Rico, D. F. (2010). Lean and agile project management: For large programs and projects. Proceedings of the First International Conference on Lean Enterprise Software and Systems, Helsinki, Finland, 37-43.

Enterprise Continuous Delivery Created by Jez Humble of ThoughtWorks in 2011 Includes CM, build, testing, integration, release, etc. Goal is one-touch automation of deployment pipeline
31Humble, J., & Farley, D. (2011). Continuous delivery. Boston, MA: Pearson Education.Duvall, P., Matyas, S., & Glover, A. (2006). Continuous integration. Boston, MA: Addison-Wesley.Ohara, D. (2012). Continuous delivery and the world of devops. San Francisco, CA: GigaOM Pro.
CoQ
• 80% MS Tst• 8/10 No Val• $24B in 90s• Rep by CD• Not Add MLK
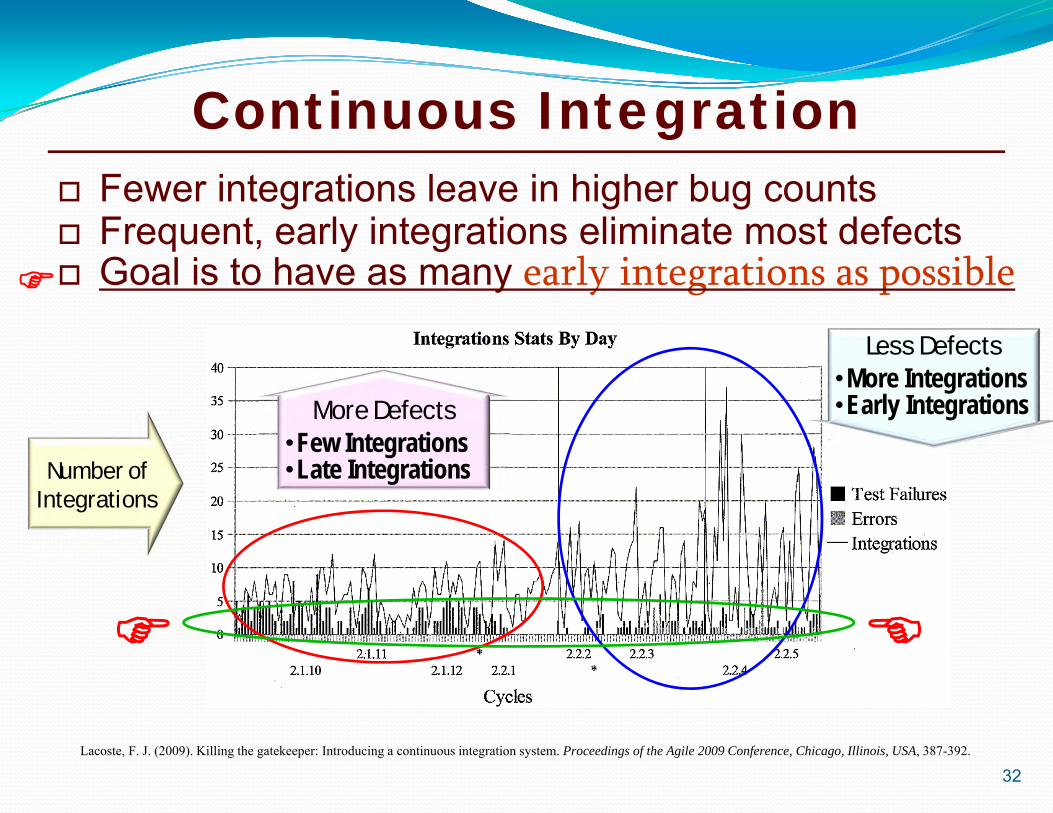
Continuous Integration Fewer integrations leave in higher bug counts Frequent, early integrations eliminate most defects Goal is to have as many early integrations as possible
32Lacoste, F. J. (2009). Killing the gatekeeper: Introducing a continuous integration system. Proceedings of the Agile 2009 Conference, Chicago, Illinois, USA, 387-392.
Number ofIntegrations
Less Defects•More Integrations•Early IntegrationsMore Defects
•Few Integrations•Late Integrations
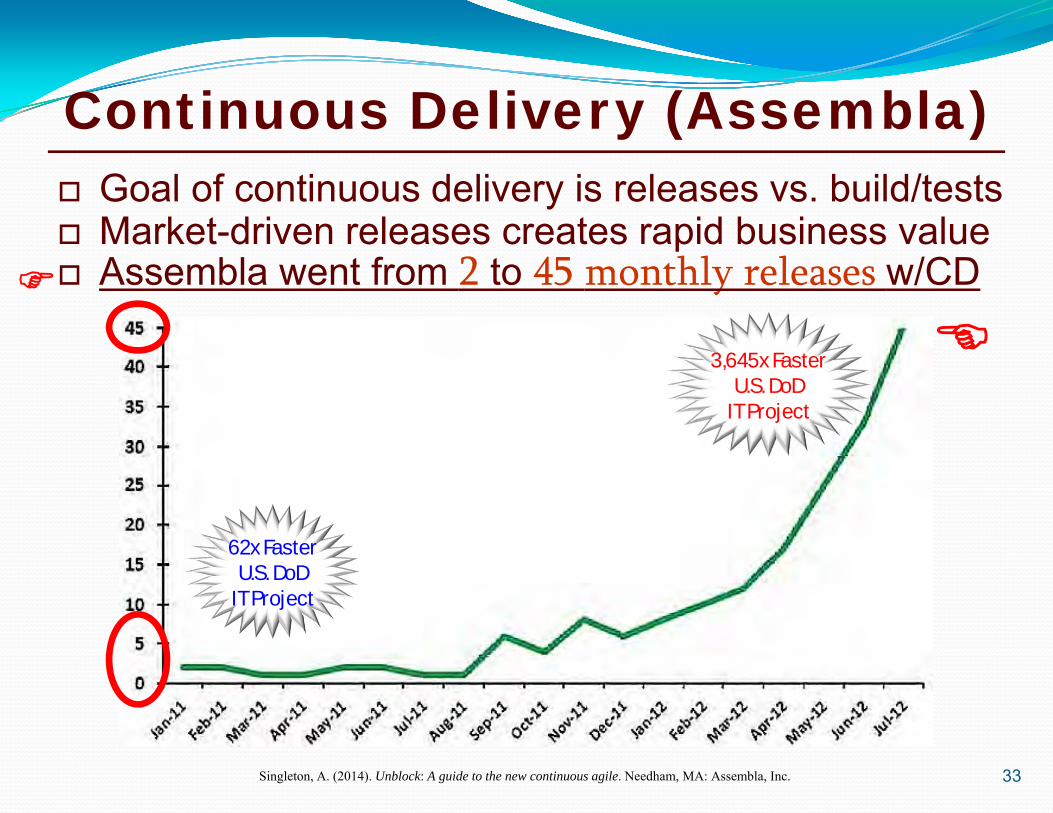
Continuous Delivery (Assembla) Goal of continuous delivery is releases vs. build/tests Market-driven releases creates rapid business value Assembla went from 2 to 45 monthly releases w/CD
33Singleton, A. (2014). Unblock: A guide to the new continuous agile. Needham, MA: Assembla, Inc.
62x FasterU.S. DoD
IT Project
3,645x FasterU.S. DoD
IT Project
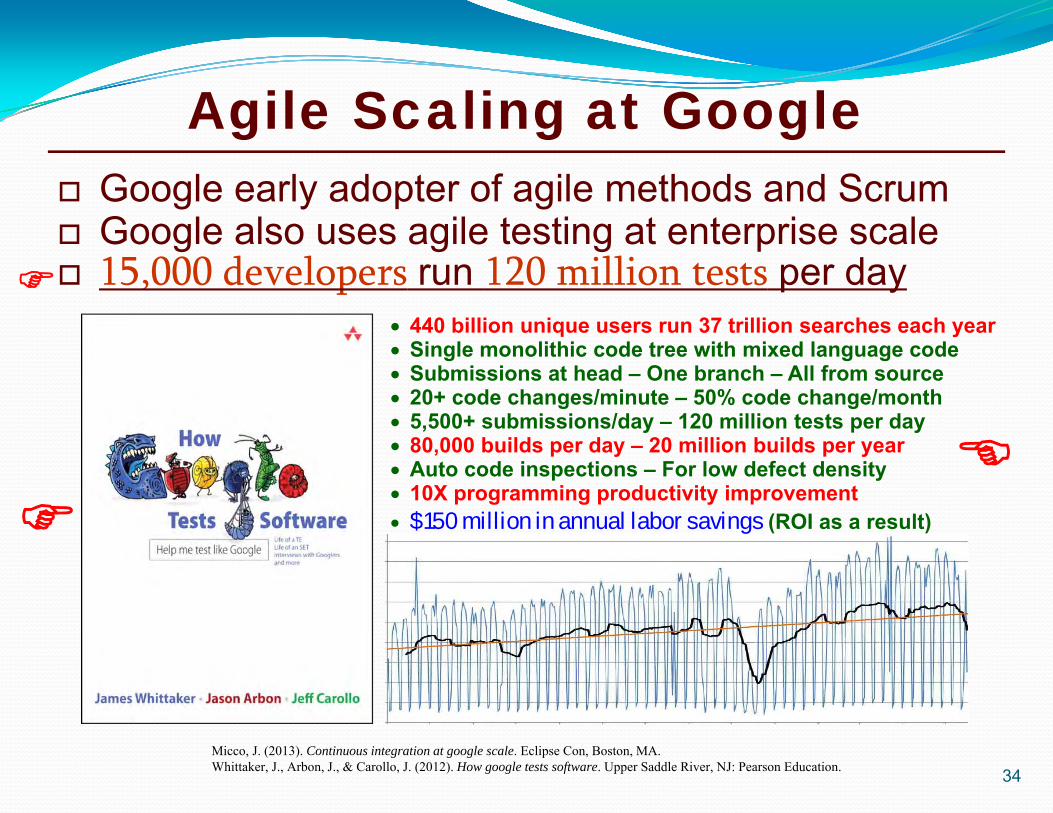
Agile Scaling at Google Google early adopter of agile methods and Scrum Google also uses agile testing at enterprise scale 15,000 developers run 120 million tests per day
34Micco, J. (2013). Continuous integration at google scale. Eclipse Con, Boston, MA.Whittaker, J., Arbon, J., & Carollo, J. (2012). How google tests software. Upper Saddle River, NJ: Pearson Education.
440 billion unique users run 37 trillion searches each year Single monolithic code tree with mixed language code Submissions at head – One branch – All from source 20+ code changes/minute – 50% code change/month 5,500+ submissions/day – 120 million tests per day 80,000 builds per day – 20 million builds per year Auto code inspections – For low defect density 10X programming productivity improvement $150 million in annual labor savings (ROI as a result)
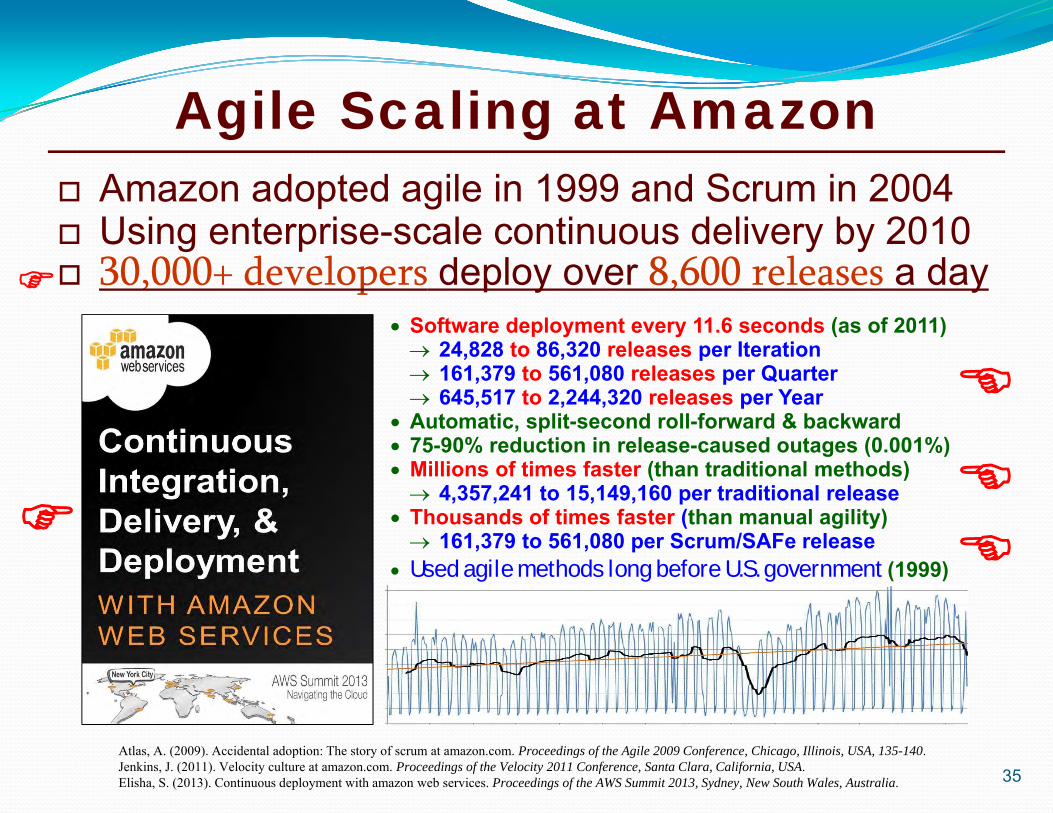
Agile Scaling at Amazon Amazon adopted agile in 1999 and Scrum in 2004 Using enterprise-scale continuous delivery by 2010 30,000+ developers deploy over 8,600 releases a day
35Atlas, A. (2009). Accidental adoption: The story of scrum at amazon.com. Proceedings of the Agile 2009 Conference, Chicago, Illinois, USA, 135-140.Jenkins, J. (2011). Velocity culture at amazon.com. Proceedings of the Velocity 2011 Conference, Santa Clara, California, USA.Elisha, S. (2013). Continuous deployment with amazon web services. Proceedings of the AWS Summit 2013, Sydney, New South Wales, Australia.
Software deployment every 11.6 seconds (as of 2011) 24,828 to 86,320 releases per Iteration 161,379 to 561,080 releases per Quarter 645,517 to 2,244,320 releases per Year
Automatic, split-second roll-forward & backward 75-90% reduction in release-caused outages (0.001%) Millions of times faster (than traditional methods) 4,357,241 to 15,149,160 per traditional release
Thousands of times faster (than manual agility) 161,379 to 561,080 per Scrum/SAFe release
Used agile methods long before U.S. government (1999)
36
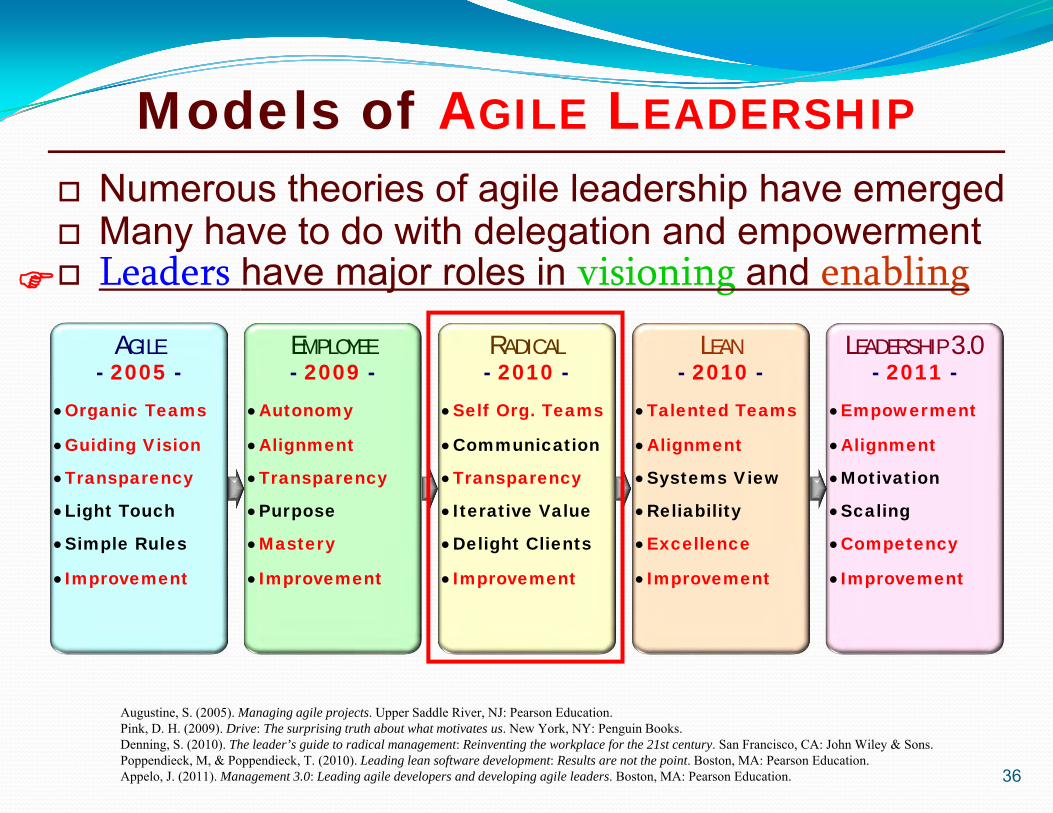
Numerous theories of agile leadership have emerged Many have to do with delegation and empowerment Leaders have major roles in visioning and enabling
AGILE- 2005 -
EMPLOYEE- 2009 -
RADICAL- 2010 -
LEAN- 2010 -
LEADERSHIP 3.0- 2011 -
Organic Teams
Guiding Vision
Transparency
Light Touch
Simple Rules
Improvement
Autonomy
Alignment
Transparency
Purpose
Mastery
Improvement
Self Org. Teams
Communication
Transparency
Iterative Value
Delight Clients
Improvement
Talented Teams
Alignment
Systems View
Reliability
Excellence
Improvement
Empowerment
Alignment
Motivation
Scaling
Competency
Improvement
Augustine, S. (2005). Managing agile projects. Upper Saddle River, NJ: Pearson Education.Pink, D. H. (2009). Drive: The surprising truth about what motivates us. New York, NY: Penguin Books.Denning, S. (2010). The leader’s guide to radical management: Reinventing the workplace for the 21st century. San Francisco, CA: John Wiley & Sons.Poppendieck, M, & Poppendieck, T. (2010). Leading lean software development: Results are not the point. Boston, MA: Pearson Education.Appelo, J. (2011). Management 3.0: Leading agile developers and developing agile leaders. Boston, MA: Pearson Education.
Models of AGILE LEADERSHIP
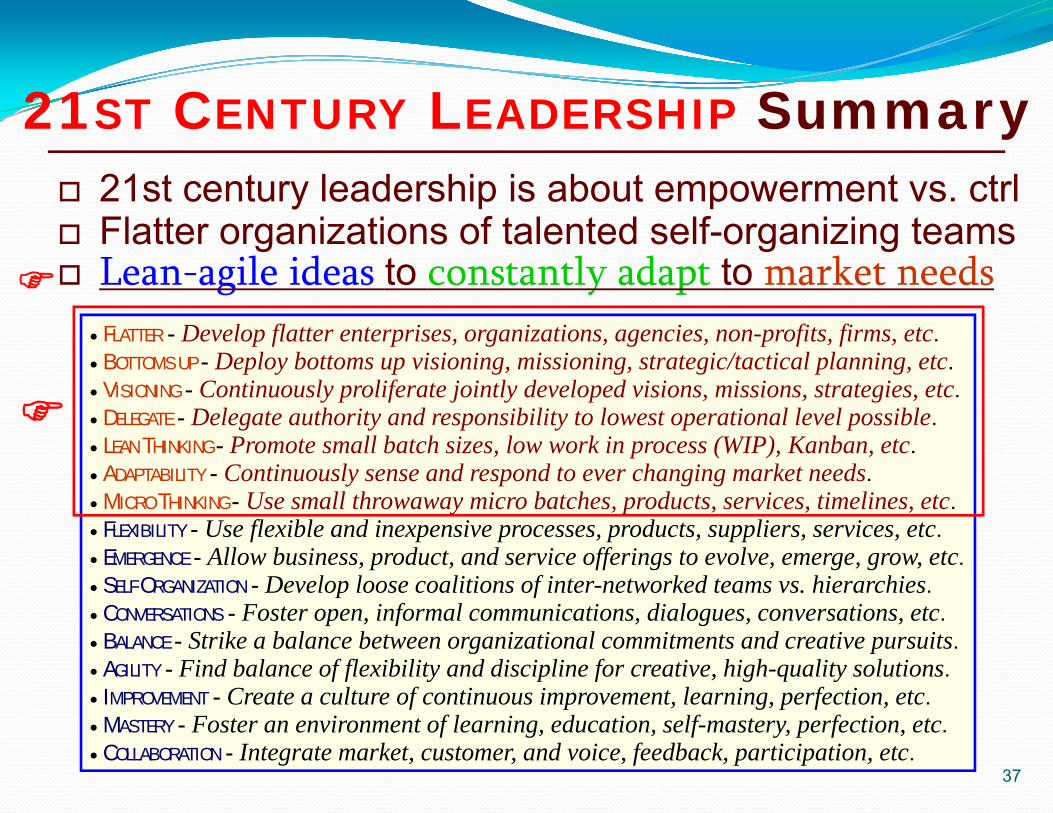
21ST CENTURY LEADERSHIP Summary 21st century leadership is about empowerment vs. ctrl Flatter organizations of talented self-organizing teams Lean-agile ideas to constantly adapt to market needs
37
FLATTER - Develop flatter enterprises, organizations, agencies, non-profits, firms, etc. BOTTOMS UP - Deploy bottoms up visioning, missioning, strategic/tactical planning, etc. VISIONING - Continuously proliferate jointly developed visions, missions, strategies, etc. DELEGATE - Delegate authority and responsibility to lowest operational level possible. LEAN THINKING - Promote small batch sizes, low work in process (WIP), Kanban, etc. ADAPTABILITY - Continuously sense and respond to ever changing market needs. MICRO THINKING - Use small throwaway micro batches, products, services, timelines, etc. FLEXIBILITY - Use flexible and inexpensive processes, products, suppliers, services, etc. EMERGENCE - Allow business, product, and service offerings to evolve, emerge, grow, etc. SELF ORGANIZATION - Develop loose coalitions of inter-networked teams vs. hierarchies. CONVERSATIONS - Foster open, informal communications, dialogues, conversations, etc. BALANCE - Strike a balance between organizational commitments and creative pursuits. AGILITY - Find balance of flexibility and discipline for creative, high-quality solutions. IMPROVEMENT - Create a culture of continuous improvement, learning, perfection, etc. MASTERY - Foster an environment of learning, education, self-mastery, perfection, etc. COLLABORATION - Integrate market, customer, and voice, feedback, participation, etc.
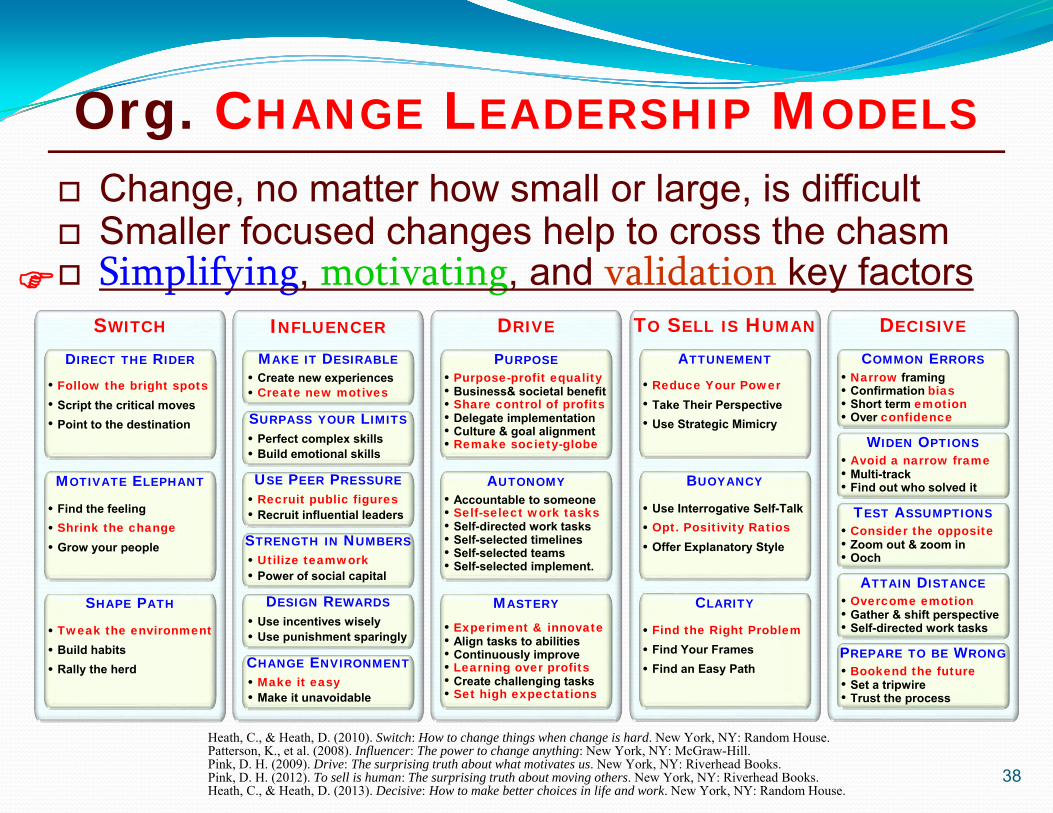
TO SELL IS HUMAN
Reduce Your Power Take Their Perspective Use Strategic Mimicry
Use Interrogative Self-Talk Opt. Positivity Ratios Offer Explanatory Style
Find the Right Problem Find Your Frames Find an Easy Path
ATTUNEMENT
BUOYANCY
CLARITY
Org. CHANGE LEADERSHIP MODELS
Heath, C., & Heath, D. (2010). Switch: How to change things when change is hard. New York, NY: Random House.Patterson, K., et al. (2008). Influencer: The power to change anything: New York, NY: McGraw-Hill.Pink, D. H. (2009). Drive: The surprising truth about what motivates us. New York, NY: Riverhead Books.Pink, D. H. (2012). To sell is human: The surprising truth about moving others. New York, NY: Riverhead Books.Heath, C., & Heath, D. (2013). Decisive: How to make better choices in life and work. New York, NY: Random House.
Change, no matter how small or large, is difficult Smaller focused changes help to cross the chasm Simplifying, motivating, and validation key factors
38
SWITCH
Follow the bright spots Script the critical moves Point to the destination
Find the feeling Shrink the change Grow your people
Tweak the environment Build habits Rally the herd
DIRECT THE RIDER
MOTIVATE ELEPHANT
SHAPE PATH
INFLUENCER
Create new experiences Create new motives
Perfect complex skills Build emotional skills
Recruit public figures Recruit influential leaders
Utilize teamwork Power of social capital
Use incentives wisely Use punishment sparingly
Make it easy Make it unavoidable
MAKE IT DESIRABLE
SURPASS YOUR LIMITS
USE PEER PRESSURE
STRENGTH IN NUMBERS
DESIGN REWARDS
CHANGE ENVIRONMENT
DRIVE
PURPOSE
AUTONOMY
MASTERY
Purpose-profit equality Business& societal benefit Share control of profits Delegate implementation Culture & goal alignment Remake society-globe
Accountable to someone Self-select work tasks Self-directed work tasks Self-selected timelines Self-selected teams Self-selected implement.
Experiment & innovate Align tasks to abilities Continuously improve Learning over profits Create challenging tasks Set high expectations
DECISIVE
COMMON ERRORS Narrow framing Confirmation bias Short term emotion Over confidence
WIDEN OPTIONS Avoid a narrow frame Multi-track Find out who solved it
TEST ASSUMPTIONS Consider the opposite Zoom out & zoom in Ooch
ATTAIN DISTANCE Overcome emotion Gather & shift perspective Self-directed work tasks
PREPARE TO BE WRONG Bookend the future Set a tripwire Trust the process
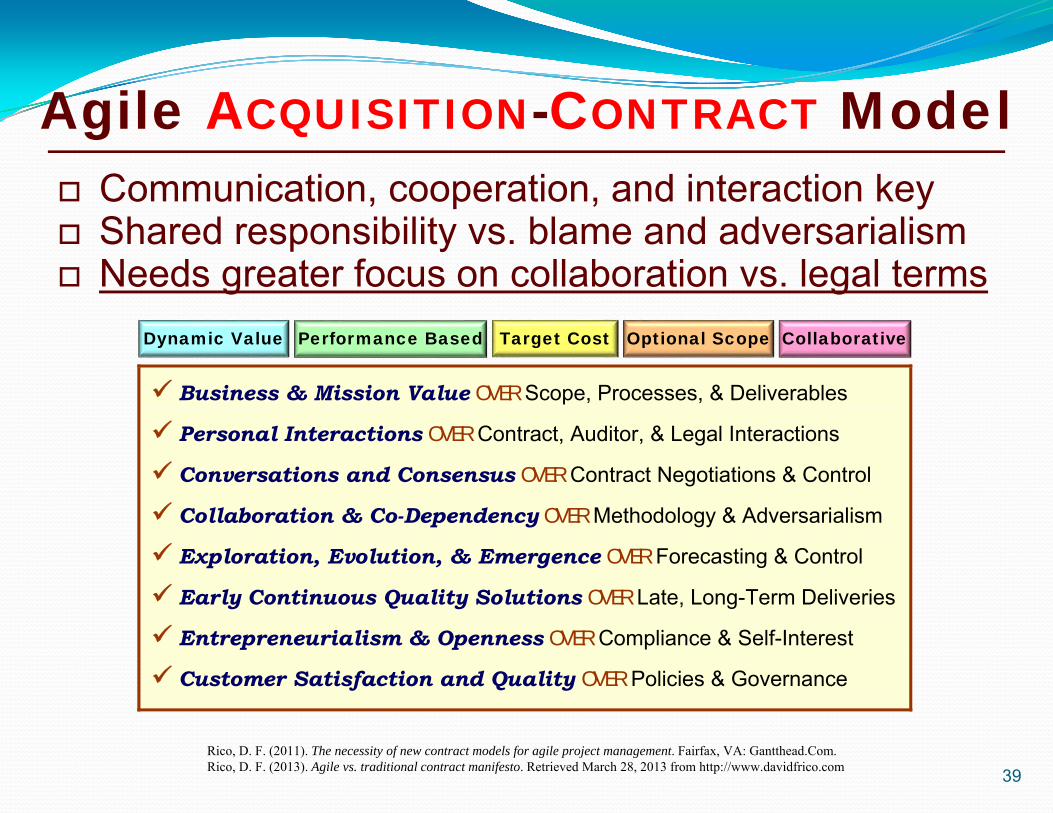
Agile ACQUISITION-CONTRACT Model
Rico, D. F. (2011). The necessity of new contract models for agile project management. Fairfax, VA: Gantthead.Com.Rico, D. F. (2013). Agile vs. traditional contract manifesto. Retrieved March 28, 2013 from http://www.davidfrico.com 39
Dynamic Value Performance Based Target Cost Optional Scope Collaborative
Business & Mission Value OVER Scope, Processes, & Deliverables
Personal Interactions OVER Contract, Auditor, & Legal Interactions
Conversations and Consensus OVER Contract Negotiations & Control
Collaboration & Co-Dependency OVER Methodology & Adversarialism
Exploration, Evolution, & Emergence OVER Forecasting & Control
Early Continuous Quality Solutions OVER Late, Long-Term Deliveries
Entrepreneurialism & Openness OVER Compliance & Self-Interest
Customer Satisfaction and Quality OVER Policies & Governance
Communication, cooperation, and interaction key Shared responsibility vs. blame and adversarialism Needs greater focus on collaboration vs. legal terms
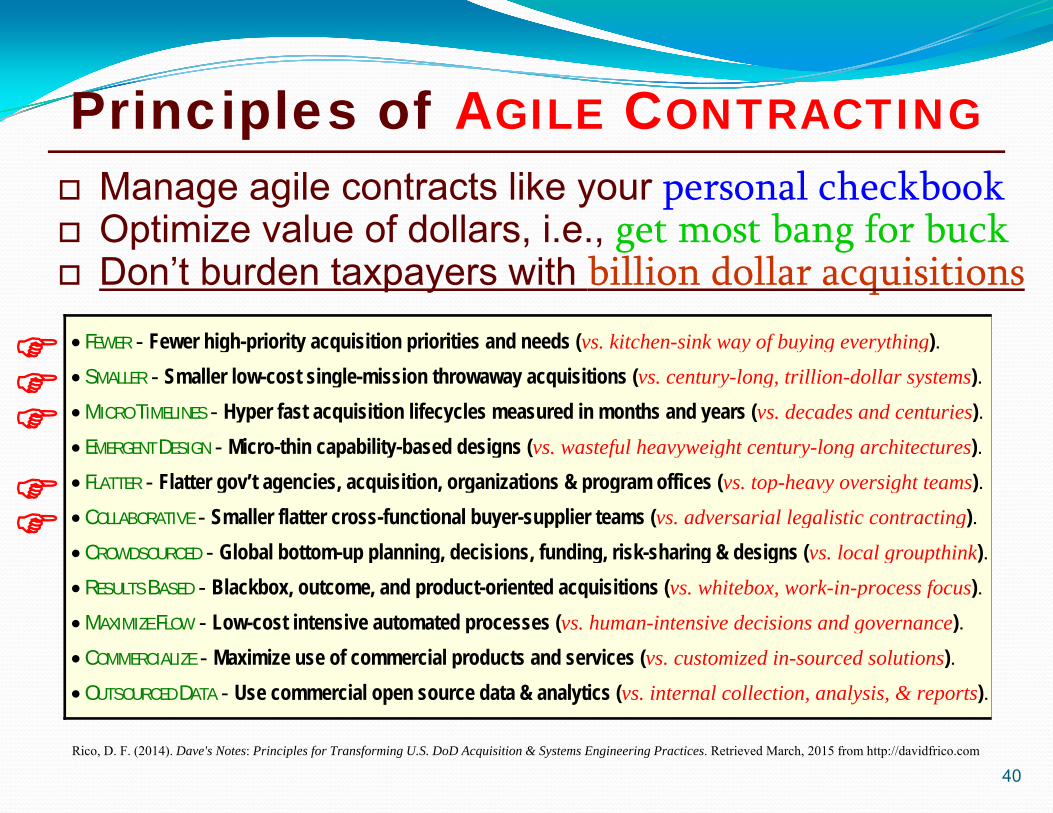
Principles of AGILE CONTRACTING Manage agile contracts like your personal checkbook Optimize value of dollars, i.e., get most bang for buck Don’t burden taxpayers with billion dollar acquisitions
40Rico, D. F. (2014). Dave's Notes: Principles for Transforming U.S. DoD Acquisition & Systems Engineering Practices. Retrieved March, 2015 from http://davidfrico.com
FEWER - Fewer high-priority acquisition priorities and needs (vs. kitchen-sink way of buying everything). SMALLER - Smaller low-cost single-mission throwaway acquisitions (vs. century-long, trillion-dollar systems). MICRO TIMELINES - Hyper fast acquisition lifecycles measured in months and years (vs. decades and centuries). EMERGENT DESIGN - Micro-thin capability-based designs (vs. wasteful heavyweight century-long architectures). FLATTER - Flatter gov’t agencies, acquisition, organizations & program offices (vs. top-heavy oversight teams). COLLABORATIVE - Smaller flatter cross-functional buyer-supplier teams (vs. adversarial legalistic contracting). CROWDSOURCED - Global bottom-up planning, decisions, funding, risk-sharing & designs (vs. local groupthink). RESULTS BASED - Blackbox, outcome, and product-oriented acquisitions (vs. whitebox, work-in-process focus). MAXIMIZE FLOW - Low-cost intensive automated processes (vs. human-intensive decisions and governance). COMMERCIALIZE - Maximize use of commercial products and services (vs. customized in-sourced solutions). OUTSOURCED DATA - Use commercial open source data & analytics (vs. internal collection, analysis, & reports).
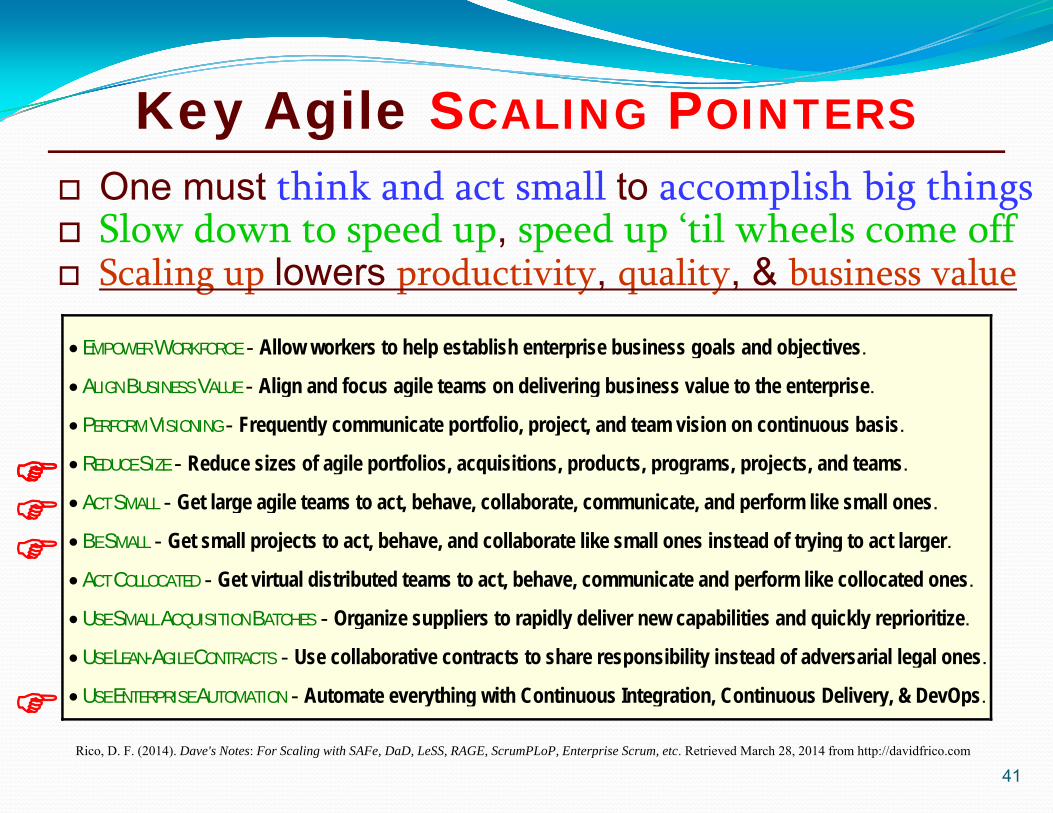
Key Agile SCALING POINTERS One must think and act small to accomplish big things Slow down to speed up, speed up ‘til wheels come off Scaling up lowers productivity, quality, & business value
41Rico, D. F. (2014). Dave's Notes: For Scaling with SAFe, DaD, LeSS, RAGE, ScrumPLoP, Enterprise Scrum, etc. Retrieved March 28, 2014 from http://davidfrico.com
EMPOWER WORKFORCE - Allow workers to help establish enterprise business goals and objectives.
ALIGN BUSINESS VALUE - Align and focus agile teams on delivering business value to the enterprise.
PERFORM VISIONING - Frequently communicate portfolio, project, and team vision on continuous basis.
REDUCE SIZE - Reduce sizes of agile portfolios, acquisitions, products, programs, projects, and teams.
ACT SMALL - Get large agile teams to act, behave, collaborate, communicate, and perform like small ones.
BE SMALL - Get small projects to act, behave, and collaborate like small ones instead of trying to act larger.
ACT COLLOCATED - Get virtual distributed teams to act, behave, communicate and perform like collocated ones.
USE SMALL ACQUISITION BATCHES - Organize suppliers to rapidly deliver new capabilities and quickly reprioritize.
USE LEAN-AGILE CONTRACTS - Use collaborative contracts to share responsibility instead of adversarial legal ones.
USE ENTERPRISE AUTOMATION - Automate everything with Continuous Integration, Continuous Delivery, & DevOps.
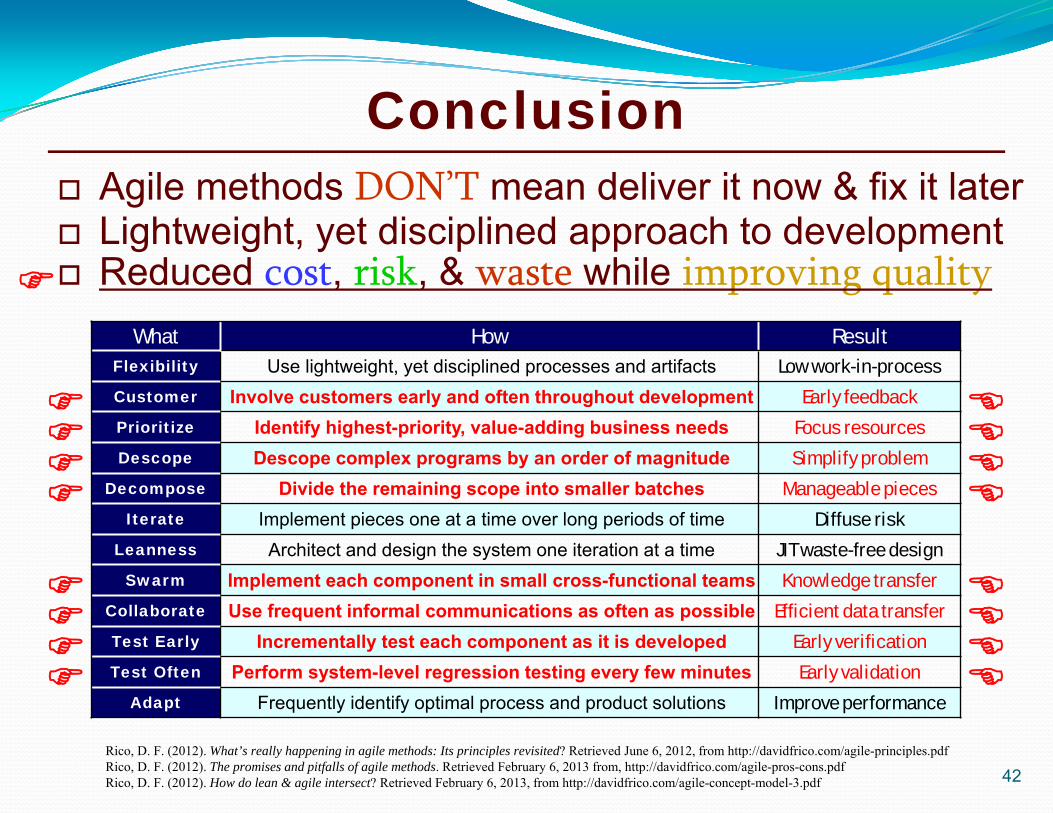
Conclusion Agile methods DON’T mean deliver it now & fix it later Lightweight, yet disciplined approach to development Reduced cost, risk, & waste while improving quality
42Rico, D. F. (2012). What’s really happening in agile methods: Its principles revisited? Retrieved June 6, 2012, from http://davidfrico.com/agile-principles.pdfRico, D. F. (2012). The promises and pitfalls of agile methods. Retrieved February 6, 2013 from, http://davidfrico.com/agile-pros-cons.pdfRico, D. F. (2012). How do lean & agile intersect? Retrieved February 6, 2013, from http://davidfrico.com/agile-concept-model-3.pdf
What How ResultFlexibility Use lightweight, yet disciplined processes and artifacts Low work-in-process
Customer Involve customers early and often throughout development Early feedback
Prioritize Identify highest-priority, value-adding business needs Focus resources
Descope Descope complex programs by an order of magnitude Simplify problem
Decompose Divide the remaining scope into smaller batches Manageable pieces
Iterate Implement pieces one at a time over long periods of time Diffuse risk
Leanness Architect and design the system one iteration at a time JIT waste-free design
Swarm Implement each component in small cross-functional teams Knowledge transfer
Collaborate Use frequent informal communications as often as possible Efficient data transfer
Test Early Incrementally test each component as it is developed Early verification
Test Often Perform system-level regression testing every few minutes Early validation
Adapt Frequently identify optimal process and product solutions Improve performance
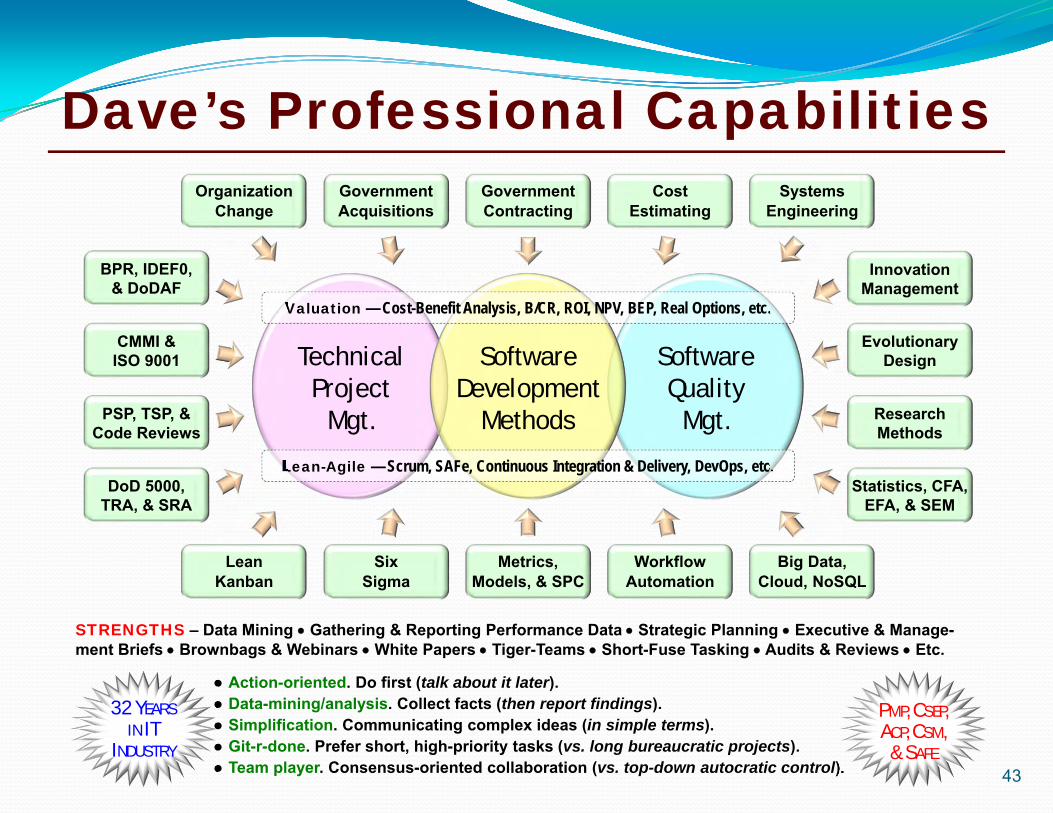
Dave’s Professional Capabilities
43
SoftwareQuality
Mgt.
TechnicalProject
Mgt.
SoftwareDevelopment
Methods
OrganizationChange
SystemsEngineering
CostEstimating
GovernmentContracting
GovernmentAcquisitions
LeanKanban
Big Data,Cloud, NoSQL
WorkflowAutomation
Metrics,Models, & SPC
SixSigma
BPR, IDEF0,& DoDAF
DoD 5000,TRA, & SRA
PSP, TSP, &Code Reviews
CMMI &ISO 9001
InnovationManagement
Statistics, CFA,EFA, & SEM
ResearchMethods
EvolutionaryDesign
Valuation — Cost-Benefit Analysis, B/CR, ROI, NPV, BEP, Real Options, etc.
Lean-Agile — Scrum, SAFe, Continuous Integration & Delivery, DevOps, etc.
STRENGTHS – Data Mining Gathering & Reporting Performance Data Strategic Planning Executive & Manage-ment Briefs Brownbags & Webinars White Papers Tiger-Teams Short-Fuse Tasking Audits & Reviews Etc.
● Action-oriented. Do first (talk about it later).● Data-mining/analysis. Collect facts (then report findings).● Simplification. Communicating complex ideas (in simple terms).● Git-r-done. Prefer short, high-priority tasks (vs. long bureaucratic projects).● Team player. Consensus-oriented collaboration (vs. top-down autocratic control).
PMP, CSEP,ACP, CSM,
& SAFE
32 YEARSIN IT
INDUSTRY

Books on ROI of SW Methods Guides to software methods for business leaders Communicates the business value of IT approaches Rosetta stones to unlocking ROI of software methods
http://davidfrico.com/agile-book.htm (Description) http://davidfrico.com/roi-book.htm (Description)
44