business statistics in practice seventh edition authors: bowerman / o’connell / murphree...
TRANSCRIPT

Business Statistics in PracticeSeventh EditionAuthors: Bowerman / O’Connell / MurphreeMcGraw-Hill

Chapter 1
An Introduction to Business Statistics
Copyright © 2014 by The McGraw-Hill Companies, Inc. All rights reserved.McGraw-Hill/Irwin

1-3
An Introduction to Business Statistics
1.1 Data1.2 Data Sources1.3 Populations and Samples1.4 Three Case Studies that Illustrate
Sampling and Statistical Inference1.5 Ratio, Interval, Ordinal, and Nominative
Scales of Measurement (Optional)

1-4
1.1 Data
Data: facts and figures from which conclusions can be drawn
Data set: the data that are collected for a particular study◦Elements: may be people, objects, events, or
other entriesVariable: any characteristic of an element
LO1-1: Explain what a variable is.

1-5
Data Continued
Measurement: A way to assign a value of a variable to the element
Quantitative: the possible measurements of the values of a variable are numbers that represent quantities
Qualitative: the possible measurements fall into several categories
LO1-2: Describe the difference between a quantitative variable and a qualitative variable.

1-6
Cross-Sectional Data
Cross-sectional data: Data collected at the same or approximately the same point in time
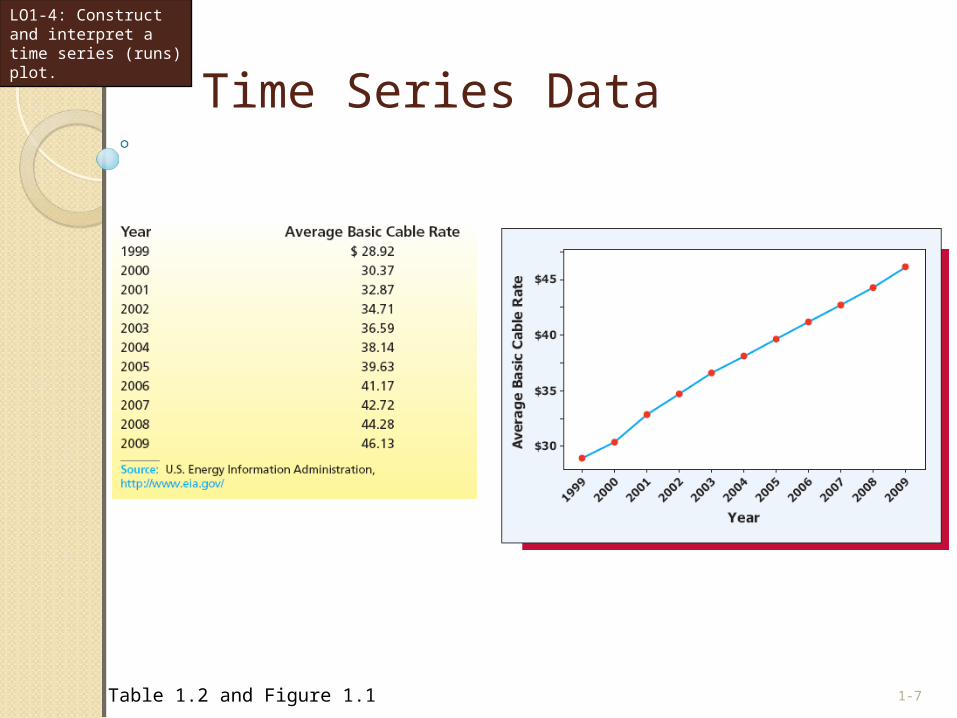
Time series data: data collected over different time periods
LO1-3: Describe the difference between cross-sectional data and time series data.
1-7
Time Series Data
LO1-4: Construct and interpret a time series (runs) plot.
Table 1.2 and Figure 1.1
1-8
1.2 Data Sources
Existing sources: data already gathered by public or private sources◦ Internet
◦ Library
◦ Private data sources
Experimental and observational studies: data we collect ourselves for a specific purpose◦ Response variable: variable of interest
◦ Factors: other variables related to response variable
LO1-5: Describe the different types of data sources: existing data sources, experimental studies, and observational studies.

1-9
Examples of Public Economic and Financial Data Sites
Table 1.3
LO1-5

1-10
1.3 Populations and Samples
Population The set of all elements about which we wish to draw conclusions (people, objects or events)
Census An examination of the entire population of measurements
Sample A selected subset of the units of a population
LO1-6: Describe the difference between a population and a sample.

1-11
Descriptive Statistics and Statistical Inference
Descriptive statistics: the science of describing the important aspects of a set of measurements
Statistical inference: the science of using a sample of measurements to make generalizations about the important aspects of a population of measurements
LO1-7: Distinguish between descriptive statistics and statistical inference.

1-12
1.4 Three Case Studies That Illustrate Sampling and Statistical Inference
1. Estimating Cell Phone Costs
2. The Marketing Research Case: Rating a New Bottle Design
3. The Car Mileage Case: Estimating Mileage
LO1-8: Explain the importance of random sampling.

1-13
Estimating Cell Phone Costs
Considering using a company to manage their cellular resources
Random sample of 100 employees on 500-minute plan
Many overages and underage
LO1-8

1-14
The Cell Phone Case: The Data
LO1-8
Table 1.4

1-15
The Marketing Research Case: Rating a New Bottle DesignStudying to see if changes should be made in
the bottle design for a popular soft drinkUsing “mall intercept method”Sample size of 60
LO1-8
1-16
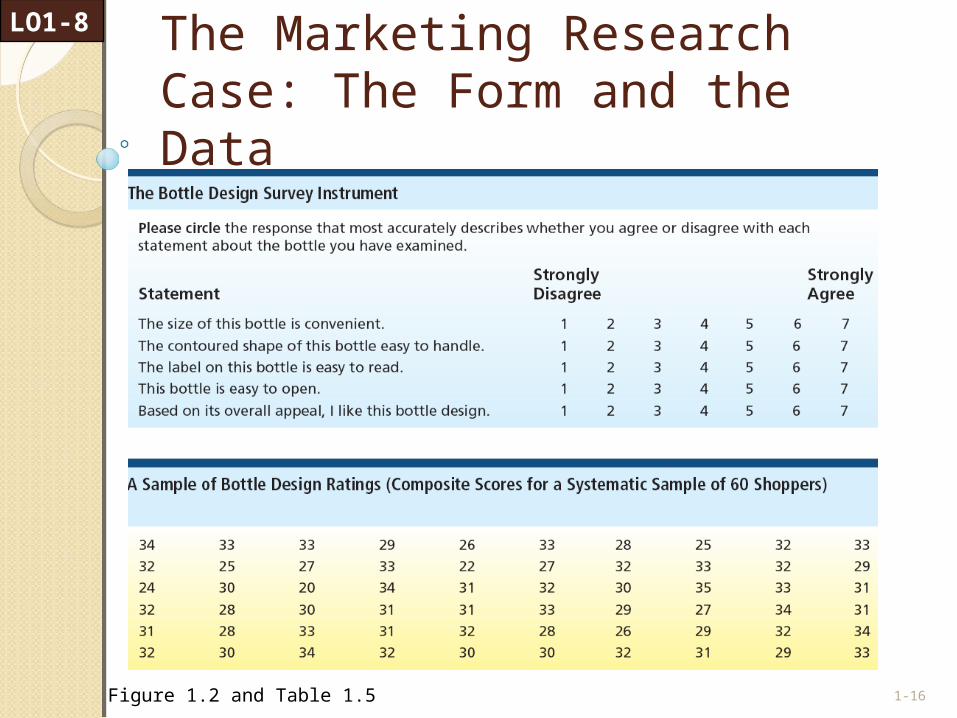
The Marketing Research Case: The Form and the Data
LO1-8
Figure 1.2 and Table 1.5

1-17
Terms
Process: a sequence of operations that takes inputs and turns them into outputs
Finite population: a population of limited size
Infinite population: a population of unlimited size
LO1-8
1-18
The Care Mileage Case: Estimating Mileage
Study of tax credit offered by the federal government for improving fuel economy
Automaker has introduced a new model and wishes to demonstrate it qualifies for the tax credit
Sample of 50 cars
LO1-8

1-19
The Care Mileage Case: The Data
LO1-8
Table 1.6 and Figure 1.3

1-20
1.5 Ratio, Interval, Ordinal, and Nominative Scales of Measurement (Optional)
Quantitative variables◦ Ratio variable: a quantitative variable measured on a scale
such that ratios of its value are meaningful and there is an inherently defined zero value
◦ Interval variable: a quantitative variable where ratios are not meaningful and there is no defined zero
Qualitative variables (categorical)◦ Ordinal variable: a qualitative variable for which there is
a meaningful ranking of the categories
◦ Nominative variable: a qualitative variable for which there is no meaningful ranking of the categories
LO1-9: Identify ratio, interval, ordinal, and nominative scales of measurement (optional).