business resource efficiency guide waste mapping: … · waste mapping: your route to more profit...
TRANSCRIPT
Waste Mapping:Your Route to More Profit
Business Resource Efficiency Guide
Home 1 Introduction 2 How to produce a waste map
3 Putting in some figures
4 Updating and reviewing
5 Action plan 6 Further information
Appendix A: Examples of wastes

Waste Mapping: Your Route to More ProfitWRAP II
Our vision is a world without waste, where resources are used sustainably.
We work with businesses and individuals to help them reap the benefits of reducing waste, develop sustainable products and use resources in an efficient way.
Find out more from the WRAP Resource Efficiency Helpline on 0808 100 2040 or at www.wrap.org.uk
1 Introduction 2 1.1 Mapping out the road to increased profits 2 1.2 Use the map 2
2 How to produce a waste map 3 2.1 Example waste maps 3 2.2 How to map out your route 4 2.3 A question of scale 4 2.4 Start thinking about waste 4 2.5 Identifying wasted resources 5
3 Putting in some figures 6 3.1 Discover your inputs and outputs 6 3.2 Counting the cost 6 3.3 How much waste? 8 3.4 The options for resource efficiency 9 3.5 The waste hierarchy 9 3.6 Taking action 10 3.7 The next steps for resource efficiency 10
4 Updating and reviewing 11 4.1 Dead ends 11
5 Action plan 12
6 Further information 13
Appendix A: Examples of wastes 15
Contents
Home 1 Introduction 2 How to produce a waste map
3 Putting in some figures
4 Updating and reviewing
5 Action plan 6 Further information
Appendix A: Examples of wastes
Waste Mapping: Your Route to More ProfitWRAP 1
Summary
In UK businesses, the true cost of waste can be up to 4% of turnover. However, resource efficiency initiatives have shown that by implementing materials reduction measures as part of a wider resource efficiency programme, this figure can often be reduced by 25%. The resulting cost savings go straight to the bottom line.
To reduce waste in any organisation, it is necessary to understand where and how it occurs, and how much it is really costing.
Becoming committed to resource efficiency is an attractive idea but, in practice, many organisations do not know where to start or how to ensure continuing success.
This publication is designed to be a first step towards tackling resource waste and becoming more resource efficient for these organisations.
Included in this guide is a blank map (or site plan). Armed with this, the first stage is to walk around your site and mark on the map the visible and potential areas where waste is generated.
The second stage is to start putting some figures to these materials and resources – this publication tells you how.
The third stage is to record your material use and then to start reducing it. At the end of this guide are sources of further information that will help organisations become committed to ongoing resource efficiency and be successful at reducing waste.
Home 1 Introduction 2 How to produce a waste map
3 Putting in some figures
4 Updating and reviewing
5 Action plan 6 Further information
Appendix A: Examples of wastes
Waste Mapping: Your Route to More ProfitWRAP 2
Home 2 How to produce a waste map
3 Putting in some figures
4 Updating and reviewing
5 Action plan 6 Further information
Appendix A: Examples of wastes
1 Introduction
1 Introduction
Many organisations considerably underestimate the cost of waste, viewing it simply in terms of disposal costs. When waste is considered in respect of the materials that are in the waste and the cost of treatment, energy and wasted effort, the true cost is often 5–20 times that of the disposal. Cutting waste and increasing your materials efficiency will save you money and help the environment.
All organisations produce waste – even efficient ones
This guide will help your organisation to start reducing waste and saving money. It will help you to look at your organisation and its processes with a fresh pair of eyes.
1.1 Mapping out the road to increased profits
1.1.1 What can you save?Businesses can usually expect to save at least 1% of turnover at little or no cost. In a business with a £2 million turnover, that represents a saving of £20,000. How much time and effort is needed to increase sales by that much? It is almost certainly far higher than that needed to save the money by being more resource efficient.
1.1.2 How do you start?By using the simple mapping techniques described in this publication, you will be encouraged to ‘map out’ how you are using resources. From this, you will be able to build up a picture of your processes – and see more clearly where you are wasting resources.
Sources of waste are not always obvious and the cost of waste is usually underestimated. The map will help you to see the true cost of waste. Ideas for reducing and minimising waste are given, but will also flow from your investigations.
1.1.3 Why should you be more resource efficient?
The relative importance of each of the following benefits of resource efficiency is a matter for each organisation to assess for itself:
it will reduce your overheads and increase ¡your profitability;it will help you to comply with health, safety ¡and environmental legislation;it will enhance your image with your ¡customers, your employees and the local community; andit will improve your workplace and the local ¡environment.
1.1.4 When can you start?Start now – there’s no time like the present. You don’t have to do everything at once. A step-by-step approach is the most effective method and the one that will lead to lasting success.
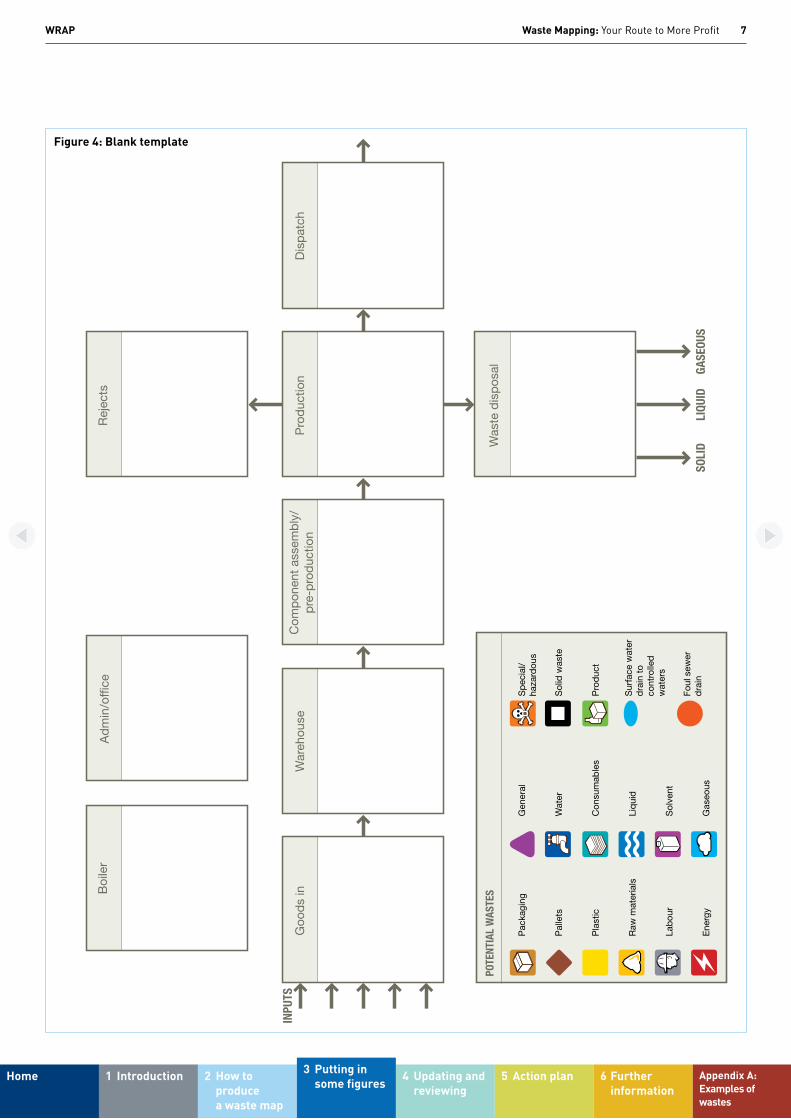
1.2 Use the mapYou can use the blank map (see Figure 4) as a template for your organisation. You could even create your own. You may not wish to use all the sections on the map or you may wish to add more – it’s up to you.
Section 2 tells you how to indicate areas of potential waste on the map. In the later stages of this publication you will be asked to start to gather data so that you can start measuring the wastes you have identified (see Section 3).
It may be that more than one type of wasted resource needs to be marked (for example, waste hot water means lost energy and lost water).
Don’t forget that waste is not just a question of amounts you can see or measure. Waste is just as likely to be wasted effort on the part of employees – this needs to be considered and noted as well.
Businesses can usually expect to save at least 1% of turnover at little or no cost.

Waste Mapping: Your Route to More ProfitWRAP 3
Home 1 Introduction 3 Putting in some figures
4 Updating and reviewing
5 Action plan 6 Further information
Appendix A: Examples of wastes
2 How to produce a waste map
2 How to produce a waste map
This section will help you to highlight your most wasteful processes. By starting to identify where waste is occurring, it will be easier to find out why it is happening. The map will help you to gather a list of wastes to target and assist you in calculating the cost of those wastes. Once you have this information, you will be in a position to decide which to target first – perhaps the easiest and most cost-effective improvements or you may want to look at those that have regulatory compliance implications.
2.1 Example waste mapsFirst, look at the two waste map examples that have been produced using the method described in this guide. The first company, Printers Inc, has produced a simple map of its site (Figure 1). The second company, First Fuses Ltd, has mapped its waste in greater detail (Figure 2).
The example waste maps are similar to those you will have produced for your organisation after following the steps in this publication.
By starting to identify where waste is occurring, it will be easier to find out why it is happening.
Conversion Printing Pre-press
Packing
Of
Engineering
Warehouse
Goods inGoods out
Canopy‘Trayed’ storagearea to collect
leachates
Locked& bunded
liquidsstore
Pallet store
StaffIn & out
only
GoodsIn & out
only
Spillkit
Spillkit
SIT
E B
OU
ND
AR
Y - S
EC
UR
ITY
FE
NC
EPackaging
Pallets
Plastic
Raw materials
Labour
Energy
Key for Figures 1 and 2
General
Water
Consumables
Liquid
Solvent
Gaseous
Special/hazardous
Solid waste
Product
Surface water drain to controlled waters
Foul sewer drain
Figure 1: Waste map for Printers Inc

Waste Mapping: Your Route to More ProfitWRAP 4
Home 1 Introduction 3 Putting in some figures
4 Updating and reviewing
5 Action plan 6 Further information
Appendix A: Examples of wastes
2 How to produce a waste map
Figure 4 is a blank map that you can adapt for your own site. You may want to photocopy the map so that you can use it again in a few months’ time to see where improvements have been made.
2.2 How to map out your routeTo complete the map, you will need to walk around your site. As you go, look for areas where waste is being generated. Any resources used (inputs) are a potential source of waste. Look particularly for wasteful processes. There may be a bin for off cuts or for discarded packaging. There may be water running away down the drain. There may be steam rising from an open treatment bath. The waste collection skip outside the building is another obvious example.
Some waste is easy to spot (for example, a hose left running). Other waste sources may be less obvious (for example, a heating thermostat that is set a few degrees higher than necessary). Start with the obvious and, as these are dealt with, the others can be investigated.
2.2.1 Seeing is believingThis publication encourages you to find out more about your process wastes. It is not essential to have everything laid out in exact detail at the beginning. The first step is to see where waste is being produced. Ask yourself ‘are these items essential by-products of the production process – or could the amount be reduced and, perhaps, even eliminated?’
2.3 A question of scaleThe first stage of marking the process wastes on the map should be fairly simple. At this stage, just enough information to take the first few steps to cutting down on waste is all that is required. Later on, you may wish to make waste maps of individual departments or processes to enable you to look at these areas in far greater detail. Extra information can be added as more detailed activities of waste minimisation are planned.
2.4 Start thinking about wasteThe maps for Printers Inc and First Fuses Ltd were produced by someone walking around with a blank map of the site looking for areas of potential waste. Don’t worry about putting
Offices
Offices
Canteen
Fuse manufacturingprocess line 1
Fuse manufacturingprocess line 2
Silverplating
Ovenbrazing
Electro-plating
Store Toolroom
Rawmaterials
storesGOODS IN
Waste area(compactor,
skips, oil bund)
Waste materialssegregated for
recycling
Finishedproduct stores
Press shopPrinting area
BoilerhouseINPUTS
electricityoilpropane
Office/storage
Solder/
Figure 2: Waste map for First Fuses Ltd

Waste Mapping: Your Route to More ProfitWRAP 5
Home 1 Introduction 3 Putting in some figures
4 Updating and reviewing
5 Action plan 6 Further information
Appendix A: Examples of wastes
2 How to produce a waste map
in any figures at this stage, just start thinking about waste. You could begin where your production process starts (for example, the delivery area or goods inwards). Think about the waste that might occur here. Ask yourself some questions – below are typical ones you may ask about your delivery area.
Is there a good system of stock rotation ¡to ensure out-of-date goods are not left on shelves?Are things stacked properly to minimise ¡damage?What happens to damaged goods? ¡What happens to ‘off-spec’ goods? ¡Are you taking every advantage of ¡bulk buying? For example, re-usable intermediate bulk containers (IBCs) are often a better option than smaller, single-use drums.What happens to the packaging? ¡Is space heating effective? ¡Are doors left open unnecessarily? ¡
2.5 Identifying wasted resourcesHere are some ideas for identifying and categorising your waste.
Raw materials – this does not just mean ¡the process materials for manufacturing, but includes consumables such as chemicals, cleaning materials and office paper.Water – for component rinsing, hand ¡washing, toilets, etc.Packaging – some kinds of cardboard ¡or plastic packaging could be re-used, recycled or even resold.Solid – including off cuts as well as ¡defective products.
Liquid – including lubricants and effluents. ¡Gaseous – including volatile organic ¡compounds (VOCs) and combustion emissions such as NOx, SOx and CO2.
Hazardous – any of the above where ¡disposal is covered by The Hazardous Waste Regulations1.Solvents – could include the last two items ¡above.Energy – for heating systems (process and ¡space heating), lighting, compressed air, pumps and drives, etc.
Take photographs of waste: they will show how much is being produced – and it will be useful for later comparisons, showing just how much has been saved.
Look for the wastes that are produced in each part of your building or stage of the production process – these will include a proportion of the raw materials, together with water, energy and other ancillary materials such as packaging. Note each of these at the appropriate place on the map.
For an office, waste may be relatively simple to see (for example, paper, toner cartridges, lighting of empty rooms, plastic cups, pens, and monitors and photocopiers left switched on unnecessarily). Also, don’t forget items that seem peripheral, like cleaning materials.
For industrial applications, the waste streams may include quantities of different metals, chemicals, effluent, etc.
See Appendix A for examples of wastes that may occur in your organisation.
1 At the time of publication, the relevant regulations are Hazardous Waste (England and Wales) Regulations 2005, Hazardous Waste (England and Wales) (amendment) Regulations 2009, and in Wales the Hazardous Waste (Wales) (amendment) regulations 2009.
Waste Mapping: Your Route to More ProfitWRAP 6
Home 1 Introduction 2 How to produce a waste map
4 Updating and reviewing
5 Action plan 6 Further information
Appendix A: Examples of wastes
3 Putting in some figures
3 Putting in some figures
3.1 Discover your inputs and outputsIdentifying the areas in which particular types of waste occur is just the first step. What you really want to know is how much it is costing you and how much money you can save.
Once areas of waste have been identified and marked on the map, you may be able to put in a figure for the amount. At this stage, it only needs to be an estimate. Detailed figures can be obtained later. The actual costs can be calculated later too.
To determine the actual cost of your waste, you need to look first at your bills and purchase orders, not at the waste itself.
Many input costs are listed in delivery notes and invoices which will give some indication of the value of what is being wasted. Put these figures onto the map as inputs. Don’t forget utility bills. You will require three types of figures:
all inputs, such as raw materials ¡purchased (cost and quantity) and electricity consumed;outputs, such as units of production; and ¡levels of waste, such as how much is ¡recycled and waste disposal charges.
You should have historical records of these and, with some effort, could put together your figures for last year.
Don’t worry at this stage if you cannot get all of the figures.
The amount of raw material that goes into the process and is not used in the final product is waste.
As you use this publication to put figures to inputs and wastes, you will begin to get a picture of where the waste is occurring – and how much it is costing. Steps can then be taken to reduce that cost to the organisation.
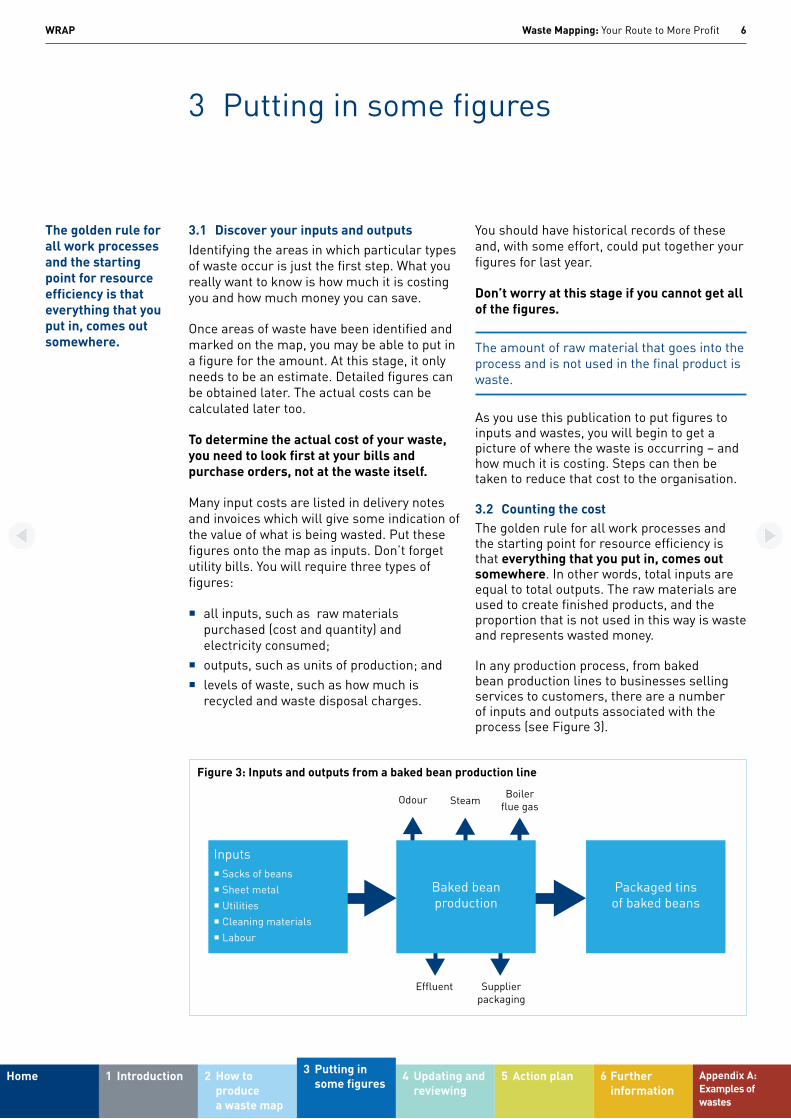
3.2 Counting the costThe golden rule for all work processes and the starting point for resource efficiency is that everything that you put in, comes out somewhere. In other words, total inputs are equal to total outputs. The raw materials are used to create finished products, and the proportion that is not used in this way is waste and represents wasted money.
In any production process, from baked bean production lines to businesses selling services to customers, there are a number of inputs and outputs associated with the process (see Figure 3).
The golden rule for all work processes and the starting point for resource efficiency is that everything that you put in, comes out somewhere.
Inputs¡ Sacks of beans¡ Sheet metal¡ Utilities¡ Cleaning materials¡ Labour
Packaged tins of baked beans
Baked beanproduction
Odour
Effluent Supplierpackaging
SteamBoiler
flue gas
Prevention
Preparing for reuse
Recycling
Other recovery
Disposal
Figure 3: Inputs and outputs from a baked bean production line
Waste Mapping: Your Route to More ProfitWRAP 7
Home 1 Introduction 2 How to produce a waste map
4 Updating and reviewing
5 Action plan 6 Further information
Appendix A: Examples of wastes
3 Putting in some figures
SOLI
DLI
QUID
GASE
OUS
Pro
duc
tion
Was
te d
isp
osal
Rej
ects
Dis
pat
ch
Boi
ler
Goo
ds
inIN
PUTS
War
ehou
se
Ad
min
/of
Com
pon
ent
asse
mb
ly/
pre
-pro
duc
tion
POTE
NTIA
L W
ASTE
S
Pac
kagi
ng
Pal
lets
Pla
stic
Raw
mat
eria
ls
Lab
our
Ene
rgy
Gen
eral
Wat
er
Con
sum
able
s
Liq
uid
Sol
vent
Gas
eous
Sp
ecia
l/ ha
zard
ous
Sol
id w
aste
Pro
duc
t
Fo
ul s
ewer
d
rain
Sur
face
wat
er
dra
in t
o co
ntro
lled
w
ater
s
Figure 4: Blank template

Waste Mapping: Your Route to More ProfitWRAP 8
Home 1 Introduction 2 How to produce a waste map
4 Updating and reviewing
5 Action plan 6 Further information
Appendix A: Examples of wastes
3 Putting in some figures
Successful organisations are those that can maximise the proportion of raw materials going into finished products and services. Or, to put it another way, they are the organisations that can reduce to a minimum the amount of money represented by waste.
By knowing the total cost of a raw material (be it a tonne of metal, a ream of paper or a cubic metre (m3) of water) and the amount of final product, the proportion of waste can be calculated – as well as the actual cost to the organisation. Don’t forget that raw materials are not just those used directly in a process. They also include the cost of ‘consumables’, such as office paper or cleaning rags. This is why you need figures for your inputs and outputs. It will help you to calculate the true cost of waste. Many organisations count only the cost of disposal, but this overlooks many sources of waste (for example, water or energy use levels that are higher than they should be, the solvent that evaporates, or where more chemicals or cleaner than necessary are used).
As you mark up wastes and costs on your waste map, think about the hidden costs as well.
3.3 How much waste?It is not essential at the start to have exact waste figures, although, of course, it helps. The most important thing is to know where waste is occurring and to have a rough idea of the quantity. Measurements like skipfuls or binfuls of waste will help you get an idea of the amount of waste being created around the site.
Remember to keep the units and timeframes of inputs, outputs and wastes the same, as far as possible. So, if deliveries of paper are made once a month, but waste paper is collected once a week, remember to convert them into the same units. It may be easier to annualise the costs. Water is generally billed in m3 so any measurements of waste should be converted to this as well.
Conversion factors
1,000 litres = 1m3
1 gallon = 0.0045m3
To convert cubic feet to m3 multiply by 0.0283
One way to get a rough idea of how much water is going down a drain is to use a bucket (or even a cup) and stopwatch. It is easy to find out how many litres the bucket or the cup holds. Then, see how many times it can be filled with wastewater in a one-minute period. Multiplying this by 60 will give the hourly waste rate. Be careful to ensure that any necessary safety measures are taken if the wastewater from an industrial process contains any potentially harmful materials.
3.3.1 Compound costsBe aware that many items have ‘compound costs’.
Water is generally subject to a double charge – for supply and for disposal. Both of these will be included on the bill. By cutting down on the amount of water you waste, you can achieve double money savings!
A process at one metal finishing site had a water use of 65 litres/minute. That compares with the typical consumption of more modern plant of 20 litres/minute and a potential ‘best-in-class’ rate of just 6 litres/minute. It meant the unit was using over ten times as much water as the best plants in the industry. Therefore, the plant operator was paying ten times as much for the supply water – and ten times the necessary charges for effluent too!
Many waste materials incur a disposal charge. If a company reduces the amount of raw materials used to manufacture an item by reducing the waste created during manufacture, that company will save twice. Less raw material used in production means lower purchase cost and savings in the disposal costs of the waste too.

Waste Mapping: Your Route to More ProfitWRAP 9
Home 1 Introduction 2 How to produce a waste map
4 Updating and reviewing
5 Action plan 6 Further information
Appendix A: Examples of wastes
3 Putting in some figures
3.3.2 Involve othersMuch of the information you will need will come from colleagues. Any resource efficiency programme relies on everyone being involved, so now is a good time to start getting everyone to think about waste.
You will have to talk to colleagues to obtain the detailed information you need to help you quantify your waste. For example, is it one skip or two of waste cardboard – is that per week or per month? How many wastepaper bins are emptied every day from the office? How often are the lights left on overnight after everyone has gone home? How long has the tap in the kitchen been leaking? Is it necessary to have clean, treated water in each of the rinsing baths?
If you’re not sure how to go about involving other people, get hold of the WRAP publication ‘Workforce Partnerships for Resource Efficiency’. It is available from the WRAP website (www.wrap.org.uk).
As you use your waste map, you will probably have many ideas that need investigating about how and why waste occurs and how to prevent it. Write everything down as it occurs to you. Once you start to see how waste could be reduced, you are ready to move on to the next step and set about reducing it in a systematic way.
3.4 The options for resource efficiencyWhen you have completed your map, it should be a comprehensive overview of waste in your organisation that will form a blueprint for reducing waste. Factors to consider in prioritising resource efficiency activities are:
the ease with which action can be taken; ¡the cost of the particular type of waste that ¡is being produced (for example, precious metals cost more to buy than steel plate, plastic document folders more than plastic cups); andthe proportion being wasted (the ¡percentage of the raw material that is not profitably used).
You should be able to identify some of these priority areas by looking at the figures you have on the map. Each organisation will have its own goals determined by its policies and practices. However, for many, the easiest and lowest-cost actions will probably be carried through first as they do not require great capital or time commitments and produce results that can be seen very quickly.
Waste Mapping: Your Route to More ProfitWRAP 10
Home 1 Introduction 2 How to produce a waste map
4 Updating and reviewing
5 Action plan 6 Further information
Appendix A: Examples of wastes
3 Putting in some figures
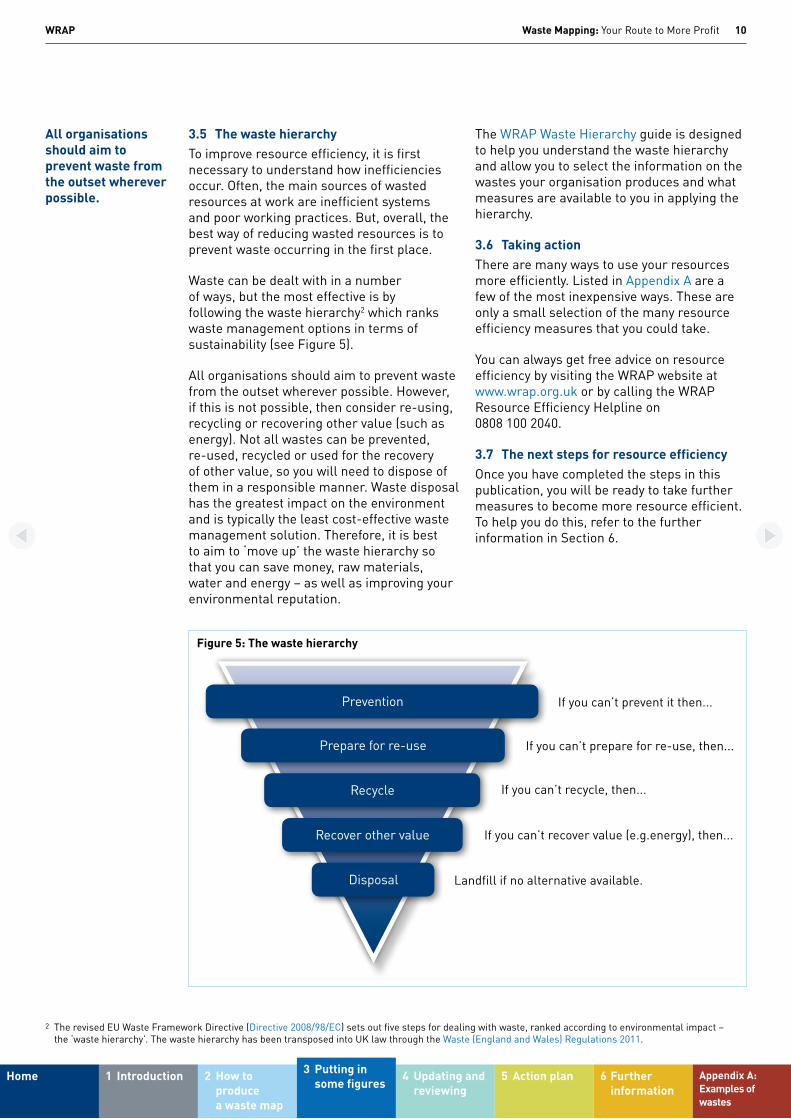
3.5 The waste hierarchyTo improve resource efficiency, it is first necessary to understand how inefficiencies occur. Often, the main sources of wasted resources at work are inefficient systems and poor working practices. But, overall, the best way of reducing wasted resources is to prevent waste occurring in the first place.
Waste can be dealt with in a number of ways, but the most effective is by following the waste hierarchy2 which ranks waste management options in terms of sustainability (see Figure 5).
All organisations should aim to prevent waste from the outset wherever possible. However, if this is not possible, then consider re-using, recycling or recovering other value (such as energy). Not all wastes can be prevented, re-used, recycled or used for the recovery of other value, so you will need to dispose of them in a responsible manner. Waste disposal has the greatest impact on the environment and is typically the least cost-effective waste management solution. Therefore, it is best to aim to ‘move up’ the waste hierarchy so that you can save money, raw materials, water and energy – as well as improving your environmental reputation.
The WRAP Waste Hierarchy guide is designed to help you understand the waste hierarchy and allow you to select the information on the wastes your organisation produces and what measures are available to you in applying the hierarchy.
3.6 Taking actionThere are many ways to use your resources more efficiently. Listed in Appendix A are a few of the most inexpensive ways. These are only a small selection of the many resource efficiency measures that you could take.
You can always get free advice on resource efficiency by visiting the WRAP website at www.wrap.org.uk or by calling the WRAP Resource Efficiency Helpline on 0808 100 2040.
3.7 The next steps for resource efficiencyOnce you have completed the steps in this publication, you will be ready to take further measures to become more resource efficient. To help you do this, refer to the further information in Section 6.
2 The revised EU Waste Framework Directive (Directive 2008/98/EC) sets out five steps for dealing with waste, ranked according to environmental impact – the ‘waste hierarchy’. The waste hierarchy has been transposed into UK law through the Waste (England and Wales) Regulations 2011.
All organisations should aim to prevent waste from the outset wherever possible.
Figure 5: The waste hierarchy
If you can’t prevent it then...
If you can’t prepare for re-use, then...
If you can’t recycle, then...
If you can’t recover value (e.g.energy), then...
Landfill if no alternative available.
Prevention
Prepare for re-use
Recycle
Recover other value
Disposal

Waste Mapping: Your Route to More ProfitWRAP 11
Home 1 Introduction 2 How to produce a waste map
3 Putting in some figures
5 Action plan 6 Further information
Appendix A: Examples of wastes
4 Updating and reviewing
4 Updating and reviewing
As waste is tackled and reduced, the waste map will change – particularly the numbers. Some waste streams may disappear completely, others may become less important. A regular review of the waste map will help you to see where improvements have been made and where the next target for action may be. It will also enable you to see and record the genuine achievements made.
Alterations required by process or product development may remove some of the waste streams altogether and – just as likely – they may create others. Waste may be ‘moved’ to other parts of the site.
Such changes may mean that sections of the map will have to be redrawn to cope with new practices and equipment.
4.1 Dead endsOver a period of time, the layout or the function of the site may alter as technologies improve, new processes are installed, and new products and services are developed. Any, or all, of these may change the way your organisation carries out its activities.
It is possible that the map may help you to identify areas that have no useful purpose. Organisations are in a process of continual change as new technologies, new processes, new products and new markets appear.
As processes change, the various contributing processes need to change too. A waste map may show up areas where change is needed to modify old practices and procedures to streamline the new production system. Such ‘dead ends’ may show up in excessive waste or long-term storage of items. These may have been necessary in the past, but may not be now.
A regular review of the waste map will help you to see where improvements have been made and where the next target for action may be.

Waste Mapping: Your Route to More ProfitWRAP 12
Home 1 Introduction 2 How to produce a waste map
3 Putting in some figures
4 Updating and reviewing
6 Further information
Appendix A: Examples of wastes
5 Action plan
5 Action plan
Adapt the blank map to suit your site or draw up a new one.
Walk around your site and identify sources of potential waste.
Get senior management commitment by telling them about the cost of waste and potential savings available.
Talk to other employees about their ideas for reducing waste.
Talk to relevant departments and people, and draw up a list of inputs, outputs and known wastes from your organisation’s processes.
Measure wastes, even if this provides only rough estimates at this stage.
Put as many figures on the waste map as possible.
Write down ideas for reducing wastes.
Calculate the true cost of waste.
Prioritise areas for action.
Use the pages in Appendix A to begin your savings.
Visit the WRAP website (www.wrap.org.uk) to find relevant information that will take you on to the next step.
If you would like to reduce the cost of waste to your organisation:
You should now be in a position to begin to develop an action plan to identify activities to minimise waste and improve resource efficiency.
Factors to consider in prioritising resource efficiency activities are:
the ease with which action can be taken; ¡the cost of the particular type of waste that ¡is being produced (e.g. precious metals cost more to buy than steel plate, plastic document folders more than plastic cups); and
the proportion being wasted (the ¡percentage of the raw material that is not profitably used).
You should be able to identify some of these priority areas by looking at the waste figures you have gathered. Your organisation will have its own goals determined by its own policies and practices. However, the easiest and lowest-cost actions will probably be carried through first as they do not require capital investment or time commitments and produce results that can be seen very quickly.

Waste Mapping: Your Route to More ProfitWRAP 13
Home 1 Introduction 2 How to produce a waste map
3 Putting in some figures
4 Updating and reviewing
5 Action plan Appendix A: Examples of wastes
6 Further information
6 Further information
WRAP guides and toolsTracking Water Use to Cut Costs. ¡Reducing Your Water Consumption. ¡Saving Money through Resource Efficiency: Reducing Water Use. ¡Finding Cost Savings: Resource Efficiency for SMEs. ¡Resource Efficiency for Managers. ¡Environmental Strategic Review Guide. ¡Waste Mapping: Your Route to More Profit. ¡Workforce Partnerships for Resource Efficiency. ¡Green Office: A Guide to Running a More Cost-effective and Environmentally Sustainable ¡Office.Self-assessment Review for Food and Drink Manufacturers. ¡Your Guide to Environmental Management Systems (EMS). ¡WRAP Waste Hierarchy Guid ¡ e.
Useful linksThe ¡ Carbon Trust helps business to cut carbon emissions. Visit the website at www.carbontrust.co.uk for more information.The ¡ Energy Saving Trust (www.energysavingtrust.org.uk) offers independent and impartial advice about how to save energy and money.
For guidance on environmental topics go to:
England ¡ – GOV.UK: Waste and environmental impactNorthern Ireland ¡ – NIBusinessInfo: Environment and efficiency Scotland ¡ – Business Gateway: Environment policy and procedures Wales ¡ – Business Wales: Environment - efficiency, waste & pollution prevention
Useful sources of information
Waste Mapping: Your Route to More ProfitWRAP 14
Home 1 Introduction 2 How to produce a waste map
3 Putting in some figures
4 Updating and reviewing
5 Action plan Appendix A: Examples of wastes
6 Further information
WRAP (Waste & Resources Action Programme) works in England, Scotland, Wales and Northern Ireland to help businesses and individuals reap the benefits of reducing waste, develop sustainable products and use resources in an efficient way.
Since its creation WRAP has funded projects that will, over their lifetimes, deliver over 120 million tonnes of waste diverted from landfill and over 20 million tonnes of CO2 equivalent greenhouse gases saved. Visit www.wrap.org.uk for more information on all of WRAP’s services.
What support can you get from WRAP?UK businesses could save £23 billion per year and help create and protect jobs by improving the way they use resources.
WRAP provides a range of free resource efficiency support for organisations including:
WRAP Resource Efficiency Helpline on 0808 100 2040; ¡online tools and guidance; ¡online training initiatives; ¡tailored business support for recycling companies; ¡case studies; and ¡guides. ¡
Visit www.wrap.org.uk to find out more.
WRAP
Waste Mapping: Your Route to More ProfitWRAP 15
Home 1 Introduction 2 How to produce a waste map
3 Putting in some figures
4 Updating and reviewing
5 Action plan 6 Further information
Appendix A: Examples of wastes
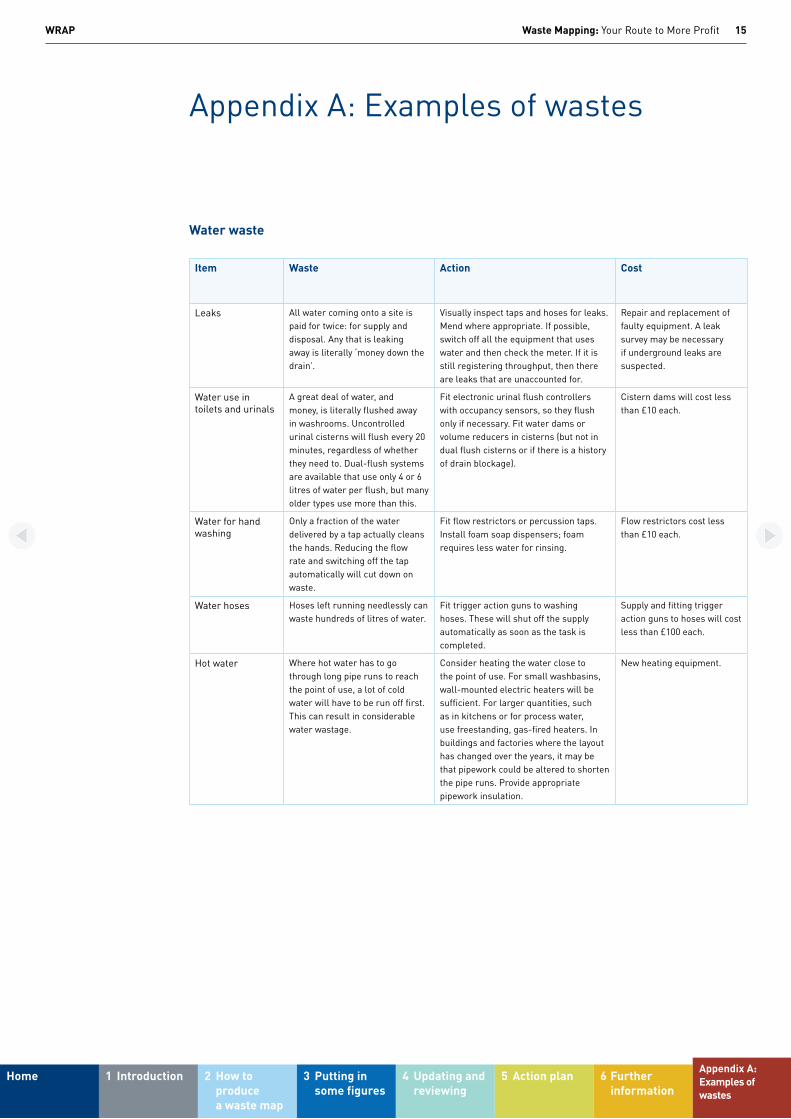
Appendix A: Examples of wastes
Item Waste Action Cost
Leaks All water coming onto a site is paid for twice: for supply and disposal. Any that is leaking away is literally ‘money down the drain’.
Visually inspect taps and hoses for leaks. Mend where appropriate. If possible, switch off all the equipment that uses water and then check the meter. If it is still registering throughput, then there are leaks that are unaccounted for.
Repair and replacement of faulty equipment. A leak survey may be necessary if underground leaks are suspected.
Water use in toilets and urinals
A great deal of water, and money, is literally flushed away in washrooms. Uncontrolled urinal cisterns will flush every 20 minutes, regardless of whether they need to. Dual-flush systems are available that use only 4 or 6 litres of water per flush, but many older types use more than this.
Fit electronic urinal flush controllers with occupancy sensors, so they flush only if necessary. Fit water dams or volume reducers in cisterns (but not in dual flush cisterns or if there is a history of drain blockage).
Cistern dams will cost less than £10 each.
Water for hand washing
Only a fraction of the water delivered by a tap actually cleans the hands. Reducing the flow rate and switching off the tap automatically will cut down on waste.
Fit flow restrictors or percussion taps. Install foam soap dispensers; foam requires less water for rinsing.
Flow restrictors cost less than £10 each.
Water hoses Hoses left running needlessly can waste hundreds of litres of water.
Fit trigger action guns to washing hoses. These will shut off the supply automatically as soon as the task is completed.
Supply and fitting trigger action guns to hoses will cost less than £100 each.
Hot water Where hot water has to go through long pipe runs to reach the point of use, a lot of cold water will have to be run off first. This can result in considerable water wastage.
Consider heating the water close to the point of use. For small washbasins, wall-mounted electric heaters will be sufficient. For larger quantities, such as in kitchens or for process water, use freestanding, gas-fired heaters. In buildings and factories where the layout has changed over the years, it may be that pipework could be altered to shorten the pipe runs. Provide appropriate pipework insulation.
New heating equipment.
Water waste

Waste Mapping: Your Route to More ProfitWRAP 16
Home 1 Introduction 2 How to produce a waste map
3 Putting in some figures
4 Updating and reviewing
5 Action plan 6 Further information
Appendix A: Examples of wastes
Item Waste Action Cost
Steel drums Non-returnable storage drums are included in the supply price. By re-using them for other purposes, organisations can save the costs of buying items for these other uses.
Identify further uses for steel drums, such as disposal of chemical wastes. Are there any areas of the production process where they could be used for temporary storage of materials before use? Any unused drums can be crushed and sold as scrap.
No cost.
Scrap metal Scrap metal merchants will often collect scrap free of charge or provide a small rebate. However, this fails to realise the real commercial value that these materials may have.
Optimising the cutting out of components from sheet metal may reduce the amount of scrap created in the first place. Buying the sheet or coils in the right dimensions may help. Separating the different metals will help realise their different market values (for example, copper and aluminium are worth more than mild steel). As separate items, it is often possible to sell on the materials to other organisations or to resell it to the suppliers.
No cost.
Packaging Excessive packaging results in higher initial costs in producing these materials in the first place and higher disposal costs as well.
Re-using packaging a number of times will also reduce costs. Even ‘one-trip’ packaging has often been found durable enough to survive several trips, provided it is inspected each time to ensure that it is undamaged. And, when these options are exhausted, there is still the opportunity to recycle many types of packaging.
No cost, except design time and trialling.
Paper It is estimated that the average office worker uses up to 45 sheets of paper per day, of which over half is considered waste. Minimising the use of office and computer paper can save a lot of money.
Separating out paper from other office waste will allow it to be recycled. Equally, cardboard, newspapers, brochures and magazines are potentially recyclable. It may be possible to find some innovative use for it – waste paper from one county council has been used as duck bedding!
Another way of minimising waste paper is to rely more on electronic means of communication such as e-mails and on-screen editing and publishing of reports. Using both sides of each sheet of paper can significantly reduce use as well.
No cost.
Solid waste
Waste Mapping: Your Route to More ProfitWRAP 17
Home 1 Introduction 2 How to produce a waste map
3 Putting in some figures
4 Updating and reviewing
5 Action plan 6 Further information
Appendix A: Examples of wastes
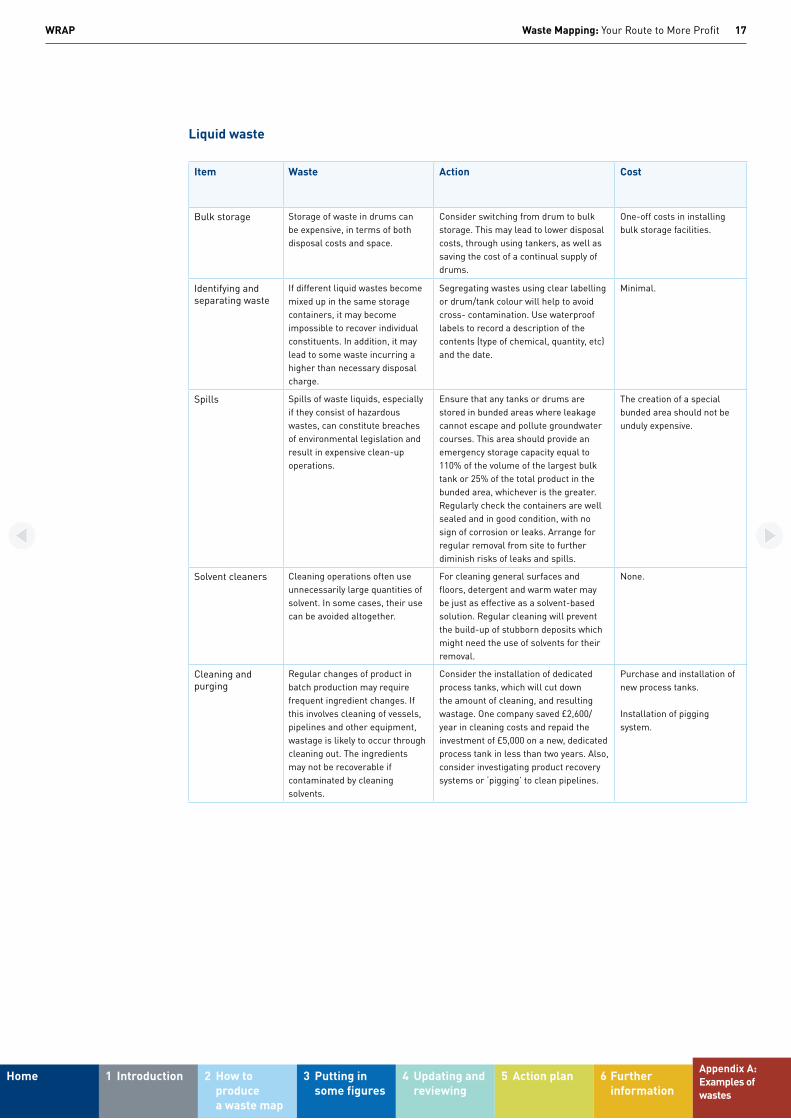
Item Waste Action Cost
Bulk storage Storage of waste in drums can be expensive, in terms of both disposal costs and space.
Consider switching from drum to bulk storage. This may lead to lower disposal costs, through using tankers, as well as saving the cost of a continual supply of drums.
One-off costs in installing bulk storage facilities.
Identifying and separating waste
If different liquid wastes become mixed up in the same storage containers, it may become impossible to recover individual constituents. In addition, it may lead to some waste incurring a higher than necessary disposal charge.
Segregating wastes using clear labelling or drum/tank colour will help to avoid cross- contamination. Use waterproof labels to record a description of the contents (type of chemical, quantity, etc) and the date.
Minimal.
Spills Spills of waste liquids, especially if they consist of hazardous wastes, can constitute breaches of environmental legislation and result in expensive clean-up operations.
Ensure that any tanks or drums are stored in bunded areas where leakage cannot escape and pollute groundwater courses. This area should provide an emergency storage capacity equal to 110% of the volume of the largest bulk tank or 25% of the total product in the bunded area, whichever is the greater. Regularly check the containers are well sealed and in good condition, with no sign of corrosion or leaks. Arrange for regular removal from site to further diminish risks of leaks and spills.
The creation of a special bunded area should not be unduly expensive.
Solvent cleaners Cleaning operations often use unnecessarily large quantities of solvent. In some cases, their use can be avoided altogether.
For cleaning general surfaces and floors, detergent and warm water may be just as effective as a solvent-based solution. Regular cleaning will prevent the build-up of stubborn deposits which might need the use of solvents for their removal.
None.
Cleaning and purging
Regular changes of product in batch production may require frequent ingredient changes. If this involves cleaning of vessels, pipelines and other equipment, wastage is likely to occur through cleaning out. The ingredients may not be recoverable if contaminated by cleaning solvents.
Consider the installation of dedicated process tanks, which will cut down the amount of cleaning, and resulting wastage. One company saved £2,600/year in cleaning costs and repaid the investment of £5,000 on a new, dedicated process tank in less than two years. Also, consider investigating product recovery systems or ‘pigging’ to clean pipelines.
Purchase and installation of new process tanks.
Installation of pigging system.
Liquid waste

Waste Mapping: Your Route to More ProfitWRAP 18
Home 1 Introduction 2 How to produce a waste map
3 Putting in some figures
4 Updating and reviewing
5 Action plan 6 Further information
Appendix A: Examples of wastes
Item Waste Action Cost
Evaporation of solvents
Volatile chemicals and solvents can be lost from storage tanks through day/night breathing. This can result in losses for some chemicals of several hundred litres per year.
Consider installing conservation valves for tanks containing volatile solvents to prevent vapour loss. These allow tanks to pressurise and depressurise without losing vapour.
Medium-cost measure. The purchase and installation of valves will cost a few hundred pounds.
Substitution of materials
Cleaning solvents are used to clean ink from equipment in printing applications. The volatile organic compound (VOC) based solvents commonly used have environmental, fire and occupational exposure issues associated with their use.
The emissions from these are subject to increasingly stringent regulation.
For some applications, non-VOC-based solvents can be used to replace volatile petroleum-based fluids.
Non-volatile solvents, which may include citrus-based cleaners, have improved over recent years and a review of cleaning solvents used on site may highlight opportunities to eliminate potentially harmful VOCs from the workplace.
No cost or low cost. However, any costs may be offset by reduced health, safety and environmental protection measures.
Boiler house emissions
Boilers generating steam or hot water for process or building use will generate quantities of soot and other substances such as oxides of nitrogen (NOx) and oxides of sulphur (SOx), as well as carbon dioxide (CO2). Such emissions will be worse if the combustion process is not efficient. The levels of emissions may fall within the compass of local authority environmental health enforcement.
Ensure that the boiler is serviced regularly for combustion efficiency. Check the suitability of different fuel grades as a way to lower emissions. Consider whether smaller units closer to the point of use would be more efficient than a single, central boiler.
Servicing should fall within the regular maintenance schedule. The cost-effectiveness of investments in new plant will have to be considered in the light of savings on fuel costs and environmental compliance requirements.
Compressed air losses
It costs money to compress air, which is widely used in a number of industries. Compressed air use is also regulated under the Transportable Gases and Pressure Systems Regulations.
Fitting pistol grip shut-offs to compressed air lines will ensure that they are not left in the ‘on’ position. Lines should also be checked for leaks and repairs made as appropriate.
Low-cost measure.
Gaseous waste
Waste Mapping: Your Route to More ProfitWRAP 19
Home 1 Introduction 2 How to produce a waste map
3 Putting in some figures
4 Updating and reviewing
5 Action plan 6 Further information
Appendix A: Examples of wastes
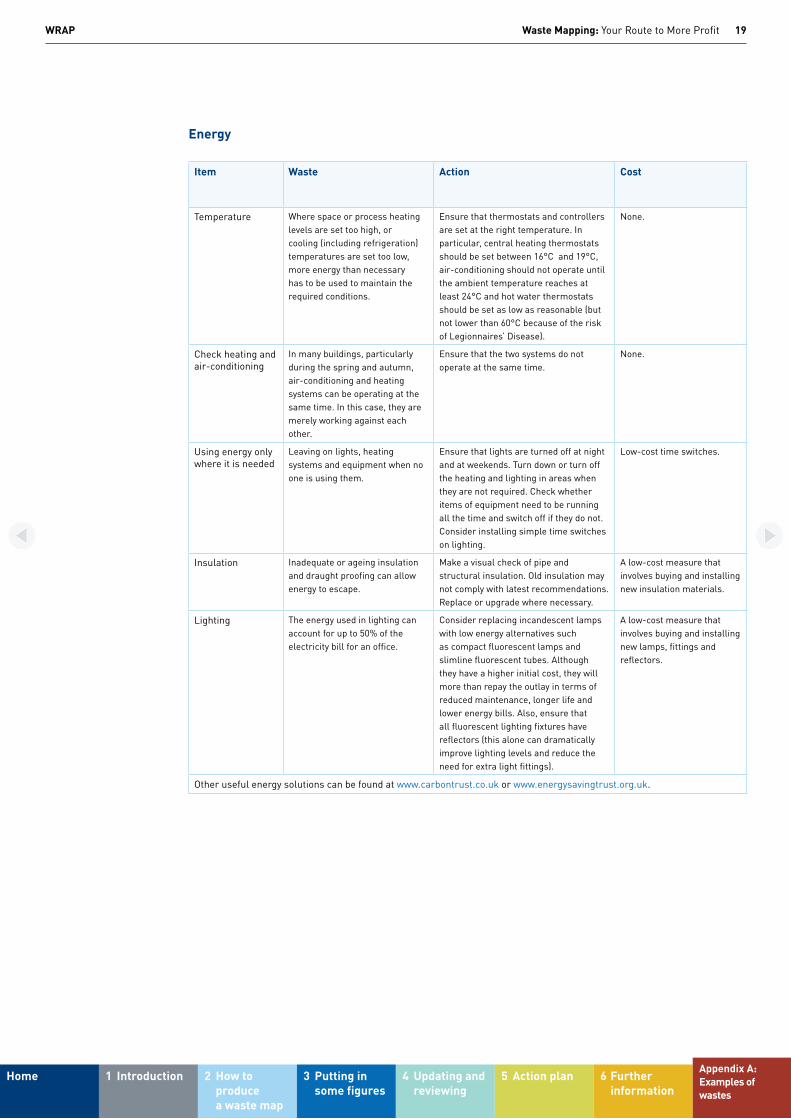
Item Waste Action Cost
Temperature Where space or process heating levels are set too high, or cooling (including refrigeration) temperatures are set too low, more energy than necessary has to be used to maintain the required conditions.
Ensure that thermostats and controllers are set at the right temperature. In particular, central heating thermostats should be set between 16°C and 19°C, air-conditioning should not operate until the ambient temperature reaches at least 24°C and hot water thermostats should be set as low as reasonable (but not lower than 60°C because of the risk of Legionnaires’ Disease).
None.
Check heating and air-conditioning
In many buildings, particularly during the spring and autumn, air-conditioning and heating systems can be operating at the same time. In this case, they are merely working against each other.
Ensure that the two systems do not operate at the same time.
None.
Using energy only where it is needed
Leaving on lights, heating systems and equipment when no one is using them.
Ensure that lights are turned off at night and at weekends. Turn down or turn off the heating and lighting in areas when they are not required. Check whether items of equipment need to be running all the time and switch off if they do not. Consider installing simple time switches on lighting.
Low-cost time switches.
Insulation Inadequate or ageing insulation and draught proofing can allow energy to escape.
Make a visual check of pipe and structural insulation. Old insulation may not comply with latest recommendations. Replace or upgrade where necessary.
A low-cost measure that involves buying and installing new insulation materials.
Lighting The energy used in lighting can account for up to 50% of the electricity bill for an office.
Consider replacing incandescent lamps with low energy alternatives such as compact fluorescent lamps and slimline fluorescent tubes. Although they have a higher initial cost, they will more than repay the outlay in terms of reduced maintenance, longer life and lower energy bills. Also, ensure that all fluorescent lighting fixtures have reflectors (this alone can dramatically improve lighting levels and reduce the need for extra light fittings).
A low-cost measure that involves buying and installing new lamps, fittings and reflectors.
Other useful energy solutions can be found at www.carbontrust.co.uk or www.energysavingtrust.org.uk.
Energy

Waste Mapping: Your Route to More ProfitWRAP 20
Home 1 Introduction 2 How to produce a waste map
3 Putting in some figures
4 Updating and reviewing
5 Action plan 6 Further information
Appendix A: Examples of wastes
www.wrap.org.uk/brehub
While we have tried to make sure this guide is accurate, we cannot accept responsibility or be held legally responsible for any loss or damage arising out of or in connection with this information being inaccurate, incomplete or misleading. This material is copyrighted. You can copy it free of charge as long as the material is accurate and not used in a misleading context. You must identify the source of the material and acknowledge our copyright. You must not use material to endorse or suggest we have endorsed a commercial product or service. For more details please see our terms and conditions on our website at www.wrap.org.uk
We hope that you have found this guide helpful on your route to greater resource efficiency. Don’t forget that WRAP is here to help you to improve resource efficiency. Visit the website at www.wrap.org.uk or contact the WRAP Resource Efficiency Helpline on 0808 100 2040.
Waste & ResourcesAction Programme
The Old Academy21 Horse FairBanbury, OxonOX16 0AH
Tel: 01295 819 900Fax: 01295 819 911Email: [email protected]
Resource Efficiency Helpline:0808 100 2040
March 2013