business research division - colorado brewers guild
TRANSCRIPT

COLORADO BREWERS GUILD Craft Brewers Industry Overview and Economic Impact 2012 and 2013
BUSINESS RESEARCH DIVISION Leeds School of Business
University of Colorado at Boulder 420 UCB
Boulder, CO 80309-0420 leeds.colorado.edu/brd
March 2014

This page intentionally left blank.

Business Research Division │ Leeds School of Business │ University of Colorado Boulder i
TABLE OF CONTENTS Table of Contents ........................................................................................................................................... i List of Tables .................................................................................................................................................. i Executive Summary ....................................................................................................................................... 1 Project Overview ........................................................................................................................................... 2 Methodology ................................................................................................................................................. 2 Definitions ..................................................................................................................................................... 2 History of Brewing in Colorado ..................................................................................................................... 3 Survey Results ............................................................................................................................................... 4
Employment, Benefits, and Wages........................................................................................................... 4 Revenues .................................................................................................................................................. 5 Expenses ................................................................................................................................................... 5
Economic Impact ........................................................................................................................................... 6 Factors Impacting Growth ............................................................................................................................ 7 Additional Community Benefits .................................................................................................................... 8 Conclusion ..................................................................................................................................................... 9 Bibliography ................................................................................................................................................ 10 Appendix 1: Renegade Brewing Company Case Study ............................................................................... 12
LIST OF TABLES Table 1: Expected Growth ............................................................................................................................. 4 Table 2: Craft Brewer Benefits ...................................................................................................................... 5 Table 3: Economic Impacts, 2012 ................................................................................................................. 6 Table 4: Economic Impacts, 2013 ................................................................................................................. 6 Table 5: Colorado Beer Excise Tax ................................................................................................................ 7 Table 6: Factors Influencing Brewery Growth .............................................................................................. 8 Table 7: Factors Inhibiting Growth ............................................................................................................... 8

Business Research Division │ Leeds School of Business │ University of Colorado Boulder 1
EXECUTIVE SUMMARY Colorado remains at the forefront of the craft brewing industry, ranking among the top states for number of breweries, per capita production, economic impacts, and favorable excise taxes. The Colorado Brewers Guild identified 232 craft brewers in the state in 2013, marking 109% growth in the number of breweries since the recession ended in 2009. By count, Colorado ranks third for breweries, behind only California and Washington. In terms of state excise taxes on production, Colorado is tied for fourth-lowest nationally. Craft breweries, and especially brewpubs, are inherently labor intensive, making the enterprises fundamentally local. While labor, as an input cost, is sourced 100% locally, only a fraction of other inputs are purchased in Colorado—weighted by production, less than 5% of hops are sourced within the state. Nonetheless, the brewery supply chain is integrated in Colorado, be it producers or wholesales facilitating the purchase and transfer of raw materials for beverage manufacturing. The industry is fragmented by size; some small brewers have little reach throughout the state, while others are on such a growth trajectory that they cannot meet current national demand. Regardless of size, sales, brand recognition, and expansion plans, all industry players have an important role in Colorado’s culture and economy. This study quantifies the economic impacts of the craft brewing industry on the state of Colorado, including both breweries and brewpubs. The report details the direct, indirect, and induced economic impacts in terms of output, employment, and income. Primary data were collected from the craft brewers in an online survey. Through the buying and selling of goods in Colorado, the industry recorded total economic benefits of $704 million in 2012, growing to $826 million in 2013. Converting mostly raw materials inputs such as hops and water into the craft beers sold domestically and internationally, the industry tallied $249 million in direct value added in 2013. In 2012 and 2013, an estimated 4,493 and 5,014 people worked in the brewery and restaurant sides of the business. Industry wages averaged $26,518 in 2012 and $27,084 in 2013, partially lowered by the part-time nature of restaurant jobs and the ramping up phase of start-up breweries, and many brewers offer employee benefits. In addition to the economic benefits that include employee wages and the buying and selling of goods in Colorado, survey responses indicate that, as a whole, craft brewers and brewpubs are very active philanthropists in their respective communities. More than 90% of brewers reported participating in fund raising and charitable events, and more than 60% indicated employee volunteerism. Respondents have volunteered or given charity money to a wide variety of causes and groups, ranging from Habitat for Humanity to aid following Colorado’s 2013 natural disasters. While these contributions are largely intangible and cannot fully be quantified, they reveal Colorado craft brewers’ and brewpubs’ continued participation in, and commitment to, their local community. More than 52% of respondents project growth in excess of 20% in 2014, and every company expects to grow this year. Despite this growth, brewers ranked factors that could inhibit or could influence growth. The factor that brewers indicated would most encourage business expansion today is lower taxes, followed by financing, increased market access, and less regulation. High ranking factors that brewers indicated would inhibit growth include the cost of brewery equipment, the cost of employees, competition, and commodity prices.

Business Research Division │ Leeds School of Business │ University of Colorado Boulder 2
PROJECT OVERVIEW
The Business Research Division conducted a study of the economic impacts of the craft brewing industry in Colorado in 2012. This study provides an update of the economic impacts of an industry that is in flux and quickly adding breweries. The report quantifies the economic contributions related to craft brewing in the state of Colorado by collecting publicly available secondary data and primary data obtained from a survey of Colorado brewers, primarily Colorado Brewers Guild members. This study estimates direct industry sales, employment, average wages, and fiscal impacts. Input-output analysis is used to illustrate the supply chain impacts of the industry and demonstrates the scope and reach of the industry within the state. This study does not include the large international brewers located in the state.
METHODOLOGY This study was conducted in cooperation with the Colorado Brewers Guild and with dozens of craft brewers across the state of Colorado. Economic impacts on Colorado were estimated by examining data provided on revenues, operating expenditures, employee salaries and benefits, and production in the state. This approach accounted for the leakage that occurs when brewers and brewpubs make purchases outside the state. Furthermore, this study estimated the multiplicative impacts of direct expenditures on other industries in the economy through input-output modeling by using IMPLAN, a widely used economic modeling software. Intangible benefits, including community service, charitable giving, and fund-raisers, are described to illustrate additional community benefits derived from the presence of craft brewers, but are not directly quantified when determining the overall economic contribution. Data requests were made directly to craft brewers and brewpubs in order to obtain information on revenue, expenditures, employment, salaries, benefits, and production, as well as factors that influence or deter growth. Information was collected through an online survey sent directly to points-of-contact within each brewery. Additional information was gathered from other public and private sources to verify and augment data. Revenues and expenditures were split by license (brewing or brewpub) and entered into the IMPLAN model by respective function (brewing, food and beverage stores).
DEFINITIONS Gross Domestic Product (GDP): A measure of economic activity, GDP is the total value added by resident producers of final goods and services.
Gross Output (Output): The total value of production is gross output. Unlike GDP, gross output includes intermediate goods and services.
Value Added: The contribution of an industry or region to total GDP, value added equals gross output, net of intermediate input costs.
Company: Includes all establishments under the same responding parent entity.
Establishment: Refers to individual company locations.

Business Research Division │ Leeds School of Business │ University of Colorado Boulder 3
HISTORY OF BREWING IN COLORADO Colorado has a long brewing history, with breweries dating back to 1859—before Colorado was a state. Brewing grew as miners, farmers, and ranchers made the territory home. The number of breweries expanded across the state and barrelage increased. Pre-prohibition, the number of breweries peaked in 1875 at 58 breweries. In 1916, Prohibition made breweries obsolete in Colorado. Five Colorado breweries survived an 18-year period without selling beer. Alternatives like ice, ice cream, ceramics and malted milk products were made instead. Prohibition was repealed in 1933.
Nonetheless, the decline of breweries continued a slow descent to one brewer in 1976.1 In 1988, Carver Brewing Company in Durango and Wynkoop Brewing Company in Denver began brewing beer and selling it in their attached restaurant. A brewpub industry segment was born in Colorado. In 1995, a Colorado brewpub license was created, blending aspects of a traditional brewery, restaurant, and beer wholesaler. The industry has been rapidly building breweries, growing to 232 licenses in 2013.2 The 1990s and the 2000s experienced profound growth in breweries, and this trend has accelerated in the 2010s. This growth in breweries is by and large craft brewers.
FIGURE 1: COLORADO BREWER GROWTH, 1859-2013
Colorado’s beer industry, by law, operates under a three-tier system that includes legally separate manufacturers, distributors, and retailers for the production, distribution, and sales of beer and other alcoholic beverages. This study examines the craft brewers within the first tier; thus, this study does not directly examine distribution or sales, which alone account for thousands of employees and millions of dollars in economic activity.
Along with the industry impacts that range from agriculture and manufacturing to marketing, transportation, and sales, the industry plays a role in tourism in the state. Visitors tour Colorado breweries, as well as take part in the Great American Beer Festival, which boasts the nation’s largest and oldest gathering of brewers and 50,000 visitors annually.
1Excluding prohibition. 2Not all licenses represent an active operating brewery. Some breweries have been issued licenses, but were not active in 2012 or 2013.

Business Research Division │ Leeds School of Business │ University of Colorado Boulder 4
SURVEY RESULTS The Business Research Division received survey responses from 61 brewers and brewpubs representing 82 locations in Colorado. Of the 61 returned surveys, two-thirds reported being licensed with the Colorado Liquor Enforcement Division as a brewery and one-third, brewpub. In Colorado, the number of manufacturing breweries only slightly outnumber brewpubs. Most beer was reportedly packaged in bottles (52%), followed by kegs (33.1%), cans (14.4%), and growlers (0.5%). Colorado craft brewers are largely serving the Colorado market—only 26.2% ship outside the state, and 16.4% ship internationally. The shipping craft brewers who did report domestic exports collectively identified 48 states as destinations. Colorado, like the nation, has seen a rapid increase in the number of craft brewers in recent years. Survey respondents illustrate this rapid increase—more than 69% of responding companies formed over the past 10 years. More than 52% of respondents project growth in excess of 20% in 2014, and every company expects to grow this year.
TABLE 1: EXPECTED GROWTH
Percentage Growth Respondents
<0 0.0%
0-5% 9.8%
5-10% 16.4%
10-15% 14.8%
15-20% 6.6%
>20% 52.5%
EMPLOYMENT, BENEFITS, AND WAGES Colorado breweries and brewpubs employed an estimated 4,493 workers in 2012, paying nearly $119 million in total wages. This averages to $26,518 per employee, diluted by the many restaurant and bartender jobs that are less than full time. In 2013, the industry recorded 5,014 workers earning $136 million, or $27,084 per worker. The bulk of employment is concentrated in the largest firms—31 establishments have more than 60 employees and represent 56% of total sector employment. Ninety firms have 20 or fewer employees (including firms with only 1 employee), representing 12% of employment. Mid-size firms (21-60 employees) account for the remaining 32% of employment. Wages, too, are concentrated in large firms. Wages in the largest size class (more than 60 employees) averaged $31,908 in 2012. Wages in the medium- and small-size class averaged $20,617 and $17,463, respectively. More than 56% of responding brewers and brewpubs offer employee benefits. Of the respondents indicating employee benefits, 85.3% offer health insurance, 70.6% paid annual leave, and 64.7% dental insurance. However, other benefits, such as dental, retirement, life insurance, and disability, are

Business Research Division │ Leeds School of Business │ University of Colorado Boulder 5
available less frequently to employees. Beyond traditional benefits, additional noted benefits range from ski passes and beer allowances to eco passes and profit sharing.
TABLE 2: CRAFT BREWER BENEFITS
Benefit Percentage
Health Insurance 85.3% Paid Annual Leave 70.6% Dental Insurance 64.7% Paid Sick Leave 47.1% Retirement 41.2% Life Insurance 38.2% Short-Term Disability 26.5% Long-Term Disability 23.5%
REVENUES Of the 52 craft breweries reporting revenues for 2013, average Colorado revenues per employee were $59,124. Differentiating by size class, the smallest size class averaged $81,590, the medium-size class averaged $54,119, and the largest size class averaged $57,543. Large brewers also the largest exporters (domestic and international), both in absolute and percentage terms. Large brewers estimated that more than half of their revenue come from sales outside Colorado, while for medium producers this percentage is 23%, and for small producers, 10%. Medium producers represent many of the state’s brewpubs. Brewer respondents indicated that 95% of industry revenue is derived from brewing, followed by restaurant sales, other alcohol, merchandise, and other.
EXPENSES Of the 61 breweries reporting expenses, average Colorado expenses per employee were $59,934. These, too, differed by size class, with the smallest size class averaging $40,191, the medium-size class averaging $60,197, and the largest size class averaging $62,001. Extrapolating these expenses to the entire sector yields Colorado expenditures totaling $246 million in 2013.
Business Research Division │ Leeds School of Business │ University of Colorado Boulder 6
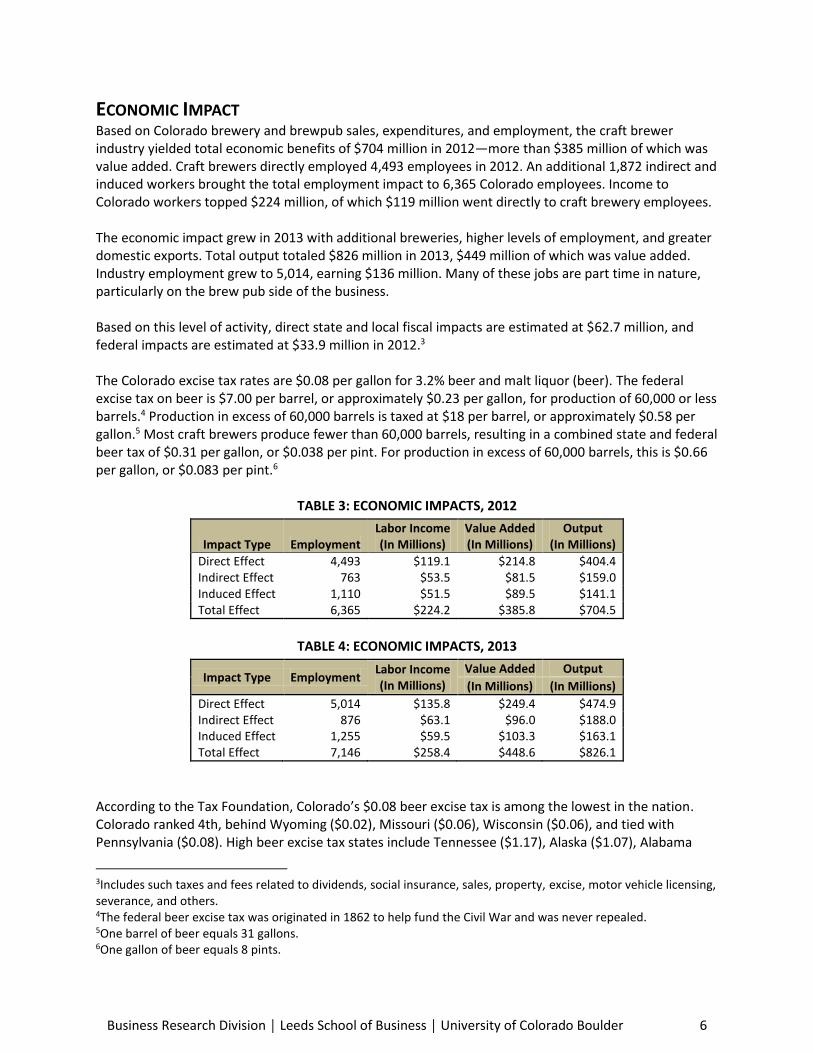
ECONOMIC IMPACT Based on Colorado brewery and brewpub sales, expenditures, and employment, the craft brewer industry yielded total economic benefits of $704 million in 2012—more than $385 million of which was value added. Craft brewers directly employed 4,493 employees in 2012. An additional 1,872 indirect and induced workers brought the total employment impact to 6,365 Colorado employees. Income to Colorado workers topped $224 million, of which $119 million went directly to craft brewery employees. The economic impact grew in 2013 with additional breweries, higher levels of employment, and greater domestic exports. Total output totaled $826 million in 2013, $449 million of which was value added. Industry employment grew to 5,014, earning $136 million. Many of these jobs are part time in nature, particularly on the brew pub side of the business. Based on this level of activity, direct state and local fiscal impacts are estimated at $62.7 million, and federal impacts are estimated at $33.9 million in 2012.3 The Colorado excise tax rates are $0.08 per gallon for 3.2% beer and malt liquor (beer). The federal excise tax on beer is $7.00 per barrel, or approximately $0.23 per gallon, for production of 60,000 or less barrels.4 Production in excess of 60,000 barrels is taxed at $18 per barrel, or approximately $0.58 per gallon.5 Most craft brewers produce fewer than 60,000 barrels, resulting in a combined state and federal beer tax of $0.31 per gallon, or $0.038 per pint. For production in excess of 60,000 barrels, this is $0.66 per gallon, or $0.083 per pint.6
TABLE 3: ECONOMIC IMPACTS, 2012
Impact Type Employment Labor Income (In Millions)
Value Added (In Millions)
Output (In Millions)
Direct Effect 4,493 $119.1 $214.8 $404.4 Indirect Effect 763 $53.5 $81.5 $159.0 Induced Effect 1,110 $51.5 $89.5 $141.1 Total Effect 6,365 $224.2 $385.8 $704.5
TABLE 4: ECONOMIC IMPACTS, 2013
Impact Type Employment Labor Income (In Millions)
Value Added Output
(In Millions) (In Millions)
Direct Effect 5,014 $135.8 $249.4 $474.9 Indirect Effect 876 $63.1 $96.0 $188.0 Induced Effect 1,255 $59.5 $103.3 $163.1 Total Effect 7,146 $258.4 $448.6 $826.1
According to the Tax Foundation, Colorado’s $0.08 beer excise tax is among the lowest in the nation. Colorado ranked 4th, behind Wyoming ($0.02), Missouri ($0.06), Wisconsin ($0.06), and tied with Pennsylvania ($0.08). High beer excise tax states include Tennessee ($1.17), Alaska ($1.07), Alabama
3Includes such taxes and fees related to dividends, social insurance, sales, property, excise, motor vehicle licensing, severance, and others. 4The federal beer excise tax was originated in 1862 to help fund the Civil War and was never repealed. 5One barrel of beer equals 31 gallons. 6One gallon of beer equals 8 pints.

Business Research Division │ Leeds School of Business │ University of Colorado Boulder 7
($1.05), and Georgia ($1.01)—the only four states in excess of $1. The Colorado Department of Revenue reports alcoholic beverage excise taxes and license fees for 3.2% beer and “repeal” beer (i.e., full strength beer). For fiscal year 2013, 3.2% beer taxes totaled $374,155 and repeal beer totaled $8.5 million for a combined total of more than $8.8 million. These taxes are generated from the entire beer industry, not just craft brewers. According to the Colorado Department of Revenue, Division of Taxation, the excise tax is applied to beer that is sold from a manufacturer to a licensed wholesaler or a consumer in the state.
TABLE 5: COLORADO BEER EXCISE TAX
Tax FY2007 FY2008 FY2009 FY2010 FY2011 FY2012 FY2013
3.2% Beer Tax $582,595 $571,021 $438,158 $413,657 $478,445 $463,382 $374,155 Full Strength Beer Tax 8,146,423 8,289,409 8,711,253 8,186,066 8,514,422 8,436,052 8,466,726
Total $8,729,018 $8,860,430 $9,149,411 $8,599,723 $8,992,867 $8,899,434 $8,840,881
Source: Colorado Department of Revenue, Liquor Enforcement Division (LED).
Low beer excise taxes does not necessarily equate to more breweries. The lowest tax states ranked 39th (Wyoming), 18th (Missouri), and 7th (Wisconsin) in the number of breweries. The highest tax states ranked 21st (Tennessee), 31st (Alaska), 40th (Alabama), and 27th (Georgia) in the number of breweries.
FACTORS IMPACTING GROWTH Two policy-minded questions were included in the survey of companies. These asked about factors that influence growth and factors that inhibit growth. By ranking responses, the breweries implicitly expressed preferences for agents of growth. Many of these factors align with national sentiments of small businesses, while other high-ranking factors illustrate issues that relate specifically to this industry in Colorado. The primary factor that brewers indicated would most encourage business expansion today included lower taxes. In addition to business taxes imposed on all businesses in the state, brewers face a federal and state excise tax on beer production. The combined federal and state excise tax totals just over $0.083 per pint of beer. The state income tax rate is 4.63% for individuals and business, though effective tax rates tend to be lower than 4.63%. The average county mill levy, including county, city, school district, and special district, was 77.685 mills in 2012. 7 Colorado sales taxes are shared between the state, counties, cities, and special districts, and can reach rates in excess of 8%, depending on the location in Colorado. In Broomfield, the rate is 8.25%. For Denver, the rate is 7.62%, while it is 7.63% in Colorado Springs. Rates on food for home consumption differ by local area. Other high-ranking factors that would encourage growth include increased access to financing, increased market access, and decreased regulation. Comparatively, a monthly survey of small businesses conducted by the National Federation of Independent Business (NFIB) finds that two factors tied second for the single-most important problem: (1) taxes and (2) government requirements and red tape. For Colorado brewers, regulation ranked sixth. The cost of brewery equipment, access to labor, increased competition, and high commodity prices all ranked high as business inhibitors. Labor appears to be a factor that is unique to this industry as only 4%
7$77.685 per $1,000 in assessed value.

Business Research Division │ Leeds School of Business │ University of Colorado Boulder 8
of business owners in the NFIB survey cited cost of labor and 8% cited quality of labor as the single most important business problem.
TABLE 6: FACTORS INFLUENCING BREWERY GROWTH
Influencing Factors Rank
Lower taxes 1 Increased access to financing 2 Increased market access 3 Decreased regulation 4 Increased access to distribution channels 5 State support for craft brewing industry 6 Tourism 7 State support for craft brewing tourism 8 Lower fuel costs 9 Increased hop production in Colorado 10
TABLE 7: FACTORS INHIBITING GROWTH
Inhibiting Factors Rank
Cost of brewery equipment 1 Cost of employees 2 Increased competition 3 High commodity prices (e.g., hops, barley, fuel, etc.) 4 Lack of access to capital 5 Cumbersome regulations 6 Federal brewer excise tax 7 Complex distribution channels 8 State brewer excise tax 9 Lack of market access 10
ADDITIONAL COMMUNITY BENEFITS Colorado craft brewers and brewpubs were asked to describe their participation in community nonprofit organizations and events, including charitable donations and volunteer activities. Brewers that reported a dollar amount in charitable donations indicated giving more than $1.4 million in gifts, a $200,000 spike in reported donations from the previous survey. Few breweries even reported giving a percentage of tap room sales or a percentage of total tips toward charitable donations. Nearly, 93.4% of brewers reported giving to charity organizations, 91.8% reported participating in fund-raising events, and 62.3% reported in engaging in volunteerism. Survey responses indicate that, as a whole, craft brewers and brewpubs are very active philanthropists in their respective communities. Respondents volunteer or give charity money to a wide variety of causes and groups. Respondents anecdotally reported community engagement most often through Habitat for Humanity, with seven respondents indicating they directly send employees to build houses while others make direct charitable donations. Other charitable activities included sponsoring community art groups, sponsoring local dinners for the homeless, organizing a Turkey Trot to support the United Way, fundraising for local civic groups and disease groups like Movember, and donating to local food banks.

Business Research Division │ Leeds School of Business │ University of Colorado Boulder 9
Sponsorship of local festivals and events were also frequently noted. Festivals are often accompanied by live music, a related cause for which proceeds could be donated, food, and beer. One brewery noted Broomfield Days, an event that brought 23,000 people together in the community to raise funds for Broomfield’s Chamber of Commerce. Another brewery sponsored a community bike race, dubbed G’Knight, to help promote cycling in the community. Additionally, employees of craft brewers and brewpubs serve in a number of community and civic groups, volunteering their time and expertise outside of work. One responding company indicated that its employees volunteered more than 2,400 hours in the local community. Most notably, when many people throughout the state were impacted by natural disasters in 2013, local breweries and brewpubs were quick to provide generous aid. One responded reported an $86,000 donation toward flood relief. Others reported donating money for damaged local schools, offering brew space, and distributing free merchandise to those who were affected by the Colorado natural disasters in 2013. While these contributions are largely intangible and cannot fully be quantified, they reveal Colorado craft brewers’ and brewpubs’ continued participation in, and commitment to, their local community. To illustrate the community impacts of breweries, Appendix 3 includes a case study on Renegade Brewing Company located in the Art District on Santa Fe in Denver.
CONCLUSION Craft brewers are a source of economic benefits totaling $704 million in output in 2012 and $826 million in 2013, disbursed throughout Colorado’s urban cities and rural communities. More than 57% of this is in direct brewer and brewpub economic activity. Direct industry employment totaled 4,493 in 2012 and 5,014 in 2013, and wages totaled an estimated $119 million and $136 million, respectively. While wages average less than the average for all industries in Colorado, the less-than-full-time nature of many of these jobs dilutes average wages. Nonetheless, many brewers offer employee benefits, ranging from the traditional (health, dental, etc.) to the creative benefits that speak to the culture of the state and industry (beer, ski passes, EcoPasses, etc.). Additionally, brewers continue to be a growing and thriving contributor to the economy and to their respective communities through donations, volunteerism, and special events.

Business Research Division │ Leeds School of Business │ University of Colorado Boulder 10
BIBLIOGRAPHY Beer Institute. Economic Impact, http://www.beerinstitute.org/br/economic-impact. Accessed
November 8, 2013. ____________. Beer Statistics, http://www.beerinstitute.org/br/beer-statistics/latest-statistics.
Accessed November 8, 2013. ____________. June 2011. Brewers Almanac, 2011. http://www.beerinstitute.org/statistics.asp?sid=2.
Accessed January 27, 2012. Brewers Association. 2013. Brewers Association Economic Impact Study,
http://www.brewersassociation.org/attachments/0001/3790/State_by_State_Data.pdf. Accessed January 8, 2014.
____________. 2013. Total Economic Impact 2012, State by State Data,
http://www.brewersassociation.org/attachments/0001/3790/State_by_State_Data.pdf. Accessed January 8, 2014.
Colorado Department of Local Affairs, Division of Property Taxation. 2012 Annual Report.
http://www.colorado.gov/cs/Satellite?c=Page&childpagename=DOLA-Main%2FCBONLayout&cid=1251643401743&pagename=CBONWrapper. Retrieved January 19, 2014.
Colorado Department of Revenue, Division of Taxation. Publication FYI Excise 12, Colorado Alcohol
Beverage Wholesalers and Manufacturers. http://www.colorado.gov/cs/Satellite?c=Document_C&cid=1178305425745&pagename=Revenue%2FDocument_C%2FREVXAddLink. Retrieved December 15, 2013.
Colorado Department of Revenue. “Revenue Online.” https://www.colorado.gov/revenueonline/#2.
Retrieved January 25, 2014. Colorado Department of Revenue. 2011 Annual Report. July 1, 2010 - June 30, 2011.
http://www.colorado.gov/cs/Satellite/Revenue-Main/XRM/1213867975035. Retrieved February 3, 2014.
Colorado Department of Revenue. 2011 Annual Report. July 1, 2011 - June 30, 2012.
http://www.colorado.gov/cs/Satellite/Revenue-Main/XRM/1213867975035. Retrieved February 3, 2014.
Colorado Department of Revenue. 2013 Annual Report. July 1, 2012 - June 30, 2013.
http://www.colorado.gov/cs/Satellite/Revenue-Main/XRM/1213867975035. Retrieved February 3, 2014.
Combrink, Tom, Cheryl Cothran, and Jeff Peterson. January 2012. Economic Contributions of the Craft
Brewing Industry to the State of Arizona. The W.A. Franke College of Business, Northern Arizona University.

Business Research Division │ Leeds School of Business │ University of Colorado Boulder 11
John Dunham & Associates. March 2013. The Beer Institute Economic Contribution Study, Methodology
and Documentation. http://beer.guerrillaeconomics.net/assets/site/res/2012%20BSA%20Economic%20Impact%20Methodology.pdf. Accessed November 7, 2013.
Marturana, Michael and Martin Shields. 2011. The Economic Impacts of Breweries on Larimer County.
Fort Collins: Regional Economics Institute, Colorado State University. Metzger, Scott. July 2012. Economic Impact of the Texas Craft Brewing Industry 2012 Annual Update.
http://www.texascraftbrewersguild.org/download/TX_Craft_Beer_Economic_Impact_2011_STUDY.pdf. Accessed November 8, 2013.
National Beer Wholesalers Association. March 2011. “New Study Shows Beer Industry Contributes $33.2
Billion Annually to California Economy.” PRNewswire. http://www.prnewswire.com/news-releases/new-study-shows-beer-industry-contributes-332-billion-annually-to-california-economy-117604543.html. Accessed January 27, 2012.
National Federation of Independent Business. February 2014. National Small Business Economic Trends.
http://www.nfib.com/surveys/small-business-economic-trends/. Retrieved February 16, 2014. National University System Institute for Policy Research. 2013[?]. The Economic Impact of Craft
Breweries in San Diego. La Jolla, California. Oregon Craft Beer. Economic Impact, Oregon Craft Beer Facts – Updated 01/25/2014.
http://oregoncraftbeer.org/oregon-beer/economic-impact/. Accessed November 8, 2013. Richey, David. 2012. California Craft Brewing Industry: An Economic Impact Study. University of
California Berkeley: Goldman School of Public Policy. Sorenson, Colin B., Todd A. Morgan, and Shannon Furniss. 2012. “The Economic Impact of Craft Brewing
in Montana,” Montana Business Quarterly, Winter, pp. 2-9. Tax Foundation. State Beer Excise Tax Rates, 2009-2013. http://taxfoundation.org/article/state-beer-
excise-tax-rates-2009-2013. Retrieved, February 14, 2014. Texas Craft Brewers Guild. Economic Impact Study, Economic Impact of Texas Craft Beer Tops $608
Million in 2011, Could Reach $5.6 Billion Within the Decade, http://www.texascraftbrewersguild.org/economic-impact-study/. Accessed November 8, 2013.
U.S. Department of the Treasury, Alcohol and Tobacco Tax and Trade Bureau. Taxes and Fee Rates.
http://www.ttb.gov/tax_audit/atftaxes.shtml. Retrieved February 2014. Washington Beer Commission. 2012 Annual Report. Shoreline, Washington.

Business Research Division │ Leeds School of Business │ University of Colorado Boulder 12
APPENDIX 1: RENEGADE BREWING COMPANY CASE STUDY The following case study describes the community impacts of Renegade Brewing Company in the Art District on Santa Fe in Denver, Colorado.

Stretching from Grand Junction to
Colorado’s Front Range and from Rifle
to Durango on the Western Slope, the
craft brewing portion of Colorado’s
beverage manufacturing industry has
a $700 million economic impact on the
state’s economy. The business takes
many forms, distinguished by varying
models of production, sales, packaging,
and distribution. Nationally, 191.6 million
barrels of beer were manufactured in the
United States in 2013.1 Colorado recorded
nearly 3.6 million taxable barrels that year,
produced by both craft brewers and the
large domestic producers.2 Renegade
Brewing Company is among 232 brewing
licensees in 2013, accounting for about
1,300 barrels.
This case study is based on an interview with Brian O’Connell, founder of Renegade Brewing Company and Chairman of the Membership Committee for the Colorado Brewers Guild. For more information on Renegade Brewing Company, visit www.renegadebrewing.com/.
After earning a master’s degree and working in various research capacities, including with the University of Colorado, Brian O’Connell founded Renegade Brewing Company in 2011. The brewery is experiencing exponential growth, and O’Connell aspires to be a regional brewery one day that remains principally active in the local community. The brewing company and the related Renegade Publik House restaurant now contribute 23 jobs to the Colorado economy.
Renegade ProgramLicensed as a manufacturing brewer with the Colorado Liquor Enforcement Division (LED), Renegade Brewing Company creates craft brews on location in Denver. The license allows for direct sales through a taproom and for distribution within the state. Packaged in cans, bottles, growlers, and kegs, Renegade craft beer is currently sold up and down the Front Range, from Fort Collins to Colorado Springs.
O’Connell’s creativity helps inspire the beer innovations. This ingenuity helped create Hammer and Sickle, which is a Great American Beer Festival winner, as well as the lesser known Berbere, an imperial chocolate stout brewed with Ethiopian curry. O’Connell’s passion and respect for the industry are ever-present in the conversation.
Renegade Brewing Company925 W. 9th AvenueDenver, CO 80204
www.renegadebrewing.com

Supply ChainAlthough Colorado has a long history and culture of brewing, the state’s climate isn’t necessarily ideal for growing many of the brewing inputs. Many of Renegade’s ingredients are supplied regionally, including grains, malt, hops, and yeast. Other critical factors are inherently local, including utilities, real estate, packaging, distribution, and most critically, the workforce and the customer.
Industry equipment is mostly imported, and other capital-intensive operations are outsourced. For a small company like Renegade, being able to operate without all of the expensive capital investments is critical. Longmont-based Mobile Canning Systems, together with CROWN Beverage Packaging cans, provides front-door canning services to the craft brew industry. They pull up a box truck to Renegade’s facility once a week, unload a line canning operation, and work with brewer staff to package product before picking up and going home. Mobile Canning Systems is not a distributor—the finished packaged goods remain in Renegade’s cooler.
WorkforceWhile many of the essential beer ingredients may not be grown in Colorado, the state does supply one of the most critical components of any business—a quality workforce. Some of Renegade’s growing pains were just as much a part of being a startup company as they were about being a brewery. During startup, employees wore multiple hats—being the sales director and cleaning the bathrooms while working for lower pay than the market rate. However, the startup culture draws a young, entrepreneurial crowd. An upside of being a more mature company means that Renegade is now able to clearly define positions within the business, articulate benefits, and provide the kind of structured processes that did not exist two years ago, such as vacation leave.
CommunityThe company is just one example of urban revitalization spreading through Denver neighborhoods. Taking a building back to its beverage manufacturing roots, Renegade operates out of a historic warehouse in Denver that dates back to a Dr. Pepper and Orange Crush bottling plant in the first half of the twentieth century. Over the years the building became vacant, covered in graffiti. Renegade revitalized the building while preserving the heritage of brick and exposed trusses.
Located within Denver’s Art District on Santa Fe, Renegade is immersed within a creative culture where people are adventurous and like to try new things. The creativity that transcends the art and craft brewing worlds collides when Renegade provides beverages during local art gallery shows.

Challenges and OpportunitiesRenegade’s startup challenges were mostly regulatory in nature, navigating the federal, state, and local permitting agencies, including the TTB, the LED, and the City and County of Denver Development Services.
Challenges abound for breweries and startup companies, ranging from raising capital to planning for future growth. O’Connell describes the difficulty in raising money, starting with friends and family and excluding banks. Growing organically, Renegade has strived to meet increasing demand with resources within its immediate reach—which sometimes means the company is playing catch-up by the time equipment is ordered, built, and delivered. The risk is not having enough supply to fill the critical
shelf space offered by retailers or requested by customers.
Self-distribution has kept prices low and in spite of using this model Renegade’s products are available along the Front Range from Fort Collins to Colorado Springs. However, contracting out that side of the business will soon allow the company to extend its reach while focusing on its core business.
Parting WordsO’Connell advises newcomers to the industry to take a few more risks than he took when it comes to raising and spending money. Given that the industry is a proven concept, he suggests spending funds wisely in areas that help make a quality brew and investing in business components (e.g., the right equipment, good equipment) that help drive cash flow.
Illustrating the camaraderie and collaboration inherent in Colorado’s craft brewing industry, two of the first individuals to visit Renegade’s tasting room in 2011 were Todd Usry, brewmaster and director of brewery operations, and Todd Thibault, director of marketing, from neighborhood compatriot Breckenridge Brewing Company. Celebrating 20 years in Colorado, Usry and Thibault invited O’Connell to set up a tent to give away product at Breckenridge’s anniversary party.
Alcohol Regulators
Alcohol and Tobacco Tax and Trade Bureau (TTB) under the Department of the Treasury
Liquor Enforcement Division (LED) under the Colorado Department of Revenue
1 Colorado Department of the Treasury, http://www.ttb.gov/statistics/2013/201312beer.pdf, accessed March 4, 2014.
2 Colorado Department of Revenue Annual Report 2013, converted from the reported 110,511,009 gallons.