business outlook global electronics industry
TRANSCRIPT

Business OutlookGlobal Electronics
Industry(with emphasis on Europe)
Custer Consulting Groupwww.custerconsulting.comJune 2018

2018 SituationAfter strong growth in 2017, expansion has now slowed.
Exchange rates distort global growth calculation. U.S. dollar denominated growth far exceeds Euro denominated growth.
Passive component shortages remain a big problem
Automotive, industrial and Internet of Things are growth drivers.
5G and other disruptive technologies are emerging.
Geopolitical unrest remains very significant.
Trade wars could do major damage.

Industrial Production – World% Change vs. One Year Earlier
Britain + 1.8 AprCzech Republic + 5.5 AprFrance + 2.1 AprGermany + 2.0 AprItaly + 1.9 AprNetherlands + 5.0 AprRussia + 1.0 AprSpain +11.0 AprEuro Area + 1.7 Apr
Canada + 4.9 MarUSA + 3.5 AprChina + 6.8 MayIndia + 4.9 AprMalaysia + 4.5 AprVietnam + 7.1 May Singapore + 9.1 AprS Korea + 0.9 AprTaiwan + 3.1 MarThailand + 4.0 AprJapan + 2.5 Apr
www.economist.com + Eurostat
20180620

Industrial Production – Europe Manufacturing Index (2015 Avg. Month = 100, Seasonally Adjusted)
70
80
90
100
110
120
130
140
Jan-
05
Jul-0
5
Jan-
06
Jul-0
6
Jan-
07
Jul-0
7
Jan-
08
Jul-0
8
Jan-
09
Jul-0
9
Jan-
10
Jul-1
0
Jan-
11
Jul-1
1
Jan-
12
Jul-1
2
Jan-
13
Jul-1
3
Jan-
14
Jul-1
4
Jan-
15
Jul-1
5
Jan-
16
Jul-1
6
Jan-
17
Jul-1
7
Jan-
18
Eur28 Germany France Italy UK
Eurostat
2018061b3
Index
LeadingIndicators
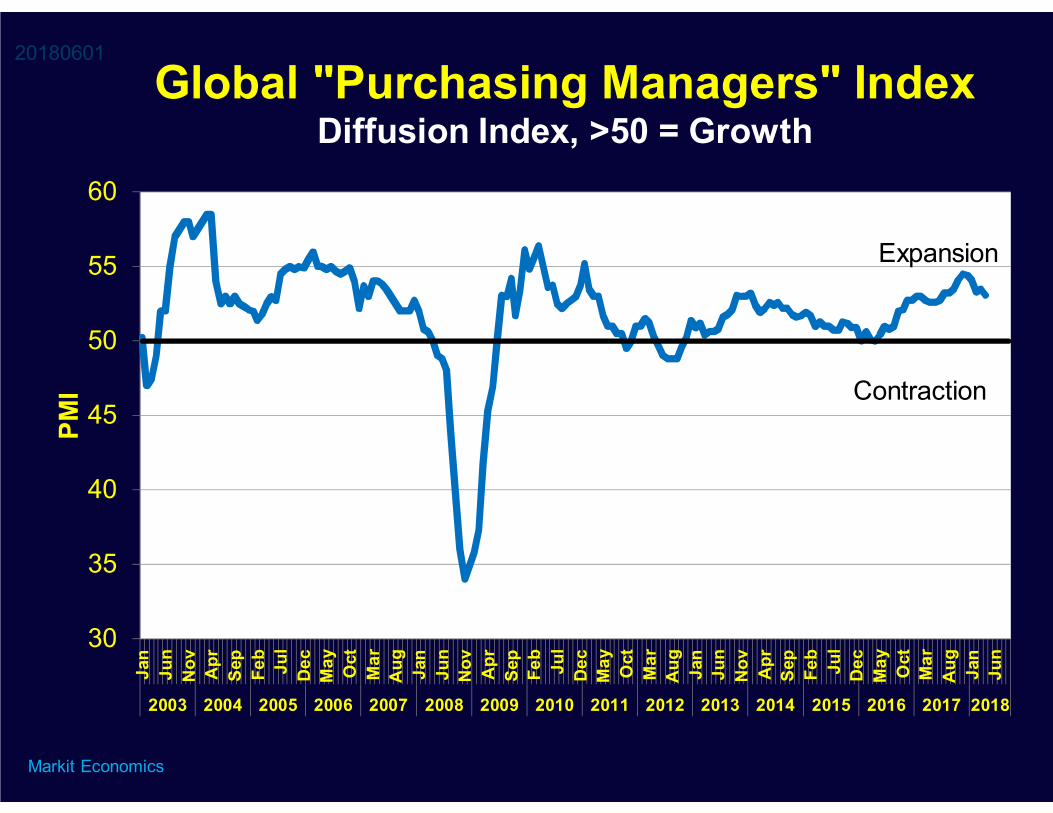
Global "Purchasing Managers" IndexDiffusion Index, >50 = Growth
Markit Economics
30
35
40
45
50
55
60
Jan
Jun
Nov Apr
Sep
Feb
Jul
Dec
May Oct
Mar
Aug Ja
nJu
nN
ov Apr
Sep
Feb
Jul
Dec
May Oct
Mar
Aug Ja
nJu
nN
ov Apr
Sep
Feb
Jul
Dec
May Oct
Mar
Aug Ja
nJu
n
2003 2004 2005 2006 2007 2008 2009 2010 2011 2012 2013 2014 2015 2016 2017 2018
PMI
20180601
Expansion
Contraction

49.8
56.5
55.8
53.4
52.7
54.4
54.4
56.9
55.5
51.3
57.2
54.5
54.4
53.5
53.8
53.9
58.1
56.2
48.0 50.0 52.0 54.0 56.0 58.0 60.0 62.0
Russia
Czech
Sweden
Spain
Italy
France
UK
Germany
Europe
PMI
April
May
European Purchasing Managers' Indices May vs April 2018
Markit Economics
Above 50 = GrowthBelow 50 = Contraction
20180601

Eurozone Manufacturing "Purchasing Managers" Index
Diffusion Index, >50 = Growth
Markit Economics
30
35
40
45
50
55
60
65
Jan
Jul
Jan
Jul
Jan
Jul
Jan
Jul
Jan
Jul
Jan
Jul
Jan
Jul
Jan
Jul
Jan
Jul
Jan
Jul
Jan
Jul
Jan
Jul
Jan
Jul
Jan
Jul
Jan
Jul
Jan
Jul
Jan
Jul
Jan
Jul
Jan
Jul
Jan
Jul
Jan
Jul
Jan
1997199819992000200120022003200420052006200720082009201020112012201320142015201620172018
PMI
20180601

Germany Manufacturing "Purchasing Managers" Index
Diffusion Index, >50 = Growth
Markit Economics
30
35
40
45
50
55
60
65
Jan
Jul
Jan
Jul
Jan
Jul
Jan
Jul
Jan
Jul
Jan
Jul
Jan
Jul
Jan
Jul
Jan
Jul
Jan
Jul
Jan
Jul
Jan
Jul
Jan
Jul
Jan
Jul
Jan
Jul
Jan
Jul
Jan
Jul
Jan
Jul
Jan
Jul
Jan
Jul
Jan
1998 1999 2000 2001 2002 2003 2004 2005 2006 2007 2008 2009 2010 2011 2012 2013 2014 2015 2016 20172018
PMI
20180601

Electronic Equipment
World

World Electronic Equipment ProductionBy Type20180612
0
500
1000
1500
2000
2500
Q1Q3Q1Q3Q1Q3Q1Q3Q1Q3Q1Q3Q1Q3Q1Q3Q1Q3Q1Q3Q1Q3Q1Q3Q1Q3Q1Q3Q1Q3Q1Q3Q1Q3Q1Q3Q1
2000 2001 2002 2003 2004 2005 2006 2007 2008 2009 2010 2011 2012 2013 2014 2015 2016 20172018
industr+instrugov/milComputer & PeripheralsautomotiveconsumerTelecom/DatacomBusiness
1Q’18Weighted avg
For total El Eq +10.8%Annual Rate $B (converted @ fluctuating exchange rates)

Electronic Equipment SuppliersEuro vs. Dollar Growth
20180610
-20-15-10-505
1015202530
Q1Q3Q1Q3Q1Q3Q1Q3Q1Q3Q1Q3Q1Q3Q1Q3Q1Q3Q1Q3Q1Q3Q1Q3Q1Q3Q1Q3Q1Q3Q1Q3Q1Q3Q1
2001 2002 2003 2004 2005 2006 2007 2008 2009 2010 2011 2012 2013 2014 2015 2016 20172018
% G
row
th
US $ Euro
US$ & Euro converted @ fluctuating exchange rate

Exchange Rate Impact on US$ Denominated Consolidated World Electronic Equipment Sales
Quarterly Revenue Growth Converted to US$ @ Fixed 2017 vs Fluctuating Exchange
Global model based on regional shipment indices
20180525
-10
-5
0
5
10
15
20
Q1 Q2 Q3 Q4 Q1 Q2 Q3 Q4 Q1 Q2 Q3 Q4 Q1 Q2 Q3 Q4 Q1
2014 2015 2016 2017 2018
% G
row
th
Fixed Fluctuating
Impact of weakening US$Global growth 7.9% stronger when calculated at fluctuating exchange

Regional DataU.S.
Europe (Eurostat)
JapanChina/Taiwan
S Korea

European Computer, Electronic & Optical Products Production
Eurostat, C26 category, EU 28 countries
20180619
40
50
60
70
80
90
100
110
120
1 6 11 4 9 2 7 12 5 10 3 8 1 6 11 4 9 2 7 12 5 10 3 8 1 6 11 4 9 2 7 12 5 10 3 8 1 6 11 4 9 2 7 12 5 10 3 8 1 6
1998 1999 2000 2001 2002 2003 2004 2005 2006 2007 2008 2009 2010 2011 2012 2013 2014 2015 2016 20172018
???
Index (2010=100), Seasonally Adjusted
Eurostat dataproblem
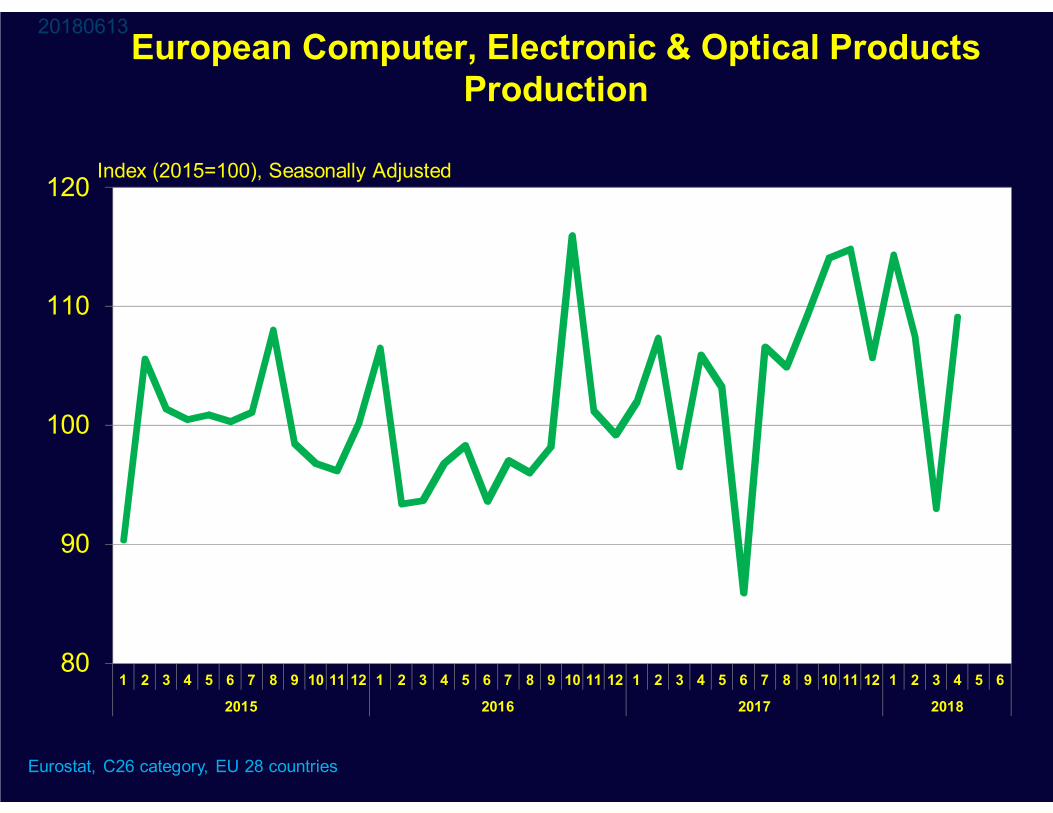
European Computer, Electronic & Optical Products Production
Eurostat, C26 category, EU 28 countries
20180613
80
90
100
110
120
1 2 3 4 5 6 7 8 9 10 11 12 1 2 3 4 5 6 7 8 9 10 11 12 1 2 3 4 5 6 7 8 9 10 11 12 1 2 3 4 5 6
2015 2016 2017 2018
Index (2015=100), Seasonally Adjusted

Taiwan/China Electronic Equipment ProducersComposite of 101 Manufacturers
Consolidated Revenue
Taiwan listed companies, often with significant manufacturing in China
0
200
400
600
800
1000
1200
1 5 9 1 5 9 1 5 9 1 5 9 1 5 9 1 5 9 1 5 9 1 5 9 1 5 9 1 5 9 1 5 9 1 5 9 1 5 9 1 5 9 1 5 9 1 5 9 1 5
2002 2003 2004 2005 2006 2007 2008 2009 2010 2011 2012 2013 2014 2015 2016 2017 2018
May 2018 up 13.7% compared to May 2017 and up 6.7% sequentially compared to April 2018
Total 2017 down 9.2% compared to total 2016
NT$ Billions

S Korea Electronic Equipment ProducersComposite of 7 Manufacturers20170619
40
50
60
70
80
90
100
1 2 3 4 1 2 3 4 1 2 3 4 1 2 3 4 1 2 3 4 1 2 3 4 1 2 3 4 1 2 3 4 1 2 3 4 1
2009 2010 2011 2012 2013 2014 2015 2016 2017 2018
+18.1%
KRW Trillions
Samsung Electronics, LG Electronics, Daewoo Electronic Components, Samsung SDI, Dongbu Hitek, SK Hynix, KEC Corp

U.S. Electronic Equipment Orders & ShipmentsComputer, Communications, Measurement & Control and Military
www.census.gov/indicator/www/m3/
20180604
1416182022242628303234
Jan
Jun
Nov Apr
Sep
Feb
Jul
Dec
May Oct
Mar
Aug Ja
nJu
nN
ov Apr
Sep
Feb
Jul
Dec
May Oct
Mar
Aug Ja
nJu
nN
ov Apr
Sep
Feb
Jul
Dec
May Oct
Mar
Aug Ja
nJu
nN
ov Apr
Sep
Feb
Jul
Dec
May Oct
Mar
Aug Ja
nJu
n
1998 1999 2000 2001 2002 2003 2004 2005 2006 2007 2008 2009 2010 2011 2012 2013 2014 2015 2016 2017 2018
Orders
Shipments
$ Billions (monthly, seasonally adjusted)

2016 World Electronic Equipment Production by Type@2016 Exchange Rates
Henderson Ventures 9/2017
2.1%
21.6 %
11.8%
9.4%23.5%
8.3%
10.3%
13.0%BusinessCommunicationConsumerAutoComputerMilitaryIndustrialInstrument
20171108

World Electronic Equipment Monthly Shipments
Converted @ Fluctuating Exchange Rates
Source: Custer Consulting Group
0
20
40
60
80
100
120
Jan
Jun
Nov Apr
Sep
Feb
Jul
Dec
May Oct
Mar
Aug Ja
nJu
nN
ov Apr
Sep
Feb
Jul
Dec
May Oct
Mar
Aug Ja
nJu
nN
ov Apr
Sep
Feb
Jul
Dec
May Oct
Mar
Aug Ja
nJu
nN
ov Apr
Sep
2002 2003 2004 2005 2006 2007 2008 2009 2010 2011 2012 2013 2014 2015 2016 2017 2018
USAEuropeJapanChinaTaiwanKoreaROAROW
US$ B
20180612

World Electronic Equipment Monthly Shipments
Converted @ Fluctuating Exchange Rates
Source: Custer Consulting Group
20180525
80
100
120
140
160
180
200
220
Jan
Jun
Nov Apr
Sep
Feb
Jul
Dec
May Oct
Mar
Aug Ja
nJu
nN
ov Apr
Sep
Feb
Jul
Dec
May Oct
Mar
Aug Ja
nJu
nN
ov Apr
Sep
Feb
Jul
Dec
May Oct
Mar
Aug Ja
nJu
nN
ov Apr
2002 2003 2004 2005 2006 2007 2008 2009 2010 2011 2012 2013 2014 2015 2016 20172018
April 2018 up 14.0% vs April 2017and down 6.4% sequentially vs. March 2018
US$ M

Electronic Equipment
Growth
Europe & World

Global Electronic Supply Chain Growth 1Q'18 vs. 1Q'17
1110
212
714
310
617
-128
2025
711
61616
8
-10 0 10 20 30Electronic Equipment
MilitaryBusiness & Office
Instruments & ControlsMedical
CommunicationInternet (Datacom)
ComputerData Storage
AutomotiveConsumer
SEMI Equip (SEMI)Semiconductors (SIA)Passive Components
PCBsLarge EMS (excl Foxconn)
ODMProcess Equipment
MaterialsRigid & Flex Laminate
Equip Tot=Weighted avgby product sector
% US$ Change
20180619
US$ equivalent at fluctuating exchange; based upon industry composites including acquisitions

European Electronic Supply Chain Growth 1Q’17 vs 1Q’18
28
-64
-13
45
32
46
-8 -6 -4 -2 0 2 4 6 8 10
Electronic EquipmentInstruments & Controls
Medical electronicsCommunication Equipment
Domestic Electric AppliancesMotor Vehicles
Airplane/AerospaceSemiconductors (SIA in euros)
Electronic componentsElectronic components & boards
Loaded electronic boardsWiring devices
% Change
20180515
Euro denominated growth rates; Eurostat, SIA & Custer Consulting Group

Markets of European Focus
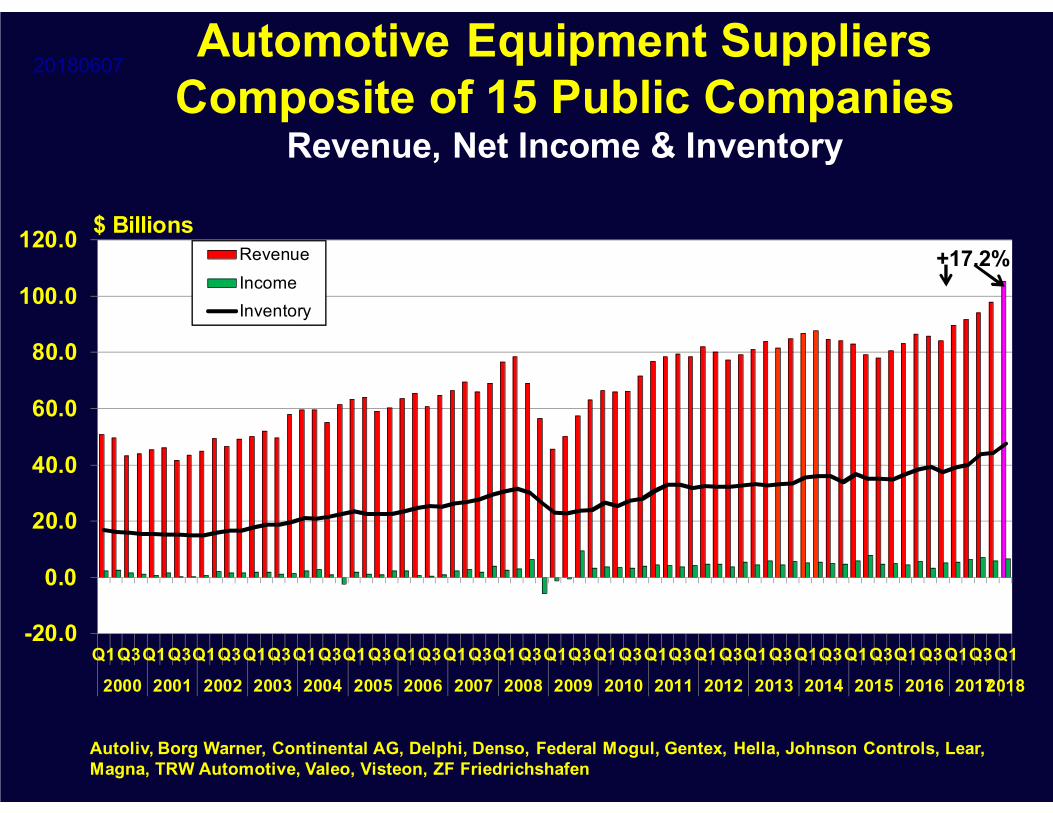
Automotive Equipment SuppliersComposite of 15 Public Companies
Revenue, Net Income & Inventory
Autoliv, Borg Warner, Continental AG, Delphi, Denso, Federal Mogul, Gentex, Hella, Johnson Controls, Lear, Magna, TRW Automotive, Valeo, Visteon, ZF Friedrichshafen
20180607
-20.0
0.0
20.0
40.0
60.0
80.0
100.0
120.0
Q1Q3Q1Q3Q1Q3Q1Q3Q1Q3Q1Q3Q1Q3Q1Q3Q1Q3Q1Q3Q1Q3Q1Q3Q1Q3Q1Q3Q1Q3Q1Q3Q1Q3Q1Q3Q1
2000 2001 2002 2003 2004 2005 2006 2007 2008 2009 2010 2011 2012 2013 2014 2015 2016 20172018
$ BillionsRevenueIncomeInventory
+17.2%

European Motor Vehicle Production
Eurostat, C291 category, EU 27 countries
20180613
40
50
60
70
80
90
100
110
120
1 6 11 4 9 2 7 12 5 10 3 8 1 6 11 4 9 2 7 12 5 10 3 8 1 6 11 4 9 2 7 12 5 10 3 8 1 6 11 4 9 2 7 12 5 10 3 8 1 6
1998 1999 2000 2001 2002 2003 2004 2005 2006 2007 2008 2009 2010 2011 2012 2013 2014 2015 2016 20172018
Index (2015=100), Seasonally Adjusted

Robert Bosch GmbhMobility Solutions Revenue
(formerly Automotive Technology sector)
CY
20180606
0
5,000
10,000
15,000
20,000
25,000
30,000
35,000
40,000
45,000
50,000
1999 2000 2001 2002 2003 2004 2005 2006 2007 2008 2009 2010 2011 2012 2013 2014 2015 2016 2017
Euros (Millions)
Revenue
www.bosch.com

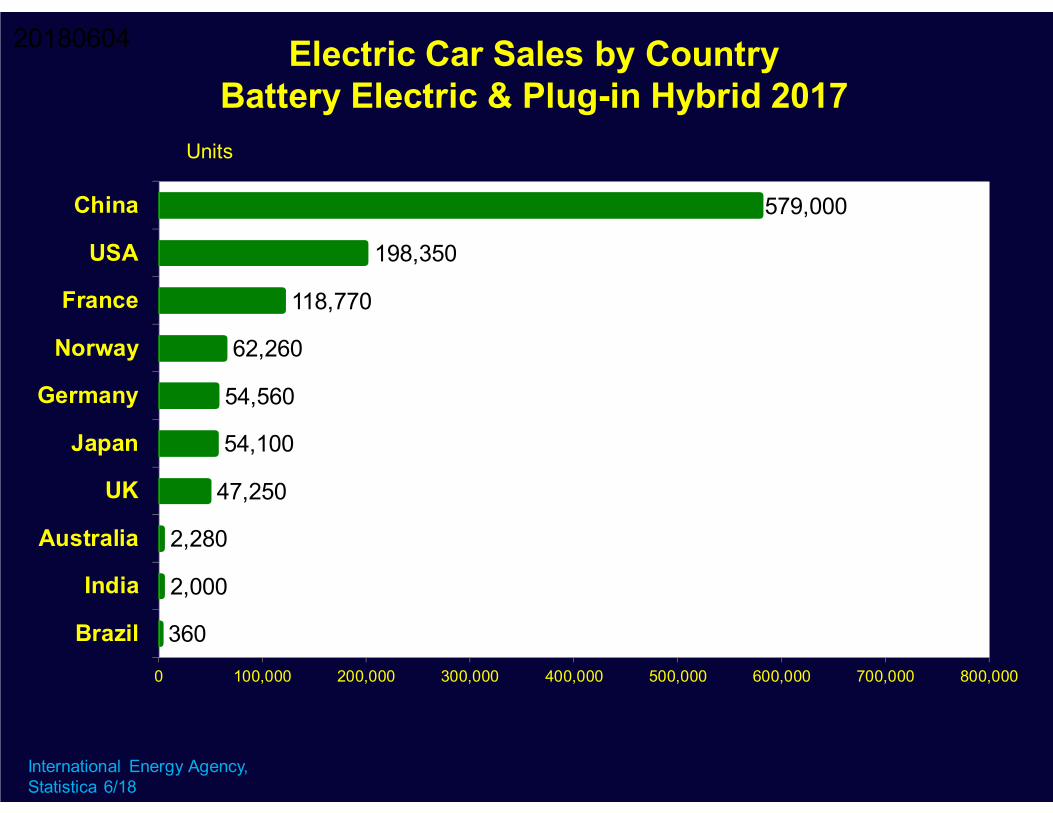
Electric Car Sales by CountryBattery Electric & Plug-in Hybrid 2017
International Energy Agency, Statistica 6/18
20180604
360
2,000
2,280
47,250
54,100
54,560
62,260
118,770
198,350
579,000
0 100,000 200,000 300,000 400,000 500,000 600,000 700,000 800,000
Brazil
India
Australia
UK
Japan
Germany
Norway
France
USA
China
Units
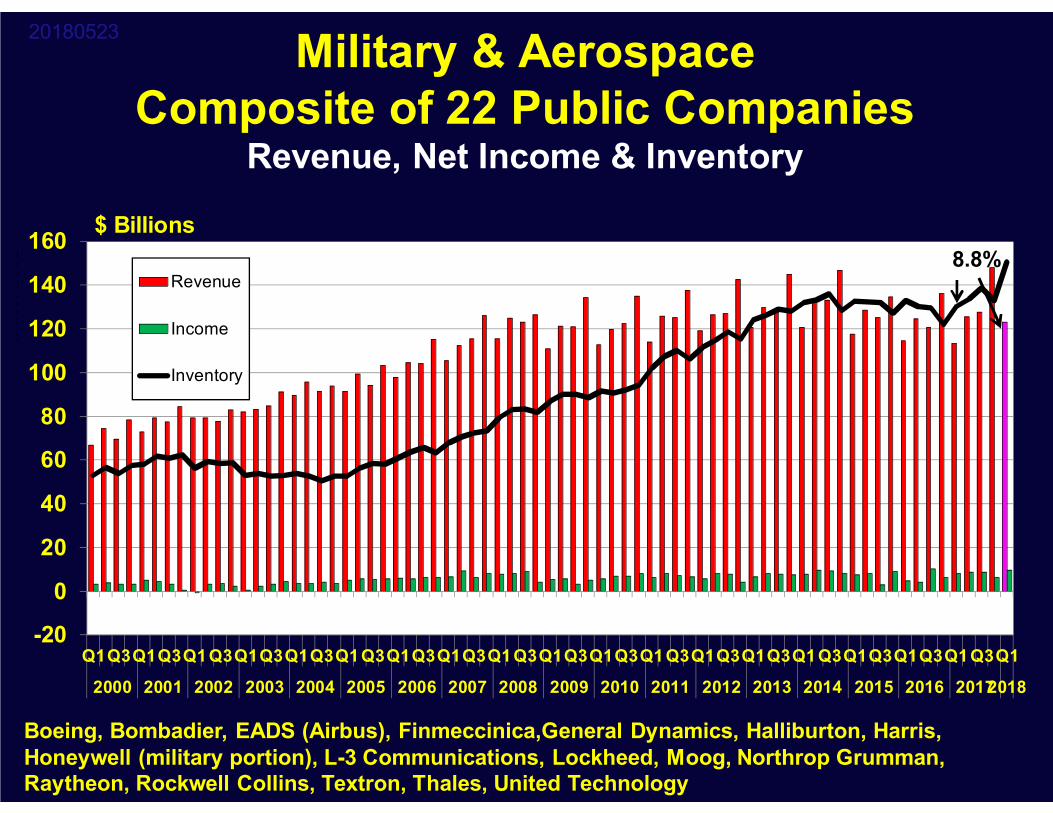
Military & AerospaceComposite of 22 Public Companies
Revenue, Net Income & Inventory
Boeing, Bombadier, EADS (Airbus), Finmeccinica,General Dynamics, Halliburton, Harris, Honeywell (military portion), L-3 Communications, Lockheed, Moog, Northrop Grumman, Raytheon, Rockwell Collins, Textron, Thales, United Technology
20180523
-20
0
20
40
60
80
100
120
140
160
Q1Q3Q1Q3Q1Q3Q1Q3Q1Q3Q1Q3Q1Q3Q1Q3Q1Q3Q1Q3Q1Q3Q1Q3Q1Q3Q1Q3Q1Q3Q1Q3Q1Q3Q1Q3Q1
2000 2001 2002 2003 2004 2005 2006 2007 2008 2009 2010 2011 2012 2013 2014 2015 2016 20172018
$ Billions
Mill
ions Revenue
Income
Inventory
8.8%

European Production - Aircraft, Spacecraft & Related Equipment
Eurostat, C303 category, EU 27 countries
20180613
40
50
60
70
80
90
100
110
120
1 6 11 4 9 2 7 12 5 10 3 8 1 6 11 4 9 2 7 12 5 10 3 8 1 6 11 4 9 2 7 12 5 10 3 8 1 6 11 4 9 2 7 12 5 10 3 8 1 6
1998 1999 2000 2001 2002 2003 2004 2005 2006 2007 2008 2009 2010 2011 2012 2013 2014 2015 2016 2017 2018
Index (2015=100), Seasonally Adjusted

Instruments & Control EquipmentComposite of 16 Public Companies
Revenue, Net Income & Inventory
ABB, Agilent, Ametek, Emerson, Itron, Keysight, National Instruments, PerkinElmer, Rockwell Automation, Rotork, Teledyne, ThermoFisher, Woodward Govenor
20180607
-10
0
10
20
30
40
50
60
Q1Q3Q1Q3Q1Q3Q1Q3Q1Q3Q1Q3Q1Q3Q1Q3Q1Q3Q1Q3Q1Q3Q1Q3Q1Q3Q1Q3Q1Q3Q1Q3Q1Q3Q1Q3Q1
2000 2001 2002 2003 2004 2005 2006 2007 2008 2009 2010 2011 2012 2013 2014 2015 2016 20172018
$ Billions
Mill
ions
Revenue
Income
Inventory
+12.2%

European Production - Instruments & Appliances for Measuring, Testing & Navigation
Eurostat, C2651 category, EU 27 countries
20180613
60
70
80
90
100
110
120
1 6 11 4 9 2 7 12 5 10 3 8 1 6 11 4 9 2 7 12 5 10 3 8 1 6 11 4 9 2 7 12 5 10 3 8 1 6 11 4 9 2 7 12 5 10 3 8 1 6
1998 1999 2000 2001 2002 2003 2004 2005 2006 2007 2008 2009 2010 2011 2012 2013 2014 2015 2016 2017 2018
Index (2015=100), Seasonally Adjusted

VolumeConsumer-driven
Products

Volume Markets
0
50
100
150
200
250
300
350
400
450
Q4 Q2 Q4 Q2 Q4 Q2 Q4 Q2 Q4 Q2 Q4 Q2 Q4 Q2 Q4 Q2 Q4 Q2 Q4 Q2 Q4 Q2
2007 2008 2009 2010 2011 2012 2013 2014 2015 2016 2017 2018
Thou
sand
s Smartphones PCs Tablets Digital Still CamerasWorld Units (Millions)
20180619
www.gartner.com; www.cipa.jp/; www.icinsights.com; www.idc.com; www.digitimes.com
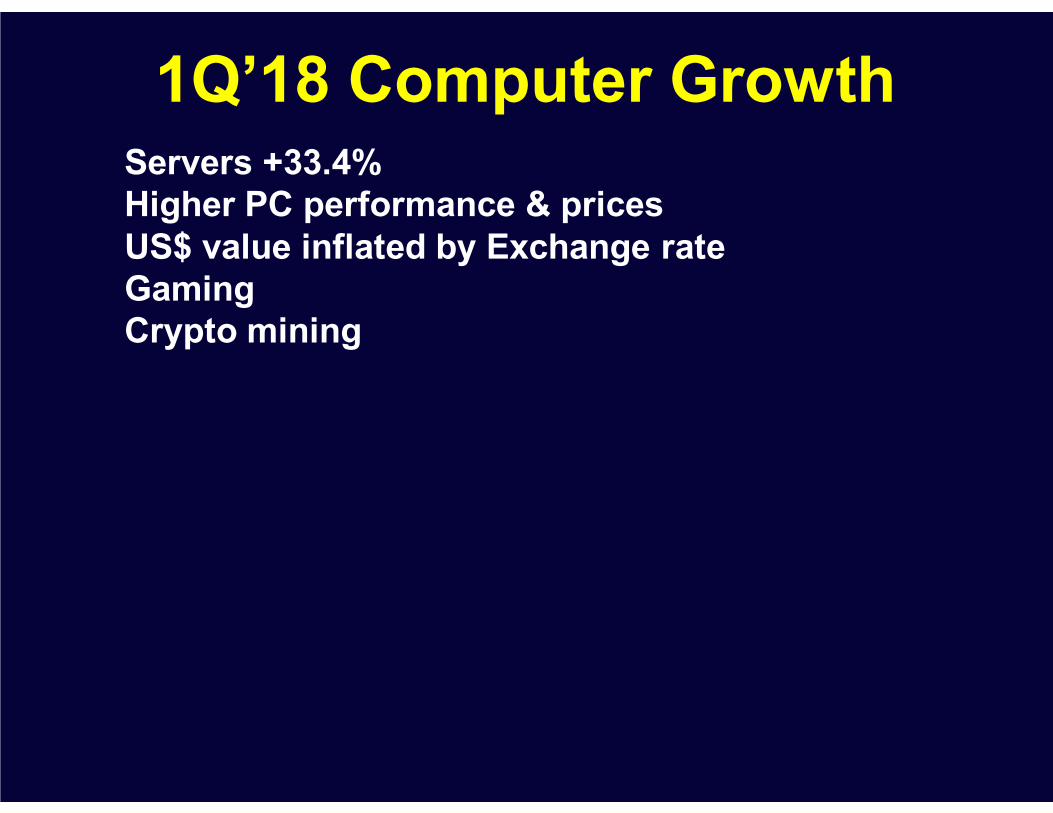
1Q’18 Computer GrowthServers +33.4%Higher PC performance & pricesUS$ value inflated by Exchange rateGamingCrypto mining

World Server Shipment Revenue
Gartner 6/18 & prior reports
02468
101214161820
Q1 Q3 Q1 Q3 Q1 Q3 Q1 Q3 Q1 Q3 Q1 Q3 Q1 Q3 Q1 Q3 Q1 Q3 Q1 Q3 Q1 Q3 Q1 Q3 Q1 Q3 Q1
2005 2006 2007 2008 2009 2010 2011 2012 2013 2014 2015 2016 20172018
US$ Billions
20180612
+33.4%
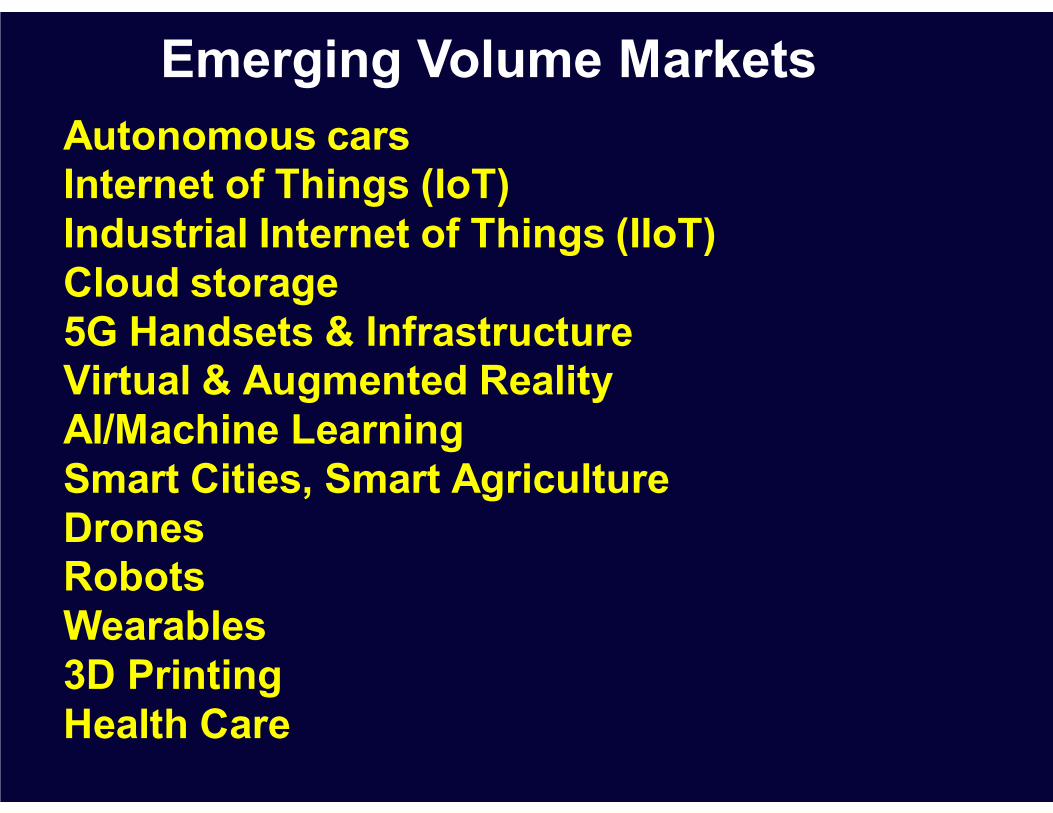
Autonomous carsInternet of Things (IoT)Industrial Internet of Things (IIoT)Cloud storage5G Handsets & InfrastructureVirtual & Augmented RealityAI/Machine LearningSmart Cities, Smart AgricultureDronesRobotsWearables3D PrintingHealth Care
Emerging Volume Markets


Things Connected to Internet
Visual Capitalist 11/17CISCO IBSGFusion
20151219

Semiconductors

World Semiconductor SalesMemory & non Memory
Gartner 1/18
20180116
16.6% -1.3% 1.1%64.3% 13.7% -12.9% -10.2% 10.2%
342.4 334.9 343.5
419.7 451.0 444.0 448.9 477.7
0
100
200
300
400
500
2014 2015 2016 2017 2018 2019 2020 2021
non MemoryMemory
Revenues & Growth ($ Billions)
6.3%-2.2% 3.0%
9.4%
4.6% 4.1% 5.8%5.1%
8.5% -2.2% 2.6%
22.2%7.5% -1.6% 1.1%
6.4%

Total Semiconductor Shipments to an AreaMonthly Shipments - Reporting Firms
www.wsts.org,www.sia-online.org/
20180606
0.0
5.0
10.0
15.0
20.0
25.0
30.0
Jan
Jul
Jan
Jul
Jan
Jul
Jan
Jul
Jan
Jul
Jan
Jul
Jan
Jul
Jan
Jul
Jan
Jul
Jan
Jul
Jan
Jul
Jan
Jul
Jan
Jul
Jan
Jul
Jan
Jul
Jan
Jul
Jan
Jul
Jan
Jul
Jan
Jul
Jan
Jul
Jan
Jul
Jan
Jul
Jan
Jul
Jan
Jul
95 96 97 98 99 00 01 02 03 04 05 06 07 08 09 10 11 12 13 14 15 16 17 18
Japan
N America
Europe
Asia-Pac
$ Billions Asia Pacific
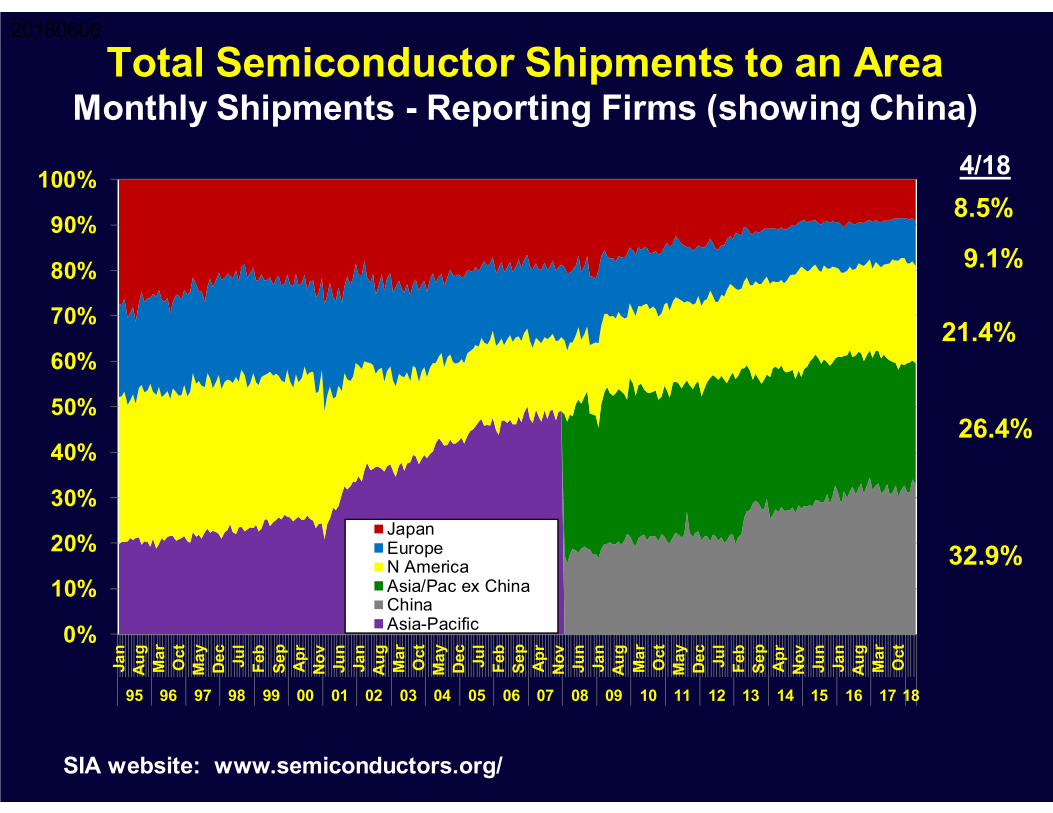
Total Semiconductor Shipments to an AreaMonthly Shipments - Reporting Firms (showing China)
SIA website: www.semiconductors.org/
20180606
0%
10%
20%
30%
40%
50%
60%
70%
80%
90%
100%
Jan
Aug
Mar Oct
May De
cJu
lFe
bSe
pAp
rNo
vJu
nJa
nAu
gM
ar Oct
May De
cJu
lFe
bSe
pAp
rNo
vJu
nJa
nAu
gM
ar Oct
May De
cJu
lFe
bSe
pAp
rNo
vJu
nJa
nAu
gM
ar Oct
95 96 97 98 99 00 01 02 03 04 05 06 07 08 09 10 11 12 13 14 15 16 17 18
JapanEuropeN AmericaAsia/Pac ex ChinaChinaAsia-Pacific
4/18
9.1%
8.5%
21.4%
32.9%
26.4%

SemiconductorCapital
Equipment

Semiconductor Capital Equipment Shipments by Area
SEMI
0.0
2.0
4.0
6.0
8.0
10.0
12.0
14.0
16.0
18.0
Q1 Q3 Q1 Q3 Q1 Q3 Q1 Q3 Q1 Q3 Q1 Q3 Q1 Q3 Q1 Q3 Q1 Q3 Q1 Q3 Q1 Q3 Q1 Q3 Q1 Q3 Q1 Q3 Q1 Q3 Q1 Q3 Q1 Q3 Q1 Q3 Q1
2000 2001 2002 2003 2004 2005 2006 2007 2008 2009 2010 2011 2012 2013 2014 2015 2016 20172018
ROWChinaTaiwanS KoreaN AmericaJapanEurope
$ Billions
+28%

EuropeSupply Chain

European Computer, Electronic and Optical Products, Semiconductors, & SEMI Equipment Shipments
Total $ Semiconductor Shipments from All Countries to Europe www.sia-online.org/, Eurostat class C26 & SEMI, CCG Extrapolation of SEMI growth
20180515
0.0
0.5
1.0
1.5
2.0
2.5
3.0
3.5
4.0
4.5
Jan
Jul
Jan
Jul
Jan
Jul
Jan
Jul
Jan
Jul
Jan
Jul
Jan
Jul
Jan
Jul
Jan
Jul
Jan
Jul
Jan
Jul
Jan
Jul
Jan
Jul
Jan
Jul
Jan
Jul
Jan
Jul
Jan
Jul
Jan
Jul
Jan
Jul
Jan
Jul
99 00 01 02 03 04 05 06 07 08 09 10 11 12 13 14 15 16 17 18
Semiconductor shipments to Europe
Computer, electronic and optical products
SEMI equipment shipments to Europe
DMASS-electronic component distribution
Zero growth
Euro 3/12 Rate of Change

ShortagesDrive Component
Sales
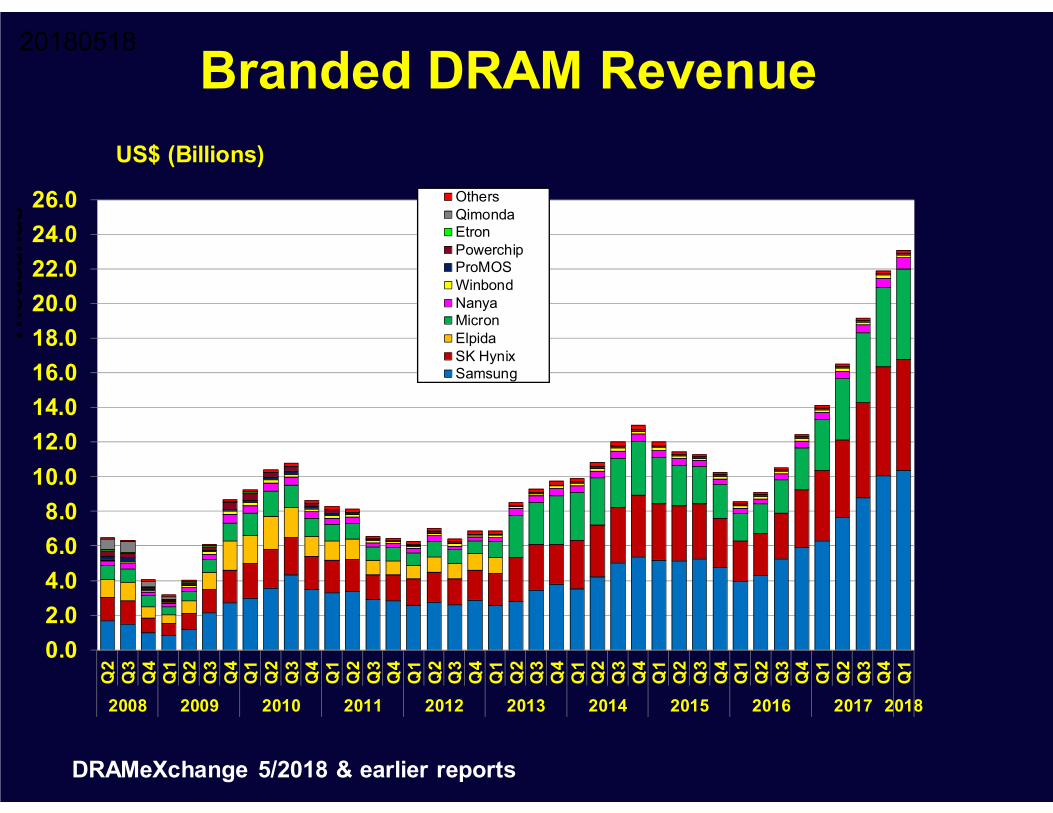
Branded DRAM Revenue
DRAMeXchange 5/2018 & earlier reports
20180518
0.02.04.06.08.0
10.012.014.016.018.020.022.024.026.0
Q2
Q3
Q4
Q1
Q2
Q3
Q4
Q1
Q2
Q3
Q4
Q1
Q2
Q3
Q4
Q1
Q2
Q3
Q4
Q1
Q2
Q3
Q4
Q1
Q2
Q3
Q4
Q1
Q2
Q3
Q4
Q1
Q2
Q3
Q4
Q1
Q2
Q3
Q4
Q1
2008 2009 2010 2011 2012 2013 2014 2015 2016 2017 2018
Thou
sand
s
OthersQimondaEtronPowerchipProMOSWinbondNanyaMicronElpidaSK HynixSamsung
US$ (Billions)

Passive ComponentsComposite of 14 Companies
Revenue, Net Income & Inventory
ALPS, AVX, Bel Fuse, Diodes, International Rectifier, Kemet, Knowles, Littlefuse, Murata, RF Micro, Rohm, Vishay, TDK, Yageo;Euro, Yen & NT$ converted to US$ at fluctuating exchange rates
20180518
-6.0-4.0-2.00.02.04.06.08.0
10.012.014.0
Q1Q3Q1Q3Q1Q3Q1Q3Q1Q3Q1Q3Q1Q3Q1Q3Q1Q3Q1Q3Q1Q3Q1Q3Q1Q3Q1Q3Q1Q3Q1Q3Q1Q3Q1Q3Q1
2000 2001 2002 2003 2004 2005 2006 2007 2008 2009 2010 2011 2012 2013 2014 2015 2016 20172018
$ Billions
Revenue
Income
Inventory
24.6%

EuropeanComponent Shipments by Country
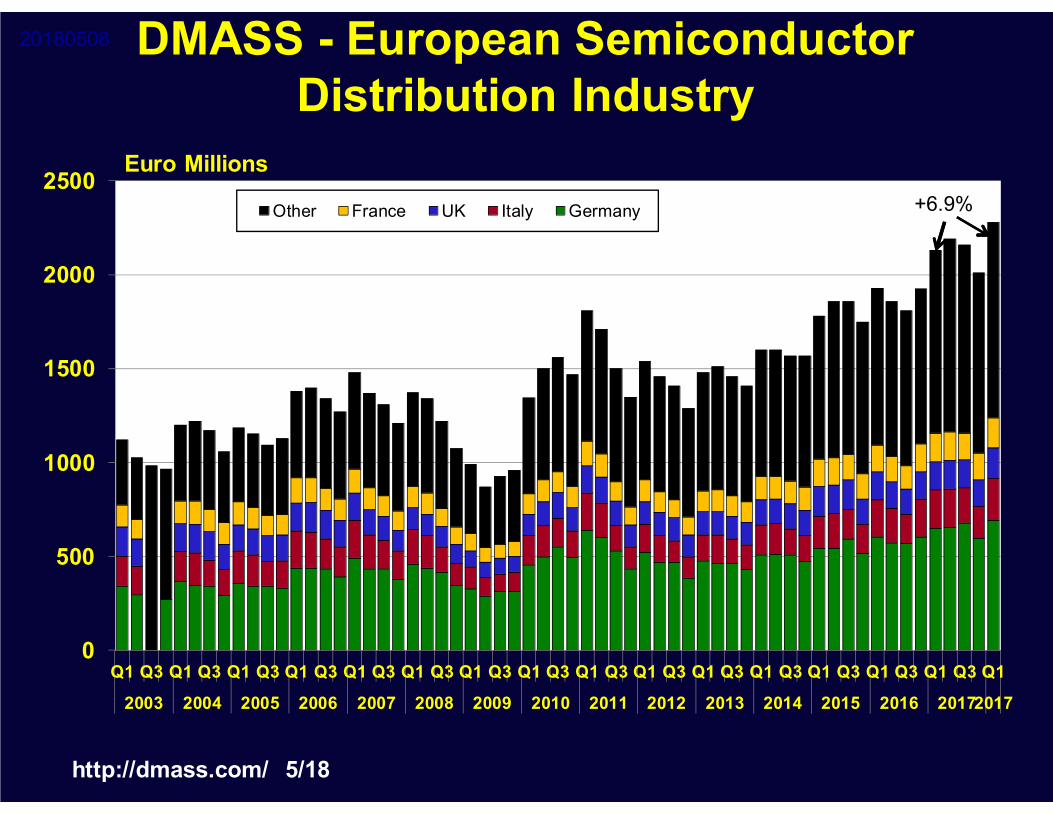
DMASS - European Semiconductor Distribution Industry
http://dmass.com/ 5/18
20180508
0
500
1000
1500
2000
2500
Q1 Q3 Q1 Q3 Q1 Q3 Q1 Q3 Q1 Q3 Q1 Q3 Q1 Q3 Q1 Q3 Q1 Q3 Q1 Q3 Q1 Q3 Q1 Q3 Q1 Q3 Q1 Q3 Q1 Q3 Q1
2003 2004 2005 2006 2007 2008 2009 2010 2011 2012 2013 2014 2015 2016 20172017
Other France UK Italy Germany
Euro Millions+6.9%

DMASSEuropean Semiconductor Distribution Industry
20180508
653695
201 220156 166152 157177 187
327366
467 489
0
100
200
300
400
500
600
700
800
900
1,000
1Q'17 1Q'18
Euros (Millions)
GermanyItalyUKFranceNordicE EuropeOther
DMASS 5/18; http://dmass.com/
“ Looking at the market by product, we cannot see a very consistent picture in Q1, some of the below-average increases in big product categories may be driven by allocation or channel shifts. However, one quarter does not really tell a story. After the dust of various market effects has settled, the situation may become clearer(and so far the weight of the big product groups has not really changed dramatically)."
Georg Steinberger, chairman of DMASS: "As we face peak demand in many industries and long lead-times for many semiconductor products, the growth is no surprise. It could have been even higher, considering channel shifts back to some manufacturers and the negative exchange rate effects from a weak US-Dollar. It remains to be seen how sustainable this is, considering that customers have to push out production in many instances due to hard allocation in other component segments. Nevertheless, at the moment outlook is solid."

EMS & ODM Companies

Global EMS & ODM Companies Composite of 52 Public Companies
Revenue
0
20
40
60
80
100
120
140
Q1Q3Q1Q3Q1Q3Q1Q3Q1Q3Q1Q3Q1Q3Q1Q3Q1Q3Q1Q3Q1Q3Q1Q3Q1Q3Q1Q3Q1Q3Q1Q3Q1Q3Q1Q3Q1
2000 2001 2002 2003 2004 2005 2006 2007 2008 2009 2010 2011 2012 2013 2014 2015 2016 20172018
US$ Sales @ fluctuating exchangeM
illio
ns +12.7%
20180518
US $ Billions

European EMS MarketWestern Europe and Eastern Europe
Source: In4ma [email protected]
20180125
16.4 17.0 17.2 17.9 18.515.5 16.9 17.1 18.2 19.3
31.933.9 34.3
36.137.8
0
5
10
15
20
25
30
35
40
45
2014 2015 2016 2017F 2018F
W Europe E Europe Total Europe
Euros B
Summary of 1,576 individual EMS entities plus 2.9%added to estimate to bring Europe 35.5 billion Euro for 2016.MENA not included

European Loaded Electronic Board Production
40
50
60
70
80
90
100
110
120
Jan
Jun
Nov Apr
Sep
Feb
Jul
Dec
May Oct
Mar
Aug Jan
Jun
Nov Apr
Sep
Feb
Jul
Dec
May Oct
Mar
Aug Jan
Jun
Nov Apr
Sep
Feb
Jul
Dec
May Oct
Mar
Aug Jan
Jun
Nov Apr
Sep
Feb
Jul
Dec
May Oct
Mar
Aug Jan
Jun
98 99 00 01 02 03 04 05 06 07 08 09 10 11 12 13 14 2015 2016 2017 2018
Index (2015=100); Seasonally Adjusted
Calendar YearEurostat, C2612

2017/20162017 2016 Growth %
Hon Hai (Foxconn) Taiwan 155,078 137,648 +12.7%Flextronics Singapore 24,893 24,419 +1.9%Jabil Circuit USA 19,544 18,651 +4.8%Sanmina USA 6,893 6,322 +9.0%Celestica Canada 6,110 5,604 +7.3%Venture Mfg Singapore 2,906 1,933 +52.7%Plexus USA 2,570 2,574 -0.1%Benchmark Elec USA 2,467 2,469 -0.1%
Total 220,544 199,844 +10.4%
Large Global EMS Providers20180303
Sources: Company data; 4Q’17 estimates for Benchmark, VentureLocal currency converted at fluctuating exchange
2017 vs. 2016 Sales ($M)
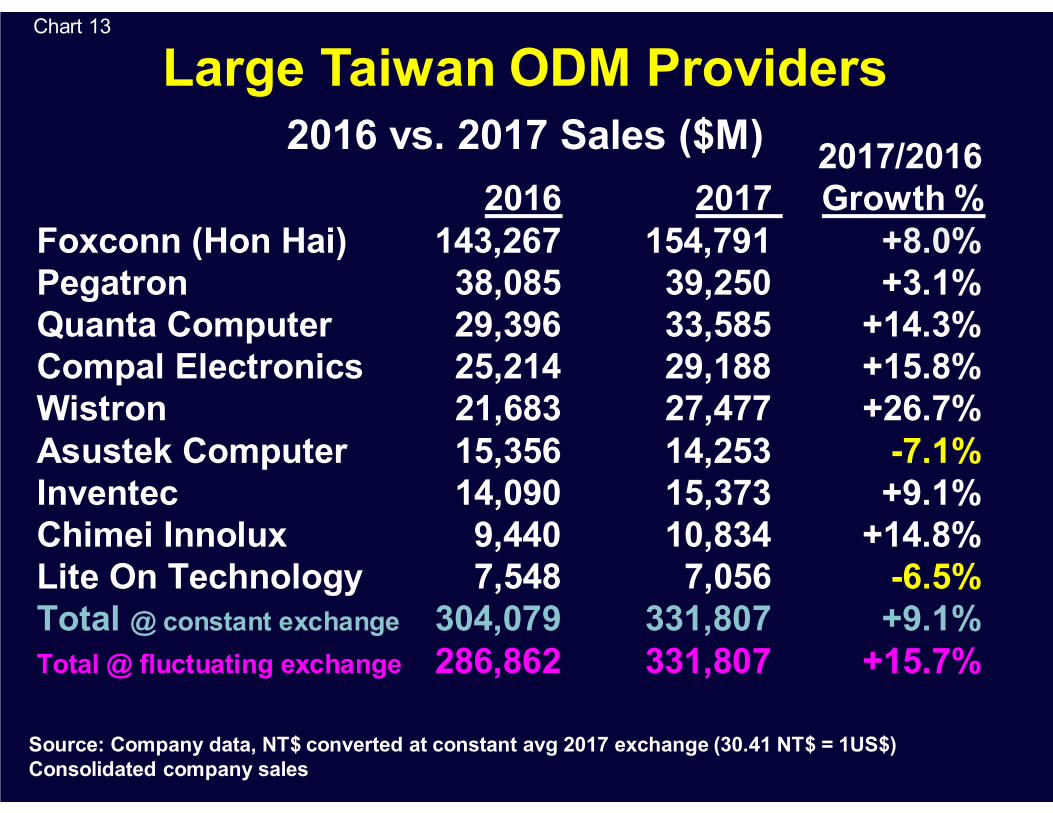
2017/20162016 2017 Growth %
Foxconn (Hon Hai) 143,267 154,791 +8.0%Pegatron 38,085 39,250 +3.1%Quanta Computer 29,396 33,585 +14.3%Compal Electronics 25,214 29,188 +15.8%Wistron 21,683 27,477 +26.7%Asustek Computer 15,356 14,253 -7.1%Inventec 14,090 15,373 +9.1%Chimei Innolux 9,440 10,834 +14.8%Lite On Technology 7,548 7,056 -6.5%Total @ constant exchange 304,079 331,807 +9.1%Total @ fluctuating exchange 286,862 331,807 +15.7%
Large Taiwan ODM ProvidersChart 13
Source: Company data, NT$ converted at constant avg 2017 exchange (30.41 NT$ = 1US$)Consolidated company sales
2016 vs. 2017 Sales ($M)

Taiwan ODM CompaniesComposite Sales of 11 Large Manufacturers
0
200
400
600
800
1,000
1,200
Jan
Jun
Nov Apr
Sep
Feb
Jul
Dec
May Oct
Mar
Aug Ja
nJu
nN
ov Apr
Sep
Feb
Jul
Dec
May Oct
Mar
Aug Ja
nJu
nN
ov Apr
Sep
Feb
Jul
Dec
May Oct
Mar
Aug Ja
nJu
nN
ov Apr
Sep
Feb
Jul
Dec
May Oct
Mar
Aug Ja
nJu
n
98 99 00 01 02 03 04 05 06 07 08 09 10 11 12 13 14 15 16 17 18
May 2018 up 13.4% vs. May 2017 and up 3.5%sequentially from April 2018
Total 2017 up 9.1% in NT$ vs. total 2016Up 15.7% in fluctuating exchange 2017 vs 2016 US$
NT$ (Billions)
Asustek Computer, Chei Mei, Compal Electronics, Foxconn, Chimei Innolux , Inventec, Inventec Appliance, Lite On Technology, Mitac International, Pegatron, Quanta Computer, Wistron, Chei Mei Display replacing Chei Mei & Innolux Display 3/10 & later
Calendar YearCompany Financial Releases

U.S. tariffs coulddrive assembly
fromChina to SE Asia

PCB Fabrication

World PCB Production 1980-2018
IPC: World PCB Production Report 2016 + Custer estimates for 2017 & 2018
0.0
10.0
20.0
30.0
40.0
50.0
60.0
70.0
80 81 82 83 84 85 86 87 88 89 90 91 92 93 94 95 96 97 98 99 00 01 02 03 04 05 06 07 08 09 10 11 12 13 14 15 16 17 18
Thou
sand
s
US$
Calendar Year
Note: Each year was calculated independently using exchange rates for that year.
Because each year involved an independent evaluation and because exchange rates can fluctuate significantly, year-to-year growth rates may not be meaningful.
"Fluctuating exchange" growth rates can be significantly different vs. those calculated using constant exchange rates.

2016 World Total PCB Production by Geographical Area
IPC 9/17
4.9%
3.6%
8.9%
50.2%
12.4%
11.3% 8.3% 0.3%
N AmericaEuropeJapanChina/HKTaiwanS KoreaRest of AsiaROW
20170923
Total: $58.2 Billion
(US$ M @ Average 2016 Exchange)

Japan PCB Production20180525
0
10
20
30
40
50
60
70
80
90
100
Jan
Sep
May Jan
Sep
May Jan
Sep
May Jan
Sep
May Jan
Sep
May Jan
Sep
May Jan
Sep
May Jan
Sep
May Jan
Sep
May Jan
Sep
May Jan
Sep
May Jan
Sep
May Jan
Sep
May Jan
Sep
May Jan
Sep
May Jan
Sep
May Jan
Sep
May Jan
Sep
May Jan
82 83 84 85 86 87 88 89 90 91 92 93 94 95 96 97 98 99 00 01 02 03 04 05 06 07 08 09 10 11 12 13 14 15 16 17 18
Yen (Billions)
Calendar YearJEITA
2017/2016+1.6%

Taiwan Shipments42 Rigid PCB & 8 Laminate Manufacturers
20180609
0
1,000
2,000
3,000
4,000
5,000
6,000
7,000
5
10
15
20
25
30
35
40
45
50
55
Jan
Jun
Nov Apr
Sep
Feb
Jul
Dec
May Oct
Mar
Aug Ja
nJu
nN
ov Apr
Sep
Feb
Jul
Dec
May Oct
Mar
Aug Ja
nJu
nN
ov Apr
Sep
Feb
Jul
Dec
May Oct
Mar
Aug Ja
nJu
nN
ov Apr
Sep
Feb
Jul
01 02 03 04 05 06 07 08 09 10 11 12 13 14 15 16 17 18
PCB
Laminate
PCB – NT$ (Billions)
Calendar YearCompany Financial Releases
Laminate – NT$ (Millions)

S Korean Companies’ Global PCB Production
Private communication from industry source
20180523
Q1 Q2 Q3 Q4 Q1 Q2 Q3 Q4 Q1 Q2 Q3 Q4 Q12015 2016 2017 2018
Total 1,980 1,890 2,035 2,000 1,937 1,844 1,972 1,961 1,939 1,965 2,206 2,634 2,043IC Substrate 530 510 540 530 518 504 545 537 512 496 541 538 533Flex 440 410 470 460 401 364 420 425 421 489 650 1138 529Rigid 1010 970 1025 1010 1018 976 1007 999 1006 980 1015 958 981
1,980 1,8902,035 2,000 1,937 1,844 1,972 1,961 1,939 1,965
2,206
2,634
2,043
0
500
1,000
1,500
2,000
2,500
3,000
3,500US$ millions (converted at 1150 won/$)
• Overseas production was about 12% of total PCB production last year• While FPCB makers are active in overseas expansion, none of substrate factories are outside Korea• The overseas portion will be increased this year due to rigid-flex PCB production at Samsung Electro-mechanics’
Vietnam site• With decrease in iPhone X sales as well as struggling Galaxy S9, the FPCB production of Q1 was less than
half of that of the last quarter. However it was still better than that of last year.• Others sectors were flat during the quarter

N American Rigid & Flexible PCB Shipments & Orders
0
50
100
150
200
250
1 4 7 10 1 4 7 10 1 4 7 10 1 4 7 10 1 4 7 10 1 4 7 10 1 4 7 10 1 4 7 10 1 4 7 10 1 4 7 10 1 4
2008 2009 2010 2011 2012 2013 2014 2015 2016 2017 2018
Shipments
Orders
2017/2016 Rigid & Flex PCB Shipments -1.8%, Orders +7.9%
Note: IPC survey captures "market" not domestic production. About 15% of the above represents imported boards resold by N American PCB producers in survey.
$M (statistical sample of about 50% of producers)
IPC

European Electronic Wiring Devices20180614
70
80
90
100
110
120
130
Jan
Jun
Nov Apr
Sep
Feb
Jul
Dec
May Oct
Mar
Aug Jan
Jun
Nov Apr
Sep
Feb
Jul
Dec
May Oct
Mar
Aug Jan
Jun
Nov Apr
Sep
Feb
Jul
Dec
May Oct
Mar
Aug Jan
Jun
Nov Apr
Sep
Feb
Jul
Dec
May Oct
Mar
Aug Jan
Jun
98 99 00 01 02 03 04 05 06 07 08 09 10 11 12 13 14 15 16 17 18
Index (2015=100); Seasonally Adjusted
Calendar YearEurostat, C2733

Europe PMI Leading Indicator vs. Europe Wiring Devices
20180601
0.4
0.6
0.8
1.0
1.2
1.4
1.6
1.8
Jan
Apr Ju
lO
ctJa
nA
pr Jul
Oct
Jan
Apr Ju
lO
ctJa
nA
pr Jul
Oct
Jan
Apr Ju
lO
ctJa
nA
pr Jul
Oct
Jan
Apr Ju
lO
ctJa
nA
pr Jul
Oct
Jan
Apr Ju
lO
ctJa
nA
pr Jul
Oct
Jan
Apr Ju
lO
ctJa
nA
pr Jul
Oct
Jan
Apr Ju
lO
ctJa
nA
pr Jul
05 06 07 08 09 10 11 12 13 14 15 16 17 18
Eurostat Wiring Devices
PCB Leading Indicator
Zero Growth
Source: Custer Consulting Group
3/12 Rate of Change
Calendar Year

FromMichael Gasch
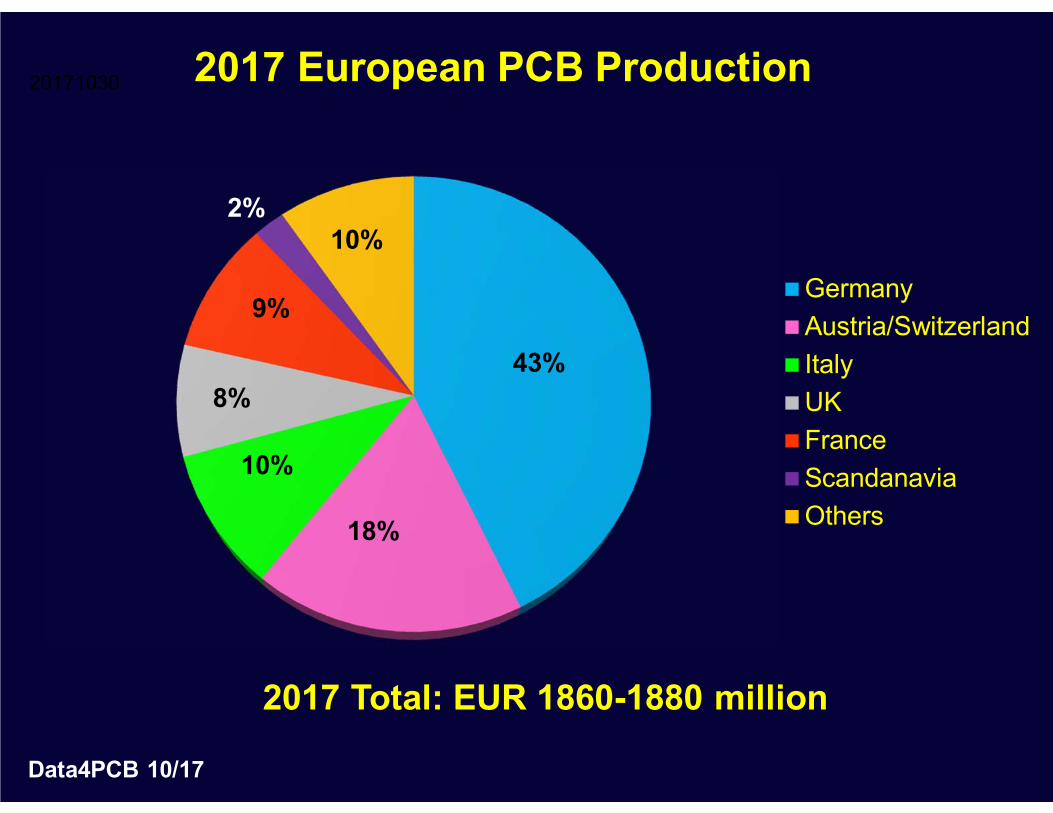
2017 European PCB Production
Data4PCB 10/17
2017 Total: EUR 1860-1880 million
43%
18%
10%
8%
9%
2%10%
GermanyAustria/SwitzerlandItalyUKFranceScandanaviaOthers
20171030

European PCB Production
Data4PCB 4/18 & prior
20171030
2000 2001 2002 2003 2004 2005 2006 2007 2008 2009 2010 2011 2012 2013 2014 2015 2016 2017Other 601 577 422 408 410 346 309 264 221 169 170 155 157 151 158 170 172 202UK 641 478 368 340 330 278 252 197 177 137 165 161 158 153 165 173 163 149Scandanavia 351 309 260 201 200 198 169 137 103 64 64 64 50 40 42 40 40Austria/Switzerland 561 575 463 447 427 427 447 427 378 258 341 343 325 323 312 315 299 332Italy 619 530 444 338 324 281 284 248 212 156 181 186 174 168 174 181 188 206France 541 465 287 244 266 240 234 231 206 165 170 166 147 148 148 157 168 156Germany 1461 1300 1006 1027 1044 981 1054 1039 970 676 883 902 835 828 825 796 740 788
0
1000
2000
3000
4000
5000
6000Euros (Millions)
Russia & FSU not included
+5%

4.8 4.8 5.4 4.4 3.8 3.9 3.1 3.3
22.9 22.1 21.2 20.6 20.2 21.1 19.7 18.6
47.5 45.0 44.341.1 42.3 42.9
41.1 41.0
9.0 10.4 9.311.0 11.6 11.5
12.4 12.6
6.9 7.9 10.1 11.3 9.5 9.3 10.5 10.7
5.2 6.1 5.6 6.9 7.7 7.9 7.9 8.1
3.6 3.7 4.1 4.8 4.9 3.4 5.3 5.7
0%
10%
20%
30%
40%
50%
60%
70%
80%
90%
100%
2010 2011 2012 2013 2014 2015 2016 2017
OthersFlex-RigidFlexHDIMLPTHn-PTH
European PCB Production by Technology
Data4PCB 4/18
20180426

18.3 17.6 17.7 16.7 19.4 20.4 21.0 21.8
2.6 2.5 2.0 2.1 1.7 1.5 1.6 1.410.9 8.4 10.4 8.2 7.0 6.9 5.6 5.2
3.32.8 1.9 3.0 2.9 2.9 2.6 2.1
8.2 9.7 6.7 7.1 7.3 7.8 7.9 8.23.9 4.2 4.4 4.8 5.3 5.6
37.5 41.8 43.2 43.8 42.9 40.8 40.3 39.8
7.6 7.2 7.1 7.8 8.2 8.8 9.6 8.311.6 9.9 7.1 7.1 6.2 6.1 6.1 7.5
0%
10%
20%
30%
40%
50%
60%
70%
80%
90%
100%
2010 2011 2012 2013 2014 2015 2016 2017
OtherMedicalIndustrialAeronauticsDefenseConsumerCommunicationComputerAutomotive
European PCB Production by End Market
Data4PCB 4/18
20180426

PCB industry in Europe 2000 – 2017revenues and number of manufacturers
4,77
54,
233
3,25
02,
937
3,00
43,
001
2,75
02,
748
2,54
32,
267
1,62
51,
969
1,97
21,
846
1,80
71,
831
1,81
51,
747
1,83
3
555
488457
405
478426
379 374359
333
314 304 299284
272252 247
230 223
0
100
200
300
400
500
0
500
1000
1500
2000
2500
3000
3500
4000
4500
5000
2000 2002 2003+ 2005 2007 2009 2011 2013 2015 2017
Revenues in million EUR Number of
manufacturers
* 2003+ = incl. Central Europe
Data4PCB 4/18 & earlier

Europe’s Top 41 PCB Companies Ranked by 2017 Revenues20160502
Rank Company Rank Company 1 AT&S / A 22 Cicor Group / CH
2 Würth Gruppe / D 23 Schaltungsdruck Storz / D
3 Schweizer Electronic / D 24 Aspocomp Oy –Gruppe / Fin4 KSG GmbH + Co KG / D 25 ACB N.V. / B
5 Elvia Group / F 26 Eleprint srl / I
6 Mektec Europa / D 27 Europrint Eger Kft / B
7 Unimicron Germany / D 28 Tecnomaster SpA / I
8 SoMaCis / I 29 Graphic plc / GB
9 hmp Macroprint / D 30 Spirit Group / GB
10 Elco Group / I + NL 31 Silga SpA / I11 European Electronic Systems / D 32 TW Elektronik Horst Muller / D
12 GS SwissPCB AG /CH 33 Ilfa / D
13 Dyconex AG / CH 34 Elekonta Marek GmbH / D
14 Varioprint AG Electronic / CH 35 OMR Italia SpA / I
15 Hausermann GmbH / A 36 Merlin (Falcon) Group / GB
16 Amphenol-Invotec /GB 37 Precoplat / D
17 Cimulec Group / F 38 Asetronic AG / CH
18 Optiprint AG / CH 39 Jenaer Leiterplatten / D
19 Cistelaier-Group / I 40 LAB Circuits S.A. / E
20 Polytron Print GmbH / D 41 Techno Service / PL
21 Rohde & SchwarzData4PCB
4/17

2017 European PCB Production
Data4PCB 4/18
EUR 1832 million
43.0%
18.1%
11.2%
8.5%
8.2%
6.9% 4.1%
GermanyAustria/SwitzerlandItalyFranceUKBelgium/Netherlands/ScandanaviaCentral Europe
20160502

Michael Gasch Comments 6/18Up to April sales of the ZVEI-group have been 7% better than in the years 2015 to 2017 for the same 4 months.
This good result is shared by all participants (small to big) and I can't pinpoint it to a certain industry. Plausible explanations might be that during the shortage of copper foil several new projects were not (yet) transferred to Asia and are still remaining to a certain extent in Europe and Asia no longer is the cheap-cheap working bench for Europe as wages are rising.
France had poorer sales during the first quarter than last year, apparently a big project for defense and/or aeronautics came to an end last year and there is no replacement in the same volume.
UK is again reporting to the B2B statistics, however, with a different group of companies. Therefore, all previous results had to be corrected. During the 1st quarter sales in GBP rose 7.3%. As export sales account for just about 20-25% and most of the business is transacted within the own country the consequences of the coming Brexit are not (yet) felt.

Michael Gasch Comments 6/18
A much greater concern, however, is the erratic behavior of the US president. The longer he is in office the more multinational treaties and agreements are no longer valid. I wonder what the North Koreans are thinking regarding how long any promises will be valid. This can't be explained any longer with "America first".
Everything is just at the whim of the day. And this has effects on the business confidence in the PCB (and the electronic) industry in Europe. I wonder as well how long it will take China to put an export ban on PCBs or electronic components for people like Apple and Google and Facebook ("as it is against the national security") and without those components servers in the USA will run on a "flat tire"...

Process Equipment, Laminate &
Materials Suppliers

Process Equipment Related SuppliersComposite of 12 Companies
Revenue
C-Sun,Tailing Technology, Camtek, Cadence, ESI, GSI Group, Mentor Graphics, Nordson, Rofin-Sinar, Coherent, Orbotech, Data I/O
20180523
0
500
1000
1500
2000
2500
3000
Q1 Q3 Q1 Q3 Q1 Q3 Q1 Q3 Q1 Q3 Q1 Q3 Q1 Q3 Q1 Q3 Q1 Q3 Q1 Q3 Q1 Q3 Q1 Q3 Q1 Q3 Q1 Q3 Q1 Q3 Q1 Q3 Q1
2002 2003 2004 2005 2006 2007 2008 2009 2010 2011 2012 2013 2014 2015 2016 20172018
$ Millions
+15.8%PCBFlat Panel DisplaysTouch ScreensPhotovoltaic

Material Suppliers (excluding laminate)Composite of 14 Companies
Revenue
Momentive, OM Group, Taiwan Glass, Baotech, Glotech, Shenmao, Wahlee,Topoint, Cabot Micro, Cookson Elec, Eternal Chemical, Hexcel, Chang Wah, Platform Specialty Products
NT$ & GBP converted to US$ at fluctuating exchange
201805184
0
500
1,000
1,500
2,000
2,500
3,000
3,500
4,000
4,500
Q1 Q3 Q1 Q3 Q1 Q3 Q1 Q3 Q1 Q3 Q1 Q3 Q1 Q3 Q1 Q3 Q1 Q3 Q1 Q3 Q1 Q3 Q1 Q3 Q1 Q3 Q1 Q3 Q1 Q3 Q1
2003 2004 2005 2006 2007 2008 2009 2010 2011 2012 2013 2014 2015 2016 20172018
$ Millions
+15.5%

Rigid & Flex Laminate SuppliersComposite of 13 Companies
Revenue
Arisawa, Arlon Electronic Materials, Elite Materials, Hwa Woei, Iteq, Microcosm,Park Electrochemical, Rogers, Shinemore, Taiflex, Thinflex, Top Union, Uniplus
NT$ converted at fluctuating exchange
20180518
0100200300400500600700800900
1000
Q1 Q3 Q1 Q3 Q1 Q3 Q1 Q3 Q1 Q3 Q1 Q3 Q1 Q3 Q1 Q3 Q1 Q3 Q1 Q3 Q1 Q3 Q1 Q3 Q1 Q3 Q1 Q3 Q1 Q3 Q1
2003 2004 2005 2006 2007 2008 2009 2010 2011 2012 2013 2014 2015 2016 20172018
$ Millions+8.4%

Global Growth RatesProcess Equipment, Materials & Laminate
20180523
0.4
0.6
0.8
1.0
1.2
1.4
1.6
1.8
Q1 Q3 Q1 Q3 Q1 Q3 Q1 Q3 Q1 Q3 Q1 Q3 Q1 Q3 Q1 Q3 Q1 Q3 Q1 Q3 Q1 Q3 Q1 Q3 Q1 Q3 Q1 Q3 Q1 Q3 Q1
2003 2004 2005 2006 2007 2008 2009 2010 2011 2012 2013 2014 2015 2016 2017 2018
Process Eq
Materials
Laminate
Zero Growth
3/12 Rate of Change
Company Financials of 12 Laminate suppliers, 13 material suppliers & 8 Process Equipment Suppliers
Calendar Year

World PCB Model

Regional PCB Shipment Growth20180614
0.4
0.6
0.8
1.0
1.2
1.4
1.6
1.8
Jan
Jun
Nov Apr
Sep
Feb
Jul
Dec
May Oct
Mar
Aug Jan
Jun
Nov Apr
Sep
Feb
Jul
Dec
May Oct
Mar
Aug Jan
Jun
Nov Apr
Sep
Feb
Jul
Dec
May Oct
Mar
Aug Jan
Jun
Nov Apr
Sep
Feb
Jul
Dec
May
00 01 02 03 04 05 06 07 08 09 10 11 12 13 14 15 16 17 18
Taiwan/China
S Korea
Japan
N America
Europe
Zero Growth
3/12 Rate of Growth (in local currency)
Sources: IPC, JPCA, Taiwan/China composite; Eurostat "wiring devices" for Europe
Calendar Year

2016 World Total PCB Production by Geographical Area
IPC 9/17
4.9%
3.6%
8.9%
50.2%
12.4%
11.3% 8.3% 0.3%
N AmericaEuropeJapanChina/HKTaiwanS KoreaRest of AsiaROW
20170923
Total: $58.2 Billion
(US$ M @ Average 2016 Exchange)

World PCB Monthly ShipmentsConverted @ Fluctuating Exchange Rates
20180614
0.0
0.5
1.0
1.5
2.0
2.5
3.0
3.5
4.0
Jan
Jun
Nov Apr
Sep
Feb
Jul
Dec
May Oct
Mar
Aug Ja
nJu
nN
ov Apr
Sep
Feb
Jul
Dec
May Oct
Mar
Aug Ja
nJu
nN
ov Apr
Sep
Feb
Jul
Dec
May Oct
Mar
Aug Ja
nJu
nN
ov Apr
Sep
Feb
Jul
Dec
May
00 01 02 03 04 05 06 07 08 09 10 11 12 13 14 15 16 17 18
N AmericaEuropeJapanTaiwan/ChinaRest of AsiaKorea
$ Billions
Source: Custer Consulting GroupCalendar Year
Note:harmonization with 2016 IPC World Market report

Forecasts

6.3
4.7
0.8
1.7
2.0
3.0
6.5
4.5
1.0
2.1
2.2
3.1
6.9
4.3
1.7
2.4
2.3
3.1
0 2 4 6 8
China
Emerging Markets
Japan
Euro area
USA
World
% Annual Growth
2017 2018F 2019F
Real GDP GrowthGrowth rates calculated using constant 2010 US$ weights
World Bank 6/18, www.worldbank.org
20180609

Asked if there was a risk for the global economy, WTO Director-General Roberto Azevedo stated: "Absolutely. If the trade dispute escalates, there's the risk of a global downturn and we're already seeing signs that this downward process has already started." He said it was crucial to maintain dialogue to avoid an escalation.

Worldwide Semiconductor Market by GeographyWSTS Forecast
WSTS 6/18
20180606
1999 2000 2001 2002 2003 2004 2005 2006 2007 2008 2009 2010 2011 2012 2013 2014 2015 2016 2017 2018 2019Total 149.4 204.4 138.9 140.8 166.3 213.1 227.4 247.7 255.6 248.6 226.3 298.3 299.5 291.6 305.6 335.8 335.2 338.9 412.2 463.4 483.7Asia Pacific 37.2 51.3 39.8 51.2 62.8 88.8 103.5 116.5 123.5 124.0 119.6 160.0 164.0 163.0 174.4 194.2 201.1 208.4 248.8 279.4 291.3Japan 32.8 46.7 33.1 30.5 38.9 45.8 44.1 46.4 48.8 48.5 38.3 46.6 42.9 41.1 34.8 34.8 31.1 32.3 36.6 39.8 41.4Europe 31.9 42.3 30.2 27.8 32.3 39.4 39.1 39.9 41.0 38.2 29.9 38.1 37.4 33.2 34.9 37.5 34.3 32.7 38.3 43.4 45.5Americas 47.5 64.1 35.8 31.3 32.3 39.1 40.7 44.9 42.3 37.9 38.5 53.7 55.2 54.4 61.5 69.3 68.7 65.5 88.5 100.9 105.5
149
204
139 141166
213 227248 256 249
226
298 300 292 306336 335 339
412
463484
0
100
200
300
400
500
+21.6% +12.4% +4.4%$ B

Worldwide Semiconductor Market by TypeWSTS Forecast
WSTS 6/18
20180606
2007 2008 2009 2010 2011 2012 2013 2014 2015 2016 2017 2018 2019Total 255646 248604 226314 298316 299522 291561 305582 335842 335168 338931 412222 463411 483719IC-Memory 57854 46348 44797 69614 60749 56995 67043 79232 77205 76767 123974 156786 162545IC-Logic 67292 73531 65215 77377 78782 81703 85928 91633 90753 91498 102209 109476 114747IC-Micro 56211 53140 48330 60633 65204 60238 58686 62072 61298 60585 63934 66152 68582IC-Analog 36453 35637 32001 42285 42338 39303 40117 44365 45228 47848 53070 58095 61044Sensors 5126 5111 4753 6903 7970 8009 8036 8502 8816 10821 12571 13306 14118Optoelectronics 15901 17902 17043 21702 23092 26175 27571 29868 33256 31994 34813 35986 38024Discrete 16809 16935 14175 19802 21387 19138 18201 20170 18612 19418 21651 23610 24659
256 249 226
298 300 292 306336 335 339
412463 484
-50
50
150
250
350
450
550$ Billions

World PCB Shipments (with forecast)Converted @ Fluctuating Exchange Rates
20180614
2.0
2.5
3.0
3.5
4.0
4.5
5.0
5.5
6.0
6.5
Jan
Jun
Nov Apr
Sep
Feb
Jul
Dec
May Oct
Mar
Aug Ja
nJu
nN
ov Apr
Sep
Feb
Jul
Dec
May Oct
Mar
Aug Ja
nJu
nN
ov Apr
Sep
Feb
Jul
Dec
May Oct
Mar
Aug Ja
nJu
nN
ov Apr
Sep
Feb
Jul
Dec
May Oct
Mar
Aug Ja
n
99 00 01 02 03 04 05 06 07 08 09 10 11 12 13 14 15 16 17 18 19
ActualForecast
-2.8%
$ Billions
Source: Custer Consulting Group - 2010 base year expanded by monthly growth of N. American, European, Japanese, Korean & Taiwan/China monthly PCB shipments
Calendar Year
Growth calculations:Europe = Eurostat “Wiring Device”Japan & N. America from JPCA & IPC dataTaiwan/China:46 rigid & flex company compositeS Korea from NT Information, company composites & KPCA
+.2%
Note:Historical data harmonized with IPC World Market reports 10/30/17
+6.8%+5.3%

Summary
Expect slowing growth due to trade disputes
Long standing regional alliances are now in question
Electronic assembly may shift to countries less affected by tariffs
Many exciting new electronic products are on the horizon but without attitude changes growth may be limited.
20111007

Custer Consulting Group Products
Daily News Services (6 days/week)- Global electronics supply chain- Solar/Photovoltaic supply chain- Automotive supply chain
Business Outlook- Market charts & data
Global marketOEMsComponents, EMS, ODM, materials & process equipSolar/Photovoltaic
- Weekly Market Comments with latest charts
20111007

Looking forward to Session 2

And thank youMichael Weinhold
for all that you have done for the EIPC and the industry

For a copy of my updated charts
Give me your business card
Ask about our newAutomotive News Service