business models for the next generation f mobile
TRANSCRIPT

International Journal of Mobile Network Communications & Telematics (IJMNCT) Vol. 7, No.1/2, April 2017
DOI : 10.5121/ijmnct.2017.7202 11
BUSINESS MODELS FOR THE NEXT GENERATION
OF MOBILE COMMUNICATIONS
Ghoul Smail1 and Jia Weijia2
1, 2 Department of Computer Science, School of Electronic Information and Electrical Engineering Shanghai Jiao Tong University/China
ABSTRACT
The Next Generation of mobile network 5G, which will be based on a high-speed wireless broadband
connection, could bring important changes to the way individuals and businesses employ
telecommunications services and solve the issues related to the explosive growth in demand for mobile
traffic, and the profitability decreasing of the mobile Broadband market. Therefore, the OMNs (Operator
Mobile Networks) should plan for deploying 5G mobile network beyond 2020, which is the expected year
for launching 5G. A business analysis study and mathematic modelling approach was considered. Also, a
new pricing model is proposed to be consistent with the growth of mobile broadband. The results show that
5G is very beneficial, not only because of its lower cost compared with 4G LTE, but also due to the
increment of average data consumptions offered by 5G mobile technologies and the increasing growth of
number of users. We also found that good analysis of Price Elasticity of Volume (PED) gives an important
margin of benefit. We confirm that the reuse of existing sites have a large impact on reducing costs when a
denser macro network deployed. However, we encountered a lack of the limited capacity related to the
macro sites and coverage limited with small cell solutions like femtocells, picocells deployed with 5G
millimeter Wave system and Wi-Fi.
KEYWORDS
4G, 5G, Benefit, CAPEX, Cost, OMN, OPEX, Prediction, Techno-economic.
1. INTRODUCTION
Mobile communication technology and industry is moving into the stage of the fifth generation (5G) of mobile technology. 5G is expected to fulfill requirements of ultra-high traffic volume density, connection density and mobility, as well as quality of service (QoS) requirements of multimedia applications towards 2020 and beyond [1] [2]. Most telecom vendors expect 5G to offer up to 10 Gbit/s over the air data rates and latency in the order of 1ms according to [3], and enable Internet of Things (IoT) devices to run on battery for up to ten years [4]. According to [5], in 2015, the global telecom service market was 965,3 billion USD and the voice service market is forecast to decline at a Compound Annual Growth Rate (CAGR) of -4.9% by 2020, while the data service market will grow by at a CAGR of 8.3%. In particular, the data service market has surpassed the voice service market since 2015, and it is expected to account for 65.7% of the entire telecom service market in 2020.
However, the OMNs are looking for improvement of their networks to expand coverage, increase capacity and support higher and better quality of service in a more efficient flow on costs and capacity. OMNs are facing cases where network cost may exceed revenues if no remedial actions are taken. Therefore, it is important to minimize the cost and maximize the revenue.
In this paper, we performed a business and financial analysis for the deployment of 5G mobile network and a mathematic model is designed to describe the revenue and predict costs. Our

International Journal of Mobile Network Communications & Telematics (IJMNCT) Vol. 7, No.1/2, April 2017
12
prediction is based on six (6) years from 2020 to 2025, and we focused on set of techno-economic indicators predicting necessity for upgrading our network. This paper consists of four sections. Section 2 gives a survey of the most relevant related work. Section 3 covers our modeling of the problem and describing a set of Techno-economic indicators predicting necessary for analyzing and predicting price and revenue of 5G network. In addition, we estimate Capital Expenditure (CAPEX) and Operative Expenditure (OPEX), which is used to compare with the revenue expected in order to make the operators to gain or lose money during the analyzed period. To our best knowledge, this is the first work to analyze the commercial launch of 5G mobile network using Price Elasticity of Volume (PED) and Volume Elasticity of Revenue ER(V) for inspecting the traffic (volume) and benefit. These two concepts are very useful when predicting the business situations for price, revenue and traffic. Furthermore, a new pricing model that can improve revenues of OMN is proposed. The traffic demand and network investment are analyzed in the last section.
2. RELATED WORK
According to the available literature in telecommunication, the techno-economic studies has become more and more important in the last ten years. The predicting is becoming increasingly important because of the high turbulence in telecommunications market, which is the result of rapid technological development followed by the exponential growth of mobile devices connected to the network and IoT. (Lingjie Duan et al.,2014) [6] analyzes the cellular operators’ timing of network upgrades and models that users can switch operators and services. An operator increases its market share but takes more risk or upgrade cost because 4G technology matures over time. (Yanjiao Chen et al., 2015) [7] analyses how an operator financially manages the cash flow and plans the 4G deployment in a finite time horizon. However (Filipe Vazl et al., 2013) [8] describes the economic and environmental comparative analysis performed on macro and femtocell, which enables the OMNs to adapt business models and deployment approaches to current and future trends in a sustainable way. (Markendahl.J et al., 2010) [9] compare the cost & capacity performance of femtocell and macrocellular networks. They used femtocells as a tool for operators to reduce network costs for mobile broadband. (Miroslaw Kantor et al., 2010) [10] identifies all essential elements of a general framework for the economic analysis of different access network technologies and architectures, as well as describes some specific issues/problems related to the techno-economic evaluation of next generation access networks. Our work is different from that study in that we are focusing on cost and benefit analysis in order to help OMNs by showing whether migrating to 5G network can make the operators to gain or loss money in the analyze period. Since there is a few study focusing in the techno-economic and the cost issues of mobile network, and for our best knowledge, this is the first model that analyzed the cost, volume, price and profit for the next generation of mobile network and we will have a contribution for the operators using a real data sets to easily identify the core parameters in deciding the path to deploying the new technology in a bigger scope. A mathematic model for revenue description and cost predicting was considered.
3. MODELING OF COST-BENEFIT PREDICTING
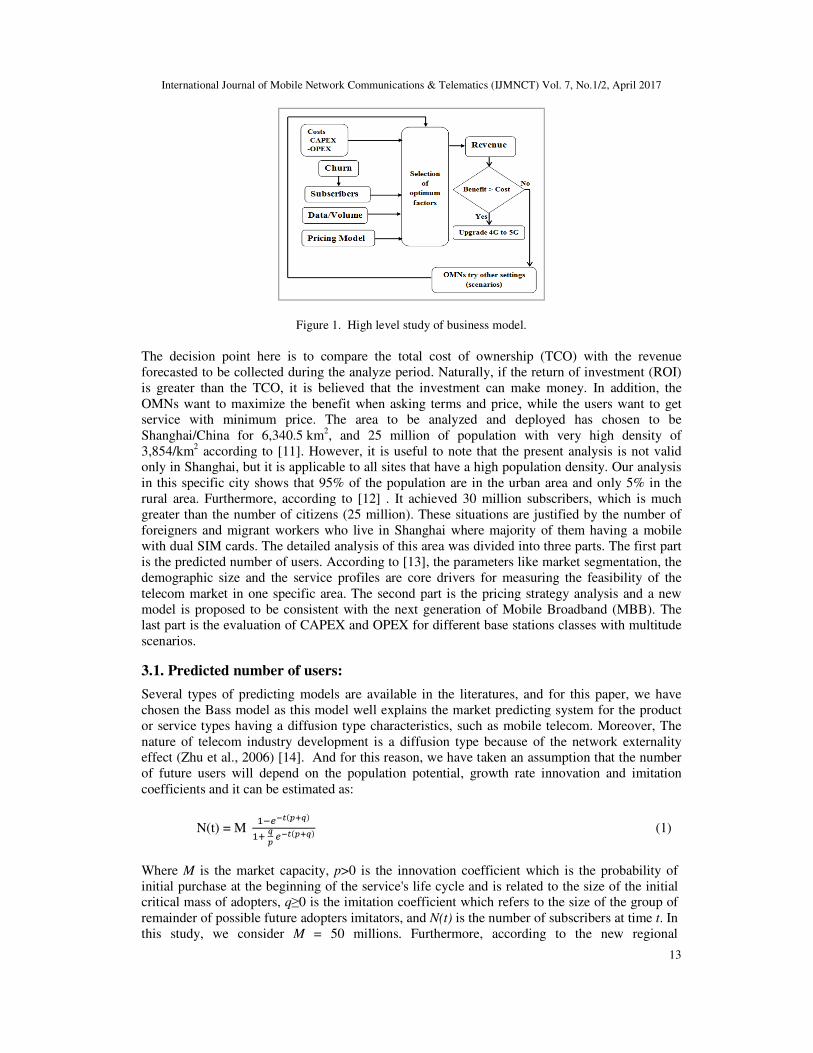
In order to analyze the required marketing parameters, a specific geographical area is assumed in this paper. As shown in Figure .1, the first part of the analysis process starts on analyzing the number of subscribers, which are defined as the users of mobile telephones, who subscribed to an OMN via Subscriber Identity Module (SIM card) in order to get access to the services (voice, data) in the target area.
International Journal of Mobile Network Communications & Telematics (IJMNCT) Vol. 7, No.1/2, April 2017
13
Figure 1. High level study of business model. The decision point here is to compare the total cost of ownership (TCO) with the revenue forecasted to be collected during the analyze period. Naturally, if the return of investment (ROI) is greater than the TCO, it is believed that the investment can make money. In addition, the OMNs want to maximize the benefit when asking terms and price, while the users want to get service with minimum price. The area to be analyzed and deployed has chosen to be Shanghai/China for 6,340.5 km2, and 25 million of population with very high density of 3,854/km2 according to [11]. However, it is useful to note that the present analysis is not valid only in Shanghai, but it is applicable to all sites that have a high population density. Our analysis in this specific city shows that 95% of the population are in the urban area and only 5% in the rural area. Furthermore, according to [12] . It achieved 30 million subscribers, which is much greater than the number of citizens (25 million). These situations are justified by the number of foreigners and migrant workers who live in Shanghai where majority of them having a mobile with dual SIM cards. The detailed analysis of this area was divided into three parts. The first part is the predicted number of users. According to [13], the parameters like market segmentation, the demographic size and the service profiles are core drivers for measuring the feasibility of the telecom market in one specific area. The second part is the pricing strategy analysis and a new model is proposed to be consistent with the next generation of Mobile Broadband (MBB). The last part is the evaluation of CAPEX and OPEX for different base stations classes with multitude scenarios.
3.1. Predicted number of users:
Several types of predicting models are available in the literatures, and for this paper, we have chosen the Bass model as this model well explains the market predicting system for the product or service types having a diffusion type characteristics, such as mobile telecom. Moreover, The nature of telecom industry development is a diffusion type because of the network externality effect (Zhu et al., 2006) [14]. And for this reason, we have taken an assumption that the number of future users will depend on the population potential, growth rate innovation and imitation coefficients and it can be estimated as:
N(t) = M��������
��
�������
(1)
Where M is the market capacity, p>0 is the innovation coefficient which is the probability of initial purchase at the beginning of the service's life cycle and is related to the size of the initial critical mass of adopters, q≥0 is the imitation coefficient which refers to the size of the group of remainder of possible future adopters imitators, and N(t) is the number of subscribers at time t. In this study, we consider M = 50 millions. Furthermore, according to the new regional

International Journal of Mobile Network Communications & Telematics (IJMNCT) Vol. 7, No.1/2, April 2017
14
classification for mobile telecommunications diffusion policy in China [15], we consider p = 0.009 and q= 0.42 for Shanghai. Graphically, results of modeling the number of mobile users according to (1) are illustrated in Figure .2.
Figure 2. Mobile users prediction for 6 years.
Our result has an s-shaped curve, which means that after launching of 5G technology, the number of adopters is still low by 2021, however innovators will start adopting the new technology. Progressively, more and more innovators are adopting 5G. As a result, the number of imitators takes an exponential form. Therefore, after the exponential development of adoptions, the number of new adopters will start to fall beyond 2024. However, our result in Figure .3 interprets the sales of the operators and we can see that in the beginning when the number of imitators is small relative to the number of innovators, there is an acceleration in sales. More adopters with time mean more users and consequently more sales of the new technology. As the number of adopters approaches the value of N(t) (50 million), the market reaches its saturation and sales decline.
Figure 3. Sales prediction
3.2. Pricing Model The manifold growth in data traffic for The Next Generation of Mobile Network (5G) will face a fundamental issue related to pricing strategy if not translated into a corresponding growth in revenues. The fast-growing of mobile broadband could ironically cause operators to fall into a profitability trap. Heavy price competition with flat-rate offers coupled with a lower willingness to pay among customers base on data usage continually expand. Furthermore, after factoring in the typical network cost to serve, more mobile broadband customers are already unprofitable, and operators are on a trajectory to face even more red link customers as usage rises relentlessly. According to [16], 89% of mobile broadband operators employ volume-charging models, sometimes in conjunction with capped pricing plans. This model is favorable only for low levels as 4G Mobile Network (eg.: 1GB, 3GB, or 10 GB per month), which will not be very satisfactory with the 5G Mobile Network and data could be unprofitable as shown in Figure. 4.

International Journal of Mobile Network Communications & Telematics (IJMNCT) Vol. 7, No.1/2, April 2017
Figure .4. Mobile data could be unprofitable (source:" The end of profitability", Tellabs insight, To address this issue and take advantage of the tremendous revenue generation potential of the fast-growing mobile broadband marketthree things: smart network, smart costing, and smart priciinnovative and flexible pricing models that can help OMNs to monetize the growth in data traffic, and thus sustain and grow in thisaddicted to broadband services and heavy users are willing to pay more for improved broadbaservice options. However, [18] consider that price is the single most important lever to drive profitability, and these findings may encourage OMNs to explor[19], they believe that we can use costumer value management techniques to estimate the value of the market offerings, and maximize the return.policy using three approaches:
3.2.1. Looking on the transparency and simplicity rather than network settings:
To reduce complexity, users must be periodically notified of their data consumption and the combination of volume-based & valueOMNs to make profitability. According to [20based before volume-based strategy to find the right consumer. For this reason, we used value pricing parameters like speed, time and data as the first pricing strategy. Avolume-based criteria which are based on user context like time of use, location and content for the secondary model of pricing. If content of video is monetized by period of time (minute or hour), it is easy for customers to inspect their parameter for volume and content being consumed as a criteria for value. This discusssummarized within Table 1.
Table 1
International Journal of Mobile Network Communications & Telematics (IJMNCT) Vol. 7, No.1/2, April 2017
Mobile data could be unprofitable (source:" The end of profitability", Tellabs insight,
To address this issue and take advantage of the tremendous revenue generation potential of the growing mobile broadband market, there is no doubt that it will be necessary to
three things: smart network, smart costing, and smart pricing. In this paper, we formulated innovative and flexible pricing models that can help OMNs to monetize the growth in data traffic, and thus sustain and grow in this highly competitive market. [17] shows that users are becoming
ices and heavy users are willing to pay more for improved broadba] consider that price is the single most important lever to drive
profitability, and these findings may encourage OMNs to explore value-based pricing. In], they believe that we can use costumer value management techniques to estimate the value
of the market offerings, and maximize the return. As our contribution, we propose a new pricing
transparency and simplicity rather than network settings:
o reduce complexity, users must be periodically notified of their data consumption and the based & value-based pricing which can be the most important choice for
profitability. According to [20], in economic policy, it is important to use valuebased strategy to find the right consumer. For this reason, we used value
pricing parameters like speed, time and data as the first pricing strategy. And we consider, based criteria which are based on user context like time of use, location and content for
the secondary model of pricing. If content of video is monetized by period of time (minute or hour), it is easy for customers to inspect their level of consumption, in this case we use time as a parameter for volume and content being consumed as a criteria for value. This discuss
Table 1. New Pricing Policy Using Users Context.
International Journal of Mobile Network Communications & Telematics (IJMNCT) Vol. 7, No.1/2, April 2017
15
Mobile data could be unprofitable (source:" The end of profitability", Tellabs insight, 2011).
To address this issue and take advantage of the tremendous revenue generation potential of the , there is no doubt that it will be necessary to focus on
we formulated innovative and flexible pricing models that can help OMNs to monetize the growth in data traffic,
] shows that users are becoming ices and heavy users are willing to pay more for improved broadband
] consider that price is the single most important lever to drive based pricing. In
], they believe that we can use costumer value management techniques to estimate the value As our contribution, we propose a new pricing
transparency and simplicity rather than network settings:
o reduce complexity, users must be periodically notified of their data consumption and the based pricing which can be the most important choice for
], in economic policy, it is important to use value-based strategy to find the right consumer. For this reason, we used value
nd we consider, based criteria which are based on user context like time of use, location and content for
the secondary model of pricing. If content of video is monetized by period of time (minute or level of consumption, in this case we use time as a
parameter for volume and content being consumed as a criteria for value. This discussion is

International Journal of Mobile Network Communications & Telematics (IJMNCT) Vol. 7, No.1/2, April 2017
16
3.2.2. Using Price Elasticity of Volume and Volume Elasticity of Revenue To increase profits and acquire more users of mobile market, OMNs must find the optimal price of services and predict sales of volume using two economic concepts: 3.2.2.1. Price Elasticity of Volume EV (P): Analogue to Price Elasticity of Demand (PED). Defined as percentage change in realized volume V per percentage change in unit price P. This is a measure of sensitivity of realized volume to changes in unit price:
���� = lim�′��→�
�′�������′�
�′�������′�
=�.∆�
�.∆�⇒
∆�
�= ���� ∙
∆�
�(2)
PED can be less than one (< 1) (in absolute value), which means that it is inelastic. It signifies that changes in price have a relatively small effect on the volume of the demanded service. However, in the case greater than one (>1), which is elastic, changes in price have a relatively large effect on the quantity demanded. 3.2.2.2. Volume elasticity of revenue ER(V):
Defined as percentage change in revenue R (charge) per percentage change in realized volume V. It is a measure of sensitivity of revenue to changes in realized volume:
�� � = lim� ′��→�
!′�!���!!′�
�′�������′�
=�.∆�
�.∆�⇒
∆�
�= �� � ∙
∆�
�(3)
OMN supposes that (ER(V) > 1), i.e. the increase of realized volume has an effect on increase of revenue. A user expects that (EV(P) < 1), i.e. the increase of realized volume has an effect on decrease of unit price and vice versa. With these two concepts, OMN gathering data on how users respond to changes in price can reduce risk and uncertainly. As we can show in Figure.5 that, a decrease in the price of service (voice calls or data) normally results in an increase in the quantity demanded by users because of the low demand and conversely.
Figure. 5. Predicted price and volume of 5G MBB using EV(P) and ER(V).

International Journal of Mobile Network Communications & Telematics (IJMNCT) Vol. 7, No.1/2, April 2017
17
Table 2. Presents a chart of how selling prices effects on profitability using (2) and (3) and we consider the demanded volume in the range of 50 and 150 GB, where 50 GB for the low, 100 GB for the moderate and 150 for the excessive demand levels for the year 2020. According to [21], network costs are 0.91 € per GB including site acquisition and build. In our case we assume that 5G will be less costs than 4G and we consider 0.75$ cost per GB in average. In this situation, we can see that the profit of sold 100 GB is much larger than 150 GB (125$ vs 37.5$). However, if we consider that 4G LTE can offer 10 GB/User/Month with the same price per GB as 5G, we can find that the profit margin of 10 GB of 4g LTE equals to 100 GB of 5G mobile network (125/200= 12.5/20). This means that 5G technologies is very beneficial than 4G not only because of its lower cost, but also due to the increase of average data consumption. In addition, it's very important to charge a flexible tariffs of data for different category of users which may attracting more users and earn more money.
Table 2. Effect of price and volume on profitability for 5G MBB.
Also, we define the profit of 5G MBB as a difference between the total revenue and the total costs of network for 1 GB of package. As shown in Figure 6. the revenue is maximized toward 200 $ when the price per GB is set to 2 $. Furthermore, we can observe that quantity demand decreases when price rises, however, revenue is maximized when price is set so that Price Elasticity of Demand is exactly one as shown in Figure. 7.
Figure 6. Pricing strategy for maximizing of revenue.
0
50
100
150
200
250
0 1 2 3 4 5
Re
ve
nu
e (
$)
Price

International Journal of Mobile Network Communications & Telematics (IJMNCT) Vol. 7, No.1/2, April 2017
18
Figure. 7. Price and elasticity of demand.
3.2.3. Extending the monthly package for 5G MBB
For the reason of 5G technology provides a high-speed wireless broadband connection and a large amount of GB/User/Month, this may create a difficulty for the users that could not using up the monthly package offered by the OMNs. To deal with this issue, we consider " the Extended Package" policy that can attract more users and create more competitiveness between operators. If one user choose a moderate package for 100 GB/Month, likely a part of that could not be consumed at the end of the month, in this case we added the reminder of this package to the succeeding monthly package. To encourage users consuming more data, we consider that the actual remainder package will be expired within the end of the next months. This may avoiding the unlimited extension of package and making sense for our approach. Figure .8 clarify our contribution for the extended package.
Figure. 8. Extended package.
3.3. Cost predicting and analysis The CAPEX comes from the network migrating elements, which usually considered as the fixed investment cost, and OPEX is the cost that comes after the deployment of dimensioned networks related to management and maintenance of 5G network. In order to perform a techno-economical analysis and comparison, we consider the following two deployment scenarios: Scenario.1:Replacement of the previous equipments of base station with deployment of new RAT(new antenna system and radio equipment) at regular sites without counting the CAPEX of the fiber backhaul (already installed). Scenario.2:The previous base stations are enhanced by adding new carriers and radio equipments to the existing RAT, and additional BSs supporting the previous RAT are deployed. In this case, a
0
1
2
3
4
5
6
7
8
9
10
0 1 2 3 4 5
Ela
sti
cit
y o
f Price

International Journal of Mobile Network Communications & Telematics (IJMNCT) Vol. 7, No.1/2, April 2017
19
software upgrade are necessary to increase backhaul transmission capacity in hot spot layer. We stand our analysis on comparing the total cost for each deployment scenario and we estimate that for a BS class i, the total expenditure Ci are discounted as:
Ci= ∑�#�$,&
���'�$(��()� (4)
Where �*�(,+ is the sum of costs occurred within year k of BS of class i and , is the discount rate. In this paper we considered k=6 years, and , =10% and that all BSs are installed during the first year. Further according to [9], we assume the cost for deploying a new MaBS (Macro Base Station) site in the urban area is 110 k$ and we add 10 k$ for radio equipments supporting 3 sectors and 5-20 MHz, yielding total of 120 k$. Also we assume 20 k$ cost of MaBS 1 carrier and we add 5 k$ per sector per carrier for the additional transceivers. However we assume 30 k$ annual OPEX for the new MaBS deployment. For the reuse of the existing MaBS, we assume 30 k$ related to site upgrade. We consider the related costs of MiBS (Micro Base Station) and PBS (Pico Base Station) equals to 50% and 15% respectively of a single-carrier MaBS equipment and 2 k$ per PBS for transmission. Note that MiBS and PBS requires 10 k$ and 2 k$ for the site deployment respectively. The CAPEX and OPEX of Femto Base Station (FBS) should be 1.1 k$ and 0.5 k$ respectively, and we consider 1.05 k$ CAPEX, and 0.14 k$ OPEX related to the WI-FI AP IEEE 802.1ac according to [22].
Nevertheless, European industry driven the development of 5G standards with reduction of OPEX by at least 20% [23]. In addition, they reduce 30% of CAPEX associated with fully standards-based solutions to smart cities deployments over the period 2017-2025 [24], thus we consider the OPEX and CAPEX for 5G mmW sites to be 30% lower compared with 4G LTE-A RAT.
To analyze the best way to achieve the maximum benefit and minimum expenditure, we assume only the case of the monopoly market to show whether the optimal upgrade. We present our simulation of the CAPEX and OPEX of different BSs for scenario 1 and scenario 2 in Figure. 10 and 11 respectively, and the total discounted cost are illustrated in Table 3 according to (4).
Figure.9.Predicted values of CAPEX & OPEX for BS/AP of different RATs related to new site (scenario 1).

International Journal of Mobile Network Communications & Telematics (IJMNCT) Vol. 7, No.1/2, April 2017
20
Figure. 10. Predicted values of CAPEX & OPEX for site reuse (scenario 2). From Figure. 9 and 10, when we compare the two scenarios, it's clear that the site reuse is significantly lower for CAPEX, and it's more convenient to the OMN to earn money, however, the two OPEX seem very close.
Table 3. Estimates of the total discounted cost in present value for new bss deployment using lTE-A, 5G mmW and IEEE 802.11ac [k$].
4. TRAFFIC DEMAND AND NETWORK INVESTMENT
4.1. Estimation of generated traffic demand
As the data volume per subscriber does not depend on the deployment scenario, the generated network traffic is proportional to the population density ρ. For this reason, we consider the traffic model presented in [25] to estimate the traffic demand for 1 km2 in Shanghai as follows:
G(t) = ρ.-
./0..1/.φ�t�D4 (5)
where 567 represents the number of hours of the day denoted as busy hours when the traffic is exaggerated and 586 is the number of days of the month. 9�:� represents a percentage of active users for a given time t using 9�:�=100% to calculate the peak area traffic demand at the busy hours in term of Gbps/km2, and Dk is the average data demand per month. In our case, we consider 567=9 across 30 days. Further, in combination with our result in Figure. 2 about the number of users, we consider a rather extreme populated area with ρ = 7,708 citizens/km2 (two times higher). Consequently, in order to ensure future-proof network beyond 2025, we will

International Journal of Mobile Network Communications & Telematics (IJMNCT) Vol. 7, No.1/2, April 2017
21
perform the dimensioning of the network from the case study with our contribution in Table 2 for three levels of demanded volume (low, moderate and excessive). Also, only downlink traffic is considered. Table 4 summarizes our results of estimated throughput of active users at busy hours in Shanghai with considering that subscribers are uniformly distributed within a cell.
Table 4. Predicted area traffic demand(Gbps/km2).
The presumed demand levels corresponds to average user data rate is approximately 1.59, 2.59 and 3.89 Mbps respectively during the 8 busy working hours in the case of 100% active users during the peak hour . However, we found that the total data demand for 7,708 users in 1 km2 area, is 11, 20 and 31 Gbps of throughput for low, moderate and excessive monthly demand respectively with consideration of 80% of radio resources utilization. 4.2. Network investment modeling We will apply different indoor deployment scenarios using different BS classes and various spectrum sizes to satisfy 11, 20 and 31 Gbps in 1 km2, then we compare the total discounted cost, coverage and capacity estimates for each BS class. However, the main issue for these scenarios is the wall penetration losses. According to [9], two compensation options are possible: building a denser 2.6 GHz network or deployment using 10Mhz within 0.8 GHz band in order to maximize the indoor coverage. To ovoid this issue in our case study and for the compensation purpose, 12 dB of attenuation, 5 times denser network should be built at 2.6 GHz band. Nevertheless, when using only 10 MHz spectrum in the 0.8 GHz band, the number of sites needs to be doubled for the capacity limitation reasons. Then we analyze the deployment options with MaBS including carrier aggregation and wall loss compensation. Also, we will develop one of the deployment scenario based on the number of FBS (Femto Base Station) per floor and the number of users per FBS in the case study. In addition, we use the indoor average spectral efficiency of 6.6 bps/Hz and 20 MHz of spectrum for FBS. Based on the elaborations related to the coverage and capacity of BSs in [26], we consider 1.02 km2 with 228 Mbps for the MaBS LTE-A and 0.001 km2 with 4245 Mbps for 5G mmW PBS. In addition, we consider 0.008 km2 with 132 Mbps for the FBS and 0.003 km2 with 1300 Mbps for Wi-Fi IEEE 802.11ac. The respective cost and capacity for different strategies of FBS/Wi-Fi, PBS and MaBS satisfying 11, 20 and 31 Gbps/km2 are summarized within Table 5 and 6 .

International Journal of Mobile Network Communications & Telematics (IJMNCT) Vol. 7, No.1/2, April 2017
22
Table 5. CAPEX and capacity for macro sites with carrier aggregation and wall losses compensation deployment.
Table 6. CAPEX and capacity for FBS and Wi-Fi IEEE 802.11ac.
From Table 5 and 6, we can see that the deployment of a large number of new sites is very costly (eg.175 -17.5 M$), but the reuse of existing sites leads to less costly deployment even when many sites need to be equipped with new RAT (eg.175 -3.5 M$). Also, result shows that 5G mmW PBS provides the lowest cost for our study case, but it indicates an essential constraint related to the coverage when dimensioning network. Even more, if we consider 13.6 dB wall attenuation of 5G mmW PBS for denser indoor deployment as in [27], we need to deploy 797 mmW sites inside the building to cover the area of 1 km2. Thus the total CAPEX will be very high 75.71 M$ (0.095x797). Findings indicate that for only around 2.73 M$ upgrade for the existing sites using MaBS LTE-A (0.8 & 2.6 GHz ) carrier aggregation , the excessive user demands will be ensured. Furthermore, for the different MaBS deployment comparisons, we found that the utilization of carrier aggregation functionality of LTE-A RAT is by far the most cost-efficient strategy with a rather small base station densities (only 33, 59 and 91 sites per km2) for the three levels; low, moderate and excessive demand respectively.

International Journal of Mobile Network Communications & Telematics (IJMNCT) Vol. 7, No.1/2, April 2017
23
We can see that the option of deploying new sites with carrier aggregation is more cost-efficient comparing to all deployment scenarios of new sites (7.08 M$ vs 8.8 M$, 17.5 M$ and 75.71 M$) for the moderate case. Due to the high coverage performance, the most cost-efficient option for the OMN is to reuse the existing sites (scenario2) for 0.8 GHz frequency carrier and 10 MHz (only 1, 1.77 and 2.73 M$) to satisfy (11, 20 and 31 Gbps/km2) for low, moderate and excessive demand level respectively. Furthermore, reuse of the MaBS (0.8 & 2.6 GHz ) sites with carrier aggregation is comparable to the reuse of the MaBS (5x2.6 GHz) with wall losses compensation (1.77 vs 1.76 M$). On the other hand, the FBS and Wi-Fi IEEE 802.11ac deployment becomes significantly cost efficient in case when FBS deployment can support large number of user (64 users/FBS) or (3 FBS/floor). In this case, we can satisfy the moderate level (20 Gbps) with the same cost for each scenario. Therefore, the trade should be done meeting the users' satisfaction. Nonetheless, FBS and Wi-Fi are strictly range limited. It can be noticed that these deployment options are almost unlimited from capacity and similar in terms of cost. We can conclude that the reuse of existing sites have a large impact also when a denser MaBS is deployed in order to compensate for wall attenuation. However, the situation is different for the deployment of new sites, unless the carrier aggregation functionality of LTA-A RAT is used. So we can summarize that, the main lack of the next generation network is recognized as limited coverage with small cell solutions like femtocells, picocells deployed with 5G mmW system and Wi-Fi. In another hand, we have the lack of the capacity limited by the macro sites. The solution to these two problems, is to investigate the cooperative layouts of macro sites with femtocells, 5G mmW PBS or Wi-Fi to achieve the trade-offs and the synergies between cost, capacity and coverage.
5. CONCLUSION AND FUTURE WORK Few studies have been made on 5G technology deployment using cost-benefit modeling and analysis technique, and present research performs the analysis on how to deploy 5G technology over the existing 4G mobile network in the monopoly setting using a real data sets. A cost-benefit modeling approach was considered for a period of 6 years over Shanghai/China. With this considerations, we performed a comparison analysis of price, cost, coverage and capacity for different scenarios using several classes of base stations and access points. In addition, we drive a new pricing model to be consistent with the growth of MBB based on value and volume based parameters. The study attempts to discover the benefit and the cost-effectiveness of migrating 4G to 5G mobile technology. The simulations have shown that good analyzing of Price Elasticity of Volume (PED) gives an important margin of benefit. Even more, we found that all the analyzed technologies are able of supporting all the mobile broadband demand for different scenarios, but macrocells improved with carrier aggregation is the most cost effectiveness solution. Also, the result reveals that using of existing sites have a large impact even when a denser MaBS is deployed in order to compensate for wall attenuation. However, the situation is different for the deployment of new sites, and the cost is very high unless the carrier aggregation functionality of LTA-A RAT is used. In addition, we identified the lack of the next generation network as limited coverage by small cell solutions like femtocells, picocells deployed with 5G mmW system and Wi-Fi. In another hand, we have the lack of the capacity limiting related to the macro sites. To tackle this challenge, it will be necessary for the OMN to investigate the cooperative layouts of macro sites with femtocells, 5G mmW PBS or advanced Wi-Fi APs like IEEE 802.11ac to get the trade-offs and the synergies between cost, capacity and coverage.

International Journal of Mobile Network Communications & Telematics (IJMNCT) Vol. 7, No.1/2, April 2017
24
Finally, the impact of the proposed approach related to the pricing model on the OMNs’ revenue and prospective comparison with traditional pricing strategies are considered as future works.
ACKNOWLEDGEMENTS
This work is supported by National China 973 Project No. 2015CB352401; Chinese National Research Fund (NSFC) Key Project No. 61532013; Shanghai Scientific Innovation Act of STCSM No.15JC1402400 and 985 Project of Shanghai Jiao Tong University with No. WF220103001. REFERENCES [1] Thomas.O, Karim.D, and Anish.K A Survey of Resource Management towards 5G radio access
network. IEEE communications surveys & tutorials, vol. 18, no 3. 1656 -1686 (3ed quarter 2016).
[2] White Paper IMT-2020 (5G) Promotion Group 5G NetworkTechnology Architecture ,(2015). [3] "5G Vision: 100 Billion connections, 1 ms Latency, and 10 Gbps Throughput", Huawei Technologies
(2015). [4] "GSMA Intelligence, Research Understanding 5G" www.gsmaintelligence.com, (2016). [5] White paper 2016 5G Service Roadmap 2022, (2016). [6] Lingjie.D, Jianwei.H, Jean.W; Economic analysis of 4G network upgrade Volume: 14, 975 -989,
DOI: 10.1109/TMC.2014- 2338299. [7] Yanjiao.C, Lingjie.D, Qian.Z; Financial analysis of 4G network deployment, INFOCOM; 1607-
1615,DOI: 10.1109/ 2015. 7218540 [8] Filipe.V,Pedro.S; Luís.G ; Américo.C; Economic and environmental comparative analysis on macro-
femtocell deployments in LTE-A; IEEE Conference 1 - 5, DOI: 10.1109 /VITAE.2013.6617060, (2013).
[9] Markendahl.J, Mäkitalo.Ö, "A comparative study of deployment options, capacity and cost structure for macrocellular and femtocell networks", IOFC (2010).
[10] Miroslaw.K, Krzysztof.W, Bart.L, Koen.C, Sofie.V, Mario.P, Lena.W, Jiajia.C, Attila.M; General framework for techn-economic analysis of next generation access networks; IEEE Conference, 10.1109/ICTON.2010. 5549342 (2010).
[11] Shanghai Population; http://worldpopulationreview.com/world-cities/shanghai-population (2016). [12] 82% of Chinese Have Mobile Phones, Some Provinces Have More Mobiles Than People;
www.tchinasia.com/82-chinas-13- billion-people-mobile-phones-provinces-mobiles-people. [13] Calcagno.A, and E. B; White Paper “LTE: a real disruptive technology and business opportunity
?” (2012). [14] Kevin.Z, Kenneth.L, Sean.X ;The Process of Innovation Assimilation by Firms in Different
Countries: A Technology Diffusion Perspective on E-Business.(2006). [15] GREGER.B; Ericsson business case mobile broadband "Don’t worry–Mobile broadband is profitable"
(2009). [16] Marco.N, Roland.K, Kate.G, Stuart.T, Bernhard.D, Jaak.D, Richard.M, Thomas.R, Praveen.D; Cisco
white paper "Rethinking Flat Rate Pricing for Broadband Services" (2012). [17] Ericsson Consumer Insight Summary Report ;"How smarter management and charging of mobile
internet can enhance the consumer experience?" Smarter Mobile Broadban (2012). [18] Book "Smart Pricing" by Jagmohan Raju, Z. John Zhang /Wharton School Publishing/ (2010). [19] Book "Value Merchants: Demonstrating and Documenting Superior Value in Business Markets
Hardcover" by James.A, Nirmalya.K, James.N (2008). [20] Karl-Heinz.S, Andrea.M; economic report "The Value before Volume pricing strategy" (2015). [21] GREGER.B; Ericsson business case mobile broadband "Don’t worry–Mobile broadband is profitable"
(2009). [22] Feidias.M "A techno-economic comparison between outdoor macro-cellular and indoor offloading
solutions" Master's Degree Project, Stockholm (2015). [23] Thibaut. K; 5G Research in Horizon 2020, "Why 5G research?" European Commission - DG
CONNECT Unit E1: Network Technologies (2014).

International Journal of Mobile Network Communications & Telematics (IJMNCT) Vol. 7, No.1/2, April 2017
25
[24] White paper; Machina research Open standards in IoT deployments would accelerate growth by 27% and reduce deployment costs by 30% (2016).
[25] Tomas.S et all; "Is backhaul becoming a bottleneck for green wireless access networks?". IEEE ICC (2014).
[26] Vladimir.N, Toni.J; Cost-effectiveness Assessment of 5G Systems with Cooperative Radio Resource Sharing (2015).
[27] Khan.F, Pi.Z, “Millimeter-wave Mobile Broadband Unleashing 3-300 GHz Spectrum,” in Proc. IEEE Symposium, 1-6, DOI: 10.1109/SARNOF.2011.
AUTHORS Mr.Ghoul Smail is a researcher in Shanghai Jiao Tong University / China specified for the next generation of mobile network, techno-economic issues for 5G mobile network and so on. Ghoul holds a Bachelor of Science degree in nature science from Sahed Mebarek / BBA / Algeria. He graduated as an engineer in artificial intelligence from the University of Setif / Algeria. He holds a post-graduate degree from the Polytechnic School of Algeria. He has a publication of paper related to the techno-economic analysis and prediction for the deployment of 5G mobile network. Prof. Weijia Jia’s research interests include next generation wireless communication, protocols and heterogeneous networks; distributed systems, multicast and anycast QoS routing protocols. In these fields, he has a number of publications in the prestige international journals (IEEE Transactions, e.g., ToN, TPDS, TC, TMC etc.), books/chapters and refereed international conference proceedings (e.g. ACM CCS, WiSec, MobiHoc, SenSys, IEEE ICDCS, INFOCOM etc.). He (with W. Zhou) has published a book “Distributed Network Systems” by Springer where the book contains extensive research materials and implementation examples. He has received the best paper award in a prestige (IEEE)conference. Prof. Jia is the guest Professor of Beijing U (ShenZhen Graduate School), University of Science and Technology of China, Beijing Jiao Tong University, Jinan University, Guangzhou, Chengdu University, China. He has served as the editors of IEEE TPDS and ComCom and PC chairs and members/keynote speakers for various prestige international conferences. He is the Senior Member of IEEE and the Member of ACM.