business intelligence strategies enables rapid analysis of
TRANSCRIPT
Methodology Open Access
Business intelligence strategies enables rapid analysis of quantitative proteomics dataLars Malmström1*, Pontus Nordenfelt2 and Johan Malmström2
Correspondence: [email protected] of molecular systems biology, ETH Zürich, Zürich, Switzerland. 2Department of Immunotechnology, BMC D13, Lund University, Lund, Sweden.
AbstractIntegration of high throughput data with online data resources is critical for data analysis and hypothesis generation. Relational databases facilitate the data integration, but larger amounts of data and the growth of the online data resources can slow down the data analysis process. We have developed a proof-of-principle software tool using concepts from the business intelligence field to enable fast, reliable and reproducible quantitative analysis of mass spectrometry data. The software allows the user to apply customizable analysis protocols that aggregates the data and stores it in fast and redundant data structures. The user then interacts with these data structures using web-based viewers to gauge data quality, analyze global properties of the data set and then explore the underlying raw data, which is stored in a tightly integrated relational database. To demonstrate the software we designed an experiment to describe the differentiation of a leukemic cell line, HL-60, to a neutrophil-like phenotype at the molecular level. The concepts described in this paper demonstrates how the new data model enabled rapid overview of the complete experiment in regard of global statistics, statistical calculations of expression profiles and integration with online resources providing deep insight into the data within a few hours.Keywords: Bioinformatics, mass spectrometry, quantitative proteomics data
© 2012 Malmström et al; licensee Herbert Publications Ltd. This is an open access article distributed under the terms of Creative Commons Attribution License (http://creativecommons.org/licenses/by/3.0),This permits unrestricted use, distribution, and reproduction in any medium, provided the original work is properly cited.
IntroductionData-driven systems biology relies on the ability to generate hypotheses from large amounts of high-content data. Insights gained from experimental data are integrated into a knowledge model and further hypotheses are tested in follow-up experiments. This necessitates a short time frame from hypothesis generation to comprehensive and quantitative data collection and fast, consistent analysis of the collected data. The proteome is a dynamic and spatially distributed set of proteins carrying out instructions encoded in the genome, which warrants proteome measurements as a critical component of molecular systems biology studies. Mass spectrometry-based proteomics have recently seen big technological advances both on the instruments and the data analysis workflows and is currently capable of generating quantitative digital representations of proteomes. In mass spectrometry-based proteomics, tryptic peptides from whole proteome digests are analyzed by tandem mass spectrometry (MS) where a subset of the ions detected in the survey scan (MS1) are selected for fragmentation, for example by collision induced dissociation (CID), and subsequently measured, generating MS/MS spectra (MS2). The resulting data is processed through multi-component workflows, where the peptides are inferred from the MS2 spectra by
searching them against a protein sequence database [1] followed by post-search filtering [2,3]. The MS1 spectra are used to derive relative abundance for the majority of the identified peptides [4-6].
In a typical data analysis workflow, the raw data files gets processed through two parallel software workflows, the identification workflow [7] and the quantitative workflow [4]. Results from both are then integrated to generate a file with protein intensities across the liquid chromatography (LC)/MS experiments. In order to understand the data, it is desirable to integrate the data with protein information databases such as the gene ontology (GO) [8], the protein data bank (PDB) [9], interaction databases and pathway databases [10] among others. As all the information flows one-way, the connection between the raw data and the processed data is lost and it becomes time consuming and labor intensive to verify any findings in the raw data. In addition, it can be difficult to capture the process in enough detail to reproduce it later. These issues can be addressed using relational databases, where the raw data is explicitly imported and annotated by tools used in the file-based workflows [11-14]. The data is stored in a structured and normalized transactional data model, i.e. each piece of data is stored only once and that allows for fast concurrent updates and safeguards against
Journal of Proteome Science Computational Biology
&
Malmström et al. Journal of Proteome Science & Computational Biology 2012, http://www.hoajonline.com/journals/pdf/2050-2273-1-5.pdf
2
doi: 10.7243/2050-2273-1-5
data inconsistencies. Comprehensive meta data such as parameter settings and software/database versions can easily be captured. The basic data structures are tables (two dimensional; rows and columns) that are referring to each other through references or foreign keys and there might be hundreds of tables each related to the others in a complex fashion. This setup is sometimes referred to as on-line transactional processing or OLTP data model. The OLTP data model solves the problem of connecting any derived result to the underlying raw data efficiently. However, with increasing speed and resolution of modern mass spectrometers and the exponential growth of online data resources, the amount of data stored in the OLTP model gets bigger. Certain types of queries (mostly ones that affect a large number of records) become slower with size and can become a prohibitive bottleneck when analyzing medium to large datasets like tens to hundreds of LC-MS experiments. This becomes an issue when the data analysis needs to be performed in a repetitive and interactive fashion where different normalization and data integration strategies are desired, which often results in the re-analysis of complete data sets several times.
To address the speed limitations of the OLTP models we have modified concepts from the business intelligence (BI) field and introduced these concepts into mass spectrometry-based proteomics bioinformatics to increase the analysis speed. BI is a term referring to a group of technologies applied to historical sales data to identify future business opportunities. BI makes it possible to analyze billions of transactions of hundreds of thousands different products across the globe interactively (<10 seconds to return a high-level report) and integrate the data with both global and local events [15-17]. The general strategy in BI is to aggregate the data in the transaction model at multiple resolutions and store the results explicitly in data structures referred to as a hyper-cube, which can have two or more dimensions. An example of a cube in the business world could be sales activities in different geographic regions creating a cube with one dimension for geographic resolution and another dimension might be product category. A dimension refers to the decomposition of some data attributes into various resolutions (levels) in a tree where each resolution contains all the information from the directly underlying resolution in a simple one-to-many relationship. An example of a dimension in the business world case would be regions where the highest resolution might be neighborhoods in a city and stretch up to countries or continents via city, country and state. The fundamental idea in BI is hence to pre-compute a data-set wide hyper-cube where the sides of the cube corresponds to a dimension and the construction of the cube is done by summing up sub-categories in the tree to greater resolutions, an operation referred to as aggregating. These cubes allow for fast querying and hence are attractive when analyzing large data sets. This also allows a dataset to be analyzed interactively where one
can navigate from resolution to resolution interactively (no view takes more than a few seconds to load). The strategy of storing each data point as part of multiple aggregate data points is sometimes referred to as on-line analytical processing, OLAP. In general, the original data is stored in the OLTP model and an OLAP model is generated from that OLTP model at some given time point in order to analyze it. The OLAP tables are regenerated at desired frequency to reflect changes in the underlying OLTP model.
In this paper, we developed an OLAP-based strategy to rapidly analyze data generated by mass spectrometry based proteomics workflows. We adapted the BI-concepts so that the typically non-decomposable mass spectrometry based proteomics data structures could be efficiently analyzed. To test the feasibility of our approach we applied the strategy to differentiation of the well-studied cell line HL-60. These cells were first purified from a patient with acute promyelocytic leukemia in 1977 [18]. It was early demonstrated that HL-60 cells can be differentiated into a neutrophil-like state by the addition of various inducers; one of these inducers is all-trans retinoic acid (ATRA) [19]. ATRA induces a neutrophil-like state that displays a similar phenotype to neutrophils in respect of phagocytosis and microbial killing [20]. Generally, it takes 3-5 days for the HL-60 cells to acquire neutrophil characteristics and behavior. In the present work, we hypothesized that the phagocytosis gain of function can be described at the molecular level by quantitative mass spectrometry based proteomics following a time-course experiment of the HL-60 differentiation process. We demonstrate how the data was processed through the automatic workflows and that the data was stored and processed in the OLTP. We found that we could create the OLAP model from the OLTP model in slightly over one wall-clock hour and that insight into the data could be gained within a few hours, much faster compared to analysis without the OLAP model.
Materials and methodsCell cultureHL-60 cells were acquired from the ATCC and were kept in low passage (<2 months) and then exchanged for freshly thawed aliquots. In accordance with the protocol of Breitman et al., [19] seeding of HL-60 cells was performed in l-glutamine-containing RPMI 1640 medium (PAA Labs, Gothenburg, Sweden), supplemented with 10% fetal bovine serum (Gibco, Copenhagen, Denmark). The cells were kept in 5% CO2 atmosphere at 37°C. No antibiotics were used. The viability of the differentiated cells was determined by trypan blue exclusion. To start differentiation of the cells 1µM all-trans retinoic acid (ATRA, Sigma-Aldrich, Stockholm, Sweden) was added.
Experiment & lysate preparationCells were counted and their viability was determined before harvesting at each time point. An aliquot of cells
Malmström et al. Journal of Proteome Science & Computational Biology 2012, http://www.hoajonline.com/journals/pdf/2050-2273-1-5.pdf
3
doi: 10.7243/2050-2273-1-5
were withdrawn, centrifuged (5 min, 146 g, swing-out) and washed three times with sterile PBS. The samples were resuspended in lysis buffer (8M Urea, 100 mM Tris, Roche Complete Mini, 0.1U/ml Benzonase, pH 8.0, sterile filtered) and frozen at -20°C. After all samples were collected, they were thawed and disrupted with a sonicator (Sonifier 150, Branson) at setting 5 (few bursts at half of maximum intensity) in 100 ml volume. Finally the samples were stored at -20°C until analysis.
Sample preparation50ml of the protein solutions were reduced with 5mM TCEP, final concentration, for 37°C for 1 hour followed by incubation of 10 mM Iodoacetamide, final concentration, in room temperature in the dark for 45 minutes. The protein solution was diluted 5 times using fresh 100 mM Tris buffer and 15 mg of Trypsin was added to the solution and incubated over night at 37°C. The resulting peptide mixtures were concentrated using spin-columns from Harvard Apparatus using the manufactures’ instructions. The concentrated peptides were dried in a speedvac and reconstituted in 50 ml 2% Acetonitrile, 0.2% formic acid.
Mass Spectrometry and data analysisThe hybrid LTQ-FT-ICR mass spectrometer was interfaced to a nanoelectrospray ion source (both from Thermo Electron, Bremen, Germany) coupled online to a Tempo 1D-plus nanoLC (Applied Biosystems/MDS Sciex, Foster City, CA). Peptides were separated on a RP-LC column (75μm x 15 cm) packed in-house with C18 resin (Magic C18 AQ 3 μm; Michrom BioResources, Auburn, CA, USA) using a linear gradient from 98% solvent A (98% water, 2% acetonitrile, 0.15% formic acid) and 2% solvent B (98% acetonitrile, 2% water, 0.15% formic acid) to 30% solvent B over 90 minutes at a flow rate of 0.3 μl/min. Three MS/MS spectra were acquired in the linear ion trap per each FT-MS scan which was acquired at 100,000 FWHM nominal resolution settings with an overall cycle time of approximately 1 second. The specific m/z value of the peptide fragmented by CAD was excluded from reanalysis for 0.5 min using the dynamic exclusion option. Charge state screening was employed to select for ions with at least two charges and rejecting ions with undetermined charge state. The normalized collision energy was set to 32%, and one microscan was acquired for each spectrum.
The RAW files were converted to an mzXML file format using ReAdW v.4.0.2 using default parameters. The MS2 spectra were searched through the X! Tandem 2008-05-26 search engine [1] against a concatenated forward and reversed human protein database (ipi, version 3.59), consisting of 80128 proteins as well as known contaminants such as porcine trypsin and human keratins. The search was performed with semi-tryptic cleavage specificity, 1 missed cleavages, mass tolerance of 25 ppm for the precursor ions
and 0.5 Da for fragment ions, methionine oxidation as variable modification and cysteine carbamidomethylation as fixed modification. The database search results were further processed using the Peptide- and ProteinProphet programs [2]. The cutoff value for accepting individual MS/MS spectra was set to a peptideProphet probability of 0.84. Based on the reversed database sequence strategy and Peptide- and ProteinProphet this corresponds to a 1% FDR at the peptide level. The proteinProphet cutoff was .99 which corresponds to a 1% FDR at the protein level. The peptides matching to multiple members of a protein family the redundancy was eliminated using the ProteinProphet programs. MS1-based quantification was done using SuperHirn [4]. Features were detected using SuperHirn using a retention time tolerance of 1, MS1 m/z tolerance of 10, MS2 PPM m/z tolerance of 30. Only features with charge 1-5 were included. Any feature for which more than one peptide could be identified at the 1% FDR, hence mapping to more than one protein, were discarded.
Software availabilityThe software is provided as is under the GNU public license and can be downloaded from sourceforge under the following url: http://sourceforge.net/projects/twoddb/
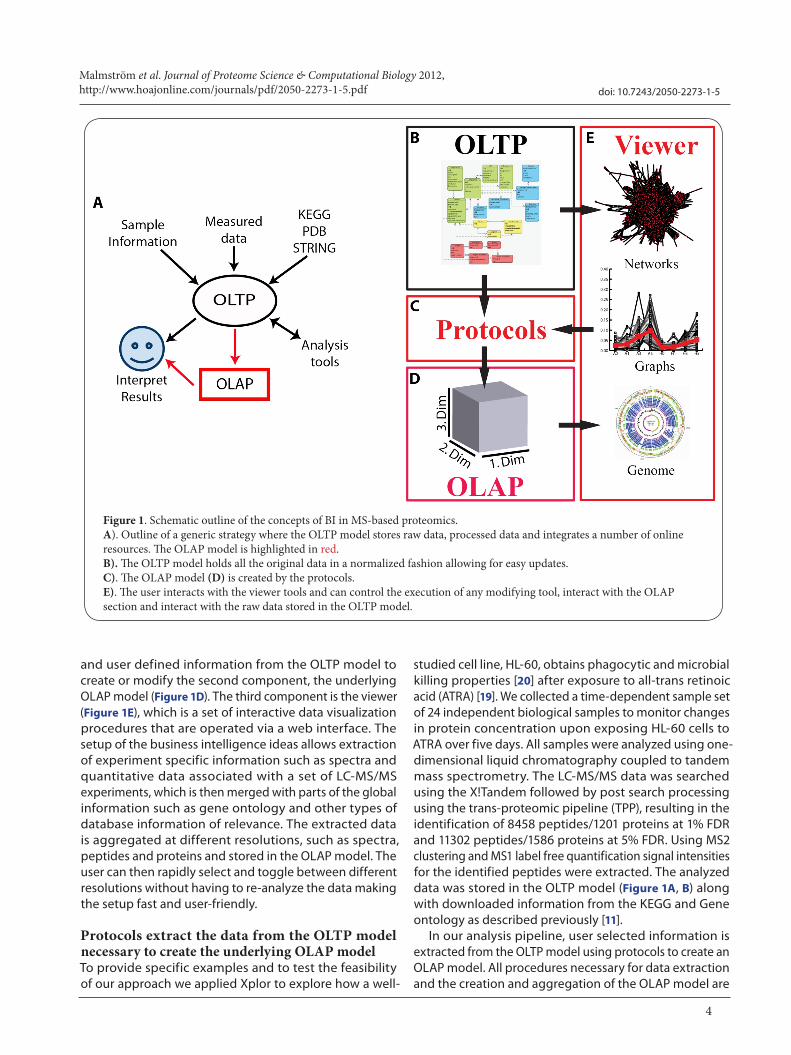
Results Application of business intelligence in proteomicsThe use of relational OLTP database models as the basic structure for storing large amount of data is beneficial for connecting any derived results with the underlying primary data. Figure 1A shows a schematic over the role of the OLTP model where information from several sources is imported into the OLTP model as outlined in the top of the figure. Measured data and sample information are imported along with publically available databases like KEGG [21], PDB [9] and STRING [10]. Several analysis tools, for example TPP [7], then exports and analyze the data and subsequently store the derived results with explicit references to the underlying data. The user then access and analyze the data via a graphical user interface. OLTP models in general suffer from becoming slower with more complex data models. Single queries in a data rich OLTP model takes prohibitively long to execute as the number of experiments reach thousands and identified proteins and peptides reach millions. To address the OLTP model speed limitations, subsets of data from the OLTP model is used to create faster OLAP models, as indicated by the red arrows in figure 1A. The OLAP model contains a subset of the data present in the OLTP model many times, aggregated in several different ways which allows for fast querying. Our implementation of the business intelligence ideas, called Xplor, consists of three components (red boxes in Figure 1C-E). The first component, the protocols (Figure 1C), are collections of procedures that extract specific
Malmström et al. Journal of Proteome Science & Computational Biology 2012, http://www.hoajonline.com/journals/pdf/2050-2273-1-5.pdf
4
doi: 10.7243/2050-2273-1-5
and user defined information from the OLTP model to create or modify the second component, the underlying OLAP model (Figure 1D). The third component is the viewer (Figure 1E), which is a set of interactive data visualization procedures that are operated via a web interface. The setup of the business intelligence ideas allows extraction of experiment specific information such as spectra and quantitative data associated with a set of LC-MS/MS experiments, which is then merged with parts of the global information such as gene ontology and other types of database information of relevance. The extracted data is aggregated at different resolutions, such as spectra, peptides and proteins and stored in the OLAP model. The user can then rapidly select and toggle between different resolutions without having to re-analyze the data making the setup fast and user-friendly.
Protocols extract the data from the OLTP model necessary to create the underlying OLAP modelTo provide specific examples and to test the feasibility of our approach we applied Xplor to explore how a well-
studied cell line, HL-60, obtains phagocytic and microbial killing properties [20] after exposure to all-trans retinoic acid (ATRA) [19]. We collected a time-dependent sample set of 24 independent biological samples to monitor changes in protein concentration upon exposing HL-60 cells to ATRA over five days. All samples were analyzed using one-dimensional liquid chromatography coupled to tandem mass spectrometry. The LC-MS/MS data was searched using the X!Tandem followed by post search processing using the trans-proteomic pipeline (TPP), resulting in the identification of 8458 peptides/1201 proteins at 1% FDR and 11302 peptides/1586 proteins at 5% FDR. Using MS2 clustering and MS1 label free quantification signal intensities for the identified peptides were extracted. The analyzed data was stored in the OLTP model (Figure 1A, B) along with downloaded information from the KEGG and Gene ontology as described previously [11].
In our analysis pipeline, user selected information is extracted from the OLTP model using protocols to create an OLAP model. All procedures necessary for data extraction and the creation and aggregation of the OLAP model are
Figure 1. Schematic outline of the concepts of BI in MS-based proteomics. A). Outline of a generic strategy where the OLTP model stores raw data, processed data and integrates a number of online resources. The OLAP model is highlighted in red. B). The OLTP model holds all the original data in a normalized fashion allowing for easy updates. C). The OLAP model (D) is created by the protocols. E). The user interacts with the viewer tools and can control the execution of any modifying tool, interact with the OLAP section and interact with the raw data stored in the OLTP model.
Malmström et al. Journal of Proteome Science & Computational Biology 2012, http://www.hoajonline.com/journals/pdf/2050-2273-1-5.pdf
5
doi: 10.7243/2050-2273-1-5
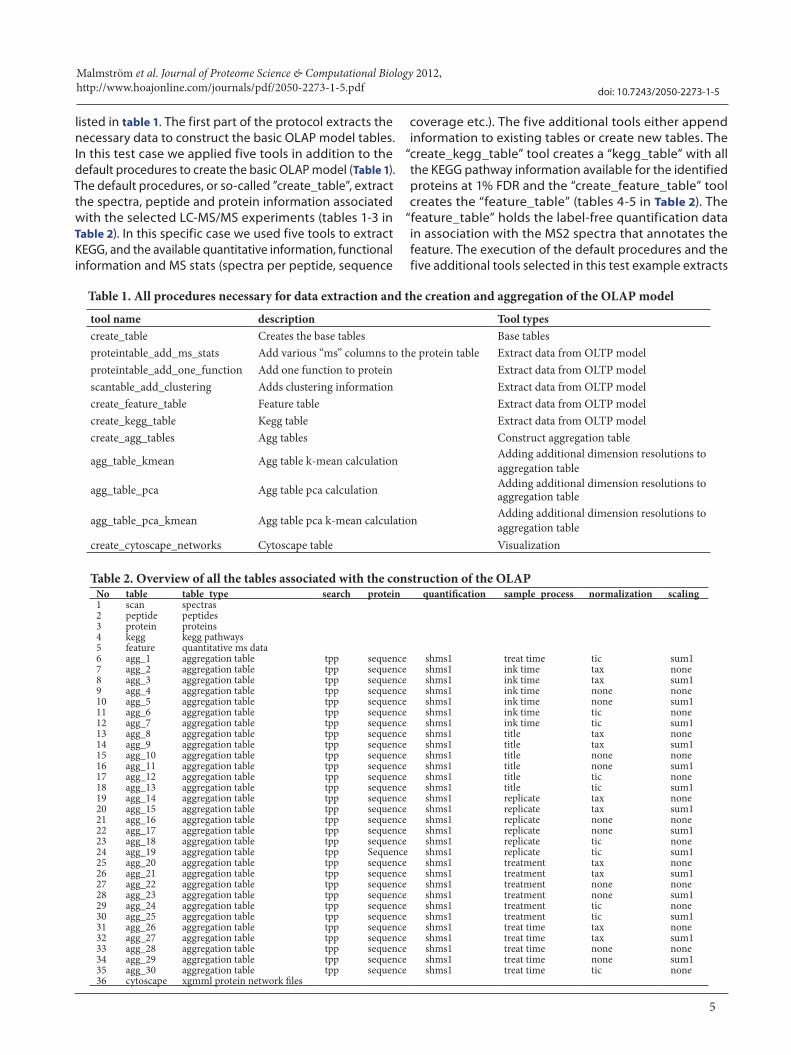
listed in table 1. The first part of the protocol extracts the necessary data to construct the basic OLAP model tables. In this test case we applied five tools in addition to the default procedures to create the basic OLAP model (Table 1). The default procedures, or so-called ”create_table”, extract the spectra, peptide and protein information associated with the selected LC-MS/MS experiments (tables 1-3 in Table 2). In this specific case we used five tools to extract KEGG, and the available quantitative information, functional information and MS stats (spectra per peptide, sequence
coverage etc.). The five additional tools either append information to existing tables or create new tables. The
“create_kegg_table” tool creates a “kegg_table” with all the KEGG pathway information available for the identified proteins at 1% FDR and the “create_feature_table” tool creates the “feature_table” (tables 4-5 in Table 2). The
“feature_table” holds the label-free quantification data in association with the MS2 spectra that annotates the feature. The execution of the default procedures and the five additional tools selected in this test example extracts
tool name description Tool typescreate_table Creates the base tables Base tablesproteintable_add_ms_stats Add various “ms” columns to the protein table Extract data from OLTP modelproteintable_add_one_function Add one function to protein Extract data from OLTP modelscantable_add_clustering Adds clustering information Extract data from OLTP modelcreate_feature_table Feature table Extract data from OLTP modelcreate_kegg_table Kegg table Extract data from OLTP modelcreate_agg_tables Agg tables Construct aggregation table
agg_table_kmean Agg table k-mean calculation Adding additional dimension resolutions to aggregation table
agg_table_pca Agg table pca calculation Adding additional dimension resolutions to aggregation table
agg_table_pca_kmean Agg table pca k-mean calculation Adding additional dimension resolutions to aggregation table
create_cytoscape_networks Cytoscape table Visualization
No table table_type search protein quantification sample_process normalization scaling1 scan spectras2 peptide peptides3 protein proteins4 kegg kegg pathways5 feature quantitative ms data6 agg_1 aggregation table tpp sequence shms1 treat time tic sum17 agg_2 aggregation table tpp sequence shms1 ink time tax none8 agg_3 aggregation table tpp sequence shms1 ink time tax sum1 9 agg_4 aggregation table tpp sequence shms1 ink time none none10 agg_5 aggregation table tpp sequence shms1 ink time none sum1 11 agg_6 aggregation table tpp sequence shms1 ink time tic none12 agg_7 aggregation table tpp sequence shms1 ink time tic sum113 agg_8 aggregation table tpp sequence shms1 title tax none14 agg_9 aggregation table tpp sequence shms1 title tax sum1 15 agg_10 aggregation table tpp sequence shms1 title none none16 agg_11 aggregation table tpp sequence shms1 title none sum1 17 agg_12 aggregation table tpp sequence shms1 title tic none18 agg_13 aggregation table tpp sequence shms1 title tic sum119 agg_14 aggregation table tpp sequence shms1 replicate tax none20 agg_15 aggregation table tpp sequence shms1 replicate tax sum1 21 agg_16 aggregation table tpp sequence shms1 replicate none none22 agg_17 aggregation table tpp sequence shms1 replicate none sum1 23 agg_18 aggregation table tpp sequence shms1 replicate tic none24 agg_19 aggregation table tpp Sequence shms1 replicate tic sum125 agg_20 aggregation table tpp sequence shms1 treatment tax none26 agg_21 aggregation table tpp sequence shms1 treatment tax sum1 27 agg_22 aggregation table tpp sequence shms1 treatment none none28 agg_23 aggregation table tpp sequence shms1 treatment none sum1 29 agg_24 aggregation table tpp sequence shms1 treatment tic none30 agg_25 aggregation table tpp sequence shms1 treatment tic sum131 agg_26 aggregation table tpp sequence shms1 treat time tax none32 agg_27 aggregation table tpp sequence shms1 treat time tax sum1 33 agg_28 aggregation table tpp sequence shms1 treat time none none34 agg_29 aggregation table tpp sequence shms1 treat time none sum1 35 agg_30 aggregation table tpp sequence shms1 treat time tic none36 cytoscape xgmml protein network files
Table 1. All procedures necessary for data extraction and the creation and aggregation of the OLAP model
Table 2. Overview of all the tables associated with the construction of the OLAP
Malmström et al. Journal of Proteome Science & Computational Biology 2012, http://www.hoajonline.com/journals/pdf/2050-2273-1-5.pdf
6
doi: 10.7243/2050-2273-1-5
the information necessary from the OLTP model to create the basic OLAP model. Each data record in the OLTP model is stored several times in the OLAP model to facilitate the aggregation of the data using the aggregation tools.
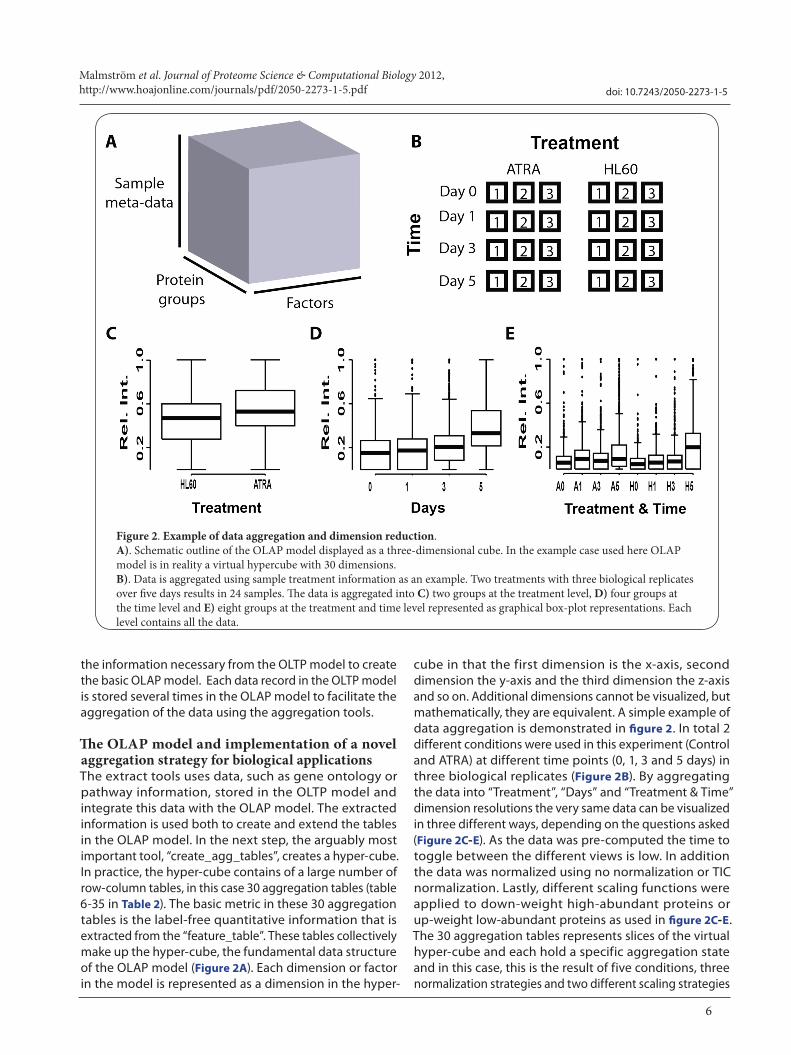
The OLAP model and implementation of a novel aggregation strategy for biological applicationsThe extract tools uses data, such as gene ontology or pathway information, stored in the OLTP model and integrate this data with the OLAP model. The extracted information is used both to create and extend the tables in the OLAP model. In the next step, the arguably most important tool, “create_agg_tables”, creates a hyper-cube. In practice, the hyper-cube contains of a large number of row-column tables, in this case 30 aggregation tables (table 6-35 in Table 2). The basic metric in these 30 aggregation tables is the label-free quantitative information that is extracted from the “feature_table”. These tables collectively make up the hyper-cube, the fundamental data structure of the OLAP model (Figure 2A). Each dimension or factor in the model is represented as a dimension in the hyper-
cube in that the first dimension is the x-axis, second dimension the y-axis and the third dimension the z-axis and so on. Additional dimensions cannot be visualized, but mathematically, they are equivalent. A simple example of data aggregation is demonstrated in figure 2. In total 2 different conditions were used in this experiment (Control and ATRA) at different time points (0, 1, 3 and 5 days) in three biological replicates (Figure 2B). By aggregating the data into “Treatment”, “Days” and “Treatment & Time” dimension resolutions the very same data can be visualized in three different ways, depending on the questions asked (Figure 2C-E). As the data was pre-computed the time to toggle between the different views is low. In addition the data was normalized using no normalization or TIC normalization. Lastly, different scaling functions were applied to down-weight high-abundant proteins or up-weight low-abundant proteins as used in figure 2C-E. The 30 aggregation tables represents slices of the virtual hyper-cube and each hold a specific aggregation state and in this case, this is the result of five conditions, three normalization strategies and two different scaling strategies
Figure 2. Example of data aggregation and dimension reduction. A). Schematic outline of the OLAP model displayed as a three-dimensional cube. In the example case used here OLAP model is in reality a virtual hypercube with 30 dimensions. B). Data is aggregated using sample treatment information as an example. Two treatments with three biological replicates over five days results in 24 samples. The data is aggregated into C) two groups at the treatment level, D) four groups at the time level and E) eight groups at the treatment and time level represented as graphical box-plot representations. Each level contains all the data.
Malmström et al. Journal of Proteome Science & Computational Biology 2012, http://www.hoajonline.com/journals/pdf/2050-2273-1-5.pdf
7
doi: 10.7243/2050-2273-1-5
(5*2*3 = 30). In this particular case, data aggregation is straightforward as the dimensions are decomposable into smaller units as the information used for aggregation was user defined.
In other examples, data aggregation is more difficult in particular when dealing with biological and/or mass spectrometry data, as the dimensions are not fully decomposable. For example one of the dimensions referred to as “protein group” (Figure 2A) allows aggregation from measured spectra to peptide to protein and finally collections of proteins, for example as defined by the Gene Ontology, by protein complexes or by any other type of groupings. These types of dimensions are non-trivial to aggregate since a spectrum can be matched to several peptides (due to co-fragmentation) and also, a peptide can be inferred from multiple spectra. A peptide can in turn be part of many proteins and proteins in general have multiple inferred peptides. Multi-function proteins have more than one GO function assigned. Our implementation allows for three different ways of dealing with non-decomposable dimensions where the first is to filter out anything that cannot be unambiguously grouped from the higher resolution. The second way is to double-count each object that maps to two or more groups at the lower resolution (common for qualitative groups) and the third is to split the signal among the groups and here one can do this uniformly or weighted by the size of the groups (common for quantitative groups). In Xplor, the developer can select the most appropriate aggregation strategy depending on dimension type. For example when a peptide sequence is shared between several proteins the developer can decide to split peptide quantification between the protein sequences equally, weighted or exclude the peptides all together. In the experiment described in this manuscript we decided to exclude peptide sequence matching to more than one protein. The difficult aggregation situations common in mass spectrometry based proteomics can in this way be circumvented using the three aggregation strategies and thus allows us to fully utilize the speed and flexibility of traditional business intelligence approaches when analyzing the data. It also allows the user to easily introduce new types of groupings and then decide how to aggregate these groups.
Adding additional dimension resolutions using pathway and statistical analysisThe construction of the OLAP model and resulting data aggregation is beneficial to view the data in different ways. However, to increase the interpretability of the complex data it is advantageous to group sets of proteins according to co-regulation or pathway information. The outlined BI strategy test case described was extended to facilitate this. The following tools, “agg_table_kmean”,
“agg_table_pca” and “agg_table_pca_kmean” (Table 1), performs a dimension reduction on each dimension of the
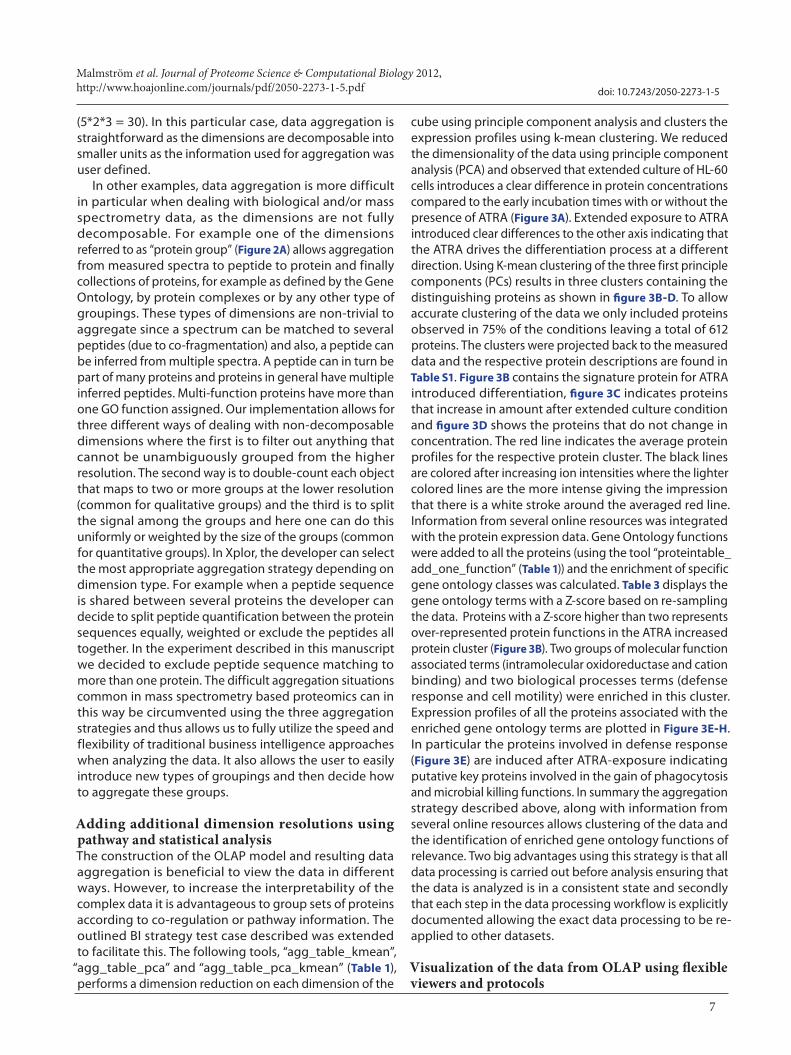
cube using principle component analysis and clusters the expression profiles using k-mean clustering. We reduced the dimensionality of the data using principle component analysis (PCA) and observed that extended culture of HL-60 cells introduces a clear difference in protein concentrations compared to the early incubation times with or without the presence of ATRA (Figure 3A). Extended exposure to ATRA introduced clear differences to the other axis indicating that the ATRA drives the differentiation process at a different direction. Using K-mean clustering of the three first principle components (PCs) results in three clusters containing the distinguishing proteins as shown in figure 3B-D. To allow accurate clustering of the data we only included proteins observed in 75% of the conditions leaving a total of 612 proteins. The clusters were projected back to the measured data and the respective protein descriptions are found in Table S1. Figure 3B contains the signature protein for ATRA introduced differentiation, figure 3C indicates proteins that increase in amount after extended culture condition and figure 3D shows the proteins that do not change in concentration. The red line indicates the average protein profiles for the respective protein cluster. The black lines are colored after increasing ion intensities where the lighter colored lines are the more intense giving the impression that there is a white stroke around the averaged red line. Information from several online resources was integrated with the protein expression data. Gene Ontology functions were added to all the proteins (using the tool “proteintable_add_one_function” (Table 1)) and the enrichment of specific gene ontology classes was calculated. Table 3 displays the gene ontology terms with a Z-score based on re-sampling the data. Proteins with a Z-score higher than two represents over-represented protein functions in the ATRA increased protein cluster (Figure 3B). Two groups of molecular function associated terms (intramolecular oxidoreductase and cation binding) and two biological processes terms (defense response and cell motility) were enriched in this cluster. Expression profiles of all the proteins associated with the enriched gene ontology terms are plotted in Figure 3E-H. In particular the proteins involved in defense response (Figure 3E) are induced after ATRA-exposure indicating putative key proteins involved in the gain of phagocytosis and microbial killing functions. In summary the aggregation strategy described above, along with information from several online resources allows clustering of the data and the identification of enriched gene ontology functions of relevance. Two big advantages using this strategy is that all data processing is carried out before analysis ensuring that the data is analyzed is in a consistent state and secondly that each step in the data processing workflow is explicitly documented allowing the exact data processing to be re-applied to other datasets.
Visualization of the data from OLAP using flexible viewers and protocols
Malmström et al. Journal of Proteome Science & Computational Biology 2012, http://www.hoajonline.com/journals/pdf/2050-2273-1-5.pdf
8
doi: 10.7243/2050-2273-1-5
The third and last part of Xplor is the viewers. A viewer is a collection of procedures to visualize or compute simple summary statistics from the underlying hyper-cube (Figure 1E). Each procedure is designed to provide specific types of requested information to answer specific questions. Since the hyper-cube is designed to minimize the processing needed for the visualization, each tool is fast loading within a few seconds even for large data sets. Most of the graphic is generated on the fly using R and each procedure consists of a data retrieval part, a graph or table generation part and a simple controller part. In general these procedures are less than 10-15 lines of code (see the supplement material for examples). As there are multiple tools and they only can be applied when the underlying hyper-cube has the
correct format, the Xplor software determines which tools can be used given the current status of the OLAP model and organize the tools in logical categories. The main categories are experiment, protein, peptide and spectra. In broad terms, visualization and global data quality tools are organized under experiment; protein is the most commonly used category for biological questions and the two last categories are mostly used to determine the quality of the experiment.
Discussion The rapid growing size and complexity of quantitative mass spectrometry based proteomics data and the need of integrating the data with online resources creates significant
-0.10 -0.05 0.00 0.05 0.10
-0.1
0-0
.05
0.00
0.05
0.10
Comp.1
Com
p.2
1
2
3
4
5
6
7
8
9
10
11
12
13
1415
16
17
18
19
20
21
2223
24
25
26
27
2829
3031
32 33
34
35
36
37
38
39
40
41
4243
4445
46
47
48
49
50 51
52
53
54
55
56
57
58
59
60
61
62
63
64
65
66
6768
69
70
71
72
73
74
75
767778
79
8081
82
83
84
8586
87
888990
91 9293
94
95
96
97
9899
100
101
102
103
104
105
106
107108
109
110
111
112
113
114115
116
117
118
119
120
121
122
123
124
125126
127
128129
130
131132
133
134
135
136137
138
139140
141
142
143
144145
146
147
148
149
150
151
152153
154
155
156
157
158 159160
161
162
163
164
165166167
168
169
170
171
172173174175
176
177
178
179180
181
182
183
184
185186
187
188
189190
191
192193
194
195
196
197
198
199
200
201
202
203
204
205 206
207
208
209
210
211
212
213
214
215
216
217
218
219
220
221
222223
224
225
226
227
228
229230
231
232233
234
235 236237
238
239240
241 242
243
244
245
246
247
248249
250
251
252253
254
255256
257
258
259
260
261
262
263
264
265
266
267
268
269
270
271
272273
274275
276
277278
279
280
281
282
283
284
285
286
287
288
289
290291
292
293
294
295 296
297
298
299
300
301
302
303
304
305306307
308
309
310
311
312
313
314
315 316317
318
319
320
321
322
323324
325
326 327
328
329
330331
332
333
334
335
336
337
338339
340341
342
343
344
345
346347
348349
350
351
352
353
354 355
356
357358
359
360
361
362
363
364
365
366367
368369
370371
372
373
374
375
376
377
378
379
380
381
382
383
384385
386
387
388389 390391
392
393394395396
397 398
399
400401
402
403404
405
406 407
408
409
410
411
412
413
414415416
417
418
419
420
421
422
423
424
425
426
427
428
429430
431432
433
434435
436
437
438
439
440
441
442
443444
445446
447448
449450
451
452
453
454
455
456457
458
459
460
461
462
463
464
465
466
467
468
469
470
471
472473
474475
476 477
478
479480
481
482483
484
485
486
487
488
489
490
491
492 493
494
495
496
497
498499
500501
502503
504
505
506
507
508
509
510511
512
513514
515
516
517
518519
520521
522
523
524
525526527
528
529
530
531532
533
534
535536
537538
539
540
541542
543
544545
546
547 548549
550551
552
553
554
555
556
557
558
559
560
561
562
563
564
565
566
567568
569
570
571
572
573
574575 576
577
578579
580
581
582
583
584 585
586587
588589
590
591
592
593
594
595
596
597598
599
600
601
602
603
604
605
606607608
609610
611
612
613
-15 -10 -5 0 5 10 15
-15
-10
-50
510
15
ATRA_0
100% 100% 100%
A0 A1 A3 A5 H0 H1 H3 H5 A0 A1 A3 A5 H0 H1 H3 H5
ATRA_1
HL60_0HL60_1
ATRA_5
HL60_3 HL60_5
ATRA_3
A0 A1 A3 A5 H0 H1 H3 H5
A0 A1 A3 A5 H0 H1 H3 H5 A0 A1 A3 A5 H0 H1 H3 H5 A0 A1 A3 A5 H0 H1 H3 H5 A0 A1 A3 A5 H0 H1 H3 H5
100% 100% 100% 100% H
A B
FE
C
G
D
Figure 3. Time dependent quantitative protein profiles from ATRA induced HL-60 cells from 0-5 days. A). biplot of the two first principle components (PCs) B) ATRA induced proteins C) proteins induced by extended culture of HL-60 cells D) proteins that to not change in protein concentration upon ATRA stimulation or extended culture. Gene ontology annotations with a Z score higher than two within the ATRA induced proteins were extracted and plotted individually for E) Defense response, F) Cell motility, G) intramolecular oxidoreductase activity and H) Cation binding. A = ATRA stimulated, H = Control
GO GO Acc No Description No in sample. Total BG_mean BG_STD Z-score
MF GO:0016860 Intramolecular oxidoreductase activity 3 5 1.37 0.59 2.7
MF GO:0043169 Cation binding 8 27 3.93 1.74 2.3
BP GO:0006952 Defense response 5 11 1.97 0.95 3.2
BP GO:0006928 Cell motility 6 8 1.59 0.77 5.8
Table 3: Over representation of gene ontology categories among the ATRA induced proteins

Malmström et al. Journal of Proteome Science & Computational Biology 2012, http://www.hoajonline.com/journals/pdf/2050-2273-1-5.pdf
9
doi: 10.7243/2050-2273-1-5
challenges, especially if there is a desire to maintain the relationship between raw and processed data. In this paper we have conceptually described the increasing problem of slow transaction models can be solved by borrowing concepts from the business intelligence field. Researchers in this field have dealt with the challenges of analyzing enormous data sets for decades. As a consequence strategies have been developed allowing rapid analysis of these datasets collectively referred to as business intelligence. While BI does not provide anything that cannot be obtained through other means, the strategy enables fast and consistent data analysis. The basic data structure in OLAP is referred to as cubes and contains the data in multiple forms as part of various aggregates. This pre-computing and de-normalization of the data in several levels omits the need to access the data in full every time a query is executed. Instead, the strategy is based on computing summary data at one level above the lowest level, then compute summary statistics of the summary statistics at an even higher level. This is called to aggregate the data over a dimension. The result of aggregating over multiple dimensions creates a lot of data, but this data is in a form that is almost ready to consume, hence the large speedup.Xplor was implemented as a complement to a previously published OLTP model, as the transaction model got significantly slower as more data was processed through it. The majority of the software was written in perl and R and the cubes and tables are exclusively stored in MySQL 5.5. The code is tightly organized around two main concepts, where the first is to process and manage the data and the other deals with the consumption of the data in the form of tables, graphs and more sophisticated visualizations such a genome views and network views. The largest challenge in regarding a biological business intelligence system is that the aggregate strategy necessary needs to reflect the underlying reality. Biology is difficult because it spans over large spatial and temporal dimensions and it is difficult to measure. There is also a functional degeneration where any given component might have multiple roles and functions. We adapted BI to biology by building a knowledge-based system to base the aggregations on. Doing these we observe several advantages, where the main advantage is speed. Speed is vital since it is difficult to keep important concepts in focus if the time between different data views exceeds ten seconds. The other advantage is that the system scales linearly which is very unusual in relational databases where query speeds not uncommonly scales quadratically. One of the drawbacks however is that is difficult to keep an OLAP model update since each measurement is part of multiple aggregates. Re-creating the OLAP anew to reflect changes in the OLTP model solves this. While building the OLAP model takes longer the more data that is analyzed, the viewer’s scales linearly in most cases. This ensures that the OLAP model will stay fast even for very large data sets. Other solutions like Biomart prove that these strategies
work in large settings with orders of magnitude more data and multiple labs [22]. Xplor has a different focus in that it is more designed around a data analysis concepts where a set of measurements are put into context using information from previous experiments and from the public domain.
We selected a suitable model system to test the implementation of the BI strategies. Although the test experiment only represents a medium size experiment that can be analyzed in fully using conventional tools the experiment outline provides means of how to conceptually demonstrate the use BI when analyze MS-based proteomics data. HL-60 is a leukemic cell line typically used to study the function of white blood cells and it was shown that by exposing HL-60 cells to ATRA the cells acquire specific phagocytic and microbial killing like properties [20]. To capture the molecular details behind this gain of function we collected a time-series sample set of HL-60 cells with and without the presence of ATRA; over a five day period the ATRA-treated cells gradually acquire the ability to phagocytize and kill bacteria, mirroring results from mature human neutrophils. The new model provided us with three major improvements compared to the OLTP. Firstly, the analysis of whole data sets, including assessment of data quality, analysis of protein quantities and the integration of various online resources, could be accomplished within a couple of hours. Thereby the bottleneck from data collection to hypothesis generation was removed. Secondly, dubious MS2 identifications and visual overview of the features from the LC-MS1 maps were at all time accessible. This is a significant at advance as scrutinizing protein identification and quantification will allow more confidence in the data. Thirdly, the ease at which new tools can be developed and the integration of additional databases provides the researchers with the possibility of obtaining a very detailed view of the data as support for the hypothesis generation. In this particular case we developed a number of different tools ranging from quality assessment such as visual overview of the data and FDR estimation to statistical calculations regarding enriched functional groups. On the negative side, the increased complexity of the system makes it less suitable for small or isolated experiments not part of larger studies because of the overhead of maintaining and adapting the system.
Although the neutrophil-like properties of ATRA-differentiated HL-60 cells have been described, there is currently only a limited understanding of the molecular pathways behind the acquisitions of these properties. Using Xplor we were not only able to verify that several hypothesized protein classes critical for the gain of function are in fact induced but we were also able to provide a more detailed molecular description of which proteins are actually involved from the various functional classes. By reducing the data dimensionality using PCA followed by K-mean clustering expression profiles enriched in putative candidates could be visualized. For example, all proteins
Malmström et al. Journal of Proteome Science & Computational Biology 2012, http://www.hoajonline.com/journals/pdf/2050-2273-1-5.pdf
10
doi: 10.7243/2050-2273-1-5
present in cluster 1 (Figure 3B) are specifically induced by ATRA and are thus likely to play a role in the gain of function. As hypothesized several proteins involved in cell motility, likely to be involved in the hunting down of the prey, are induced. We also observe that several proteins involved in defense response that normally play a role in microbial killing are induced. Although we observe the induction of several proteins involved in membrane trafficking and fusion these functional classes as a whole were not statistically enriched. There are a couple of explanations for this; 1) the functional GO classes encompasses several other proteins that are not induced 2) these types of proteins are under-represented in our data set or 3) these protein classes are not in fact enriched but rather change in localization.
ConclusionIn summary, the use of the OLAP model have enabled us to analyze data sets of MS spectra fast enough to enable interactive web interface. This has several advantages where one obvious is that the data can reside in data centers where the storage capacity is higher, security is better and hardware is cheaper. At the same time, the data is accessible from any computer connected to the Internet and is hence easily shared. This approach combines the strength of storing the data in a normalized fashion and still enabling fast analysis. The development of new tools and the use of the transaction model is however not limited to this data set, but can be extended to any other data set. It is expected that the concepts described here can be implemented in several other system providing these system with equal increase in analysis speed and flexibility.
Additional files
List of abbreviations BI Business intelligence GO Gene Ontology GPL GNU public license LC Liquid chromatography MS Mass spectrometry OLAP On-line analytical processing OLTP On-line transactional processing PCA Principle component analysisPerl Practical extraction and report language RDBM Relational database manager SQL Structured Query Language
Competing interestsJM is a board member and shareholder in Biognosys AG, Zurich, Switzerland.
Authors’ contributions JM and LM originated the ideas, designed the database, defined the protocols and viewers, analyzed the data and wrote the paper. LM implemented the
software. JM performed mass spectrometry analysis. PN prepared the samples, participated in project planning, data analysis and manuscript writing.AcknowledgementThe project was funded by funds from the Swedish research council (project 2008-3356), the Crafoord Foundation (ref nr 20100892) and the Swedish Foundation for Strategic Research (FFL4).
Publication historyEditor: Eugene Kapp, Walter & Eliza Hall Inst of Medical Research, Australia.Received: 31-Aug-2012 Revised: 02-Oct-2012 Accepted: 5-Oct-2012 Published: 20-Nov-2012
References1. Craig R, Beavis RC: A method for reducing the time required to match
protein sequences with tandem mass spectra. Rapid Commun Mass Spectrom 2003, 17:2310-2316. | Article | PubMed
2. Keller A, Nesvizhskii AI, Kolker E, Aebersold R: Empirical statistical model to estimate the accuracy of peptide identifications made by MS/MS and database search. Anal Chem 2002, 74:5383-5392. | Article | PubMed
3. Nesvizhskii AI, Keller A, Kolker E, Aebersold R: A statistical model for identifying proteins by tandem mass spectrometry. Anal Chem 2003, 75:4646-4658. | Article | PubMed
4. Mueller LN, Rinner O, Schmidt A, Letarte S, Bodenmiller B, Brusniak MY, Vitek O, Aebersold R, Muller M: SuperHirn - a novel tool for high resolution LC-MS-based peptide/protein profiling. Proteomics 2007, 7:3470-3480. | Article | PubMed
5. Ong SE, Blagoev B, Kratchmarova I, Kristensen DB, Steen H, Pandey A, Mann M: Stable isotope labeling by amino acids in cell culture, SILAC, as a simple and accurate approach to expression proteomics. Mol Cell Proteomics 2002, 1:376-386. | Article | PubMed
6. Gygi SP, Rist B, Gerber SA, Turecek F, Gelb MH, Aebersold R: Quantita-tive analysis of complex protein mixtures using isotope-coded affinity tags. Nat Biotechnol 1999, 17:994-999. | Article | PubMed
7. Keller A, Eng J, Zhang N, Li XJ, Aebersold R: A uniform proteomics MS/MS analysis platform utilizing open XML file formats. Mol Syst Biol 2005, 1:2005 0017. | Article | PubMed Abstract | PubMed Full Text
8. Ashburner M, Ball CA, Blake JA, Botstein D, Butler H, Cherry JM, Davis AP, Dolinski K, Dwight SS, Eppig JT, Harris MA, Hill DP, Issel-Tarver L, Kasarskis A, Lewis S, Matese JC, Richardson JE, Ringwald M, Rubin GM, Sherlock G: Gene ontology: tool for the unification of biology. The Gene Ontology Consortium. Nat Genet 2000, 25:25-29. | Article | PubMed Abstract | PubMed Full Text
9. Berman HM, Battistuz T, Bhat TN, Bluhm WF, Bourne PE, Burkhardt K, Feng Z, Gilliland GL, Iype L, Jain S, Fagan P, Marvin J, Padilla D, Ravi-chandran V, Schneider B, Thanki N, Weissig H, Westbrook JD, Zardecki C: The Protein Data Bank. Acta Crystallogr D Biol Crystallogr 2002, 58:899-907. | Article | PubMed
10. Jensen LJ, Kuhn M, Stark M, Chaffron S, Creevey C, Muller J, Doerks T, Julien P, Roth A, Simonovic M, Bork P, von Mering C: STRING 8--a global view on proteins and their functional interactions in 630 organisms. Nucleic Acids Res 2009, 37:D412-416. | Article | PubMed Abstract | PubMed Full Text
11. Malmstrom L, Marko-Varga G, Westergren-Thorsson G, Laurell T, Malmstrom J: 2DDB - a bioinformatics solution for analysis of quan-titative proteomics data. BMC Bioinformatics 2006, 7:158. | Article | PubMed Abstract | PubMed Full Text
12. Yu K, Salomon AR: PeptideDepot: flexible relational database for visual analysis of quantitative proteomic data and integration of existing protein information. Proteomics 2009, 9:5350-5358. | Article | PubMed Abstract | PubMed Full Text
13. Hartler J, Thallinger GG, Stocker G, Sturn A, Burkard TR, Korner E, Rader R, Schmidt A, Mechtler K, Trajanoski Z: MASPECTRAS: a
Supplement file 1 Supplement table 1
Malmström et al. Journal of Proteome Science & Computational Biology 2012, http://www.hoajonline.com/journals/pdf/2050-2273-1-5.pdf
11
doi: 10.7243/2050-2273-1-5
platform for management and analysis of proteomics LC-MS/MS data. BMC Bioinformatics 2007, 8:197. | Article | PubMed Abstract | PubMed Full Text
14. Rauch A, Bellew M, Eng J, Fitzgibbon M, Holzman T, Hussey P, Igra M, Maclean B, Lin CW, Detter A, Fang R, Faca V, Gafken P, Zhang H, Whiteaker J, States D, Hanash S, Paulovich A, McIntosh MW: Com-putational Proteomics Analysis System (CPAS): an extensible, open-source analytic system for evaluating and publishing proteomic data and high throughput biological experiments. J Proteome Res 2006, 5:112-121. | Article | PubMed
15. Bernier E, Gosselin P, Badard T, Bedard Y: Easier surveillance of climate-related health vulnerabilities through a Web-based spatial OLAP application. Int J Health Geogr 2009, 8:18. | Article | PubMed Abstract | PubMed Full Text
16. Ordonez C, Chen Z: Evaluating statistical tests on OLAP cubes to compare degree of disease. IEEE Trans Inf Technol Biomed 2009, 13:756-765. | Article | PubMed
17. Wu C: Development of a medical informatics data warehouse. AMIA Annu Symp Proc 2006, 1148. | Article | PubMed Abstract | PubMed Full Text
18. Gallagher R, Collins S, Trujillo J, McCredie K, Ahearn M, Tsai S, Metzgar R, Aulakh G, Ting R, Ruscetti F, Gallo R: Characterization of the continuous, differentiating myeloid cell line (HL-60) from a patient with acute promyelocytic leukemia. Blood 1979, 54:713-733. | Article | PubMed
19. Breitman TR, Selonick SE, Collins SJ: Induction of differentiation of the human promyelocytic leukemia cell line (HL-60) by retinoic acid. Proc Natl Acad Sci U S A 1980, 77:2936-2940. | Article | PubMed Abstract | PubMed Full Text
20. Nordenfelt P, Bauer S, Lonnbro P, Tapper H: Phagocytosis of Strepto-coccus pyogenes by all-trans retinoic acid-differentiated HL-60 cells: roles of azurophilic granules and NADPH oxidase. PLoS One 2009, 4:e7363. | Article | PubMed Abstract | PubMed Full Text
21. Ogata H, Goto S, Sato K, Fujibuchi W, Bono H, Kanehisa M: KEGG: Kyoto Encyclopedia of Genes and Genomes. Nucleic Acids Res 1999, 27:29-34. | Article | PubMed Abstract | PubMed Full Text
22. Kasprzyk A, Keefe D, Smedley D, London D, Spooner W, Melsopp C, Hammond M, Rocca-Serra P, Cox T, Birney E: EnsMart: a generic sys-tem for fast and flexible access to biological data. Genome Res 2004, 14:160-169. | Article | PubMed Abstract | PubMed Full Text