business groups and tunneling: evidence from private ... of finance forthcoming business groups and...
TRANSCRIPT
Journal of Finance forthcoming
Business Groups and Tunneling: Evidence from Private Securities Offerings by Korean Chaebols
JAE-SEUNG BAEK, JUN-KOO KANG, and INMOO LEE*
This version: June 2005
* Baek is from the Department of Trade, College of Economics and Business, Hankuk University of Foreign Studies, Gyounggi-do, Korea, Tel.: +82-31-330-4936, email: [email protected]; Kang is from the Department of Finance, Eli Broad College of Business, Michigan State University, East Lansing, MI 48824-1121, Tel.: 517-353-3065, email: [email protected]; and Lee is from the College of Business Administration, Korea University and the Department of Finance and Accounting, Business School, National University of Singapore, Singapore 117592, Tel.: +65-6874-8017, email: [email protected]. We are grateful for useful comments from Charles Hadlock, Florencio Lopez-de-silanes, Hasung Jang, Joongi Kim, Wei-Lin Liu, Yishay Yafeh, and the seminar participants at the 2003 Allied Korean Finance Associations Meetings, the 2004 Asian Finance Association Meetings, the Hitotsubashi Workshop on Corporate Governance in East Asia, the 4th Asian Corporate Governance Conference, and Singapore Management University. We thank especially two anonymous referees and Robert Stambaugh (the editor) for their insightful comments. Kang and Lee acknowledge financial support from the Asian Institute of Corporate Governance at Korea University and Baek acknowledges financial support from Hankuk University of Foreign Studies Research Fund.
ABSTRACT
Using a comprehensive sample of equity-linked private securities offerings by Korean firms from 1989 to 2000, we examine whether such offerings can be used as a mechanism for tunneling among firms belonging to a chaebol. We find that the chaebol-affiliated issuers sell private securities at a larger discount when the controlling shareholders are expected to receive greater wealth gains from the discount. We also find that the chaebol-affiliated issuers realize an 8.8% higher announcement return than do other types of issuers if they sell private securities at premium to other member firms in the same group, and if the controlling shareholders receive positive net gains from equity ownership in issuers and acquirers. In contrast, the member acquirers realize a 5.8% lower announcement return for such deals. Furthermore, a one standard deviation increase in the discount rate is associated with a 9.3% (11.4%) lower (higher) return for chaebol-affiliated issuers with good past performance (member acquirers) than for other types of issuers (acquirers). These results are consistent with tunneling within business groups and suggest that the tunneling effect is economically large and significant.
1
The widespread use of pyramid ownership structures and cross-holdings among firms belonging
to a business group allows controlling shareholders to exercise full control over a firm despite
holding a relatively small portion of its cash flow rights.1 This divergence between ownership and
control raises concerns about tunneling – that the controlling shareholders of the business group
have strong incentives to siphon resources out of firms to increase their wealth (hereafter referred to
as the tunneling view; Johnson, La Porta, Lopez-de-Silanes, and Shleifer (2000)). Although
tunneling creates a severe agency problem between controlling and minority shareholders and
creates serious friction that affects the efficient functioning of a capital market, systematic evidence
of its existence is scarce. One notable exception is the study of Bertrand, Mehta, and Mullainathan
(2002), who use a sample of 18,600 Indian firms during the period 1989 to 1999 to examine
tunneling in pyramidal ownership structures of business groups. They show that the ultimate owners
of the pyramids have strong incentives to divert resources from firms low down in the pyramid
toward ones high up in the pyramid. In a similar vein, Bae, Kang, and Kim (2002) find that minority
shareholders of a firm within the Korean business group making an acquisition lose, but that the
controlling shareholder benefits because the acquisition enhances the value of other firms in the
group. These results are consistent with the existence of tunneling among firms belonging to
business groups.
In this paper, we extend the previous literature by providing direct evidence of tunneling among
group firms. To gain a better understanding of tunneling from a different perspective than those
found in the existing literature, we analyze the pricing and the valuation effect of equity-linked
private securities offerings (PSOs) by Korean firms from 1989 to 2000. To precisely identify
testable implications of the tunneling view, we first develop a model that considers the tunneling
incentives of controlling shareholders in chaebols and then test these predictions. Our objective is to
examine the extent to which firm value is related to the controlling shareholders’ incentive to carry
2
out tunneling. Unlike previous studies, we focus on the financing decisions of group-affiliated firms,
not on their investment decisions. We study the private financing activities of group firms because
they represent a setting where the interests of controlling and minority shareholders frequently
diverge; thus, tunneling could be a major motivation behind some of these activities.
PSOs tend to draw less attention from stock market investors and regulatory agencies because
they essentially view such offerings as a private matter (Wruck (1989)). Therefore, the incentive for
controlling shareholders to tunnel tends to be strong in PSOs, which means that tests of the extent of
tunneling activity can be more powerful and convincing. PSOs can also involve several interesting
forms of tunneling, such as dilutive share issues that discriminate against minority shareholders,
deep discount issues to benefit controlling shareholders, issuing securities at inflated prices by
poorly performing firms to well-performing firms in the same group, etc. This variety provides a
rich setting for the investigation of the market’s ex-ante valuation of financing decisions motivated
by tunneling.
We focus on Korean firms since they have certain characteristics that make them particularly
well suited to an investigation of tunneling. In particular, many Korean firms belong to business
groups known as chaebols. An important feature of a chaebol is that it has an inherently weak
governance structure2 and that a single family usually controls all member firms in it. Firms
belonging to a chaebol also maintain substantial business ties with other firms in the group, are
bound together by a nexus of explicit and implicit contracts, and are connected by an extensive
arrangement of reciprocal shareholding agreements. In general, a chaebol’s owner-managers put up
a relatively small portion of the total stake in the group, but cross-shareholding among member
firms allows them to have full control over all member firms. Although having both control rights
and ownership vested in one individual minimizes the agency problem that arises from the
separation of ownership and control (Jensen and Meckling (1976)), it creates another type of agency

3
problem: the owner-managers of a chaebol can easily expropriate other investors in the firm by
tunneling resources out of the firm to maximize their welfare (Johnson et al. (2000)). These
characteristics of chaebol firms allow us to examine whether the valuation effect of PSOs is related
to tunneling carried out by the owner-managers.
The issuance of bonds with warrants (BWs) by Samsung SDS, the Samsung Group’s systems
integration unit, to the controlling shareholder’s family illustrates how tunneling can take place
between a member firm and the controlling shareholder. Samsung SDS is an unlisted company, but
its shares have been traded in the over-the-counter (OTC) market. In February 1999, Samsung SDS
issued 23 billion Korean won worth of BWs through a private placement to Chairman Lee Kun-
Hee’s son, Lee Jae-Yong, and several others. The BWs, which carried an 8% interest rate and
matured in three years, gave holders the right to convert them into 2.3 million shares of common
stock at a price of 7,150 won per share, one year from the date of issuance. This conversion price
was far lower than the share price of 54,750 won at the OTC market. Activists for the rights of
minority shareholders criticized Samsung SDS for selling its new BWs to Lee Jae-Yong in a bid to
help him gain managerial control after the company goes public, running counter to the interests of
other shareholders (Korea Herald, June 5, 1999 and May 10, 2000).
A civil organization, the People’s Solidarity for Participatory Democracy (PSPD), sued
Samsung SDS, arguing that it circumvented the law by selling its BWs to Lee Jae-Yong at an
unreasonably low price and requested a court injunction to prevent unfair deals. Accepting the
plaintiff’s charges, the Seoul High Court issued a temporary injunction against the exercise, sale,
and other disposition of warrants attached to the BWs until the case was resolved. The court pointed
out that it was illegal to issue BWs at extremely low prices without special approval from the
shareholders (Korea Economic Daily, May 10, 2000; Joins.com, May 12, 2000).
The PSPD also filed a criminal complaint against directors of Samsung SDS, charging them of
4
violating the Commercial Codes regarding the duty of care and the duty of loyalty of directors.3
However, its request for an investigation was rejected not only by the district office, but also by the
higher-level prosecutors’ office. Samsung SDS defended itself against the charge by arguing that the
pricing of its BWs was based on the valuation method allowed in the inheritance tax rules and
represented the results of a consultation with an outside consulting firm. The prosecutors’ office
also concluded that it is not a breach of the duty of care and the duty of loyalty to use the
inheritance tax rules rather than the price at the OTC market in deciding the offer price. Many legal
scholars, however, criticized this decision, arguing that it was both inappropriate and unfair to use
the inheritance tax rules in estimating the offering price since the rules relied on a very conservative
valuation method to protect taxpayers from being overtaxed. To revoke the decision by the
prosecutors’ office, the PSPD filed an appeal to the Constitutional Court. The court, however, ruled
against the PSPD, saying that the prosecution had not made a major mistake in interpreting the
constitutions and applying the law (Yonhap News, June 27, 2003). In the appendix, we discuss
several other cases in Korea where tunneling is suspected.
Our paper also covers similar ground to the literature that examines the stock-price reaction to
PSOs in other countries. The existing literature shows convincingly that the announcement of new
private equity issues by U.S. and Japanese firms is associated with an increase in the firms’ stock
price (Wruck (1989), Hertzel and Smith (1993), Kato and Schallheim (1993), Kang and Stulz
(1996), and Barclay, Holderness, and Sheehan (2003)).4 Similarly, there are positive announcement
effects for private convertible bond issues in contrast to negative announcement effects for public
convertible bond issues (Fields and Mais (1991)). Wruck (1989) finds that the change in firm value
at the announcement of a private sale of equity is strongly correlated with the resulting change in
ownership concentration, and argues that the positive announcement effect for private equity
offerings is largely due to anticipated monitoring by block shareholders. On the other hand, Hertzel
5
and Smith (1993) argue that private equity offerings convey information that the issuing firm’s
equity is undervalued and thus can be used as a way of mitigating the Myers and Majluf (1984)
underinvestment problem. While these papers emphasize the positive role of private placements,
our paper focuses on the dark side of PSOs by studying how firm value is affected when the main
motivation behind placing securities privately is to transfer resources between firms.5
The model developed in Section I shows that the tunneling incentives of a controlling
shareholder in PSOs depend on his relative ownership stakes in the issuers and acquirers, the issue
price (premium or discount), and the percentage of shares purchased at the offerings by the acquirer
relative to its prior ownership in the issuer. The wealth transfer can occur when the shares are sold
either at a premium or a discount to the chaebol member firms or the controlling shareholder in the
same group. Our model suggests that for discount issues, tunneling from the issuer to the
controlling shareholder through the acquirer is more likely to occur when the controlling
shareholder’s ownership (including both directly and indirectly held shares) in the issuer is smaller
than his share of ownership in the acquirer’s participation at the private equity offerings. Another
implication of the model is that for premium issues, tunneling from the acquirer to the controlling
shareholder through the issuer is more likely to occur when the acquirer does not increase its
ownership in the issuer to a higher level than its prior ownership.
The empirical results suggest that pricing decisions of PSOs are indeed affected by the
tunneling incentives of the controlling shareholders of chaebols. We find that chaebol issuing firms
with good past performance and those where the controlling shareholders have smaller equity
ownership in issuers than in member acquirers sell private securities at a low price to member
acquirers. Regarding the effects of announcements, we find that the shareholders of the issuing
firms on average experience positive wealth gains around the time of the announcement of PSOs.
However, the positive gains are mainly from PSOs by nonchaebol issuers. Chaebol issuers that sold
6
securities privately to firms in the same group realize insignificant announcement returns.
Consistent with the prediction of our model, we also find that compared to other types of issuers,
chaebol-affiliated issuers realize an 8.8% higher announcement return when they sell private
securities at premium to other member firms in the same group, and when the controlling
shareholders receive positive net gains from equity ownership in issuers and acquirers. In contrast,
the member acquirers realize a 5.8% lower announcement return for such deals. Furthermore, a one
standard deviation increase in the discount rate is associated with a 9.3% (11.4%) lower (higher)
return for chaebol-affiliated issuers with good past performance (member acquirers) than for other
types of issuers (acquirers). These results suggest that the tunneling effect is economically large and
significant.
Overall, our findings for chaebol-affiliated firms are inconsistent with those of previous studies
that document the positive role of PSOs and support the tunneling view for business groups. They
also suggest that the controlling shareholder’s incentive to carry out tunneling should be factored in
when the value of chaebol-affiliated firms is being evaluated.
The paper proceeds as follows. In Section I, we present a simple model of tunneling within
chaebol firms and use it to develop testable hypotheses. Section II describes the data and provides
summary statistics for variables of interest. Section III provides the cumulative abnormal returns for
issuers and acquirers. Section IV reports the results from cross-sectional regressions. Section V
discusses the results from the robustness tests. Section VI summarizes and concludes the paper.
I. Testable Implications of the Tunneling View
The cases discussed in the previous section and the appendix suggest that when neither
corporate governance mechanisms nor laws protect minority shareholders from expropriation by
controlling shareholders, it tends to make tunneling easier for firms that place securities privately
7
than for those that place securities publicly. Furthermore, the owner-managers of chaebol-affiliated
firms that conduct PSOs have good opportunities to engage in tunneling since there is no restriction
on other chaebol member firms purchasing shares at PSOs. Given that all the major decisions of
each member firm in a chaebol are in the hands of the controlling family, rather than professional
management, and that the legal protection against expropriation of minority shareholders was weak
in Korea during our sample period, a chaebol’s owner-managers may have strong incentives to
siphon resources out of the issuers (or acquirers) to increase their own wealth. Thus, deals in which
the shares are sold either to member firms in the same business group or to the controlling
shareholders (hereafter called “intra-group deals”) have greater potential to affect the value of
issuing and acquiring firms than do other types of deals.
A. A Simple Model of the Tunneling View
We use a simple setting to identify some key factors that affect the tunneling incentives of a
controlling shareholder in a chaebol. To simplify the analysis, we assume that there are only two
member firms in the chaebol. Before the private equity offering (PEO), the controlling shareholder
owns αI% of the outstanding shares of the issuer and αA% of the outstanding shares of the acquiring
firm. The issuer’s number of outstanding shares before the offering is SO and the number of shares
sold by the issuer at the offering is SI. Therefore, the issuer’s total number of outstanding shares will
increase to SN = SO + SI after the PEO. The acquiring firm owns SAO shares of the issuer before the
PEO and purchases SA shares at the offering.6 The offer price per share is OP and the price per
share before the offering is PO.
The market value of the issuer after the PEO (VIN) is the sum of its market value before the
PEO (VIO) and the amount being raised at the offering:
VIN = VIO + OP × SI. (1)
8
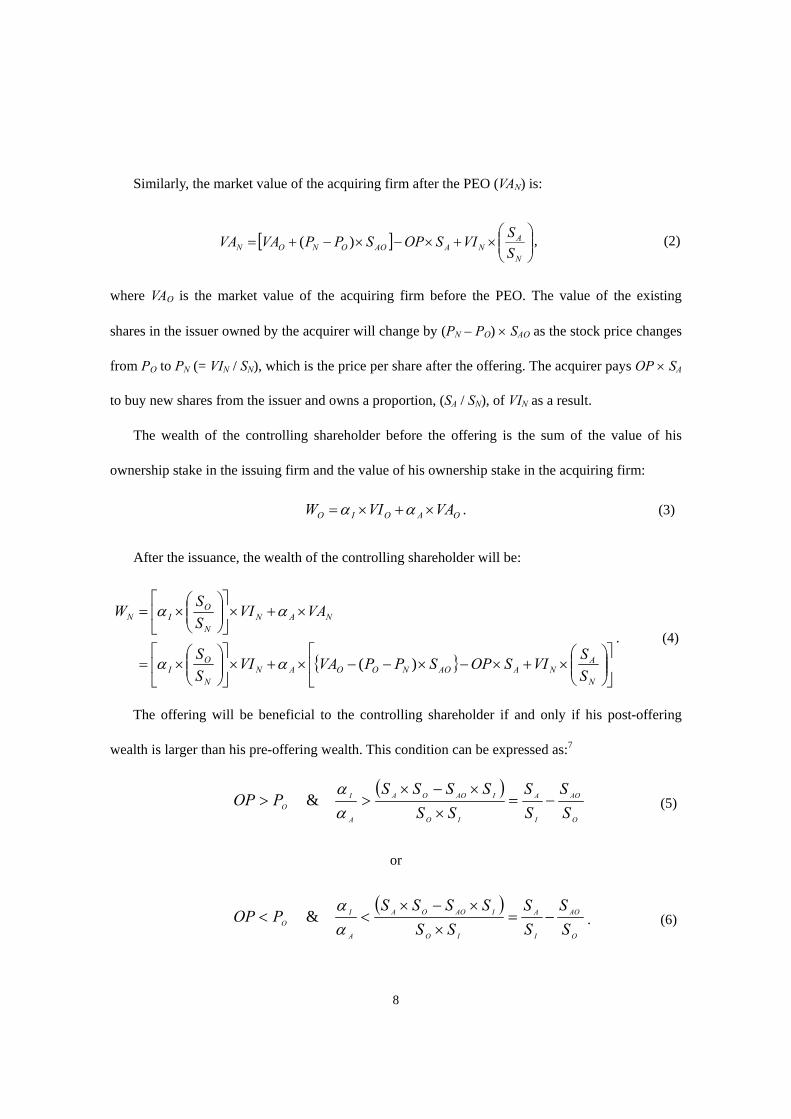
Similarly, the market value of the acquiring firm after the PEO (VAN) is:
[ ] ⎟⎟⎠
⎞⎜⎜⎝
⎛×+×−×−+=
N
ANAAOONON S
SVISOPSPPVAVA )( , (2)
where VAO is the market value of the acquiring firm before the PEO. The value of the existing
shares in the issuer owned by the acquirer will change by (PN – PO) × SAO as the stock price changes
from PO to PN (= VIN / SN), which is the price per share after the offering. The acquirer pays OP × SA
to buy new shares from the issuer and owns a proportion, (SA / SN), of VIN as a result.
The wealth of the controlling shareholder before the offering is the sum of the value of his
ownership stake in the issuing firm and the value of his ownership stake in the acquiring firm:
OAOIO VAVIW ×+×= αα . (3)
After the issuance, the wealth of the controlling shareholder will be:
{ } ⎥⎦
⎤⎢⎣
⎡⎟⎟⎠
⎞⎜⎜⎝
⎛×+×−×−−×+×⎥
⎦
⎤⎢⎣
⎡⎟⎟⎠
⎞⎜⎜⎝
⎛×=
×+×⎥⎦
⎤⎢⎣
⎡⎟⎟⎠
⎞⎜⎜⎝
⎛×=
N
ANAAONOOAN
N
OI
NANN
OIN
SSVISOPSPPVAVI
SS
VAVISSW
)(αα
αα
. (4)
The offering will be beneficial to the controlling shareholder if and only if his post-offering
wealth is larger than his pre-offering wealth. This condition can be expressed as:7
( )
O
AO
I
A
IO
IAOOA
A
IO S
SSS
SSSSSS
POP −=×
×−×>>
αα
& (5)
or
( )
O
AO
I
A
IO
IAOOA
A
IO S
SSS
SSSSSS
POP −=×
×−×<<
αα
& . (6)
9
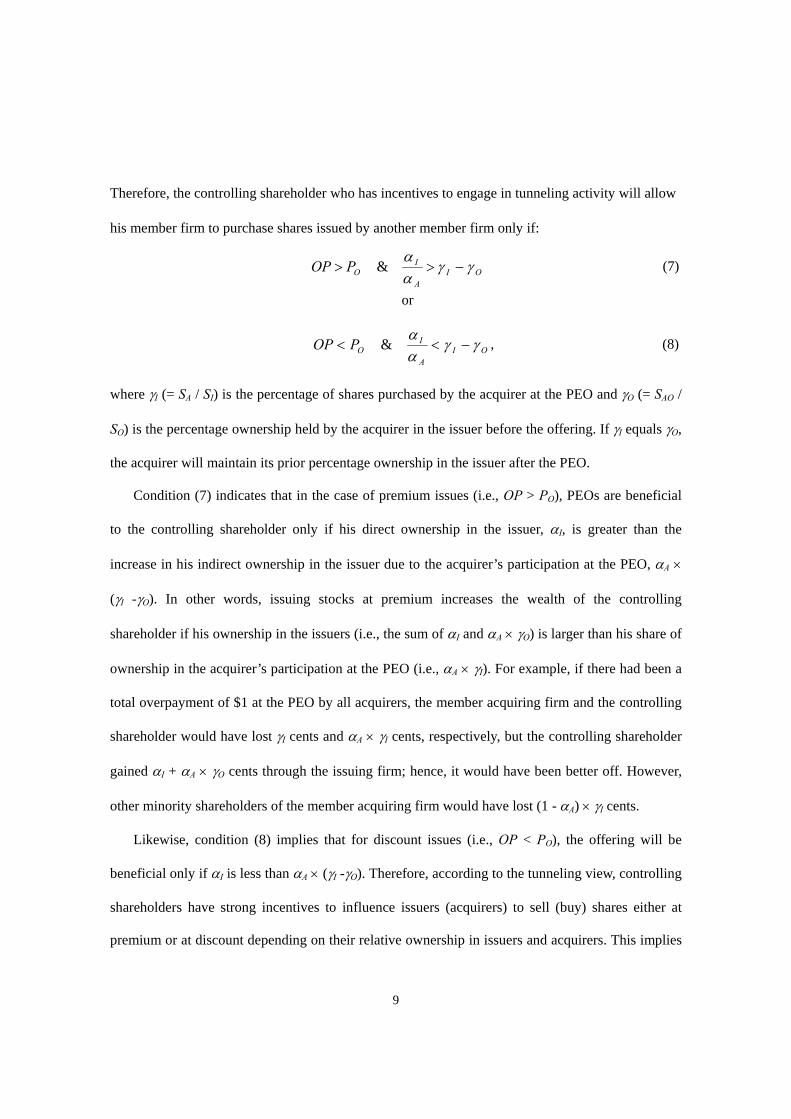
Therefore, the controlling shareholder who has incentives to engage in tunneling activity will allow
his member firm to purchase shares issued by another member firm only if:
OIA
IOPOP γγ
αα
−>> & (7)
or
OIA
IOPOP γγ
αα
−<< & , (8)
where γI (= SA / SI) is the percentage of shares purchased by the acquirer at the PEO and γO (= SAO /
SO) is the percentage ownership held by the acquirer in the issuer before the offering. If γI equals γO,
the acquirer will maintain its prior percentage ownership in the issuer after the PEO.
Condition (7) indicates that in the case of premium issues (i.e., OP > PO), PEOs are beneficial
to the controlling shareholder only if his direct ownership in the issuer, αI, is greater than the
increase in his indirect ownership in the issuer due to the acquirer’s participation at the PEO, αA ×
(γI -γO). In other words, issuing stocks at premium increases the wealth of the controlling
shareholder if his ownership in the issuers (i.e., the sum of αI and αA × γO) is larger than his share of
ownership in the acquirer’s participation at the PEO (i.e., αA × γI). For example, if there had been a
total overpayment of $1 at the PEO by all acquirers, the member acquiring firm and the controlling
shareholder would have lost γI cents and αA × γI cents, respectively, but the controlling shareholder
gained αI + αA × γO cents through the issuing firm; hence, it would have been better off. However,
other minority shareholders of the member acquiring firm would have lost (1 - αA) × γI cents.
Likewise, condition (8) implies that for discount issues (i.e., OP < PO), the offering will be
beneficial only if αI is less than αA × (γI -γO). Therefore, according to the tunneling view, controlling
shareholders have strong incentives to influence issuers (acquirers) to sell (buy) shares either at
premium or at discount depending on their relative ownership in issuers and acquirers. This implies
10
that the relative ownership is a key factor driving a premium or discount decision at the offering.8
Conditions (7) and (8) also suggest that the percentage of shares purchased by the acquirer, γI, is
an important parameter in determining the tunneling incentives of the controlling shareholder. If the
acquirer purchases only a small portion of the PEO such that it is not able to maintain its prior
percentage ownership in the issuer (i.e., γI < γO), condition (7) will always be satisfied, but condition
(8) will not since both αI and αA are nonnegative numbers. Therefore, when γI < γO, issuing stocks at
premium is always beneficial to the controlling shareholder and offering at discount is always a
value-destroying activity to him. In other words, in premium offering cases, the controlling
shareholder can always increase his wealth through the PEO if the affiliated acquirer purchases only
a small portion of shares relative to its prior ownership in the issuer and if the outside investors buy
a large portion of the remaining shares. In contrast, in discount offering cases, the controlling
shareholder can take advantage of the PEO if the acquirer buys a large portion of shares sold by the
issuer. Otherwise, the PSO will end up having a negative impact on the wealth of the controlling
shareholder.
In sum, our model suggests that the tunneling activity of the controlling shareholder depends on
the issue price (premium or discount), his relative ownership in the issuer and acquirer, and the
percentage of shares purchased at the PEO by the acquirer relative to its prior ownership in the
issuer.
Private convertible bond offerings (PCBOs) and private bonds with warrants offerings
(PBWOs) can be used for tunneling in a similar way by setting the conversion value or strike price
very low (high) compared to the current stock price without the deep-in-the-money (deep-out-of-
the-money) option value being fairly reflected in the price of those securities.
B. Testable Implications
11
We empirically evaluate the above implications of our model as follows. First, we investigate
whether announcement returns of deals involving issuers and acquirers in the same chaebol are
different from those of other deals. According to the tunneling view, the wealth transfer can occur
only when the issuer and the acquirer belong to the same business group and the shares are sold
either at a premium or a discount. Therefore, we expect the announcement returns of the issuer
(acquirer) to be more negative when the shares are sold to either member firms in the same business
group or to the controlling shareholders at discount (premium). Such transactions, however, are
expected to increase the wealth of chaebol acquirers (issuers) and controlling shareholders.
Second, the model suggests that for PEOs to be beneficial to the controlling shareholders, their
relative ownership in the issuing and acquiring firms should lie in certain ranges, as specified by
conditions (7) and (8), and the offer prices should be set at premium or discount. The actual ranges
depend on how much the acquirer purchases shares at the PEO relative to its prior equity ownership
in the issuer before the offering (i.e., γI -γO). These conditions suggest that for discount issues, the
announcement returns of the issuer are more negative for those issues that satisfy condition (8); that
is, when the relative ownership, αI / αA, is less than γI -γO. Likewise, for premium issues, the
announcement returns of the issuers are more positive for those issues that satisfy condition (7). An
alternative way to test conditions (7) and (8) is to see if the announcement returns of the issuer are
positively related to a relative ownership disparity (net gain to the controlling shareholder from a $1
overpayment by all acquirers at the PSO) defined as the difference between the controlling
shareholder’s directly and indirectly held ownership in the issuers before the offering (αI + αA × γO)
and the controlling shareholder’s share of ownership in the member acquirer’s participation at the
offering (αA × γI).
Third, we examine whether the percentage of shares purchased at the PEO by the acquirer (γI)
relative to its prior ownership in the issuer (γO) has any impact on the announcement period returns.
12
As discussed above, when γI < γO, issuing stocks at premium is always beneficial to the controlling
shareholder and offering at discount is always a value-destroying activity to him. In other words, the
controlling shareholder who wants to maximize his own wealth is not likely to influence issuers to
sell stocks at discount unless the affiliated acquirer is able to purchase a higher percentage of shares
than its prior ownership in the issuer. Thus, the tunneling view suggests that holding everything else
constant, the abnormal returns of the issuer (acquirer) are more positive (negative) when the shares
are offered at premium and the acquirer does not increase its ownership in the issuer to a higher
level than its prior ownership. In such a case, the tunneling is expected to more likely be the main
motivation of PSOs.
II. Data
A. Sample Selection
Our sample consists of private placements of equity-linked securities by nonfinancial firms
listed on the Korea Stock Exchange (KSE) during the period 1989 to 2000. The types of securities
we consider include common stocks, convertible bonds, and BWs. We obtain our sample by
checking various sources, including the Korea Securities Research Institute (KSRI)’s database, the
Korea Listed Companies Association (KLCA)’s database, the KLCA’s monthly publication, Sang
Jang, KOSCOM’s CHECK2000 database, and the KSE’s Korea Investor’s Network for Disclosure
System (KIND System). To avoid having the results confounded by multiple issues that cluster
during a short time period, we eliminate issues that occur within a 10-day interval before and after
the announcement of the offering. We collect the offering announcement dates from one of the
major daily economic newspapers in Korea, the Korea Economic Daily, a publication that is
essentially the Korean equivalent of the Wall Street Journal. We obtain the stock price data from the
13
Korea Investor Service (KIS)’s KIS 2000 database and financial data from the KLCA and KIS’s
FAS2000 databases. Our restrictions result in a final sample of 262 issuing firms and 70 acquiring
firms.9
Since stock return data is needed to measure tunneling within firms belonging to a business
group, we define a chaebol as a business group that has at least two listed member firms. Our
definition of a chaebol is much broader than that of other studies in which a chaebol is usually
defined as one of the 30 largest business groups. Since “the top 30” is an arbitrary category that the
Korean government creates for its own purposes and since the issue of tunneling is relevant not only
to the large business groups but also to other, small business groups, our definition of a chaebol
allows us to measure the tunneling effect more accurately. We identify each firm’s chaebol
affiliation using the KIS 2000 database.
Table I reports the distribution of the sample of 262 placements by type and by year. PCBOs
were the most frequent events (149 cases), followed by PEOs (60 cases) and then PBWOs (53
cases). Though not reported here, out of the 262 PSOs, 116 (44.3%) were issued by chaebol-
affiliated firms. Out of these 116 issues, 100 were issued by firms belonging to the top 30 chaebols,
and in 77 cases, the issuers and acquirers belonged to the same chaebol. There was some clustering
of the issues during the Asian financial crisis. More than 80% of the PEOs, 64% of the PCBOs, and
all of the PBWOs occurred during the period 1997 to 2000. For private convertible bonds and
private BWs, no offerings were made from 1993 to 1996. This was mainly due to the Korean
government’s policy of restricting the issuance of private equity-linked securities out of concern
that these securities were sometimes used against the interests of minority shareholders. The Korean
government stopped imposing this restriction in 1997.
To compare the frequency distribution of the PSOs with that of the public equity offerings,
Table I also shows the frequency distribution of rights offerings and Initial Public Offerings (IPOs)
14
by year. There were 1,775 rights offerings and 522 IPOs during our sample period. The
predominance of rights offerings in Korea is not surprising given the findings of Cronqvist and
Milsson (2003), who show that to avoid the possibility of an increase in monitoring by blockholders,
firms controlled by a family prefer to use uninsured rights offerings. To examine whether the equity
issuing activity depends on the market condition shown in other markets (Loughran and Ritter
(1995)), the last column of the table also reports the annual returns of the Korea Composite Stock
Price Index (KOSPI). Unlike in the U.S., we do not observe any significant relation between the
equity offering activity and the stock market condition in Korea.
[Insert Table I here]
B. Summary Statistics
To see whether the characteristics of issuers involved in intra-group deals are different from
those of other issuers, we examine the significance of their differences in Panel A of Table II. Out of
262 issuing firms, 77 are involved in intra-group deals and 185 are involved in other deals.10 Since
the tunneling takes place only in intra-group deals, these numbers indicates that about 30 percent of
the sample PSOs are likely to be candidates for tunneling. The comparison of issuer characteristics
between these two types of deals (columns A and D) shows that the mean and median offer sizes
relative to total assets are significantly larger for intra-group deals than for other deals.11
[Insert Table II here]
We also find that the premium (i.e., negative discount) is on average 11.7% greater for issuers in
intra-group deals than for issuers in other deals, suggesting that deals that involve firms in the same
chaebol tend to carry a higher offer price than other deals. For PEOs, we measure the discount as
the ratio of the difference between the share price on the announcement date and the offer price to
the share price on the announcement date. For PCBOs (PBWOs), we use the conversion price
15
(strike price) instead of the offer price.
Issuers in intra-group deals tend to have higher leverage (total debt to total assets) and higher
industry-adjusted ROA (net income to total assets) than issuers in other deals. Equity ownership by
controlling shareholders is smaller for issuers in intra-group deals than for issuers in other deals, but
equity ownership by foreign investors is larger for the former than for the latter. We measure equity
ownership by the controlling shareholder as the sum of the direct and indirect holdings of the largest
shareholder and his family members. We trace the indirectly owned shareholdings through the
complex network of cross-holdings by examining all member firms within the same group.
Following La Porta, Lopez-de-Silanes, and Shleifer (1999), we compute the indirect shareholdings
by tracing up to two layers of control chains.
Of the 77 intra-group deals, 31 involved the purchase by the firms that are listed on the KSE.
We classify these 31 deals into two groups according to the issue price (premium or discount issue)
and relative ownership stakes of the controlling shareholder. Sample I includes 16 issuing firms in
intra-group deals that satisfy condition (7) in Section I; that is, premium issues in which (αI / αA) >
(γI - γO). Sample II includes 15 issuing firms in intra-group deals that satisfy condition (8); that is,
discount issues in which (αI / αA) < (γI - γO). We find that all 31 intra-group deals satisfy either
condition (7) or condition (8). This means that all of these deals have the potential to provide the
controlling shareholders with private benefits by issuing shares at premiums or discounts. A
comparison of these two groups (columns B and C) shows that issuers belonging to Sample I are on
average smaller than issuers belonging to Sample II based on total assets. The relative size of the
offer amounts is larger for Sample I than for Sample II. The mean and median discounts are 66.7%
and 25.3% greater for Sample II than for Sample I, respectively. There is no evidence that leverage,
past performance, equity ownership by controlling shareholders, and equity ownership by foreign
investors are different between the two samples.
16
Panel B of Table II shows the summary statistics of a sample of 70 purchasing firms. Among
these 70 firms, 31 were acquirers in intra-group deals and 39 were acquirers in other deals. A
comparison of the deal and acquirer characteristics between these two groups (columns A and D)
shows that the relative size of acquiring amounts is larger for intra-group deals than for other deals.
Acquirers in intra-group deals on average tend to have lower leverage and higher industry-adjusted
ROA than acquirers in other deals. The controlling shareholders hold smaller equity ownership
stakes in acquirers in intra-group deals than acquirers in other deals, but foreign shareholders show
the opposite pattern of equity holdings. Equity ownership by acquirers in the issuing firms before
the offerings is on average 4.7% greater for intra-group deals than for other deals. However, after
the offering, equity ownership by acquirers in the issuing firms is on average 4% smaller for intra-
group deals than for other deals.
A comparison of characteristics between Sample I and Sample II (columns B and C) shows that
the relative size of acquiring amounts is larger for Sample I than for Sample II. We also find that the
operating performance of acquirers in Sample II is better than the operating performance of
acquirers in Sample I. None of the other acquirer characteristics are significantly different between
the two subsamples.
The tunneling view suggests that chaebol firms set offering prices to benefit their controlling
shareholders. To show whether offering prices in intra-group deals are consistent with the tunneling
view, in Table III, we examine the relation between the pricing of the securities and the tunneling
variables discussed in the previous section. To transfer wealth from the acquiring firms to the
issuing firms in the same group, the chaebol acquiring firms are expected to pay significantly higher
premiums than are firms in other deals. Similarly, the chaebol acquiring firms are expected to pay
considerably less for the wealth transfer from the issuing firms to the acquiring firms.12 To measure
this tunneling effect, we use the price discount as the dependent variable and the following variables
17
as the explanatory variables: i) the dummy for intra-group deals; ii) the gain to the controlling
shareholder from the $1 overpayment by all acquirers (i.e., the sum of αI and αA × γO); iii) the loss
to the controlling shareholder from the $1 overpayment (i.e., αA × γI); iv) a relative ownership
disparity defined as the difference between αI + αA × γO and αA × γI,13 which is the net gain to the
controlling shareholder from the $1 overpayment by all acquirers at the PSO; and v) industry-
adjusted ROA. The regressions also control for firm size (log of total assets), leverage (total debt
over total assets), size of offerings (offer amount over total assets), industry dummy variables, and
dummy variables for the type of securities.
[Insert Table III here]
We find that in regressions (1) and (4), the gain to the controlling shareholder from the $1
overpayment at the PSO is significantly negatively related to the discount, whereas the loss to the
controlling shareholder from the $1 overpayment is positively, albeit insignificantly, related to the
discount. Combining these two effects, as shown in regressions (3) and (6), the coefficients on the
net gain to the controlling shareholder from the $1 overpayment by all acquirers is significantly
negatively related to the discount. Furthermore, the coefficients on the interaction term between the
dummy for intra-group deals and the gain to the controlling shareholder from the $1 overpayment in
regressions (2) and (5) are significantly negative, indicating that the discounts are larger when
controlling shareholders in chaebol-affiliated issuers are expected to realize higher gains from
discount offerings. We also find that the coefficients on the interaction term between the dummy for
intra-group deals and industry-adjusted ROA in regressions (4), (5), and (6) are significantly
positive, indicating that chaebol-affiliated issuers with better past performance tend to sell their
private securities at a lower price to their member firms than do other types of issuers. These results
are consistent with tunneling within business groups.

18
III. Market’s Responses to PSOs
We calculate the abnormal returns for the issuing and acquiring firms around the time of the
announcement of private sales of securities by using a standard event-study methodology. We
estimate market model parameters by using days -220 to -21 relative to the announcement date. We
use the KOSPI return as the proxy for the market portfolio. The daily abnormal returns are
accumulated to obtain the cumulative abnormal return (CAR) from day -t before the announcement
date to day +t after the announcement date. We use t-statistics to test the hypothesis that the average
CARs are equal to zero and sign-rank test statistics to test the hypothesis that the CARs are
distributed symmetrically around zero.
Panel A of Table IV presents the CARs for issuing firms. The average CAR (-1, 1) and CAR (-5,
5) for the total sample of issuing firm are 1.85% and 2.85%, respectively, and significant at the 0.01
level. These results are consistent with those for U.S. issuers conducting private sales of equity
(Wruck, 1989; Hertzel and Smith, 1993; Barclay, Holderness, and Sheehan, 2003). In contrast, the
mean and median CARs (-10, 480) are -42.3% and -49.9%, respectively, both of which are
significant at the 0.01 level. These results are also consistent with the findings of Hertzel, Lemmon,
Linck, and Rees (2002) and Barclay, Holderness, and Sheehan (2003), who show long-run
underperformance following private sales of equity by U.S. firms.
[Insert Table IV here]
Classifying the deals into intra-group deals and other deals, we find that the significance of the
positive mean CAR (-1, 1) and CAR (-5, 5) mostly comes from issuers in other deals. Although the
average CARs for issuers in intra-group deals during the same intervals are positive, they are not
significant. Furthermore, the median CAR (-10, 480) for intra-group deals is significantly smaller
than that for other deals (-73.1% compared to -42.9%). These results suggest that factors that
determine the valuation effects of the PSOs are different for chaebol and nonchaebol firms, and that
19
tunneling can be a major motivation behind some chaebol firms’ financing activities.14
Figure 1 shows the CARs for issuing firms from day -10 to day +480 around the event date.
The CARs for the issuers in intra-group deals increase up to day -5 and then start falling until day
+480. For the issuers in other deals, the CARs also increase before day -5. Unlike the CARs for the
issuers in intra-group deals, the CARs for the issuers in other deals continue to rise even after the
announcement date and level off at day +50. The CARs start falling below zero after around day
+70. Panel A of Table IV also shows the CARs for purchasing firms around PSO announcement
dates. We find that the mean and median CARs (-1, 1) are not significant. In contrast, the mean and
median CARs (-10, 480) are negative and significant.
[Insert Figure 1 here]
Panel B of Table IV presents the CARs (-1, 1) and CARs (-5, 5) for the subsample of 70 issuing
and 70 purchasing firms in deals in which purchasing firms are listed on the KSE. The issuing firms
in intra-group deals realize positive and significant abnormal returns, while the acquiring firms in
intra-group deals realize negative and significant abnormal returns. The returns for issuing and
acquiring firms in other deals show a different pattern. Although the issuing firms realize
significantly positive returns, the purchasing firms do not realize any significant returns. These
results indicate that the managerial objectives of chaebol firms in intra-group deals are different
from those of firms in other deals.
Since tunneling can take place in both directions, from issuers to acquirers or from acquirers to
issuers, the announcement effects of these two opposite forms of tunneling in Panel B are likely to
offset each other. To investigate the effect of these two different forms of tunneling in an
unambiguous way, in Panel C, we classify acquirers and issuers in intra-group deals into Sample I
and Sample II according to the issue price and relative ownership stakes of the controlling
shareholder as suggested by the model developed in Section I. We expect that for Sample I, issuers

20
experience positive abnormal returns, while acquirers experience negative abnormal returns. We
expect to observe the opposite pattern of the CARs for Sample II.
Consistent with the prediction of the model, the issuers in Sample I realize positive and
significant returns and the acquirers in Sample I realize negative and significant returns. In Sample
II, however, we do not observe any significant announcement effects, even though the directions of
the announcement effects are consistent with the model. The tests of mean and median differences
between the CARs for issuing (acquiring) firms in Sample I and those for issuing (acquiring) firms
in Sample II strongly reject the null hypothesis of equality.
Although the opposite signs for the CARs of the issuing and purchasing firms reported in Panel
C suggest the existence of tunneling in PSOs, it is not possible to infer from them whether the PSOs
indeed end up increasing the wealth of the controlling shareholder. To see whether the controlling
shareholder financially benefits from the PSOs, in Panel C, we also report the CARs realized by the
portfolio of issuers and acquirers. The value-weighted CAR for the portfolio is measured by
calculating a value-weighted average of the issuing firm CAR and the purchasing firm CAR for
each offering, where the weights are based on the market values of stocks owned by the controlling
shareholder in the issuer and the acquirer. We find that the controlling shareholder realizes the mean
and median value-weighted CARs (-5, 5) of 6.38% and 5.71% from Sample I, both of which are
significant at the 0.01 level. The corresponding CARs for Sample II are 4.23% and 3.03%, but not
significant, possibly due to the small sample size.
To measure the economic significance of the benefits the controlling shareholder receives from
the PSOs, in Panel D, we report the market value changes of the controlling shareholder’s equity
holdings in the issuing and acquiring firms for Sample I and Sample II. The results show that for
Sample I, the mean net market value change of holdings from day -5 to day +5 by the controlling
shareholders is about 1 billion won. For Sample II, the corresponding number is 611 million won.
21
The positive portfolio returns and net gains realized by the controlling shareholders support the
prediction of the tunneling view.
However, it is possible that the controlling shareholders care about more than just the market
value of their holdings in chaebol firms. They might put more value on the controlling rights and
private benefits in chaebol firms. Therefore, our measures of the value weighted CARs for the
portfolio and the changes in the market value of the controlling shareholders’ holdings
underestimate the extent of the tunneling. In addition, to the extent that the valuation of securities
issued by unlisted firms is difficult to estimate, as in the case of Samsung SDS, the controlling
shareholders are likely to choose the PSOs of privately held firms as a way to tunnel resources from
member firms. Since the changes in the market value of the controlling shareholders’ holdings
cannot be estimated for such PSOs, this further makes our estimation of the magnitude of tunneling
less than the true extent.
IV. Multivariate Analyses
When tunneling is detected later by investors or regulatory bodies, the controlling shareholders
can receive severe penalties from the stock market and face various sanctions from regulators. The
controlling shareholders, therefore, tend to choose the form of tunneling that minimizes penalties
and sanctions, and this makes the existence of tunneling difficult to detect by the market
participants. To avoid the measurement problems associated with the subtlety of tunneling, in this
section, using the predictions of our model, we further identify the subgroups of deals in which
tunneling effects are more likely to occur and examine whether the announcement effects of these
groups are different from those of other groups in the multivariate regression framework.
In regressions (1), (2), and (3) of Table V, we use the CAR (-1, 1) for the issuer as the dependent
variable. In tests not reported here, we also experiment with CARs (-1, 0), CARs (-5, 5), and CARs
22
(-10, 480), and obtain results similar to those reported in this paper. All regressions are estimated
using ordinary least squares (OLS). As a measure of tunneling effects, we use the following
variables as independent variables: i) the dummy variable for intra-group deals; ii) dummy variables
indicating whether condition (7) or (8) in the model is satisfied; and iii) the dummy variable for a
small acquisition (i.e., a premium offering in which the percentage of shares purchased by the
acquirer is smaller than its percentage ownership in the issuer before the offering).15 Instead of
using dummy variables for conditions (7) and (8), we use an alternative measure of tunneling
effects: a relative ownership disparity defined as the difference between αI + αA × γO and αA × γI ,
which is the net gain to the controlling shareholder from the $1 overpayment by all acquirers at the
PSO. The regressions also control for other variables used in Table III.
[Insert Table V here]
In the first regression, we regress the CARs for issuers on discount, the dummy for intra-group
deals, an interaction term between these two variables, and other control variables. If the issuing
firms sell securities at a deep discount for tunneling purposes to firms in the same chaebol, we
would expect a negative relation between the CAR for issuing firms and the interaction term of the
discount rate and the intra-group deal dummy. Consistent with our expectation, the interaction
variable has a coefficient of -0.04 with a t-statistic of -2.15. This implies that a one standard
deviation increase in the discount rate (43.0%) leads to a 1.72% lower CAR (-1,1) for chaebol-
affiliated issuing firms in intra-group deals than for other issuing firms in non-intra-group deals. In
contrast, the coefficient on the discount rate is 0.005 and not significant. Therefore, unlike intra-
group deals, the discount has little statistically discernible effect on the CAR for the issuing firms in
other deals.
To directly test the role of relative ownership of the controlling shareholder in tunneling, in the
second regression, we include two dummy variables that capture conditions specified in the model
23
developed in Section I: the dummy for condition (7), which is set to one for intra-group deals that
satisfy condition (7), and the dummy for condition (8), which is set to one for intra-group deals that
satisfy condition (8). In intra-group premium deals that satisfy condition (7), the controlling
shareholder and the issuing firm are expected to gain from the PSOs at the expense of minority
shareholders of the acquiring firm. In contrast, for intra-group discount deals that satisfy condition
(8), we expect the controlling shareholder and the acquiring firm to gain from the deals.
To investigate the importance of the percentage shares purchased at PSOs by the acquirer (γI)
relative to its prior ownership in the issuing firm (γO), we also include a dummy variable for a small
acquisition, which takes the value of one for intra-group premium issues with γI < γO. According to
the model, if γI is smaller than γO, the controlling shareholder has no incentives to influence the
issuer to sell the shares at discount for tunneling. However, when γI is smaller than γO, issuing
shares at premium is always beneficial to the controlling shareholder, suggesting that his tunneling
incentives are high in this case. Therefore, we expect the premium issues with γI < γO to have higher
(lower) CARs for issuing (acquiring) firms.
The results show that the dummy variable for condition (7) has a coefficient of 0.088 with a t-
statistic of 2.75 and the dummy variable for condition (8) has a coefficient of -0.045 with a t-
statistic of -2.08. These estimated coefficients indicate that all else being constant, the firms that
issue private securities under conditions (7) and (8) on average experience 8.8% higher and 4.5%
lower CARs, respectively, than other types of issuers. These results are consistent with the tunneling
view that controlling shareholders have incentives to use PSOs as opportunities to benefit
themselves at the expense of other shareholders. Consistent with the prediction of the model, we
also find that the coefficient on the dummy variable for a small acquisition is positive and
significant with a t-statistic of 1.95.
In the third regression, we replace the dummy variables for conditions (7) and (8) with an
24
alternative measure of tunneling: a relative ownership disparity. The higher the relative ownership
disparity, the larger the net gains to the controlling shareholder from the $1 overpayment by all
acquirers at the PSO. So, the tunneling view predicts a positive relation between relative ownership
disparity and issuer returns. Consistent with this prediction, the coefficient on relative ownership
disparity is positive and significant with a t-statistic of 2.41. A one standard deviation increase in the
relative ownership disparity (12.5%) increases the CAR (-1, 1) by 1.4%.
Among other control variables, firm size is significantly and negatively related to the
announcement period returns. To the extent that large issuing firms have more resources and play a
key role in tunneling resources, the negative coefficient on firm size is consistent with the tunneling
effect.16
Overall, our results support the view that the controlling shareholders in chaebols are likely to
be involved in inefficient corporate transactions, supporting the existence of tunneling effects in
firms belonging to business groups in emerging markets.
To more closely examine the existence of tunneling effects, we also examine whether the
financial and ownership structures of issuing firms have any impacts on the cross-sectional
variation of abnormal returns for purchasing firms. In the last three regressions of Table V, we use
the CAR (-1, 1) for the lead acquirer as the dependent variable. In addition to the independent
variables used in issuer regressions, we include the acquirers’ size and leverage as explanatory
variables.
The most important finding is that the coefficient estimates on dummy variables for condition
(7) and small acquisitions are now significantly negative for acquirers. In particular, the dummy
variable for condition (7) has a coefficient of -0.058, suggesting that all else being equal, acquiring
firms under this condition experience a 5.8% lower CAR than other types of acquirers. These
findings, coupled with the findings that the coefficients on these two same variables are
25
significantly positive in the previous regression for the issuers, suggest the possibility of wealth
transfer from the acquiring firms to the issuing firms. However, the coefficients on a dummy
variable for condition (8) and relative ownership disparity are not significant.17
Overall, the results from the multivariate analyses of announcement period returns for issuers
and acquirers support the tunneling view that the chaebol owner-managers make financing
decisions with little regard for maximizing the shareholder wealth of an individual firm, but with
great regard for maximizing their own private benefits.18
V. Additional Tests
To check the robustness of the results, we examine additional specifications of regression
models. We briefly summarize the results of these tests.
A. Past Performance and Equity Ownership by Foreign Investors
The indirect implication of our model is that the tunneling incentives of the controlling
shareholder are affected by the past performance of both the issuer and the acquirer. For example,
when the issuer has performed poorly before the offering but the acquirer has performed well, the
controlling shareholder might have strong incentives to influence the acquirer to buy stocks at
premium to help the issuer get out of difficulty. Therefore, the tunneling view suggests that the
announcement returns of chaebol issuers are higher than those of other issuers when they have poor
past performance and sell shares at premium to other member firms. In contrast, their returns are
expected to be lower when they have good past performance and sell shares at discount to other
member firms. The announcement returns of chaebol acquirers are expected to be the opposite to
those of chaebol issuers in these cases. To address this issue, in Table VI, we include as an
additional explanatory variable an interaction term between the discount rate and the indicator
26
variable for intra-group deals in which issuing firms have an industry-adjusted ROA above the
sample median.
Table VI shows the results. In issuer (acquirer) regressions, the regression coefficient on the
interaction term is -0.216 (0.263) with a t-statistic of -2.15 (2.12), implying that a one standard
deviation increase in the discount (43.0%) is associated with a 9.3% (11.4%) lower (higher) return
for chaebol-affiliated issuers with good past performance (member acquirers) than for other types of
issuers (acquirers). To the extent that tunneling is more likely to occur from issuers to acquirers if
the issuers with good past performance sell securities at a lower price to the firms in the same
chaebol, these results suggest that resources can be tunneled into acquirers out of well-performing
issuers.
[Insert Table VI here]
Another indirect implication of our model is that the tunneling incentives of the controlling
shareholder are likely to be affected by the monitoring of independent outside shareholders (Shleifer
and Vishny (1986)). To investigate the role of outside shareholders in deterring tunneling activities
within chaebol firms, we include equity ownership by foreign investors as an additional explanatory
variable.19 We find that the coefficients on equity ownership by foreign investors are positive and
significant in issuer regressions. To the extent that foreign investors are independent from
management, these results support the view that unaffiliated outside investors play an instrumental
role in preventing firms from engaging in tunneling activities.
B. Impact of the Shift in the Regulatory Environment
As in many other countries, Korean firms are not required to register with the Financial
Supervisory Service (equivalent to the SEC in the U.S.) for their PSOs. Furthermore, until recently,
there were no constraints on how firms select the offer prices or the conversion (exercise) prices of
27
their private securities. To prevent the misuse of PSOs, however, the Korean government started to
regulate the conversion (exercise) prices of PCBOs (PBWOs) and the offering prices of PEOs by
listed companies in the late 1990s. For example, after March 1997, a firm that wants to issue private
CBs (BWs) is required to set their conversion (exercise) price at a higher level than the average
market price of its shares, and after June 1999, a firm that wants to issue private equity is required
to set the discount rate at less than 10%.20 These regulations, however, do not apply to private
securities issued by unlisted companies or to those issued by listed firms that are offered at premium.
To examine the impact of the shift in the regulatory environment (i.e., the passage of the
regulations on conversion (exercise) prices or offering prices) on the tunneling incentives of
controlling shareholders in chaebols, in unreported tests of issuer regressions, we use as the
additional explanatory variables a regulation dummy that takes the value of one if the issues are
made after the adoption of these regulations and interaction terms between this dummy and
tunneling variables. We find that the coefficient on the interaction term between the dummy for
condition (7) and the regulation dummy is positive and significant but the coefficient on the dummy
for condition (7) becomes insignificant. In contrast, the coefficient on the interaction term between
the dummy for condition (8) and the regulation dummy is not significant but the coefficient on the
dummy for condition (8) remains significantly negative. These results, coupled with the fact that
price regulations apply to discount issues but not to premium issues, suggest that before the
adoption of regulation, discount offerings were the dominant means for tunneling, but during the
post-regulation period unbalanced regulations have changed the incentive of the controlling
shareholder to use premium offerings as an important means for tunneling.
C. Type of Securities Offerings
One obvious issue when using pooled data of private placements of equity, CBs, and BWs is
28
that the issuer characteristics of these three groups are somewhat different from each other. This
means that our results in Table V could be driven by a particular group of sample firms even though
we have controlled for the types of security offerings by including type dummies. To ensure that
this is not the case, we re-estimate issuer regressions by the type of securities offerings. Since the
subsample of PBWOs includes only seven cases of intra-group deals, we do not perform the
regression analysis for this subsample.
The unreported results show that the coefficients on a dummy for condition (7), a dummy for
condition (8), and relative ownership disparity are consistently significant in both subsamples.
Therefore, the results for these two subgroups suggest that our main results regarding the tunneling
effect are not specific to a certain group of firms.
D. Value-Weighted Portfolio Returns of Nonissuing and Nonpurchasing Firms
If the main motivation behind placing securities privately by the controlling shareholder is to
tunnel resources out of an affiliated firm and transfer them to other firms, PSO announcements will
have value implications not only for the firms participating in the offerings but also for other
nonparticipating member firms in the same chaebol. For example, in an intra-group PSO motivated
by tunneling, nonparticipating members of the chaebol might experience increases in value because
the market expects that if those member firms were to get into trouble, they too would be bailed out
(Bae et al. (2002)). However, to the extent that this deal sends bad signals to the market about the
quality of the governance structures the chaebol adopts, it could have a negative impact on the value
of other nonparticipating member firms.
To address this issue, we estimate the value-weighted portfolio returns of nonparticipating firms
that belong to the same chaebol as the issuer. Abnormal returns for nonissuing affiliates are
calculated by using a portfolio approach. The market-model parameters are estimated using returns
29
of the value-weighted portfolio of nonissuing firms in the same group and then used to calculate the
daily abnormal returns of the portfolio. The daily abnormal returns are accumulated to obtain the
portfolio CAR from day -t to day +t. In unreported tests, we find, however, that none of the value-
weighted portfolio CAR (-1, 1) of nonparticipating firms is significant. The results from regressing
the value-weighted portfolio CAR (-1, 1) of nonparticipating firms on the issue and issuer
characteristics (not reported) show that the value-weighted portfolio returns are significantly and
negatively related to discounts for intra-group deals, particularly when an issuer’s industry-adjusted
ROA is above the sample median. We also find that for intra-group deals, the effect of the private
placement on the value of nonparticipating firms is more detrimental when these deals meet
condition (7) of the model. These results suggest that the market perceives tunneling-motivated
private placements of securities by a chaebol-affiliated firm as group-wide events. The weak quality
of the governance structures that the chaebol issuing firm adopts in the tunneling activity signals to
the market the quality of the governance structures for other member firms and thus has a negative
impact on the value of the whole group.
VI. Summary and Conclusion
We examine whether equity-linked PSOs by group-affiliated firms in Korea are motivated by
tunneling that benefits the controlling shareholders at the expense of other shareholders. We find
that for intra-group deals, the firms with good past performance tend to sell their securities at a
lower price. Chaebol firms also tend to sell their securities at lower (higher) prices when relative
ownership stakes of the controlling shareholders in the issuing and acquiring firms allow them to
reap benefits from selling securities at discount (premium).
Compared to other types of issuers, the chaebol-affiliated issuers realize a higher announcement
return when they sell private securities at premium to other member firms in the same group, and
30
when the controlling shareholders receive positive net gains from equity ownership in issuers and
acquirers. In contrast, the chaebol-affiliated issuers realize a lower return when they sell securities
at discount to member firms, particularly when they perform well before the offerings. Such deals,
however, lead to significantly higher returns for chaebol acquirers. These results support the
tunneling view that the substantial discretionary power held by controlling shareholders in chaebol
firms allows them to receive private benefits at the expense of other shareholders, resulting in
inefficient financing decisions.
Our evidence points to a dark side of PSOs that is consistent with tunneling within business
groups. Our findings, coupled with the findings of Bertrand et al. (2002) and Bae et al. (2002),
suggest that owner-managers in business groups indeed have strong incentives to siphon resources
out of member firms for their private benefits, and use both investment and financing decisions as a
means of achieving this goal. Concentrated ownership by chaebol owner-managers and cross-
shareholding practices within chaebol firms seem to be largely responsible for these distorted
incentives of chaebol owner-managers.
31
References
Bae, Kee-Hong, Jun-Koo Kang, and Jin-Mo Kim, 2002. Tunneling or value added? Evidence from mergers by Korean business groups. Journal of Finance 57, 2695-2740.
Baek, Jae-Seung, Jun-Koo Kang, and Kyung Suh Park, 2004. Corporate governance and firm value:
Evidence from the Korean financial crisis. Journal of Financial Economics 71, 265-313. Barclay, Michael J., Clifford G. Holderness, and Dennis P. Sheehan, 2003. Private placements and
managerial entrenchment. Unpublished working paper, University of Rochester. Bertrand, Marianne, Paras Mehta, and Sendhil Mullainathan, 2002. Ferreting out tunneling: An
application to Indian business groups. Quarterly Journal of Economics 117, 121-148. Claessens, Stijn, Simeon Djankov, Joseph P. H. Fan, and Larry H. P. Lang, 2002. Disentangling the
incentive and entrenchment effects of large shareholdings, Journal of Finance 57, 2741-2771. Claessens, Stijn, Simeon Djankov, and Larry H. P. Lang, 2000. The separation of ownership and
control in East Asian corporations. Journal of Financial Economics 58, 81-112. Cronqvist, Henrik, and Mattias Nilsson, 2003. The choice between rights offerings and private
equity placements. Working paper, University of Chicago. Fields, L. Paige, and Eric L. Mais, 1991. The valuation effects of private placements of convertible
debt. Journal of Finance 46, 1925-1932. Hertzel, Michael, and Richard L. Smith, 1993. Market discounts and shareholder gains for placing
equity privately. Journal of Finance 48, 459-485. Hertzel, Michael, Michael L. Lemmon, James S. Linck, and Lynn Rees, 2002. Long-run
performance following private placements of equity. Journal of Finance 57, 2595-2617. Jang, Hasung, and Joongi Kim, 2002. Nascent stages of corporate governance in an emerging
market: Regulatory change, shareholder activism and Samsung Electronics. Corporate Governance 10, 84-95.
32
Jensen, Michael C., and William H. Meckling, 1976. Theory of the firm: Managerial behavior, agency costs and ownership structure. Journal of Financial Economics 3, 305-360.
Johnson, Simon, Rafael La Porta, Florencio Lopez-de-Silanes, and Andrei Shleifer, 2000. Tunneling.
American Economic Review Papers and Proceedings 90, 22-27. Kang, Jun-Koo, Yong-Cheol Kim, and Rene M. Stulz, 1999. The underreaction hypothesis and the
new issue puzzle: Evidence from Japan. Review of Financial Studies 12, 519-534. Kang, Jun-Koo, and Rene M. Stulz, 1996. How different is Japanese corporate finance? An
investigation of the information content of new security issues. Review of Financial Studies 9, 109-139.
Kang, Jun-Koo, and Rene M. Stulz, 1997. Why is there a home bias? An analysis of foreign
portfolio equity ownership in Japan. Journal of Financial Economics 46, 3-28. Kato, Kiyoshi, and James S. Schallheim, 1993. Private equity financings in Japan and corporate
grouping (keiretsu). Pacific-Basin Finance Journal 1, 287-307. Kim, Joongi, 2000. Recent amendments to the Korean Commercial Code and their effects on
international competition. University of Pennsylvania Journal of International Economic Law 21, 273-329.
La Porta, Rafael, Florencio Lopez-de-Silanes, and Andrei Shleifer, 1999. Corporate ownership
around the world. Journal of Finance 54, 471-517.
La Porta, Rafael, Florencio Lopez-de-Silanes, and Andrei Shleifer, 2002. Investor protection and
corporate valuation. Journal of Finance 57, 1147-1170. Lemmon, Michael L., and Karl V. Lins, 2003. Ownership structure, corporate governance, and firm
value: Evidence from the East Asian financial crisis. Journal of Finance 58, 1445-1468. Loughran, Tim, and Jay R. Ritter, 1995. The new issue puzzle. Journal of Finance 50, 23-51.
33
Mitton, Todd, 2002. A cross-firm analysis of the impact of corporate governance on the East Asian financial crisis. Journal of Financial Economics 64, 215-241.
Myers, Stuart, and Nicholas Majluf, 1984. Corporate financing and investment decisions when
firms have information that investors do not have. Journal of Financial Economics 13, 187-221. Shleifer, Andrei, and Robert W. Vishny, 1986. Large shareholders and corporate control. Journal of
Political Economy 94, 461-488. Wruck, Karen H., 1989. Equity ownership concentration and firm value: Evidence from private
equity financings. Journal of Financial Economics 23, 3-28.
34
ENDNOTES
1 Claessens, Djankov, and Lang (2000) document a large divergence between cash flow rights and control
rights for many East Asian firms. Claessens, Djankov, Fan, and Lang (2002), La Porta, Lopez-de-Silanes,
Shleifer, and Vishny (2002), Mitton (2002), Lemmon and Lins (2003), and Baek, Kang, and Park (2004) find
that firm value is negatively related to the separation of the cash flow and control rights of the controlling
shareholders.
2 Although chaebol firms have undertaken significant structural reforms to strengthen their corporate
governance structures in recent years, several important governance systems, including the outside directors
of the board and the legal system to protect minority shareholders, were not well established during our
sample period. See Bae et al. (2002) and Baek et al. (2004) for detailed discussions of corporate governance
systems in Korea.
3 In Korea, the fiduciary duty of directors has become an important issue only recently. Before 1997, no
reported lawsuit had been filed by minority shareholders against directors for the breach of their duty (Kim
(2000)). In addition, unlike in the U.S., the concepts of the duty of care and the duty of loyalty were not
clearly distinguished in Korea. Until recently, some legal scholars and judges thought that the duty of care
itself covers the duty of loyalty and therefore took the view that it is not necessary to explicitly define the duty
of loyalty of directors (see, for example, a public hearing document of the Ministry of Justice written in
Korean: http://www.cfe.org/stock/lan/discuss/2.html). However, in February 1998, the Commercial Codes
explicitly introduced the concept of the duty of loyalty of directors to the individual company into Article
382-3. Nevertheless, as we show in several cases in the appendix, Korean courts emphasize the
predictability of the law and rely on statutory rules to govern self-dealing behavior of corporate directors
rather than emphasizing the notion of fairness, which is an important principle of common law countries in
governing such behavior (Johnson et al. (2000)). This reluctance of Korean courts to apply the principle of
35
fairness to corporate directors is similar to that of courts in many civil law countries. See Johnson et al. (2000)
for a detailed discussion of this issue.
4 Hertzel, Lemmon, Linck, and Rees (2002), however, show that the stock market performance of U.S. firms
issuing private equity is significantly lower than that of nonissuers over a three-year period after the offering,
and view this as evidence of overoptimistic reactions by investors during the announcement period. Kang,
Kim, and Stulz (1999) also document the long-run underperformance following private sales of equity by
Japanese firms.
5 In a recent paper, Barclay, Holderness, and Sheehan (2003) show that for private placements of equity made
to passive investors, stock returns for issuing firms are positive but small at the issue announcement, and
negative over 120 days after the offering. They argue that these results are consistent with the view that
private placements of equity help management solidify their control of the firms. While their paper also
examines the dark side of PSOs by focusing on management entrenchment as a potential motivation behind
placing securities privately, our focus differs from theirs in that we examine controlling shareholders’
incentives for tunneling within firms belonging to business groups.
6 Our model does not consider the case where the issuer also owns some shares of the acquirer; that is, the
case of a direct crossholding. This is because the direct crossholding within member firms was legally
prohibited in Korea during our sample period. We also do not explicitly consider indirectly owned
shareholdings by the controlling shareholder in the model; that is, indirect holdings in issuing and acquiring
firms through holdings in other affiliated firms. We obtain results very similar to those shown in this section if
we add these indirect holdings to the controlling shareholder’s direct ownership so far as other affiliated firms
do not participate at the PEO. Our empirical analysis, however, considers both direct and indirect ownership
by the controlling shareholder in issuing and acquiring firms.
7 The proofs of equations (5) and (6) are available upon request.
36
8 It is also possible that the controlling shareholder directly participates in the offering and purchases the
shares sold by the issuer. To simplify the analysis, let’s assume that the controlling shareholder owns αI% of
the outstanding shares of the issuer, but does not hold any equity of other affiliated firms. Thus, his initial
wealth before the offering (WO) is given by αI × SO × PO. If the controlling shareholder purchases SCS shares at
the offering, his wealth after the offering (WN) will change to WN = [(αI × SO + SCS) / (SO + SI)] × (SO × PO +
SI × OP) – (SCS × OP). It can be easily shown that the controlling shareholder is able to increase his wealth if
he purchases less than αI% of the total offering (i.e., (SCS / SI) < αI) at premium. Alternatively, he can increase
his wealth if he purchases more than αI% of the total offering (i.e., (SCS / SI) > αI) at discount. Therefore, the
tunneling can still occur when the shares are sold directly to either the controlling shareholder or his family
members.
9 For most deals in our sample, there are usually multiple acquirers involved in the sale. In such instances, we
identify the listed firm that purchases the largest portion of private securities as the lead acquirer. When there
are more than two lead acquirers, we choose the firm that has the largest market value of equity as the lead
acquirer. Out of 262 issues, 43 lead acquirers are individuals, 149 lead acquirers are unlisted firms, and 70
lead acquirers are publicly listed firms.
10 Out of the 77 intra-group deals, 34 are sales to the owner-managers and 43 are sales to the firms in the
same group.
11 For one case in our sample, the exact offering amount was not available. Therefore, this observation is
excluded when calculating the mean and median offering sizes. This observation is also excluded from our
regression analyses below.
12 Of course, there are other nontunneling explanations for the large discounts at PSOs. For example, Wruck
(1989) argues that the large discounts are compensation to the acquirers for the monitoring of management.
Hertzel and Smith (1993) view these discounts as a signal of undervaluation. In contrast, Barclay, Holderness,
37
and Sheehan (2003) argue that discounts are compensation for helping managers to entrench.
13 For intra-group deals between member firms, the relative ownership disparity is measured by (αI + αA ×
γO) - αA × γI. However, for non-intra-group deals between unaffiliated firms, αA, γO, and γI cannot be defined
and thus the values of these variables are assumed to be zero. In other words, the relative ownership disparity
for this subgroup is simply αI. Since the benefit of the controlling shareholder for a premium issue increases
as αI increases, αI can measure the extent of the net gain to the controlling shareholder at the PSO (i.e.,
relative ownership disparity). For intra-group deals in which the controlling shareholder of the chaebol issuing
firm is an acquirer, the relative ownership disparity is measured by (αI - SCS /SI). SCS /SI is equivalent to γI in
intra-group deals in which a member firm purchases the shares. The same definition is used for non-intra-
group deals in which the controlling shareholder of the nonchaebol-issuing firm is an acquirer.
14 The classification by the type of securities indicates that firms conducting PEOs experience significantly
positive announcement returns but those conducting PCBOs and PBWOs generally realize insignificant
returns. The CARs (-10, 480) are negative for all three types of securities offerings and those for intra-group
deals are always smaller than those for other deals.
15 Although the dummy variables for conditions (7) and (8) can only be defined for intra-group deals, for
non-intra-group deals, we assign the value of zero to these dummy variables. By doing so, our regression
analyses address the question of whether the CARs for the issuers and the acquirers in intra-group deals that
satisfy condition (7) or condition (8) differ from those for the issuers and acquirers in other types of deals that
do not satisfy condition (7) or condition (8). However, in unreported tests, we examine the robustness of the
results by running regressions separately only for intra-group deals and find that the results are similar.
16 For a given deal size and issuer characteristics, a PSO might attract different investor attention when the
issue is an intra-group deal from when it is not. To address this issue, in unreported tests, we allow control
variables in Table V, such as firm size, leverage, and offer amounts, to have different effects for intra-group
38
and non-intra-group deals by running separate regressions for these two subsamples of deals. We find that
none of these control variables are significant in the subsample regressions except that the coefficient on firm
size is negative and significant only in the subsample of non-intra-group deals.
17 The sample of purchasing firms used in regressions (4), (5), and (6) of Table V consists only of listed firms
and does not include offerings in which the controlling shareholders of the chaebol are buyers of private
securities. Therefore, the coefficients on many explanatory variables are estimated less precisely.
18 To show whether our results are unaffected by one or two outliers that satisfy condition (7) or condition (8),
for the subsample of firms in intra-group deals, we perform an analysis excluding an issuing (acquiring) firm
with the highest CAR and an issuing (acquiring) firm with the lowest CAR from the regressions. We also
experiment with the total sample by excluding the top and bottom 1% of issuers’ (acquirers’) CARs. We
obtain results that are similar to those reported in the paper.
19 Foreign investors tend to hold equity in a few selected firms that show good performance (Kang and Stulz
(1997)), which suggests that they are likely to be victims rather than beneficiaries of tunneling if tunneling
takes place. Therefore, foreign investors have a strong incentive to monitor the chaebol owner-managers and
discourage them from engaging in tunneling. These arguments suggest that foreign ownership of issuers is
positively related to abnormal returns for issuers.
20 See Articles 57, 61, and 63 of the Regulation on Securities Issuance and Disclosure. We thank Hong Kyu
Han at the Financial Supervisory Service for providing detailed information on regulatory issues in PSOs.

39
Table I Distribution of Private Placements of Securities by Year and by Type of Securities
The sample consists of private sales of equity-linked securities by 262 nonfinancial firms listed on the Korea Stock Exchange (KSE) during the period 1989 to 2000. The sample is obtained by checking various sources, including the Korea Securities Research Institute’s database, the Korea Listed Companies Association (KLCA)’s database, the KLCA’s monthly publication, Sang Jang, KOSCOM’s CHECK2000 database, and the KSE’s Korea Investor’s Network for Disclosure System. To avoid having the results confounded by multiple issues that cluster during a short time period, issues that occur within a 10-day interval before and after the announcement of the offering are eliminated. Intra-group deals refer to private sales of equity-linked securities to acquirers in the same chaebol. A chaebol refers to a business group that has at least two listed member firms. The numbers in the private offerings columns represent sample observations in each category. The numbers in the rights offerings and IPOs columns represent the total number of rights offerings and initial public offerings, respectively. KOSPI returns are the annual returns of the Korea Composite Stock Price Index.
Private offerings Total: (1) + (2) + (3) Public offerings
Equity (1)
Convertible bonds (2)
Bonds with warrants (3) Total
Intra-group deals
Other deals
Rights offerings IPOs
KOSPI returns
1989 1 0 0 1 0 1 155 124 0.30%
1990 0 10 0 10 1 9 126 43 -23.50%
1991 1 30 0 31 1 30 124 22 -12.20%
1992 0 13 0 13 2 11 112 4 11.00%
1993 1 0 0 1 1 0 162 8 27.70%
1994 2 0 0 2 0 2 106 31 18.60%
1995 3 0 0 3 2 1 142 28 -14.10%
1996 2 0 0 2 2 0 106 51 -26.20%
1997 2 40 21 63 26 37 84 23 -42.20%
1998 17 24 2 44 21 23 79 3 49.50%
1999 16 26 30 72 13 59 162 31 82.80%
2000 15 6 0 21 6 15 86 4 -52.35%
Total 60 149 53 262 77 185 1,775 522
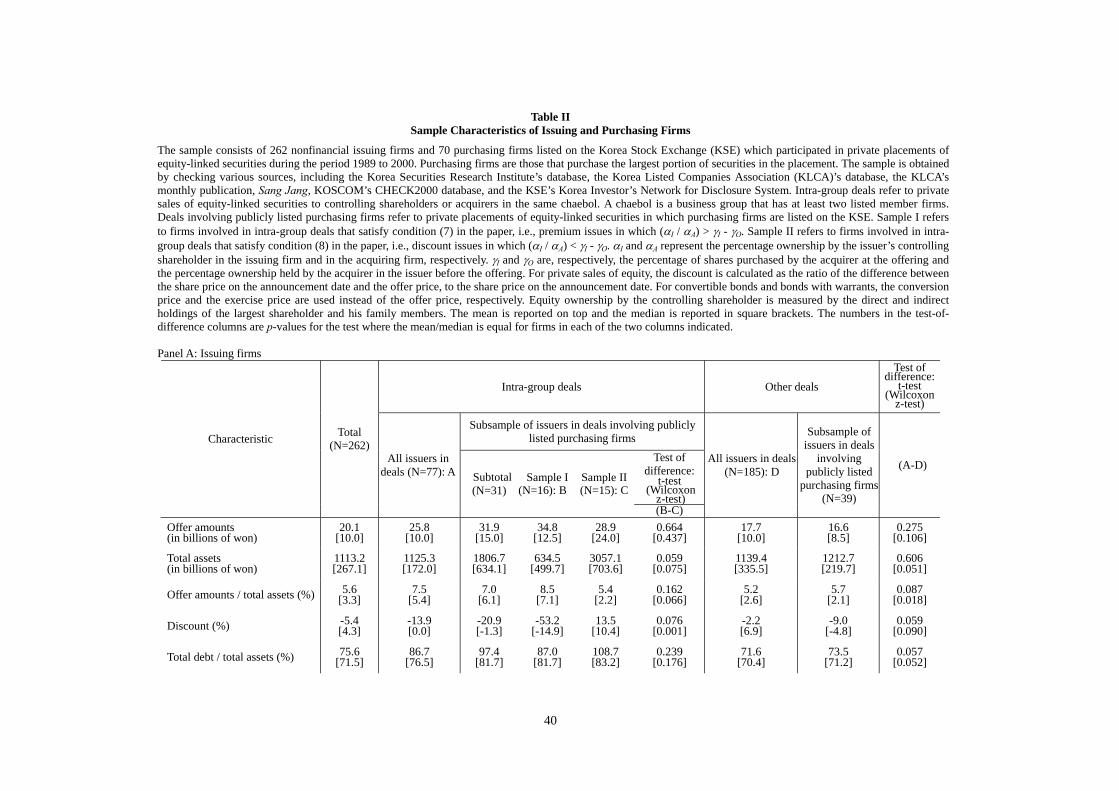
40
Table II Sample Characteristics of Issuing and Purchasing Firms
The sample consists of 262 nonfinancial issuing firms and 70 purchasing firms listed on the Korea Stock Exchange (KSE) which participated in private placements of equity-linked securities during the period 1989 to 2000. Purchasing firms are those that purchase the largest portion of securities in the placement. The sample is obtained by checking various sources, including the Korea Securities Research Institute’s database, the Korea Listed Companies Association (KLCA)’s database, the KLCA’s monthly publication, Sang Jang, KOSCOM’s CHECK2000 database, and the KSE’s Korea Investor’s Network for Disclosure System. Intra-group deals refer to private sales of equity-linked securities to controlling shareholders or acquirers in the same chaebol. A chaebol is a business group that has at least two listed member firms. Deals involving publicly listed purchasing firms refer to private placements of equity-linked securities in which purchasing firms are listed on the KSE. Sample I refers to firms involved in intra-group deals that satisfy condition (7) in the paper, i.e., premium issues in which (αI / αA) > γI - γO. Sample II refers to firms involved in intra-group deals that satisfy condition (8) in the paper, i.e., discount issues in which (αI / αA) < γI - γO. αI and αA represent the percentage ownership by the issuer’s controlling shareholder in the issuing firm and in the acquiring firm, respectively. γI and γO are, respectively, the percentage of shares purchased by the acquirer at the offering and the percentage ownership held by the acquirer in the issuer before the offering. For private sales of equity, the discount is calculated as the ratio of the difference between the share price on the announcement date and the offer price, to the share price on the announcement date. For convertible bonds and bonds with warrants, the conversion price and the exercise price are used instead of the offer price, respectively. Equity ownership by the controlling shareholder is measured by the direct and indirect holdings of the largest shareholder and his family members. The mean is reported on top and the median is reported in square brackets. The numbers in the test-of-difference columns are p-values for the test where the mean/median is equal for firms in each of the two columns indicated. Panel A: Issuing firms
Intra-group deals Other deals
Test of difference:
t-test (Wilcoxon
z-test)
Subsample of issuers in deals involving publicly listed purchasing firms
Test of difference:
t-test (Wilcoxon
z-test)
Characteristic Total (N=262)
All issuers in deals (N=77): A
Subtotal(N=31)
Sample I(N=16): B
Sample II (N=15): C
(B-C)
All issuers in deals (N=185): D
Subsample of issuers in deals
involving publicly listed
purchasing firms (N=39)
(A-D)
Offer amounts (in billions of won)
20.1 [10.0]
25.8 [10.0]
31.9 [15.0]
34.8 [12.5]
28.9 [24.0]
0.664 [0.437]
17.7 [10.0]
16.6 [8.5]
0.275 [0.106]
Total assets (in billions of won)
1113.2 [267.1]
1125.3 [172.0]
1806.7 [634.1]
634.5 [499.7]
3057.1 [703.6]
0.059 [0.075]
1139.4 [335.5]
1212.7 [219.7]
0.606 [0.051]
Offer amounts / total assets (%) 5.6 [3.3]
7.5 [5.4]
7.0 [6.1]
8.5 [7.1]
5.4 [2.2]
0.162 [0.066]
5.2 [2.6]
5.7 [2.1]
0.087 [0.018]
Discount (%) -5.4 [4.3]
-13.9 [0.0]
-20.9 [-1.3]
-53.2 [-14.9]
13.5 [10.4]
0.076 [0.001]
-2.2 [6.9]
-9.0 [-4.8]
0.059 [0.090]
Total debt / total assets (%) 75.6 [71.5]
86.7 [76.5]
97.4 [81.7]
87.0 [81.7]
108.7 [83.2]
0.239 [0.176]
71.6 [70.4]
73.5 [71.2]
0.057 [0.052]

41
Industry-adjusted ROA (%) -1.4 [-0.5]
-0.7 [0.5]
-3.9 [-1.4]
-5.7 [-1.4]
-2.0 [-1.8]
0.403 [0.368]
-1.7 [-1.3]
-0.2 [0.7]
0.132 [0.018]
Equity ownership by controlling shareholders (%)
18.6 [17.0]
16.1 [12.5]
19.5 [16.5]
22.5 [17.0]
16.4 [13.4]
0.263 [0.311]
21.4 [18.4]
25.5 [21.2]
0.036 [0.484]
Equity ownership by foreign investors (%)
10.8 [3.6]
14.5 [4.0]
5.0 [1.4]
4.7 [1.2]
5.3 [1.5]
0.834 [0.620]
9.4 [3.1]
3.6 [0.7]
0.057 [0.252]
Panel B: Purchasing firms
Intra-group deals
Test of difference: t-test
(Wilcoxon z-test)
Test of difference:t-test
(Wilcoxon z-test) Characteristic Total (N=70) Subtotal
(N=31): A Sample I(N=16): B
Sample II (N=15): C
(B-C)
Other deals (N=39): D
(A-D)
Acquiring amounts (in billions of won)
23.5 [10.0]
16.3 [10.0]
13.7 [10.0]
19.0 [10.0]
0.296 [0.243]
16.6 [8.5]
0.093 [0.015]
Total assets (in billions of won)
1475.7 [429.7]
3586.1 [1946.4]
2969.2 [1622.8]
4244.3 [1946.4]
0.419 [0.339]
1212.7 [219.1]
0.656 [0448]
Acquiring amounts / total assets (%)
6.3 [3.4]
7.0 [6.1]
8.5 [7.1]
5.5 [2.2]
0.162 [0.066]
5.7 [2.1]
0.150 [0.094]
Discount (%) -15.8 [-5.1]
-20.9 [-1.3]
-53.2 [-14.9]
13.5 [10.4]
0.076 [0.001]
-9.0 [-4.9]
0.400 [0.397]
Total debt / total assets (%) 80.6 [80.3]
83.2 [78.7]
90.9 [78.7]
75.0 [77.2]
0.195 [0.220]
78.6 [89.2]
0.511 [0.041]
Industry-adjusted ROA (%) -4.8 [-3.0]
-1.4 [1.3]
-6.7 [-0.4]
2.3 [1.6]
0.086 [0.020]
-6.8 [-4.5]
0.158 [0.001]
Equity ownership by controlling shareholders (%)
17.6 [14.9]
18.9 [17.5]
15.7 [12.1]
22.4 [18.3]
0.897 [0.257]
21.7 [21.4]
0.072 [0.030]
Equity ownership by foreign investors (%)
7.3 [5.8]
7.7 [6.4]
7.9 [5.8]
7.6 [7.1]
0.893 [0.959]
5.8 [3.5]
0.378 [0.083]
Equity ownership by acquirers in the issuing firms before the offerings (%)
1.4 [0.0]
5.3 [0.0]
9.6 [0.0]
0.7 [0.0]
0.546 [0.343]
0.6 [0.0]
0.032 [0.033]
Equity ownership by acquirers in the issuing firms after the offerings (%)
16.0 [10.4]
13.8 [10.4]
10.3 [8.3]
17.5 [11.3]
0.157 [0.192]
17.8 [10.2]
0.224 [0.439]
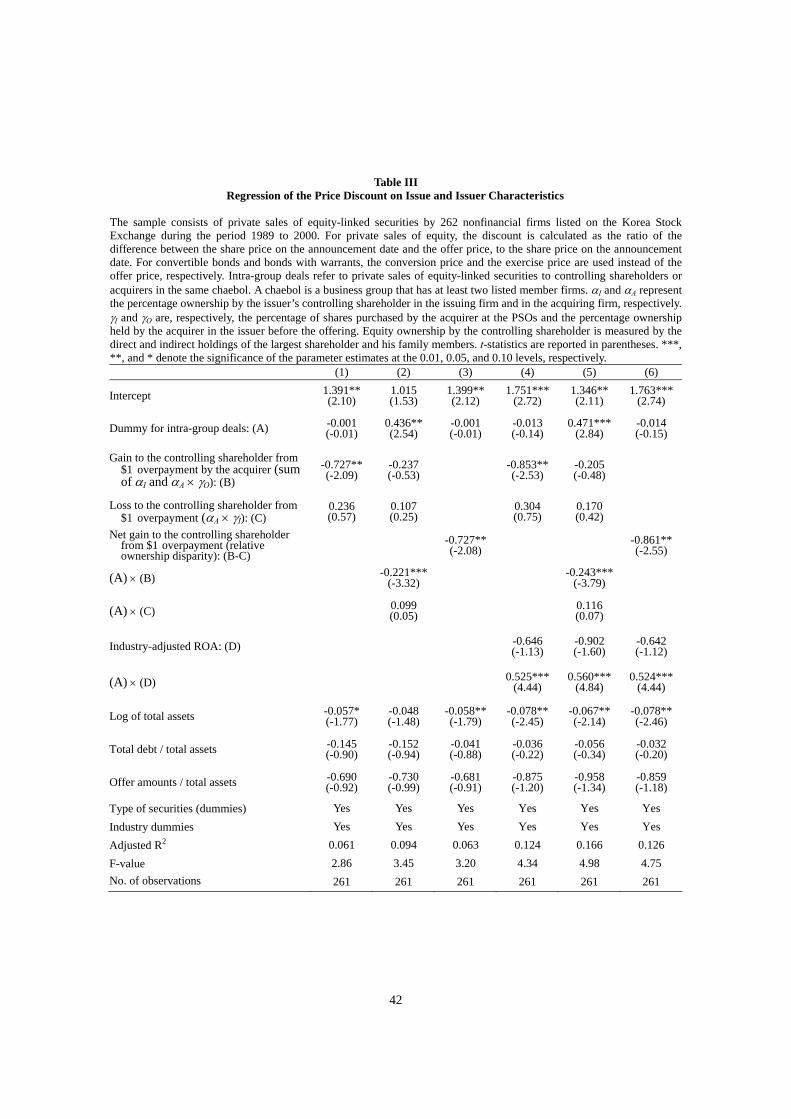
42
Table III Regression of the Price Discount on Issue and Issuer Characteristics
The sample consists of private sales of equity-linked securities by 262 nonfinancial firms listed on the Korea Stock Exchange during the period 1989 to 2000. For private sales of equity, the discount is calculated as the ratio of the difference between the share price on the announcement date and the offer price, to the share price on the announcement date. For convertible bonds and bonds with warrants, the conversion price and the exercise price are used instead of the offer price, respectively. Intra-group deals refer to private sales of equity-linked securities to controlling shareholders or acquirers in the same chaebol. A chaebol is a business group that has at least two listed member firms. αI and αA represent the percentage ownership by the issuer’s controlling shareholder in the issuing firm and in the acquiring firm, respectively. γI and γO are, respectively, the percentage of shares purchased by the acquirer at the PSOs and the percentage ownership held by the acquirer in the issuer before the offering. Equity ownership by the controlling shareholder is measured by the direct and indirect holdings of the largest shareholder and his family members. t-statistics are reported in parentheses. ***, **, and * denote the significance of the parameter estimates at the 0.01, 0.05, and 0.10 levels, respectively.
(1) (2) (3) (4) (5) (6)
Intercept 1.391** (2.10)
1.015 (1.53)
1.399** (2.12)
1.751***(2.72)
1.346** (2.11)
1.763***(2.74)
Dummy for intra-group deals: (A) -0.001 (-0.01)
0.436** (2.54)
-0.001 (-0.01)
-0.013 (-0.14)
0.471*** (2.84)
-0.014 (-0.15)
Gain to the controlling shareholder from $1 overpayment by the acquirer (sum
of αI and αA × γO): (B) -0.727**(-2.09)
-0.237 (-0.53) -0.853**
(-2.53) -0.205 (-0.48)
Loss to the controlling shareholder from $1 overpayment (αA × γI): (C)
0.236 (0.57)
0.107 (0.25) 0.304
(0.75) 0.170 (0.42)
Net gain to the controlling shareholder from $1 overpayment (relative ownership disparity): (B-C)
-0.727**(-2.08) -0.861**
(-2.55)
(A) × (B) -0.221***(-3.32) -0.243***
(-3.79)
(A) × (C) 0.099 (0.05) 0.116
(0.07)
Industry-adjusted ROA: (D) -0.646 (-1.13)
-0.902 (-1.60)
-0.642 (-1.12)
(A) × (D) 0.525***(4.44)
0.560*** (4.84)
0.524***(4.44)
Log of total assets -0.057* (-1.77)
-0.048 (-1.48)
-0.058**(-1.79)
-0.078**(-2.45)
-0.067** (-2.14)
-0.078**(-2.46)
Total debt / total assets -0.145 (-0.90)
-0.152 (-0.94)
-0.041 (-0.88)
-0.036 (-0.22)
-0.056 (-0.34)
-0.032 (-0.20)
Offer amounts / total assets -0.690 (-0.92)
-0.730 (-0.99)
-0.681 (-0.91)
-0.875 (-1.20)
-0.958 (-1.34)
-0.859 (-1.18)
Type of securities (dummies) Yes Yes Yes Yes Yes Yes Industry dummies Yes Yes Yes Yes Yes Yes Adjusted R2 0.061 0.094 0.063 0.124 0.166 0.126 F-value 2.86 3.45 3.20 4.34 4.98 4.75 No. of observations 261 261 261 261 261 261
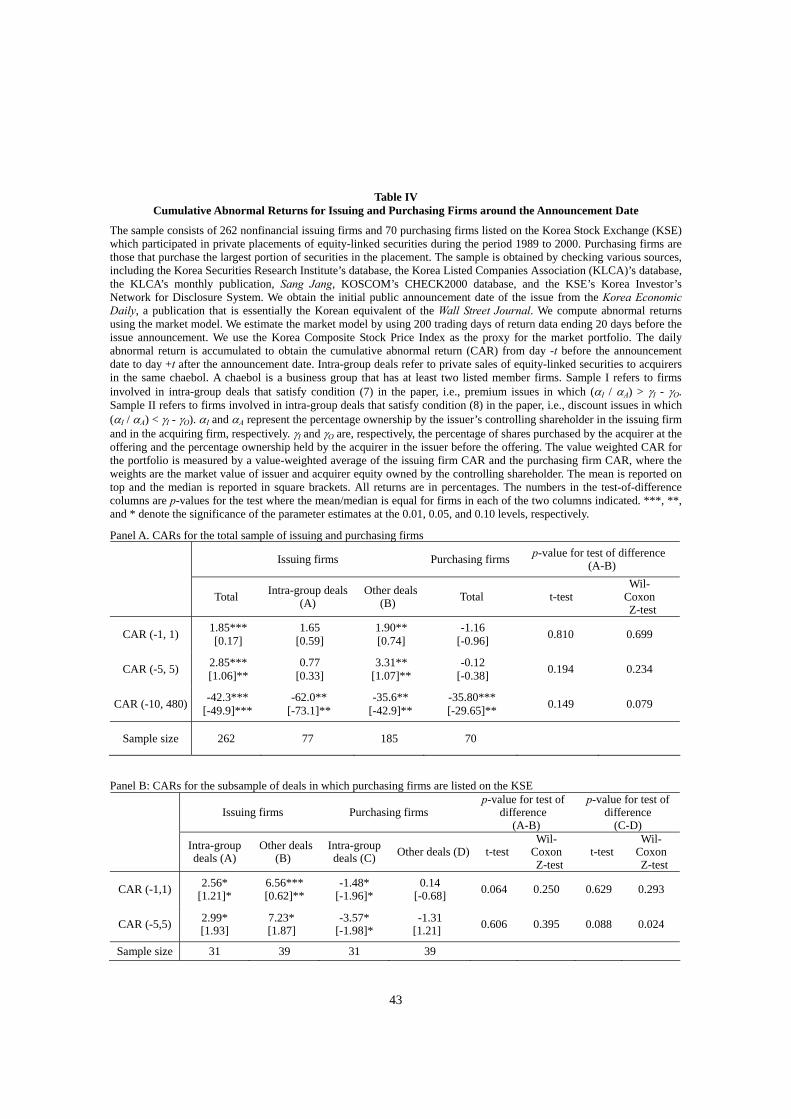
43
Table IV
Cumulative Abnormal Returns for Issuing and Purchasing Firms around the Announcement Date
The sample consists of 262 nonfinancial issuing firms and 70 purchasing firms listed on the Korea Stock Exchange (KSE) which participated in private placements of equity-linked securities during the period 1989 to 2000. Purchasing firms are those that purchase the largest portion of securities in the placement. The sample is obtained by checking various sources, including the Korea Securities Research Institute’s database, the Korea Listed Companies Association (KLCA)’s database, the KLCA’s monthly publication, Sang Jang, KOSCOM’s CHECK2000 database, and the KSE’s Korea Investor’s Network for Disclosure System. We obtain the initial public announcement date of the issue from the Korea Economic Daily, a publication that is essentially the Korean equivalent of the Wall Street Journal. We compute abnormal returns using the market model. We estimate the market model by using 200 trading days of return data ending 20 days before the issue announcement. We use the Korea Composite Stock Price Index as the proxy for the market portfolio. The daily abnormal return is accumulated to obtain the cumulative abnormal return (CAR) from day -t before the announcement date to day +t after the announcement date. Intra-group deals refer to private sales of equity-linked securities to acquirers in the same chaebol. A chaebol is a business group that has at least two listed member firms. Sample I refers to firms involved in intra-group deals that satisfy condition (7) in the paper, i.e., premium issues in which (αI / αA) > γI - γO. Sample II refers to firms involved in intra-group deals that satisfy condition (8) in the paper, i.e., discount issues in which (αI / αA) < γI - γO). αI and αA represent the percentage ownership by the issuer’s controlling shareholder in the issuing firm and in the acquiring firm, respectively. γI and γO are, respectively, the percentage of shares purchased by the acquirer at the offering and the percentage ownership held by the acquirer in the issuer before the offering. The value weighted CAR for the portfolio is measured by a value-weighted average of the issuing firm CAR and the purchasing firm CAR, where the weights are the market value of issuer and acquirer equity owned by the controlling shareholder. The mean is reported on top and the median is reported in square brackets. All returns are in percentages. The numbers in the test-of-difference columns are p-values for the test where the mean/median is equal for firms in each of the two columns indicated. ***, **, and * denote the significance of the parameter estimates at the 0.01, 0.05, and 0.10 levels, respectively.
Panel A. CARs for the total sample of issuing and purchasing firms
Issuing firms Purchasing firms p-value for test of difference (A-B)
Total Intra-group deals
(A) Other deals
(B) Total t-test Wil-
Coxon Z-test
CAR (-1, 1) 1.85*** [0.17]
1.65 [0.59]
1.90** [0.74]
-1.16 [-0.96] 0.810 0.699
CAR (-5, 5) 2.85*** [1.06]**
0.77 [0.33]
3.31** [1.07]**
-0.12 [-0.38] 0.194 0.234
CAR (-10, 480) -42.3*** [-49.9]***
-62.0** [-73.1]**
-35.6** [-42.9]**
-35.80*** [-29.65]** 0.149 0.079
Sample size 262 77 185 70
Panel B: CARs for the subsample of deals in which purchasing firms are listed on the KSE
Issuing firms Purchasing firms p-value for test of
difference (A-B)
p-value for test of difference
(C-D) Intra-group deals (A)
Other deals (B)
Intra-group deals (C) Other deals (D) t-test
Wil- Coxon Z-test
t-test Wil-
Coxon Z-test
CAR (-1,1) 2.56* [1.21]*
6.56*** [0.62]**
-1.48* [-1.96]*
0.14 [-0.68] 0.064 0.250 0.629 0.293
CAR (-5,5) 2.99* [1.93]
7.23* [1.87]
-3.57* [-1.98]*
-1.31 [1.21] 0.606 0.395 0.088 0.024
Sample size 31 39 31 39

44
Panel C: CARs for intra-group deals by issue price (discount or premium) and relative ownership stakes of the controlling shareholders in issuers and acquirers
Issuing firms Purchasing firms Value weighted CAR for the portfolio
p-value for test of difference
(A-B)
p-value for test of difference
(C-D) Sample I
(A) Sample II
(B) Sample I
(C) Sample II
(D) Sample I
Sample II
t-testWil- Coxon Z-test
t-test Wil-CoxonZ-test
CAR (-1,1) 3.87* [2.21]*
0.77 [-0.09]
-4.81***[-4.11]***
1.21 [0.93]
3.78*** [3.25]***
4.79 [4.77] 0.196 0.099 0.067 0.045
CAR (-5,5) 6.82* [3.86]*
-1.09 [-0.99]
-7.74**[-4.47]**
2.67 [2.39]
6.38***[5.71]***
4.23 [3.03] 0.050 0.052 0.008 0.001
Sample size 16 15 16 15 16 15
Panel D: Market value changes of the controlling shareholder’s holdings in intra-group deals by issue price (discount or premium) and his relative ownership stakes in issuers and acquirers (in millions of won)
Issuing firms Purchasing firms Net wealth gains p-value for test of difference
(A-B)
p-value for test of difference
(C-D) Sample I
(A) Sample II
(B) Sample I
(C) Sample II
(D) Sample I
Sample II
t-testWil- Coxon Z-test
t-test Wil- CoxonZ-test
day -1 to day +1
514 [174]
866 [-36]
-151 [-245]
1,057 [566]
519 [173]
598 [261] 0.820 0.233 0.254 0.147
day -5 to day +5
1,368 [550]
-519 [-163]
-622* [-544]***
2,009 [228]
1,012* [269]***
611 [226] 0.625 0.130 0.066 0.007
Sample size 16 15 16 15 16 15
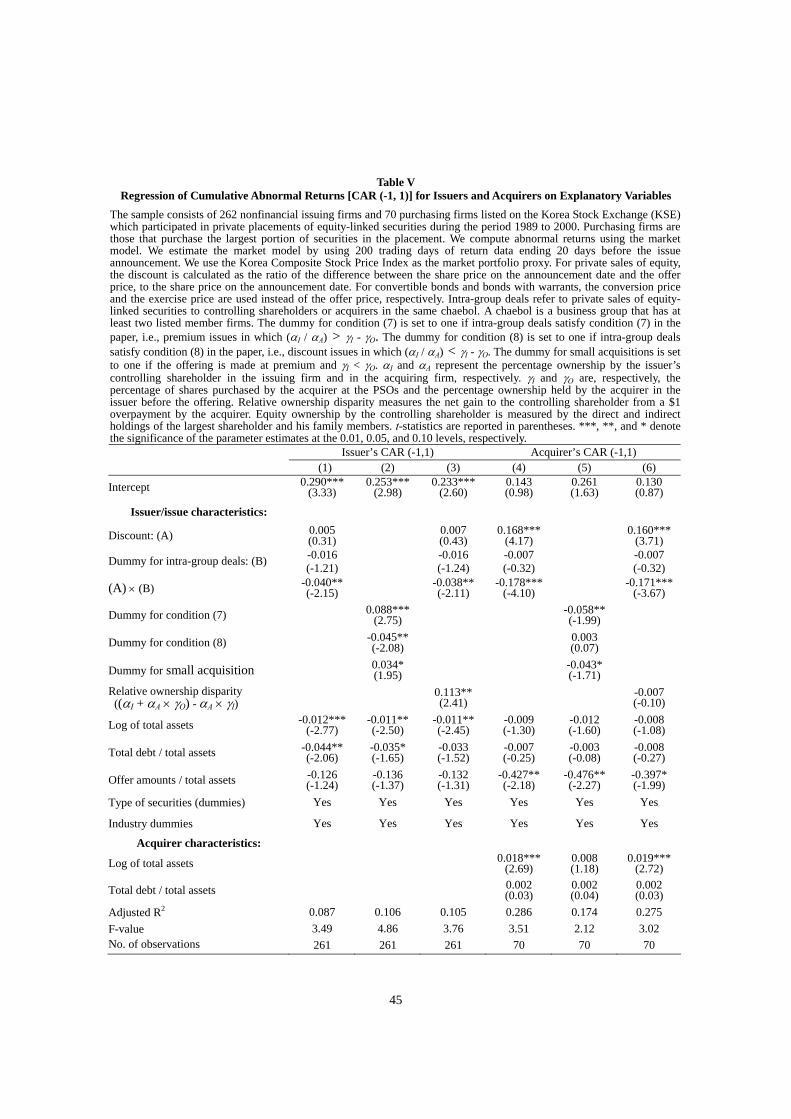
45
Table V Regression of Cumulative Abnormal Returns [CAR (-1, 1)] for Issuers and Acquirers on Explanatory Variables
The sample consists of 262 nonfinancial issuing firms and 70 purchasing firms listed on the Korea Stock Exchange (KSE) which participated in private placements of equity-linked securities during the period 1989 to 2000. Purchasing firms are those that purchase the largest portion of securities in the placement. We compute abnormal returns using the market model. We estimate the market model by using 200 trading days of return data ending 20 days before the issue announcement. We use the Korea Composite Stock Price Index as the market portfolio proxy. For private sales of equity, the discount is calculated as the ratio of the difference between the share price on the announcement date and the offer price, to the share price on the announcement date. For convertible bonds and bonds with warrants, the conversion price and the exercise price are used instead of the offer price, respectively. Intra-group deals refer to private sales of equity-linked securities to controlling shareholders or acquirers in the same chaebol. A chaebol is a business group that has at least two listed member firms. The dummy for condition (7) is set to one if intra-group deals satisfy condition (7) in the paper, i.e., premium issues in which (αI / αA) > γI - γO. The dummy for condition (8) is set to one if intra-group deals satisfy condition (8) in the paper, i.e., discount issues in which (αI / αA) < γI - γO. The dummy for small acquisitions is set to one if the offering is made at premium and γI < γO. αI and αA represent the percentage ownership by the issuer’s controlling shareholder in the issuing firm and in the acquiring firm, respectively. γI and γO are, respectively, the percentage of shares purchased by the acquirer at the PSOs and the percentage ownership held by the acquirer in the issuer before the offering. Relative ownership disparity measures the net gain to the controlling shareholder from a $1 overpayment by the acquirer. Equity ownership by the controlling shareholder is measured by the direct and indirect holdings of the largest shareholder and his family members. t-statistics are reported in parentheses. ***, **, and * denote the significance of the parameter estimates at the 0.01, 0.05, and 0.10 levels, respectively.
Issuer’s CAR (-1,1) Acquirer’s CAR (-1,1) (1) (2) (3) (4) (5) (6)
Intercept 0.290***(3.33)
0.253***(2.98)
0.233***(2.60)
0.143 (0.98)
0.261 (1.63)
0.130 (0.87)
Issuer/issue characteristics:
Discount: (A) 0.005 (0.31) 0.007
(0.43) 0.168***
(4.17) 0.160***(3.71)
Dummy for intra-group deals: (B) -0.016 (-1.21) -0.016
(-1.24) -0.007 (-0.32) -0.007
(-0.32)
(A) × (B) -0.040** (-2.15) -0.038**
(-2.11) -0.178***
(-4.10) -0.171***(-3.67)
Dummy for condition (7) 0.088***(2.75) -0.058**
(-1.99)
Dummy for condition (8) -0.045** (-2.08) 0.003
(0.07)
Dummy for small acquisition 0.034* (1.95) -0.043*
(-1.71)
Relative ownership disparity ((αI + αA × γO) - αA × γI) 0.113**
(2.41) -0.007 (-0.10)
Log of total assets -0.012***(-2.77)
-0.011** (-2.50)
-0.011** (-2.45)
-0.009 (-1.30)
-0.012 (-1.60)
-0.008 (-1.08)
Total debt / total assets -0.044** (-2.06)
-0.035* (-1.65)
-0.033 (-1.52)
-0.007 (-0.25)
-0.003 (-0.08)
-0.008 (-0.27)
Offer amounts / total assets -0.126 (-1.24)
-0.136 (-1.37)
-0.132 (-1.31)
-0.427** (-2.18)
-0.476** (-2.27)
-0.397* (-1.99)
Type of securities (dummies) Yes Yes Yes Yes Yes Yes
Industry dummies Yes Yes Yes Yes Yes Yes
Acquirer characteristics:
Log of total assets 0.018***(2.69)
0.008 (1.18)
0.019***(2.72)
Total debt / total assets 0.002 (0.03)
0.002 (0.04)
0.002 (0.03)
Adjusted R2 0.087 0.106 0.105 0.286 0.174 0.275 F-value 3.49 4.86 3.76 3.51 2.12 3.02 No. of observations 261 261 261 70 70 70

46
Table VI Regression of Cumulative Abnormal Returns [CAR (-1, 1)] for Issuers and Acquirers on Explanatory Variables:
Robustness Checks The sample consists of 262 nonfinancial issuing firms and 70 purchasing firms listed on the Korea Stock Exchange (KSE) which participated in private placements of equity-linked securities during the period 1989 to 2000. Purchasing firms are those that purchase the largest portion of securities in the placement. We compute abnormal returns using the market model. We estimate the market model by using 200 trading days of return data ending 20 days before the issue announcement. We use the Korea Composite Stock Price Index as the market portfolio proxy. For private sales of equity, the discount is calculated as the ratio of the difference between the share price on the announcement date and the offer price, to the share price on the announcement date. For convertible bonds and bonds with warrants, the conversion price and the exercise price are used instead of the offer price, respectively. Intra-group deals refer to private sales of equity-linked securities to controlling shareholders or acquirers in the same chaebol. A chaebol is a business group that has at least two listed member firms. The dummy for condition (7) is set to one if intra-group deals satisfy condition (7) in the paper, i.e., premium issues in which (αI / αA) > γI - γO. The dummy for condition (8) is set to one if intra-group deals satisfy condition (8) in the paper, i.e., discount issues in which (αI / αA) < γI - γO. The dummy for small acquisitions is set to one if the offering is made at premium and γI < γO. αI and αA represent the percentage ownership by the issuer’s controlling shareholder in the issuing firm and in the acquiring firm, respectively. γI and γO are, respectively, the percentage of shares purchased by the acquirer at the PSOs and the percentage ownership held by the acquirer in the issuer before the offering. Relative ownership disparity measures the net gain to the controlling shareholder from a $1 overpayment by the acquirer. Equity ownership by the controlling shareholder is measured by the direct and indirect holdings of the largest shareholder and his family members. t-statistics are reported in parentheses. ***, **, and * denote the significance of the parameter estimates at the 0.01, 0.05, and 0.10 levels, respectively.
Issuer’s CAR (-1, 1) Acquirer’s CAR (-1, 1)
(1) (2) (3) (4) (5) (6)
Intercept 0.319***(3.64))
0.295***(3.41)
0.245***(2.74)
0.138 (0.91)
0.279 (1.56)
0.156 (0.99)
Issuer/issue characteristics:
Discount: (A) 0.004 (0.25) 0.006
(0.35) 0.169***
(4.28) 0.169***(4.09)
Dummy for intra-group deals: (B) -0.016 (-1.22)
-0.014 (-1.08)
-0.008 (-0.33) -0.006
(-0.24)
(A) × (B) -0.049**(-2.42) -0.048**
(-2.40) -0.197***
(-4.14) -0.203***(-4.11)
Dummy for condition (7) 0.088***(2.72) -0.060**
(-2.01)
Dummy for condition (8) -0.046**(-2.15) 0.006
(0.12)
Dummy for small acquisition 0.040** (2.20) -0.044*
(-1.73)
Relative ownership disparity ((αI + αA × γO) - αA × γI) 0.119***
(2.58) -0.034 (-0.52)
Industry-adjusted ROA 0.011 (0.15)
0.066
(0.64)
Industry-adjusted ROA is above the median (dummy): (C)
0.008 (0.67) 0.007
(0.53) 0.041** (2.03) 0.041**
(2.04) (A) × (C) -0.109
(-1.27) -0.103 (-1.20)
0.482* (1.67) 0.504*
(1.68)
(B) × (C) 0.001 (0.06) 0.003
(0.27) -0.002 (-0.20) -0.002
(-0.18)
(A) × (B) × (C) -0.216**(-2.15) -0.191*
(-1.92) 0.263** (2.12) 0.269**
(2.15)
Equity ownership by foreign investors 0.097** (2.07)
0.116***(2.46)
0.103** (2.21)
-0.104 (-0.63)
0.054 (0.30)
-0.106 (-0.63)
Log of total assets -0.014***(-3.18)
-0.014***(-3.07)
-0.012***(-2.69)
-0.008 (-1.00)
-0.015 (-1.50)
-0.009 (-1.07)
Total debt / total assets -0.031 (-1.46)
-0.028 (-1.25)
-0.022 (-1.03)
-0.053* (-1.69)
0.015 (0.41)
-0.056* (-1.74)
Offer amounts / total assets -0.152 (-1.50)
-0.176* (-1.73)
-0.153 (-1.52)
-0.366* (-1.71)
-0.467** (-2.12)
-0.363* (-1.68)
Type of securities (dummies) Yes Yes Yes Yes Yes Yes
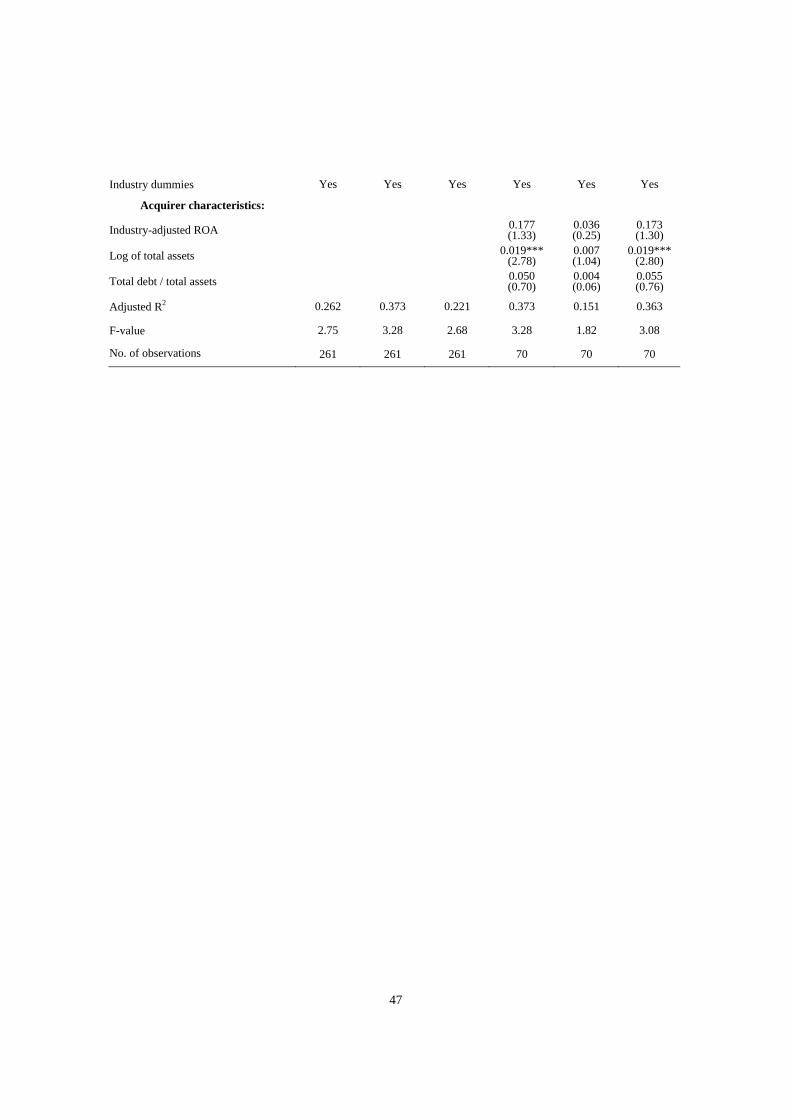
47
Industry dummies Yes Yes Yes Yes Yes Yes
Acquirer characteristics:
Industry-adjusted ROA 0.177 (1.33)
0.036 (0.25)
0.173 (1.30)
Log of total assets 0.019***(2.78)
0.007 (1.04)
0.019***(2.80)
Total debt / total assets 0.050 (0.70)
0.004 (0.06)
0.055 (0.76)
Adjusted R2 0.262 0.373 0.221 0.373 0.151 0.363
F-value 2.75 3.28 2.68 3.28 1.82 3.08
No. of observations 261 261 261 70 70 70
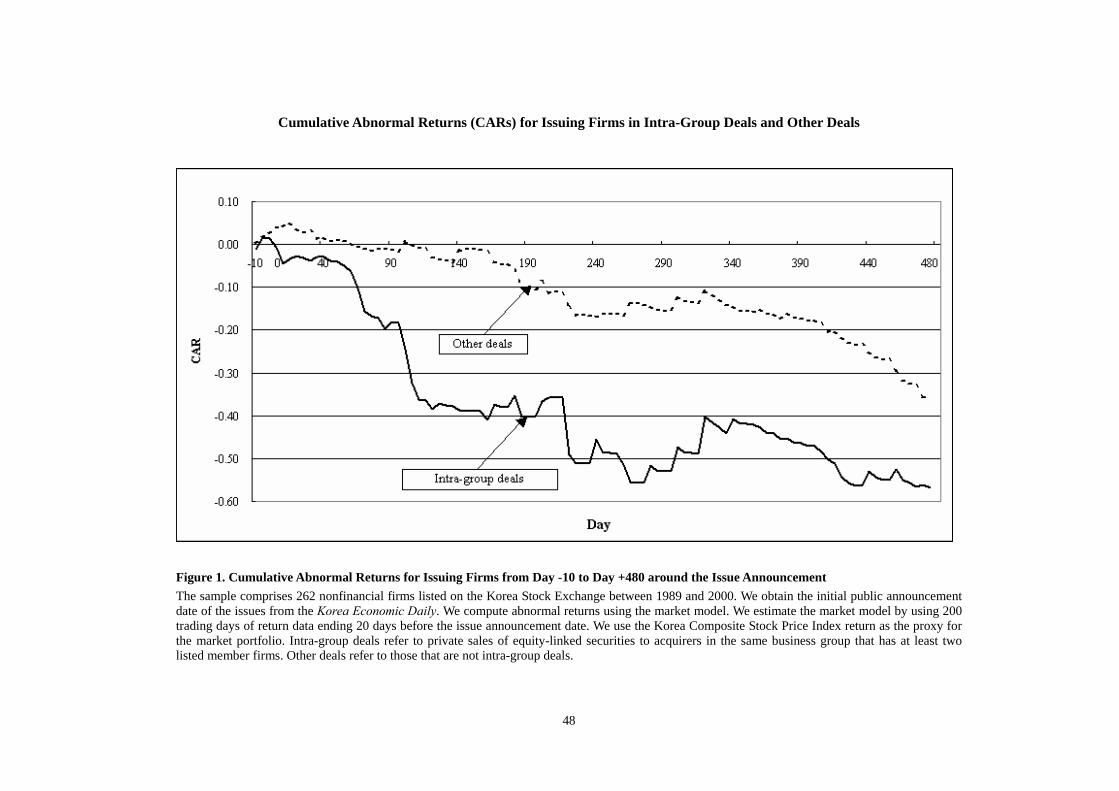
48
Cumulative Abnormal Returns (CARs) for Issuing Firms in Intra-Group Deals and Other Deals
Figure 1. Cumulative Abnormal Returns for Issuing Firms from Day -10 to Day +480 around the Issue Announcement The sample comprises 262 nonfinancial firms listed on the Korea Stock Exchange between 1989 and 2000. We obtain the initial public announcement date of the issues from the Korea Economic Daily. We compute abnormal returns using the market model. We estimate the market model by using 200 trading days of return data ending 20 days before the issue announcement date. We use the Korea Composite Stock Price Index return as the proxy for the market portfolio. Intra-group deals refer to private sales of equity-linked securities to acquirers in the same business group that has at least two listed member firms. Other deals refer to those that are not intra-group deals.
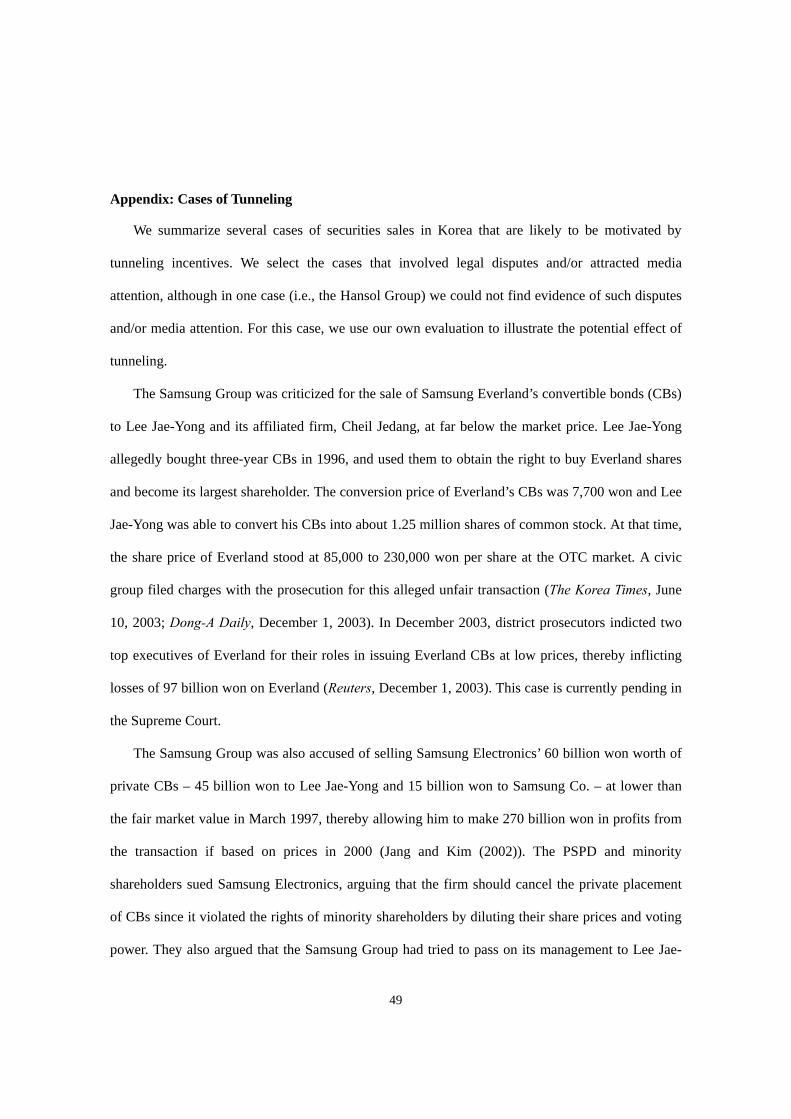
49
Appendix: Cases of Tunneling
We summarize several cases of securities sales in Korea that are likely to be motivated by
tunneling incentives. We select the cases that involved legal disputes and/or attracted media
attention, although in one case (i.e., the Hansol Group) we could not find evidence of such disputes
and/or media attention. For this case, we use our own evaluation to illustrate the potential effect of
tunneling.
The Samsung Group was criticized for the sale of Samsung Everland’s convertible bonds (CBs)
to Lee Jae-Yong and its affiliated firm, Cheil Jedang, at far below the market price. Lee Jae-Yong
allegedly bought three-year CBs in 1996, and used them to obtain the right to buy Everland shares
and become its largest shareholder. The conversion price of Everland’s CBs was 7,700 won and Lee
Jae-Yong was able to convert his CBs into about 1.25 million shares of common stock. At that time,
the share price of Everland stood at 85,000 to 230,000 won per share at the OTC market. A civic
group filed charges with the prosecution for this alleged unfair transaction (The Korea Times, June
10, 2003; Dong-A Daily, December 1, 2003). In December 2003, district prosecutors indicted two
top executives of Everland for their roles in issuing Everland CBs at low prices, thereby inflicting
losses of 97 billion won on Everland (Reuters, December 1, 2003). This case is currently pending in
the Supreme Court.
The Samsung Group was also accused of selling Samsung Electronics’ 60 billion won worth of
private CBs – 45 billion won to Lee Jae-Yong and 15 billion won to Samsung Co. – at lower than
the fair market value in March 1997, thereby allowing him to make 270 billion won in profits from
the transaction if based on prices in 2000 (Jang and Kim (2002)). The PSPD and minority
shareholders sued Samsung Electronics, arguing that the firm should cancel the private placement
of CBs since it violated the rights of minority shareholders by diluting their share prices and voting
power. They also argued that the Samsung Group had tried to pass on its management to Lee Jae-
50
Yong by selling Samsung Electronics’ CBs. Against the plaintiff’s claim, however, the Supreme
Court dismissed the reasoning due to a lack of grounds. The court held that it was not certain
whether the CB issuance was designed to firm up Samsung’s management rights. The court also
added that the nullification of CBs is possible only when pending companies are locked in a
management battle or are on the verge of such a situation. In deciding for Samsung Electronics, the
Supreme Court focused on the need to protect the integrity of the bond transaction and no fairness
test was used. This ruling also runs counter to the decisions of a lower court which accepted the
plaintiff’s claim to some extent by saying that the CB issuance seemed to be geared toward wealth
inheritance to Lee Jae-Yong from his father (The Korea Times, June 28, 2004).
The issuance of private CBs by Hansol Paper to Hansol Chemical, both of which belong to the
Hansol Group, is another example of tunneling being suspected within firms belonging to a
business group. Hansol Paper sold 30 billion won worth of its private CBs to Hansol Chemical on
March 27, 1997 with the yield to maturity of 7% and the conversion price of 16,000 won, which
was 3% lower than the market price of its shares on the day before the issuance. Interestingly,
Hansol Chemical also issued 10 billion won worth of its private CBs to Hansol Paper on the same
date.1 Therefore, Hansol Paper was able to raise the net fund of 20 billion won through these two
intra-group transactions. However, the issue terms of Hansol Chemical’s CBs were much worse
than those of Hansol Paper’s CBs even though the financial health of Hansol Chemical was much
stronger than that of Hansol Paper at the end of 1996 (debt equity ratio 128% versus 233% and
ROE 12% versus 7.9%). The yield to maturity of Hansol Chemical’s CBs, 7%, was the same as that
of Hansol Paper’s CBs, but their conversion price was 30% below the market price of Hansol
Chemical’s shares on the day before the issuance. These terms clearly suggest that the deal was
1 Hansol Paper also bought 5 billion won worth of Hansol CSN’s CBs and 5 billion won worth of Hansol
Telecom’s CBs on the same date at the same yield to maturity as the other deals.
51
unfair to Hansol Chemical and was structured in a way that would not maximize its value. At the
time of the issue announcement, the direct and indirect holdings of the controlling family of the
Hansol Group were 12.1% of the outstanding shares in Hansol Paper and 2.6% in Hansol Chemical.
As a result of these holdings, during the 11-day period around the issue announcement, the
controlling family gained 940 million won through Hansol Paper but lost 206 million won through
Hansol Chemical based on CARs (-5,5).
The sale of LG Petrochemical’s shares owned by LG Chem (both belonging to the LG group) to
the controlling family and the buyback of some of these shares later also illustrate how private
dealing provides the controlling shareholders with an opportunity for wealth transfer from the firms
for the benefit of the controlling shareholders. In June 1999, LG Chem sold 27.4 million shares
(70% of the outstanding shares) of the unlisted LG Petrochemical at 5,500 won per share to the
controlling family. But, in April 2002, it bought 6.32 million shares back at 15,800 won per share
from the family of Koo Bon-Moo, the chief executive officer of LG Chem and the leader of the LG
Group, resulting in a net gain to the controlling family of 10,300 won per share. The market price of
LG Petrochemical’s shares on the buyback date was 16,200 won. Reflecting investors’ concern
about the potential corporate governance problem in the LG Group, LG Chem tumbled 15%, the
daily limit, on the date this deal was announced, resulting in the loss of 230 billion won. Most of the
other LG affiliated stocks also lost ground. In contrast, the controlling family was expected to reap
about 66 billion won from this transaction on the same date. Many analysts argued that LG Chem
did not act in the interest of its shareholders by selling its stake in an affiliate for pennies and then
repurchasing the stake for a significantly higher price, and believed that the overall transaction was
mainly geared toward benefiting the controlling family (Joins.com, April 25, 2002; Platts
Commodity News, April 26, 2002).