business - fraser · production, rising consumer incomes, and sustained buying at near record...
TRANSCRIPT
^ ^ m v r i i n i iBusiness KeviewJUNE 1953
CONTENTS
Stability in Wholesale Prices . . . . 1
Recent Trends in Department Store Sales 5
New Uses for B o ro n ........................8
FINANCE • INDUSTRY • AGRICULTURE • TRADEFOURTH FEDERAL RESERVE DISTRICT
Vol. 35— No. 6 Federal Reserve Bank of Cleveland Cleveland 1, Ohio
Stability in Wholesale Prices
THE average level of wholesale prices has remained virtually unchanged since the end of 1952. This stability may be considered unusual since
it has prevailed during a period of rising industrial production, rising consumer incomes, and sustained buying at near record levels by consumers, government, and industry.
The stability of prices has not been peculiar to this country alone; it is a world-wide situation. It reflects a greatly improved world supply condition of nearly every raw material and finished product. Today, there is scarcely any shortage of any important commodity. Supplies are adequate for the needs of producers and consumers. The only exceptions are nickel and a few other rare materials which are vital to the construction of jet engines.
The increased availability of raw materials and finished products is due in large part to the recent fruition of major investment programs in new plant and equipment, both here and abroad. From 1945 through 1952, private business in the United States invested $150 billion in new facilities, with an additional $27 billion scheduled for this year. About two- fifths of this total sum has been for the account of manufacturers. Industry in general has never been so well equipped to supply any foreseeable demands which the economy may place upon it.
The recent supply situation also reflects the worldwide reappraisal of the immediate and probable needs for basic raw materials. The post-Korean scramble for inventories at any price has abated and a second look is being given to accumulated stocks. In several important instances, the decision was made —as in the case of Great Britain—that emergency
stockpiles were excessive and these have been, or are in the process of being, liquidated with a depressing effect upon prices. This was true of such important materials as lead and zinc. In other instances, emergency stockpile-buying of materials has come to an end and an effort is being made to hold stocks constant in anticipation of possible future emergencies. This of itself, however, represents a significant drop in total demand and likewise has affected prices. Rubber stockpiling in this country is a good example of this situation.
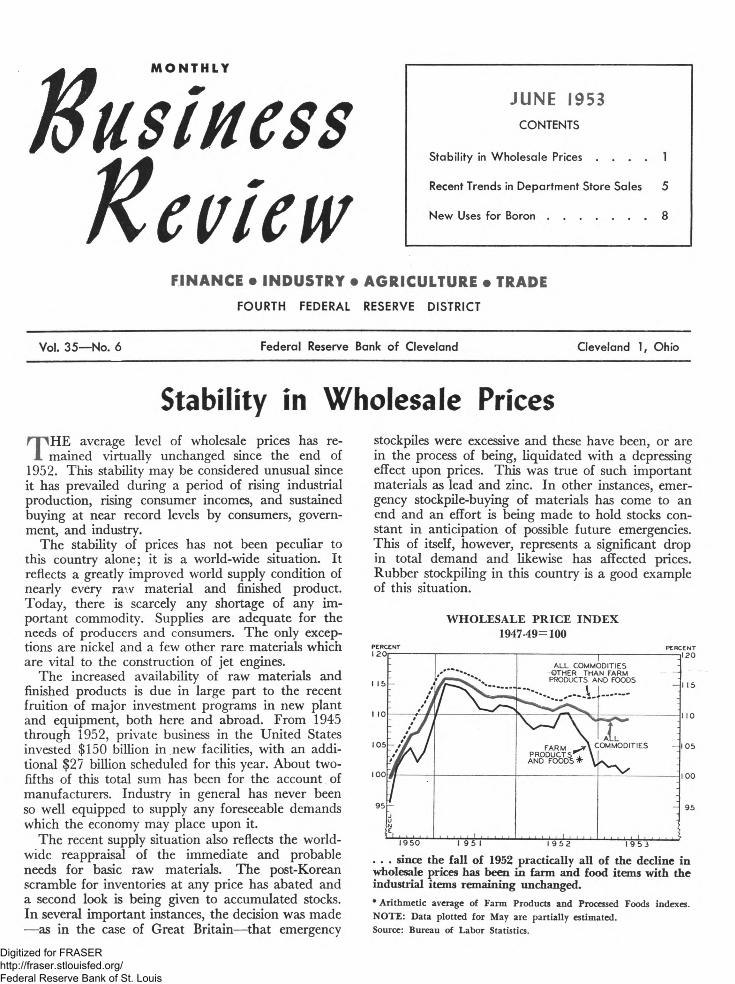
WHOLESALE PRICE INDEX 1947-49= 100
PERCENT i;
i i ,
* # # g
A L L COMM< OTHER THA PRODUCTS A
r ........DDITIES N FARM ND FOODS
9 #/ M i » / / t / * m / * # /— t M. /
- / / A / MM \ I
t M V
FARM C PRODUCTS ^ \ AND FO O DS#- \
A L L.OMMODITIES -
JuE
L l l l M l1 9 5 1 1 9 5 2 19 5 3
. . . since the fall of 1952 practically all of the decline in wholesale prices has been in farm and food items with the industrial items remaining unchanged.* Arithmetic average of Farm Products and Processed Foods indexes. NOTE: Data plotted for May are partially estimated.Source: Bureau of Labor Statistics.
Digitized for FRASER http://fraser.stlouisfed.org/ Federal Reserve Bank of St. Louis

Page 2 Monthly Business Review June 1, 1953
In the interval since Korea, the movement of wholesale or primary market prices (as represented by the index of wholesale prices compiled by the Bureau of Labor Statistics) divides clearly into three distinct phases. The first phase of rapidly climbing prices came to an end in February and March, 1951. During that interval, wholesale prices advanced more than 16 percent. The second phase was a period of gentle but persistent decline which continued almost without interruption until December 1952. The third phase has been one of stability. Since December, prices have fluctuated within a narrow range of 0.5 percent as shown by the chart.
The chart also shows how the index of “industrial” commodities (commodities other than farm products and processed foods) has diverged from that of the farm and food items since the third quarter of last year. All of the subsequent decline has been centered in the farm and foods groups, overshadowing the stability of industrial commodity prices. In April, the index of industrial commodities was unchanged
from the year-ago figure while farm and food items averaged over 7 percent lower.
The price changes experienced by the industrial commodities give an intimation of future price trends since they account for about 70 percent of the month- to-month change in the total index; that is, changes in the wholesale price level of industrial commodities have about 2 /z times as much effect on the general level of wholesale prices as do equivalent changes in the average prices of farm products and foods. Since it is anticipated that the farm products and foods groups may decline further during coming months1, the price behavior of the major industrial commodities merits closer attention.
In April, the price indexes of nearly three-fourths of the industrial commodities averaged higher than, or showed virtually no change from, third-quarter1952 levels as can be seen in the accompanying1 R ecent price trends in farm p roducts w ere discussed in th e M ay
Review.
WHOLESALE PRICE INDEXMAJOR COMMODITY GROUPS AT OR NEAR POST-KOREAN PEAKS IN APRIL
(1947-49=100)
Source: B ureau of L ab o r Statistics.
Digitized for FRASER http://fraser.stlouisfed.org/ Federal Reserve Bank of St. Louis
June 1, 1953 Monthly Business Review Page 3
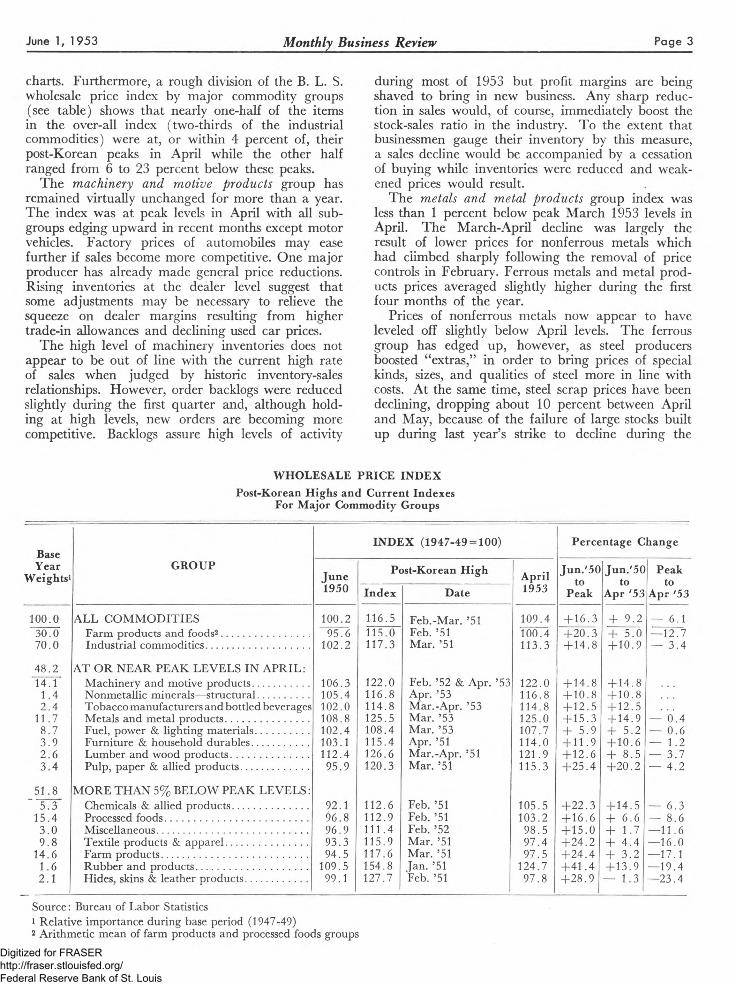
charts. Furthermore, a rough division of the B. L. S. wholesale price index by major commodity groups (see table) shows that nearly one-half of the items in the over-all index (two-thirds of the industrial commodities) were at, or within 4 percent of, their post-Korean peaks in April while the other half ranged from 6 to 23 percent below these peaks.
The machinery and motive products group has remained virtually unchanged for more than a year. The index was at peak levels in April with all subgroups edging upward in recent months except motor vehicles. Factory prices of automobiles may ease further if sales become more competitive. One major producer has already made general price reductions. Rising inventories at the dealer level suggest that some adjustments may be necessary to relieve the squeeze on dealer margins resulting from higher trade-in allowances and declining used car prices.
The high level of machinery inventories does not appear to be out of line with the current high rate of sales when judged by historic inventory-sales relationships. However, order backlogs were reduced slightly during the first quarter and, although holding at high levels, new orders are becoming more competitive. Backlogs assure high levels of activity
during most of 1953 but profit margins are being shaved to bring in new business. Any sharp reduction in sales would, of course, immediately boost the stock-sales ratio in the industry. To the extent that businessmen gauge their inventory by this measure, a sales decline would be accompanied by a cessation of buying while inventories were reduced and weakened prices would result.
The metals and metal products group index was less than 1 percent below peak March 1953 levels in April. The March-April decline was largely the result of lower prices for nonferrous metals which had climbed sharply following the removal of price controls in February. Ferrous metals and metal products prices averaged slightly higher during the first four months of the year.
Prices of nonferrous metals now appear to have leveled off slightly below April levels. The ferrous group has edged up, however, as steel producers boosted “extras,” in order to bring prices of special kinds, sizes, and qualities of steel more in line with costs. At the same time, steel scrap prices have been declining, dropping about 10 percent between April and May, because of the failure of large stocks built up during last year’s strike to decline during the
WHOLESALE PRICE INDEXPost-Korean Highs and Current Indexes For Major Commodity Groups
Base INDEX (1947-49 = 100) Percentage ChangeYearWeights1 GROUP June Post-Korean High April Jun.'5C Jun.'50 PeaktoApr '531950 Index Date 1953 Peak Apr '53
100.0 ALL COMMODITIES 100.2 116.5 Feb.-Mar. ’51 109.4 + 16.3 + 9.2 — 6.130.0 Farm products and foods2.............................. 95.6 115.0 F eb .’51 100.4 +20.3 + 5.0 —12.770.0 Industrial commodities................................... 102.2 117.3 Mar. ’51 113.3 + 14.8 + 10.9 — 3.448.214.1
AT OR NEAR PEAK LEVELS IN APRIL: Machinery and motive products................... 106.3 122.0 Feb. ’52 & Apr. ’53 122.0 + 14.8 + 14.81.4 Nonmetallic minerals—structural................. 105.4 116.8 Apr. ’53 116.8 + 10.8 + 10.82.4 Tobacco manufacturers and bottled beverages 102.0 114.8 Mar.-Apr. ’53 114.8 + 12.5 + 12.511.7 Metals and metal products............................ 108.8 125.5 Mar. ’53 125.0 + 15.3 + 14.9 - 0.4
8.7 Fuel, power & lighting materials.................. 102.4 108.4 Mar. ’53 107.7 + 5.9 + 5.2 - 0.63.9 Furniture & household durables................... 103.1 115.4 Apr. ’51 114.0 + 11.9 + 10.6 — 1.22.6 Lumber and wood products.......................... 112.4 126.6 Mar.-Apr. ’51 121.9 + 12.6 + 8.5 — 3.73.4 Pulp, paper & allied products....................... 95.9 120.3 Mar. ’51 115.3 +25.4 +20.2 — 4.251.85.3
MORE THAN 5% BELOW PEAK LEVELS: Chemicals & allied products.......................... 92.1 112.6 F eb .’51 105.5 +22.3 + 14.5 — 6.315.4 Processed foods................................................. 96.8 112.9 F eb .’51 103.2 +16.6 + 6.6 — 8.6
3.0 Miscellaneous................................................... 96.9 111.4 Feb. ’52 98.5 +15.0 + 1.7 —11.69.8 Textile products & apparel............................ 93.3 115.9 Mar. ’51 97.4 +24.2 + 4.4 —16.0
14.6 Farm products.................................................. 94.5 117.6 Mar. ’51 97.5 +24.4 + 3.2 —17.11.6 Rubber and products...................................... 109.5 154.8 J a n .’51 124.7 +41.4 + 13.9 —19.42.1 Hides, skins & leather products..................... 99.1 127.7 F eb .’51 97.8 +28.9 — 1.3 —23.4
Source: Bureau of Labor Statistics1 Relative importance during base period (1947-49)2 Arithmetic mean of farm products and processed foods groups
Digitized for FRASER http://fraser.stlouisfed.org/ Federal Reserve Bank of St. Louis

Page 4 Monthly Business Review June 1, 1953
WHOLESALE PRICE INDEXMAJOR COMMODITY GROUPS MORE THAN FIVE PERCENT BELOW
POST-KOREAN PEAKS IN APRIL (1947-49=100)
Source: Bureau of Labor Statistics.
winter months. However, steel scrap does not bulk large in the metals index.
By the fourth week in May, it appeared that most of the adjustments in extras had been completed by major producers. The revisions had the effect of raising finished steel prices between 4 and 5 percent. Further price changes are not anticipated unless there should occur a significant change in costs.
The fuel, power and lighting materials index is the third major group still near peak post-Korean levels in April. This group also rose the least of any major group following the Korean outbreak, and the March peak of 118.4 percent of the 1947-49 average is virtually the same as the figure for July 1948 when petroleum prices were rising so rapidly. Petroleum prices currently average 2 percent below July 1948.
Some seasonal slackening in demand for heating materials is already evident in this series. The seasonal downturn will most likely prevail into the summer months but, since it started from a higher point, the margin over the year-ago months should be maintained.
Most of the recent advances in the furniture and household durables group have been registered by such miscellaneous household durables as dinner- ware, glassware, silverware, cutlery, etc. Furniture and appliances are only fractionally above year-ago levels while the miscellaneous group has advanced nearly 7 percent. Here again, the high level of stocks does not appear out of line with the present sales rate. Furthermore, stocks of appliances generally increase seasonally during this period. However, at
(C ONTINUED ON PA G E 7)Digitized for FRASER http://fraser.stlouisfed.org/ Federal Reserve Bank of St. Louis

June 1, 1953 Monthly Business Review Page 5
Recent Trends in Department Store Sales
D URING recent calendar quarters, the major source of expansion in the total business activity
oi the nation has been the lift in consumer buying. Correspondingly, the question as to the substainability of the present high level of business turns in no small measure upon the prospects for continued activity in the consumer sector of the economy.
Department stores have shared in the generally strong tone of retail sales, although to a somewhat less extent than some other retailers,—especially auto dealers. The information portrayed below may serve toward bringing the record of department store sales up to date, at least in respect to this Federal Reserve District. Attention is focused on the trends since 1951 in Fourth District department store sales, both in respect to dollar volume and estimated physical volume/1)
Total The first of the accompanying charts shows Sales indexes of the dollar volume and the esti
mated physical volume of total department store sales in the Fourth District, by months, for the years 1952 and 1953 to date. The solid line on the chart represents dollar sales while estimates of physical volume are indicated by the broken line. Both measures of sales are shown as percentages of the1951 average and are adjusted for seasonal variation. The shaded area between the two lines indicates the extent of correction of dollar sales for the effects of average changes in prices charged by department stores.
During the summer months of 1952, department store sales exhibited wide fluctuations in monthly level with a tendency toward recovery from the downward trend present during the early months of the year. By December, adjusted sales had reached a level topped only during the months of the two post- Korean scare-buying episodes in 1950 and 1951.
The strength in sales continued into the first quarter of 1953 until a decided weakness in April resulted in a sharp decline in the adjusted sales level. Although data for May are not available at press time, it appears from the reports of the first half of the month that sales in May are likely to represent considerable improvement over the April showing.
(1) For the trend of Fourth District department store sales since january, 1948, see the January 1953 issue of this Review.
In estimating the physical volume trends indicated in this article the price data used as correctives of dollar volume are drawn from the Department Store Inventory Price Index, and from the apparel and housefumishings components of the Consumers’ Price Index, both published by the Bureau of Labor Statistics, U. S. Department of Labor. For the method used, as well as qualifications to its accuracy, see the July 1952 issue of this Review, page 8.
The chart shows little difference in level between dollar volume and physical volume of sales because price reductions during the period have been moderate, with declines occurring gradually from month to month. As a result, the level of physical volume of sales has been only slightly above that of dollar volume in relation to 1951. During 1952, for example, dollar sales averaged some 1 percent below the 1951 level; physical volume during the same period, however, exceeded the 1951 average by an estimated 1 percent.
Whether measured by physical volume or dollar volume, department store sales thus far in 1953 have averaged well above the like period of last year. However, it must be remembered that sales during the early months of 1952 were rather disappointing and therefore provide a weak target for current sales. Even if adjusted sales during May should fail to show improvement over April, the year-to-year margin could still be maintained because of the unusually low position of adjusted sales in May last year. However, the more favorable showing of sales in June, 1952, would seem to present a reasonable target for the coming June and may provide a real test of1953 sales.
A pp ard Separate indexes of dollar sales and esti- Sales mated physical volume have also been
prepared for two broad departmental groups which, in combination, account for over 75 percent of total sales. These are the apparel and housefumishings groups. Data for the apparel group are shown on the second of the accompanying charts. Month-to-month movements in adjusted dollar sales of apparel are shown by the solid line on the chart. (Apparel here includes clothing and accessories for men, women, and children.) The broken line indicates estimated physical volume, also seasonally adjusted.
As seen from the chart, the monthly pattern of apparel sales in the Fourth District tends to follow very closely that of sales for the total department store. Such a similarity of movement is to be expected since apparel sales constitute about 55 percent of total sales in those department stores which report on a departmental basis.
A marked exception to the usual similarity between the course of apparel sales and of total department store sales occurred in January this year. Adjusted sales by apparel departments fell off considerably between December and January, while only a slight decline was registered for the total store. The offsets occurred not only in the housefumishings departments, but also among certain other depart-
Digitized for FRASER http://fraser.stlouisfed.org/ Federal Reserve Bank of St. Louis

Page 6 Monthly Business Review June 1, 1953
DEPARTMENT STORE SALES Fourth District
(Seasonally Adjusted)I9 S I- I0 0 1951-100
. . . whether measured by physical volume or dollar volume, department store sales thus far in 1953 have averaged well above the like period of last year; the margin over 1951, however, is consistently greater in terms of physical volume than in dollar sales.
1951 = 100 1951* 100
. . . dollar sales by apparel departments during 1952 were 2 percent greater than in the previous year; when measured by physical volume, the margin was about 4 percent. Apparel sales thus far this year, except in April, have been above the 1951 level whether measured by dollar volume or physical volume.
. . . housefurnishings sales, whether measured by dollar volume or physical volume, have lagged somewhat below the 1951 average since the beginning of last year; during the past fall and winter months, however, sales have been close to the 1951 level.
mental groups not considered here; examples are small wares, piece goods and household textiles, sports goods, etc.
During the entire period shown on the chart, both dollar sales and physical volume of apparel have tended to exceed the 1951 average. In this respect, apparel departments made a more favorable showing than did the total store. During April of this year, however, adjusted apparel sales fell off more sharply than did sales for the total store.
Prices of apparel lines have tended to decline very slightly throughout the period under discussion. Only a small difference in level, therefore, is shown between physical volume and dollar volume of apparel sales. Dollar sales by apparel departments during1952 were 2 percent greater than in the previous year. When measured by physical volume, the margin over 1951 is 4 percent. A similar relationship between dollar sales and physical volume is evident in sales thus far in the current year.
1951=10013 0 ,-------------------------------------
HOUSEFURNISHINGS DEPARTMENTS
PH YSICALVOLUME
(EST.)
D O LLA RVOLUME
Digitized for FRASER http://fraser.stlouisfed.org/ Federal Reserve Bank of St. Louis

June 1, 1953 Monthly Business Review Page 7
Housefurnishings The third of the accompanying Sales charts shows adjusted indexes of
dollar sales and estimated physical volume of sales for the housefurnishings group of departments in Fourth District department stores. As on the other charts, dollar volume is represented by the solid line, and the broken line indicates estimated physical volume.
Housefurnishings sales, whether measured by dollar volume or by physical volume, have lagged somewhat below the 1951 average during the period shown on the chart. The total for 1951, however, was influenced largely by the substantial volume of housefurnishings sales during the scare-buying episode in January and February. While the year 1951 thus presents a rather inflated standard of comparison for housefurnishings sales, the year is used as a base in order to facilitate comparison between housefurnishings volume and apparel volume.
Prices of housefurnishings, like those of apparel, have shown a slight net decline since 1951. Consequently, the physical volume estimates for recent
months appear as slightly more favorable than the dollar volume. Thus, dollar sales for the housefurnishings department declined 8 percent in 1952 from the preceding year’s average; but after adjustment for price changes the decline is reduced to 6 percent.
During the past fall and winter months, housefurnishings departments maintained a fairly steady level of adjusted sales at a position well above that of the previous summer months. As was the case with the apparel departments, a sharp drop occurred in April, although the decline was not quite so severe as that experienced by the apparel departments.
Housefurnishings sales during each month for which data are available this year have topped the year-ago month, with the exception of sales during January. During the early months of last year, however, the volume was somewhat disappointing. Nevertheless, some recovery was evidenced by the May and June figures for 1952. The latter months may be considered to be a reasonable standard of comparison for testing the strength of housefurnishings sales during May and June of this year.
STABILITY IN WHOLESALE PRICES(C O N T IN U E D FR O M P A G E 4 )
least one of the District’s major appliance manufacturers is pessimistic enough about the current outlook to curtail production drastically until present inventories are worked down.
A sharp rise in cigarettes and tobacco following price decontrol explains the sharp February-March advance in the tobacco manufactures and bottled beverages group. Further advances in this small sector of the wholesale price level are possible if buying interest in bottled spirits continues to perk up as it has in recent weeks.The recent advance in the structural nonmetallic minerals group was largely the result of higher prices for concrete ingredients and gypsum products. Rising prices of hard woods and millwork account for most of this year’s advance of the lumber and wood products group. Prices of building materials in general have advanced during recent months as construction activity shows little sign of abating from present high levels.
Pulp, paper, and allied products prices have shown practically no change since last July. Continued high rates of business activity are maintaining demand for containers and packaging materials.
Although included among the lower one-third of the industrial commodities in the table, the chemical and allied products index has shown a definite upward trend since the beginning of the year, rising nearly 2 percent between January and April. Some chemicals rose considerably after price ceilings were removed with the largest advances registered by industrial chemicals.
The remaining three industrial groups—textiles andapparel, rubber products, and leather------have shownthe most violent fluctuations since Korea and appear to be headed toward somewhat lower levels in the immediate future. However, prices of cotton products, where much of this year’s decline has been centered, have firmed during recent weeks. Apparel prices held steady during the early months of the year and higher prices are anticipated in some fall lines.
Crude rubber prices continued to pace declines in the rubber and products group into April. Since then, natural rubber prices have firmed and are currently above April levels although still somewhat under June 1950. Prices of tires and tubes account for about half of this index’s weight, however, and current high inventories bear watching. If, as industry spokesmen maintain, they are not excessive, this index may level out during coming months.
The hides, skins and leather products group still averages lower in price than in June 1950—the only major group to break through this benchmark. Since continued heavy marketings of cattle are expected throughout this year, some declines from present levels may occur.
Taken altogether, the industrial commodities are confronted with a situation where supply has caught up with—if not outrun—demand in most markets. Keener competition between sellers and a larger aggregate of goods coupled with more cautious buying habits has removed, for the time being, an important source of upward pressure on prices.
Digitized for FRASER http://fraser.stlouisfed.org/ Federal Reserve Bank of St. Louis

Page 8 Monthly Business Review June 1, 1953
New Uses for BoronBy CLYDE WILLIAMS, Director, Battelle Memorial Institute
Since the twenty-mule-team days of about 75 years ago, boron has acquired a number of well-established applications. In the form of borax, it is a familiar household cleaner. Boric acid, a mild antiseptic particularly suitable for eye washing, is stocked regularly in most medicine cabinets. In industry, where over half of the present production is consumed, boron and its compounds do important jobs in chemical, metallurgical, glass, and ceramic processing.As versatile as the material has already been, a rapidly expanding era of usefulness is foreseen. Promising new and potential applications include use of compounds of the element as a coating material for wear-, corrosion-, and heat-resistant purposes, and as a constituent of antiknock compounds, jet and rocket fuels, and certain alloy
steels.Boron compounds are commercially available in quantities well beyond immediate demand. The country is fortunately endowed with extensive deposits of such materials in the Mojave Desert of southeastern California and southwestern Nevada. From this area, producers supply over 90 per cent of the world’s needs for boron compounds. The region, aptly described as “America’s Chemical Storehouse”, contains billions of cubic feet of chemicals, a large percentage of which is made up of boron compounds, potash, common salt, and soda.The principal producers of boron products are the American Potash and Chemical Corporation and the Pacific Coast Borax Company. Others reporting production are the Pittsburgh Plate Glass Company, Columbia Chemical Division; the United States Borax Company; and the West End Chemical Company. Latest available statistics show a steady upward trend in the production of borax and other boron compounds from 430,689 tons in 1946 to 647,735 tons in 1950.
The use of boron in steel making received a boost late in World War II as a temporary measure to save other alloying materials which were in critical supply. Since that time, interest in making the practice permanent has increased greatly. Boron steel production rose from two per cent of total alloy steel output in 1950 to about nine per cent (730,000 tons) in 1952. Informed observers predict that the country will soon need 10,000,000 tons per year of ingot alloy steel. Most of this could be treated with boron. However, it appears more probable that boron steel output might reach 20 per cent of the expected ingot alloy steel production, or 2,000,000 tons, thereby resulting in the consumption of about 200,000 pounds of boron.When proper metallurgical techniques are used, boron can improve the capacity of low- -and medium-carbon steels to harden without adversely affecting the physical
Editor’s Note—While the views expressed on this page are not necessarily those of this bank, the Monthly Business Review is pleased to make this space available for the discussion of significant developments in industrial research.
properties or safe performance of the alloy. Boron steels, furthermore, are less sensitive to “shatter cracks” and “flakes” than some of the steels which they replace.Savings in production costs and critical alloying materials are the outstanding advantages in the use of boron for steelmaking. The amount of boron added to steel is remarkably small, from about 0.001 to 0.006 per cent. An indication of savings in steel alloying constituents is given by the experience of three companies producing a total of about 30,000 tons per year of ingot steel for tools, heavy- duty gears, shafts, bolts, and studs. By using an estimated 1800 pounds of boron annually, the net savings per year was 656,000 pounds of nickel, 119,000 pounds of chromium, 52,000 pounds of molybdenum, and 9100 pounds of manganese.According to a report prepared by Battelle for the President’s Materials Policy Commission, boron, in the form of the element or in combination with other elements, appears to have a promising future as a coating material for both metallic and nonmetallic products. In this form, it gives surfaces that increase resistance to heat, corrosion, and wear. Many of the coatings are exceptionally hard, since boron, boron carbide, or boron nitride usually can be formed in place. Depending on the base material, various other compounds (such as borides of silicon, zirconium, vanadium, and tungsten) can be formed as coatings to give a wide range of chemical- wear-, and heat-resistant properties. Boron and most of the borides resist oxidation up to 2192-2372 degrees Fahrenheit. Hence, use of boron in coatings has possibilities of great usefulness in protecting some of the high-melting metals that have poor resistance to oxidation.Another phase of boron coating is to apply boron- containing alloys as a fused layer on the surface of a base metal. The nickel-base hard-facing alloys now commonly used for resisting wear in corrosive environments, contain from 1 to 4.75 per cent of boron. Fortunately, the presence of boron in the alloy reduces its melting point so that these wear-resisting coatings are not difficult to apply by metal-spraying and welding techniques.
More research is needed on a number of boron applications before their potential can be fully known. Studies on boron-base alloys are really just starting. Such studies may lead to applications of the metal itself as a material for limited construction purposes. The compounds di- borane, pentaborane, and aluminum borohydride have properties that make them particularly suitable for use in jet and rocket fuels. When some difficult production problems are worked out, military demands for such compounds may be substantial. In recent years, it was discovered that boron added to leaded gasoline will reduce the need for higher octane fuels in older engines where carbon accumulations on cylinder walls cut down the performance of low-octane fuels. Further research on this application is reported to be in progress.There is little doubt that boron and its compounds, already well-established in a wide variety of domestic and industrial uses, have a growing number of new opportunities to serve the American economy. The abundance of boron raw material in the United States and the versatility of its compounds will be constant spurs to the development of new applications.
A4
Digitized for FRASER http://fraser.stlouisfed.org/ Federal Reserve Bank of St. Louis