business environment reform...
TRANSCRIPT

Business Environment Reform Facility
Title: Ghana Business Enabling Environment Programme (BEEP) Monitoring and Evaluation Support, Phase 3 – Project Completion Report
Ashley Craft
22 October 2017

FutureTest Ghana Business Enabling Environment Programme (BEEP) Monitoring and Evaluation Support, Phase 3 – Project Completion Report
About Business Environment Reform Facility (BERF)
BERF is funded by the UK Department For International Development (DFID) under the Business
Environment for Economic Development (BEED) Programme. BERF is a central facility responding to
demand from the DFID’s priority Country Offices and stakeholders to initiate, improve and scale
up business environment reform programmes. BERF is managed by a consortium led by KPMG
LLP. The programme started in January 2016 and will finish in January 2019.
We provide expert advice, analysis of lessons learned, policy research about what works and what
doesn’t and develop innovative new approaches to involving businesses and consumers in investment
climate reform.
BERF has a strong emphasis on strengthening the Business Environment for women and girls, as well
as for young adults more generally. It is also aiming to improve the relationship between business and
the physical environment including where relevant through linkage to climate change analysis. BERF
recognises the need for appropriate political economy analysis in order to underpin business
environment reform processes and interventions.
About this Report
Research for this study was conducted by Ashley Craft between May and October 2017.
The views contained in this report are those of the authors and do not necessarily represent the views
of any BERF consortium member or DFID.
This is a working paper shared for discussion purposes only. No reliance should be placed upon this
report.

FutureTest Ghana Business Enabling Environment Programme (BEEP) Monitoring and Evaluation Support, Phase 3 – Project Completion Report
Acronyms and Abbreviations
AGI Association for Ghana Industries
BBI Business Barometer Index
BERF Business Environment Reform Facility
BEED Business Environment for Economic Development
CCM Compliance Cost Methodology
CIT Corporate Income Tax
CPI Consumer Price Index
DB Doing Business
DFID Department for International Development
EPA Environmental Protection Agency
GLFS Ghana Labour Force Survey
GRA Ghana Revenue Authority
GRA Ghana Radio Network
GSS Ghana Statistical Services
IBES International Business Establishment Survey
LAP Land Administration Project
MLGRD Ministry of Local Government and Rural Development
NHIL National Health Insurance Levy
OECD Organisation for Economic Cooperation and Development
PDAP Preliminary Design Approval in Principle
PIT Personal Income Tax
PPD Public-Private Dialogue
PSPF Private Sector Policy Facility
RIA Regulatory Impact Assessment
SME Small and Medium Enterprise
TKG The Khana Group
TCPD Town and Country Planning Department
VAT Value Added Tax
WHT Withholding Tax
WTO World Trade Organisation

FutureTest Ghana Business Enabling Environment Programme (BEEP) Monitoring and Evaluation Support, Phase 3 – Project Completion Report
Contents
Introduction 1
Methodology 2
Activities 2
Conclusion and Recommendations 5
Deliverables 5
Appendix 1 Ghana Business Enabling Environment Programme: Baseline report on the cost of compliance in target regulatory areas 6
1. Executive Summary 6
2. Introduction 8
3. Taxation component 11
4. Construction permits component 22
5. Commercial courts component 30
6 Business confidence surveys 34
Appendix 2 Ghana Business Enabling Environment Programme: Baseline report on the cost of compliance in target regulatory areas - Technical Annex 40
1. Overview 40
2. Taxation component 45
3. Construction permits component 56
4. Commercial courts component 63
5. Business confidence surveys 65

FutureTest Ghana Business Enabling Environment Programme (BEEP) Monitoring and Evaluation Support, Phase 3 – Project Completion Report
1
Introduction
The UK is providing up to £10 million over 2015-2019 through the Ghana Business Enabling
Environment Programme (BEEP) to help improve the business environment (BE) in Ghana.
Specific reform areas include taxation, commercial courts, and business construction and
operation permits. The Public Sector Policy Facility (PSPF), which originally focused on
bringing together businesses to consult on proposed regulatory changes, has been adapted
to support the newly-formed Business Regulation Unit under the new Ghana administration.
The Inception Phase of BEEP concluded that monitoring and evaluation (M&E) within the
targeted MDAs was generally weak and relied on a mix of monitoring systems. As a result,
DFID Ghana approached the Business Environment Reform Facility (BERF) for support on
programme Monitoring and Evaluation (M&E). This has taken place in three phases:
Phase 1
DFID Ghana engaged an M&E specialist to design a consistent programme level monitoring
and evaluation approach. The consultant produced three stages of deliverables including an
analysis of options for programme level M&E. The M&E final report recommended using
compliance cost analysis along with a measure of business confidence, and suggested a
methodology which would allow the programme to gather primary data from different groups
of businesses likely to benefit from the reforms as well as the Ministries, Departments, and
Agencies (MDAs) implementing the reforms. The report also recommended the setting up and
use of a Panel of Users representing different kinds and sizes of businesses in Ghana, building
on existing user committees and the Better Regulatory Committee, as sources of information
on new/proposed regulatory reforms.
Phase 2
The M&E specialist was engaged to provide long term advisory support to DFID Ghana to
implement the approach to baseline programme level data collection recommended in the
M&E for BEEP Final Report from Phase 1. Work included design of bespoke surveys for each
reform area and recruitment and management of a local data collection firm to gather data
from a representative sample of businesses in the Greater Accra area, as well as capacity
building and quality assurance of data produced by the MDAs themselves. Programme data
were used to test initial assumptions around the design of the programme as well as the three
initial reform areas to determine the extent to which assumptions still held.
Phase 3
In January 2017, a new Ghana government administration was sworn in alongside a new
president. The new administration is implementing changes to the business environment to

FutureTest Ghana Business Enabling Environment Programme (BEEP) Monitoring and Evaluation Support, Phase 3 – Project Completion Report
2
stimulate economic growth, including the establishment of a new Business Regulation Unit
whose central focus is to cut red tape.
In Phase III, which ran from January to October 2017, DFID Ghana requested additional
support from BERF to:
Review the strategic fit and workplans for the main reform areas under BEEP;
Implement changes to the BEEP M&E Framework in light of recommendations from the
Annual Review and engagement with the new Government of Ghana (GoG), as well as
to reflect recent changes in UK policy and focus;
Identify areas of support to the new GoG Business Regulation Unit; and
Disseminate findings to a broader audience of the cost compliance methodology (CCM)
study developed under the first two phases of BERF.
Methodology
The assignment method included:
Remote
Desk based review and quality assurance of written work, based remotely
Support and management of deliverables including the baseline report, via Skype/phone
Project Completion Report writing
In-country
Stakeholder consultations, including engagement with the new GoG on its new priorities
for regulatory reform
Visit to Ghana incorporating meetings, workshops, and one-to-one support sessions
Presentation of findings and recommendations to DFID Ghana, GoG and other donors
The consultant made trips in March, July, and October 2017 to support the project. Flights
were cost-shared with another DAI-managed programme in Ghana.
Activities
Summary of activities
Activity 5.1 Provide analysis of proposed activities for the three current BEEP components –
commercial courts, local licenses, and tax – to determine the extent to which:
Programme activities are still relevant to DFID and GoG priorities,

FutureTest Ghana Business Enabling Environment Programme (BEEP) Monitoring and Evaluation Support, Phase 3 – Project Completion Report
3
Data supplied by components are valid and components are able to provide the agreed
data needed to gauge progress against the logframe, and
The cost compliance methodology (CCM) data provides sufficient evidence of cost
savings to justify all proposed reform activities.
Work undertaken:
Strategic fit and evidence assessment report submitted to DFID on 7 April. Call held with
Programme Coordinator to discuss changes to proposed workplans. Workplans
reviewed to determine continuing relevance to programme objectives and new
Government of Ghana priorities.
Revised logframe with output indicators tracking data needed from components
submitted to DFID on 14 August.
Provisional compliance cost estimates presented to DFID at validation workshop on 20
July, and in the draft baseline report on 14 August.
Activity 5.2 Make recommendations on how to prioritise support to existing and new BEEP
components and on whether proposed workplan activities for existing components are
justified, working together with other BEEP technical advisers.
Work undertaken:
Strategic fit and evidence assessment report submitted to DFID on 7 April.
Call held with Programme Coordinator to discuss changes to proposed workplans.
Workplans reviewed to determine continuing relevance to programme objectives and
new Government of Ghana priorities. Logframe amended to reflect changing priorities
(both weighting and indicators).
Activity 5.3 This analysis will inform DFID Ghana's decisions on how to reprioritise the
workplans for the three components and inform a programme logframe revision and revised
value for money (VfM) assessment.
Call held with Programme Coordinator to discuss changes to proposed workplans.
Workplans reviewed to determine continuing relevance to programme objectives and
new Government of Ghana priorities.
Revised logframe with output indicators tracking data needed from components
submitted to DFID on 14 August.
Draft VfM assessment submitted 31 August.
VfM approach approved in meeting 13 October.
Activity 5.4 Present findings from the CCM work undertaken to date to a wider audience
including DFID Ghana, GoG and other donors.

FutureTest Ghana Business Enabling Environment Programme (BEEP) Monitoring and Evaluation Support, Phase 3 – Project Completion Report
4
Validation workshop held on 20 July at the Alisa Hotel in Accra to present the findings
of the baseline survey. Attendees included DFID Ghana, Deputy Minister for Trade and
Industry, representatives from the supported Ministries, and businesses participating in
the survey.
Draft baseline report submitted 14 August. Final report submitted 26 September.
Activity 5.5 Work with BEEP Policy Facility Adviser to provide support to the GoG Business
Regulation Unit.
No support for BRU was requested during the contract.
Status of activities
Activity Status
5.1 Provide analysis of proposed activities for the three current BEEP
components – commercial courts, local licenses, and tax – to determine
the extent to which:
Programme activities are still relevant to DFID and GoG priorities,
Data supplied by components are valid and components are able to
provide the agreed data needed to gauge progress against the
logframe, and
The cost compliance methodology (CCM) data provides sufficient
evidence of cost savings to justify all proposed reform activities.
Complete
5.2 Make recommendations on how to prioritise support to existing and new
BEEP components and on whether proposed workplan activities for
existing components are justified, working together with other BEEP
technical advisers.
Complete
5.3 This analysis will inform DFID Ghana's decisions on how to reprioritise the
workplans for the three components and inform a programme logframe
revision and revised value for money (VfM) assessment.
Complete
5.4 Present findings from the CCM work undertaken to date to a wider
audience including DFID Ghana, GoG and other donors. This could involve
short case studies for wider circulation.
Complete
5.5 Work with BEEP Policy Facility Adviser to provide support to the GoG
Business Regulation Unit.
No support
requested
FutureTest Ghana Business Enabling Environment Programme (BEEP) Monitoring and Evaluation Support, Phase 3 – Project Completion Report
5
Conclusion and Recommendations
Phase III support was successful, although no support to the Business Regulation Unit was
asked for as the team is still gearing up for delivery.
Support to the Business Regulation Unit is needed over the coming programme year and DFID
have begun drafting a Terms of Reference for what this would cover. Indicative activities
include helping draft a logframe for the BRU work which aligns with the Government of
Ghana’s priorities and helping the BRU prioritise regulatory reform areas with analysis similar
to what was contained in the Strategic and Evidence Review.
Deliverables
Appendix 1 Final BEEP baseline report
Appendix 2 BEEP baseline report technical annex

FutureTest Ghana Business Enabling Environment Programme (BEEP) Monitoring and Evaluation Support, Phase 3 – Project Completion Report
6
Appendix 1 Ghana Business Enabling Environment Programme: Baseline report on the cost of compliance in target regulatory areas
1. Executive Summary
The Ghana Business Enabling Environment Programme (BEEP) Baseline Survey is part of
UK Department for International Development’s (DFID) on-going initiative to improve the
Business Enabling Environment in Ghana. The aim is to support targeted institutions within
the Government of Ghana to enact reforms, build the evidence base for reform through
independent analysis and research, and support Public-Private Dialogue (PPD) to enhance
the demand for and effectiveness of reform. The Ghana BEEP has three regulatory areas –
commercial justice and contract enforcement, improving taxpayer services, and reducing the
cost of business licensing fees and construction permits.
DFID commissioned The Khana Group (TKG) to conduct a representative baseline survey on
the cost of compliance in the three target areas. Three separate questionnaires in line with the
three regulatory reform areas were developed and administered to 265 businesses in the
Greater Accra Region. This document outlines the survey methodology, the findings in line
with the objectives as well as additional information that may be useful when using the data.
1.1 Key findings
The survey provided estimates of the average compliance costs for taxation and construction
permits for businesses in Greater Accra, as well as a range of estimates of the cost of
compliance for Greater Accra Region and the entire country.
For the taxation component, the baseline survey estimated the median cost of
compliance for regular reporting on taxation for micro and small businesses at GHS
9,550 (mean GHS 9,427) a year. Businesses subjected to an audit had median costs of
GHS 10,000 (mean GHS 8,621). The survey estimated the median cost of compliance
for regular reporting on taxation for medium and large businesses at GHS 10,036 (mean
GHS 14,425) a year. Medium and large businesses subjected to an audit incurred
median costs of GHS 12,575 (mean GHS 17,618).
These data were used to estimate the overall cost of compliance for registered
businesses in Greater Accra and across Ghana. These estimates range from GHS 275.3
million to 660.7 million annually for businesses registered in Greater Accra, and GHS
550.3 million to 1,299.1 million annually for businesses across Ghana.
For the construction permit component, the baseline survey estimated the median cost
of compliance for applying for a construction permit for micro and small businesses was
GHS 9,720 (mean GHS 12,133), plus an average of GHS 1,972 of opportunity costs for
delay. The median cost of compliance for a construction permit for medium and large
businesses was GHS 10,900 (mean GHS 12,587), plus an average of GHS 196,643 of
opportunity costs for the delay.
FutureTest Ghana Business Enabling Environment Programme (BEEP) Monitoring and Evaluation Support, Phase 3 – Project Completion Report
7
These data were used to estimate the overall cost of compliance for businesses applying for
a construction permit in Greater Accra and across Ghana. These estimates range from GHS
3.8 million to 7.1 million for the Greater Accra Region, and GHS 11.7 million to 20.1 million
across Ghana.

FutureTest Ghana Business Enabling Environment Programme (BEEP) Monitoring and Evaluation Support, Phase 3 – Project Completion Report
8
2. Introduction
2.1 Overview of Ghana BEEP
Ghana’s Business Environment has been performing relatively well in recent years, with a
sound legal framework and good compliance with World Trade Organisation (WTO) Trade-
Related Investment Measures. Ghana instituted reforms1 that helped to reduce the time to
register a business by almost 20 percent, and improved contract enforcement, by expanding
the capacity of the Registrar of Companies and of Commercial Courts respectively. Similarly,
the number of steps it takes to register a property was reduced and legislation was introduced
to facilitate access to credit.
However, more remains to be done. Ghana’s ranking on the World Bank Doing Business
indicators has slipped from 70 in 2015 to 108 in 2017. While part of this fall is explained by
changes in methodology, it also highlights that gains are being eroded as reforms have
stagnated. No substantive reforms have been undertaken for nearly seven years. Significant
weaknesses still persist in areas such as dealing with construction permits. Despite
improvements, the World Bank Doing Business 2017 estimated that it took businesses on
average 170 days to acquire a building permit. Burdensome tax administration is also a
hindrance to bringing informal enterprises into the tax net. The World Bank estimated that
Ghanaian businesses made around 33 tax payments per year (compared to three in frontier
systems) and spent 224 hours per year required to comply with tax regulations2. On the legal
front, it took businesses in Ghana an average of 710 days to enforce a contract, including trial
and enforcement of judgment, which compares poorly with the sub-Saharan and OECD
averages of 641 and 540, respectively.
The UK Department for International Development (DFID) recognises the vital role that the
private sector plays in the social and economic development of the country. In 2015, DFID
provided up to £10 million for a four-year period through Business Enabling Environment
Programme (BEEP) to help improve the Business Enabling Environment in Ghana. The aim
is to support targeted institutions within the Government of Ghana to enact reforms; build the
evidence base for reform through independent analysis and research; and support Public-
Private Dialogue (PPD) to enhance the demand for and effectiveness of reform. The current
BEEP reform areas are:
1) Commercial justice and contract enforcement (including arbitration) - Commercial Courts
of the Judicial Service and relevant agencies.
2) Improving tax payer services particularly for Small and Medium Enterprises (SMEs) -
Ghana Revenue Authority (GRA) and other relevant agencies.
1 Implemented under The National Private Sector Development Strategy 2005-2010. 2 World Bank defines these as countries with the best performance on individual indicators assessed.

FutureTest Ghana Business Enabling Environment Programme (BEEP) Monitoring and Evaluation Support, Phase 3 – Project Completion Report
9
3) Local level business licensing fees, operating permits and building/construction permits -
Ministry of Local Government and Rural Development (MLGRD), and related regulatory
agencies.
4) Private Sector Policy Facility (PSPF) - Providing support for public-private dialogue around
government regulation of businesses (Private Sector Policy Facility), supporting the
Government of Ghana’s Business Regulatory Reform Strategy, and enhancing
transparency and accountability of government regulations.
DFID commissioned a representative baseline survey to establish the cost of compliance of
existing Tax, Building/Construction Permits and Commercial Courts regulations. The survey
also investigates whether there is a disproportionate burden of compliance on different types
of businesses, including small and micro enterprises vs. medium and large companies,
companies operating in the construction sectors, women owned or foreign-owned businesses.
This report outlines and describes the survey methodology, the survey findings in line with the
objectives as well as additional information that may be useful when using the data.
2.2 Background to the baseline survey
The BEEP approach to monitoring and evaluation was reviewed in the inception period and
one of the recommendations was to use compliance cost methodology as a standard
measurement of cost savings. The survey incorporates builds on compliance cost
methodology but also looks to capture other costs including opportunity costs and financial
costs to capture the full cost of compliance to Ghanaian businesses. For a deeper explanation
of Compliance Cost Methodology and how it was adapted to the programme, see the
Technical Annex.
2.3 Methodology
2.3.1 Development and piloting of Survey Instruments
Three separate questionnaires were devised for each of the three initial target reform areas
and shared with the responsible government department to further refine the questions.
Questionnaires were then piloted with businesses prior to administration. For a fuller
discussion of the pilot process, see the Technical Annex.
2.3.2 Sampling Protocol and Selection of businesses
Following piloting, the survey team achieved a total sample of 265 businesses – 97
businesses were selected principally for the taxation component, 85 for construction permits,
and 83 for commercial court disputes. Respondent businesses were selected from a list of
eligible businesses provided by the Ghana Revenue Authority, the Commercial Courts and
the Ministry of Local Government and Rural Development. The survey team fell slightly short
of its target of 280 businesses, for reasons set out in the sections below. The sample size was
designed to test whether programme targets of around 40% reduction in the cost of

FutureTest Ghana Business Enabling Environment Programme (BEEP) Monitoring and Evaluation Support, Phase 3 – Project Completion Report
10
compliance would be achieved between the start and end of the programme,3 following the
rationale laid out in the Ghana Business Enabling Environment Programme Monitoring and
Evaluation Final Report (July 2016).
2.3.3 Business Categories for Analysis
Following the recommendations in this report, the sample was further stratified by size of
business4 and business ownership. Twenty-nine percent of the surveyed firms are micro-sized
firms, 49 percent were small-sized firms, 14 percent were medium-sized firms, and 7 percent
were large firms.
About 79 percent of businesses surveyed were headed by male executives, 15 percent by
female executives and 6 percent headed by both male and female executives. The survey
data also showed that 86 percent of the businesses were Ghanaian owned.
Table 1: Demographic Characteristics of Businesses in the achieved sample
Size Taxation Construction Permits Commercial Courts
Micro (below 5) 43 28 7
Small (6-31) 38 36 57
Medium (32-100) 9 14 14
Large (above 100) 7 7 8
Total 97 85 83
Sex of Highest executive Taxation Construction Permits Commercial Courts
Male 75 66 68
Female 16 10 14
Male and Female 6 9 1
Total 97 85 83
Ownership Taxation Construction Permits Commercial Courts
Ghanaian Owned 86 76 66
Foreign owned 6 9 11
Ghanaian and Foreign Owned 5 0 6
Total 97 85 83
2.3.4 Validation Meeting
Following preliminary analysis of the results, a validation meeting was held to present findings
of the baseline survey to key stakeholders. A total of 57 participants attended the workshop
and included representatives from government, businesses, and industry groups. The
workshop gave the stakeholders the opportunity to validate the findings of the baseline and to
3 Assumptions are power = 0.8, p < 0.05, one-tailed hypothesis as the regulatory burden is expected to decrease, effect size 0.40. Calculated using G-Power 3.1.9.2. 4 The GSS defines large-sized firms as engaging more than 100 persons on a temporary or permanent business, medium-sized firms engaging from 31 to 100 persons, small-sized firms engaging from 6 to 30 persons, and micro-sized firms engaging from 1 to 5 persons.

FutureTest Ghana Business Enabling Environment Programme (BEEP) Monitoring and Evaluation Support, Phase 3 – Project Completion Report
11
give recommendations and suggestions to improve the report and future research that will be
carried out in this regard.
2.3.5 Survey Limitations
The data collection firm had difficulty fulfilling their targets of 90 businesses for each regulatory
area, due to lack of valid contact information provided by the implementing agencies and
refusals of businesses contacted. This resulted in a loss of survey representativeness. See
Technical Annex for details.
Because of high initial refusal rates from businesses selected for the commercial courts
component, the survey team had to modify the questionnaire and so was unable to provide
robust estimates of the cost of compliance for commercial disputes.
3. Taxation component
3.1 Estimated cost of tax compliance
3.1.1 Compliance cost methodology
Compliance costs for the Tax component are derived using BEEP survey data on registered
businesses within the Tema Metropolis and elsewhere in the Greater Accra Region of Ghana
that filed 2015 tax returns and planned on filing 2016 tax returns.5 These firms are classified
according to size as large, medium, small, and micro establishments. Over 83 percent of the
surveyed firms are micro or small-sized. Data were also analysed based on whether firms
used the presumptive method or the more rigorous self-assessment method of paying taxes.
The Technical Annex provides further information on the demographics of businesses
selected for the tax component.
3.1.2 Estimates of firm-level compliance costs for taxation
The BEEP Baseline Survey considers two broad categories of compliance costs associated
with taxation. The first category of compliance costs covers the routine costs of preparing and
filing tax returns, whereas the second category covers additional costs if the business is
involved in an audit.
For the taxation component, the baseline survey estimated the median cost of compliance for
regular reporting on taxation for micro and small businesses at GHS 9,550 (mean GHS 9,427)
a year. Businesses subjected to an audit had median costs of GHS 10,000 (mean GHS 8,621).
The survey estimated the median cost of compliance for regular reporting on taxation for
medium and large businesses at GHS 10,036 (mean GHS 14,425) a year. Medium and large
businesses subjected to an audit incurred median costs of GHS 12,575 (mean GHS 17,618).
5 See Department for International Development (2017), “DFID Business Enabling Environment Programme Baseline Survey.” Id., at p. 3.

FutureTest Ghana Business Enabling Environment Programme (BEEP) Monitoring and Evaluation Support, Phase 3 – Project Completion Report
12
The survey data indicate that tax preparation is largely done by in-house staff in micro- and
small businesses, whereas in medium and large businesses this is outsourced. Micro and
small businesses spent on average of 140 staff days preparing taxes per year, and staff wages
represented 70% of the cost of preparing taxes and of the cost of audit. 25% of costs were on
professional services, however less than half of micro and small businesses spent any money
on professional services in preparing taxes, and for audit the median amount spent was just
GHS 200.
Medium and large businesses spent a similar average of 137 staff days preparing taxes per
year, however this represented only 45% of the cost of preparing taxes and 35% of the cost
of audit. These companies spent around the same amount on professional services for
preparing taxes, and this rose to 65% when these companies were faced with an audit.

FutureTest Ghana Business Enabling Environment Programme (BEEP) Monitoring and Evaluation Support, Phase 3 – Project Completion Report
13
Table 2: Summary Statistics of Firm-level Compliance Costs of Regular Reporting of Taxes
Regular Reporting
Costs Number of
Observations 25th
Percentile Median 75th
Percentile Mean Standard Deviation Minimum Maximum
Micro- and small-sized firms
Office Equipment (GHS) 81 0.0 50.0 480.0 795.4 2,339.1 0.0 12,250.0
Software and Systems (GHS) 80 0.0 0.0 0.0 132.1 423.7 0.0 2,500.0
Professional Service (GHS) 81 0.0 0.0 2,000.0 2,225.9 6,453.7 0.0 40,000.0
Staff days 81 41.7 130.4 260.7 139.9 106.2 0.0 286.8
Staff wages (GHS) 81 1,920.0 6,000.0 12,000.0 6,441.5 4,890.2 0.0 13,200.0
Other Costs (GHS) 81 0.0 0.0 0.0 1.9 16.7 0.0 150.0
Total regular
reporting costs (GHS) 80 3,180.0 9,550.0 12,450.0 9,427.6 7,471.8 0.0 41,680.0
Medium- and large-sized firms
Office Equipment (GHS) 16 4.0 105.0 750.0 1,288.3 3,043.8 0.0 12,000.0
Software and Systems (GHS) 14 0.0 0.0 0.0 342.4 1,274.4 0.0 4,770.0
Professional Service (GHS) 16 0.0 0.0 3,750.0 6,078.1 13,962.4 0.0 52,500.0
Staff days 16 7.8 84.7 260.7 137.0 147.8 0.0 521.4
Staff wages (GHS) 16 360.0 3,900.0 12,000.0 6,307.5 6,805.0 0.0 24,000.0
Other Costs (GHS) 16 0.0 0.0 0.0 25.0 100.0 0.0 400.0
Total regular reporting costs (GHS) 14 3,660.0 10,036.0 16,750.0 14,424.8 15,812.6 0.0 57,390.0
Sources: BEEP Baseline Survey, GLFS (2015).

FutureTest Ghana Business Enabling Environment Programme (BEEP) Monitoring and Evaluation Support, Phase 3 – Project Completion Report
14
Table 3: Summary Statistics of Firm-level Compliance Costs of Tax Audits, for Surveyed Firms
Audit Costs Number of
Observations 25th
Percentile Median 75th
Percentile Mean Standard Deviation Minimum Maximum
Micro- and small-sized firms
Office Equipment (GHS) 45 0.0 0.0 200.0 297.5 809.3 0.0 4,800.0
Software and Systems (GHS) 45 0.0 0.0 0.0 33.4 118.7 0.0 600.0
Professional Service (GHS) 45 0.0 200.0 3,000.0 2,270.4 4,118.6 0.0 21,000.0
Staff days 45 0.0 78.2 260.7 130.3 120.4 0.0 260.7
Staff wages (GHS) 45 0.0 3,600.0 12,000.0 5,997.3 5,541.7 0.0 12,000.0
Other Costs (GHS) 45 0.0 0.0 0.0 22.2 149.1 0.0 1,000.0
Total audit costs (GHS) 45 3,420.0 10,000.0 12,900.0 8,620.9 5,843.2 0.0 21,100.0
Medium- and large-sized firms
Office Equipment (GHS) 14 0.0 0.0 140.0 163.6 358.1 0.0 1,000.0
Software and Systems (GHS) 14 0.0 0.0 0.0 0.4 1.4 0.0 5.3
Professional
Service (GHS) 14 0.0 3,900.0 10,000.0 11,367.9 18,332.7 0.0 52,500.0
Staff days 14 0.0 117.3 260.7 132.2 122.6 0.0 273.8
Staff wages (GHS) 14 0.0 5,400.0 12,000.0 6,085.7 5,642.5 0.0 12,600.0
Other Costs (GHS) 14 0.0 0.0 0.0 0.0 0.0 0.0 0.0
Total audit costs (GHS) 14 5,000.0 12,575.0 22,000.0 17,617.5 19,505.8 0.0 60,800.0
Sources: BEEP Baseline Survey, GLFS (2015).
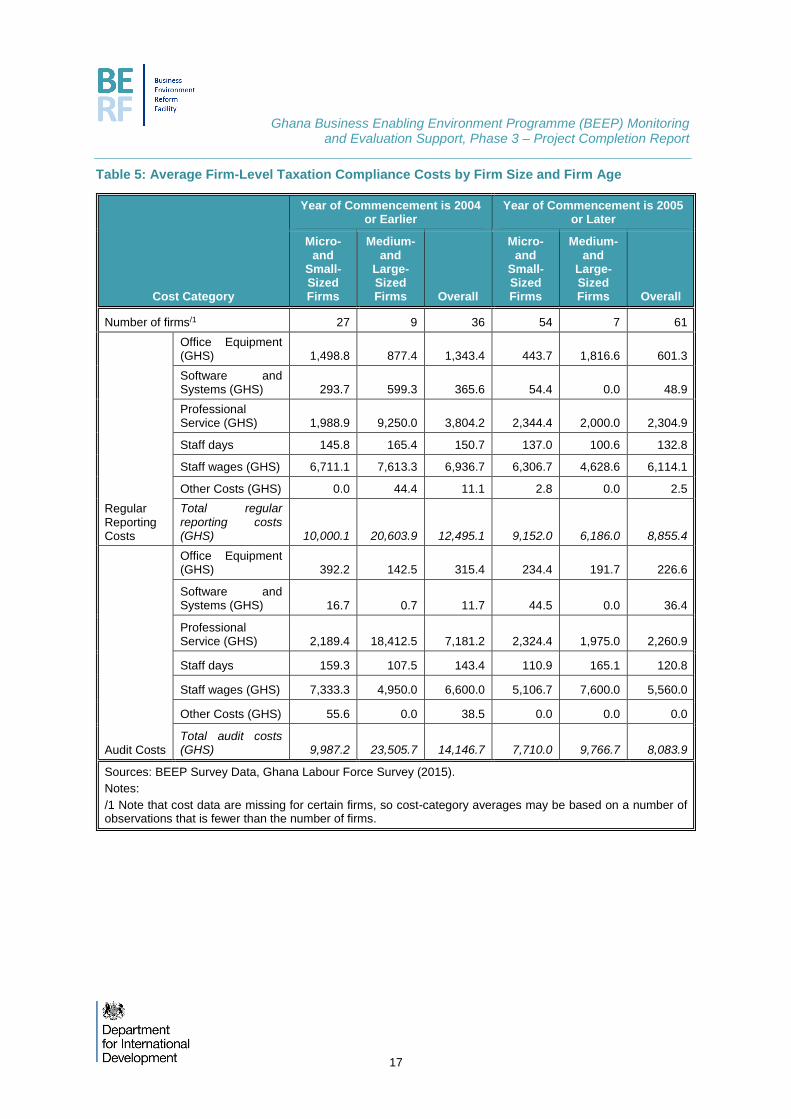
3.1.3 Variation by business characteristics
In this subsection, the variation in per-firm and overall mean compliance costs by firm age and
accounting type is examined. Table 4 presents average firm-level compliance costs for the
various cost categories of the surveyed firms. As shown in Table 4, expenditures on
professional services increases with firm size, and therefore total regular reporting costs
increase as firm size increases. The table also shows that total audit costs are higher for
medium- and large-sized firms than for micro- and small-sized firms.

FutureTest Ghana Business Enabling Environment Programme (BEEP) Monitoring and Evaluation Support, Phase 3 – Project Completion Report
15
Table 4: Compliance Costs by Firm Size and Accounting Record Type (GHS)
Costs n= Min 25th Percentile
Median
75th Percentile
Max Mean
Standard Deviation
Micro- and small size firms, formal accounting records kept (self-assessment)
Regula
r R
eport
ing
Office Equipment 57 0 0 100 455 12,250
693 2,265
Software and Systems 57 0 0 0 0 2,500 154 479
Professional Services 57 0 0 0 3,000 35,000
2,321 5,666
Staff Wages (lower quartile) 57 0 985 2,461 6,153 6,769 3,287 2,473
Staff Wages (upper quartile) 57 0 2,422 6,055 15,137 16,651
8,086 6,084
Other Costs 57 0 0 0 0 150 3 20
Total 57 14,544
Audits
Office Equipment 36 0 0 0 205 4,800 329 898
Software and Systems 36 0 0 0 0 500 25 91
Professional Services 36 0 0 1,500 3,500 21,000
2,808 4,452
Staff Wages (based on 25th Percentile of GLFS data)
36 0 0 985 6,153 6,153 2,408 2,762
Staff Wages (based on 75th Percentile of GLFS data)
36 0 0 2,422 15,137 15,137
5,925 6,793
Other Costs 36 0 0 0 0 1,000 28 167
Total 36 11,522
Micro- and small size firms, informal accounting records kept (presumptive method)
Regula
r R
eport
ing
Office Equipment 24 0 0 18 500 11,000
1,039 2,541
Software and Systems 23 0 0 0 0 1,000 78 239
Professional Services 24 0 0 0 100 40,000
2,000 8,162
Staff Wages (based on 25th Percentile of GLFS data)
24 0 462 3,077 6,153 6,153 3,341 2,641
Staff Wages (based on 75th Percentile of GLFS data)
24 0 1,135 7,569 15,137 151,367
8,218 6,497
Other Costs 24 0 0 0 0 0 0 0
Total 24 14,676

FutureTest Ghana Business Enabling Environment Programme (BEEP) Monitoring and Evaluation Support, Phase 3 – Project Completion Report
16
Costs n= Min 25th Percentile
Median
75th Percentile
Max Mean
Standard Deviation
Audits
Office Equipment 9 0 0 50 200 600 173 230
Software and Systems 9 0 0 0 0 600 67 200
Professional Services 9 0 0 0 100 900 122 295
Staff Wages (based on 25th Percentile of GLFS data)
9 3,077 6,153 6,153 6,153 6,153 5,743 1,020
Staff Wages (based on 75th Percentile of GLFS data)
9 7,569 15,137 15,137
15,137 15,137
14,128 2,510
Other Costs 9 0 0 0 0 0 0 0
Total 9 20,233
FutureTest Ghana Business Enabling Environment Programme (BEEP) Monitoring and Evaluation Support, Phase 3 – Project Completion Report
17
Table 5: Average Firm-Level Taxation Compliance Costs by Firm Size and Firm Age
Cost Category
Year of Commencement is 2004 or Earlier
Year of Commencement is 2005 or Later
Micro- and
Small-Sized Firms
Medium- and
Large-Sized Firms Overall
Micro- and
Small-Sized Firms
Medium- and
Large-Sized Firms Overall
Number of firms/1 27 9 36 54 7 61
Regular Reporting Costs
Office Equipment (GHS) 1,498.8 877.4 1,343.4 443.7 1,816.6 601.3
Software and Systems (GHS) 293.7 599.3 365.6 54.4 0.0 48.9
Professional Service (GHS) 1,988.9 9,250.0 3,804.2 2,344.4 2,000.0 2,304.9
Staff days 145.8 165.4 150.7 137.0 100.6 132.8
Staff wages (GHS) 6,711.1 7,613.3 6,936.7 6,306.7 4,628.6 6,114.1
Other Costs (GHS) 0.0 44.4 11.1 2.8 0.0 2.5
Total regular reporting costs (GHS) 10,000.1 20,603.9 12,495.1 9,152.0 6,186.0 8,855.4
Audit Costs
Office Equipment (GHS) 392.2 142.5 315.4 234.4 191.7 226.6
Software and Systems (GHS) 16.7 0.7 11.7 44.5 0.0 36.4
Professional Service (GHS) 2,189.4 18,412.5 7,181.2 2,324.4 1,975.0 2,260.9
Staff days 159.3 107.5 143.4 110.9 165.1 120.8
Staff wages (GHS) 7,333.3 4,950.0 6,600.0 5,106.7 7,600.0 5,560.0
Other Costs (GHS) 55.6 0.0 38.5 0.0 0.0 0.0
Total audit costs (GHS) 9,987.2 23,505.7 14,146.7 7,710.0 9,766.7 8,083.9
Sources: BEEP Survey Data, Ghana Labour Force Survey (2015).
Notes:
/1 Note that cost data are missing for certain firms, so cost-category averages may be based on a number of observations that is fewer than the number of firms.

FutureTest Ghana Business Enabling Environment Programme (BEEP) Monitoring and Evaluation Support, Phase 3 – Project Completion Report
18
3.2 Estimates for Greater Accra / Ghana
The overall compliance costs of taxation for the Greater Accra region as well as for Ghana
was estimated using the two-step estimation methodology. Details of this methodology are
available in the Technical Annex.
Table 6 shows the estimated compliance cost ranges for Greater Accra and Ghana
respectively using the methodologies. An estimated range of GHS 275.3 million to 660.7
million for the Greater Accra region, and GHS 550.3 million to 1,299.1 million for Ghana.
Table 6: Compliance Costs Range Estimates for the Tax Component (GHS mil)
Region Lower Bound of Range Upper Bound of Range
Greater Accra 275.3 660.7
Ghana 550.3 1,299.1
Source: BEEP Survey data; GSS Report (2015), Ghana Labour Force Survey (2015), GSS Report, GSS CPI data.
3.3 Comparison with World Bank estimates
The findings from BEEP survey were compared with corresponding data for Ghana presented
by the World Bank in its Doing Business 2016 report. According to the World Bank, in Ghana,
“[on] average, firms make 33.00 tax payments a year [and] spend 224.00 hours a year filing,
preparing and paying taxes.”6
The total number of tax payments estimated using BEEP survey data for medium sized firms,
36, closely matches the World Bank’s estimate of 33 tax payments for the same firm size.
However, BEEP survey data found that the median staff time spent on taxation-compliance-
related activities not including audit, was far higher than World Bank estimates.
Table 7: Staff Time Required by Surveyed Firms for Tax Compliance
Firm Size Number of Firms
Staff Time (Hours) Spent on Tax Filing and Preparation
Median Mean
Micro 43 1,042.9 1,185.5
Small 38 730.0 1,045.1
Medium 9 1,022.0 1,098.5
Large 7 438.0 1,093.5
Source: BEEP Survey Data.
6 See World Bank (2016), “Doing Business 2016, Measuring Regulatory Quality and Efficiency, Economy Profile 2016, Ghana,” p.66..

FutureTest Ghana Business Enabling Environment Programme (BEEP) Monitoring and Evaluation Support, Phase 3 – Project Completion Report
19
3.4 Findings on relative importance of taxation
The BEEP questionnaire included a section on business confidence, in which all firms – not
just those selected for taxation – were asked to report the biggest problems or issues faced in
the last 3 months. Of 165 surveyed firms, 90 listed high levels of taxes among the three biggest
problems they faced in the last 3 months, and 30 listed “burden of paying taxes, high number
of taxes”. Thus, 54% of firms found high levels of taxes to be of concern, but only 18% of firms
the burden of paying taxes by itself to be a concern. Only 14% of firms listed both the level
and the burden of paying taxes to be among the three biggest problems they faced.
To identify the predictors of tax being a higher concern for companies, a logistic regression
analysis was performed. This model showed that micro firm size and informal accounting
records were significantly correlated with tax issues being a high concern for companies.
Details of the logistic regression are found in the Technical Annex.
3.5 Taxation component - Conclusions and recommendations
3.5.1 Conclusions
The baseline survey estimated the median cost of compliance for regular reporting on
taxation for micro and small businesses at GHS 9,550 (mean GHS 9,427) a year, with
around 60% of these costs staff time or wages. Most micro and small business did not
spend any money on professional services for preparing their tax returns. Small and micro
businesses subjected to an audit incurred median costs of GHS 10,000 (mean GHS
8,621). Again, most of this was in staff time, although these firms spent a median of GHS
200 (mean 2,270) on professional services for audits.
The survey estimated the median cost of compliance for regular reporting on taxation for
medium and large businesses at GHS 10,036 (mean GHS 14,425) a year, with around
40% of these costs staff time or wages. Most of these enterprises did not spend any money
on professional services for preparing their tax returns, but those who did spent a
substantial amount (median GHS 0, mean GHS 6,078). Medium and large businesses
subjected to an audit incurred median costs of GHS 12,575 (mean GHS 17,618). While
much of this was staff time, the majority of costs in responding to an audit were spent on
professional services (median GHS 3,900, mean GHS 11,367).
These data were used to estimate the overall cost of compliance for registered businesses
in Greater Accra and across Ghana. These estimates range from GHS 275.3 million to
660.7 million annually for businesses registered in Greater Accra, and GHS 550.3 million
to 1,299.1 million annually for businesses across Ghana.
The results of the survey confirm World Bank estimates of the number of procedures for
paying taxes. However, the baseline survey found that average number of hours spent
filing, preparing, and paying taxes is far higher than World Bank estimates suggest. The
BEEP survey data show that businesses of all sizes spend around 140 staff days, or over

FutureTest Ghana Business Enabling Environment Programme (BEEP) Monitoring and Evaluation Support, Phase 3 – Project Completion Report
20
1,000 staff hours per year preparing taxes. This suggests that the burden is significantly
higher for micro and small businesses, who have fewer staff, and hardest for sole traders.
The variation in firm-level compliance costs by business demographics was also
examined. In general, the compliance costs of taxation are higher for larger firms, but the
relative cost of compliance is much greater for micro and small businesses. This shows
that regulation places a disproportionate burden on micro and small businesses.
There was no direct evidence to show that the cost of compliance was significantly different
for enterprises what were solely or jointly owned by foreigners or women. These findings
were validated by workshop participants who suggested there was no systemic reason
why females or foreigners should be discriminated against in paying taxes. However, the
statistical analysis was limited because these companies represented less than 10% of
the sample.
Data from the Integrated Business Establishment Survey (IBES) suggest that foreigners
are 2-3 times more likely to own a medium or large enterprise than a small or micro
enterprise, and that females are more likely to work in micro enterprises. This means that
the cost of compliance for foreign and female owned businesses may be different based
on the size of the business they are likely to own.
3.5.2 Recommendations
The data and estimates of the annual cost of compliance for taxation show that this is the
BEEP intervention with the greatest potential to generate significant reductions in the cost
of compliance, even if it affects only registered i.e. formal businesses. The number of
businesses affected by taxation reforms is far higher than those affected in construction
permits or commercial disputes.
Because of the disproportionate burden on micro and small businesses, the government
should reconsider the introduction of mandatory self-assessment for businesses
registered with the Small Taxpayers Office, and consider whether reporting requirements
are proportionate to the amount of tax likely to be paid.
The burden of paying taxes on micro and small enterprises likely serves as a disincentive
to formalization and registration of businesses. Given the government’s emphasis on
widening the tax net, particular attention should be given on how to ease the burden for
these businesses.
A comparison of the costs of small and micro firms using presumptive and self-assessment
methods finds no real difference in the cost of compliance between these two methods for
regular reporting. However, firms using the presumptive method spend almost twice as
much in responding to audits.

FutureTest Ghana Business Enabling Environment Programme (BEEP) Monitoring and Evaluation Support, Phase 3 – Project Completion Report
21
Very few micro or small enterprises spend money on professional services or on software
and systems, yet medium and large firms increasingly rely on professional services in case
of an audit.
The World Bank Doing Business indicators may significantly underestimate the burden of
paying taxes in Ghana, and indeed this has been demonstrated as Ghana’s performance
on this indicator has fallen with the introduction of an audit section in the methodology.
The Government of Ghana should address the factors contributing to the cost of paying
taxes and responding to an audit, including taking measures to reduce the number of
audits that take place.

FutureTest Ghana Business Enabling Environment Programme (BEEP) Monitoring and Evaluation Support, Phase 3 – Project Completion Report
22
4. Construction permits component
4.1 Estimated cost of compliance
4.1.1 Compliance cost methodology
Similar to the Tax Component, the BEEP survey data on registered businesses within the
Tema and Accra Metropolis in the Greater Accra Region of Ghana is used to estimate the cost
of compliance for obtaining a construction permit.7 The final survey data presents responses
for 85 firms, of which 10 are located in the Tema Metropolis and 75 in the Greater Accra
Region outside the Tema Metropolis,8 which is used to calculate Ghanaian firms’ compliance
cost of applying for construction permits. Three-quarters of the surveyed firms are micro or
small-sized. The Technical Annex provides further information on the demographics of
businesses selected for the tax component.
4.1.2 Estimates of firm-level compliance costs for construction permits
The BEEP Baseline Survey calculates both the direct costs of obtaining a construction permit
and the opportunity cost to businesses waiting for a new premise. Direct compliance costs are
shown for micro- and small-sized firms in Table 8, and for medium- and large-sized firms in
Table 9.
For the construction permit component, the baseline survey estimated the median cost of
compliance for applying for a construction permit for micro and small businesses was GHS
9,720 (mean GHS 12,133), plus an average of GHS 1,972 of opportunity costs for delay. The
median cost of compliance for a construction permit for medium and large businesses was
GHS 10,900 (mean GHS 12,587), plus an average of GHS 196,643 of opportunity costs for
the delay.
7 See Department for International Development (2017), “DFID Business Enabling Environment Programme Baseline Survey.” Id., at p. 3.
8 Of these 85 firms, 8 are located in the Tema Metropolis and 77 in the Greater Accra Region outside the Tema Metropolis.

FutureTest Ghana Business Enabling Environment Programme (BEEP) Monitoring and Evaluation Support, Phase 3 – Project Completion Report
23
Table 8: Summary Statistics of Firm-level Direct Compliance Costs of Applying for the Most
Recent Construction Permit: Micro- and Small-Sized Firms (N = 61)
Administrative Compliance Cost
Component
25th Percentil
e Median
75th Percentil
e Mean
Standard
Deviation
Minimum
Maximum
Staff time (days) 24.0 49.0 108.0 75.4 80.7 3.0 365.0
Staff costs (GHS) 0.0 500.0 1,000.0 861.4 1,285.0 0.0 7,000.0
Proof of land deed and copies of land title (GHS)
150.0 950.0 3,300.0 1,795.9 2,049.8 0.0 8,500.0
Detailed drawing / design (GHS)
1,200.0 2,500.0 5,000.0 3,515.6 3,301.3 0.0 13,500.0
Fire report (GHS) 50.0 1,000.0 2,600.0 1,765.3 2,157.3 0.0 10,000.0
Traffic Impact Assessment report (GHS)
0.0 0.0 300.0 232.0 482.7 0.0 3,000.0
Hydrological report (GHS) 0.0 0.0 300.0 232.0 414.5 0.0 2,000.0
Environmental Impact Assessment report (GHS)
50.0 500.0 800.0 535.5 490.7 0.0 2,500.0
Geo-technical report (GHS) 0.0 0.0 450.0 249.8 374.2 0.0 1,500.0
Site visits, including post-permit (GHS)
0.0 200.0 1,300.0 925.4 1,644.5 0.0 9,100.0
Submission, response to queries, payment of permit fees, and any other required documentation (GHS)
1,000.0 1,300.0 2,460.0 1,892.2 1,660.9 0.0 9,000.0
Certificate of Habitation (GHS)
0.0 0.0 0.0 127.7 316.6 0.0 1,500.0
Total Administrative Costs (GHS)/1
7,800.0 9,720.0 16,150.0 12,132.8 6,795.2 1,200.0 36,300.0
Source: BEEP Baseline Survey. There are 61 micro- and small-sized firms.
Notes:
/1 Total costs do not include staff time.

FutureTest Ghana Business Enabling Environment Programme (BEEP) Monitoring and Evaluation Support, Phase 3 – Project Completion Report
24
Table 9: Summary Statistics of Firm-level Administrative Compliance Costs of Applying for the
Most Recent Construction Permit: Medium- and Large-Sized Firms (N = 20)
Administrative Compliance Cost
Component 25th
Percentile Median 75th
Percentile Mean Standard Deviation Minimum Maximum
Staff time (days) 24.0 32.5 80.0 61.2 58.7 5.0 183.0
Staff costs (GHS) 0.0 350.0 1,250.0 940.0 1,697.2 0.0 7,500.0
Proof of land deed and copies of land title (GHS)
0.0 125.0 1,250.0 931.0 1,566.4 0.0 5,900.0
Detailed drawing / design (GHS)
0.0 3,000.0 9,800.0 4,467.5 4,405.3 0.0 10,500.0
Fire report (GHS) 750.0 1,500.0 4,000.0 2,170.0 1,906.5 0.0 5,800.0
Traffic Impact Assessment report (GHS)
0.0 0.0 500.0 307.5 545.9 0.0 2,000.0
Hydrological report (GHS)
0.0 0.0 150.0 147.5 284.0 0.0 1,000.0
Environmental Impact Assessment report (GHS)
0.0 475.0 1,000.0 587.5 603.3 0.0 2,000.0
Geo-technical report (GHS)
0.0 0.0 400.0 462.0 924.3 0.0 3,800.0
Site visits, include post-permit (GHS)
0.0 75.0 1,200.0 536.5 722.3 0.0 1,980.0
Submission, response to queries, payment of permit fees, and any other required documentation (GHS)
812.5 1,450.0 2,270.0 1,890.3 1,585.0 0.0 6,626.0
Certificate of Habitation
0.0 0.0 0.0 147.5 444.1 0.0 1,800.0
Total Administrative Costs (GHS)/1
7,365.0 10,900.0 16,400.0 12,587.3 9,032.9 0.0 37,600.0
Source: BEEP Baseline Survey. There are 20 medium- and large-sized firms.
Notes:
/1 Total costs do not include staff time.
For 72 of the 81 firms in the sample, the construction permit application was for a new building
(as opposed to a renovation or a demolition). The BEEP Baseline Survey provides data on
the opportunity costs relating to the delay in obtaining construction permits. In particular, the
BEEP survey participants report whether the construction project undertaken led to an
increase in the percentage of persons employed, sales volume, or both. Table 10 shows the

FutureTest Ghana Business Enabling Environment Programme (BEEP) Monitoring and Evaluation Support, Phase 3 – Project Completion Report
25
summary statistics of these percentage increases.
Table 10: Summary Statistics of Reported Increase (%) in Employees, Sales, and Turnover
Firm Size
Firm Outcom
e
Number of Firms
that report a positive percenta
ge increase
Summary Statistics of the Reported Percentage Increase
25th Percenti
le Media
n
75th Percenti
le Mea
n
Standard
Deviation
Minimum
Maximum
Micro- and Small-Sized Firms (N = 61)
Employees
24 4.5 10 20 19.9 23.1 2 100
Sales Volume
25 10 15 30 21.1 17.6 2 70
Turnover 29 5 15 25 19.2 17.0 1 70
Medium- and Large-Sized Firms (N = 20)
Employees
10 6 27 50 27.9 20.7 4 50
Sales Volume
11 10 20 20 18.1 11.4 4 40
Turnover 10 5 15 20 17.4 14.1 4 50
Source: BEEP Baseline Survey.
4.1.3 Variation by business
In this subsection, the variation in per-application and overall annual compliance costs by firm
size and firm age is examined. Table 11 presents average per-application compliance costs
for the various administrative cost components of the surveyed firms, when firms are grouped
by size.
Table 11: Average Per-Application Construction Permits Compliance Costs by Firm Size
Cost Component Micro (N = 27) Small (N = 34) Medium (N = 13) Large (N = 7)
Administrative Costs
Staff time (days) 82.0 70.1 64.7 54.7
Staff costs (GHS) 1,104.7 668.2 1,176.9 500.0
Proof of land deed and copies of land title (GHS)
2,010.4 1,625.6 1,405.4 50.0
Detailed drawing / design (GHS) 3,003.7 3,922.2 5,588.5 2,385.7
Fire report (GHS) 2,060.4 1,530.9 1,861.5 2,742.9
Traffic Impact Assessment report (GHS)
340.7 145.6 369.2 192.9
Hydrological report (GHS) 300.0 177.9 138.5 164.3

FutureTest Ghana Business Enabling Environment Programme (BEEP) Monitoring and Evaluation Support, Phase 3 – Project Completion Report
26
Cost Component Micro (N = 27) Small (N = 34) Medium (N = 13) Large (N = 7)
Environmental Impact Assessment report (GHS)
668.1 430.1 488.5 771.4
Geo-technical report (GHS) 299.6 210.3 403.8 570.0
Site visits, include post-permit (GHS)
1,468.5 494.1 490.8 621.4
Submission, response to queries, payment of permit fees, and any other required documentation (GHS)
2,397.9 1,490.6 2,048.5 1,596.4
Certificate of Habitation 190.4 77.9 73.1 285.7
Total Administrative Compliance Costs
13,844.5 10,773.5 14,044.7 9,880.7
Opportunity Costs of Delay 2,555.7 1,509.0 190,226.6 208,561.6
Total Per-Application Compliance Costs
16,400.2 12,282.5 204,271.2 218,442.4
Source: BEEP Baseline Survey
Higher per-application compliance costs of larger firms are driven by the higher opportunity
costs of delay of the larger firms, which is in turn driven by the higher turnover of larger firms.
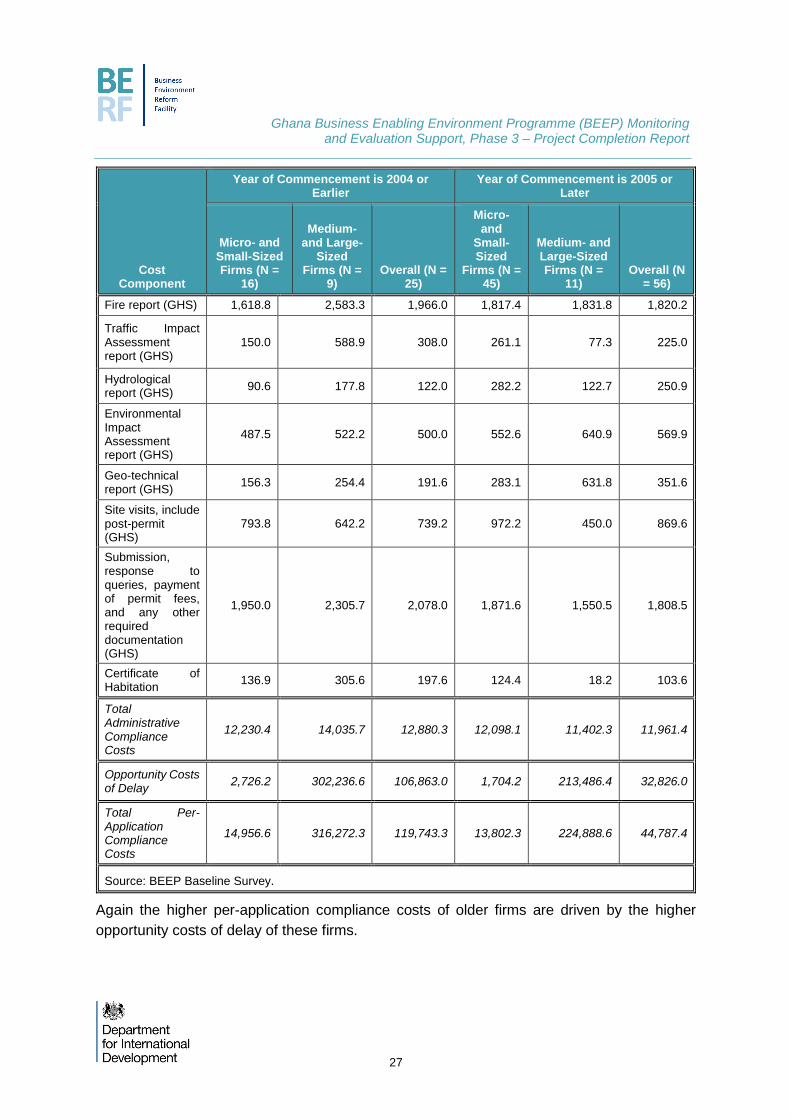
Table 12 presents average per-application compliance costs for the various administrative
cost components of the surveyed firms, when firms are grouped by firm age as well as firm
size.
Table 12: Average Per-Application Construction Permits Compliance Costs by Firm Age and
Firm Size
Cost Component
Year of Commencement is 2004 or Earlier
Year of Commencement is 2005 or Later
Micro- and Small-Sized Firms (N =
16)
Medium- and Large-
Sized Firms (N =
9) Overall (N =
25)
Micro- and
Small-Sized
Firms (N = 45)
Medium- and Large-Sized Firms (N =
11) Overall (N
= 56)
Administrative Costs
Staff time (days) 100.1 48.4 81.5 66.6 71.6 67.6
Staff costs (GHS) 1,046.0 1,333.3 1,149.4 795.8 618.2 760.9
Proof of land deed and copies of land title (GHS)
1,463.1 1,411.1 1,444.4 1,914.2 538.2 1,643.9
Detailed drawing / design (GHS)
4,337.5 3,911.1 4,184.0 3,223.4 4,922.7 3,557.2
FutureTest Ghana Business Enabling Environment Programme (BEEP) Monitoring and Evaluation Support, Phase 3 – Project Completion Report
27
Cost Component
Year of Commencement is 2004 or Earlier
Year of Commencement is 2005 or Later
Micro- and Small-Sized Firms (N =
16)
Medium- and Large-
Sized Firms (N =
9) Overall (N =
25)
Micro- and
Small-Sized
Firms (N = 45)
Medium- and Large-Sized Firms (N =
11) Overall (N
= 56)
Fire report (GHS) 1,618.8 2,583.3 1,966.0 1,817.4 1,831.8 1,820.2
Traffic Impact Assessment report (GHS)
150.0 588.9 308.0 261.1 77.3 225.0
Hydrological report (GHS)
90.6 177.8 122.0 282.2 122.7 250.9
Environmental Impact Assessment report (GHS)
487.5 522.2 500.0 552.6 640.9 569.9
Geo-technical report (GHS)
156.3 254.4 191.6 283.1 631.8 351.6
Site visits, include post-permit (GHS)
793.8 642.2 739.2 972.2 450.0 869.6
Submission, response to queries, payment of permit fees, and any other required documentation (GHS)
1,950.0 2,305.7 2,078.0 1,871.6 1,550.5 1,808.5
Certificate of Habitation
136.9 305.6 197.6 124.4 18.2 103.6
Total Administrative Compliance Costs
12,230.4 14,035.7 12,880.3 12,098.1 11,402.3 11,961.4
Opportunity Costs of Delay
2,726.2 302,236.6 106,863.0 1,704.2 213,486.4 32,826.0
Total Per-Application Compliance Costs
14,956.6 316,272.3 119,743.3 13,802.3 224,888.6 44,787.4
Source: BEEP Baseline Survey.
Again the higher per-application compliance costs of older firms are driven by the higher
opportunity costs of delay of these firms.

FutureTest Ghana Business Enabling Environment Programme (BEEP) Monitoring and Evaluation Support, Phase 3 – Project Completion Report
28
4.2 Estimates for Greater Accra / Ghana
In order to estimate the compliance costs of applying for construction permits, data on per-
firm estimates of compliance costs relating to firms’ most recent application for a construction
permit is first derived. These per-firm estimates are then further used to derive annual
estimates of compliance costs for Greater Accra and Ghana at large. Details of this
methodology are available in the Technical Annex.
Table 13 shows the estimated compliance cost ranges for Greater Accra and Ghana
respectively using the methodology described. An estimated range of GHS 3.8 million to 7.1
million for the Greater Accra region, and GHS 11.6 million to 20.1 million for Ghana, including
both the cost of compliance and opportunity costs of businesses affected.
Table 13: Annual Compliance Costs Range Estimates for Local Licenses Component (GHS mil)
Region Lower Bound of Range Upper Bound of Range
Greater Accra 3.8 7.1
Ghana 11.6 20.1
Source: BEEP Survey data; GSS Report (2015), GSS Report, GSS CPI data.
4.3 Comparison with World Bank test case
In its Doing Business (2016) report, the World Bank estimates the compliance cost of dealing
with the formalities involved in building a warehouse in Ghana.9 According to the World Bank,
dealing with construction permits “requires 14 procedures, takes 170 days and costs 2.9
percent of the warehouse value [or GHS 7,173].”10
The BEEP survey found a maximum number of 12 procedures for the construction permit
process. However, as some of the procedures identified by the World Bank occurred
simultaneously with no added cost, the findings are similar.
The average number of days taken by medium size surveyed firms to comply with construction
permit application procedures is 64.7 days. Note that the World Bank’s estimate of 216 days
applies to time elapsed between application and granting of the permit, rather than the number
of staff days taken to comply, so these figures are not directly comparable.
The BEEP survey also found that the average administrative cost per application was around
50% higher than what the World Bank findings suggest, although warehouses are relatively
simple building projects and the survey did not restrict its findings to these types of
9 See Doing Business Report, at p. 26. The World Bank’s related indicators “are based on a set of specific procedures—the steps that a company must complete to legally build a warehouse—identified by
Doing Business through information collected from experts in construction licensing, including architects, civil engineers, construction lawyers, construction firms, utility service providers and public officials
who deal with building regulations. These procedures are those that apply to a company and structure matching the standard assumptions used by Doing Business in collecting the data.” Id., at p. 29.
10 See World Bank Doing Business Report 2017, at p. 12.

FutureTest Ghana Business Enabling Environment Programme (BEEP) Monitoring and Evaluation Support, Phase 3 – Project Completion Report
29
construction. However, the survey also demonstrated that the opportunity cost of waiting for
the permit could be at least as much as the administrative cost, and in the case of medium
and large companies could be much larger.
4.4 Construction permits component - Conclusions and recommendations
4.4.1 Conclusions
The BEEP survey data on Construction Permits provides data on administrative and
opportunity costs of dealing with construction permits. According to the survey, firms in
Greater Accra undertake up to 12 procedures in applying for construction permits,
requiring 72 days of staff time on average to complete.
The baseline survey estimated the median cost of compliance for applying for a
construction permit for micro and small businesses was GHS 9,720 (mean GHS 12,133),
plus an average of GHS 1,972 of opportunity costs for delay. The median cost of
compliance for a construction permit for medium and large businesses was GHS 10,900
(mean GHS 12,587), plus an average of GHS 196,643 of opportunity costs for the delay.
The total cost of compliance was not substantially different among firm sizes. This likely
reflects the fact that the steps in the procedure are based on the proposed project and are
the same regardless of business size. The slightly higher cost for medium and large
enterprises may reflect their likelihood of submitting more complex projects, requiring more
to be spent on architectural drawings, etc.
These data were used to estimate the overall cost of compliance for businesses applying
for a construction permit in Greater Accra and across Ghana. These estimates range from
GHS 3.8 million to 7.1 million for the Greater Accra Region, and GHS 11.7 million to 20.1
million across Ghana.
The BEEP Survey Data suggests that the cost of compliance for the construction
component is about the same for companies regardless of size. However medium and
large companies had much higher opportunity costs of delay because their turnover was
much larger.
There was no direct evidence to show that the cost of compliance was significantly different
for enterprises what were solely or jointly owned by foreigners or women. These findings
were validated by workshop participants who suggested there was no systemic reason
why females or foreigners should be discriminated against in applying for construction
permits. However, analysis was limited because these companies represented less than
10% of the sample.
Data from the Integrated Business Establishment Survey (IBES) suggest that foreigners
are 2-3 times more likely to own a medium or large enterprise than a small or micro
enterprise, and that females are more likely to work in micro enterprises. This means that

FutureTest Ghana Business Enabling Environment Programme (BEEP) Monitoring and Evaluation Support, Phase 3 – Project Completion Report
30
the cost of compliance for foreign and female owned businesses may be different based
on the size of the business they are likely to own.
In spite of the high compliance costs, 55 percent of establishments surveyed said that the
permitted project provided an economic benefit to the business. Further, completed
construction projects resulted in an average increase of 14.4 employees, with a median of
4.5 employees, and/or a 13.4 percent increase in sales volume or turnover, with a median
increase of 10 percent. Two-thirds of these businesses benefitted from both increased
headcount and sales volume or turnover.
4.4.2 Recommendations
The only categories in which micro and small enterprises spent significantly more than
medium and large companies was on proof of land deed and staff time (days). The first
suggests that micro and small enterprises may face problems producing a land deed, and
the second suggests that these firms may be less familiar with the application process and
so take somewhat longer. The programme should consider what additional support can
be provided to micro and small enterprises in obtaining a construction permit, particularly
as this may signal that these businesses are growing their turnover or number of
employees and are progressing towards medium-sized businesses.
Anecdotal evidence from the survey team suggested that a large proportion of firms
surveyed outsourced the construction permit process, possibly to the firm constructing the
building. However questions about outsourcing the permitting process were not asked
explicitly on the survey. The prevalence, cost and affordability of outsourcing the
construction permit process could be explored in greater depth.
Analysis of the data suggests that the World Bank Doing Business indicator does not capture
the full cost of applying for a construction permit and the biggest cost of construction permits
is in the form of delayed opportunities for medium and large businesses to grow. Reforms in
this area would likely benefit a small number of businesses but the gains in revenue (and taxes
paid) as well as increased employment are substantial.
5. Commercial courts component
5.1 Estimated cost of compliance
The estimated cost of compliance for commercial courts was not able to be calculated, due to
the refusal of most of the businesses approached to disclose information on the value of the
claim in dispute and associated costs. For details of the procedure followed and rates of
refusal, see the Technical Annex. Businesses were eventually asked a shorter set of questions
on their use and attitudes towards the court system.

FutureTest Ghana Business Enabling Environment Programme (BEEP) Monitoring and Evaluation Support, Phase 3 – Project Completion Report
31
5.2 Use of the court system
5.2.1 Approximate value of the claim, by type of claim
Table 14 below shows the average cost of the claim by the method used to resolve the dispute.
High-value disputes (above GHS 100,000) tended to be resolved between parties themselves,
by arbitration, or through the commercial division of the high court. Low-value disputes (below
GHS 30,000) tended to be resolved through the district court, the circuit court, or through
mediation.
Table 14: Average value of claim, by venue
Which of the following methods did you use to resolve the dispute?
Average cost of amount in dispute
Parties resolved between themselves 113,979
Mediation (non-binding resolution outside the court system. 15,000
Arbitration (binding resolution outside court system) 587,500
Circuit court 22,576
District Court 26,808
Commercial division of the High Court 230,938
Higher Court 61,500
Others 35,000
Table 15 indicates that the median value of the claim was between GHS 10,000 and 20,000.
About 61 percent of claims were below GHS 50,000, the upper threshold for the circuit court,
and 42 percent of claims were below GHS 20,000, the threshold for the district court.
Two-thirds (67%) of the disputes were resolved through the court system. Most disputes were
resolved in the district court (29%), followed by the circuit court (15%). Twenty-seven percent
of respondents chose to resolve the issue among themselves. Few parties chose to resolve
disputes through mediation or arbitration.
The major issue of dispute is on loan default (84%), followed by land litigation (7%), and other
disputes (8%).

FutureTest Ghana Business Enabling Environment Programme (BEEP) Monitoring and Evaluation Support, Phase 3 – Project Completion Report
32
Table 15: Methods of Resolving Dispute by Cost
Which of the following methods did you use to resolve the dispute?
What was the amount in dispute?
Total
Between GHS, 2,000 and GHS 5,000
Between GHS GHS 5,000 and GHS 10,000
Between GHS, 10,000 and GHS 20,000
Between GHS 20,000 and GHS 50,000
Between GHS 50,000 and GHS 100,000
Between GHS 100,000 and GHS 250,000
Between GHS 250,000 and GHS 500,000
Between GHS 500,000 and GHS 1 million
Over GHS 1 million
Parties resolved between themselves
3 2 7 3 3 3 2 0 1 24
Mediation (non-binding resolution outside the court system.
0 0 1 0 0 0 0 0 0 1
Arbitration (binding resolution outside court system)
0 0 0 0 0 1 0 0 1 2
Circuit court 1 4 5 1 2 0 0 0 0 13
District Court 2 4 12 3 5 0 0 0 0 26
Commercial division of the High Court
0 0 0 7 3 2 1 2 1 16
Higher Court 0 1 1 1 1 1 0 0 0 5
Other (specify) 0 0 0 2 0 0 0 0 0 2
Total 6 11 20 17 14 7 3 2 3 89

FutureTest Ghana Business Enabling Environment Programme (BEEP) Monitoring and Evaluation Support, Phase 3 – Project Completion Report
33
5.2.2 Factors associated with the choice of venue for Dispute Resolution
Only one factor was statistically significant after the analysis with methods of resolving
disputes. The method chosen to resolve disputes was primarily because of the certainty of
decision by the court from our logistic regression. Those who were certain about the court
decision were about 3.29 times to use the court system more than those who are not certain.
No other factor was significant at 0.05 significant level.
5.3 Opinions of the Ghanaian Commercial Court System
The BEEP survey data presents data on the general opinion of the court system. These
include relevant knowledge of the cases, length of time taken to resolve disputes, cost of court
fees and attorney fees as well as satisfaction. These are used to assess the general
satisfaction with the court system in Ghana.
5.3.1 Opinions of the court system, by various factors
The table below shows the levels of positive responses to various aspects of Ghana’s court
system. Scores range from 5, e.g. ‘very high’ or ‘very certain’ for positive factors or ‘very
inexpensive’ for negative factors, to 1.
Table 16: Opinions of various aspects of the court system
Factor % positive Score
Level of knowledge of judges on relevant aspects of commercial law 93% 4.2
Certainty that court’s decision won’t change 87% 4.3
Availability of good legal advice 79% 4.0
Opinion of Ghana’s court system for resolving commercial disputes 41% 3.0
Overall satisfaction with the outcome 28% 2.5
Ability to enforce judgment once obtained 27% 2.4
Cost of court fees 20% 1.6
Cost of attorney’s fees 19% 1.5
Length of time taken to resolve a dispute 9% 1.3
Respondents’ attitudes were clearly positive towards the level of knowledge of judges on
relevant aspects of commercial law, certainty that a court’s decision won’t change, and
availability of good advice. They were clearly negative on the court’s ability to enforce
judgment once obtained, the cost of court fees, cost of attorney’s fees, and length of time
taken to resolve a dispute, for which only 9% of respondents saw as positive.
5.4 Commercial courts component - Conclusions and recommendations
5.4.1 Conclusions
The median value of commercial disputes reported by businesses surveyed was between
GHS 10,000 and GHS 20,000. About 61% of claims were below GHS 50,000, the upper
threshold for the circuit court, and 42% of claims were below GHS 20,000, the threshold

FutureTest Ghana Business Enabling Environment Programme (BEEP) Monitoring and Evaluation Support, Phase 3 – Project Completion Report
34
for the district court. 30% of claims under GHS 50,000 were settled out of court, but mostly
by the parties themselves - only one of these was settled by arbitration or mediation.
Data on claims over 100,000 are limited, as they represented less than 9% of the total
claims. However, limited data suggest that these cases were as likely as not to be settled
outside of court as in the commercial division of the high court.
5.4.2 Recommendations
The inability of the baseline survey to gather enough information to estimate the cost of
compliance highlights the sensitivity of this area to parties in a dispute, and suggests that
the parties themselves may not be the best source of this information. The court is
developing its own monitoring, evaluation, and reporting system which may better capture
the current costs associated with bringing a claim in the Ghanaian court system.
Prior design work has recognised court enforcement and length of time taken to resolve a
dispute as areas for improvement, but negative attitudes towards the costs of both court
fees and attorney’s fees from the perspective of decreasing the cost of compliance suggest
that the court could take measures to address these as well.
Despite moderate opinions as to the effectiveness of the court system and satisfaction
with the outcomes, there is ample evidence that many parties turn to the court system to
resolve matters under GHS 50,000 and under GHS 20,000. This, coupled with issues
around the current cost of court fees and attorney’s fees, lend support to the creation of a
small claims court or small claims procedures designed to reduce the costs involved in
bringing a claim and length of time taken to resolve a dispute.
6 Business confidence surveys
6.1 Overall and by sector
One of the recommendations for programme monitoring and evaluation in the inception phase
was to explore different ways of measuring business confidence. The programme logframe
identified the Association of Ghana Industries (AGI) annual business confidence index as a
source for tracking business confidence, but the M&E report noted that the methodology used
for this index was not transparent and the index may be limited to a single question. The
baseline survey therefore provided an opportunity to demonstrate the value of adding
questions to this index, including questions specific to the service, manufacturing, and
construction sectors, modelled after business confidence surveys used by OECD and EU. The
questions in this index can be found in the Technical Annex.

FutureTest Ghana Business Enabling Environment Programme (BEEP) Monitoring and Evaluation Support, Phase 3 – Project Completion Report
35
The BEEP survey included a section on business confidence, which includes survey questions
of firms’ subjective assessment of the ease of doing business, as well as sector-specific
subjective assessment questions for firms in the construction, manufacturing, and service
sectors. This is section details the general business confidence in the Ghanaian economy.
The BEEP Ghana programme has supported regulatory reform work in this regard. The BEEP
taxation, construction permits, and commercial courts surveys yield data for 254 companies,
of which 246 belong to the construction, manufacturing, or service sectors.
An “overall assessment of the investment climate Ghana in the past 3 months” was first
tabulated. 60.2 percent of firms indicated that their assessment of the ease of doing business
in Ghana in the past 3 months was that it had stayed the same, 24.5 percent of firms indicated
that it had gotten worse, and 15.4 percent responded that it improved. See the Technical
Annex for details of the responses.
Firms were also asked specific questions based on the sub-sector to which they belonged –
services, manufacturing, and construction. Over 90 percent of the firms surveyed were
services companies.
Amongst services companies over 50 percent of the firms provided a neutral response: 58
percent of the services companies answered that their business situation over the past 3
months stayed unchanged, 53 percent answered that the demand for their services stayed
the same over the past 3 months, 77 percent indicated that there was no change in total
employment over the past 3 months, and 58 percent answered that they did not predict a
change in total employment over the next three months.
Furthermore, high cost of utilities, high levels of taxes, and delayed payments were the three
problems most frequently listed by services firms as the biggest problems they faced in the
last 3 months. Note that the neutrality of responses is reflected in firms’ overall assessment of
the ease of doing business in Ghana in the past 3 months: 60 percent of services firms
indicated that their assessment had stayed the same.
Although samples sizes for construction and manufacturing firms were too small for results to
be reliably reported, for both construction and manufacturing firms, high cost of utilities,
exchange rates and inflation, and delayed payments were the three problems most frequently
listed by services firms as the biggest problems they faced in the last 3 months.
Table 17: Analysis of Service Sector Responses to Sector Specific Subjective Assessment Questions
Survey Question Response
Services (N = 233)/1
Overall assessment of the ease of doing business in Ghana in past 3 months
Gotten better 35
Stayed the same 58.4%
Gotten worse 23.6%
Improved 20.2%

FutureTest Ghana Business Enabling Environment Programme (BEEP) Monitoring and Evaluation Support, Phase 3 – Project Completion Report
36
Survey Question Response
Services (N = 233)/1
Business situation over past 3 months
Stayed unchanged 53.2%
Deteriorated 18.5%
Change in demand (turnover) for company's services over past 3 months
Increased 23.6%
Stayed the same 48.5%
Decreased 19.7%
Change in total employment over past 3 months
Increase 12.4%
Stay the same 72.1%
Decrease 8.6%
Change in total employment over next 3 months
Increase 30.5%
Stay the same 52.4%
Decrease 6.9%
Three biggest problems or issues you faced in the last 3 months/1
High cost of utilities, including electricity and water 81.1%
Delayed payments 52.4%
High levels of taxes, including VAT, corporate, payroll 45.5%
Exchange rates, value of the cedi, more expensive imports 30.0%
Access to credit / finance 21.5%
Burden of paying taxes, high number of taxes 12.9%
Customs and trade regulations 8.2%
Corruption, unauthorized payments 6.0%
Competition from imported goods 3.9%
Other 3.0%
1 Note firms could give up to three responses.
6.2 Comparison with AGI Business Confidence survey and other measures
The Association of Ghana Industries (AGI) publishes quarterly “Business Barometer” reports
which present a summary of Ghanaian firms’ business confidence, based on a survey of
Ghanaian “captains of industry.”11 In particular, the report presents the “Business Barometer
Indicator” (BBI), which “measures the level of confidence in the business environment and
predicts short-term business trend.”12 The report also presents firms’ overall performance of
11 See AGI BB Report, 2016 Q1, at p.1. 12 See AGI BB Report, 2016 Q1, at p.1. According to AGI, “the [BBI] is an AGI proprietary tool that measures the level of confidence in the business environment and predicts short-term business trend. It simply expresses the state of the business climate numerically in one figure (index) with 100 as the base index.” See AGI BB Report, 2014 Q1, at p.1.

FutureTest Ghana Business Enabling Environment Programme (BEEP) Monitoring and Evaluation Support, Phase 3 – Project Completion Report
37
their business as well as the major challenges faced by firms. The findings of the 2016 reports
are presented in the Table 18.
The AGI BBI ranges from 98.5 to 101.9 across the four quarters, indicating very little variation
around the base index of 100. According to the BEEP survey, 60.1 percent of surveyed firms
indicated that their assessment of the ease of doing business environment in Ghana had
remained the same, similarly indicating neutrality of the business climate. The AGI survey
results on business performance are similar to the findings of the BEEP survey. According to
the BEEP survey, 57.9 percent of the services companies answered that their business
situation over the past 3 months stayed unchanged and 52.8 percent indicated that there was
no change in demand for their services over past 3 months. According to the AGI survey, the
percentage of captains of industry (across manufacturing, services, and construction sectors)
who find that their overall business performance stayed the same in the current quarter relative
to the previous quarter ranged from 42 percent to 50 percent over the four quarters.
AGI survey results on employer’s hiring optimism over the next 6 months mirror the results of
the BEEP survey. According to the AGI survey, the percentage of employers who expect hiring
to (1) increase ranges across the four quarters from 30 percent to 39 percent, (2) remain the
same ranges from 54 percent to 61 percent, and (3) to decrease ranges from 7 percent to 12
percent. According to the BEEP survey, 35.7 percent of surveyed companies expect total
employment to change over the next three months, 57 percent expect it to remain the same,
and 7.2 percent expect it to decrease. Finally, similar to the BEEP survey, the AGI survey also
identifies high utilities costs, tax burdens, and delayed payments among the major problems
faced by services companies.
Table 18: Overall Business Performance
6.3 Factors significantly correlated with optimism / pessimism
Since the sample of services firms is large enough, the relationship between the issues
identified by firms and their responses to the subjective assessment questions is examined.
To do so, a correlation analysis was performed against a pessimistic response and
2016 Quarte
r
AGI Business Baromete
r Indicator (Base =
100)
Overall Business Performance (%)
Change in Employment Over the Next 6 Months
Current Situation (current quarter
relative to previous quarter)
Expectation (next quarter relative to current quarter)
Better
Same
Worse
Better
Same
Worse
Increase
Remain
Same Decreas
e
1 101.9 37 42 21 61 33 6 31 57 12
2 98.5 29 50 21 54 37 9 31 57 12
3 99.0 31 45 24 57 37 6 30 61 9
4 101.6 30 45 25 70 26 3 39 54 7

FutureTest Ghana Business Enabling Environment Programme (BEEP) Monitoring and Evaluation Support, Phase 3 – Project Completion Report
38
identification of a particular problem or issue faced in the past three months. See the Technical
Annex for details of how this analysis was performed.
High costs of utilities, high levels of taxes, and delayed payments have a statistically significant
impact on firms’ negative overall assessment of the business climate and the pessimistic
subjective assessment of their performance and outlook. The table below summarizes the
findings of the correlation and regression analyses.
Table 19: Problems correlated with negative assessment of business climate
Subjective assessment question
Biggest problem(s) faced in the last 3 months significantly correlated with pessimistic
response to subjective assessment question/1
Overall assessment of the ease of doing business in Ghana in past 3 months High cost of utilities, including electricity and water/1
Business situation over past 3 months High levels of taxes, including VAT, corporate, payroll/2
Change in demand (turnover) for company's services over past 3 months
High levels of taxes, including VAT, corporate, payroll/2;
Competition from imported goods/1
Change in total employment over past 3 months/2 High levels of taxes, including VAT, corporate, payroll/2
Change in total employment over next 3 months
High cost of utilities, including electricity and water/2;
Delayed payments/1
Source: BEEP survey data; only services firms considered.
Notes:
/1 Relationship identified by both correlation and logit regression analysis.
/2 Relationship identified by correlation analysis only.
/3 Relationship identified by logit regression analysis only.
6.4 Business confidence survey - Conclusions and recommendations
6.4.1 Conclusions
The BEEP survey of firms’ subjective assessment of business performance and outlook, and
overall assessment of the ease of doing business in Ghana yields insight into the economic
drivers of firms’ business optimism.
Analysis of BEEP survey data shows that a majority of the surveyed firms, over 60 percent,
assess the ease of doing business in Ghana as having stayed the same over the past
three months. Only 15.5 percent of surveyed firms assessed the ease of business as
having gotten better, and 24.4 percent of firms actually indicate that the ease of business
has gotten worse.
Furthermore, according to the BEEP survey, over 50 percent of the services companies13
provided for the neutral response for each of the subjective business-performance
13 The BEEP survey presents business confidence data for 246 construction, manufacturing, and services firms. Of these 246 firms, 233 (or 94.7%) are services firms.

FutureTest Ghana Business Enabling Environment Programme (BEEP) Monitoring and Evaluation Support, Phase 3 – Project Completion Report
39
assessment questions: 58 percent indicated that their business situation over the past 3
months stayed unchanged, 53 percent stated that demand for their services stayed the
same over the past 3 months, 77 percent responded that there was no change in total
employment over the past 3 months, and, finally, 58 percent answered that they did not
predict a change in total employment over the next three months.
6.4.2 Recommendations
According to the BEEP survey, this “cautious pessimism” may be driven by the high costs
of utilities, high levels of taxes, and delayed payments: These three problems most
frequently listed by services firms as the biggest problems they faced in the last 3 months.
These findings are consistent with those of the Association of Ghanaian Industries, as
presented in their Business Barometer report. Thus, regulatory reforms and effective
enforcement that would reduce utilities costs,14 reduce tax burdens, and facilitate timely
payments would go a long way towards improving the business environment.
There is a high degree of correlation between the findings of the BEEP business
confidence module and the AGI ‘Business Barometer’. However, the BEEP business
confidence module includes more questions and sector-specific questions which permit
more variance in the index and more analysis by factor and sub-sector.
The AGI remains the preferred source of business confidence information because it is long-
running and administered each quarter; however, the index could be improved by adding
questions on additional factors of business confidence, including in the regulatory
environment, and sector-specific factors. Its representativeness could also be improved by
administering the survey to a representative sample of businesses outside of its immediate
membership.
14 For example, according to the “[World Bank], Ghana’s relative high cost of power is based on the adoption of sole sourcing in the granting of power purchase agreements” and it “advised the [Ghanaian government] to limit sole sourcing in the awarding of government contracts.” See https://www.primenewsghana.com/business/world-bank-advises-ghana-against-sole-sourcing.html.

FutureTest Ghana Business Enabling Environment Programme (BEEP) Monitoring and Evaluation Support, Phase 3 – Project Completion Report
40
Appendix 2 Ghana Business Enabling Environment Programme: Baseline report on the cost of compliance in target regulatory areas - Technical Annex
1. Overview
This Technical Annex presents the methodology and additional findings of the Baseline Report
in detail. It is arranged to correspond to the various sections in the Baseline Report.
1.1 Methodology
Compliance Cost Methodology (CCM) provides an approach to monitoring the efficiency and
effectiveness of Ghana BEEP across all reform areas at programme level. CCM allows the
programme to quantify and monetise the costs of selected regulations and cost savings
associated with various intervention areas. CCM can also be used to aggregate outputs across
components for a measure of programme level outcomes. Some intervention components,
such as the current Commercial Justice and Contract Enforcement component, are not
actually regulatory in the sense that they do not apply to all businesses and alternatives for
resolving commercial disputes available. However, CCM can still be applied to understand the
costs, including opportunity costs, of court delays for claimants and the court itself.
In theory, CCM measures only substantive compliance costs associated with regulations. An
assessment of Ghana BEEP shows that interventions may affect not only direct substantive
compliance costs, in the form of fees and information required, but also opportunity costs
incurred through delays in processing applications or rendering judgments. Moreover,
efficiency gains in administration and enforcement processes may have significant impact on
the regulating agencies themselves. The methodology for measuring compliance cost savings
at outcome level has therefore been widened to assess other costs associated with the
regulatory environment. These include other costs borne by the businesses being regulated,
including opportunity costs incurred by regulatory delays. They also include measuring the
cost of administration and enforcement of the regulation by the agencies themselves.
1.1.1 Pilot of Survey Instruments
Three separate questionnaires were devised for each of the three initial target reform areas
and shared with Implementing Agency representatives to refine the questionnaires further.
Subsequently two levels of pre-test of survey instruments were also undertaken before
training and survey implementation.
The first phase of the pre-test entailed a team of enumerators visiting pre-sampled
businesses on 14th and 15th February, 2017. Prior to the pre-testing of the survey
instruments, businesses were screened to ascertain eligibility for their selected study
components. Following this exercise, phone calls were made to the businesses to set
up appointments. The survey team pre-tested the instruments with 10 businesses
across the three components. The intent of the pilot was to test the reliability and validity

FutureTest Ghana Business Enabling Environment Programme (BEEP) Monitoring and Evaluation Support, Phase 3 – Project Completion Report
41
of the scripted questionnaire and the outcome of the pre-test was used to update the
script.
A second pilot was conducted on 13th and 14th March, 2017 after training of data
collectors to ensure that the survey questionnaires were appropriately understood and
the data collection team was conversant with the survey instruments. In addition, the
pilot was used to further reaffirm the usability of the survey (including the time it takes to
complete a questionnaire), to examine the role of stakeholders and their expectations of
the survey, and test the deployment of enumerators. Eight business participated in the
second pilot phase. Similar to the first phase of piloting, some businesses rescheduled
the surveys to the next day, thus extending the intended one-day pilot.
1.1.2 Enumerator training
A 4-day training was conducted for enumerators. The training introduced the research team
to the purpose of the baseline and equipped them with the relevant tools and skills needed
to undertake the baseline survey for BEEP. The first three days of the training programme
were designed to emphasize effective practices in interviewing to ensure that the questions
posed lead to appropriate responses. The survey employed different learning
methodologies, both theoretical and practical including role playing to ensure that the data
collectors were well experienced to conduct the activities successfully.
One main highlight of the training was to give enumerators the opportunity to thoroughly
review and understand survey questionnaires. The fourth day of the training was used to
pilot the survey instruments within the Accra Metropolis, debrief and prepare for data
collection. A total of eight trainees participated in the training.

FutureTest Ghana Business Enabling Environment Programme (BEEP) Monitoring and Evaluation Support, Phase 3 – Project Completion Report
42
Training Photos:
1.1.3 Sampling Protocol and Selection of businesses
The quota sampling technique was employed to achieve a sample size of 265; 97 businesses
were selected principally for the taxation component, 85 selected for construction permits, and
83 selected for commercial court disputes. Respondent businesses were selected from a list
of eligible businesses provided by the Ghana Revenue Authority, the Commercial Courts and
the Ministry of Local Government and Rural Development.
The survey deployed a 3-step approach (See Figure 1) to select the business for this survey
beginning with preliminary phone calls to administer initial screening questionnaires for
eligibility, including filling sample quota, and availability of key personnel. This was followed
up with sending the questionnaires for review via email and booking appointments for the
surveys. The final step was to conduct surveys with representatives of the businesses. 59%
of surveys were conducted in person, 39% by telephone, and 1% completed the survey via
Google Forms.

FutureTest Ghana Business Enabling Environment Programme (BEEP) Monitoring and Evaluation Support, Phase 3 – Project Completion Report
43
Figure 1: Flow Chart of Administering the Survey
1.1.4 Validation Meeting
On the 20th of July 2017, a one-day validation meeting organised by the BEEP Ghana
Programme took place at the Alisa hotel in Accra, Ghana. The main aim of the workshop was
to enable TKG present preliminary findings of the baseline survey to key stakeholders. A total
of 57 participants attended the workshop comprising of 20 survey participants and
representatives from the allied government institutions; 2 from MLGRD, 2 from the Accra and
Tema Metropolitan Assembly respectively, 7 from the Ministry of Trade and Industry (MOTI),
5 from the Ghana Revenue Authority, and 3 from the Judiciary Services. Also present were
representatives from DFID (5), TKG (6), Association of Ghana Industries (AGI), Ghana
Revenue Authority (GRA), Ghana Radio Network (GRN) and the Environmental Protection
Agency (EPA). This workshop gave the stakeholders the opportunity to validate the findings
of the baseline and to give recommendations and suggestions to improve the report and future
research that will be carried out in this regard.
1.1.5 Survey Limitations
1) The Khana Group had difficulty fulfilling their targets of 90 businesses for each regulatory
area, due to lack of valid contact information provided by the implementing agencies and
refusals of businesses contacted. This resulted in a loss of survey representativeness.

FutureTest Ghana Business Enabling Environment Programme (BEEP) Monitoring and Evaluation Support, Phase 3 – Project Completion Report
44
As per the methodology, screening interviews were held via telephone for the 3
components. Administering the screening questionnaire for the Construction Permit
Component was successful. Out of 95 business screened, 94 agreed to partake in the
baseline survey. The screening of the other two components were was not as successful.
The lists of eligible businesses provided by the Ghana Revenue Authority and Commercial
Courts did not include valid contact numbers so TKG conducted an internet search for the
telephone numbers and physical addresses of the businesses.
The telephone numbers of 25 percent of businesses in the Commercial Court component
were not found through the internet search. In addition, only 5 eligible businesses indicated
their willingness to partake in the baseline survey. Similarly, out of 101 businesses, the
telephone numbers for 20 percent of businesses in the tax component could not be found
through the internet search. Of the businesses whose contact details were identified, 46
percent could not be reached via telephone and only 13 eligible businesses were willing
to partake in the survey. Based on the low response rates, the team embarked on face-to-
face screening for Tax and Commercial Courts components. The preliminary screening
process not only served as an attempt to identify eligible business but also a means of
introducing and sensitizing businesses of the teams’ visit.
The survey was unable to provide robust estimates of the cost of compliance for
commercial disputes. When a detailed questionnaire was presented to businesses, over
94 percent refused to participate in the survey citing issues with confidentiality or non-
disclosure agreements. Based on recommendation from DFID, the team revisited all
identified businesses sampled for the Commercial Court Component to administer a short
form of the commercial court survey to instead elicit responses on the reasons for the
commercial dispute, the cost involved and the general perception of the Ghanaian legal
system.
2) The data collection period was carried out between the period of 16th March to 19th May,
2017. Due to some challenges (outlined below) the proposed data collection period of 15
days; from 16th March to 5th April 2017 had to be extended by 10 more days. Outlined
below are the reasons for the delay in data collection:
The survey team faced problems with businesses rescheduling appointments more
than twice particularly with the Building Permit Component. Of the 270 surveyed
firms 156 were visited more than twice before the questionnaire was completed.
Sixty-five (42 percent) of these businesses were from the Building Permit
Component. This was further compounded by the fact that the sampling frame had
been exhausted. The team resulted to phone interviews at the convenience of the
respondents. Thus the period for which building permits had been requested was
extended from 3 to 5 years.
Peculiar to the Building Permit component, even after the initial pre-screening some
businesses refused to partake in the survey citing reasons of disinterest and inability

FutureTest Ghana Business Enabling Environment Programme (BEEP) Monitoring and Evaluation Support, Phase 3 – Project Completion Report
45
to answer questions. The team identified and administered surveys to businesses
from the tax component that indicated they had requested for building permits over
the past five years. Fourteen businesses were identified from the tax component with
whom the Building Permit questionnaire was administered.
2. Taxation component
2.1 Estimated cost of tax compliance
2.1.1 Compliance cost methodology
Figure 2 shows the demographics of the surveyed firms, and Table 1 shows the distribution of
surveyed firms according to these size definitions and accounting record types.
Figure 2: Demographic Characteristics of Surveyed firms-Tax component

FutureTest Ghana Business Enabling Environment Programme (BEEP) Monitoring and Evaluation Support, Phase 3 – Project Completion Report
46
Table 1: Distribution of Surveyed Firms by Size and Age-Tax Component
Firm Size
Year of Commencement
Total Pre 1975 1975 to 1984 1985 to 1994 1995 to 2004 2005 to 2015
Micro 4 2 3 5 29 43
Small 1 0 4 8 25 38
Medium 0 0 0 4 5 9
Large 0 1 4 0 2 7
Total 5 3 11 17 61 97
Sources: BEEP Baseline Survey; GSS Report.
2.1.2 Estimates of firm-level compliance costs for taxation
The BEEP Baseline Survey considers two broad categories of compliance costs associated
with taxation. The first category of compliance costs considered in the BEEP survey covers
the following costs associated with preparing, reporting, and paying taxes:
Costs of goods and services used to prepare tax returns, including office equipment such
as accounts books, invoice books, stationary, and software and electronic systems
Staff costs, measured indirectly by the level of staff involved in preparing the returns and
the number of hours spent preparing.
The second category of taxation compliance costs cover costs associated with audits and
penalties:
Penalties for being more than 10% over or under initial tax estimates,
Delays associated with the receipt of rebates
Audit expenses, broken down further into the cost of goods and services, staff costs, and
other associated costs.
As shown in Table 2, of the 97 firms surveyed for the tax component, 20 use both presumptive
and self-assessment methods, 63 use self-assessment methods only, and 9 firms use
presumptive methods only.15
15 See PricewaterhouseCoopers (2012), “Self-Assessment for Medium Tax Payers,” available at <https://www.pwc.com/gh/en/assets/pdf/ghana-on-point-self-assessment-december-2012.pdf (accessed on
August 23, 2017). “Entities in Ghana are required to pay tax on either a provisional assessment or self-assessment basis. Under the provisional assessment scheme, the GRA will provide an assessment
based on their estimation of what the likely taxes payable will be. Being under self-assessment entails accounting for and self-reporting the entity’s estimated chargeable income and its taxes payable for
each year of assessment. This assessment would be used as basis of the entity’s corporate tax payments.” Id., at p. 1.

FutureTest Ghana Business Enabling Environment Programme (BEEP) Monitoring and Evaluation Support, Phase 3 – Project Completion Report
47
Table 2: Distribution of Tax Assessment Methods used by Firm Size
Firm Size Presumptive
Only
Self-Assessment
Only Presumptive and Self-Assessment Other Total
Micro 8 16 16 3 43
Small 1 31 4 2 38
Medium 0 9 0 0 9
Large 0 7 0 0 7
Total 9 63 20 5 97
Sources: BEEP Baseline Survey.
Table 3 shows the distribution of surveyed firms according to size and the number of annual
tax payments made, for the following types of taxes: Value-Added Tax (VAT), National Health
Insurance Levy (NHIL), Corporate Income Tax, Personal Income Tax, Withholding Tax, and
other payroll taxes (these include pension contributions and workers’ insurance. Table 4
shows that, other than corporate income tax, and withholding tax for small and medium firms,
tax payments were mostly made 12 times a year for all types of taxes.
Table 3: Distribution of Surveyed Firms according to Size and Number of Annual Tax Payments
made
Firm Size
Number of Annual Payment
s
Number of Firms
Value-Added
Tax
National Health
Insurance Levy
Corporate Income
Tax
Personal Income
Tax Withholdin
g Tax
Other Payroll Taxes/1
Micro and Small (N = 81)
0 25 25 18 17 36 26
1 3 2 32 6 9 0
4 1 1 10 1 7 0
12 51 52 15 54 22 55
Other/1 1 1 6 3 7 0
Medium and Large
(N = 16)
0 4 4 2 1 4 0
1 0 0 5 0 1 0
4 0 0 7 0 1 0
12 10 10 1 14 7 16
Other/2 2 2 1 1 3 0
Source: BEEP Baseline Survey.
Notes:
/1 “Other payroll taxes” includes pension contributions and workers’ insurance. See BEEP Baseline Survey Questionnaire, Taxation Component, at p. 4.
/2 Other may be any other number of payments, ranging from 0 to 12 and not equal to 0, 1, 4 or 12.

FutureTest Ghana Business Enabling Environment Programme (BEEP) Monitoring and Evaluation Support, Phase 3 – Project Completion Report
48
2.1.3 Estimates for Greater Accra / Ghana
The overall compliance costs of taxation for the Greater Accra region as well as for Ghana
was estimated using a two-step estimation methodology, outlined in Figure 2. First, per-firm
compliance costs of taxation are derived using BEEP survey data as well as Ghana Labour
Force Survey (GLFS) data on wages in Ghana and GSS data on regional Consumer Price
Indices (CPI). In the next step, overall compliance costs estimates were derived for Greater
Accra and for Ghana using the per-firm compliance costs derived in the first step, as well GSS
CPI data and GPI data on business demographics in Ghana. This estimation methodology is
depicted in Figure 3.
Figure 3: Outline of Methodology for the Estimation of Overall Compliance Costs
To obtain the relevant sample of GLFS data, the wages of individuals whose job descriptions
relate closely to tax reporting activities were analysed. In particular, analysis of wages is
restricted to surveyed individuals whose job descriptions match the following: finance
managers, accountants, administrative and executive secretaries, general office clerks,
secretaries (general), data entry clerks, accounting and bookkeeping clerks, payroll clerks,
and sales works not elsewhere classified. Only individuals (1) for whom salary information is
available, (2) who work one job, and (3) who work in a regular job16 were considered. This
yields a final, and relevant GLFS sample of 38 observations.
Furthermore, since the BEEP survey only includes firms in the Greater Accra Region, per-firm
average compliance costs must necessarily be computed using wages that pertain to the
Greater Accra Region. To do this, the regional wages were converted in the relevant GLFS
16 See GLFS Household Questionnaire, Section 3.A.

FutureTest Ghana Business Enabling Environment Programme (BEEP) Monitoring and Evaluation Support, Phase 3 – Project Completion Report
49
sample to Greater Accra wage levels using GSS CPI data.17 Table 4 shows the summary
statistics of monthly wages (at the Greater Accra level) obtained from the GLFS dataset.
17 Mean annual regional CPIs are derived by averaging monthly CPI levels.

FutureTest Ghana Business Enabling Environment Programme (BEEP) Monitoring and Evaluation Support, Phase 3 – Project Completion Report
50
Table 4: Summary Statistics of Monthly Wages in Greater Accra
Number of Observations Minimum Maximum
25th Percentile
50th Percentile (Median)
75th Percentile Mean
Standard Deviation
38 211.8 4,850.0 520.0 1,000.0 1,428.8 1,260.3 1,106.4
Sources: Ghana Labour Force Survey (2015); GSS Statistical Bulletin—Consumer Price Index (January 2016 to December 2016). The final, relevant GLFS sample consists of 38 observations.
Notes:
/1 Wages in regions other than Greater Accra are converted to Greater Accra levels using mean regional CPIs.
/2 We only consider individuals (1) for whom salary information is available, (2) who work one job, and (3) who work in a regular job (see GLFS Household Questionnaire, Section 3.A).
/3 We only consider surveyed individuals whose job descriptions match any of the following: finance managers, accountants, administrative and executive secretaries, general office clerks, secretaries (general), data entry clerks, accounting and bookkeeping clerks, payroll clerks, and sales works not elsewhere classified.
GSS provides data on the distribution of firms by size and accounting record types in Ghana.
To determine the appropriate grouping of firms, a statistical test was conducted to determine
whether there is a difference between median total regular reporting costs for micro- and
small-sized firms that keep formal accounting records and those that keep informal accounting
records, and accept the null hypothesis that there is no difference between the two groups.18
Similarly this test was performed for total audit costs, for micro- and small-sized firms, and
thus the null hypothesis of no difference between the groups is accepted.
The first step is to derive firm-level total regular reporting and audit compliance costs of
taxation, as shown in the main report.
The methodology to derive the overall compliance costs for Greater Accra and Ghana is as
follows:
1. Estimation of taxation compliance costs for Greater Accra
Let 𝑖 denote firm type, where 𝑖 ∈ {𝑚𝑖𝑐𝑟𝑜 & 𝑠𝑚𝑎𝑙𝑙, 𝑚𝑒𝑑𝑖𝑢𝑚 𝑎𝑛𝑑 𝑙𝑎𝑟𝑔𝑒}, and let 𝑝𝑖 denote
the probability that firm of type 𝑖 is audited.
Let 𝑅𝑖 denote the median per-firm total compliance cost of regular reporting, and 𝐴𝑖
denote the median per-firm total compliance cost of audit, of type-𝑖 firms.
Furthermore, let 𝑅𝑖 and 𝑅𝑖, and 𝐴𝑖 and 𝐴
𝑖, denote the lower and upper 95% confidence
levels of 𝑅𝑖 and 𝐴𝑖 respectively.
Finally, let 𝑛𝑖 denote the number of firms of type 𝑖 in Greater Accra that keep formal
accounting records.
Then, the estimated range of overall compliance costs of taxation for Greater Accra is
(∑ 𝑛𝑖(𝑅𝑖 + 𝑝𝑖𝐴𝑖)𝑖 , ∑ 𝑛𝑖(𝑅𝑖
+ 𝑝𝑖𝐴𝑖)𝑖 ).
2. Estimation of taxation compliance costs for Ghana
18 The non-parametric equality-of-medians test was performed. Also perform the Wilcoxon rank-sum test and obtain the same result.

FutureTest Ghana Business Enabling Environment Programme (BEEP) Monitoring and Evaluation Support, Phase 3 – Project Completion Report
51
It is assumed the 𝑝𝑖 does not vary across Ghanaian regions.
Let �̂�𝑖 denote the median non-Greater Accra per-firm total compliance cost of regular
reporting, and �̂�𝑖 denote the median non-Greater Accra per-firm total compliance cost
of audit, of type-𝑖 firms. Non-Greater Accra costs are derived applying CPI deflators to
Greater-Accra cost levels.
Furthermore, let �̂�𝑖 and �̂�𝑖
, and �̂�𝑖 and �̂�𝑖
, denote the lower and upper 95% confidence
levels of �̂�𝑖 and �̂�𝑖 respectively.
Finally, let �̂�𝑖 denote the number of firms of type 𝑖 across regions other than Greater
Accra, that keep formal accounting records.
Then, the estimated range of overall compliance costs of taxation for Ghana is
(∑ 𝑛𝑖(𝑅𝑖 + 𝑝𝑖𝐴𝑖)𝑖 + ∑ �̂�𝑖(�̂�𝑖 + 𝑝𝑖�̂�𝑖)𝑖 , ∑ 𝑛𝑖(𝑅𝑖
+ 𝑝𝑖𝐴𝑖)𝑖 + ∑ �̂�𝑖( �̂�
𝑖
+ 𝑝𝑖 �̂�𝑖
)𝑖 ), i.e., the
sum of overall compliance costs for the Greater Accra and non-Greater Accra regions.
2.2 Comparison with World Bank estimates
In this subsection, the data yielded by the BEEP survey is compared on the number of tax
payments and the time required to prepare and file taxes, with corresponding data for Ghana
presented by the World Bank in its Doing Business 2016 report.19 To arrive at these estimates,
the World Bank uses a case study and “records the taxes and mandatory contributions that a
medium-size company [located in Accra] must pay in a given year as well as measures of the
administrative burden of paying taxes and contributions.”20
To obtain its estimates, tax practitioners were asked by the World Bank “to review a set of
financial statements as well as a standardized list of assumptions and transactions that the
company completed during its 2nd year of operation. Respondents are asked how much taxes
and mandatory contributions the business must pay and how these taxes are filed and paid”.21
According to the World Bank, in Ghana, “[on] average, firms make 33.00 tax payments a year
[and] spend 224.00 hours a year filing, preparing and paying taxes.”22 The World Bank’s
results on taxes paid and the corresponding number of payments and time are presented in
Table 5.23
19 See World Bank (2016), “Doing Business 2016, Measuring Regulatory Quality and Efficiency, Economy Profile 2016, Ghana.” Hereinafter “Doing Business Report.”
20 See Doing Business Report, at p. 65.
21 See Doing Business Report, at p. 67.
22 See Doing Business Report, at p 66.
23 See Doing Business Report, at p. 67.

FutureTest Ghana Business Enabling Environment Programme (BEEP) Monitoring and Evaluation Support, Phase 3 – Project Completion Report
52
Table 5: World Bank Estimates on the Number of Tax Payments and Associated Time
Tax or Mandatory Contribution Number of Payments
Time (Hours)/1
Corporate Income Tax 6 40
Social Security Contributions 12 88
Capital Gains Tax 1
n.a.
Tax on Interest 0
Municipal Tax 0
Property Tax 1
Fuel Tax 1
Social Security Contributions on Employees 0
Value Added Tax (VAT) and National Health Insurance Levy (NHIL) 12 96
Totals 33 224
Source: Doing Business Report, at p. 67. This table is a partial reproduction of table 8.2 in the Doing Business Report.
In order to compare data on tax preparation and filing yielded by the BEEP survey and the
World Bank’s estimates, the BEEP survey data on the number of tax payments is first
summarised, as shown in Table 6.
Table 6: Compliance Cost Comparison with World Bank Estimates
Firm Size
Number of
Surveyed Firms
Median Number of Tax Payments
Value-added
tax (VAT)
National Health
Insurance Levy
(NHIL)
Corporate Income
Tax (CIT)
Personal Income
Tax (PIT) Withholding Tax (WHT)
Other Payroll Taxes
Total Number of Tax
Payments
Medium 9 12 12 4 12 8 12 57
Large 7 12 12 3 12 12 12 70
Source: BEEP Survey Data.
Note that the World Bank combines VAT and NHIL tax payments. Moreover, the World Bank
does not consider personal income tax. In order to perform a comparison of the estimates, the
VAT and NHIL tax payments was combined and also personal income tax was excluded from
the calculation to obtain the total number of tax payments as shown in 7th column of Table 7.24
As shown in Table 7, the total number of tax payments estimated using BEEP survey data for
medium sized firms, 36, closely matches the World Bank’s estimate of 33 tax payments for
the same firm size.
24 Since, for all firm sizes, the median number of tax payments is 12 for both VAT and for NHIL taxes, we use a median number of 12 tax payments for VAT and NHIL payments combined.

FutureTest Ghana Business Enabling Environment Programme (BEEP) Monitoring and Evaluation Support, Phase 3 – Project Completion Report
53
Table 7: Comparison of Number of Tax Payments:
Firm Size
Number of
Surveyed Firms
Median Number of Tax Payments (BEEP Survey)
Sum of Median Number of Tax
Payments (BEEP
Survey)
Total Number of Tax
Payments for a
Medium-Sized Firm
(World Bank)
Value-added tax (VAT) and National Health Insurance Levy (NHIL)
Corporate Income Tax (CIT)
Withholding Tax (WHT)
Other Payroll Taxes, including pension contributions and worker's insurance
Micro 43 12 1 1 12 26
33 Small 38 12 2 2 12 28
Medium 9 12 4 8 12 36
Large 7 12 3 12 12 39
Sources: BEEP Survey Data, Doing Business Report.
Table 8 shows summary statistics of BEEP survey data on the time spent to prepare and file
taxes. As shown in Table 8, according to the BEEP survey for medium-sized firms, the median
staff time spent on taxation-compliance-related activities equals 1,022 hours, not including
audit.
Table 8: Staff Time Required by Surveyed Firms for Tax Compliance
Firm Size Number of Firms
Staff Time (Hours) Spent on Tax Filing and Preparation
Median Mean
Micro 43 1,042.9 1,185.5
Small 38 730.0 1,045.1
Medium 9 1,022.0 1,098.5
Large 7 438.0 1,093.5
Source: BEEP Survey Data.
In comparison, the World Bank estimates that firms in Ghana “spend 224.00 hours a year
filing, preparing and paying taxes”.25 Note that World Bank’s estimate measures time spent on
the following activities: (1) collecting information and computing the tax payable, (2)
completing tax return forms, (3) filing with proper agencies, and (4) arranging payment or
withholding, and (4) preparing separate tax accounting books, if required.26 Whereas the
BEEP survey records staff time “for gathering, preparing, and submitting information for tax
reporting purposes, including initial submissions, and resubmissions, as well as seeking
25 See Doing Business Report, at p 66.
26 See Doing Business Report, at p. 65.

FutureTest Ghana Business Enabling Environment Programme (BEEP) Monitoring and Evaluation Support, Phase 3 – Project Completion Report
54
advice on preparing taxes”.27 The much higher estimate yielded by the BEEP survey thus likely
arises due to the broader range of activities considered.
2.3 Findings on relative importance of taxation
2.3.1 Logistic regression
To identify the predictors of tax being a higher concern for companies, a logistic regression
analysis was performed, the results of which are shown in the table below. The dependent
variable in models 1 and 2 equals one for a company if it lists high levels of taxes (including
VAT, corporate, payroll) among the top 3 biggest problems it faced in the last 3 months. In
models 3 and 4, the dependent variable equals one for a company if it lists the burden of
paying taxes among the top 3 biggest problems and zero otherwise. Finally, the dependent
variable in models 5 and 6 equals one if it lists high levels of taxes and/or the burden of paying
taxes among the top 3 biggest problems it faced in the last 3 months, and zero otherwise.
The covariates considered are: (1) firm size (the independent variable equals 1 for micro-sized
firms and zero otherwise), (2) accounting record type (the independent variable equals 1 if the
accounting record type is informal and zero otherwise), (3) the type of assessment method
used (the independent variable equals 1 if self-assessment methods are used and zero
otherwise), (4) the number of tax payments,28 (5) the firm’s own estimate of its compliance
costs of taxation in 2015, and (6) the total compliance costs of taxation. Essentially, for each
of the three dependent variables, two models are estimated, one with the full set of covariates,
and another where the total costs of compliance are excluded (doing so allows to perform the
regression using the set of firms from both the taxation and construction datasets).
The results of these analysis are presented in Table 9. As shown in the table, statistical
significance is only obtained for the coefficient of firm size in models 1, 2, and 6, and for the
coefficient of accounting record type in model 1. However, the expected positive signs of
coefficients of the respondent’s estimate of compliance costs parameters as well as actual
compliance costs in models 1, 2, 5, and 6, as well as the coefficients of the number of tax
payments in models 3 and 4 were confirmed by the regression analysis.
27 BEEP Taxation Questionnaire, at p. 7.
28 The total number of tax payments is calculated using a single category for both VAT and NHIL payments, and excludes personal income tax payments.

FutureTest Ghana Business Enabling Environment Programme (BEEP) Monitoring and Evaluation Support, Phase 3 – Project Completion Report
55
Table 9: Logistic regression analysis of tax being a higher concern for companies
Independent Variables
Dependent Variable: High levels of taxes
(including VAT, corporate, payroll)
among the top 3 biggest problems they faced in
the last 3 months/6
Dependent Variable:
Burden of paying taxes/high number of taxes among 3 biggest problems
they faced in the last 3 months/6
Dependent Variable: Burden of paying taxes and/or high number of taxes among the top 3 biggest problems they
faced/6
Model 1 Model 2 Model 3 Model 4 Model 5 Model 6
Firm size/1 0.895* 1.063* -0.394 0.851 0.765* 0.838
(0.359) (0.509) (0.450) (0.675) (0.359) (0.500)
Accounting record type/2
1.055* 0.499 -0.054 -0.794 0.857 0.337
(0.497) (0.643) (0.593) (0.909) (0.491) (0.636)
Tax assessment method used/3
0.922 0.565 -0.712 -0.823 0.771 0.198
(0.504) (0.723) (0.592) (0.909) (0.488) (0.713)
Number of tax payments/4
-0.006 -0.033 0.027 0.039 0.001 -0.018
(0.015) (0.021) (0.019) (0.028) (0.015) (0.020)
Respondent's estimate of compliance costs of taxation/5
18.190 18.486 -4.432 -3.459 15.588 15.369
(14.618) (14.681) (6.639) (7.314) (13.535) (12.917)
Total costs of taxation compliance/6
18.008 -7.719 11.304
(17.360) (23.614) (16.842)
Constant -1.167* -0.650 -1.379* -2.136* -0.903 -0.182
(0.556) (0.793) (0.661) (1.066) (0.548) (0.784)
Number of Observations
165 94 165 94 165 94
Pseudo R-Squared 0.102 0.158 0.031 0.073 0.073 0.098
Sources: BEEP Survey data. The unit of observation is an individual company. Standard errors of estimated parameters are reported in parentheses. *, **, *** denote statistical significance at the 1%, 5%, and 10% levels respectively.
Notes:
/1 Equals 1 if firm size is micro, equals 0 otherwise.
/2 Equals 1 if accounting record type is informal, equals 0 otherwise.
/3 Equals 1 if self-assessment methods are used, equals 0 otherwise.
/4 Total number of tax payments and contributions made by the firm in 2016.
/5 Pertain to tax payments made in 2015.
/6 Since the construction survey does not report actual compliance costs (by component) of taxation, models 2, 4, and 6 can be estimated using only data from the taxation component.
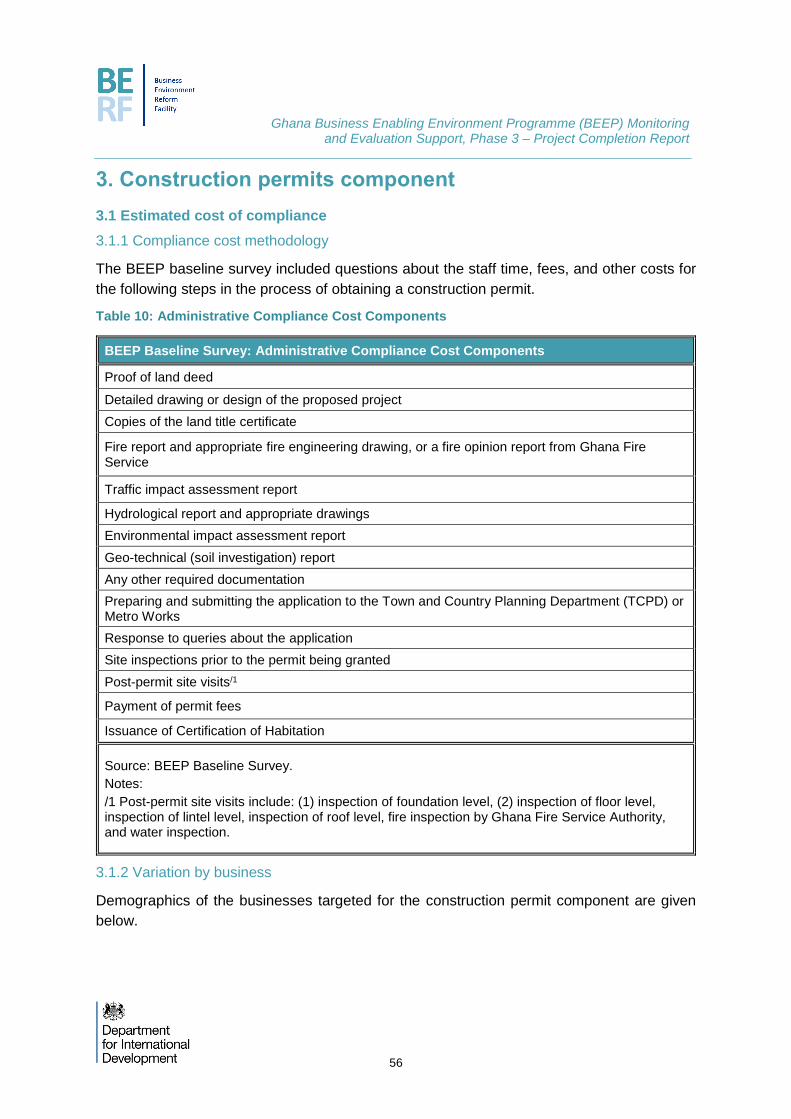
FutureTest Ghana Business Enabling Environment Programme (BEEP) Monitoring and Evaluation Support, Phase 3 – Project Completion Report
56
3. Construction permits component
3.1 Estimated cost of compliance
3.1.1 Compliance cost methodology
The BEEP baseline survey included questions about the staff time, fees, and other costs for
the following steps in the process of obtaining a construction permit.
Table 10: Administrative Compliance Cost Components
BEEP Baseline Survey: Administrative Compliance Cost Components
Proof of land deed
Detailed drawing or design of the proposed project
Copies of the land title certificate
Fire report and appropriate fire engineering drawing, or a fire opinion report from Ghana Fire Service
Traffic impact assessment report
Hydrological report and appropriate drawings
Environmental impact assessment report
Geo-technical (soil investigation) report
Any other required documentation
Preparing and submitting the application to the Town and Country Planning Department (TCPD) or Metro Works
Response to queries about the application
Site inspections prior to the permit being granted
Post-permit site visits/1
Payment of permit fees
Issuance of Certification of Habitation
Source: BEEP Baseline Survey.
Notes:
/1 Post-permit site visits include: (1) inspection of foundation level, (2) inspection of floor level, inspection of lintel level, inspection of roof level, fire inspection by Ghana Fire Service Authority, and water inspection.
3.1.2 Variation by business
Demographics of the businesses targeted for the construction permit component are given
below.

FutureTest Ghana Business Enabling Environment Programme (BEEP) Monitoring and Evaluation Support, Phase 3 – Project Completion Report
57
Figure 4: Demographics of the Surveyed Firms-Construction permits
Figure 4 presents demographics of the surveyed firms, and Table 11 shows distribution of
surveyed firms by size and age.
Table 11: Distribution of Surveyed Firms by Size and Age-Local Licenses Component
Firm Size
Year of Commencement
Total Pre 1975 1975 to 1984 1985 to 1994 1995 to 2004 2005 to 2016
Micro 2 1 0 3 22 28
Small 1 2 5 3 25 36
Medium 0 0 2 3 9 14
Large 0 0 2 2 3 7
Total 3 3 9 11 59 85
Sources: BEEP Baseline Survey; GSS Report.
3.2 Estimates for Greater Accra / Ghana
The BEEP Baseline Survey provides data on the administrative compliance procedures of
applying for Construction Permits. In order to estimate the compliance costs of applying for
construction permits, data on per-firm estimates of compliance costs relating to firms’ most
recent application for a construction permit is first derived. These per-firm estimates are then

FutureTest Ghana Business Enabling Environment Programme (BEEP) Monitoring and Evaluation Support, Phase 3 – Project Completion Report
58
further used to derive annual estimates of compliance costs for Greater Accra and Ghana at
large.
In order to derive overall compliance costs associated with construction permits for the Greater
Accra Region, it is necessary to estimate the number of applications submitted per year. To
do so, all the construction permits issued by Accra Metropolitan Assembly (AMA) and Tema
Metropolitan Assembly (TMA) from 2012-16 are considered.29 The total number of eligible
permits in this five-year period is 524, or approximately 105 per year. Based on data supplied
by the AMA, applications have a 43 percentage acceptance rate, and thus the total number of
businesses submitting an application is estimated to be 244 per year in the Greater Accra
Region.30
To estimate the number of applications in Ghana, the ratio of the total number of businesses
in Ghana compared to the total number of business in Greater Accra was multiplied by 244,
using data provided by the GSS Report (2015), and this equals approximately 879 applications
per year.
Another set of estimates required to determine compliance costs is average turnover of
Ghanaian firms by firm size. For small and micro businesses, turnover is estimated at GHS
45,000; for medium businesses, at GHS 2.5 million; and for large businesses, at GHS 7.5
million.31
Finally, the current cost of delay in issuing a construction permit estimated by multiplying (1)
the probability that a business that applies for a construction permit reports an increase in
employees, turnover, or both, (2) the reported percentage increase in turnover or sales
volume,32 (4) average turnover,33 and (3) the ratio of the average number of days required to
issue a construction permit to the number of days in a year.34
Similar to the estimation strategy for the taxation component, a two-step methodology to
calculate overall compliance costs for Greater Accra and Ghana at-large is used, and this is
described pictorially in Figure 4. First, per-firm compliance costs of applying for the most recent
construction permit are derived using BEEP survey data, as well as GSS data on regional
consumer price indices.35 Next, using data on the number of applications in Greater Accra and
29 We exclude applications for masts, walls, residential housing, schools and religious institutions, and include the rest, including mixed-use projects and clinics. 30 The number of applications equals 105 divided by 43%, which approximately equals 244 per year.
31 These estimates are based on the mid-points of definitions provided by the GRA, with the large category based on 1.5x the minimum threshold. As of publication, GRA has not provided data on the mean or median turnover of businesses in each size category. 32 The higher of the two. If both the percentage increase in turnover or sales volume are missing/zero, and there is a positive percentage increase in the number of employees, we use the percentage
increase in the number of employees as a proxy for the percentage increase in turnover.
33 For small and micro businesses, we estimate turnover at GHS 45,000; for medium businesses, at GHS 2.5 million; and for large businesses, at GHS 7.5 million. These estimates are based on definitions
provided by the GRA.
34 The average number of days required to issue a construction permit was estimated by the Ghana Ministry of Local Government and Rural Development to be 145.
35 Note that for the Local Licences Component, we do not need GLFS wage data, because the BEEP Survey for this component provides data on staff costs in monetary terms.

FutureTest Ghana Business Enabling Environment Programme (BEEP) Monitoring and Evaluation Support, Phase 3 – Project Completion Report
59
the entire country, we estimate overall annual compliance costs for Greater Accra and Ghana
at-large.
Figure 5: Outline of Methodology for the Estimation of Overall Compliance Costs-Local Licenses
Component
As shown in Figure 5, the methodology to derive the overall compliance costs for Greater
Accra and Ghana is as follows:
1. Estimation of construction permits compliance costs for Greater Accra
Let 𝑖 denote firm type, where 𝑖 ∈ {𝑚𝑖𝑐𝑟𝑜 & 𝑠𝑚𝑎𝑙𝑙, 𝑚𝑒𝑑𝑖𝑢𝑚 𝑎𝑛𝑑 𝑙𝑎𝑟𝑔𝑒}.
Let 𝐿𝑖 denote the median per-application administrative compliance cost and 𝐾𝑖
denote the median per-application delay (opportunity) cost,
Furthermore, let 𝐿𝑖 and 𝐿𝑖 and 𝐾𝑖 and 𝐾
𝑖denote the lower and upper 95% confidence
levels of 𝐿𝑖 and 𝐾𝑖 respectively.
Finally, let ni denote the number of applications for construction permits submitted by
firms of type i in Greater Accra in a year.
Then, the estimated range of overall annual compliance costs of taxation for Greater Accra is
(∑ 𝑛𝑖(𝐿𝑖 + 𝐾𝑖)𝑖 , ∑ 𝑛𝑖 (𝐿𝑖
+ 𝐾𝑖)𝑖 ).
2. Estimation of construction permits compliance costs for Ghana
Let �̂�𝑖 denote the median non-Greater Accra per-application administrative
compliance cost, and �̂�𝑖 denote the median per-application delay (opportunity) cost.

FutureTest Ghana Business Enabling Environment Programme (BEEP) Monitoring and Evaluation Support, Phase 3 – Project Completion Report
60
Non-Greater Accra costs are derived applying CPI deflators to Greater-Accra cost
levels.
Furthermore, let �̂�𝑖 and �̂�𝑖
and �̂�𝑖 and �̂�𝑖
denote the lower and upper 95%
confidence levels of �̂�𝑖 and �̂�𝑖 respectively.
Finally, let �̂�𝑖 denote the number of applications for construction permits submitted by
firms of type 𝑖 in regions other than Greater Accra in a year. This is estimated using
IBES data.
Then, the estimated range of overall compliance costs of construction permits for
Ghana is (∑ (𝑛𝑖(𝐿𝑖 + 𝐾𝑖) + 𝑛𝑖(�̂�𝑖 + �̂�𝑖))𝑖 , ∑ (𝑛𝑖 (𝐿𝑖
+ 𝐾𝑖) + 𝑛𝑖 (�̂�
𝑖
+ �̂�𝑖
))𝑖 ), i.e., the
sum of overall compliance costs for the Greater Accra and non-Greater Accra
regions.
3.3 Comparison with World Bank test case
In its Doing Business (2016) report, the World Bank estimates the compliance cost of dealing
with the formalities involved in building a warehouse in Ghana.36 According to the World Bank,
dealing with construction permits “requires 14 procedures, takes 170 days and costs 2.9
percent of the warehouse value.”37 To compare the number of procedures undertaken by the
surveyed firms to comply with construction permit application requirements, the 15 procedures
considered by the World Bank are first matched with the procedures recorded by BEEP
Survey, as shown in Table 12.
Table 12: Construction Permit Application Procedures Considered in the Doing Business Report
(2016) and in the BEEP Baseline Survey
Doing Business Report/1 BEEP Baseline Survey/2
Obtain preliminary design approval in principle (PDAP) Detailed drawing or design of the proposed project
Conduct title search at the Land Commission Proof of land deed, Copies of the land title certificate
Obtain fire protection opinion report Fire report and appropriate fire engineering drawing, or a fire opinion report from Ghana Fire Service
Obtain an environmental impact approval certificate
Environmental impact assessment report; Traffic impact assessment report; Hydrological report and appropriate drawings/3
Apply for building permit with the Town and Country Planning Department
Preparing and submitting the application to the Town and Country Planning Department (TCPD) or Metro Works; Payment of permit fees; Response to queries about the application; Any other required
36 See Doing Business Report, at p. 26. The World Bank’s related indicators “are based on a set of specific procedures—the steps that a company must complete to legally build a warehouse—identified
by Doing Business through information collected from experts in construction licensing, including architects, civil engineers, construction lawyers, construction firms, utility service providers and public officials
who deal with building regulations. These procedures are those that apply to a company and structure matching the standard assumptions used by Doing Business in collecting the data.” Id., at p. 29.
37 See Doing Business Report, at p. 26.

FutureTest Ghana Business Enabling Environment Programme (BEEP) Monitoring and Evaluation Support, Phase 3 – Project Completion Report
61
Doing Business Report/1 BEEP Baseline Survey/2
documentation; Site inspections prior to the permit being granted/4
Receive inspection after foundation has been laid Inspection of foundation level
Receive inspection after floor level has been finished Inspection of floor level
Receive inspection after lintel has been finished Inspection of lintel level
Receive inspection after roofing has been finished Inspection of roof level
Request and receive final inspection from Fire Services Fire inspection by the Ghana Fire Service Authority
Obtain certificate of habitation/occupancy Issuance of Certification of Habitation
Obtain inspection from Ghana Water Company Water inspection
Obtain water connection n.a.
Request water connection n.a.
Receive final inspection from Accra Metropolitan Assembly n.a.
n.a./5 Geo-technical (soil investigation) report
Source: Doing Business Report (2016), BEEP Baseline Survey.
Notes:
/1 Doing Business Report, at pp. 31-33.
/2 BEEP Construction Permits Questionnaire, at pp. 4-15.
/3 See Doing Business Report, at p. 30 (“Depending how complex the building is, an environmental impact assessment report, a hydro report and a traffic management report may be required.”)
/4 See Doing Business Report, at pp. 30-31.
/5 See Doing Business Report, at p. 30 (“Soil report – not applicable for Doing Business case study”).
Matching procedures as shown in Table 12, the number of procedures undertaken by the
surveyed firms is compared with the World Bank’s estimate of 15 procedures for its
hypothetical company and warehouse. Note that with this matching, the maximum number of
procedures according to the BEEP survey equals 12. Since the World Bank’s list of 15
procedures includes procedures associated with no cost, the correct comparison of the
number of procedures reported by the World Bank, 15, is to the maximum number of
procedures according to the BEEP survey, which equals 12. Restricting the counting of
procedures only to those associated with positive costs results in a much smaller number of
procedures, as shown in Table 13.

FutureTest Ghana Business Enabling Environment Programme (BEEP) Monitoring and Evaluation Support, Phase 3 – Project Completion Report
62
Table 13: Average Number of Procedures, associated with Positive Compliance Costs,
Undertaken by Surveyed Firms to Comply with Construction Permit Application Requirements
Firm Size Number of
Firms
Number of Procedures
Median Mean Minimum Maximum
Micro 27 6 7.1 3 12
Small 34 5 5.3 2 11
Medium 13 5 5.2 2 9
Large 7 5 4.6 2 6
Source: BEEP Baseline Survey.
Now, the BEEP survey records the total staff time taken to apply for the most recent
construction permit. Summary statistics of data on staff time from the BEEP survey are shown
in Table 14.
As shown in Table 14, the average number of days taken by medium size surveyed firms to
comply with construction permit application procedures is 64.7 days. Note that the World
Bank’s estimate of 216 days applies to time elapsed between application and granting of the
permit, rather than the number of staff days taken to comply, so these figures are not directly
comparable.
Table 14: Summary Statistics of Staff Time Required by Surveyed Firms to Comply with
Construction Permit Application Procedures
Firm Size Number of
Firms
Staff Time (Days)
Median Mean Minimum Maximum
Micro 27 50 82.0 4 365
Small 34 38.5 70.1 3 365
Medium 13 47 64.7 5 183
Large 7 28 54.7 12 180
Source: BEEP Baseline Survey.

FutureTest Ghana Business Enabling Environment Programme (BEEP) Monitoring and Evaluation Support, Phase 3 – Project Completion Report
63
4. Commercial courts component
4.1 Estimating the cost of compliance of commercial courts
4.1.1 Availability of contact details and survey representativeness
A total of 410 businesses were identified on the sampling frame, out of which 302 businesses
identified were eligible. Though some of the data provided by the courts had contact numbers
or physical addresses, many of these were not in use and some businesses had relocated.
The survey conducted an online search and visited 302 physical addresses of eligible
businesses to conduct face-to-face screening to ascertain whether or not they were eligible to
take part in the survey. Only 44 businesses agreed from the onset to participate in the BEEP
survey.
4.1.2 Refusal rates and survey representativeness
Of the 302 eligible businesses, 9 expressed that they were not interested, 73 were too busy
to partake in the survey and thus rescheduled more than two times, 44 businesses commented
that the survey questions were too lengthy and 132 asked that TKG send them a formal
proposal. The team tried emailing the questionnaires, proposing to conduct phone surveys
and creating Google Doc versions of the survey questionnaire which were relatively successful
with the Building Permit Component. Despite these efforts only 6 businesses accepted to
complete the BEEP survey in its original long form. Feedback suggested that businesses were
reluctant to discuss commercially sensitive issues around disputes or that legal departments
were prohibited from sharing this information without consent. Therefore, a decision was made
to administer a short module of the Commercial Court.
4.2 Use of the court system
4.2.1 Approximate value of the claim, by type of claim
The major issue of dispute is on loan default (84%), followed by land litigation (7%), and other
disputes (8%) as shown in Table 15.
Table 15: Major Causes of Dispute
Issue in Dispute Frequency Percentage
Land Litigation 6 6.7
Loan Default 75 84.3
Theft 2 2.2
Other financial Issues 3 3.3
Others 3 3.3
Total 89 100

FutureTest Ghana Business Enabling Environment Programme (BEEP) Monitoring and Evaluation Support, Phase 3 – Project Completion Report
64
4.2.2 Factors associated with the choice of venue for Dispute Resolution
Only one factor was statistically significant after the analysis with methods of resolving
disputes. The method chosen to resolve disputes was primarily because of the certainty of
decision by the court from our logistic regression. Those who were certain about the court
decision were about 3.29 times more than those who are not certain. No other factor was
significant at 0.05 significant level. About 25% of the variance is explained by the model shown
in Table 16.
Table 16: Factors associated the choice of venue for dispute resolution
Factors Odds ratio
95% CI coefficient S.E P-value
Satisfaction with outcome -0.47 -1.81 – 0.88 -0.089 0.68 0.49
Opinion on court system 0.03 -1.20 – 1.25 0.006 0.62 0.97
Knowledge on commercial law -3.35 -7.73 – 1.03 -1.51 2.2 0.13
Dispute resolution time -3.35 -7.73 – 1.03 -1.51 2.2 0.13
Cost of court fees 1.69 -2.19 – 5.57 0.87 1.95 0.39
Cost of attorney’s fees -0.98 -5.35 – 3.39 -0.45 2.2 0.66
Availability of good legal advice -2.92 -4.45 -2.61 1.12 0.11
Ability to enforce judgment -0.63 -1.66 – 0.39 -1.24 0.51 0.22
Certainty of court decisions -3.29 -4.24 -3.03 1.07 0.003
4.3 Opinions of the Ghanaian Commercial Court System
The BEEP survey data presents data on the general opinion of the court system. These
include relevant knowledge of the cases, length of time taken to resolve disputes, cost of court
fees and attorney fees as well as satisfaction. These are used to assess the general
satisfaction with the court system in Ghana.
4.3.1 Opinions of the court system, by various factors
The BEEP survey data suggests that although the 93 percent of respondents held the view
that judges have relevant knowledge as shown in Table 17 on aspects of the commercial court
system they were however, nearly 80 percent were of the view that length of time taken to
resolve a dispute was too long (Table 17).
Table 17: Level of Knowledge of the judges on relevant aspects of commercial law
Level of Knowledge Frequency Percentage
Very high 48 53.9
Somewhat high 35 39.3
Not very high 5 5.6
Low 1 1.1
Total 89 100

FutureTest Ghana Business Enabling Environment Programme (BEEP) Monitoring and Evaluation Support, Phase 3 – Project Completion Report
65
Table 18: Length of time taken to resolve a dispute
Length of time Frequency Percentage
Very Long 71 79.8
Somewhat Long 10 11.2
Not very long 7 7.9
Short 1 1.1
Total 89 100
Table 19: Cost of court fees
Cost of court fees Frequency Percentage
Very high 53 59.6
Somewhat high 18 20.2
Not very high 16 18.0
Low 2 2.2
Total 89 100
Table 20: Cost of attorney’s fees
Cost of attorney Frequency Percentage
Very high 62 69.7
Somewhat high 10 11.2
Not very high 16 18.0
Low 1 1.1
Total 89 100
5. Business confidence surveys
5.1 Overall and by sector
Table 21: Overall Assessment of Ease of Doing Business in Ghana over the past three months
Sector Subsector Number of Companies/1
Overall Assessment of the Ease of Doing Business in Ghana in the Past 3 Months
Gotten Better
Stayed the Same Gotten Worse
Industry
Manufacturing 3 0 1 2
Electricity & gas 1 0 1 0
Water supply, sewerage, waste management 1 0 1 0
Construction 9 2 6 1
Services
Wholesale & retail trade 35 6 21 8
Transportation & storage 6 0 3 3

FutureTest Ghana Business Enabling Environment Programme (BEEP) Monitoring and Evaluation Support, Phase 3 – Project Completion Report
66
Sector Subsector Number of Companies/1
Overall Assessment of the Ease of Doing Business in Ghana in the Past 3 Months
Gotten Better
Stayed the Same Gotten Worse
Accommodation & food storage 5 0 1 4
Information & communication 3 0 3 0
Financial & insurance 88 9 58 21
Real estate 39 11 22 6
Professional, scientific & technical 3 0 3 0
Administrative & support service 2 0 2 0
Public administration & defense 1 0 1 0
Education 20 2 10 8
Human health & social work 5 1 3 1
Arts, entertainment, & recreation 4 1 2 1
Other services 15 5 7 3
Agriculture Fishing & aquaculture 1 0 0 1
Total 241 37 145 59
Sources: BEEP survey data.
Notes:
/1 Of the 254 companies, 5 firms had a missing information on sector. After these five firms are excluded, we further exclude 8 firms that did not provide one of the three responses, “gotten better,” “stayed the same”, and “gotten worse.” Thus, the total number of companies in this analysis equals 254 minus 13, or 241.

FutureTest Ghana Business Enabling Environment Programme (BEEP) Monitoring and Evaluation Support, Phase 3 – Project Completion Report
67
5.2 Factors significantly correlated with optimism / pessimism
Since the sample of services firms is large enough, the relationship between the issues
identified by firms and their responses to the subjective assessment questions is examined.
To do so, a correlation analysis is performed. For each of the subjective assessment
questions, we examine the correlation between a “pessimistic” response, and the identification
of a particular issue. Specifically, for each subjective assessment question, the variables are
defined such that equal 1 whenever the response is pessimistic (decreased; below normal;
decrease) and 0 otherwise. These variables are then correlated with the “biggest problems”
variables—for example, the variable corresponding to high cost of utilities equals 1 if a
company listed the problem as one of the 3 biggest problems it faced in the past 3 months.
We also perform logit regressions of each of the subjective assessment variables against the
“problems” variables, in which we include firm size as a regressor to control for size effects.
The Tables 22 and 23 below present the results of the correlation and regression analyses.

FutureTest Ghana Business Enabling Environment Programme (BEEP) Monitoring and Evaluation Support, Phase 3 – Project Completion Report
68
Table 22: Correlation analysis of main problems faced by businesses
High cost of utilities,
including electricity and water
Access to credit / finance
High levels of taxes, including
VAT, corporate,
payroll
Burden of paying
taxes, high number of
taxes
Exchange rates, value of the cedi, more
expensive imports
Delayed payments
Customs and trade
regulations
Competition from
imported goods
Corruption, unauthorized
payments
Overall assessment of the ease of doing business in Ghana in past 3 months
226 0.13* -0.02 0.032 -0.00 0.00 -0.07 -0.10 0.10 -0.10
Business situation over past 3 months
214 0.06 0.09 0.14* 0.02 0.05 -0.07 -0.07 0.07 -0.08
Change in demand (turnover) for company's services over past 3 months
214 0.08 0.02 0.13* 0.04 0.07 -0.02 -0.08 0.12* -0.09
Change in total employment over past 3 months
217 0.07 -0.04 0.22* -0.07 -0.09 0.04 -0.04 0.01 -0.08
Change in total employment over next 3 months
209 0.14* -0.09 0.03 -0.10 -0.01 0.16* -0.02 -0.05 -0.07
Source: BEEP survey data. Only services firms considered. * denotes statistical significance at the 10% level or better.
Notes:
/1 There are 233 services firms, but the number of observations does not always equal 233 because of missing data.

FutureTest Ghana Business Enabling Environment Programme (BEEP) Monitoring and Evaluation Support, Phase 3 – Project Completion Report
69
Table 23: Logistic regression analysis of the main problems faced by businesses
Regressor
Model I Model II Model III Model IV/1 Model V/1
Dependent variable: Overall
assessment of the ease of
doing business in Ghana in
past 3 months
Dependent variable: Business
situation over past 3 months
Dependent variable:
Change in demand
(turnover) for company's
services over past 3 months
Dependent variable:
Change in total employment over past 3
months
Dependent variable:
Change in total employment over next 3
months
Firm Size -0.362 -0.478* -0.055 0.173 0.282
(0.204) (0.234) (0.206) (0.291) (0.323)
High cost of utilities, including electricity and water
1.141* 0.372 0.686 0.627 n.a.
(0.559) (0.539) (0.544) (0.826)
Access to credit / finance -0.271 0.551 0.171 -0.178 -0.711
(0.424) (0.447) (0.458) (0.714) (1.127)
High levels of taxes, including VAT, corporate, payroll
-0.010 0.363 0.428 0.832 0.263
(0.201) (0.237) (0.266) (0.512) (0.243)
Burden of paying taxes, high number of taxes
0.331 0.428 0.707 -0.518 n.a.
(0.512) (0.558) (0.547) (1.091)
Exchange rates, value of the cedi, more expensive imports
0.192 0.573 0.784 -0.379 0.830
(0.379) (0.429) (0.422) (0.697) (0.729)
Delayed payments -0.070 0.274 0.592 0.630 1.856*
(0.367) (0.434) (0.429) (0.610) (0.842)
Customs and trade regulations -1.028 -0.784 -0.881 -0.117 0.408
(0.800) (0.809) (0.828) (1.119) (1.202)
Competition from imported goods
1.352 0.767 1.555* 0.960 n.a.
(0.794) (0.803) (0.764) (1.202)
Corruption, unauthorized payments
-1.306 -1.415 -2.169 n.a. n.a.
(1.125) (1.197) (1.310)
Constant
-1.372 -1.408 -2.609*** -3.813** -4.217***
(0.737) (0.772) (0.783) (1.227) (1.192)
Number of Observations 226 214 214 204 147
Pseudo R-Squared 0.066 0.074 0.073 0.081 0.093
Source: BEEP Survey data. *, **, and *** denote statistical significance at the 5%, 10%, and 1% levels.
Notes:
/1 Variables denote “n.a.” predict failure perfectly and are omitted from the logit regression.
Thus, high costs of utilities, high levels of taxes, and delayed payments have a statistically
significant impact on firms’ pessimistic overall assessment of the business climate and the
pessimistic subjective assessment of their performance and outlook.

Contact us
Kru Desai
Government and Infrastructure
T +44 (0) 20 73115705
Katja Silva-Leader
International Development Assistance Services
T +44 (0)1442 202 400
Peter Wilson
BERF Team Leader
T +44 (0)7850329362
www.kpmg.com