business continuity planning construction industry ... · pdf filebusiness continuity planning...
TRANSCRIPT

Business Continuity Planning Construction Industry Productivity
Presentation for Construction Clients Group February 2015
Presented by: Garry Miller

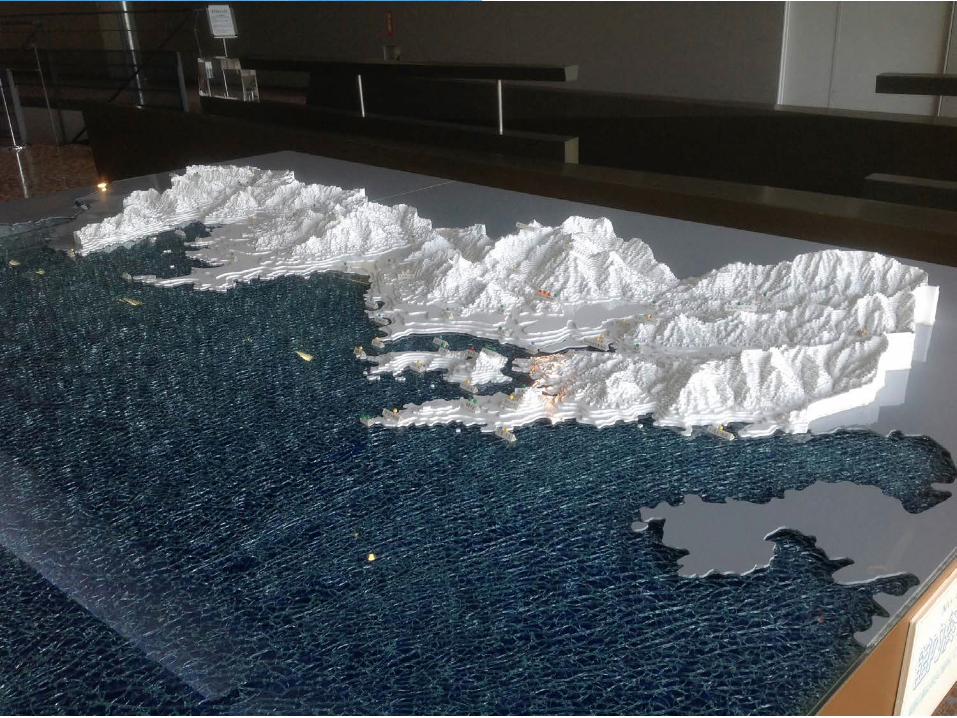
Japan • https://www.youtube.com/watch?v=3xKMFzKOIfQ
• https://www.youtube.com/watch?v=noq8FYvRqgs
• https://www.youtube.com/watch?v=tPQ5iTcnXW0


Date
Date

Date

Date
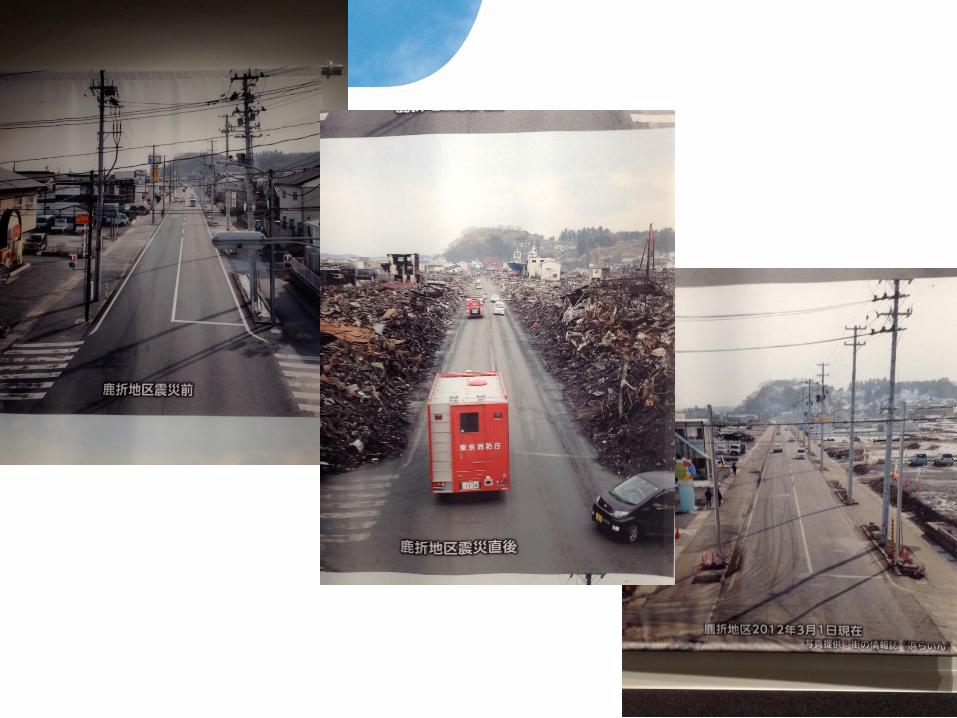


What would we do if faced by a disaster event later today?

Please listen to 43 second recording •https://www.youtube.com/watch?v=jIItailP-O4
•What would we do next?

UoA Business Continuity Plan (Learning and Teaching Continuity Plan) 1.Ensuring that as high as possible number of
students are kept on track for graduation 2.Minimising the adverse financial impact for the
University 3.Protecting the University of Auckland’s
reputation by showing an ability to manage a catastrophe
4.Minimising stress for staff and students responding to an event
5.Positioning the University to play a role in society in the event of a major disruption

Lessons from UoC • Clear and resilient communication channels • Use of ICT and LMS for blended course delivery • Staff who are competent with online learning and teaching • Staff who are accessible and visible • Online spaces that promote interaction, sense of
community • Central hubs of interaction (Facebook, Homepage etc) • Routine to reduce anxiety and help students to focus • Flexibility and adaptability; • Psychological support to help cope with emotional shock.

Scenario Analysis

1) That the University support the development of four overarching learning and teaching continuity strategies: ① Increase our adaptive capacity by delivery of
courses via blended learning approaches; ② Enhance our ability to respond by
strengthening communication tools for mass announcements;
③ Strengthen our preparedness by provision of physical and virtual hubs for students and staff;
④ Reduce our risk factors by identifying alternative resources, venues and timetables.

2) That the University embed learning and teaching continuity planning and practice at the course level across the institution by:
i. Minimum online presence standard; ii. Course outline - continuity statement; iii. Project team to increase the blended
learning; iv. Support CLeaR’s initiatives for
advancement of blended learning; v. Champion.

• That the University update its policy on lecture recording storage and associated resource requirements to support an increased volume of lecture recordings to a minimum of two years, for learning and teaching continuity purposes.
• That ITS investigate the feasibility and
resource requirements of implementing audio-visual recording of laboratories, and that an approach be developed and piloted in the Faculty of Science.
3) Lecture Recordings and 4) Lab Recordings:
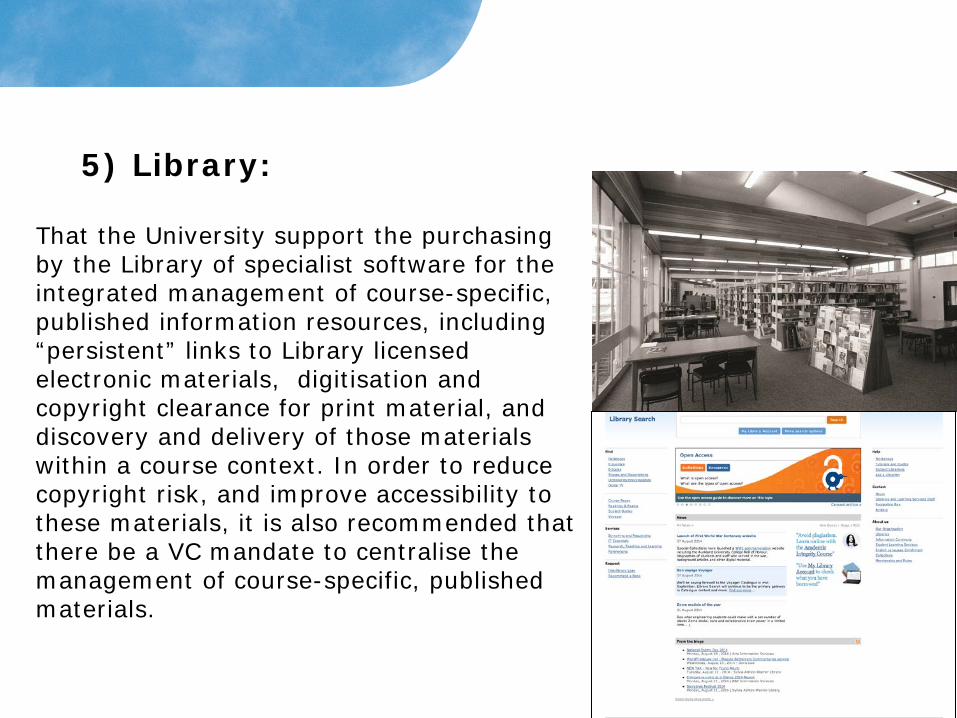
That the University support the purchasing by the Library of specialist software for the integrated management of course-specific, published information resources, including “persistent” links to Library licensed electronic materials, digitisation and copyright clearance for print material, and discovery and delivery of those materials within a course context. In order to reduce copyright risk, and improve accessibility to these materials, it is also recommended that there be a VC mandate to centralise the management of course-specific, published materials.
5) Library:

i. Periodic ‘work from home’ days;
ii. Faculty of Science as an initial pilot;
iii. Embedding practice drills in Faculty Business Continuity Plans.
6) That the University instigate on-going periodic practice drills to test and strengthen the ability of staff to deliver L&T remotely by:

i. Disruption readiness statement to course outlines;
ii. Amend the Academic Calendar - that the University Emergency Management Statute has paramountcy in a crisis;
iii. Faculty has an agreed workflow for approving and implementing sudden changes to a course outline in a crisis.
7) That the University prepare staff and students for potential changes to assessments in an unforeseen crisis by:

i. Guides for Faculties, teachers and students;
ii. Online continuity checklist for instructors;
iii. Sources of further assistance for staff and students dealing with psychological stress.
8) That resources be developed centrally to support learning and teaching continuity, including:

• That the current system for broadcasting messages in a crisis situation be clarified, tested, documented and made available on the staff intranet as a matter of urgency.
• That the University and Faculties
regularly review its relationships with other universities and consider establishing memoranda of understanding for sharing of resources and facilities in a crisis.
9) Broadcasting and 10) Sharing Resources

• That the University regularly reviews the timetabling from the point of view of possible disaster scenarios, and maintains a plan for an alternative back-up exam timetable ready to implement at short notice.
• That the University undertake a
detailed analysis of online examination options, as a possible back-up option for the administration of examinations after a disaster event.
11) Alternative timetabling and 12) Online exams:

Feedback
Any comments?

New Zealand Construction Industry Productivity

Multi-Factor Productivity Performance
0.700
0.750
0.800
0.850
0.900
0.950
1.000
1.050
88 89 90 91 92 93 94 95 96 97 98 99 00 01 02 03 04 05 06 07 08 09
Prod
uctiv
ity in
dex
base
Mar
88=1
.000
MFP index - Construction
Source: Statistics NZ Reported in Page (2010)

Productivity
Source: OECD (2001)
Productivity = Output Input
Type of Output Measure
Type of Input Measure
Labour Capital Capital and Labour Capital, Labour and Intermediate Inputs (energy,
materials, services)
Gross Output Labour Productivity
(based on gross output)
Capital Productivity
(based on gross output)
Capital-Labour Multifactor Productivity
(based on gross output)
KLEMS Multifactor Productivity
Value Added Labour Productivity
(based on value added)
Capital Productivity
(based on value added)
Capital-Labour Multifactor Productivity
(based on value added)
-
Single factor productivity measures Multifactor productivity measures

Productivity

Multi-Factor Productivity Performance
0.700
0.750
0.800
0.850
0.900
0.950
1.000
1.050
88 89 90 91 92 93 94 95 96 97 98 99 00 01 02 03 04 05 06 07 08 09
Prod
uctiv
ity in
dex
base
Mar
88=1
.000
MFP index - Construction
Source: Statistics NZ Source: Statistics NZ Reported in Page (2010)

Multi-Factor Productivity Performance
0.700
0.750
0.800
0.850
0.900
0.950
1.000
1.050
88 89 90 91 92 93 94 95 96 97 98 99 00 01 02 03 04 05 06 07 08 09
Prod
uctiv
ity in
dex
base
Mar
88=1
.000
MFP index - Construction
Source: Statistics NZ Reported in Page (2010)

0
200
400
600
800
1000
1200
1400
1600
Pro
du
ctiv
ity
Ind
ex
Comparison of Multi-Factor Productivity Index of Construction vs Manufacturing Industry
Construction Former Measured Sector
Real estate bloom
Oil crisis
Resource Management Act
NZ Property bloom
Asian financial crisis
Technology Bubble collpase
9-11
Global Financial Crisis
Christchurch Earthquake

0
200
400
600
800
1000
1200
1400
1600
Pro
du
ctiv
ity
Ind
ex
Comparison of Multi-Factor Productivity Index of Construction vs Manufacturing Industry
Construction Manufacturing Former Measured Sector

0
200
400
600
800
1000
1200
1400
Pro
du
ctiv
ity
Ind
ex
Labour and Capital Productivity Index (Construction)
Labour productivity Capital productivity


Classification of Construction and Off Site Production • Structural steelwork fabrication • Steel pipe and tube manufacturing • Precast concrete production • Ready mix concrete manufacturing • Ceramic product manufacturing • Prefabricated wood production • Engineering design and consulting services

800
850
900
950
1000
1050
1100
1150
1200
1978 1979 1980 1981 1982 1983 1984 1985 1986 1987 1988 1989 1990 1991 1992 1993 1994 1995 1996 1997 1998 1999 2000 2001 2002 2003 2004 2005 2006 2007 2008 2009 2010 2011 2012
Pro
du
ctiv
ity
Ind
ex
Comparison of Multi-Factor Productivity Index of Construction vs Manufacturing Industry, with Adjusted Construction for Off-site Manufacturing
Construction Manufacturing Adjusted Construction

Conclusions
• Productivity of the construction sector is better than previously indicated
• Productivity stats in in 80s and early 90s are questionable
• Productivity of end-to-end value chain including off-site manufacturing (and others) should be researched and reported

Flexible Learning Options 1 year full time
Up to 4 years part time 3 core papers plus 5 electives from choice
of 10 Fees circa $9k (domestic students)

Hosted in CeDRRR Multi-disciplinary, pan-
university Law, Medicine, Arts, Science
Enrollments to date +30