business cases for brocade software-defined networking use cases
TRANSCRIPT

1
Key Takeaways
The TCO of three SDN
uses cases is analyzed:
service creation and
insertion, WAN network
virtualization and
network analytics.
An SDN solution
compared to a PMO
solution for each use case
produced savings of:
83% for Service
Creation and Insertion
61% for WAN
Virtualization
48% for Network
Analytics
Business Cases for Brocade Software-Defined Networking Use Cases
Executive Summary
Service providers’ (SP) revenue growth rates have failed to keep pace with their increased
traffic growth and related expenses, and the result is a profit squeeze that is forcing SPs to
rethink their business models and network designs. Software-Defined Networking (SDN)
holds the potential to dramatically reduce total cost of ownership (TCO) while increasing
service velocity.
Brocade has developed three SDN use cases built around an SDN controller and Brocade’s
MLXe series routers that are compliant with the recommendations of the Open Networking
Foundation. The services creation and insertion use case automates traffic steering to
achieve a desired pipeline of services customized to the needs of each service subscriber. The
WAN network virtualization use case provides an OpenFlow overlay to an existing L2/L3 VPN-
IP network among data centers to increase service velocity and reduce TCO as compared to
the present mode of operations (PMO). The network analytics use case allows the WAN to
use OpenFlow to route, filter and replicate to multiple analytics tools. This provides flexible
and responsive access to business information needed to increase the efficiency of the
networking operation and to support the creation of incremental revenue streams.
ACG Research analyzed the TCO, network capital expense (CapEx), network operation
expense (OpEx), and labor cost to process service orders of the three use cases. It found that
SDN dramatically increases the speed of bringing order processing systems online and the
speed of processing individual service orders. The time to set up the order processing system
is reduced from one year under the PMO to four months using SDN. The time to process a
single order is reduced by a factor of seven. Though direct costs of building and operating the
network are reduced by using SDN the majority of the business benefit of SDN is derived
from speeding up and reducing the cost of the service order process.

2
Introduction
Software-Defined Networking (SDN) offers service providers a vehicle to reduce service delivery costs
and increase service velocity. SDN links networks and applications, enabling direct programmatic control
of the network in line with end-users’ application needs, rather than programming around the network,
as is done today. By having access to network topology information, applications can optimize decisions
related to service fulfillment, service placement, and service removal. The network has the intelligence
to provide guidance to a key set of applications through abstraction, including peer-to-peer, content
distribution, and data center applications.
SDN supports efficient use of network and operational resources in the following ways:
Automation: SDN enables operations automation by linking OpenFlow to Operational Support Systems
(OSSs) through software architectures such as REpresentational State Transfer (REST), which enables
rapid service changes and service creation.
Efficiency of assets: SDN provides network operators an accurate depiction of network topology and
usage and the control to eliminate unnecessary capacity increases and, thus, produces CapEx savings.
Incremental revenue streams: SDN supports self-service portals, enabling customers to tailor the
network to accommodate their application or service needs. This increases service innovation, flexibility
and responsiveness and drives increased service profitability.
Business intelligence: SDN taps data held in the network to improve many things: from real-time
information and location-based offerings to new service insertion points, as well as intelligent
applications that can reroute themselves based on network data. The result is better customer quality
systems and user experiences, and more efficient network operations.
Three use cases are analyzed to illustrate the business case for SDN:
1. Services Creation and Insertion: SDN automates traffic steering to achieve a desired pipeline of
services such as firewall and Intrusion Detection System (IDS).
2. WAN Network Virtualization: Provides an OpenFlow overlay to an existing L2/L3 VPN-IP network
among data centers.
3. Network Analytics: An SDN approach to network analytics allows the WAN to use an OpenFlow
overlay or passive optical taps for traffic replication to the analytics network, the analytics
network to use OpenFlow for traffic filtering and replication to multiple analytics tools, and a
network analytics application that resides on the SDN controller.
TCO comparisons are made between the Present Mode of Operations (PMO) and the SDN solution for
each use case. A hybrid solution (part PMO and part SDN) also is compared to the PMO for the WAN
Network Utilization use case. Four TCO categories are computed for all use case comparisons.
1. CapEx for the WAN router and SDN controller.
3
2. OpEx items associated with the installation, operation and maintenance of the WAN router and
SDN controller.
3. Labor expenses associated with setting up the service delivery systems and software.
4. Labor expenses for processing subscribers’ service orders.
In addition, service velocity (the time required to set up service delivery systems and to process
individual service orders) is compared for the PMO and SDN solutions.
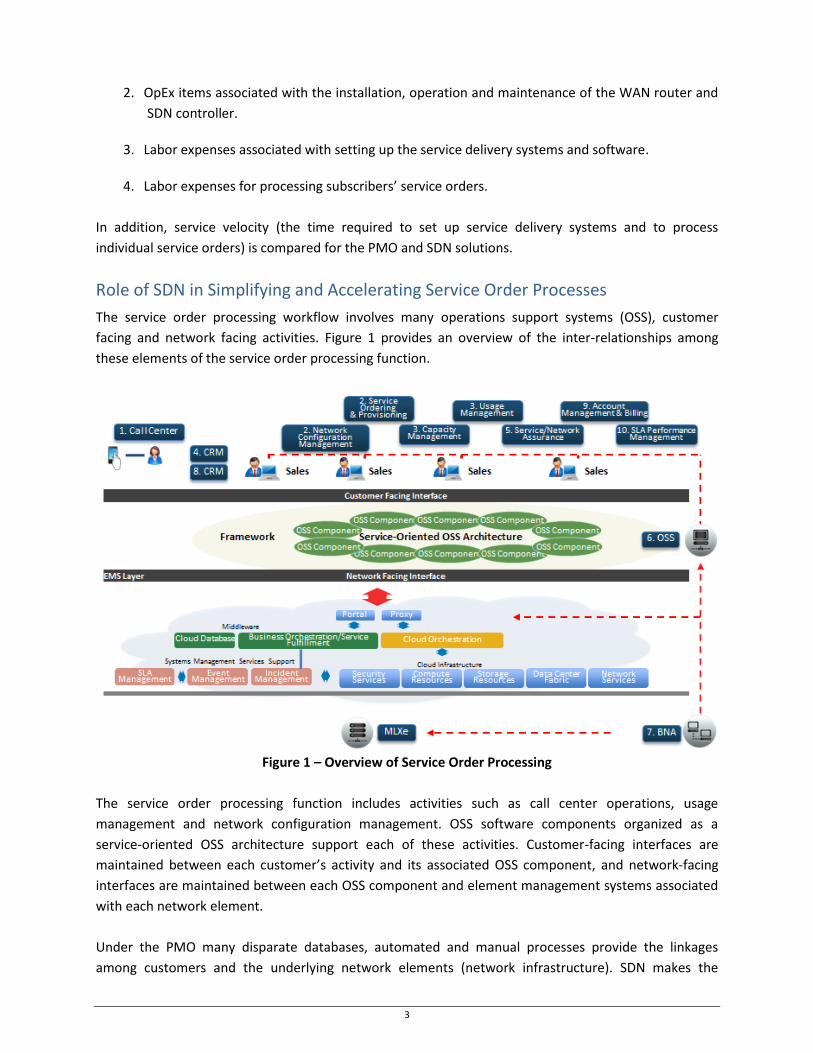
Role of SDN in Simplifying and Accelerating Service Order Processes
The service order processing workflow involves many operations support systems (OSS), customer
facing and network facing activities. Figure 1 provides an overview of the inter-relationships among
these elements of the service order processing function.
Figure 1 – Overview of Service Order Processing
The service order processing function includes activities such as call center operations, usage
management and network configuration management. OSS software components organized as a
service-oriented OSS architecture support each of these activities. Customer-facing interfaces are
maintained between each customer’s activity and its associated OSS component, and network-facing
interfaces are maintained between each OSS component and element management systems associated
with each network element.
Under the PMO many disparate databases, automated and manual processes provide the linkages
among customers and the underlying network elements (network infrastructure). SDN makes the

4
linkages among customers and network elements explicit and automated. The next paragraphs provide
a detailed comparison of PMO versus SDN service order processing.
Figure 2 illustrates PMO workflows.
Figure 2 – PMO Service Order Processing Workflows
The work flows from left to right in the figure. EMSs must provide access to each vendor’s network
elements so that service orders can be executed. In the second step customer state information must be
mapped to individual network elements (devices). Device and routing information must be passed to the
CRM system.
Figure 2 shows that the PMO has many inconsistencies and manual processes that retard service
velocity and impair the quality of the service order process. There is no common northbound interface
between the EMSs and the OSS components. This increases complexity that can obstruct service velocity
and introduce errors. Some northbound data is entered manually, which is even slower and more error
prone. Each EMS has its own proprietary database and API, which introduces further complexity. Passing
of customer state information between the configuration database of each EMS and the OSS
provisioning system is particularly slow and error prone because there is no mapping of a customer’s
state to network devices. This must be done manually. Finally, passing of network device and routing
information from each EMS to the CRM system requires custom programming for the EMS system of
each system vendor.
Figure 3 illustrates SDN service order processing workflows.

5
Figure 3 – SDN Service Order Processing
The figure shows a greatly simplified workflow as compared to the PMO. Databases are standardized
and consolidated. All APIs are OpenFlow. REST software architecture rather than various vendors’
proprietary EMS systems is used throughout, and all manual interfaces have been eliminated. This
simplifies service order processing and results in lower setup and processing costs and higher service
velocity.
Service Creation and Insertion Use Case
The services creation and insertion use case automates traffic steering to achieve a desired pipeline of
services and customizes services to meet each customer’s specific needs. Figure 4 illustrates the
network configuration.
Figure 4 – SDN Service Creation and Insertion

6
The network consists of an OpenFlow-enabled router that steers traffic to IP services (firewall and IDS in
this example). An SDN controller and services insertion software provide routing and configuration
commands to the router. Standardized APIs support automation of the service creation process thereby
eliminating the use of CLI and other manual service creation processes. Standardization on OpenFlow
also eliminates the use of disparate vendor-specific EMSs used to control the individual IP services.
This configuration optimizes the use of network resources by eliminating the need to steer traffic
through the IP service appliances. This increases the traffic utilization of the router and on each IP
service appliance that, in turn, reduces I/O port requirements and associated CapEx. The sources of
CapEx savings are analyzed in the TCO results discussion that follows. Finally, service velocity is
increased (as discussed in the previous section), which results in much faster service delivery and
significantly lower service order processing costs.
WAN Network Virtualization Use Case
The WAN network virtualization use case is a protected traditional L2/L3 VPN-IP network
interconnecting data centers with an OpenFlow overlay. Figure 5 provides an overview of the network
architecture.
Figure 5 – WAN Network Virtualization
In this design an OpenFlow overlay and associated WAN SDN controller is added to an existing
production network. OpenFlow does not affect traditional traffic, and protection is provided in
hardware. A hybrid port mode is created. This allows for deployment of the initial OpenFlow overlay
service with reduced risk to ongoing operations. As SDN handles an increasing traffic share network
capacity additions are reduced because SDN provides better network usage visibility and routing
flexibility that allows operation at higher capacity utilization levels.
Centralization of network control in the SDN controller also reduces network CapEx by allowing the use
of lower cost line cards in each WAN router. As discussed previously, SDN increases service velocity with
very large reductions in service delivery times and service order processing costs.

7
Network Analytics Use Case
An SDN approach to network analytics allows the WAN to use an OpenFlow overlay or passive optical
taps for traffic replication to the analytics network. Figure 6 illustrates a network analytics use case for a
mobile operator.
Figure 6 – Network Analytics for a Mobile Operator
Network analytics are used to provide real-time
network statistics for collection and alerting,
summarization of normal and abnormal traffic, and
detection of network performance issues in advance of
customers’ complaints. Under SDN the WAN may use an
OpenFlow overlay or passive optical taps for traffic
replication to the analytics network. A centralized
network analytics software application and SDN
controller use an OpenFlow router to provide traffic
filtering and replication to multiple analytic tools.
The OpenFlow router in combination with the network
analytics application and SDN controller optimizes the
use of network resources by eliminating the need to
steer traffic through the network analytics tools and
without impacting the production network and users.
Centralization of the route processing function in the
SDN controller allows lower cost line cards to be
deployed in the router, which reduces overall network
cost. Finally, service velocity is increased (as discussed
previously), which results in much faster service delivery
and much lower service order processing costs.
Network Analytics Applications
Data analysis is moving from a batch or data warehouse
paradigm to a real-time streaming data model.
Analytics tools include:
HTTP Analyzer
VoIP Analyzer
Intrusion Detection
Billing Applications Analytics tools are being applied in many fields:
Telephony o CDR processing o Churn prediction
Stock Market o Weather impact on securities prices o Ultra-low latency market analysis
Law Enforcement, Defense, & Cyber Security o Real-time multimodal surveillance o Situational awareness
Fraud Prevention o Detecting multiparty fraud o Real-time fraud prevention
Health & Life Sciences o Epidemic early warning system o Remote healthcare monitoring
Smart Grid & Energy o Demand-side management o Distribution automation

8
TCO Analysis
The TCO for the three use cases is compared for the SDN solutions versus the PMO solutions.
Common TCO Modeling Assumptions
The following modeling assumptions are made for all three use cases:
CapEx is computed for the PMO or SDN router, SDN controller and the element management
system of the PMO.
Network OpEx includes operations expenses required to deploy and maintain the router, SDN
controller and element management system of the PMO.
Labor costs only are computed for setup of the service order processing system and for
processing service orders.
TCO is computed for five years.
All CapEx and the labor cost to set up service order processing are incurred in the first year.
Network OpEx and the labor cost of service order processing are computed for five years.
Brocade MLXe series routers are used for the PMO, hybrid, and SDN use case solutions; MLXe
line cards with higher processing capacity are deployed for the PMO.
Service Creation and Insertion Use Case TCO
The TCO of the PMO and SDN solutions is compared for the service creation and insertion use case by
modeling the single router chassis solution in Figure 4. Input data and assumptions are shown in Table 1.
Input Item Amount
WAN 10GE Ports 14
PMO Maximum Port Utilization 50%
SDN Maximum Port Utilization 80%
Number of Service Orders Processed per Day 100
Table 1 – Input Items for Service Creation and Insertion Use Case
Port utilization is higher for the SDN solution than for the PMO due to the network awareness of the
business applications and the business intelligence provided by the SDN network design1.
Service Creation and Insertion Use Case TCO Comparisons
Table 2 summarizes the TCO analysis.
TCO Category ($ Millions) Percentage
Savings PMO SDN
Network CapEx $1.0 $0.6 -39%
Network OpEx $1.1 $0.8 -31%
Labor Cost for Order Processing Setup $0.3 $0.1 -77%
Labor Cost for Order Processing $43.7 $6.2 -86%
TCO $46.1 $7.7 -83%
Table 2 – TCO Comparison for Service Creation and Insertion
1 See the “Service Creation and Insertion Use Case” section of the whitepaper for further discussion of SDN enabled network
awareness and business intelligence.

9
Although SDN produces substantial percentage savings in all cost categories, labor cost savings of order
processing are significantly larger than those of the other categories. (The role of SDN in increasing
service velocity and reducing order processing costs was discussed in a previous section.) Order
processing time is reduced from seven hours under the PMO to one hour using SDN. The time to set up
the order processing system is reduced from one year under the PMO to four months using SDN. Labor
cost savings are reduced in the same proportions.
Network CapEx is 39 percent lower for SDN than PMO. The savings come from three sources:
1. Higher utilization of network resources: SDN links the applications layer in real time to the
physical network; in-turn, the network provides real-time state information to the applications
layer. The two-way information flow permits compliance with SLAs at higher port utilization
levels and thus reduces CapEx requirements.
2. Better scale effects from 100 Gbps router ports: Brocade MLXe 100 Gbps router ports have
lower unit costs ($/Gbps) than lower speed ports. The more intelligent approach of SDN to
network control leverages the 100 Gbps port scale economies.
3. Low-cost 10 GE line cards: The centralized SDN control plane reduces the need to provide route
processing functions on the individual line cards. The cost savings achieved by using low-cost
line cards more than offsets the cost of the centralized SDN controller and produces a net CapEx
reduction.
Figure 7 breaks out the individual network OpEx cost categories and labor cost associated with setting
up the order processing system.
Figure 7 – OpEx Breakdown Excluding Service Order Processing for Service Creation and Insertion Use
Case

10
The largest OpEx savings are realized in the service order process setup, training and service contract
expense categories. Service order process setup costs less under SDN because consolidation and
standardization of databases and use of a standard API (OpenFlow) and Restful APIs take much of the
work out of the setup process. Training costs are reduced because using a centralized SDN controller
limits the number of people who must receive intensive training on the control plane functions. Service
contract expense is closely linked to CapEx. The lower CapEx of the SDN yields correspondingly lower
service contract expense.
WAN Network Utilization Use Case TCO
The TCO for the WAN network utilization use case is compared for PMO, SDN and a hybrid solution
where traffic is gradually moved from PMO ports to SDN ports. The architectural design is shown in
Figure 5. The WAN interconnects eight data centers using the network topology shown in Figure 8.
Figure 8 – Inter-Data Center WAN Network Topology
An Open Shortest Path First routing algorithm is used to assign port requirements on the WAN, giving
data center side ports as input data for each data center. Input data and assumptions are in Table 3.
Input Item Amount
Number of WAN Nodes 8
Capacity Expansion Model Greenfield
Backup Protocol 1+1 Fast Reroute
Core Router Port Size 10GE
PMO Maximum Port Utilization 50%
Hybrid Maximum Port Utilization 65%
SDN Maximum Port Utilization 75%
Number of Orders Processed per Day 10
Table 3 – WAN Network Virtualization Inputs and Assumptions

11
Table 4 displays the number and size of ports on the data center side of each WAN node.
Node Number Number of Ports Port Speed
1 8 10GE
2 14 10GE
3 2 100GE
4 1 100GE
5 2 10GE
6 3 10GE
7 3 10GE
8 2 10GE
Table 4 – Ingress Ports at Each WAN Node
WAN Network Virtualization Use Case TCO Results
Table 5 summarizes the TCO comparison.
TCO Category TCO ($ Millions) Percentage Savings
PMO Hybrid SDN Hybrid SDN
Network CapEx $3.3 $2.1 $1.7 -37% -49%
Network OpEx $2.9 $2.7 $1.8 -10% -38%
Labor Cost for Order Processing Setup
$0.3 $0.1 $0.1 -77% -77%
Labor Cost for Order Processing
$4.4 $2.5 $0.6 -43% -86%
TCO $10.9 $7.3 $4.2 -33% -61%
Table 5 – WAN Network Virtualization Use Case TCO Comparison
The SDN and hybrid solutions have 61 percent and 33 percent lower TCO, respectively, over five years as
compared to the PMO solution. In this use case labor cost for order processing does not overwhelm the
other TCO cost categories as it did in the service creation and insertion use case. The WAN network
virtualization use case uses significantly more network equipment and has a much lower order
processing requirement as compared to the service creation and insertion use case.
SDN produces substantial network CapEx savings due to the centralization of the control plane function
and the increase in two-way information flows between the applications layer and the physical network.
This and the dramatic reduction in service order processing costs of the SDN are the root causes of TCO
savings of the SDN and the hybrid solutions.
Network Analytics Use Case TCO
The TCO of the PMO and SDN solutions is compared for the network analytics use case by modeling the
single router chassis solution shown in Figure 6. Input data and assumptions are displayed in Table 6.

12
Input Item Amount
WAN 10GE Ports 8
PMO Maximum Port Utilization 50%
SDN Maximum Port Utilization 80%
Number of Service Orders Processed per Day 5
Table 6 – Input Items for Network Analytics Use Case
Port utilization is higher for the SDN solution than for the PMO due to the network awareness of the
business applications and the business intelligence provided by the SDN network design2.
Network Analytics Use Case TCO Comparisons
Table 7 summarizes the TCO analysis.
TCO Category ($ Millions) Percentage
Savings PMO SDN
Network CapEx $0.6 $0.5 -13%
Network OpEx $0.7 $0.6 -17%
Labor Cost for Order Processing Setup $0.3 $0.1 -77%
Labor Cost for Order Processing $0.9 $0.1 -86%
TCO $2.5 $1.3 -48%
Table 7 – TCO Comparison for Network Analytics
SDN produces significant increases in service velocity (the time to set up the network analytics
production process and to execute orders for new analytic services) and corresponding decreases in the
labor cost to execute orders for new analytic services. This provides the flexibility and speed needed to
achieve operational excellence and support proactive marketing and sales initiatives.
Conclusion
SDN offers a process for reducing service delivery costs and increasing service velocity. SDN design
supports process automation and enhances the two-way flow of business intelligence between the
network infrastructure and high-level business applications thereby increasing the efficiency of network
assets and supporting the creation of incremental revenue streams.
The TCO of three use cases are analyzed:
1. Services Creation and Insertion: SDN automates traffic steering to achieve a desired pipeline of
services such as firewall and IDS.
2. WAN Network Virtualization: Provides an OpenFlow overlay to an existing L2/L3 VPN-IP network
among data centers.
2 See the “Network Analytics Use Case” section of the whitepaper for further discussion of SDN enabled network awareness and business
intelligence.

13
3. Network Analytics: An SDN approach to network analytics allows the WAN to use an OpenFlow
overlay or passive optical taps for traffic replication to the analytics network, analytics network
to use OpenFlow for traffic filtering and replication to multiple analytics tools, and a network
analytics application to set on top of the SDN controller.
Table 8 summarizes the percentage savings produced by SDN as compared to PMO for the three use
cases.
TCO Category
SDN Percentage Savings Compared to PMO
Service Creation & Insertion
WAN Virtualization
Network Analytics
Network CapEx 39% 49% 13%
Network OpEx 31% 38% 17%
Labor Cost for Order Processing Setup 77% 77% 77%
Labor Cost for Order Processing 86% 86% 86%
TCO 83% 61% 48%
Table 8 – SDN Percentage Savings of TCO as Compared to TCO
Service velocity is also dramatically increased by reducing order processing setup time from one year to
four months and by a seven to one reduction in order processing time.
ACG Research
ACG Research is an analyst and consulting company that focuses in the networking and telecom space. Our best-in-
class subject matter analysts have a combined 120+ years of experience and expertise in telecom segments that
address both technology and business issues. We offer comprehensive, high-quality, end-to-end business
consulting and syndicated research services. Copyright © 2013 ACG Research.