business and competitive analysis
TRANSCRIPT

Business and Competitive Analysis

In an increasingly competitive world, it is quality of thinking that gives an edge—an idea thatopens new doors, a technique that solves a problem, or an insight that simply helps make sense of it
all.We work with leading authors in the various arenas of business and finance to bring cutting-edge
thinking and best-learning practices to a global market.It is our goal to create world-class print publications and electronic products that give readers
knowledge and understanding that can then be applied, whether studying or at work.To find out more about our business products, you can visit us at www.ftpress.com.
Business and Competitive Analysis
Effective Application of New and Classic Methods
Craig S. Fleisherand Babette E. Bensoussan
An imprint of PEARSON EDUCATIONUpper Saddle River, NJ • New York • London
San Francisco • Toronto • Sydney • Tokyo • SingaporeHong Kong • Cape Town • Madrid • Paris • Milan
Munich • Amsterdam

Vice President, Publisher: Tim MooreAcquisitions Editor: Martha CooleyEditorial Assistant: Pamela BolandDevelopment Editor: Russ HallAssociate Editor-in-Chief and Director of Marketing: Amy NeidlingerPublicist: Amy FandreiMarketing Coordinator: Megan ColvinCover Designer: Chuti PrasertsithManaging Editor: Gina KanouseProject Editor: Betsy HarrisCopy Editor: Water Crest PublishingProofreader: Language Logistics, LLCSenior Indexer: Cheryl LenserCompositor: Moore Media, Inc.Manufacturing Buyer: Dan Uhrig
© 2007 by Pearson Education, Inc.Publishing as FT PressUpper Saddle River, New Jersey 07458FT Press offers excellent discounts on this book when ordered in quantity for bulk purchases orspecial sales. For more information, please contact U.S. Corporate and Government Sales, 1-800-382-3419, [email protected]. For sales outside the U.S., please contactInternational Sales at [email protected] and product names mentioned herein are the trademarks or registered trademarks of theirrespective owners.All rights reserved. No part of this book may be reproduced, in any form or by any means, withoutpermission in writing from the publisher.Printed in the United States of AmericaFirst Printing February, 2007ISBN 0-13-187366-0Pearson Education LTD.Pearson Education Australia PTY, Limited.Pearson Education Singapore, Pte. Ltd.Pearson Education North Asia, Ltd.Pearson Education Canada, Ltd.Pearson Educatión de Mexico, S.A. de C.V.Pearson Education—JapanPearson Education Malaysia, Pte. Ltd. Library of Congress Cataloging-in-Publication Data
Fleisher, Craig S. Business and competitive analysis methods: effective application of new and classicmethods/CraigFleisher, Babette Bensoussan.

p. cm. ISBN 0-13-187366-0 (hardback : alk. paper) 1. Business intelligence. 2. Competition. I.Bensoussan,Babette E. II. Title.
HD38.7.F57 2007 658.4'032—dc22 2006030892

DedicationThis book is dedicated to my immediate family, my wonderful wife Angela and three awesome
boys Zachary, Austin, and Kieren. They have contributed love, patience, and understanding—characteristics that were particularly needed during the cold, winter months as we put the
finishing touches on this effort and tried to keep the synapses connected. Thanks again everybody—I couldn't have done it without you and your support.
—Craig S. FleisherI dedicate this book to Garry Johnston, my husband and best friend. His encouragement,
patience, and love throughout the countless days, weeks, and months involved were instrumentalin me emerging with some semblance of sanity. Garry, you have been a tower of strength. Thank
you.—Babette E. Bensoussan

Table of ContentsAcknowledgmentsAbout the AuthorsPreface1 Business and Competitive Analysis: Definition, Context, and Benefits
Understanding the TerminologyCompetitiveStrategicAnalysisIntelligence
Analysis as a Component in the Intelligence CycleCompetitive Analysis and Decision Making
The Competitive Context Facing Contemporary EnterprisesContemporary Context Facing the Analyst
Shifting Organizational Priorities for Analysts and AnalysisSummaryReferencesEndnotes2 Performing the Analysis Process
Understanding the Customers of AnalysisDefining the Analysis ProblemIdentifying the Scope of the Analysis
Intelligence Analysis at Differing Organizational LevelsStrategic Intelligence Analysis (SIA)Tactical Intelligence Analysis (TIA)Operational Intelligence Analysis (OIA)
Evaluating the Inputs to AnalysisMaking Sense of the Analysis
FactsPerceptionsBeliefsAssumptionsProjectionsSynthesis
Infrastructure to Support the Analysis ProcessIntelligence SolutionsLimitations of Intelligence SolutionsManaging the Internal NetworkManaging the External NetworkProactivity, Efficiency, and Perpetual Learning
SummaryFleisher and Bensoussan's 10 Commandments for Business and Competitive Analysis
References
Endnotes3 Avoiding Analysis Pitfalls
Analysis of FailureFailure LocationSources of Failure
Four-Level Hierarchical Model of Analysis FailuresIndividual Analyst-Level FailuresAnalysis Task-Level FailuresInternal Organizational-Level FailuresExternal Environment-Level Failures
Overcoming the Barriers and Improving Analysis PerformanceProvide EmpowermentRealize the Value of AnalysisValue the Link Between Analysis and SuccessAsk the Right QuestionsDevelop Recognized Analysis TrainingMeasure Performance AppropriatelyPosition the Analyst CorrectlyProvide the Right ToolsDifferentiate the Task
SummaryReferencesEndnotes4 Communicating Analysis Results
The Art of Effective CommunicationPackaging the Results of Your AnalysisDelivering the Message
Face-to-Face BriefingsWritten Reports and BriefingsPresentations in Meetings, Seminars, and WorkshopsE-Mail/Instant MessagingIntelligence SystemsExercises and Planning Sessions
Common Products and Reports Used by AnalystsNews Bulletins and NewslettersAssessmentsCompetitor ProfilesStrategic Impact WorksheetsIntelligence BriefingsSituation AnalysisSpecial Intelligence Summaries
Creating the ReportCommunication Difficulties Faced by AnalystsEffective Listening and Answering the Questions of Decision MakersConduct Communication Follow-Up and Gather Feedback
Pragmatic ConsiderationsSummaryReferencesEndnotes5 Applying the FAROUT Method
Applying the TechniquesAn Evaluation Scheme for Assessing the Adequacy of Tools and Techniques: FAROUT
Using the FAROUT Rating SystemReferencesEndnotes6 Industry Analysis (The Nine Forces)
Short DescriptionBackground
General EnvironmentOperating Environment/Industry AnalysisInternal Environment
Strategic Rationale and ImplicationsStrengths and AdvantagesWeaknesses and LimitationsProcess for Applying the TechniqueCase Study: Rating the Nine Forces Model in the Australian Airline Industry
Barriers to Entry-Weighting 9Bargaining Power of Buyers-Weighting 6Bargaining Power of Suppliers-Weighting 6Government-Weighting 6Social-Weighting 5Competitors-Weighting 9Technology-Weighting 8Substitutes-Weighting 3International-Weighting 6
FAROUT SummaryRelated Tools and TechniquesReferencesEndnotes7 Competitive Positioning Analysis
Short DescriptionBackgroundStrategic Rationale and Implications
Develop and Build on the Firm's PositionMaintain and Hold the Firm's Strong Market PositionDefend a Dominant PositionWithdraw from a Market
Strengths and AdvantagesWeaknesses and LimitationsProcess for Applying the Technique

Identify Current Strategy and Market/Product/Project ParametersConduct AnalysisReview Results and Formulate Positioning Strategy
SummaryCase Study: Financial ServicesFAROUT SummaryRelated Tools and TechniquesReferencesEndnotes8 Business Model Analysis
Short DescriptionBackgroundStrategic Rationale and ImplicationsThe Business ModelClassification of Business ModelsStrengths and Advantages
ComprehensiveDetailed UnderstandingIntegration of Value Delivery MechanismInnovation
Weaknesses and LimitationsDisruption from Outside the IndustryInnovationMarket Orientation
Process for Applying the TechniqueStep 1: Articulate the Value PropositionStep 2: Specify the Target SegmentStep 3: Determine CompetitorsStep 4: Evaluate the Value Chain and the Cost ModelStep 5: Evaluate the Value NetworkStep 6: Determine the Revenue Model for the FirmStep 7: Determine the Critical Success Factors for the IndustryStep 8: Complete an Analysis Grid Detailing Each Element of the Business Model
Case Study: Dell Computer and the Printer MarketFAROUT SummaryRelated Tools and TechniquesReferencesEndnotes9 SERVO Analysis
Short DescriptionBackground
StrategyEnvironmentResourcesValues
OrganizationStrengths and AdvantagesWeaknesses and LimitationsProcess for Applying the Technique
Step 1: Evaluate the Current Performance of the FirmStep 2: Assess the Current Strategy and Discern Whether Change Is NecessaryStep 3: Develop and Evaluate Strategic Options and Programs
FAROUT SummaryRelated Tools and TechniquesReferencesEndnotes10 Supply Chain Management (SCM) Analysis
Short DescriptionBackgroundStrategic RationaleStrengths and AdvantagesWeaknesses and LimitationsProcess for Applying the Technique
Rules and ToolsCase Study: ATale of Two Supply Chains: Best Buy vs. Sears/KmartFAROUT SummaryRelated Tools and TechniquesReferencesEndnotes11 Benchmarking Analysis
Short DescriptionBackgroundStrategic Rationale and Implications
Taxonomy of BenchmarkingStrengths and Advantages
Powerful Competitive Analysis ToolObjective Stretch Goal Setting and Performance MeasurementFlexibilityRemoval of BlindspotsImproves Cost Efficiencies and QualityNot Reinventing the Wheel but Redesigning ItMedia RecognitionRequirement for Other CertificationsCreates an Innovative Culture Open to New Ideas
Weaknesses and LimitationsCopycat SyndromeHigh Rate of FailureWhat Works Well in One Organization Might Not Work in AnotherBenchmarking Is Resource IntensiveNo Firm Does Everything the Best
Low-Performing Firms Have a DisadvantageSome High-Performing Companies May Not Be Willing to Share Information
Process for Applying the TechniqueStep 1: Identify the Processes That Need to Be BenchmarkedStep 2: Identify Performance MeasuresStep 3: Evaluate Your Own Firm's CapabilitiesStep 4: Identify Firms to Be BenchmarkedStep 5: Conduct Research of Selected FirmsStep 6: Analyze the Collected Data and Develop an Action Plan
Case Study: Delivery of Packages by Federal ExpressStep 1: Identify the Process That Needs to Be BenchmarkedStep 2: Identify Performance MeasuresStep 3: Evaluate Own Firm's CapabilitiesStep 4: Identify Firms to Be BenchmarkedStep 5: Conduct Research from Selected FirmsStep 6: Analyze the Collected Data and Develop an Action Plan
FAROUT SummaryRelated Tools and TechniquesReferencesEndnotes12 McKinsey 7S Analysis
Short DescriptionBackgroundStrengths and AdvantagesWeaknesses and LimitationsProcess for Applying the TechniqueCase Study: Privatization of Kenya Airways in the New MillenniumFAROUT SummaryRelated Tools and TechniquesReferencesEndnotes13 Shadowing
Short DescriptionBackgroundStrategic Rationale and ImplicationsStrengths and AdvantagesWeaknesses and LimitationsProcess for Applying the Technique
Shadow TeamsTeam CompositionTeam StructurePerformance GoalsShadowingDeveloping a Shadow Market Plan
Case Study: Illuminating Strategy by Shadowing

Sources of InformationInferencesConfirmationTentative ConclusionsMonitoring
Mini Case StudiesCase 1-Deregulating UtilityCase 2-Packaged-Food MultinationalCase 3-Ready-to-Eat FoodsCase 4-Pharmaceutical Firm
FAROUT SummaryRelated Tools and TechniquesReferencesEndnotes14 Product Line Analysis
Short DescriptionBackgroundStrategic RationaleStrengths and AdvantagesWeaknesses and LimitationsProcess for Applying the Technique
Step 1: Initial Product AuditStep 2: Assess the Product Relative to Its Position in the Product Life Cycle
Case Study: eBay, Inc. in 2004FAROUT SummaryRelated Tools and TechniquesReferencesEndnotes15 Win/Loss Analysis
Short DescriptionBackgroundStrategic Rationale and ImplicationsStrengths and AdvantagesWeaknesses and LimitationsProcess for Applying the Technique
Step 1: Determine the Target Segments and Identify ProspectsStep 2: Understand Internal Cultural IssuesStep 3: Develop the QuestionnaireStep 4: Preparation for the InterviewsStep 5: Conducting InterviewsStep 6: Analysis and InterpretationStep 7: Dissemination
Case Study: Microsoft Business SolutionsUnderstanding the EnvironmentLearning from Their Losses

Leveraging the DataKeeping Current
FAROUT SummaryRelated Tools and TechniquesReferencesEndnotes
16 Strategic Relationship AnalysisShort DescriptionBackgroundStrategic Rationale
Purposes Served by SRsTwo Key Strategic Relationship Processes
Strengths and AdvantagesWeaknesses and LimitationsProcess for Applying the Technique
1. Studying Your Own Firm's Relationship Formation Readiness2. Studying a Rival's Relationships
FAROUT SummaryRelated Tools and TechniquesReferencesEndnotes
17 Corporate Reputation AnalysisShort DescriptionBackgroundStrategic Rationale and ImplicationsStrengths and Advantages
UniversalBottom LineCompetitive DifferentiationQualitative
Weaknesses and LimitationsPractical UsesReliability of ResultsReturn on Investment
Process for Applying the TechniqueReputation QuotientFocused CRAMedia Ranking and MonitoringReputation Management
Case StudyFAROUT SummaryRelated Tools and TechniquesReferencesEndnotes
18 Critical Success Factors Analysis

Short DescriptionBackgroundStrategic Rationale and ImplicationsStrengths and AdvantagesWeaknesses and LimitationsProcess for Applying the Technique
Leidecker and Bruno's Identification TechniquesDetermining Critical Success Factor Importance
SummaryFAROUT SummaryRelated Tools and TechniquesReferencesEndnotes
19 Country Risk AnalysisShort DescriptionBackgroundStrategic RationaleStrengths and AdvantagesWeaknesses and LimitationsProcess for Applying the Technique
Economic RiskTransfer RiskExchange RiskLocation/Neighborhood RiskSovereign RiskPolitical Risk
Case Study: Zyboldt Metals (ZMC) Expansion into Eastern EuropeHungaryUkraine
FAROUT SummaryRelated Tools and TechniquesReferencesEndnotes
20 Driving Forces AnalysisShort DescriptionBackgroundStrategic RationaleStrengths and AdvantagesWeaknesses and LimitationsProcess for Applying the Technique
Step 1: Identifying an Industry's DFsStep 2: Assessing the Impact of the DFs
SummaryCase Study: The Digital Music IndustryFAROUT Summary
Related Tools and TechniquesReferencesEndnotes
21 Event and Timeline AnalysisShort DescriptionBackgroundStrategic Rationale and ImplicationsStrengths and AdvantagesWeaknesses and LimitationsProcess for Applying the Technique
Plot the Target Firm's History of Key Events on a LineDevelop a Chronological Table of EventsDevelop an Events MatrixEvent and Causal Factors Analysis
Case StudyTimelines in Competitive Analysis
Development of the TimelineFAROUT SummaryRelated Tools and TechniquesReferencesEndnotes
22 Technology ForecastingShort DescriptionBackgroundStrategic Rationale and ImplicationsStrengths and AdvantagesWeaknesses and LimitationsProcess for Applying the Technique
1. Delphi Technique-Expert Opinion2. Trend Extrapolation3. Growth Curves4. Historical Analogy5. Scenarios6. Morphological Analysis7. Relevance Trees8. Monitoring
Using the InformationCase Study: Bell Canada and the Delphi ProcessFAROUT SummaryRelated Tools and TechniquesReferencesEndnotes
23 War GamingShort DescriptionBackground
Strategic Rationale and ImplicationsStrengths and AdvantagesWeaknesses and LimitationsProcess for Applying the Technique
Step 1: Is a War Game the Way to Go?Step 2: Getting a Business War Game Off the GroundStep 3: Who Should Play?Step 4: Preparing for Your War GameStep 5: Playing the GameStep 6: After the Game
Case StudyFAROUT SummaryRelated Tools and TechniquesReferencesEndnotes
24 Indications and Warning AnalysisShort DescriptionBackgroundStrategic Rationale and ImplicationsStrengths and AdvantagesWeaknesses and LimitationsProcess for Applying the Technique
Step 1: Establish the Set of IndicatorsStep 2: Establish Meaning Behind IndicatorsStep 3: Validate and Rank Indicators Against Threshold Levels to Determine When Warnings
Need to Be IssuedStep 4: Determine and Recommend Appropriate Firm Responses to the Warning
SummaryFAROUT SummaryRelated Tools and TechniquesReferencesEndnotes
25 Historiographical AnalysisShort DescriptionBackgroundStrategic Rationale and ImplicationsStrengths and AdvantagesWeaknesses and LimitationsProcess for Applying the Technique
Step 1-Develop a General PropositionStep 2-Collect Primary InformationStep 3-Collect Secondary InformationStep 4-Select the Best Sources for the Third DraftStep 5-Reporting
Case Study-Australian Menswear Retailer
FAROUT SummaryRelated Tools and TechniquesReferencesEndnotes
26 Interpretation of Statistical AnalysisShort DescriptionBackgroundStrategic Rationale and ImplicationsStrengths and AdvantagesWeaknesses and LimitationsProcess for Applying the Technique
Percentage ChangesPercentiles and QuartilesNormal Distribution and Bell CurveSummarizing Data with One Value-Central TendencyStandard DeviationComparing DataRegression AnalysisCorrelationP-Values
FAROUT SummaryRelated TechniquesReferencesEndnotes
27 Competitor Cash Flow AnalysisShort DescriptionBackgroundStrategic Rationale and ImplicationsStrengths and AdvantagesWeaknesses and LimitationsProcesses for Applying This Technique
Future Cash Flow AnalysisTip Sheet on Cash Flow Analysis
Case StudiesHistoric Cash Flow Analysis: Burns PhilpFuture Cash Flow Analysis: Power Brewing
FAROUT SummaryRelated Tools and TechniquesReferencesEndnotes
28 Analysis of Competing HypothesesShort DescriptionBackgroundStrategic Rationale and ImplicationsStrengths and Advantages

Weaknesses and LimitationsProcess for Applying the Technique
Step 1: Identify the Possible Hypotheses to Be ConsideredStep 2: List the Significant Evidence in Support of and Against Each HypothesisStep 3: Prepare a Matrix with Hypotheses Across the Top and Evidence Down the SideStep 4: Refine the MatrixStep 5: Draw Tentative Conclusions About the Relative Likelihood of Each Hypothesis by
Trying to Disprove ItStep 6: Analyze How Sensitive Your Conclusion Is to a Few Critical Pieces of EvidenceStep 7: Report ConclusionsStep 8: Identify Milestones for Future Observation That May Indicate Events Are Taking a
Different Course Than ExpectedSummaryFAROUT SummaryRelated Tools and TechniquesReferencesEndnotes
29 Linchpin AnalysisShort DescriptionBackgroundStrategic Rationale and ImplicationsStrengths and AdvantagesWeaknesses and LimitationsProcess for Applying the Technique
Linchpin Assumption Sensitivity AnalysisProcess for Using Linchpin Analysis in Assessing Risk
FAROUT SummaryRelated Tools and TechniquesReferencesEndnotes
Index

AcknowledgmentsI, Craig Fleisher, want to express my gratitude and thanks to a number of friends and colleagueswithout whose help the book could not be written. My first expression of gratitude goes out to my co-author Babette Bensoussan, who worked alongside me for the last few years in developing this text.Second, a big dose of thanks goes out to Sheila Wright, my colleague and fellow SCIP Board memberwho researches and teaches competitive intelligence and marketing courses at Leicester BusinessSchool (De Montfort University, UK), and who was a magnificent and timely help in polishing Part 1,as well as being a particularly helpful sounding board for my ideas. Go Tigers! My highly capableresearch assistant Jennifer White did a marvelous job in helping me uncover and organize thematerials as well as develop PowerPoint slides for each of the technique chapters, and Sanjay Guptaassisted in reviewing and commenting upon several chapters—particularly the one on business modelanalysis, which he helped develop, as did my long-time research assistant Victor Knip, who was hisusual hard-working self.I also want to thank the many individuals who helped review these chapters and provided valuableadvice. I'd particularly like to thank long-time competitive intelligence and related professionalsBrad Ashton, Albert Cruywagen, Bill Fiora, Alex Graham, Arik Johnson, Timothy Kindler, VictorKnip, Martha Matteo, Rainer Michaeli, John Prescott, Pascal Savioz, Pat Shaw, Fred Wergeles, andMelanie Wing. Thanks to many excellent MBA students in my various CI courses at the University ofWindsor, University of New Brunswick, and Wilfrid Laurier University. The book also benefitedfrom feedback from students and workshop attendees at the University of Sydney and SydneyGraduate School of Management (Australia), Nihon University (Japan—special thanks to my friendand colleague Yoshio Sugasawa), Stellenbosch University, Graduate School of Business Leadershipat UNISA (thanks to Peet Venter), University of Pretoria and North-West University in South Africa(special thanks to Wilma Viviers). They offered me a wonderful sounding board for discussing manyof the book's ideas. Additionally, I want to acknowledge David Blenkhorn, who co-taught CI coursesat WLU with me, where I also benefited from teaching related strategy courses with my colleagueKenneth Harling, and Conor Vibert of Acadia University, with whom I regularly discuss theseconcepts. Additionally, several valuable workshops and conferences held under the auspices ofSociety of Competitive Intelligence Professionals (SCIP), CBIA (South Africa) and its long-timeleader Steve Whitehead, my friends Mike Kuhn and Marie Luce-Muller of IBIS South Africa, Frost &Sullivan, KMWorld, and Marcus Evans Conferences, in particular, have also allowed me manyopportunities to hone these ideas. Last but not least, I want to express my appreciation to variousagencies that provided funding and other forms of support along the way in developing this book,including the Canadian Council for Public Affairs Advancement, National Research Council(Canada), National Research Foundation (South Africa), Odette School of Business, Dean AllanConway, and the Windsor Research Leadership Chair and Odette Research Chairs—University ofWindsor.I, Babette Bensoussan, readily acknowledge that I am right on the cutting edge of the still relativelynew competitive intelligence market in Australia. This positioning has not only presented me with amultiplicity of challenges when compiling this book, but it has also placed me in a somewhat uniqueprofessional situation.While I have been privileged to witness and indeed help create the emergence of this field inAustralia and Asia over the past decade, the fact remains that relevant expertise is still very thin on

the ground locally. This situation has, however, provided me with a wonderful opportunity to treadnew ground, refine implementation frameworks and ideas, and help excite the Australasian businessenvironment about the value that competitive intelligence can deliver when it is appliedprofessionally and comprehensively.Putting this book together in these market circumstances has been personally fulfilling and challengingat the same time. I have been propelled largely by my keenness to make competitive intelligence amore fundamental consideration in both Australian and Asian businesses. Turning that keenness intohard copy, however, would not have happened without the knowledge that everyone who knew aboutmy efforts added a dimension and fully supported me—even with just a few words of encouragementto keep me focused during the tougher times.There are several people and groups of people to whom I owe a note of thanks for their contribution—whether direct or indirect—to the existence of this book. May I firstly acknowledge and expressmy thanks to my co-author Dr. Craig Fleisher, who has shared my vision so completely in both thisand our first book. I would also like to extend heartfelt thanks and appreciation to Dr. GrahamGodbee, whose expertise in competitor cash flow analysis delivered that chapter with style. Inaddition, my continuing appreciation to my undergraduate and postgraduate students over the years atSydney's Graduate School of Management both in Sydney and Guangzhou, China, and Queensland'sBond University who have—possibly unknowingly—given me additional impetus to commit my ideasto paper; to the SCIP organization for helping to build and consolidate my international professionalprofile and allowing me to test my analytical ideas in practical situations, and to the Australasianbusiness community, who continue to provide the clay with which I work.With everything in life, you do it all with a little help from your friends—and there are several whostand out. For support in getting this manuscript finalized, I owe heartfelt thanks to Kerrie Tarrant,Carolyn Schmidt, and Korina Ashbrook—what a team—thank you. To my dearest friends—CyndiAllgaier and Christine Bull—ladies, without your ongoing encouragement, where would I be!Last but certainly not least, we thank the excellent staff at FT Press and Pearson who helped us allalong the way, particularly Martha Cooley, Betsy Harris, Russ Hall, Michael Ablassmeir, PaulaSinott, and Megan Colvin. It was a genuine pleasure to work with each of you.

About the AuthorsAuthors Fleisher and Bensoussan are uniquely placed as experts in the field of business andcompetitive analysis. They have extensive corporate consulting, research, and teaching experience instrategy and competitive intelligence and have both published and spoken internationally. Theircollaboration also brings the book a healthy balance of both theory and application.Craig S. Fleisher is the Windsor Research Leadership Chair and Professor of Management (Strategyand Entrepreneurship), Odette School of Business, University of Windsor, Ontario, Canada. He wasthe 2006 President of the Board of Directors of the international Society of Competitive IntelligenceProfessionals (SCIP), inaugural chairman of the Board of Trustees of the Competitive IntelligenceFoundation (Washington, DC), founding editor of the Journal of the Competitive Intelligence andManagement, is an SCIP Fellow, and is on several editorial boards of journals in the intelligencefield. Author or editor of eight books and scores of scholarly articles and chapters, Craig has beenrecognized as one of Canada's top MBA professors by Canadian Business magazine, is named in theCanadian Who's Who, and has taught university and executive courses in the strategy, analysis, andcompetitive intelligence areas for nearly two decades. A well-traveled speaker, he regularly advisesleading corporations, associations, and public sector agencies on CI and analysis.Babette Bensoussan is the Managing Director of The MindShifts Group Pty. Ltd., a Sydney,Australia, based consulting firm specializing in strategic planning, competitive intelligence, andstrategic marketing projects in the Asia Pacific region. Over the past 15 years, Babette has carried outover 300 intelligence and strategic projects in a wide range of industries and markets, includingaerospace, information technology/computers, insurance, transport, financial services, wasteservices, pharmaceuticals, utilities, mining, and manufacturing operations—to just name a few.Babette was a Founder and Vice President for the Society of Competitive Intelligence Professionalsin Australia (SCIPAust), a member of the Journal of Competitive Intelligence and Management andCompetitive Intelligence Review editorial boards, and was awarded the CI field's highest individualhonor by being named SCIP's Meritorious Award winner in 2006, as well as having been the firstinternational recipient of the SCIP Fellows Award in 1996. She also has successfully taughtundergraduate, MBA, and executive courses on competitive analysis and intelligence at the SydneyGraduate School of Management and Bond University.

PrefaceThis is a book about how individuals in organizations can turn data and information into insights thatdecision makers cannot and will not ignore. This book provides its readers with 24 commonlyapplied methods for helping generate actionable recommendations for decision makers, as well as ahandful of detailed chapters that address the process of competitive analysis itself.Given the priority of competitiveness in firms today, business managers need to have a benchmarkabout what business and competitive analysis is and how it works. More importantly, they need to beable to convert the wealth of available data and information into a valuable form for decision-makingand subsequent actions. Collected data must be converted into intelligence. This is accomplishedthrough analysis.Business and Competitive Analysis (BCA) is a book about analysis. Analysis is one of the moredifficult and critical roles a manager, consultant, functional specialist, strategist, or intelligenceprovider is called upon to perform. Although great strides have been made in recent years in terms ofplanning strategy and intelligence projects and collecting data, the same cannot be said for analysis.Much of the background research we performed in developing this book was derived from practiceand research in the larger field of competitive intelligence (CI). This field is not one most of ourreaders will have encountered during their formal education, and their current employers may nothave anybody with that discipline in their job titles. Nevertheless, nearly every firm performs some ofthe CI functions, and most of them perform it on a regular basis in advance of making key decisions.Analysis is one of the key roles performed by individuals in the CI field, and it is the one thatarguably generates the highest value for executives. In our view, business and competitive analysiscan and should be a key weapon in the firm's arsenal for achieving competitive advantage.Despite many advances and steady growth in the CI field, some areas of this growing field havereceived more or less attention than others. The growth of digital communication and informationtechnology and especially the Internet has led to much attention being given to processes andtechniques of data collection, as well as information and knowledge management. Planningcompetitive intelligence projects has also received a boost from the ever-present attention given morebroadly to strategic planning and strategy development. Despite these areas of popular interest, twoareas that have received disproportionately less attention are analysis and its communication. In fact,our own observations, experiences, and several studies underlie the authors' contention that manypractitioners have limited understanding of the breadth and depth of the challenge underlying theseareas.We seek to remedy this situation by offering this needed book that is devoted entirely to the process,tools, and techniques for conducting business and competitive analysis. This is our second book inthis subject matter area, with our first, called Strategic and Competitive Analysis: Methods andTechniques for Analyzing Business Competition, having been published several years ago andsubsequently translated into half a dozen different languages. We received a lot of constructivefeedback on that effort, particularly from managers and analysts who were using the techniquesdescribed in that book. Based on the feedback and reviews, readers typically found it to be anexcellent, one-stop source for reminding and guiding them on the key steps of a particular tool toaddress a particular problem they were facing, as well as providing them with an enhanced idea ofwhat was supposed to be accomplished by applying the tool. That book was used in many well-known enterprises to help train newly hired analysts and consultants. Finally, the book was used in
business school courses in scores of countries to help students learn and apply these techniques todecision-oriented case studies and "real-world" projects.We took the feedback we received and incorporated it into this book in the form of a wider range ofproven techniques and a better background on the process and context of business and competitiveanalysis. This book is absolutely not a second edition and contains completely new content. Betweenthe two books, we provide lengthy coverage of nearly 50 different techniques, which is surely themost detailed coverage of business and competitive analysis methods ever produced.We recognize that there are literally hundreds of business and competitive analysis techniques that wecould have included in this book. It was not our intention to offer an exhaustive list and detaileddescription of all these techniques. Instead, we have extensively reviewed the literature in the field,considered survey research and our own experiences in determining those techniques we view aspotentially being the most applicable across a broad range of decision making contexts supported bythe business and competitive analysis process.Although we have tried to include both "classic" and evolving techniques, we recognize that sometechniques that are being used in consulting and industry may not be included here. One reason for thisis that some of these tools are and remain proprietary to the consultancies employing them. Anotherpart of the reason we may not have included a useful tool here is that analysis is a process thatrequires both technical knowledge and creativity. We recognize and hope that managers and analystswill creatively develop techniques not included in this book that provide for better outcomes in theirspecific contexts.The reader should also be alert to the fact that any listing of techniques is bound to run into a varietyof problems of semantics and definitional confusion. Some of the techniques included in this book areknown by multiple names. This may have occurred because the technique came to be associated witha particular originating organization or particular company's use (e.g., McKinsey 7S), a particularauthor (e.g., Porter's Five Forces Model), or has retained a generic name (e.g., benchmarkinganalysis). We recognize that some of the techniques included in this book have seen modifications inuse over the years or are derivatives of other closely related techniques. In all cases, we have tried toinclude and describe the most popularly utilized versions of the techniques, as opposed to all of atechnique's possible derivatives. Throughout our methods chapters, we have tried to alert the readerto where there is overlap between techniques by suggesting that the reader refer to the overlappingconstructs elsewhere in the text.Many of the techniques included in this book were created by leading economists, financial and costaccountants, futurists, sociologists, anthropologists, intelligence agencies, business professors,consultants, and other insightful practitioners or theoreticians. They often developed their ideas in aneffort to solve pressing analytical problems that they faced. We are grateful to these individuals forenlightening our understanding of business and competitive analysis. We make a sincere attempt toacknowledge the originators of these techniques in the book.We must also note to our readers that it was not our primary intention to "invent a new wheel" when itcomes to analytical techniques. The techniques we have included all have a history, with some havingbeen applied for several decades or longer. This book's techniques have been and are in use in realorganizations and do not exist just in theory. However, we have included several techniques that arelikely to be unfamiliar or novel to many readers, even those who have gone through graduatebusiness, management, or marketing courses, as well as individuals who have been performinganalysis in their enterprises for many years. We believe strongly that unfamiliarity is a particularlybad indicator of a method's value. We believe our readers will find that even some of the new
techniques (to them at least) will be of high potential value in helping them make sense of their firm'sbusiness and competitive contexts.
How to Use the Book
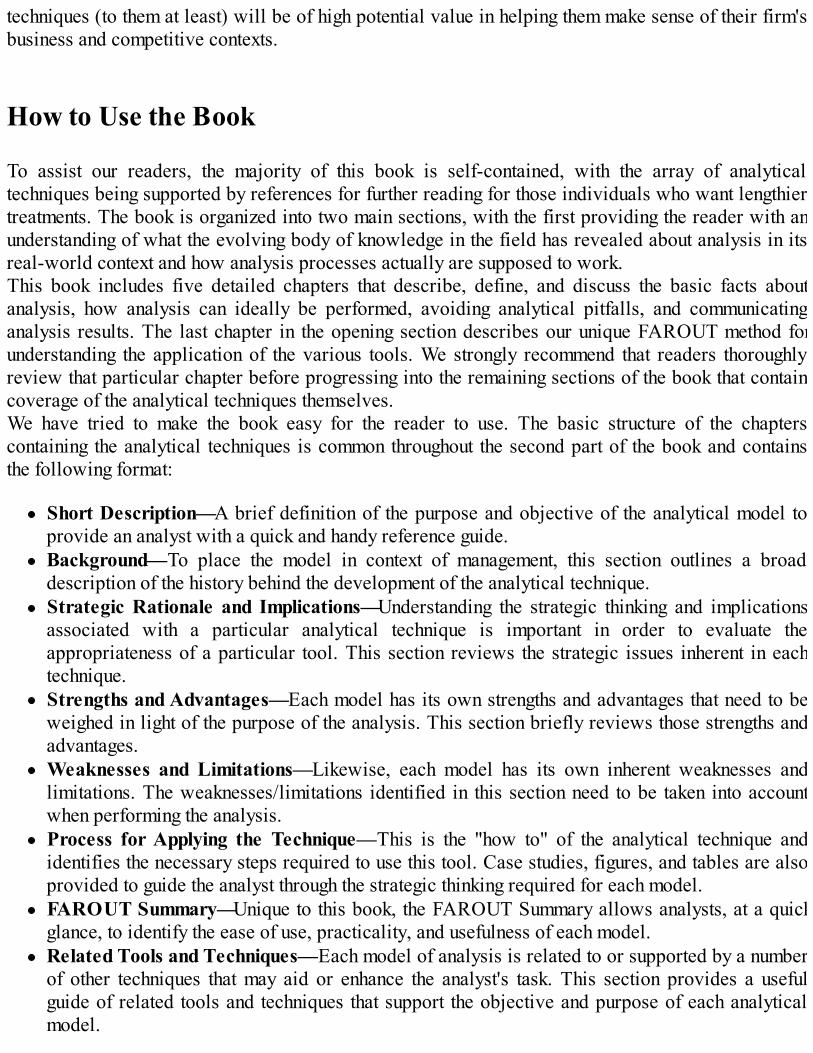
To assist our readers, the majority of this book is self-contained, with the array of analyticaltechniques being supported by references for further reading for those individuals who want lengthiertreatments. The book is organized into two main sections, with the first providing the reader with anunderstanding of what the evolving body of knowledge in the field has revealed about analysis in itsreal-world context and how analysis processes actually are supposed to work.This book includes five detailed chapters that describe, define, and discuss the basic facts aboutanalysis, how analysis can ideally be performed, avoiding analytical pitfalls, and communicatinganalysis results. The last chapter in the opening section describes our unique FAROUT method forunderstanding the application of the various tools. We strongly recommend that readers thoroughlyreview that particular chapter before progressing into the remaining sections of the book that containcoverage of the analytical techniques themselves.We have tried to make the book easy for the reader to use. The basic structure of the chapterscontaining the analytical techniques is common throughout the second part of the book and containsthe following format:
Short Description—A brief definition of the purpose and objective of the analytical model toprovide an analyst with a quick and handy reference guide.Background—To place the model in context of management, this section outlines a broaddescription of the history behind the development of the analytical technique.Strategic Rationale and Implications—Understanding the strategic thinking and implicationsassociated with a particular analytical technique is important in order to evaluate theappropriateness of a particular tool. This section reviews the strategic issues inherent in eachtechnique.Strengths and Advantages—Each model has its own strengths and advantages that need to beweighed in light of the purpose of the analysis. This section briefly reviews those strengths andadvantages.Weaknesses and Limitations—Likewise, each model has its own inherent weaknesses andlimitations. The weaknesses/limitations identified in this section need to be taken into accountwhen performing the analysis.Process for Applying the Technique—This is the "how to" of the analytical technique andidentifies the necessary steps required to use this tool. Case studies, figures, and tables are alsoprovided to guide the analyst through the strategic thinking required for each model.FAROUT Summary—Unique to this book, the FAROUT Summary allows analysts, at a quickglance, to identify the ease of use, practicality, and usefulness of each model.Related Tools and Techniques—Each model of analysis is related to or supported by a numberof other techniques that may aid or enhance the analyst's task. This section provides a usefulguide of related tools and techniques that support the objective and purpose of each analyticalmodel.

References—For those analysts wanting to delve further into a particular technique, referencesfor additional readings are provided at the end of each chapter.
Readers will benefit by becoming familiar with this template. This book was not designed to be readin one sitting—if nothing else, its length would probably make that an extremely tiring task andpractically impossible for most individuals. Instead, we have designed it as a handy comparison andreference source. In this respect, it can be most effectively applied in a "just in time" fashion so as toproactively or concurrently meet an organization's analytical needs as they arise.The book features conceptual ideas about business and competitive analysis, along with a strong biastoward practical application. Among the unique aspects of this book that readers should find valuableare the following:
It provides in one easy location two-dozen of the most common and popular models of analysisused in business. Normally, executives and students would have to go to multiple sources tolocate each model. Here, for the first time, the most commonly used models are defined andexplained in one book.Every model is also uniquely evaluated using FAROUT—an evaluation process for identifyingthe ease of use, practicality, and usefulness of each model. FAROUT allows analysts ordecision-makers to understand the strengths and weaknesses of the techniques.An easy-to-use, consistent format (i.e., template) is utilized to provide the reader with a fasterunderstanding of how to apply the techniques.The book covers both the so-called "classic" strategy techniques, such as industry analysis,along with some of the newer popular techniques, such as business model analysis. Several ofthese models, such as win/loss analysis, strategic relationship analysis, driving forces analysis,and event and timeline analysis, among others, have never been treated this comprehensively inany other publication.It provides external techniques addressing the environments and industry that the organizationcompetes in, along with the techniques for focusing internally on the organization.It provides references to more comprehensive treatments of the techniques for those who want toinvestigate them in greater depth.
We expect to stimulate others to begin closing some of the knowledge gaps in business andcompetitive analysis that we have explicitly and implicitly identified throughout this book's chapters.We also hope that this book encourages practitioners to further share their experiences andobservations with researchers and teachers like us in the field. We anticipate that the book willcompel our readers to question some, if not a large number, of their current analysis practices andunderstanding. Our ultimate aim is that this book be viewed as a valuable contribution to theknowledge and practice of business and competitive analysis. Whether or not we achieve our aim isleft in your hands, our readers, as it should be. Please feel free to contact either of us if you wouldcare to share your views.Babette E. BensoussanThe Mindshifts Group Pty. Ltd.Level 6, 8 Help StreetChatswoodNew South Wales 2067
Craig S. FleisherOdette School of BusinessUniversity of Windsor401 Sunset Avenue—508 OBWindsor, Ontario, N9B 3P4

Australiatelephone: +(61-2) 9411-3900fax: +(61-2) 9411-3636email: [email protected]
Canadatelephone: 519-253-3000 x3455fax: 519-973-7073email: [email protected]
1Business and Competitive Analysis: Definition, Context, andBenefits
Business competition now comes in many different forms and from a great variety of competitors, andthe challenges are increasing. Successfully positioning the enterprise, properly deciding on thecorrect allocation of resources, and deciding what an acceptable level of performance might be insuch a competitive environment are key tasks of senior decision makers. Consequently, skillfulbusiness and competitive analysis (BCA) is critically important in determining how an enterprise cancompete and deliver value to its stakeholders.This book is designed to assist analysts to develop high value insights, to aid them in making sense ofthe competitive environment confronting their organizations, and to guide them in advising theirdecision makers. Our underlying premise throughout this book is that a good analyst, working in anyenvironment, must have a robust and healthy repertoire of methods, tools, and techniques to helpanswer important questions on the enterprise's ability to compete, not only in the present, but also thefuture. For the most part, the end users of an analyst's output are decision makers, and as such, theywill be the clients or customers taking action based on those results.Uniquely, this book focuses specifically on analysis, analysis methods/techniques, and the analysisprocess. It is not designed to be another strategic management or strategic planning text. There areplenty of good titles of those genres available,1 although the processes and techniques describedherein will certainly benefit strategic planners and managers. We have decades of experienceadvising, consulting, instructing, practicing, and researching how BCA is used in all types ofenterprises.What surprises us about competitive and strategic analysis is the relatively limited number of toolsand techniques used by most practitioners and how little genuine insight emanates from them!These adverse results occur not only because some tools are badly chosen, outdated, or incorrectlyused, but also because they are misunderstood and/or misapplied. This book provides comprehensiveinstruction on a range of constructive processes, tools and techniques that are available, direction onhow the method was developed, analysis of its strengths and weaknesses, an outline of the processused to actually employ the technique as well as sample applications, and identification ofcomplementary techniques, resulting overall in that vital ingredient—insight.Our first text in this area identified 24 different techniques.2 Since the first book was published, wehave seen many instances and heard countless anecdotes from practitioners who wished to have an"analyst's manual" of BCA tools and techniques. We believe that this book goes some way towardmeeting that desire.
Understanding the Terminology
This book emphasizes a handful of key words: competitive, strategic, analysis, and intelligence.These are all part of the normal business and management lexicon. As we use these words repeatedly,it is useful for us to clearly identify what we mean when we use them.

Competitive
In this book, we look at businesses that are in competitive markets and typically operate in acompetitive mode. We are addressing the processes and means by which firms position themselvesand their products or services against their rivals to win market share.Competitive means that a contest is occurring between two or more parties. The sources of this canbe multi-faceted, originating in product or service offerings, shelf-space negotiations, suppliercontracts, and investor relations, to name just a few. Usually, competitive bouts end up with a winner,and no further contest is needed.The focus of this book is on the market place, though, and this is quite a different proposition.Competition here is about achieving a sustainable winning performance, not delivering one action thatsimply wounds, but consistently beating the rest who are working, most likely, toward the same orvery similar goals as your enterprise.
Strategic
Strategic is a word used today to describe almost every decision and/or action taken, when in realitythere is a clear mix of the no less valuable, tactical decision making taking place. The generic use ofa word such as "strategic" can diminish its real role and mask the impact that a true strategic decisionhas.Strategic matters are a key focus of this book. Strategic decisions, as opposed to tactical, operational,or instantaneous decisions, have a unique set of characteristics to differentiate them. Thesedistinctions occur along the dimensions of time, frequency, effort required, consequences, and impact.Strategic decisions typically:
address at least a medium-term time horizon, at best long-term (time).occur infrequently or emerge from a formalized planning cycle (frequency).require significant input from key people (effort).require significant information input from key functions (effort).require substantial resources to formulate and implement (effort).affect the long-term direction of the organization (consequences).affect many, if not all, of the organization's activities (consequences).affect competitive dynamics (impact).involve major change to the firm's activities (impact).become the over-arching blue-print for subsequent decisions (impact).
If all or a significant number of the preceding elements are present, the greater the likelihood that thedecision is indeed strategic. We want to make it clear that just because a decision is not strategicdoes not make it unimportant.3 Many non-strategic decisions help to determine the performance of anenterprise in a marketplace, particularly in the shorter term. Decisions such as seasonal pricediscounting, direct mail campaigns, product enhancements, and ambush marketing are all examples of
non-strategic decisions. They have a short-term lifespan and a short-term effect.The key to our identification of a strategic decision is that they are the ones typically made by seniorexecutives, managing directors, and/or the senior management team. Consequently, the enterprise thatgets the strategic decisions "right" has a far greater chance of also getting the non-strategic decisionsright.
Analysis
Where does analysis fit in with competitive understanding? Competitive analysis is the cornerstone ofeffective strategy formulation and execution.4 Valuable analysis helps decision makers to understandand predict critical market-changing actions that may be taken by competitors and other competition-impacting stakeholders. These decision makers are charged with answering a small number of verypowerful questions about their organization, including the following:
1. 1. What is our current status or situation?2. 2. What are our options?3. 3. Which direction do we want to go?4. 4. Which direction should we go?5. 5. How can we get to where we have decided we are going?6. 6. How will we know that we have gotten there?
Many of the analysis tools in this book will be beneficial to strategic decision makers in their effort toaddress those critically important questions. Properly conceived analysis aids decision makers ingenerating, choosing, and validating appropriate strategic responses.Analysis is a term that generates much controversy and disagreement. Before we provide ourdefinition of analysis, it may be helpful to examine definitions put forth by others that are in commonusage. These can be found in Table 1-1.Table 1-1Common Definitions of Analysis as Used in Intelligence Contexts

Although there is some value in these definitions, we find each of them to be lacking in some aspect.As such, in this book, analysis is defined as: "The skilled application of scientific and non-scientificmethods and processes by which individuals interpret data or information to produce insightfulintelligence findings and actionable recommendations for decision makers."Like many developing fields of inquiry, business and competitive analysis is NOT purely art orscience, but a combination of substantial portions of both in its effective application. As with the typeof research formally taught to scientists, the analysis process can be viewed as holding much incommon with the scientific method. Analysts will observe certain events, persons, or actions,develop a proposition or hypothesis that describes/explains what they have observed, and then usethe hypothesis to make predictions about what may subsequently occur. These predictions can then befurther assessed through additional observations or data, and the hypotheses can be modified basedon the results.5This process, which can be applied in theory by analysts, gets complicated very quickly by factorspresent in the real world of business and market-place competition, as well as the politics and socialnature of decision makers and enterprises. Analysts frequently work in groups or teams and benefitfrom the pooling of expertise. Hypotheses aren't always developed, tested, or reformulated, but arefrequently modified in real-time by the evidence that is acquired. These factors point to genuinebusiness and competitive analysis being more of a social scientific pursuit than that of physical orpure science.The "real world" tends to bring out the "art" aspect of analysis. When conducting an experiment usingcontrol groups, we know that some percentage of a treatment group's analyses will not confirm thecontrol group's analyses. Analysts in these two groups will weigh the same data or informationdifferently, based on schemes that may be hard for others to accurately replicate. Even when analystsdo substantively agree about the nature of the problems being addressed, they can still subsequentlydisagree about the proposed course of action. Consequently, analysts may never be able to "prove"they were right. It is these kinds of experiences that points to why analysis can sometimes be viewedas more akin to art than science. The following humorous parable helps point out some of theimportant differences between the two perspectives.

A Parable About the Artist and the Scientist
There were once two people, a scientist and an artist, sitting next to each other, traveling on a bus.They had never met before, and there wasn't much conversation between the two. The artist wasminding her own business, looking out her window at the beauty of the passing terrain. The scientistwas uptight, trying to think of things he didn't know so he could try to figure them out. Finally, thescientist was so bored, that he said to the artist, "Hey, do you want to play a game?" The artist, beingcontent with what she was doing, ignored him and continued looking out of the window, hummingquietly to herself. This infuriated the scientist, who irritably asked again, "Hey, you, do you want toplay a game? I'll ask you a question, and if you get it wrong, you give me $5. Then, YOU ask ME aquestion, and if I can't answer it, I'll give YOU $5." The artist thought about this for a moment, butshe decided against it, seeing that the scientist was obviously a very wise man. She politely turneddown the scientist's offer. The scientist, who, by this time was going mad, tried a final time. "Look,I'll ask you a question, and if you can't answer it, you give me $5. Then you ask ME a question, and ifI can't answer it, I'll give you $100!"Now, the artist, who was not that smart academically, wasn't stupid either. She readily accepted theoffer. "OK," the scientist said, "what is the EXACT distance between the Earth and the Moon?" Theartist, obviously not knowing the answer, didn't stop to think long about the scientist's question. Shetook a $5 bill out of her pocket and handed it to the scientist. The scientist gladly accepted the billand promptly said, "OK, now it's your turn."The artist thought about this for a few minutes, and then asked, "All right, what goes up a mountain onthree legs, but comes down on four?" The big smirk quickly vanished from the scientist's face. Hethought about this for a long while, taking out his pencil and making numerous calculations on hisbooks. When that didn't lead to an answer, he took out his laptop and accessed the Internet. Afterabout an hour of this, all the while with the artist quietly watching the mountains go by, the scientistfinally gave up. He reluctantly handed the artist a $100 bill. The artist accepted it graciously, turningback to the window. "Wait!" the scientist shouted. "You can't do this to me! What's the answer??"The artist smiled sweetly, pressed a $5 bill into his hand, and said "I don't know."Business and competitive analysts are tasked with making sense out of often ambiguous, complex, andchallenging matters that decision makers care about. Like the artist on the bus, they too have to weighup the odds, work through the scenarios, work out what they know as opposed to their competition,and take action. They have to make sense of, or create meaning from, a typically constrained sampleof data and information. In an often-confused and rapidly moving competitive landscape, they try toanswer the three critical questions commonly asked of them:
1. 1. "What?"2. 2. "So what?"3. 3. "Now what?"
Any of these three questions may be answered in a variety of constructive ways using replicableprocedures and methods (science), as well as intuitive or creative ones (art).
Intelligence
It is important to understand the place of intelligence within the larger context of an enterprise. Theneed to generate competitive intelligence (CI) is certainly not new. Sun Tzu plainly stated therationale for intelligence over two thousand years ago. He wrote, "Now the reason the enlightenedprince and the wise general conquer the enemy whenever they move, and their achievementssurpass those of ordinary men, is foreknowledge."6
Intelligence processes in business organizations have received significant attention in recent decades.The benefits gained by successfully anticipating a competitor's future plans and strategies aregenerally self-evident. The consequences of making decisions based on information that isincomplete, inaccurate, or late are as severe.CI often engenders images of fictional secret agents such as James Bond using an impressive array ofsophisticated gadgetry to eavesdrop on their business competition. In reality, CI can be exhilarating,but not because of illegal skullduggery. Modern CI practitioners are stimulated by using their uniqueset of skills, knowledge, abilities, and instincts to uncover relationships that enable theirorganizations to compete more effectively. Most CI practice includes a heavy dose of analyticalcapabilities. Analysts are prominent, central members of CI functions in today's successful, globalenterprises.There are numerous definitions of CI in contemporary practice and scholarship. Our current sense isthat no single definition of CI is likely to be precise and universally accepted. As such, CI isgenerally viewed as the process by which organizations gather actionable information aboutcompetitors and the competitive environment and, ideally, apply it to their planning processes anddecision-making in order to improve their enterprise's performance . CI links signals, events,perceptions, and data into discernible patterns and trends concerning the business and competitiveenvironment. CI can be simple scanning, such as analyzing a company's annual report and other publicdocuments, or elaborate, such as performing a fully digitized war gaming exercise.7CI is not business espionage; it is ethical, legal, legitimate, and essential. Business espionagedevelops intelligence by illegal or cloak-and-dagger means such as breaking and entering, bribery,coercion, deliberate deception or advertising "phantom" job vacancies, electronic eavesdropping,bugging or tapping, network infiltration, or systems hacking.8 CI practitioners use public, but notnecessarily published, information. In other words, the information the CI practitioner seeks is readilyavailable and identified through legal means of open sources such as public documents, interviews,and in-house expertise. It does not involve the theft of trade secrets.One way to understand CI is to view it as a progression from raw inputs to finished outputs. In thisperspective, CI begins with scattered bits of raw, basic data. This raw material is then organized byCI practitioners and becomes information. Information becomes intelligence when it is placed into aformat useful to a decision-maker's unique or critical intelligence needs (CINs). Intelligence istherefore information that is analyzed, interpreted, and infused with developed implications—thebasic focus of this book. Using this lens, CI is the refined intelligence product produced by an analystthat meets a decision-maker's unique needs for understanding a competitive aspect of the internaland/or external environment. Effective CI helps the decision-maker make a better decision!CI can also be viewed as an organizational function ranging in scope between the broader area ofbusiness intelligence (BI) and the narrower version practiced as competitor analysis (CA). A CIfunction provides the foundation on which strategy and tactics are built, assessed, and modified. As a

mostly staff-oriented function, CI will cut across and overlap other functions, in particular, thoseassociated with marketing, planning, and strategy.Competitive Intelligence Programs (CIPs) have goals such as proactively detecting opportunities orthreats; eliminating or reducing blindspots, risks, and/or surprises; and reducing reaction time tocompetitor and marketplace changes. CIPs attempt to ensure that decision makers have accurate,current information about the organization's competitive environment, and a plan for using thatinformation.9
Analysis as a Component in the Intelligence Cycle
Analysis is arguably that portion of the larger intelligence process in which the greatest value isgenerated.10 Much organizational experience suggests it can also be more difficult to do than theresource-draining data and information collection efforts that most organizations have emphasized inrecent years. Nevertheless, there is a long series of research and publications that suggests thatbusiness and competitive analysis serves a variety of important, longstanding needs fororganizations.11 Although we intend to explore this context in much greater detail in other parts of thissection, here we will briefly describe how analysis fits within the intelligence process.Analysis is just one step of a larger process for developing intelligence for an organization. Mostdepictions of the so-called "intelligence cycle" show a series of 4 to 6 steps in a stripped-down form.These steps describe the functions of an intelligence operation in an enterprise and are illustrated inFigure 1.1.Figure 1.1 A generic intelligence cycle
The analysis step in this cycle involves its own set of sub-tasks that need to be conducted in order togenerate effective outputs and outcomes. Analysis works interactively with all the sub-processes ofdata classification and synthesis to produce a finished product such as a chart, graph, table, text,

summary, visual, or other communicative aids appropriate for dissemination.Analysis involves the skillful application of a variety of techniques. We are sharing many good onesin the upcoming chapters of this book. All of these will help decision makers make sense ofintelligence.Intelligence analysis is always context-specific in that it does not occur within a vacuum, a staticcondition, or under experimental conditions. Because analysis is performed by practitioners in activeorganizational and competitive conditions, it is important to identify the nature of competition thatanalysts examine as a part of their work task.
Competitive Analysis and Decision Making
Most organizations today are not structured or organized properly to make good decisions that willhelp them outperform their competition in the marketplace.12
It is commonplace for this book's authors to hear from decisions makers who lament in retrospect: "Ifonly I'd known that, I'd never have made that decision or taken that action." Such comments reflectan absence of intelligence supporting the decision maker and the lack of greater insight behind theirdecisions and subsequent actions.There is no shortage of examples where poor decisions have adversely affected many stakeholders.Read the business section of your local paper, and you will hear of bankruptcies, down-sizingbecause of poor sales, over-optimistic new product revenue/volume predictions, wasted R&Defforts, or plant closures due to outdated technology or cheap imports. Intelligence failures relative tonational decision making are also well publicized and again point to decision makers who were notproperly prepared to make optimal decisions.13
Although it is often difficult to find decision makers who will publicly take the responsibility forhaving made poor choices, we all know of individuals who, with hindsight, would have done thingsdifferently. Unfortunately, we are unaware of anyone who has figured out how to either roll back theclock or to reverse time!14 Making better choices and decisions the first time creates a greater needfor effective analysis and intelligence.Today's managers face an abundance of information in their decision-making contexts, and sometimesthis information abundance causes them to be paralyzed. Benjamin Gilad notes how informationarriving to top managers is invariably biased, subjective, filtered, and/or late. Analysts have themeans for helping reduce both the volume and rate of this information flow while simultaneouslyassuring the quality of the product being delivered. They can then greatly enhance the executive'sactual ability and confidence in effective decision making.Analysis has been revitalized in the "knowledge" era, or the era of intellectual capital. Whatever weshould call it, knowledge is increasingly recognized as a key organizational asset that can distinguishbetween the winners and losers in many competitive market-places.15 Organizations that caneffectively generate, capture, disseminate, and apply knowledge better and faster than theircompetitors stand a higher probability of achieving successful performance. Analysts are a criticalpart of this knowledge-oriented process as they are among the primary directors of knowledge in anorganization. One thing we hope to emphasize in this book is that analysts must provide direction andguidance to those individuals responsible for collecting data and information. They are the link togathered data and the organization's key decisions.
Analysis is just as important because of the increased recognition and value on good thinking skills.Analysis cannot be conducted in the absence of thinking. Without it, we would have random choiceand luck. This is not the best foundation for a considered outcome and is increasingly likely to sufferfrom "extinction by instinct." The other end of the continuum is from "paralysis by analysis." That isnot to summarily discount the value of instinct, but it has to be measured alongside more reliable andtested methods of analysis.As access to data or information has increased, the highest value is now placed on not just obtainingappropriate data, but more importantly, to making good sense of it. That's analysis!
The Competitive Context Facing Contemporary Enterprises
Beating competitors, in many industries, has become a necessity rather than a desirable goal. Moreinsightful strategy development and execution has been needed since even a decade ago. We wouldsuggest the following reasons are among the most critical ones underlying increased competition, allof which produce a greater need for improved business and competitive analysis.Explosion of access to cheap and fast information: Whether it is employee mobility, greater accessto higher education in both traditional and online formats, companies showing less loyalty to theiremployees, or those same employees showing less loyalty to their employers, the window oncompetition and competitive opportunities has grown wider and more transparent. Because ofchanging information and communication technology, as well as changing socio-cultural valuesystems, keeping key competitive information proprietary and out of the sight or hands of competitorshas become more difficult than ever before.Maturation of industries and businesses: Many industries that were prominent in the twentiethcentury were resource-based industries, such as forest products, manufacturing, steel, and so on.These have rapidly matured or have seen a dramatic slowdown compared to past rates of growth.Many have struggled to institutionalize innovation capabilities, resources, strategies, new resourceinputs, new production processes, new product development challenges, new employee skillrecruitment and integration, new distribution channels, and/or understanding new customer needs.These are quite different challenges to simply trying to build market share in an existing static andsimple market space, and the potential for them to miss the disruptive forms of activity that may beoccurring on the fringes of their still-lucrative markets is high.16
Loss of traditional means of competitive structuring and advantage: Traditionally, companiescould achieve competitive advantage through scale economies, segment entrenchment, first-moveradvantages, and other such industry level gains. While still existing in some sectors, these approachesare now so quickly and easily imitated that they no longer deliver sustainable advantage. While thegeneric strategies of cost, differentiation, and focus described by Michael Porter are stillconceptually fruitful, they are hard to achieve and sustain in practice. In a later paper, Porter himselfreconsidered the traditional approaches and concluded that the achievement of advantage ispositioning, rather than resource-based.Sophisticated and better-informed consumers: Customers are better informed than ever before andhave access to significantly more information on which to base their purchasing decisions. As withB2B markets, buying habits are less ingrained, and purchases are increasingly based on specification,cost, and value. Today's consumer is less likely to be swayed by an emotional appeal and will do

hard-nosed research before striking a deal, especially with big ticket items.Companies that still think they can sell anything they like, at any price, to a gullible customer maywell do so once, but not again. Bad news travels fast, and the presence of customer pressure groups,Internet blogs, and vociferous word-of-mouth channels will quickly damage a brand.Dynamic and rapidly evolving technology: Physical strengths are being replaced by intangible assetssuch as intellectual property, knowledge, intelligence, brands, R&D teams, and market position,resulting in volume-based advantages being less prominent.17 Even in industries where scale-basedadvantages still exist, typically manufacturing, the continual push by businesses across the globe toimprove operational efficiency has made it harder to sustain such advantages.18 This has made thedevelopment of effectiveness-based strategy and execution more critical than ever.There is little doubt that competition compels organizations to respond, preferably in a proactivemanner. Designing these responses and assessing their impact are the primary task of the business andcompetitive analyst. The context within which the analysis is undertaken and the organization withinwhich the analyst is working, will, inevitably, produce unique demands. The following sectionelaborates on the unique contextual factors impacting business and competitive analysts.
Contemporary Context Facing the Analyst
Being an analyst in an enterprise facing a high degree of competitive rivalry is difficult, especiallywhen inexperienced and/or lacking appreciation of analysis science. Analysts have always had tosatisfy decision makers who want and need their assistance. If anything, the challenge for the analysttoday is more daunting than in the past. We think there are several prominent reasons why this state ofaffairs exists, such as the following:Lack of recognition that analysts are mission-critical: It is rare to find a student coming onto abusiness degree program who claims that he or she wants to be a competitive analyst. In contrast,hundreds, if not thousands, will say that they want to be a management accountant, financial analyst, asales specialist, or a brand manager. Similarly, it is rare to hear a CEO or a CFO claim that theircompetitive advantage came from their analytical team or their capabilities. We know that analysisunderlies many company's competitive advantages, but it is often called something else, or theprocess is embedded among other functional activities. Enlightened organizations recognize theunique value that analysis generates, and as a result, then put significant resources behind it to ensurethat they continue to derive competitive advantage.Decision makers cannot always articulate their decision needs: Analysis requires proper directionat the outset for the process to produce a satisfactory output. Unfortunately, decision makers may notask the right questions of the analyst. They may not even know what the questions are. So it is up tothe analyst to focus their decision-maker on the "must know," as opposed to the all embracing "like toknow" style that we witness too frequently.Pressure for a quick judgment: Competitors are moving fast, investors and shareholders want thequarterly performance targets on time, customers want solutions yesterday, and nobody is willing towait. Time is the most precious resource for an analyst; consequently, time will always be in shortsupply. Decisions are often made on the basis of "what we know now" because the situation simplywill not allow for more delay. As such, analysts need to constantly seek established data collectionand classification systems that can provide reliable outputs quickly. They need to provide intelligence
despite that being at a lower level of confidence than usually expected. Analysts and decision makersneed to address the increasingly time-starved context within which they both work and assess itsramifications.Highly ambiguous situations: Ambiguity comes in many forms for both the decision itself and theanalyst. It can emanate from the nature of competition, the range of competitive tactics employed, keystakeholders' responses in a competitive arena, product and/or process enhancements, consumerresponses to competitive tactics, and so on. These types of interjections have been studied byresearchers who have recognized that ambiguity can be a potent barrier to competitive imitation19 andallow for a competitor to sustain their advantage for a longer period.Incrementally received/processed information: Rarely will an analyst get the information he or sheneeds, in time and in the format they require. The inability of traditional executive informationsystems to capture, classify, and rank rumors, gossip, grapevine data, and knowledge held byemployees out in the field means that analysts lack the kind of primary source information that hasalways been the "jewel in the crown" element that makes analysis so valuable.20
Shifting Organizational Priorities for Analysts and Analysis
We know there has been a fundamental shift in the nature and sequence of organizational priorities foranalysts. Though change is not uniform across sectors, it is possible to decipher the outline of atransformation toward improved analytical capabilities through the following principles.Adding Value to Intelligence: A priority for analysts is to deliver a product that adds context andmeaning to raw data and information. In today's information-overloaded environment, intelligencecompetes for the attention of the decision maker. John Gannon, former Deputy Director of the CentralIntelligence Agency, commented, "It is our challenging but rewarding job to keep telling thesesmart but overworked folks, decision or policy makers, what's happening in a complicated world."Keeping ahead of the competition and keeping the attention of intelligence users cannot be taken forgranted. Some commentators consider that the insufficient and poor training of analysts has been aprimary reason for the low effectiveness of intelligence programs.21
One of the ways to stay relevant is to build and maintain subject matter expertise, continuity, anddepth within the organization's analytical ranks. Information alone will not be useful to the consumerif it is not interpreted correctly and presented in a credible way by a recognized expert. This issuehas been addressed in some organizations through the creation of a senior-level council that isresponsible for strategic planning and addresses the areas of CI recruitment, assignments, core skills,standards, and training. Others have relied upon the continuous delivery of learning opportunities,through apprenticeships, traditional classroom, and virtual means, by which analysts can upgradetheir capabilities. Finally, some organizations have outsourced to specialist companies who theybelieve can provide the needed services better than internal resources. The variety of ways that bestpractice CI organizations have attempted to address this need has been catalogued in severalstudies.22
Answering Questions in Real Time: Analysts have traditionally met intelligence needs through theregular briefings and overviews, usually tailored to the client's needs. These deliveries can also besupplemented with personalized electronic or paper memos that respond to incidental orsupplementary questions. Analysts may provide daily or, when a crisis erupts, minute-by-minute

support. While the vast majority of an organization's analytical tasks will be carried out in responseto specific questions, over the course of a typical year, an analyst or analytical team will providehundreds of ad-hoc briefings on virtually every aspect of the enterprise.Concentrating Resources: Analysts must be vigilant about prioritization, and they are expected to useall the latest technology to stay ahead of the competition without wasting scarce resources.Consequently, there is a need to continually press for clarification of a critical intelligence need.Organizations have to find innovative ways to build in flexibility within their collection and analysisefforts so that new priorities can be addressed on as as-needed basis. This flexibility is seldomconsidered when devising a competitive analysis or intelligence system, but has become increasinglyimportant in a resource-constrained context.Forging Partnerships: Another priority is how the organization, its data collectors, and analystsrelate with the broader community. Partnership is a concept that has taken hold as organizations seekto take advantage of others' specialized expertise and resources. Cooperative efforts between CI andother departments have built formal and informal networks of functional and subject expertsthroughout the organization. Rarely does all the expertise on any particular issue reside in one part ofan organization or a single unit. Tapping into analytic expertise across the firm is important toovercome commonly experienced budget and personnel constraints.Looking Over the Horizon: The focus on decision-tailored support helps make analysis morerelevant and useful to the client. It also ensures that intelligence resources are going where they needto be. Providing such high-level support makes an enormous claim on resources, particular staffingand time. At worst, analysts risk becoming prisoners of their inboxes and unable to put daily events ina broader context, which is essential if they are to provide timely warning of emerging opportunitiesor threats. The challenge is to step back and consider what the organization might face tomorrow, nextweek, or next year. Analysts have to look beyond the immediate and the obvious, toward those forcesthat might be moving slowly but inexorably toward their organization. Giving decision makers a senseof the possible, rather than the probable, must be a key priority for analysts, and it is precisely thisthat sets them apart from others in the organization.Providing Timely Support: Analysis is most relevant when it is provided directly to the decisionmaker. Analysts are at their best when deployed on-site and in regular contact with the organization'smanagers, negotiating teams, and front-line decision makers. This ensures a better understanding ofshifting agendas, prime movers, and quick feedback on their outputs. This all helps to better target theintelligence effort. As mentioned already in this section, time is a luxury that few decision makersenjoy, so anything that puts the analyst closer to the problem can only speed up the solutionidentification process.
Summary
Excellent analysis is the key to successful insights and/or intelligence and can provide high-valuestrategic decision support capability in contemporary enterprises. Intelligence about customers,competitors, potential partners, suppliers, and other influential stakeholders is a company's first, andoften only, line of offense/defense. Maintaining this capability into the future requires analysts andcompetitive intelligence practitioners to exploit every opportunity to provide their decision makerswith analysis that is persuasive, relevant, timely, perceptive, and actionable. Analysts must provide
their decision makers with the essential insight needed to preserve their organization'scompetitiveness and provide early warnings of market changes.Contemporary analysts are expected to offer direct and immediate support to resolve different typesof queries, work more closely with their counterparts responsible for human and technical collection,package their analyses in a variety of new forms, and deliver them through whatever means are bestsuited to the recipient.In fulfilling this mission for the future, competitive intelligence-driven organizations and members ofthe analytical community face many fresh challenges. Success will be determined, at least in part, byhow well these individuals and functions manage their scarce resources, balance frequentlyconflicting demands, produce longer-term analysis, continue to develop both broad and deep analyticexpertise, and forge new relationships with others both inside and outside their organizations. This isnot the time for analysts to be resting on their laurels. New ways of working and critical issues areappearing at a far greater pace than in the past. Analysts need all the help they can get to rise to thechallenge of tomorrow's demands.
References
American Productivity and Quality Council (APQC) (2000). Developing a Successful CI Program:Enabling Action, Realizing Results. Houston, TX: APQC.Chender, M. (2006). Comments from his speech given to the KMWorld webinar, "Creating aPredictable Advantage," January 19, found at www.kmworld.com.Christensen, C.M. (2000). "Meeting the challenge of disruptive change," Harvard Business Review,78(2), pp. 66–78.Clark, R.M. (2004). Intelligence Analysis: A Target-Centric Approach. Washington, DC: CQ Press.Dierickx, I., and K. Cool (1989). "Asset stock accumulation and sustainability of competitiveadvantage," Management Science, 35, pp. 1504–1511.Dishman, P., Fleisher, C.S., and V. Knip (2003). "A chronological and categorized bibliography ofkey competitive intelligence scholarship: Part 1 1996-2003," Journal of Competitive Intelligenceand Management, 1(1), pp. 13–79.Fleisher, C.S., Knip, V., and P. Dishman (2003). "A chronological and categorized bibliography ofkey competitive intelligence scholarship: Part 2 1990-1996," Journal of Competitive Intelligenceand Management, 1(2), pp. 11–86.Fleisher, C.S. (2001). "An introduction to the management and practice of competitive intelligence,"pp. 3–18 in Fleisher, C.S., and D.L. Blenkhorn [eds.], Managing Frontiers in CompetitiveIntelligence. Westport, CT: Quorum Books.Fortune Magazine (2005). Global 500 listing retrieved from the web on February 20, 2006 athttp://money.cnn.com/magazines/fortune/global500/.Fuld, L.M. (1995). The New Competitor Intelligence. New York, NY: John Wiley & Sons.Gannon, J. (1996). "Intelligence analysis for the 21st century," excerpted from an address deliveredNovember 18 to the Fletcher School of Law and Diplomacy at Tufts University. Source:http://www.cia.gov/cia/di/speeches/42826397.html.Gilad, B. (1996). Business Blindspots: Replacing Myths, Beliefs and Assumptions with MarketRealities. London, UK: Infonortics.

Hall, R. (1993). "A Framework Linking Intangible Resources and Capabilities to SustainableCompetitive Advantage," Strategic Management Journal, 14 (November), pp. 607–618.Halliman, C. (2003). "A Look at How a Number of Business and Competitive IntelligenceProfessionals View or Define the Analysis Process," retrieved April 28, 2003 fromhttp://www.InformationUncover.com/new.htm.IALEA (2001). Starting an Analytic Unit for Intelligence Led Policing. Lawrenceville, NJ:International Association of Law Enforcement Intelligence Analysts, Inc. (IALEA).Johnston, R. (2005). Analytic Culture in the U.S. Intelligence Community. Washington, DC: TheCenter for the Study of Intelligence.Knip, V., Dishman, P., and C.S. Fleisher (2003). "A chronological and categorized bibliography ofkey competitive intelligence scholarship: Part 3 pre-1990," Journal of Competitive Intelligence andManagement, 1(3), pp. 11–80.Lackman, C., Saban, K., and J. Lanasa (2000). "Organizing the competitive intelligence function: Abenchmarking study," Competitive Intelligence Review, 11(1), pp. 17–27.Mathams, R.H. (1995). "The Intelligence Analyst's Notebook," in Strategic Intelligence: Theory andApplication, 2d. ed., Washington, DC: Joint Military Intelligence Training Center, pp. 77–96.McGonagle, J.J., and C.M. Vella (1990). Outsmarting the Competition: Practical Approaches toFinding and Using Competitive Information. Naperville, IL: Sourcebooks.Porter, M.E. (1996). "What is strategy?," Harvard Business Review, 74(6), Nov/Dec., pp. 61–78.Porter, M.E. (1980). Competitive Strategy: Techniques for Analyzing Industries and Competitors.New York, NY: Free Press.Prescott, J.E., and P.T. Gibbons (1993). "Global competitive intelligence: An overview," pp. 1–27 inPrescott, J.E., and P.T. Gibbons [eds.], Global Perspective on Competitive Intelligence, Alexandria,VA: Society of Competitive Intelligence Professionals.Prescott, J.E., Herring, J., and P. Panefly (1998). "Leveraging information for action: A look into thecompetitive and business intelligence consortium benchmarking study," Competitive IntelligenceReview, 9(1), pp. 4–12.Procyshyn, T.W. (1998). "The coming intelligence failure," a white paper found athttp://bib.cfc.dnd.ca/irc/nh/nh9798/0069.html, Ottawa Canada: Department of National Defense(DND) Canada.Rogers, P., and M. Blenko (2005). "The decision-driven organization: Making good decisions andmaking them happen," A white paper produced for Bain and Company, found at www.bain.com.Shaker, S., and M. Gembicki (1999). The WarRoom Guide to Competitive Intelligence. New York,NY: McGraw Hill.Tzu, S. (1988). The Art of War. Oxford, UK: Oxford University Press.Waltz, E. (2003). Knowledge Management in the Intelligence Enterprise. Boston, MA: ArtechHouse.Werther, G. (2001). "Building an 'Analysis Age' for Competitive Intelligence in the 21st Century,"Competitive Intelligence Review, 12(1), pp. 41–47.Zahra, S., and S. Chaples (1993). "Blind spots in competitive analysis," Academy of ManagementExecutive, 7(2), pp. 7–28.
Endnotes

1 The field of strategy and strategic management is frequently covered in most university business ormanagement curricula. The books used in these courses do a fine job in covering the processes andcontent of strategy. This book assumes some knowledge of these concepts, but does not require highlevels of prior strategy knowledge to be applicable.2 Fleisher, C.S., and B. Bensoussan (2003) . Strategic and Competitive Analysis: Methods andTechniques for Analyzing Business Competition. Upper Saddle River, NJ: Prentice Hall.3 We will distinguish between strategic, tactical, and operational decisions types in later chapters.This book's methods will be at least somewhat applicable to all three types, although admittedly itwill disproportionately be focused on strategic decisions.4 Zahra and Chaples, 1993.5 Clark, 2004.6 Tzu, 1988.7 Shaker and Gembicki, 1999.8 Fleisher, 2001.9 McGonagle and Vella, 1990; Prescott & Gibbons, 1993.10 We recognize that there are likely key conceptual if not practical differences between the terms"business" and "competitive" intelligence. As explaining these differences would require far moredetail than we can provide here, we refer readers to Fleisher's discussion of these terms in greaterdepth in Chapter 5 of the edited book (with D. Blenkhorn) entitled Controversies in CompetitiveIntelligence: The Enduring Issues, Westport, CT: Praeger Publishers (2003).11 Dishman, Fleisher, and Knip, 2003; Fleisher, Knip, and Dishman, 2003; Knip, Fleisher, andDishman, 2003.12 Rogers and Blenko, 2005.13 For a poignant example of these, Robert Steele does a nice job of identifying the varying nature ofthe failures that occurred associated with the 9-11 events that dramatically affected the United States.See "What went wrong and why," pp. 3–10 in Steele, Robert David (2002). The New Craft ofIntelligence: Personal, Public & Political, Oakton, VA: OSS International Press.14 This fact won't stop people from trying! This is another reason why strategic decisions need to bemade correctly the first time, every time.15 Waltz, 2003.16 Christensen, 2000.17 Hall, 1993.18 Porter, 1996.19 Dierickx and Cool, 1989.20 Chender, 2006.21 Werther, 2001.22 Namely, APQC (2000), Lackman et al (2000), and Prescott et al (1998).
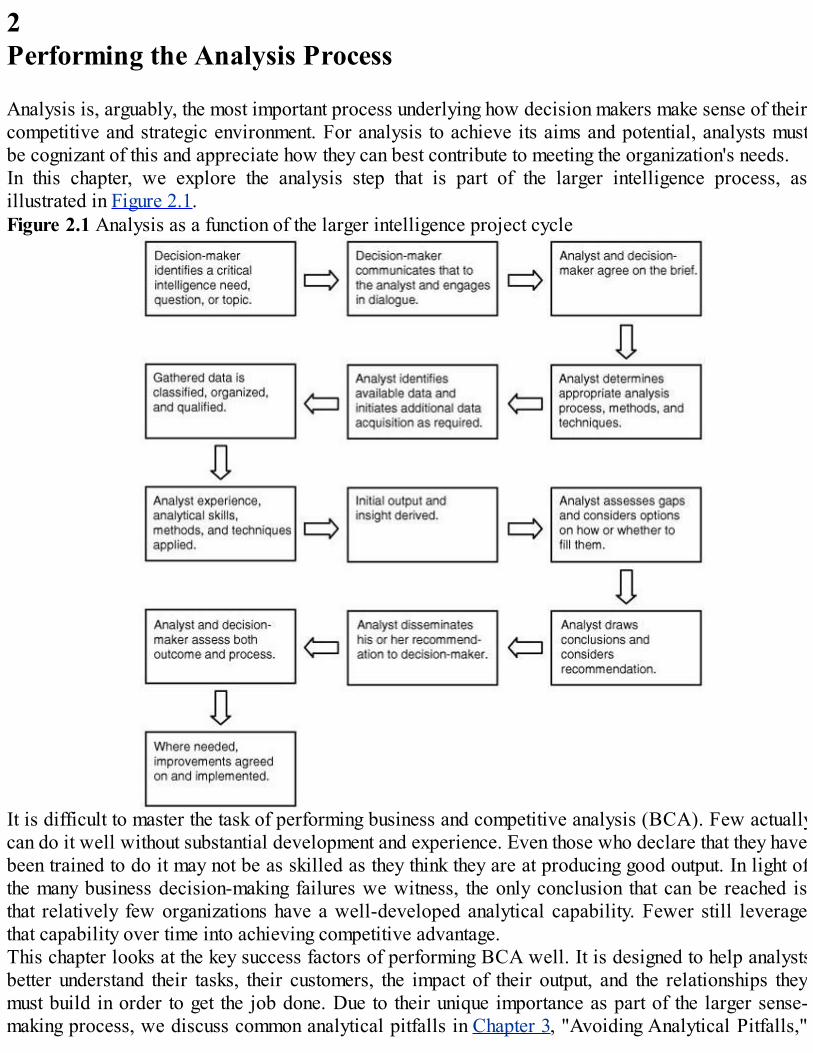
2Performing the Analysis Process
Analysis is, arguably, the most important process underlying how decision makers make sense of theircompetitive and strategic environment. For analysis to achieve its aims and potential, analysts mustbe cognizant of this and appreciate how they can best contribute to meeting the organization's needs.In this chapter, we explore the analysis step that is part of the larger intelligence process, asillustrated in Figure 2.1.Figure 2.1 Analysis as a function of the larger intelligence project cycle
It is difficult to master the task of performing business and competitive analysis (BCA). Few actuallycan do it well without substantial development and experience. Even those who declare that they havebeen trained to do it may not be as skilled as they think they are at producing good output. In light ofthe many business decision-making failures we witness, the only conclusion that can be reached isthat relatively few organizations have a well-developed analytical capability. Fewer still leveragethat capability over time into achieving competitive advantage.This chapter looks at the key success factors of performing BCA well. It is designed to help analystsbetter understand their tasks, their customers, the impact of their output, and the relationships theymust build in order to get the job done. Due to their unique importance as part of the larger sense-making process, we discuss common analytical pitfalls in Chapter 3, "Avoiding Analytical Pitfalls,"
and how to communicate analysis results in Chapter 4, "Communicating Analysis Results."
Understanding the Customers of Analysis
"Basically, the work that we do for our customers, which are our executive leadership, oursales forces, our product managers, and our strategy people, should help them with theircustomers . . . our approach is very customer-focused; how are we going to help ourcustomers help their customers?"—Bret Breeding, former Global Corporate Competitive Intelligence Manager for CompaqComputer
The first questions any analyst must answer are "Who are my analysis customers?" and "What aretheir critical needs?" These can sometimes be difficult to answer, especially if the customersthemselves cannot effectively articulate what they want or there are multiple customers with differingagendas. The answers must at least be attempted because without those, the analyst cannot select theright methods. To be truly effective, analysts must understand how their outputs will eventually beused by the decision makers.1 These individuals may well be one or more steps removed from theanalyst's immediate customer.An analyst's customers or clients2 are those individuals in the enterprise who are in need of adviceand guidance in advance of making an identified decision. We make no distinction here between thelevel at which a customer may be situated in the enterprise, as we know that analysts provide manydecision makers with advice, whether they are working on a strategic, tactical, or operationalproblem.The analysis process has a clear starting point when either the analyst identifies an issue himself or acustomer makes a request. The process also has an end point when the satisfactory product isdelivered to the customer. Having said that, good analysts will communicate with their customersthroughout the entire process and will engage in many iterations to improve the final product. Anopen-minded attitude to the task is essential, as is the recognition that improvement can always beachieved. A delicate ego is a distinct hindrance to improving one's analysis.
Defining the Analysis Problem
Customer needs have to be interpreted before they can be acted upon. This is often the foundation to asuccessful analysis process. Analyst-customer interaction is critical at all stages of the process, butno more so than at the outset; consequently, time spent here will pay dividends later on. A genuinedialog is needed, as experience has shown us that the issuing of instructions in a one-way manner justdoes not produce effective results.Most enterprises attempt to identify, relate to, and then satisfy market-place customers' needs andemploy customer needs identification processes and (internal) customer relationship management(CRM) techniques. The relationship that an analyst has with his customer and/or decision maker is noless important. Symmetric, two-way communication is needed to identify an enterprise's actual, asopposed to perceived, intelligence needs.

Helping business and competitive analysts are government intelligence models for identifyingnational-level intelligence requirements, which have been adapted for commercial use. A popularadaptation is the Key Intelligence Topics (KITs) approach advocated by Jan P. Herring or using KeyIntelligence Questions (KIQs). Essentially the same activity, this is a semantic terminology changethat is preferred by some firms.Although Herring suggests that KITs are not a simple management tool or a panacea for analysisefforts, the KIT process delivers three essential benefits:
It facilitates the identification of legitimate intelligence needs and distinguishes between "need-to-know" and "fishing expedition" projects.An initial set of KITs provides a proper foundation for an intelligence program, eventuallyguiding the determination of CI resources, capabilities, and skills required.Being a user-driven model, the KIT process provides a foundation for operational planning tomeet and understand both organizational and decision makers' dynamic intelligence needs.
In line with our suggestions in the previous paragraphs, the KIT/KIQ process centers on an interactivedialog between analysts and decision makers. A successful senior intelligence practitioner, Dr.Wayne Rosenkrans, Global Intelligence Director at AstraZeneca Pharmaceuticals, supported thisview when he said: "My advice usually is to spend whatever time is necessary on that KIT-KIQprocess at the very beginning. That is so important, and if you get off on the wrong foot, or on awild goose chase, you'll have wasted all kinds of time."Herring classified decision makers' intelligence needs into one of three, not mutually exclusive,categories:
1. 1. Strategic decisions and actions2. 2. Early-warning topics3. 3. Descriptions of key marketplace players
The KIT process requires a high-level understanding of the intelligence needs as well as the varioustypes of operations necessary to address them. Herring noted that when done effectively, analysts' useof the KIT process should result not only in identifying the organization's key intelligence needs, butalso in creating the critical communication channel necessary to produce credible insight. It alsohelps to manage expectations.Fiora, Kalinowski, and others offer help here by suggesting that the analyst assesses each task byaddressing each of the following issues:
Why is this project being proposed?Has anyone attempted it before?Are there any barriers I should know about?What data or information has already been gathered on this topic?What analysis process will be needed?Who has a stake in the outcome?What decisions will be made based on my work?How quickly is an answer needed or wanted?What are the customer's expectations of me?What does the customer want or not want to hear?
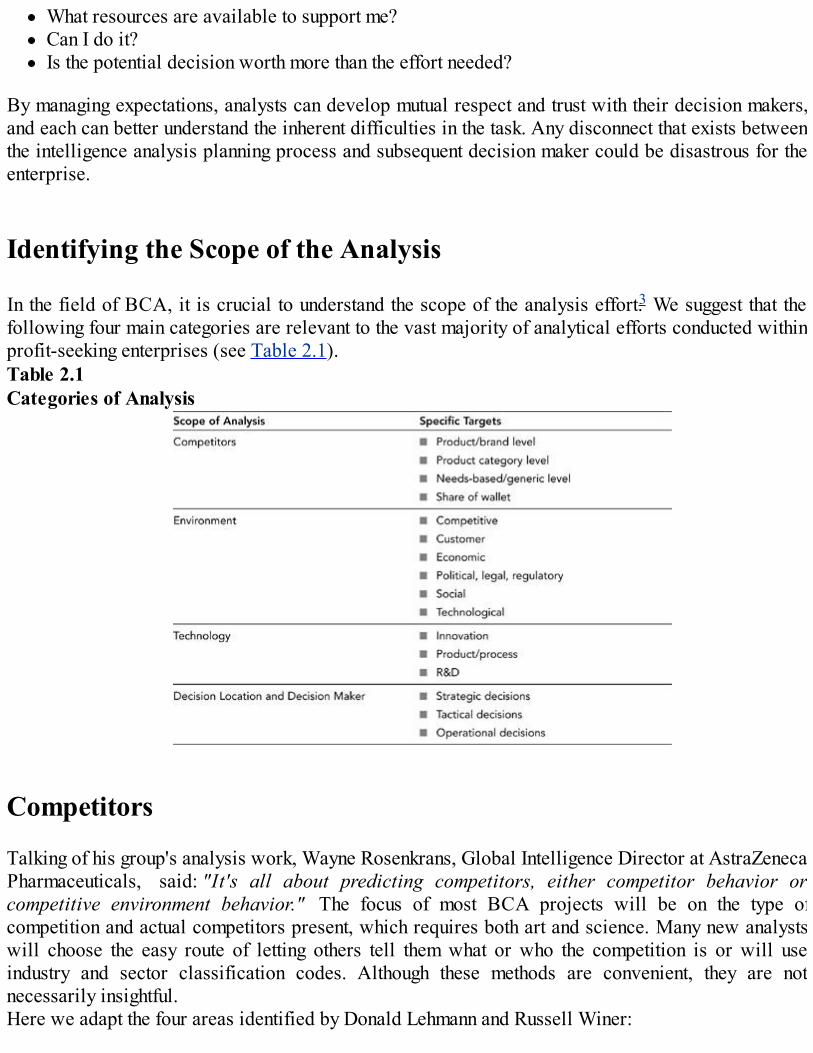
What resources are available to support me?Can I do it?Is the potential decision worth more than the effort needed?
By managing expectations, analysts can develop mutual respect and trust with their decision makers,and each can better understand the inherent difficulties in the task. Any disconnect that exists betweenthe intelligence analysis planning process and subsequent decision maker could be disastrous for theenterprise.
Identifying the Scope of the Analysis
In the field of BCA, it is crucial to understand the scope of the analysis effort.3 We suggest that thefollowing four main categories are relevant to the vast majority of analytical efforts conducted withinprofit-seeking enterprises (see Table 2.1).Table 2.1Categories of Analysis
Competitors
Talking of his group's analysis work, Wayne Rosenkrans, Global Intelligence Director at AstraZenecaPharmaceuticals, said: "It's all about predicting competitors, either competitor behavior orcompetitive environment behavior." The focus of most BCA projects will be on the type ofcompetition and actual competitors present, which requires both art and science. Many new analystswill choose the easy route of letting others tell them what or who the competition is or will useindustry and sector classification codes. Although these methods are convenient, they are notnecessarily insightful.Here we adapt the four areas identified by Donald Lehmann and Russell Winer:
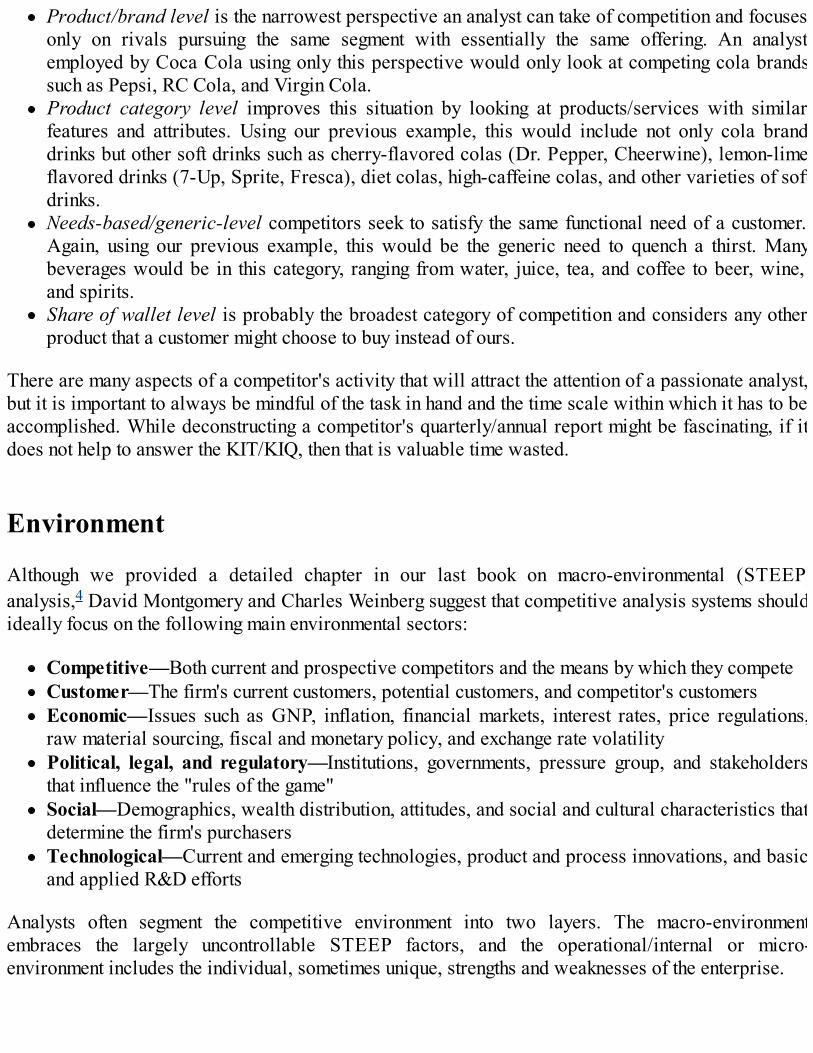
Product/brand level is the narrowest perspective an analyst can take of competition and focusesonly on rivals pursuing the same segment with essentially the same offering. An analystemployed by Coca Cola using only this perspective would only look at competing cola brandssuch as Pepsi, RC Cola, and Virgin Cola.Product category level improves this situation by looking at products/services with similarfeatures and attributes. Using our previous example, this would include not only cola branddrinks but other soft drinks such as cherry-flavored colas (Dr. Pepper, Cheerwine), lemon-limeflavored drinks (7-Up, Sprite, Fresca), diet colas, high-caffeine colas, and other varieties of softdrinks.Needs-based/generic-level competitors seek to satisfy the same functional need of a customer.Again, using our previous example, this would be the generic need to quench a thirst. Manybeverages would be in this category, ranging from water, juice, tea, and coffee to beer, wine,and spirits.Share of wallet level is probably the broadest category of competition and considers any otherproduct that a customer might choose to buy instead of ours.
There are many aspects of a competitor's activity that will attract the attention of a passionate analyst,but it is important to always be mindful of the task in hand and the time scale within which it has to beaccomplished. While deconstructing a competitor's quarterly/annual report might be fascinating, if itdoes not help to answer the KIT/KIQ, then that is valuable time wasted.
Environment
Although we provided a detailed chapter in our last book on macro-environmental (STEEP)analysis,4 David Montgomery and Charles Weinberg suggest that competitive analysis systems shouldideally focus on the following main environmental sectors:
Competitive—Both current and prospective competitors and the means by which they competeCustomer—The firm's current customers, potential customers, and competitor's customersEconomic—Issues such as GNP, inflation, financial markets, interest rates, price regulations,raw material sourcing, fiscal and monetary policy, and exchange rate volatilityPolitical, legal, and regulatory—Institutions, governments, pressure group, and stakeholdersthat influence the "rules of the game"Social—Demographics, wealth distribution, attitudes, and social and cultural characteristics thatdetermine the firm's purchasersTechnological—Current and emerging technologies, product and process innovations, and basicand applied R&D efforts
Analysts often segment the competitive environment into two layers. The macro-environmentembraces the largely uncontrollable STEEP factors, and the operational/internal or micro-environment includes the individual, sometimes unique, strengths and weaknesses of the enterprise.

Technology
Technology analysis is principally concerned with the technological base of new or emergingtechnological capacity.5 Much technological analysis focuses on evolution of science and scientificactivity, such as basic and applied research conducted within government laboratories, hospitals,innovation parks, and universities. One specialized area of competitive analysis falls under the rubricof Competitive Technology Intelligence (CTI). Brad Ashton and Gary Stacey identified three focalareas for CTI:
Innovation—Identifying innovation and in particular, disruptive innovation. Decision makers intechnologically driven industries experience rapid change. Consequently, new or differenttechnologies will be needed within a short- to medium-term time period to compete.Product/process—Attempts to understand the nature and potential results of processimprovements. For companies with technology intensive products and/or processes, technologyis an important differentiating factor in product features, production steps, or pricing strategy.Those industries that are characterized by frequent product introductions must keep ahead ofrelevant emerging technologies.R&D—Many industries have a high proportion of companies with high R&D intensity. As such,they display higher-than-average ratios of R&D expenditures to sales. They are also firmswhose R&D portfolio may contain a high proportion of large, long-range products and that aremost active in developing innovation, as well as product and process improvements.
The intelligence needs of decision makers in technology environments will vary by industry andposition. Ashton and Stacey also noted that scientists and engineers require detailed technicalintelligence on technical objectives, manufacturing methods, R&D approaches, and technicalcontacts. Technical managers often need analysis related to competitors' program funding plans, IPportfolios, partnership approaches and arrangements, R&D strategies, and technology acquisition ortransfer strategies. Senior decision makers are frequently concerned with the nature of emerging orpotential business alliances, new product introductions, and technical breakthroughs. Marketingdecision makers care about competitive product features, product sales, product benefits, andcost/performance/price insights. Last but certainly not least, public policy makers and regulatorsrequire analysis to help them establish reasonable policy and regulatory requirements. A flexibleapproach is therefore needed to respond to the needs of each and every customer.
Decision Location and Decision Maker
Management decisions differ depending on the level of responsibility on which they are made andwho makes them. A brief overview is helpful here to put this into context:
Strategic decisions have significant resource allocation impact, set the precedents or tone fordecisions further down the organization, and have a potentially material effect on theorganization's competitiveness within its marketplace. They are made by top managers and affectthe business direction of an organization.
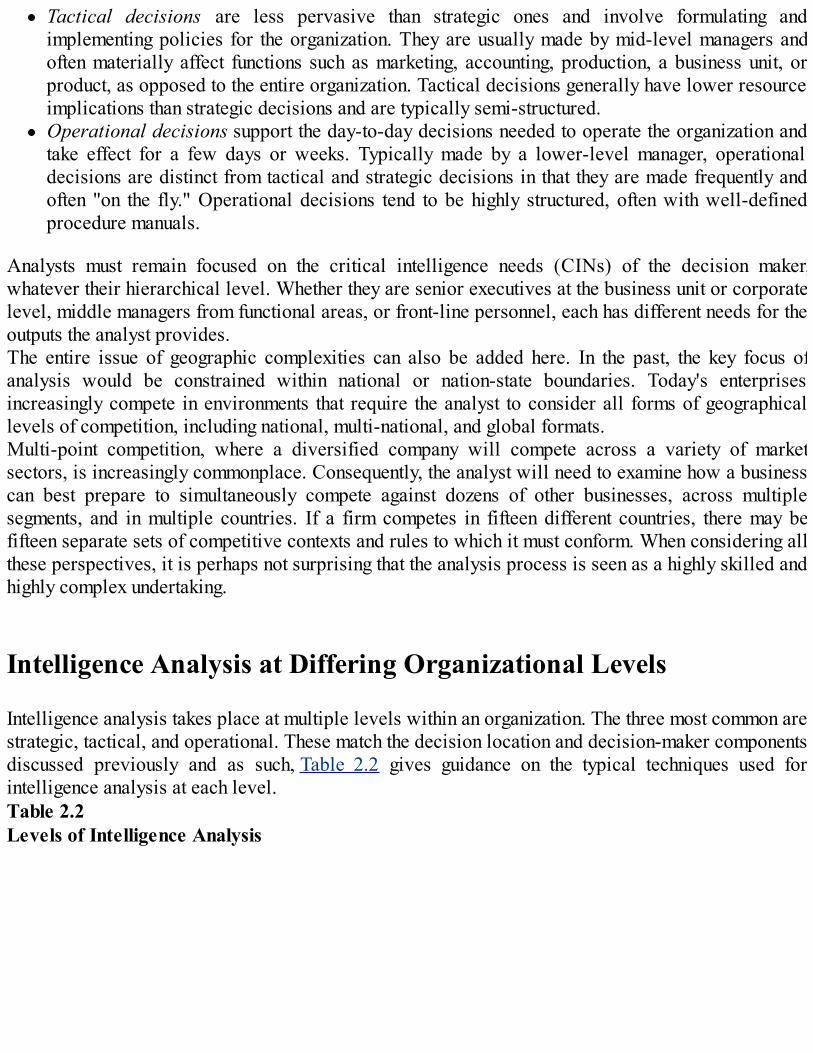
Tactical decisions are less pervasive than strategic ones and involve formulating andimplementing policies for the organization. They are usually made by mid-level managers andoften materially affect functions such as marketing, accounting, production, a business unit, orproduct, as opposed to the entire organization. Tactical decisions generally have lower resourceimplications than strategic decisions and are typically semi-structured.Operational decisions support the day-to-day decisions needed to operate the organization andtake effect for a few days or weeks. Typically made by a lower-level manager, operationaldecisions are distinct from tactical and strategic decisions in that they are made frequently andoften "on the fly." Operational decisions tend to be highly structured, often with well-definedprocedure manuals.
Analysts must remain focused on the critical intelligence needs (CINs) of the decision maker,whatever their hierarchical level. Whether they are senior executives at the business unit or corporatelevel, middle managers from functional areas, or front-line personnel, each has different needs for theoutputs the analyst provides.The entire issue of geographic complexities can also be added here. In the past, the key focus ofanalysis would be constrained within national or nation-state boundaries. Today's enterprisesincreasingly compete in environments that require the analyst to consider all forms of geographicallevels of competition, including national, multi-national, and global formats.Multi-point competition, where a diversified company will compete across a variety of marketsectors, is increasingly commonplace. Consequently, the analyst will need to examine how a businesscan best prepare to simultaneously compete against dozens of other businesses, across multiplesegments, and in multiple countries. If a firm competes in fifteen different countries, there may befifteen separate sets of competitive contexts and rules to which it must conform. When considering allthese perspectives, it is perhaps not surprising that the analysis process is seen as a highly skilled andhighly complex undertaking.
Intelligence Analysis at Differing Organizational Levels
Intelligence analysis takes place at multiple levels within an organization. The three most common arestrategic, tactical, and operational. These match the decision location and decision-maker componentsdiscussed previously and as such, Table 2.2 gives guidance on the typical techniques used forintelligence analysis at each level.Table 2.2Levels of Intelligence Analysis
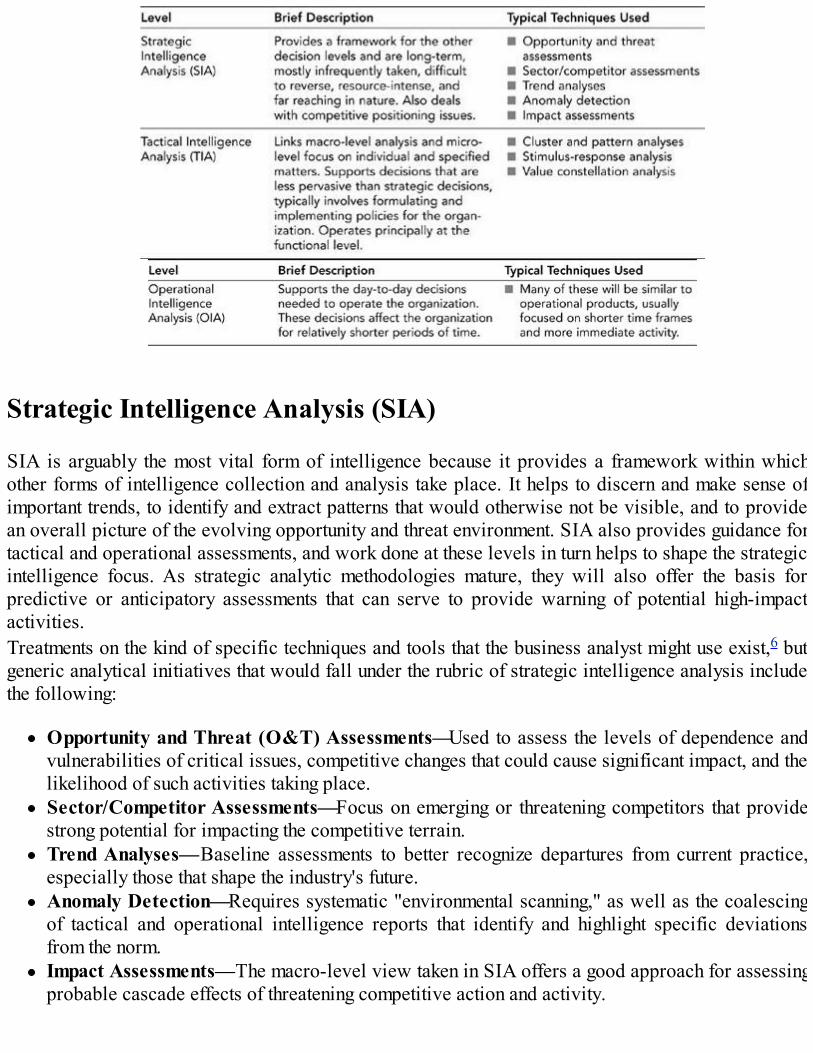
Strategic Intelligence Analysis (SIA)
SIA is arguably the most vital form of intelligence because it provides a framework within whichother forms of intelligence collection and analysis take place. It helps to discern and make sense ofimportant trends, to identify and extract patterns that would otherwise not be visible, and to providean overall picture of the evolving opportunity and threat environment. SIA also provides guidance fortactical and operational assessments, and work done at these levels in turn helps to shape the strategicintelligence focus. As strategic analytic methodologies mature, they will also offer the basis forpredictive or anticipatory assessments that can serve to provide warning of potential high-impactactivities.Treatments on the kind of specific techniques and tools that the business analyst might use exist,6 butgeneric analytical initiatives that would fall under the rubric of strategic intelligence analysis includethe following:
Opportunity and Threat (O&T) Assessments—Used to assess the levels of dependence andvulnerabilities of critical issues, competitive changes that could cause significant impact, and thelikelihood of such activities taking place.Sector/Competitor Assessments—Focus on emerging or threatening competitors that providestrong potential for impacting the competitive terrain.Trend Analyses—Baseline assessments to better recognize departures from current practice,especially those that shape the industry's future.Anomaly Detection—Requires systematic "environmental scanning," as well as the coalescingof tactical and operational intelligence reports that identify and highlight specific deviationsfrom the norm.Impact Assessments—The macro-level view taken in SIA offers a good approach for assessingprobable cascade effects of threatening competitive action and activity.
Tactical Intelligence Analysis (TIA)
TIA is a necessary and important complement to work done at the strategic level. It is the natural linkbetween macro- and micro-level analysis. Although SIA provides the framework for TIA, theseassessments in turn feed SIA. With a dynamic symbiotic relationship between the two, mutual strengthis derived.Typical techniques used in TIA are the following:
Cluster and Pattern Analysis—Identifies the use of particular marketplace attack methods,commonalities of targets, and attempts to build profiles of competitors.Stimulus-Response Analysis—Identifies actions that could be taken by competitors in responseto specific events. This analysis could be used both proactively to develop warnings orreactively to design future tactics.Value Constellation Analysis—Identifies the key stakeholders, important partners, allies, jointventure prospects, outsourcing potential, and agents that a company could utilize.
Operational Intelligence Analysis (OIA)
Unlike its two more broadly based IA cousins, OIA is often event-centric and single-case-oriented. Itprovides more immediate but lesser-lasting benefits and typically involves technological assessmentsof methods used for marketplace battles or investigations of competitive threats. It is frequentlyfocused on helping the analyst understand in real-time a particular event; such as a competitor who isattempting to perform competitive intelligence efforts of your enterprise. This can be especiallyhelpful for counter-intelligence and can keep your company's efforts from being prematurelydisclosed.An important component of OIA is vulnerability analysis and recommending how these can beminimized or eliminated. Vulnerability analysis can be used to look both at the enterprise'smarketplace vulnerabilities as well as, more tactically, the competitive intelligence process beingemployed.
Evaluating the Inputs to Analysis
It is critical that analysts can credibly evaluate their data and information. In weighing the credibilityof inputs, they have to consider the nature of their sources and reliability. In the intelligencecommunity, this is often described as the process of determining "bona fides."There are a series of questions that should be kept in mind when examining sources, as follows:
Reliability—Can the source of the information be trusted to deliver reliable information to the

analyst? Does the source have a "track record" for delivering credible inputs? The U.S. militaryuses the following information evaluation scale to assess reliability:7
"A" Completely reliable"B" Usually reliable"C" Fairly reliable"D" Not usually reliable"E" Unreliable"F" Reliability unknown
Accuracy—Have the data inputs been captured "first hand," or have they been filtered? Is thereany reason to think that there might be any deception involved? Is the source able tocommunicate the data precisely? Is the source truly competent and knowledgeable about theinformation they provide? Do they have a known vested interest, hidden agenda, or other biasthat might impact the information's accuracy? Can the source's data be verified by other sourcesor otherwise triangulated?Availability—Unavailable data is not going to help the analyst do his or her work. It is criticalthat the analyst does not rely solely on one source. Are there credible substitutes that can beused? Can sources be accessed quickly?Ease of access—What is the financial opportunity and time cost to access the source? Is this thebest use of limited resources, or can equivalent data be gained with lesser expenditure? Does thesource speak the right language, or will translation be needed? If so, what are the dangers ofmisunderstanding and/or incorrect reporting?
Once analysts have addressed their sources, they need to make sense of what has been gathered. Thenext section talks about the preliminary stage in sense-making—that of qualifying the raw data andinformation before it is subjected to analytical processing.
Making Sense of the Analysis
Analysts ultimately respond to decision makers' needs for knowledge. This brings up the key questionof what we mean by the word "knowledge." In this book, we conceptualize knowledge as that whichpeople in the enterprise either know they know or perceive that they know. Knowledge is definitelyan asset of the enterprise and is referred to by analysts as evidence, the basis upon which they canperform further assessment.Knowledge can be further broken down into five interrelated elements, all of which are important foranalysts to understand in carrying out their responsibilities.8
Facts
Verified information, something known to exist or to have occurred. These are unambiguously truestatements and are known to be so. Facts come in any form and will be found among virtually anysource of data that enters an employee's awareness, or the enterprise's communication and
information systems. It is surprising how few enterprises subject their collected data and informationto fact checking and verification processes. This becomes even more important for strategy decision-making purposes because many of the facts about competitors and competition are time-sensitive.What may be accurate today may be dangerously incorrect tomorrow.
Perceptions
Perceptions are impressions or opinions that fall short of being facts, but which are supported tosome extent by underlying data or logic. These are often expressed as thoughts or opinions inlanguage such as: "I think that . . ." or "My view is . . ." It is important for the analyst to subject thesethoughts and opinions to tests to establish which can be converted into facts and which have to remainas perceptions for the time being. There is nothing wrong in factoring perceptions into the analysisprocess, just as long as everybody knows that this is what they are. The error comes whenperceptions are mistakenly regarded and treated as facts when they are not. The use of perceptions isperhaps the most exciting element to subject to subsequent analysis, especially when using scenarioanalysis, war-gaming, what-if analysis, and other such future-oriented techniques.
Beliefs
Beliefs are often drawn from a mix of facts and perceptions and commonly describe cause-effectrelationships. They can be either explicit or implicit, but they too need to be subjected to verificationand justification. Beliefs often color the way individuals understand their world and the way in whichthey think about the future. Therefore, it becomes critical in the analysis process for beliefs to beaired and made transparent to those individuals who are key parts of the process, whether theseindividuals are data gatherers, analysts, or decision makers.
Assumptions
This is the knowledge that individuals take for granted. These can come in the form of any of thepreviously described categories and may refer to things that have occurred in the past, present, or canbe fairly safely predicted as going to happen in the future. Explicit assumptions are those that areconsciously adopted by the analyst, are well understood, and are shared. Implicit assumptions arethose that individuals in the analysis process do not consciously elicit, share, or articulate and maynot even be aware of. Valuable as they are, as with perceptions and beliefs, assumptions need to beconsistently and constantly challenged to reflect changing situations and a shifting competitivelandscape.
Projections

Projections are composed of a mixture of facts, perceptions, beliefs, and assumptions. They arejustified or substantiated judgments about the future. It is again important that the analyst be able topowerfully defend or justify their projections as they become a critical part of the knowledge baseunderlying the decisions made.
Synthesis
Having identified the type of knowledge in place, the analyst can proceed with greater confidencetoward a high-quality output. Qualified inputs are then subjected to the real heart of analysis—thethinking processes, sifting, synthesis, induction, deduction, abduction, experimentation, mathematicalconceptualization, experimentation, research, application of methods, techniques, and a vast array ofother activities all designed to generate unique and actionable insights.An important element to the analysis process is that of infrastructure support, or those technologicalparts of the analysis process that are complementary to the analysis and analysis process itself. Thefollowing section provides an overview of the key facets of analysis infrastructure that can encourageand permit the analyst to produce their best work.
Infrastructure to Support the Analysis Process
One facet of analysis infrastructure that has become more prominent in recent years is the growth ofinformation systems support. When we refer to information systems in this book, we are specificallyreferring to combinations of software and hardware that are utilized to support information gathering,classification, synthesis, and dissemination. These are often referred to under alternative rubrics suchas management information systems (MIS), decision support systems (DSS), enterprise informationsystems (EIS), enterprise resource planning systems (ERP), executive information systems (ExIS),business intelligence systems (BI), marketing information systems (MkIS), and knowledgemanagement systems (KM), among others. Firms have also developed information support systems towhich they refer by their own unique names. The function of each remains the same—providingsupport for the analysis process and enhancing sense-making.The entire subject of system support would require book-length treatments to properly describe whatwe know and their ability to support the business and competitive analysis process. This bookfocuses on carrying out business and competitive analysis, and as such, we highlight what we deem tobe the key elements that analysts should consider as they use these systems to support them in theirwork.
Intelligence Solutions
Unfortunately for most of the readers of this book, competitive analysts generally have not been wellsupported by the information systems introduced by organizations. Most were not purpose-designedto support BCA tasks, and as such, they have not and maybe cannot replace or substitute for the human
cognitive and mental processes that analysts uniquely develop and employ.9Successful analysts require the support of dedicated information systems, both formal, informal,human, and technical. These systems can, among other things, allow the manipulation of data formulti-dimensional visualization of phenomena and for mapping relationships. Effective systems alsooperate in real-time and have filters to make sure that the data and information the analyst works withis traceable, to provide the ability to assess validity and reliability.Analysts are ordinarily uninvolved in the selection of management information systems and usuallyhave to work with what is already there in the larger enterprise or what can be afforded. Fortunately,there has been an upswing in the nature and number of intelligence software solutions. Intelligencesolutions have become one of the hotter topics in today's boardrooms. Recognizing their needs in thisarea, corporations have energized a burgeoning market for intelligence consulting, software, andservices solutions.
Limitations of Intelligence Solutions
Essentially, decision makers want concise information they can act on. Typically, they get bits andpieces of data or stacks of undigested reports, leaving them to fill in the blanks. Effective intelligencesolutions are designed not to create more information, but to create better information. Used properly,intelligence solutions can reduce the amount of information being transmitted; nevertheless, it is wiseto be aware of their limitations.Some commercial intelligence solutions have attempted to provide the "holy grail" of intelligencewith artificial intelligence, knowledge trees, or executive decision support systems, which take theinputted information and perform a number of "tests" on it to alert the analyst to when certain dataparameters have been triggered. Virtually all intelligence-related software provides the basic meansfor organizing and categorizing information, but precious few take it to the next step to whereinferences can be drawn or insight achieved.Nearly all commercial intelligence solutions fall short in the qualitative arena, which is whatintelligence analysis has traditionally been about. There is little evidence of intelligence software thatprovides the kind of discovery through spatial, timeline, and relationship analysis that trained analystsroutinely perform.10 Analysis of soft data means seeing just around the corner, appreciating why arival made certain visits to different competitors or provincial officials, or the competitor's CEO hasvoiced certain views. Few intelligence solutions are able to look around the corner, especially whenthat corner is on a different street or in a country where the written and spoken language differsmarkedly from the analyst's enterprise.What the software industry generally has not grasped is that competitive intelligence is traditionallydefined as information that has been analyzed to the point where a person can make a decision.Software generally does not analyze. It can perform rudimentary and even sophisticated statisticalanalysis on convenient data, but still requires interpretation. Reality dictates that most analysis isdone on the less convenient data that employees encounter but mostly do not recognize to be animportant piece of the intelligence puzzle. This highlights the importance of combining human/expertknowledge and organizational data with a sophisticated, purpose written, software product, to forman effective intelligence solution. These things can rarely be bought "off-the-shelf."Organizations also use groupware or intranet-based technologies to organize and categorize the
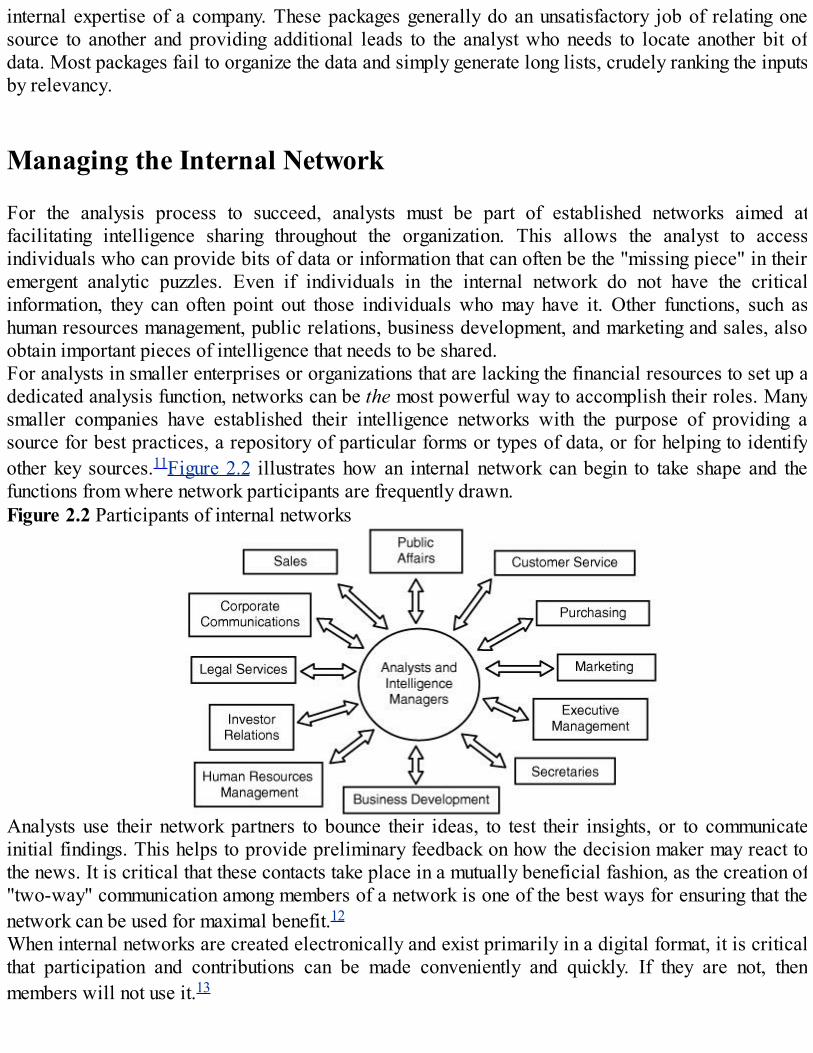
internal expertise of a company. These packages generally do an unsatisfactory job of relating onesource to another and providing additional leads to the analyst who needs to locate another bit ofdata. Most packages fail to organize the data and simply generate long lists, crudely ranking the inputsby relevancy.
Managing the Internal Network
For the analysis process to succeed, analysts must be part of established networks aimed atfacilitating intelligence sharing throughout the organization. This allows the analyst to accessindividuals who can provide bits of data or information that can often be the "missing piece" in theiremergent analytic puzzles. Even if individuals in the internal network do not have the criticalinformation, they can often point out those individuals who may have it. Other functions, such ashuman resources management, public relations, business development, and marketing and sales, alsoobtain important pieces of intelligence that needs to be shared.For analysts in smaller enterprises or organizations that are lacking the financial resources to set up adedicated analysis function, networks can be the most powerful way to accomplish their roles. Manysmaller companies have established their intelligence networks with the purpose of providing asource for best practices, a repository of particular forms or types of data, or for helping to identifyother key sources.11Figure 2.2 illustrates how an internal network can begin to take shape and thefunctions from where network participants are frequently drawn.Figure 2.2 Participants of internal networks
Analysts use their network partners to bounce their ideas, to test their insights, or to communicateinitial findings. This helps to provide preliminary feedback on how the decision maker may react tothe news. It is critical that these contacts take place in a mutually beneficial fashion, as the creation of"two-way" communication among members of a network is one of the best ways for ensuring that thenetwork can be used for maximal benefit.12
When internal networks are created electronically and exist primarily in a digital format, it is criticalthat participation and contributions can be made conveniently and quickly. If they are not, thenmembers will not use it.13
Managing the External Network
External networks are also a key part of the analyst's contact universe. It is vital that analystsestablish, maintain, and constantly qualify and update a set of contacts outside the firm, as certaintypes of research cannot be accomplished without them. Analysts must be able to access industryexperts, industry associations, industry commentators, stock analysts, government experts, governmentdepartments, civil servants, respected journalists, subject specialists, and broadcasters to obtainneeded data or access to other important stakeholders. Analysts that network with professionals fromother non-competing or consulting firms can gain insight into effective practices.14 It is important tonote here that networks may not be viewed as providing immediate and obvious benefits. JohnShumadine, Director of Competitive Intelligence for Deloitte and Touche, states it clearly when hesays: "But it sometimes takes years to develop a Rolodex within your own industry, a repository ofinformation and a collection of individuals that you can network with. There's not an immediatepayback." Nevertheless, these networks are typically essential to long-term business and competitiveanalysis success.
Proactivity, Efficiency, and Perpetual Learning
Analysts need to be highly proactive, not only delivering the needed intelligence for their decisionmakers today, but also figuring out ways by which they can augment their organization's analysiscapabilities for the future.Developing increased expertise at searching, classifying, qualifying, and organizing data can be avery beneficial time saver for analysts. They also need to develop the ability to cut through the"noise" and get to the heart of an issue. They need to be able to remove the unnecessary trappings andkeep only the essential bits that make the difference. The Pareto principle, whereby 20% of theinformation will provide 80% of the insight, nearly always rings true in analysis work. Betteranalysts also hone their project and time management skills over time. We know of few long-termanalysts who are poor at this, and, in reality, it is one of the key competencies that effective analystsmust eventually display.Another key task for the analyst is to learn how to quickly deal with the flood of data and informationthat comes in on a daily basis. An analogy is considering how a quick keyword entry using any one ofthe many search engines available on the World Wide Web generates thousands of "hits" and howonly a few of these will actually be relevant to the searcher's goals. By systematically capturinglearning from prior projects, integrating their efforts across projects, building the capabilities of theirsupporting information systems, leveraging their networks more effectively, and last but not least, byeducating their customers in ways that improves their mutual relationship, significant advances inbusiness and competitive analysis can be made.
Summary
L.M. Fuld noted that three elements were part of the successful competitive intelligence operations
that he had examined:
Constancy—Information is gathered and analyzed constantly, not just during the traditionalstrategic planning cycle or on a just-in-time basis.Longevity—Intelligence program investments were for the longer term. Six months, one year, oreven two years may not be enough to prove the worth of a program. The most successful andenduring intelligence systems had taken three to five years to mature.Involvement—The more people saw the development and use of intelligence as a keycomponent of their jobs, the more readily available the intelligence was and the more it wasused.
These three facets of success are not commonly experienced by competitive analysts. Most claim thatthey are not properly supported in terms of information systems, access to key decision makers,access to data or information, or most importantly, the time needed to effectively perform their tasks.Properly allocating resources is critical if the analysis function and individuals doing it are to beeffective.In examining analysis practiced in a number of organizations in the last twenty years, we haveidentified a set of characteristics that are present in those organizations that have maintained thegreatest longevity. These are reflected in Fleisher and Bensoussan's 10 Commandments for Businessand Competitive Analysis, and they provide a beneficial summary to the lessons that should becaptured by analysts and their superiors from reading this chapter.
Fleisher and Bensoussan's 10 Commandments for Business andCompetitive Analysis
1. 1. Analysis should underlie and be an integral part underlying every one of your organization'simportant competitive and strategic decisions.
2. 2. Decision-making customers shall use only analyzed data to direct competitive decision-making, planning, and subsequent actions.
3. 3. Analytic processes should be performed in a timely manner and products delivered to clientswell in advance of their need to use them in decision-making.
4. 4. Analytic products must contain conclusions and recommendations effectively presented inthe optimal format to customers for their consideration.
5. 5. Analysts shall not confuse data compilations, digests, newsletters, static portals, orsummaries with analysis.
6. 6. Analysis must be FAROUT© and able to be relied upon to strike the best balance among theseelements.
7. 7. Analysis outputs (products, advice, services, etc.) will be negotiated based on the client'sspecification to ensure that the KIT is achievable.
8. 8. Analysis should reflect all relevant data available, from all legitimate/legal means andsources.
9. 9. Analysis should utilize the best and most current methods, tools, and techniques available(like the ones included in this book and beyond).
10. 10. Analysis must be regularly evaluated by both its producers as well as consumers for itscontribution to your organization's mission and goals.
References
Ashton, W.B., and G.S. Stacey (1995). "Technical intelligence in business: Understanding technologythreats and opportunities," International Journal of Technology Management, 10(1), pp. 79–104.Belkine, M. (1996). "Intelligence analysis as part of collection and reporting," pp.151–164 of Part B.in Gilad, B., and J. Herring [eds.], The Art and Science of Business Intelligence Analysis.Greenwich, CT: JAI Press.Bouthillier, F., and K. Shearer (2003). Assessing Competitive Intelligence Software: A Guide toEvaluating CI Technology. Medford, NJ: Information Today, Inc.Carr, M.M. (2003). Super Searchers on Competitive Intelligence: The Online and Offline Secretsof Top CI Researchers. Medford, NJ: Cyberage Books.Chender, M. (2006). Comments from his speech given to the KM World webinar, "Creating aPredictable Advantage," January 19, found at www.kmworld.com.Clark, R.M. (2004). Intelligence Analysis: A Target-Centric Approach. Washington, DC: CQ Press.Fiora, B. (2003). "Applying consulting skills to CI projects—Part 1," Competitive IntelligenceMagazine, 6(3), pp. 53–54.Fleisher, C.S., and B. Bensoussan (2003). Strategic and Competitive Analysis: Methods andTechniques for Analyzing Business Competition. Upper Saddle River, NJ: Prentice Hall.Fuld, L.M. (2003). Intelligence Software Report 2003: Leveraging the Web. Private report by Fuld& Company, Boston, Massachusetts.Fuld, L.M. (1995). The New Competitor Intelligence. New York, NY: John Wiley & Sons.Fuld, L.M., and K. Sawka (2000). "Money can't buy you smarts," CIO Magazine, 1 October.Herring, J. (2002). "KITs revisited—their use and problems," SCIP Online, 1(8), May 2.Herring, J. (1999). "Key intelligence topics: A process to identify and define intelligence needs,"Competitive Intelligence Review, 10(2), pp. 4–14.Kalinowski, D.J. (2003). "Managing expectations: Will clients ever fully understand?" CompetitiveIntelligence Magazine, 6(6), pp. 25–29.Lehmann, D.R., and R.S. Winer (2002). Analysis for Marketing Planning, 5th ed. New York, NY:McGraw-Hill Irwin.McGonagle, J., and C. Vella (2003). The Manager's Guide to Competitive Intelligence. Greenwich,CT: Praeger Books.Montgomery, D.B., and C.B. Weinberg (1998). "Toward strategic intelligence systems," MarketingManagement, 6 (Winter), pp. 44–52.Nikkel, P. (2003), "How can we determine which CI software is most effective: A framework forevaluation," pp. 163–175 in Fleisher, C., and D. Blenkhorn [eds.], Controversies in CompetitiveIntelligence: The Enduring Issues. Westport, CT: Praeger.O'Connor, T.R. (2003). "The skills of an intelligence analyst," North Carolina Wesleyan College,http://faculty.ncwc.edu/toconnor/392/spy/analskills.htm, March.Page, A.M. (1996). "The art and science of collection management," pp. 181–206 of Part B. in Gilad,

B., and J. Herring [eds.], The Art and Science of Business Intelligence Analysis. Greenwich, CT:JAI Press.Ringdahl, B. (2001). "The need for business intelligence tools to provide business intelligencesolutions," pp. 173–184 in Fleisher, C., and D. Blenkhorn [eds.], Managing Frontiers inCompetitive Intelligence. Westport, CT: Quorum Books.Senge, P. (1990). The Fifth Discipline: The Art and Practice of the Learning Organization. NewYork, NY: Currency Doubleday.Skryzowski, L. (2003). "Building a CI network from scratch," Competitive Intelligence Magazine,6(3), pp. 39–41.
Endnotes
1 McGonagle and Vella, 2003.2 Similar to actual practice, we will use these terms interchangeably in this book, recognizing thatthere are subtle differences between the two terms.3 Clark, 2004.4 See Fleisher and Bensoussan, 2003, Chapter 17.5 See, in particular, Chapters 21 through 25 of this book, which focus on technological phenomena.6 Fleisher and Bensoussan, 2003.7 Page, 1996.8 Belkine, 1996; Fahey, 1999; O'Connor, 2003; Senge, 1990.9 Fuld, 2003.10 Bouthillier and Shearer, 2003; Fuld and Sawka, 2000; Nikkel, 2002; Ringdahl, 2001.11 Skryzowski, 2003.12 Skryzowski, 2003.13 Chender, 2006.14 McGonagle and Vella, 2003.

3Avoiding Analysis Pitfalls
This chapter illustrates the common barriers or obstacles to business and competitive analysis (BCA)effectiveness in contemporary enterprises. Analysis of failure is an elusive concept, and research ofanalysts about their understanding and experiences of these terms have produced little, if any,consensus.1 We, the book's authors, are typically uncomfortable when we hear analysts or theirclients claim that, "I'll know it when I see it."It hardly needs to be said that organizations and managers can learn from failures if individualsthoughtfully talk about and examine them, something that is rarely done except in cases ofcatastrophic, publicly visible failures2 that cannot escape the media's glare. Unfortunately, by theirvery nature, adverse results and failures are rarely, if ever, discussed in the normal course oforganizational affairs. Our premise in identifying the possibility and causes of analytical failure isthat we believe that much can be learned by managers and practitioners from studying failures andthat this learning can ultimately contribute to creating a more successful analysis function. As such,we begin with a discussion about what constitutes analysis of failure.
Analysis of Failure
Although analysis of failure is an accepted part of contemporary industry practice, its application toan enterprise's intelligence, planning, and decision-making functions is comparatively rare. There is ahierarchy of failure, though, and we examine this now.
Failure Location
We would regard the highest level of analysis failure to be that of business failure, whereby abusiness is no longer able to continue as a viable commercial entity. If failure is defined as"discontinuance of business," the percentage is likely around two-thirds of all start-ups will failwithin their first ten years,3 and at even higher rates in some particularly difficult sectors such asretailing and restaurants. Most of these business failures are commonly attributed to a general lack ofeffective planning and management skills exhibited by these firms' executives.Beneath the level of the firm, we encounter planning, decision-making, and implementation failures.Because we are concerned in this book with the BCA function in contemporary enterprises, werecognize planning and decision-making failures as being at least partly composed of intelligencefailures. These can be further disaggregated into failures along the traditional "intelligence cycle"functions of planning, data collection, analysis, and dissemination/communication.Intelligence failures are distinguishable from more task-oriented intelligence errors, which areviewed as factual inaccuracies in analysis resulting from poor or missing data. Intelligence failure isdefined by R. Johnston as "systemic organizational surprise resulting from incorrect, missing,discarded, or inadequate hypotheses." These failures may be due, at least in part, to failed analysis,
but they can also be caused by other factors that interact with the analysis process. Attempting todisentangle or disaggregate the analysis portion of the process from other related processes is neveran easy or straight-forward task. At a minimum, it is important that analysts and their decision makersalways carry out a postmortem on major projects to try and determine any areas for improvement.Having suggested the need for post-task assessment of the analysis process, we recognize that thereare a variety of problems associated with the evaluation of intelligence analysis and reporting thatmake this task more challenging.4 For example, the range of cognitive biases impacting this process isoutlined in greater depth in J.R. Heuer Jr.'s excellent book entitled Psychology of IntelligenceAnalysis. Briefly summarized, he notes that
Analysts normally overestimate the accuracy of their past judgments.Intelligence clients or consumers normally underestimate how much they learned from analysisproducts such as reports or briefs.Overseers of intelligence production who conduct post-mortem analyses of an intelligencefailure normally judge that events were more readily foreseeable than was, in fact, the case.
Suffice it to say, a variety of assessment methods must be used in evaluating the analysis and itscomplementary/supplementary processes to reduce the presence and impact of bias.
Sources of Failure
When analysis is ineffective, both the analyst and the decision maker often don't recognize it in timeand frequently cannot identify the root cause(s) of the errors, problems, or failure. They must considerthe following questions underlying the potential errors, some of which may also be causes of failure.Errors that we recognize as commonly occurring in performing the analysis task include thefollowing:
Analysis problem definition—Was the analysis problem, the key intelligence topic, or keyintelligence question (KIT, KIQ) properly specified at the outset? Did the analysis processallow for any subsequent redefinitions of the problem?Analysis project planning—Did the analyst develop a project management plan or statement ofwork to perform the analysis process? Did they actually implement the process according totheir plan or veer away from it mid-course?Data-gathering error—Was the appropriate data available to the analyst? If not, could the datahave been efficiently acquired? Did the analyst properly account for data or information gaps?Was the analysis the cause of the failure, or was data collection the primary cause?Tool- and technique-related error—Did the analyst use the best available tools, techniques,and/or analysis methods? Were the right tools used and in the right sequence and combination?Synthesis error—Did the analyst arrive at the optimal conclusion or insight? Did they "connectthe dots" in a logical and defensible manner? Would other experienced and successful analystshave connected them differently?Communication transmission or channel error—Did the analyst communicate their insights totheir decision maker throughout the project in an optimal fashion? Was the analysis failure really

a communication failure?Communication reception error—Did the decision maker have a complete and accurateunderstanding of the analyst's conclusions before the decision needed to be made?Unsystematic development error—Did (uncontrollable) events arise during the course of theprocess that derailed the analysis or analyst? What impact did unexplained variance or randomfactors have on the outcome of the analysis task?
Four-Level Hierarchical Model of Analysis Failures
Whatever the outcomes experienced for analysis errors or failures, it is valuable to identify thereasons why these happen. We have developed a four-leveled taxonomy for identifying the barriers togenerating effective competitive analysis.5 The four levels are as follows:
1. 1. The individual analyst2. 2. The analysis task itself3. 3. The organizational context within which the task is conducted4. 4. The external environment in which the organization is ensconced
These four levels and the primary factors associated with each are illustrated in Table 3.1.Table 3.1Four-Level Hierarchical Model of Analysis Failures

In the section that follows, we identify the most common problems we have found in our research ateach of these four levels. We recognize that some of the factors may not be present in only the singlecategory we ascribed it, but may also be present in one or more of the other levels. We have placedthe factor at the level where we have most frequently observed it being an obstacle to effectiveanalysis, recognizing that it may have secondary or tertiary impacts at another level.
Individual Analyst-Level Failures
The BCA task is fundamentally performed by individual analysts, although these analysts also need tocooperate and collaborate with others in their firm to get their tasks accomplished. We see thefollowing hindrance factors as being primarily present at the level of the individual analyst. They arenot listed in the order of occurrence or of perceived importance, but these are the half-dozen distinctitems we have identified as being most commonly present.Different natural analytical abilities: People rely on a limited set of mental models, havepreconceptions on issues, and exhibit a wide range of cognitive bias when reviewing information.People also think differently. Some predominate cognitively in a right-brained linear fashion; othersin a left-brained lateral fashion. This is important when viewed in light of analysis being a mixture ofboth scientific and nonscientific techniques.

Naturally limited mental capacities: The content and context facing most analysts has become morecomplicated, complex, and fast moving in recent years. Having said that, our brain's natural abilitiesto effectively process additional information hasn't evolved correspondingly to match this. Thepopular view that we only use 10% of our brain's ability is a well-worn myth, and one could arguewith the figure, but we are confident that human beings still only use a limited percentage of theirbrain capacity, although scientific record still does not have a sense of what that true percentagemight be.6G.A. Miller suggested that the magical number describing our natural information processingcapabilities is seven things at one time plus or minus two. This could be a major problem for analystswho often have a far higher number of issues to keep in their mental calculus at any one time.Although we now have better information technology systems to assist in the analysis task, we stillmainly use our brains in the same ways as we have always done.Natural motivation: Given a choice between a more difficult and a less difficult task with identicaloutcomes, the majority of people opt for the easier task. As we hope is already patently obvious bynow, analysis is not an easy task. It can require the use or expenditure of tremendous cognitive,intellectual, organizational, and social resources to properly accomplish. One reason it is so difficultis because we have far fewer published heuristics or "rules of thumb" to use in performing analysisthan we do in many other fields of organizational endeavor. Some analysts think that volume ofanalysis outputs is the answer, not their value. This form of sufficing behavior will probably fail tomeet the needs of today's demanding decision-making clients.Cognitive biases and perceptual distortion: In spite of the presence of the broad range of analyticaltechniques, some organizations still adopt poor strategies, and their decision-making processes arevulnerable to individual cognitive biases or "groupthink." Researchers have identified a variety ofcommon cognitive biases that can enter into an individual's or group's process of analysis.7 Theseinclude the following:
Estimation Bias—Over or under estimation of the magnitude of future events.Escalating Commitment—The commitment of more and more resources such as time, effort,data, and funds to an idea, course of action, project, or program, even after there is growingevidence that it is failing.Groupthink—This occurs when a group of decision makers embarks on a poorly determinedcourse of action without thoroughly questioning the underlying assumptions of the decision. Thisis most prevalent in organizations with entrenched leadership, engrained cultures, and seniorexecutives who dislike being challenged.Illusion of Control—An individual with misplaced confidence in his or her ability to "alwaysget it right" and to control things. Often found among senior executives who have been fortunateenough to get it right so far. Illusion of control and groupthink are common bed-fellows.The Prior Hypothesis Bias—Beliefs about the relationships between variables, even whenpresented with contradictory analytical evidence. Individuals prone to this bias use data onlywhen it confirms their beliefs while ignoring data that does not.Reasoning by Analogy—Individuals will use simple analogies to make sense out of challengingproblems. Oversimplifying complex problems is dangerous and can mislead an analyst to offer adetrimental judgment.Representativeness—A bias that violates statistical law in individuals who tend to generalizefrom small samples to explain larger phenomena. Analysts are at risk of this when they hear from
one or two influential individuals that an incident or action is taking place, and they immediatelyaccept this as truth without further investigation.
The existence of cognitive biases and groupthink raises issues of how to bring critical intelligence tobear on organizational decision-making mechanisms so that the decisions made are realistic. It isimportant to understand the range of motives behind it. M.S. Feldman and J.G. March pointed out thatpeople in organizations often tend to collect more information than strictly necessary for decisionmaking, partly to influence others and partly to be seen as "rational." In other words, analysis is oftenused not just for objective decision-making but also for political or symbolic purposes.Insufficient understanding and application of analysis tools and techniques: Studies on the use ofanalysis tools and techniques by business practitioners have consistently demonstrated that theindividuals responsible will use only a very limited set of tools and techniques, usually those theyknow the best and have previously applied with some perceived success.8 We previously illustratedthis problem as a "tool rut."9 Even when analysts are willing to acquire and then use an enlarged toolbox and attempt tools and techniques outside their ordinary fare, they often lack the knowledge,understanding, and experience to apply it effectively. It is no surprise therefore, that they will stick tothe safe but well-worn path of familiarity.
Analysis Task-Level Failures
A number of factors associated with the analysis task itself can be responsible for performanceproblems.Part of larger task: In Chapters 1, "Business and Competitive Analysis: Definition, Context, andBenefits," and 2, "Performing the Analysis Process," we discussed how analysis was part of a largernumber of processes that impact an organization's decision-making, policy development, andassociated activities. We have seen many examples where the analysis process was short-circuited infavor of other activities, leading to the diminishment of the decisions made, as well as a reducedmarket performance. Research done on competitive intelligence processes have consistently foundthat more time should be spent on analysis and significantly less on data collection and gathering.10
Task discontinuity: Analysts can ordinarily go from task to task in the course of their day. They willfrequently be working on any number of critical intelligence needs, questions, or topics at any singlepoint in time. As such, benefits derived from the learning curve, which suggests that the efficiency ifnot the effectiveness of analysis performance should grow and accelerate over time, are seldomachieved. The learning curve is one reason why analysts in the public sector are often assigned tospecific focal areas (e.g., country or regional "desks") for substantial periods of time, often betweenfive to seven years. These long-term assignments allow for the analyst and their organizations tocapture learning curve effects as experience is developed. Unfortunately, we find that most businessor commercial enterprises do not have the defined internal career paths, the patience, or the plans tohelp analysts obtain the learning curve benefits of depth, breadth, and length of experience.Unsatisfactory data inputs: The GIGO principle of "garbage in, garbage out" holds true in BCA.Many times, analysts will use data that is merely convenient, such as that generated by internalmanagement information systems, which can be easily found on the World Wide Web, or that can bequickly gathered through discussions with colleagues. "Convenient" data seldom provides the analystwith critical insight or the "golden nugget" being sought. Convenience-based data gathering is an

arch-enemy of effective analysis. There are a number of reasons why this state of affairs exists,including but not limited to the following prominent examples:
1. 1. Need to justify investments made in systems designed for other purposes—Organizationsmake substantial investments in data-gathering systems and require evidence to justify their veryexistence. The problem with this is that most of the information systems established inenterprises today are not tasked to support competitive analysis and intelligence generation.They are good at gathering customer data, accounting data, production data, and financial data,but bad at gathering competitive and strategic data.11
2. 2 . Differences in gathering versus analyzing/synthesizing information—Many executivesassume that web-based, electronic data subscriptions or media clipping services can generateintelligence. These things certainly generate volumes of data or information, but they do not,cannot, and are unlikely to perform the analysis and synthesis tasks that a human analyst canperform.12 As we have noted previously, there are no systems of which we are aware that canperform analysis at a level anywhere near that of a successful analyst. Although systems canaccelerate the reorganization, reclassification, or restructuring of data, they can do little beyondthat. The continuing development of artificial intelligence (AI)-based collection systems willassist the analysis process in the future, but even these are typically only focused on a minorsubset of typical business and competitive analysis problems.
3. 3. Extracting needed data from the heads of colleagues—Sometimes the critical missing datathe analyst needs can be found only within the heads of individuals either within or outside theorganization.13 It can be difficult to identify those parties that are likely to be the best sources forneeded information, and even if they could be readily identified, they would also have to beaccessible and amenable to providing this on a "just-in-time" basis. Most organizations lack thesystems to enable them to capture the critical information known by their own employees. Eventhough organizations have become more sophisticated in the application of knowledgemanagement (KM) systems, these still require heavy investment, ongoing training, and constanthuman interaction to be effective.
4. 4. Separating the wheat from the chaff—Many existing systems do not have the appropriatemeans for filtering or "grading" informational inputs as they enter the systems. As such, "bad"data, which may be corrupt for a bewildering variety of reasons, lives happily alongside the"good" data, and the analyst must still assess its suitability for the analysis tasks ahead.
Disconnects from decision making: The clients or customers of analysts are the ones who have theultimate responsibility to use intelligence or not. Analysts do not make decisions, nor do they managethe processes by which an organization might implement their findings. As such, decision makersmight simply choose not to use the intelligence, to ignore it, or to dismiss it for any variety of reasons.It is one thing for a decision maker to dismiss analysis because it is ineffective or unsatisfactory, butentirely another when it was indeed performed effectively.This dilemma points out the difference between analysis and policy-making. Analysts can study thetargets and potential outcomes of specific policy actions and can develop well-conceived rationalesfor decisions. At the end of the day, though, they are but one input among others in the client'sdecision-making calculus. We hope that the analyst's work will be a critical, if not the most critical,input. Nevertheless, we recognize that achieving the highest levels of trust from decision makers canonly genuinely take place over time, supported with collaboration, regular interaction, achievement of

successes, and a significant degree of mutual trust and understanding.Imbalance among key task facets: Analysts must be ever-cognizant of and always striving towardmaintaining any number of balances at any point in time. The ability to achieve this balance usuallyoccurs after a number of years of analytical experience. The authors have seen and heard from someexperienced analysts who have been doing the job for some time, and they still fail to properlybalance the many conflicts that are associated with performing the analysis task. There are no simplesolutions to this.
Internal Organizational-Level Failures
The internal organizational environment within which the analyst performs their task is alsoresponsible for less effective analysis outcomes. The major organizational factors we seecontributing to unfavorable outcomes are described next.Some decision makers don't understand and appreciate analysis: In many organizations, decisionmakers neither understand the role or place of intelligence analysis nor recognize the value it cangenerate in improving decision-making quality. As more companies focus their attention andresources on understanding competition and the competitive environment, they are realizing that theyare unsure of how to properly utilize the intelligence collected.14 Insufficient understanding of theintelligence function leads to a deluge of poorly translated data, as departments request information,without filtering out the most relevant issues.15 By churning out vast quantities of purposelessinformation, the analysts and their departments are unable to properly apportion their time to theaccurate analysis and assembly of useable intelligence.Clients cannot specify their critical intelligence needs or questions: The first critical step in theanalysis process requires that the decision maker clearly articulate his or her needs to the analyst.This is frequently easier said than done. Many decision makers have difficulties briefing theiranalysts, struggle with explaining the decision that they are facing, or actually ask for the wrong thing.During the course of a project, the analyst will often uncover information that suggests the initialquestion needs to be modified. Unless the decision maker is fully familiar with the decision they arefacing, they are unlikely to know if this new information has relevance.Under-resourcing the analysis function: Because it is invariably a part of some largerorganizational processes, analysis is typically under-resourced. The lack of resources in the form ofdata, information, databases, systems, people, and most commonly, time, are always mentioned insurveys of analysts. Indeed, time is seen as one of the primary barriers keeping them from being moreeffective in their organizational roles.16 A large element of this problem is that it is difficult for thosemanaging the analysis process to communicate the benefits derived from their activity in the formatthat executives ordinarily use in making their resource allocation decisions. Executives typicallyallocate financial and human resources on the basis of expected return on investment, net presentvalue, or quantitative cost/benefit calculations. Putting a comparative quantitative calculation on thebenefits of analysis has typically eluded most analysis managers and their clients.17
Lack of analysis-specific IT support: Organizations now have a plethora of information systemsavailable for management, control, and planning purposes. Unfortunately, most of these systems arenot designed to support the business and competitive analyst's roles and responsibilities in theirorganizations. Even when companies do employ so-called "intelligence solutions" or systems, these
are mainly focused on facilitating the collection facet of the larger intelligence process rather than theanalysis/synthesis tasks.18
Lack of thinking time: Thinking is a key component in producing analysis. It is rare for analysts toexperience "blinding flashes" of insight19 or to quickly obtain the essential and previously missingpieces of data that helps them arrive at confident conclusions. Instead, analysts spend substantial timethinking about their clients, data, models, networks, projections, targets, and work plans. There aretimes when this thinking just cannot be rushed, despite the perception held by many analysts that theyneed to produce ever more tangible products to more demanding clients.20 This perception sometimesleads analysts to generate a lot of activity at the expense of insight.Organizational culture and politics: In some organizations, the deliverers of "bad" or undesirablenews to decision makers are punished. These punishments can range from admonishments, to thewithdrawal of cooperation or resources, or ultimately, the elimination of the analyst's position.Unfortunately for analysts who find themselves reporting to easily offended decision makers in suchorganizational contexts, there is probably little they can do about it, except to hope for a change inthose who act in this manner. If that behavioral change is not in the offing, analysts will often have tofind more enlightened employing organizations.Time and trust: Analysts and decision makers operate most effectively in an environment of mutual,shared trust. Unfortunately for some participants in the analysis process, trust usually takes some timeto develop. Organizational realities demonstrate that many analysts or their decision makers are not intheir posts long enough to allow for confidence, mutual respect, and trust to develop. In the absence ofan appropriate level of trust, the analyst has to hope that they can develop this asset by carrying outeffective analysis and convincing their clients that they can be relied upon to deliver the goods whenasked.Invisibility and mystery: Although analysis work is increasingly a social and network-oriented task,analysts frequently work in the background of organizations. They are not necessarily on the "frontline" facing customers and can sometimes be invisible to the larger organization. Their work is alsooften part of larger research-related processes, so they are rarely singled out for attention. Analystsare not frequently in the organizational limelight for what they do, except in those cases whereanalysis failure was blamed for organizational mishap. Because an analyst's work and their functionis sometimes viewed as mysterious or intellectually demanding, analysts are generally left to get onwith their task without managerial interference. Unfortunately, this "invisibility and mystery"problem, at times, can be perpetuated by analysts themselves.Misconception that everyone can do analysis: Randomly ask any recent MBA graduate whether theydeveloped good analytical skills in their programs, and the answer you'll nearly always get will be"Yes." Most people do not recognize the differences between the process of analysis and theirordinary ability to think or "connect the dots." By this point in the book, it should go without sayingthat everyday thinking is not analysis, although an individual who does not think clearly cannotperform analysis. Analysis requires a unique and differentiated form of thinking and is encapsulatedin the evolving analysis body of knowledge.Most individuals have neither been formally trained nor have the natural ability to perform therigorous and systematic type of specific thinking tasks that constitute competitive, enterprise, orstrategic analysis as we know it. We know that analytical capability can be improved and enhancedthrough formal training, self-learning, mentoring, and coaching, as well as through regular review andevaluation of analysis processes and products.
External Environment-Level Failures
The external environment within which the organization operates can also be partially responsible forless-effective analysis outcomes. The major environmental factors we see contributing to theseunfavorable outcomes are described next.Growing range of competitive factors: The weapons used by enterprises in market-basedcompetition have become more varied and better developed over time. Competition has historicallyoccurred using the traditional marketing mix tactics along the "7Ps" dimensions of product, price,place, promotion, participants/people, physical evidence, and process.21
Today, competitive weapons can be found outside marketing in places such as the supply chain,human resources management, corporate culture, leadership, information systems, research anddevelopment, finance, operations, and production, among others. The growth of new knowledge,technological advances, and emerging public policies can all play a major factor in determining if anenterprise wins or loses in its marketplace.Complexity and turbulence: Complexity has increased because there are more competitors andstakeholders, interacting in a variety of ways and in greater quantities, to produce more unpredictableand turbulent situations. Turbulence means that the competitive environment is subject to continuousor near continuous change. Emerging concepts such as chaos theory have been applied to the businesscontext in both the popular and scholarly presses.22 This further reinforces the point that theenvironment being analyzed today may well be more dynamic than it was yesterday.Data overload: Because of the virtual explosion of resources that have been unleashed over theWorld Wide Web, the Internet, and in corporate intranets, analysts have more data and informationthan at any other period in history. Analysts commonly view this explosion of information as beingakin to "drinking out of a fire hose." Unfortunately, much of this data is redundant, comes fromdubious sources, is in foreign languages, lacks a paper trail, can be expensive to access, and/or turnsout to be irrelevant to the analysts' concerns. Software engineers are recognizing this problem and arebeginning to develop effective programs to assist organizations in filtering, organizing, andclassifying incoming information into databases that better serve the organization's managementinformation needs. Despite this, most analysts feel that they are drowning in information, yet starvedof knowledge.Globalization: This describes the nature of changes in societies and the world's economy fromdramatically increased trade among different nation-states and increasing levels of socio-culturalexchange and interaction. Despite these sectors being intertwined and the blurring that occursbetween markets, industries, and geographic boundaries, it is useful to distinguish economic,political, and cultural aspects of globalization. Globalization has also driven changes in technology,particularly in the transportation and communications sectors, where it is claimed there exists aglobal village with no recognized borders.Educational deficiencies: Although there has been a natural and healthy evolution in the nature ofBCA offerings available to individuals' intent on a formal education in the processes andcompetencies of analysis, not all educational developments in this area have been positive. Wesuggest that there are a number of prominent factors that have kept the number of offerings frommushrooming,23 including:
1. 1 . Lack of experienced faculty staff—There is a dearth of experienced BCA staff in
universities, colleges, and at the post-secondary level. Consequently, there are few programsoffered in the subject. While being highly practical and of considerable value in a businessmanagement program, the area is not established as a major academic discipline. Few businessor management schools have competitive intelligence or analysis courses, and it is mostly absentamong the top-rated business schools.
2. 2. Scarcity of research—The area of BCA lacks an agreed-upon body of knowledge, core texts,and case studies, all of which are the needed published record that helps professionalize a field.The larger area of competitive intelligence is served by few major journals, has virtually nochaired professorships, has a handful of disparate research centers, and has only a few programsdedicated to its study. A small number of institutions around the globe have the capability tooffer doctoral level training in the field, so new researchers and scholars interested in BCA areproduced only occasionally or drift into the area from an overlapping field.
3. 3. Scope ambiguity—Ongoing struggles have occurred within a few universities about where toput a business or competitive analysis course—in business and management, library andinformation sciences, information systems, journalism, international studies, or militaryscience/studies. Even within a business or management program, there are questions as towhether competitive analysis belongs in marketing, management information systems, orbusiness policy/strategy. If they are asked at all, senior business or management administratorsquestion whether business and competitive analysis or competitive intelligence is a legitimatediscipline, practice, profession, field, or area of study. Nobody has yet produced a definitiveanswer.
4. 4 . Economic trends—Competitive intelligence appeared to be taking off in the 1990s asrepresented by a major growth in membership of the international Society of CompetitiveIntelligence Professionals (SCIP—www.scip.org). Since then, even this organization hasexperienced occasional periods of declining numbers. Similarly, past studies have demonstrateddeclines in the area during recessionary periods, when organizations reduce staff numbers ofwhat they deem less-essential functions. Paradoxically, those working in analysis know that thisis precisely the time when investment in such activity should increase, in order to better preparethe firm for the challenges ahead.
Despite the difficulties encountered in competitive analysis and intelligence gaining acceptancewithin the university context, CI and BCA education have had some positive developments,particularly in the offerings developed by consultancies and individuals. Fortunately, courses inbusiness and competitive analysis can be found in most parts of the globe if individuals know whereto look.
Overcoming the Barriers and Improving Analysis Performance
Besides employing simple and straightforward lists like Fleisher and Bensoussan's 10Commandments for Business and Competitive Analysis described in Chapter 2 of this book, there area number of additional things that can be done. To improve the performance and quality of BCAperformed in contemporary enterprises, we recognize the following will help.

Provide Empowerment
Intelligence produced by effective analysis should be and is empowering to decision makers. Apopular saying in the intelligence community is, "Without intelligence, a decision maker cannot takeresponsibility. With it, he or she cannot avoid taking responsibility." Clearly, the more that decisionmakers are equipped with insight, the better they will perform. This is why the importance ofintelligence analysis needs to be recognized in its own right. Both analysts and executives need topromote the reality and truth that analysis is critical to an organization's competitive market success.Analysts and their clients should be comfortable with and publicize to others, that real benefit whichemanates from analysis, that it is an evolving discipline in its own right, and that analysts areprofessionals in exactly the same way as others in the organization.
Realize the Value of Analysis
Even if the benefits and value of the process cannot be easily quantified by existing performancemeasurement systems, executives need to realize that effective analysis cannot be achieved through"quick fixes" or by the introduction of new software or hardware applications. The value of analysiscomes from the insight it provides decision makers, which ultimately benefits their enterprise. Whendone well, analysis will become recognized implicitly, if not explicitly by decision makers for thevalue it provides.
Value the Link Between Analysis and Success
Providing managers with case studies and examples of good and bad analytical outputs can helppowerfully demonstrate this relationship between analysis quality and decision-making effectiveness.Using analysis insights will significantly lower the number of controllable or perceived risksassociated with decisions.
Ask the Right Questions
Consumers of analysis products must also be educated to know what to ask for from analysts andhelped to understand what they can expect to receive. Executives and departmental managers, likemany other employees within the organization, often misunderstand the true functions and properoperations of analysts or intelligence specialists. Decision makers will often ask for the wronginformation and will then have difficulty in making sense of the analytical products they receive.What matters to executives is "fact-based intelligence that makes a difference to their agendas,priorities, and needs as they perceive them," criteria that are important at the planning and directingphase of the decision-making process.24 For intelligence to be useful and effective, managers shouldask for and expect the items shown in the following list (adapted from Self [2003]). In general,analysts must provide products that are tailored not only to decision makers' specific information

requirements but also presented or disseminated in their "language" and conform to their uniqueframes of reference.25
Products that resolve their critical intelligence needs, questions, or topics.Analysis that utilizes the full and comprehensive range of available data within specified(budget, ethics, time, etc.) constraints.Analyzed data, information, and conclusions, not trivia or so-called "nice to knows."Timely delivery of products well in advance of the decision to which the analysis was targeted.Analysis findings that can play a central and vital role in their decision-making process.Conclusions that can enhance the positive effects of a chosen strategy or that can be used todiminish the adverse effects of competitor's actions.Recommendations that will enable the decision maker to make better decisions or more effectiveimplementation of a chosen strategy or course of action.Logical, reasonable, and defensible support and explanations for why certain phenomena willoccur and what future contingencies may arise.Feedback and post-mortems to improve future product quality.
Develop Recognized Analysis Training
Universities, employers, professional associations, and CI educators must develop dedicated coursesand programs on analysis, not just the larger or broader CI process.26
These courses should include, at a minimum, the following items:
Coverage of the techniques and methods of strategic, business, and competitive analysis.27
Opportunities to practice performing analysis through case studies or supervised "on the job"experience.Processes to be used by analysts for helping their clients to clarify and articulate their KITs.Coverage of a range of philosophies and thinking styles such as those that would be gainedthrough exposure to the basic tenets of epistemological science.Communication processes to deliver analytical outputs to the client.Exposure to methods of understanding the research on analytical failure, the pitfalls of analysis,and its associated psychological, social, and cognitive origins.
Courses can and arguably should be offered both in classrooms and through electronic and self-pacedlearning formats. Some courses should be designed to reinforce existing knowledge about the analysisprocess, while others should be designed to impart knowledge of newly emerged processes, tools,and techniques as they develop. Analysts should be encouraged to take these courses on a regularbasis and be given incentives and recognitions for successfully upgrading their capabilities andknowledge.
Measure Performance Appropriately

The competencies, skills, and capabilities of an analyst can be measured, and what can be measuredcan be both managed and improved. The development of capability measurement tools and metrics todemonstrate improvement should be strongly encouraged. There is also a need to measure analysisproducts and processes against benchmarks. Best practices in the analytic field need to be identifiedand emulated.
Position the Analyst Correctly
Executives must place analysts in organizational positions where they can make a genuine differenceand are secure. Analysts need to be actively involved in the networks of information collectors andtheir clients, but also be given the time needed to properly do their work. Also the longer that analystscan focus their efforts on particular specialties needed by the decision makers, the quicker they willmove up the learning curve in terms of producing quality outputs.As even the most effective analysts can provide inaccurate insight at times, decision-making clientsneed to give their analysts opportunities to fail and to demonstrate that they have learned from theseundesirable experiences. This opportunity leads to the development of shared trust between an analystand a decision maker. With security and the trust of their clients, analysts are at their most effective.
Provide the Right Tools
Enterprises need to provide analysts with the proper tools of their craft: analytic applications, properdata inputs, access to sources, time to think, advanced information and communication infrastructure,and so on. Analysts cannot be expected to provide insight without having access to rich sources ofdata, enabling technology, the open door of their organizational colleagues, and clearly articulatedKITs/KIQs. The outputs must be focused to capture the client's imagination and provide assistance oncomplex issues quickly, yet in a comprehensive way. The analyst's job must not be to intimidateclients with information, but rather to entice them with it.
Differentiate the Task
Last but certainly not least, business and competitive analysts must differentiate the nature of analysisthey perform from other forms of analysis concurrently being done within their enterprises. Businessand competitive analysts and their decision-making clients should be careful not to overrate oroveremphasize the analysis of organizations, industries, and markets that is provided by economists,financial analysts, or marketing researchers/analysts. These individuals are primarily concerned withshort-term financial gains, customer satisfaction, product placement, and related concerns, notnecessarily with long-term competitiveness and effective business or corporate strategy development.Executives who understand the reasons these functions vary and the respective benefits eachgenerates will be far better served in their decision making.
Summary
Analysis is a critical component in aiding executives in their decision making. This chapter hasidentified much of what is wrong with analysis today, but it also suggests that there is much more thatcan be done to improve analysis. These problems can be fixed, although it will require the efforts ofmany stakeholders and institutions, some of which have been reluctant to-date to changing in themanner we have identified.CI scholar Ben Gilad notes that intelligence is an insight about externally motivated change and futuredevelopments and their implications to the organization. Done well, analysis and the intelligencedeveloped from it helps the organization to reduce its risk level in dealing with both threats andopportunities that exist outside. The absence of effective analysis will produce little insight tounderlying key decisions. Without a good analysis capability, an enterprise is increasingly vulnerableto attack and will miss profitable opportunities in the dynamic, globalized, world economy of today.
References
Bazerman, M.H. (2002). Judgment in Managerial Decision Making, 5th edition. Hoboken, NJ: JohnWiley & Sons.Bernhardt, D. (1999). "Consumer versus producer: Overcoming the disconnect between managementand competitive intelligence," Competitive Intelligence Review, 10(1), pp. 19–26.Cohen, A. (1998). "The misuse of competitive intelligence," Sales and Marketing Management,150(3), 13.Edmonson, A., and M. Cannon (2005). "Failing to learn and learning to fail (intelligently): How greatorganizations put failure to work to improve and innovate," Long Range Planning Journal, 38(3),June.Feldman, M.S., and J.G. March (1981). "Information in organizations as signal and symbol,"Administrative Science Quarterly, 26(2), pp.171–186.Fleisher, C.S. (2004). "Competitive intelligence education: Competencies, sources, and trends,"Information Management Journal, 2004, 38(2), pp. 56–63.Fleisher, C.S., and B. Bensoussan (2003a). Strategic and Competitive Analysis: Methods andTechniques for Analyzing Business Competition. Upper Saddle River, NJ: Prentice Hall.Fleisher, C.S., and B. Bensoussan (2003b). "Why is analysis performed so poorly and what can bedone about it?," pp. 110–122 in Fleisher, C., and D. Blenkhorn [eds.], Controversies in CompetitiveIntelligence: The Enduring Issues. Westport, CT: Praeger Publishers.Fleisher, C.S., and D.L. Blenkhorn (2001). "Effective approaches to assessing competitiveintelligence," pp. 110–123 in Fleisher, C.S. and D.L. Blenkhorn [eds.], Managing Frontiers inCompetitive Intelligence. Westport, CT: Quorum Books.Fuld, L.M. (2001). "Intelligence software: Reality or still virtual reality?," Competitive IntelligenceMagazine, 4(2), pp. 22–27.Gib, A., and R. Gooding (1998). "CI tool time: What's missing from your toolbag?," pp. 25–39 in theProceedings of the 1998 international conference of the Society of Competitive IntelligenceProfessionals, Chicago, IL.

Gilad, B. (1994). Business Blindspots: Replacing Your Company's Entrenched and OutdatedMyths, Beliefs, and Assumptions with the Realities of Today's Markets. Chicago: Probus.Gladwell, M. (2000). The Tipping Point: How Little Things Can Make a Big Difference. Boston,MA: Little Brown.Heuer Jr., J.R. (1999). The Psychology of Intelligence Analysis. Washington, DC: Center for theStudy of Intelligence.Johnston, R. (2005). Analytic Culture in the U.S. Intelligence Community. Washington, DC: TheCenter for the Study of Intelligence.Kahneman, D., Slovic, P., and A. Tversky (1982). Judgment under Uncertainty: Heuristics andBiases. Cambridge, UK: Cambridge University Press.Kalat, J.W. (1998). Biological Psychology, sixth edition. Pacific Grove: Brooks/Cole Publishing Co.Kiel, L.D., and E.W. Elliott (1997). Chaos Theory in the Social Sciences: Foundations andApplications. Ann Arbor, MI: University of Michigan Press.Marteniuk, J. (2003). "How do companies find the best balance between the technical and personal ineffective competitive intelligence systems?," pp. 176–189 in Fleisher, C., and D. Blenkhorn [eds.],Controversies in Competitive Intelligence: The Enduring Issues. Westport, CT: Praeger Publishers.McGonagle, J.J., and C.M. Vella (2003). The Manager's Guide to Competitive Intelligence.Greenwich, CT: Praeger Books.Miller, G.A. (1956). "The magical number seven, plus or minus two: Some limits on our capacity forprocessing information," Psychological Review, 63, pp. 81–97.Nikkel, P. (2003). "How can we determine which competitive intelligence software is mosteffective?," pp. 163–175 in Fleisher, C., and D. Blenkhorn [eds.], Controversies in CompetitiveIntelligence: The Enduring Issues. Westport, CT: Praeger Publishers.Rafiq, M., and P.K. Ahmed (1995). "Using the 7Ps as a generic marketing mix," MarketingIntelligence & Planning, 13(9), pp. 4–15.Rigby, D.K. (2003). Management Tools 2003. White Paper. Boston, MA: Bain & Company, Inc.Rigby, D.K. (2001). "Putting the tools to the test: Senior executives rate 25 top management tools,"Strategy & Leadership, 29(3), pp. 4–12.Sawyer, D.C. (1999). Getting It Right—Avoiding the High Cost of Wrong Decision. Boca Raton,FL: St. Lucie Press.Self, K. (2003). "Why do so many firms fail at competitive intelligence?," pp. 190–202 in Fleisher,C., and D. Blenkhorn [eds.], Controversies in Competitive Intelligence: The Enduring Issues.Westport, CT: Praeger Publishers.Tversky, A., and D. Kahneman (1986). "Rational choice and the framing of decisions," Journal ofBusiness, 59, pp. 251–294.Waldrop, M. (1992). Complexity: The Emerging Science at the Edge of Order and Chaos. NewYork, NY: Touchstone.Watson, J., and J. Everett (1996). "Do small businesses have high failure rates?," Journal of SmallBusiness Management, 34(4), pp. 45–62, October.Windle, G. (2003). "How can competitive intelligence practitioners avoid over-relying on theInternet," pp. 85–97 in Fleisher, C., and D. Blenkhorn [eds.], Controversies in CompetitiveIntelligence: The Enduring Issues. Westport, CT: Praeger Publishers.
Endnotes
1 Johnston, 2005.2 Edmonson and Cannon, 2005.3 Watson and Everett, 1996.4 Fleisher and Blenkhorn, 2001.5 Fleisher and Bensoussan, 2003b.6 Kalat, 1998.7 Bazerman, 2002; Kahneman et al, 1982; Sawyer, 1999; Tversky and Kahneman, 1986.8 Fleisher and Bensoussan, 2003b; Gib and Gooding, 1998; Rigby, 2001; Rigby, 2003.9 Fleisher and Bensoussan, 2003b.10 McGonagle & Vella, 2003.11 Nikkel, 2003.12 Windle, 2003.13 Marteniuk, 2003.14 Cohen, 1998.15 Cohen, 1998.16 Johnston, 2005.17 Fleisher and Blenkhorn, 2001.18 Nikkel, 2003; Fuld, 2001.19 Achieving the elusive "a-ha" findings is sometimes known as the process of "abduction" in analysiscircles.20 Johnston, 2005.21 Rafiq and Ahmed, 1995.22 Gladwell, 2000; Kiel and Elliott, 1997; Waldrop, 1992.23 Fleisher, 2004.24 Bernhardt, 1999.25 Bernhardt, 1999.26 Fleisher, 2004.27 Fleisher, 2004.

4Communicating Analysis Results
One of the most difficult challenges facing analysts in organizations is effectively communicating theresults of their work on a timely basis to their decision makers. This is important because analysisoften underlies decisions, and decision makers cannot always wait for the analyst to complete theirwork. Also many of the decisions that are made about competitive business matters rely on datainputs that have a short shelf life. In other words, the intelligence generated about competitive actionsis only useful to the enterprise for a short time period before it becomes out of date, at which point, itno longer has the ability to deliver competitive advantage. Analysts must place considerable attentionon delivering their findings to, and gaining the attention, understanding, confidence, and ultimatelytrust, of their decision makers. Presenting results to decision-making clients is one of the vulnerableareas where intelligence and other strategy-related processes can fail.
The Art of Effective Communication
Individuals new to the field or those who remain ignorant of the art and science of communicationwill do their best to avoid the challenge of this element of the analyst's task. It is important to realizethat the analyst's job is not over when the formal analysis process itself is concluded. Delivery of thefindings to the decision makers, gauging their understanding of the analyst's recommendations, makingsure that no critical intelligence was lost in the exchange of ideas, and understanding how the analysisproduct will be used are among the analyst's key communication task responsibilities. Failures inthese final stages of the analysis process can devalue the analyst's work and can ultimately be a primecontributor to bad decisions and inappropriate actions taken by an enterprise in the marketplace.Additionally, the communication stage is a vital feedback mechanism for the analyst to understandhow well he has done the job in hand. It also provides pointers on how he might improve hisperformance on the next one.Within each enterprise, there will be established procedures for communicating with decision-makingclients, writing a report, and presenting results. Many of these are generic across business ormanagement professions, while others will be more specific to an enterprise and its particularculture. A major responsibility of analysts is to learn these procedures, particularly those associatedwith demonstrated and proven communication performance, and to pay close attention to them whencommunicating their own findings and insights.A common theme regarding the relationship between communication and audience satisfaction is thatthe more confidence that the audience (decision maker) has in the ability of the communicator(analyst), then the more satisfied they are likely to be with what is being communicated (analysisproduct). Distortion, ambiguity, and incongruence in communication can all act to increase a decisionmaker's discomfort or uncertainty. Analysts who are able to lessen the amount of distortion in theircommunication will reduce their client's levels of discomfort and uncertainty, and ceteris paribus,achieve higher levels of satisfaction, and receive better feedback. These communication results areall beneficial in achieving successful analytical outcomes over time.We want to state, for the record, that you will have difficulty becoming an effective analyst in an

enterprise unless you demonstrate effective communication skills, knowledge, and abilities.Resources spent in supporting analysis efforts are wasted if the analyst's recommendations are notused. This is even more serious if the reason for non- or misuse is that the decision makers did notunderstand what was being provided to them, that the conclusions were not clear, or that the analysisproduct was delivered in an incomprehensible or inappropriate manner. Ineffective communication ofresults will negate what might otherwise have been outstanding work in all the other phases of theanalysis process.Over the past 20 years or more, the form in which competitive analysis is delivered has beendramatically altered. In the 1980s, most analysts' outputs were communicated through eitheroccasional written reports, regularly written reports, and in a passive manner by making the contentsof files available in a centralized location or database on an as-needed basis to decision makers.1Today, more active and regular delivery of results occurs through reporting, presenting, and pushingreports through electronic means to users.2 What used to be contained in manila folders in large filingcabinets has now been shifted over to internal electronic databases or custom-developed intranetportals. Intranets have become a common means for communicating intelligence in most largeorganizations.
Packaging the Results of Your Analysis
How intelligence is presented and packaged affects the client's perception of its validity.3 One thingthe analyst must always consider is the need to inform versus the need to protect critical informationfrom being shared beyond the persons for whom it was originally intended. Some analysis results aredelivered through automated electronic means, while others are offered in face-to-face group settingsor in-person. Regardless of the manner in which the analysis product is delivered to decision makers,the analyst must also address trade-offs between depth, breadth, speed, security, and convenience.Similar to most forms of communication, analysts must always consider how each output format islikely to create the conditions necessary to influence the client of the importance of their insights.Analysts must also be cognizant of their own predisposition to particular formats. Properly factoringin these two considerations on the analyst and decision maker's communication preferences and takingaccount of these before communication takes place will strengthen the likelihood that the client willaccept their recommendations.Analysts who develop recognized levels of communication effectiveness are more likely to presentresults that
are future-oriented with detailed predictions of the evolution of the phenomena of interest.contain well-articulated conclusions that are developed through comprehensive research andlogical reasoning.include clear explanations of subjects that go beyond the reasonable technical grasp of theirdecision-making clients.4

Delivering the Message
By what methods does the analyst deliver these results? It should be reiterated here that the method(s)used should be mainly based on the decision maker's needs.5 That premise does suggest, though, thatthe decision makers actually know what they need to know, and as previously mentioned in this book,that is not always the case. It is in these situations that the analyst has an even greater responsibility,not only to meet the decision maker's perceived needs, but to produce a back-up set of additionalanalysis product, recommendations, and/or communication channels. This added-value back-up set iswhere the analyst's communication skills, knowledge, and abilities become highly visible as it willaddress what the decision maker might have asked for, if only they had known what to ask for. It is inthis role that the analyst acts more proactively, as a subject expert or an internal consultant, ratherthan as a reactive employee simply completing a task. At the end of every reporting event, thedecision maker should always ask three questions of the analyst:
"Is there anything else I should have asked you to do?""Is there anything else you think you should have done?""Is there anything else you want to tell me?"
The appropriate communication packaging of analytical outputs is essential. Analysts typicallyprovide their outputs to decision-making clients in the following forms.6
Face-to-Face Briefings
One of the most effective two-way models of communication, face-to-face briefings allow the analystto physically and orally present their findings to a client. This not only encourages discussion andexchange of understanding to take place in real-time, but it minimizes second-hand distortion or theeffects that a time lag can have on the acquired understanding.
Written Reports and Briefings
Printed outputs are a cost-effective way of distributing results. Some executives still prefer to readitems from the printed page rather than from a screen, particularly if a screen is not readily availableor inconvenient (i.e., the decision maker is traveling on an airplane or his e-mail networks are noteasily accessible). A problem with this form of communication is that there are many more pages ofmaterials printed than are ever read, and much of the information that is read is not fully understoodby its readers. It is not unknown, quite common even, for the readers of paper-based intelligencereports to be overlooked. Additionally, the report itself has the potential to fall into the hands of anunintended audience and can create undesirable vulnerabilities.
Presentations in Meetings, Seminars, and Workshops
These are a very effective way to deliver results to a group of decision makers and are a good way ofgaining a group's attention. The main advantage in this format is that it provides opportunities for theanalysts to discuss their findings in real-time, not only with those who may have initiated the task inthe first place, but also more importantly with those individuals to whom it was designed to inform. Itis important that the appropriate decision makers are available to observe and interact with thepresenter, and this scheduling aspect is often an overlooked part of the analysis communicationprocess.One criticism of this method is that many times, analysts prepare PowerPoint slide decks whereby theaesthetics of their slides, the fanciness of their presentations, or the structure of their slideorganization overpowers the important content or message, which then gets lost or missed because ofthe high reliance on the presenting technology.7 Analysts need to be wary of spending too much timethinking about how snazzily they can present reports, at the expense of worrying about the robustnessof content.Seminars and workshops are two other forms of presentation-based communication. They can allowthe analysts to present their ideas more formally while still allowing for the collective benefits ofquality question and answer time. This encourages discussion among the collected group ofexecutives in an audience and aids the exploration of solutions to competitive and strategic problems.
E-Mail/Instant Messaging
Digital communication is probably the most commonly used means for analysts to communicate withtheir decision-making clients. The major benefit of this format is the almost immediate attention andquick replies. E-mail and instant messaging are good ways to disseminate "alerts," regularlypublished newsletters, and other forms of analytical results that need to be acted upon in a quickmanner. A drawback of this form of communication is that it makes it difficult to communicate the"richness" of the recommendation context and can limit the format of the results to mostly, if notentirely, text.
Intelligence Systems
Customized systems offered by specialized competitive intelligence vendors, or systems tailored foranalytical use within the larger corporate communication system, are becoming more commonplace.These allow analysts' clients to either see their findings in refined and finished formats, which caninclude digital links to other materials, and/or in their original input such as documents, interviewnotes, articles, and so forth. Such systems nearly always allow for selective access and viewing byclients on a need-to-know basis, or they can be designed to send out various forms of information inthe form of e-mails, instant messages, or fax to a selected numbers of recipients. The drawback tothese systems is that they can be cumbersome, costly, complex, and do not always allow for two-waycommunication to take place.
Exercises and Planning Sessions
Many analytical tools require two-way interaction between analysts and their decision-makingclients. Some of the tools in this book are best practiced in this way, including techniques such as wargaming (see Chapter 23, "War Gaming"), scenario analysis,8 or shadowing (see Chapter 13,"Shadowing"). These frequently involve the analyst or designated individuals playing the role of oneor more competitors. These techniques require a vast amount of data before anything is attempted andcan be conducted in a one-off session, over an extended period of time in a person-to-person format,or can be conducted in teams in tightly planned and scheduled sessions aided by expert facilitators.9
Common Products and Reports Used by Analysts
Analysts ordinarily generate outputs in a variety of forms for use by their decision-making clients.Each of these has a typical audience, for which they are designed, are produced on a particularfrequency, and are viewed to hold a certain level of perceived value in the eyes of the reportrecipients. They should always be tailored for the known and unique needs of the decision makers.The most common types of analyst reports are given next and are discussed in greater detail withrespect to their relative advantages and disadvantages.
News Bulletins and Newsletters
Targeted most frequently to field sales personnel, marketing, managers, sales managers, or otherdecision makers, these analysis outputs contain largely tactical and/or operational information andutilize data gathered from all sources. They can include both publicly available and internallyavailable information. They frequently focus on current or immediate past events. They are rarelyoriented toward the future.Newsletters are typically of lower strategic value relative to other types of outputs.10 Although theseitems may be seen as less valuable than other products in a comparative sense, their cumulative valuecan be higher and strategic in nature. This can be especially true if they raise the level of competitiveawareness over time in the enterprise. When done well, newsletters and news bulletins can becatalysts for not only conversations and discussions between analysts, analyst groups, and theirclients, but encourage new questions to be asked of the analyst group. One way of achieving thiscatalyzing effect is to ensure that newsletters do indeed include analysts' interpretations and insight,along with the informative "news" aspects of the bulletins.11
Assessments
These are fairly brief and regularly generated products that look at particular business decisions,providing an assessment of the current situation facing the decision maker, identifying the critical

success factors associated with the situation, and suggesting likely outcomes in terms of probabilities.The content can range from a very general overview of broad issues to detailed answers to highlyspecific questions.
Competitor Profiles
Competitor profiles are produced as needed but are constantly updated and contain generalinformation about the enterprise's competitors in the marketplace. They are valuable for field salespersonnel, marketing, and sales managers, as well as other functional decision makers who not onlybenefit from their existence, but contribute to their augmentation and evolution. Seldom actionable intheir own right, they are of lower strategic value relative to other types of analytic outputs, but can becombined with other types of outputs that have higher overall decision-making value.Done well, competitor profiling is carried out at many different layers of the enterprise, addressingthe competitive landscape and associated activities right across the value chain. Passive competitorprofiles are simple historical commentaries, compiled from publicly available documents and assuch, carry little or no analytical value or originality. Active competitor profiles are future driven,contain identification and assessments of critical success factors, deconstruction of publishedfinancial reports, qualitative and quantitative judgments on current/future capabilities, probabilitiesof competitor action taking place, and recommendations on how best to react to each and every oneshould it occur.
Strategic Impact Worksheets
Strategic impact worksheets are closely related to competitor profiles and are used to identifyspecific events that may potentially impact the enterprise. They are usually targeted at thoseindividuals in the enterprise who will be most affected by the events, possibly including StrategicBusiness Unit or functional managers. Ordinarily issued on a regular basis, they are usually ofmoderate value to decision makers. However, if the analyst uses these with competitor profiles todevelop an early-warning system, then they can take on increased value. Anything that helps theorganization to avoid being surprised by competitor action, market shifts, or hitherto unforeseenevents, can only be of great value.
Intelligence Briefings
Usually issued on a regular basis, in a highly condensed manner, these are reports to senior and othermanagers about strategic news. They are rarely used to address specific issues, but they do ensurethat all concerned are kept as "aware" as possible of the shifting competitive landscape.Intelligence briefings are increasingly offered electronically in broadcast formats over secureintranets, in webinar formats, or via secure video-teleconferencing facilities. They are typically ofmoderate value to the analyst's clients.
Situation Analysis
These are one of the more unique products produced by analysts on an as-needed or as-requestedbasis for key decision makers. The situation analysis report summarizes emerging and rising strategicissues. They usually provide background in the form of the detailed thinking and synthesis actuallyperformed to generate the recommendations. Relative to other products, their shelf lives are short.
Special Intelligence Summaries
Special intelligence summaries are usually brief in length, not much more than one or two pages, andmost frequently generated on an as-requested basis. They identify situations, summarize the keysupporting analyses, and offer recommendations on desired actions to senior decision makers. Theyare among the most valuable outputs regularly generated by analysts and are often the most visibleinfluencers of an enterprise's decisions.
Creating the Report
When creating reports, analysts should emphasize the following items:12
Strategic versus tactical or operational informationDecision-oriented informationInclusion of only relevant supporting dataDistribution of reports to clients on a timely, need-to-know basisMultiple reports versus one large report for lower to middle levels of management
Analysts can enhance their decision makers' receptivity by using a variety of analysis outputs.M. Dugal developed the idea of an analyst's portfolio, which comprised 10 key products. Each ofthese "products" differ in terms of shelf life, intended audience, processes used to generate them,sources underlying their development, analytical tools most commonly applied to generating them,their modes of dissemination, and the resources required to produce them.
1. 1 . Current Intelligence provides clients with the first identification of developments in theorganization's competitive arena. This is typically light on analytical manipulation and, in caseswhere it is warranted, will later be assessed more thoroughly.
2. 2. Basic Intelligence reports on analytical research that provides the up-to-date, systematic factsand understanding about the organization's environment, industry, and competitors.
3. 3 . Technical Intelligence helps the decision maker understand developments in both thescientific and technical areas that affect, or may potentially impact, their organization'scompetitive environment.

4. 4. Early Warning Intelligence provides advanced warning of potential marketplace disruptionsand environmental opportunities and threats.
5. 5 . Estimated Intelligence provides forecasts, scenarios, and likely developments relative tocompetitor's products, markets, customers, processes, and/or industry composition.
6. 6. Work Group Intelligence is used in support of internal projects and teams especially thoserelative to possible merger and acquisition candidates, patent purchases, or acquisition ofspecialist expertise.
7. 7. Targeted Intelligence offers one-time intelligence that targets narrow, specific, and focusedneeds of an intelligence client.
8. 8. Crisis Intelligence is designed to assist the organization in managing its way through crisisevents.
9. 9. Foreign Intelligence focuses on competitors, industries, and companies that operate outsidethe nation-state domicile of the organization.
10. 10. Counterintelligence assists the organization in addressing the intelligence threats posed bycompetitors.
Communication Difficulties Faced by Analysts
Despite the increased use of technology in communication between analysts and their decision-making clients,13 the analyst's communication of their findings continues to be a trouble spot fordecision support. Why is the effective communication of analysis results so difficult?In our experiences, and through observation and surveys of hundreds of business and competitiveanalysts, their work context, and their organizations, we have identified a number of reasons that canbe frequently associated with lower levels of analytical effectiveness.Although we were tempted to prioritize these items, either by the frequency in which they occur or bytheir relative importance to the analysis process, we do not have access to systematic research in thisfield that would allow us to achieve this. We think that further examination and research of thesereasons is warranted, and we usually suggest to managers that they audit their own operations toassess the prevalence of these problems in their context. In no particular order, we have observed thatmost analysts
Don't understand or think through basic communication transmission models that impact theirdaily work.A basic model developed by C.E. Shannon and W. Weaver looked like this:Figure 4.1 Communication transmission model
Shannon and Weaver argued that there were three levels of problems in communication:1. 1. The technical problem: How accurately can the message be transmitted?2. 2. The semantic problem: How precisely is the meaning "conveyed"?3. 3. The effectiveness problem: How effectively does the received meaning affect behavior?

Subsequent research in human communication, most notably by Harold Lasswell,14 was closelyallied to behaviorist approaches, and this resulted in a verbal version of the former Source-Message-Channel-Receiver transmission model that essentially asked, "Who says what in whichchannel to whom with what effect?" Most analysts do not ask these questions of theircommunication products, and because of this, often misfire on achieving their aims of influencingthe decision maker.Although these models are far too simplistic to accurately reflect communication reality intoday's complex world, having a communication model in mind such as these, at least providesan initial basis from which to think through the communication challenge. A widely knownnotion in physics that analysts should know about suggests that chaos or randomness alwaysincreases with time. This results in communication being increasingly distorted the more times itis passed along and through a channel. It would be seen as added noise or complexity and canoccur at any stage or at multiple stages of the analysis process.Have not received training and development in becoming effective communicators.You cannot be an analyst and be a poor communicator, and you cannot be a successful analystunless you are also an effective communicator. Unfortunately, reporting and presentation skillsare not a focus of most business professionals' formal education or training.15 Yes, companieswill send graduate trainees on an "Introduction to Public Speaking" or "How to UsePowerPoint" type training course in their first year of employment, and in that respect, they canbe useful. Functional managers and analysts at all other levels are generally assumed to haveattained highly developed communication skills through some form of osmosis. The evidencecontradicts this. Good analysts and good managers can sometimes be spectacularly bad atmaking presentations and delivering information, so much so, that the audience feels distinctlyembarrassed and uncomfortable at their performance. This does not assist in the communicationprocess and is an element that is entirely correctable.Analysts use communication skills to negotiate with their clients for choices, time to decide,time to act, understanding, and to agree on how each can help to achieve better decisions.Analysts actually accomplish their jobs indirectly through the communication that is exchangedbetween the analyst and their clients.What is important for the analyst to know is that communication can be exercised and improved.It can be broken down into its component parts and practiced. Analysts also need to know howand when to keep quiet. This is a highly developed talent used during information acquisitionand most effectively by skilled negotiators.Far from being seen as a one-off introductory type course for newcomers, advancedcommunication skills training should be a mandatory and ongoing requirement for all employees.Communication is a complex business, and it really is much more than talking.Rely upon the communication techniques that they are experienced and comfortable with, notnecessarily those that are appropriate for a particular client and/or situation.Analysts, who were trained to write reports in their earlier career responsibilities, willordinarily continue to write them until someone suggests they stop. It is human nature for theanalyst to fall back on what they know, but often what they need to know can be far more vital tothem in achieving successful outcomes. This will require many analysts to undergo additionaltraining, to learn new skills, to practice them, and to continuously develop their capabilities.Much of this will require an organizational and personal investment in time and money but will

typically reap rewards in the form of more appropriate and effective delivery of the analysisproduct.Many professionals, such as surgeons, pilots, engineers, and scientists, embrace the philosophythat they will never know all there is to know about their jobs. They also recognize that newdevelopments are occurring every day. As such, they are legally required to learn about theseand demonstrate their continued competence in order to remain employable. While notsuggesting that this should be the case for analysts and their decision makers, it is perhaps a littlestrange that those involved in vital decisions about the future of an enterprise should be deemedas the "finished product" from day one in their job.Have not learned to pick up "silent cues" in communication.Most analysts rely far too heavily on written data and information and discount or downplayother forms of inputs, including conversations, observations, and behavioral cues. This can be acritical skill for analysts since they need not only to communicate with the eventual recipients oftheir work, but also the gatherers of the data and information they are using. Much of this workwill require the analyst to make judgments about the credibility of sources, the clarity of thegathered data, and/or the possible motivations of those involved. Better analysts will use notonly the so-called obvious, published cues to conduct their work, but will also be cognizant ofthe informal, behavioral cues that are given off by individuals during communication.Lack a clear understanding of their client's (or sometimes their own) expectations andrequirements.Many analysts operate with a fuzzy understanding of how their clients will use their outputs andrecommendations. A major problem is that many analysts work without an organized KIT/KIQprocess and fail to do systematic debriefs and assessments with their decision makers.16 If theanalyst does not recognize when and why a client is dissatisfied with their work, they will havedifficulties in identifying the means by which to improve it.One means for avoiding this problem is to utilize the previously discussed KIT/KIQ process,supplemented by a "statement of work." D.S. Mockus has suggested that a statement of workshould encompass, at a minimum, the following elements:
Prioritized list of deliverablesPrimary contact and distribution listAnticipated timeframe of final reportFormat of final results
1. i. Written (paper copy, digital, e-mail, instant message)2. ii. Verbal (face to face, over the phone, in meeting format)
Anticipated frequency of status reports/updatesFormat of status reports/updates
1. i. Written (hard copy, digital, e-mail)2. ii. Verbal (in person, over the phone)
Anticipated audience (titles, positions)
Analysts also need to understand their own communication styles, tendencies, and biases. Forexample, many analysts will filter the results of their analyses by manipulating information inways that they perceive it will be seen more favorably by the receiver. For analysts who havenot rigorously determined their client's needs or requirements, this is likely to get them intotrouble. The client may realize what has happened, and as a consequence, not believe, or trust,
the recommendations offered.Because intelligence is communicated via language, analysts need to recognize how importanttheir choice of words, visuals, or voice will be, particularly if their decision-making clients arefrom different nationalities, cultures, genders, or experiential backgrounds. Words meandifferent things to different people. Cultural or social nuances need to be known and properlyaddressed. To one analyst's client, a "threat" may mean something imminent and urgent, while toanother it may be viewed as something that is long-term, long distance, and unlikely to beproblematic.Do not develop a plan or strategy for communication or think through the choice ofcommunication vehicles with the same level of rigor that they may think through the choice ofanalytical tools and techniques.In far too many enterprises that we have advised, communication is treated as an afterthought.Strangely enough, executives frequently point to the communication process as being bothimportant and yet a frequent source of organizational difficulties or failures. These facts point tothe importance for analysts to consider communication as rigorously as they would any other keyfacet of their work. A facilitator of this is the development of communication plans andcommunication audits/reviews on a regular basis. These can then be linked to the overallstrategic plan, group's analysis plans, or individuals' project plans.Just like the analysis techniques we describe in this book, communication vehicles or modes allhave different attributes. It is imperative that analysts think these matters through early in theprocess so that they can integrate the development of the final products into the intended deliverymethod. Communication, like most of the rest of the processes described in this book, can andshould be planned, managed, measured, and improved.Do not make their recommendations "actionable."By "actionable," the analyst's recommendations must relate directly and obviously to theKIT/KIQ of the decision maker, the enterprise's relevant strategic, tactical, and/or operationalplans, as well as the decision-making process itself. Actionable means that the analyst has maderecommendations that walk the client through not only the decision itself but the likelyorganizational and competitive manifestations (i.e., contingencies) that would occur as a resultof it being acted upon. Last but not least, actionable analysis usually includes an implementationplan, which can be scoped out in the form of a timeline, GANTT chart, project plan, or the like.Need to develop the synthesis skills to take volumes of complex data and information andconvert them into brief and easy-to-understand outputs.A common reason many analysts fail is that they do not know how to summarize their thoughtsand communicate them succinctly. One reason this occurs is that analysts may lack a deepunderstanding of the analytical techniques they are using. This book is intended to help put thatsituation right. Many decision makers have neither the time, patience, or desire to read throughlengthy tomes or book-length backgrounders about a topic. This is one reason why we think the"Occam's Razor" rule17 should always be applied to communication. This suggests that theanalyst should communicate using the simplest and most parsimonious explanation that can fit thefacts. All else being equal, it is better to communicate findings using simple and shorter formatsas opposed to longer and more complex ways.Another related communication error made by analysts is not "cutting to the chase" or knowinghow to differentiate between the "must have" and the "nice to have" intelligence. As one expertin the competitive intelligence field stated, "effective analysts learn not to summarize but
rather to synthesize."18 It is far too easy to produce volume, whereas synthesizing analyticalfindings down to their essential core messages is a skill that will always be valued by today'sharried decision makers.Have not thoroughly examined the communication expectations, channel, and formatneeds/preferences of their decision makers.Some decision makers prefer to receive their intelligence via particular channels or in specificformats. Some will prefer to hear results in a private face-to-face, in-person manner; some willprefer a formal presentation; some will prefer to receive e-mails or access a special web areadesigned for the purposes; and some will prefer to receive written reports sent via the internalmail.It is common for analysis clients to exhibit selective hearing based on their own needs,motivations, experience, background, and other personal characteristics. Analysts should takeaccount of and be sensitive to a client's work habits, personality, and schedule. If the client hasan extremely busy day, it would be futile to try and arrange a 90 minute in-depth briefing forsomething that can wait until tomorrow. If an analyst really does have to demand a client'sattention, then the subject matter and scenario had better be of sufficient gravity to warrant suchan intrusion.Part of "managing a client's expectations" also compels analysts to profile themselves and theirclients. D.J. Kalinowski suggests that clients have one of four basic communication styles—thefirst as a primary style and another exhibited less frequently as a secondary style, each of whichindicates that the analyst should do specific things. This notion is expanded next.
Style 1: AnalyticalProblem solvers, organized, logical, somewhat impersonal, typically cautious, and nearlyalways consistent. As such, it is important for the analyst to have done their homework.They should strive to communicate as accurately as possible, providing the level ofbackground detail the client needs to gain confidence in the rigor and logic of theirrecommendations.Style 2: DriverGoal-driven, action-oriented, competitive, serious, strong-willed, controlling, and self-reliant. Analysts communicating with these clients must be efficient in their communication,cutting confidently and quickly "to the chase" and not providing much "fluff" or side-tracking in the presentation of their findings. It is important to stress the "bottom-line"implications of the findings, make clear recommendations, and answer these clients'questions quickly and directly.Style 3: AmiableSympathetic, nurturing, cooperative, personal, adaptable, tolerant, patient, good listeners,and thoughtful. Analysts delivering their findings to these clients try and involve them in thecommunication, keep an open mind, are agreeable, and are willing to explore the manyoptions they went through before coming to their actionable insight. Last but not least, theyshould be clear about the multiple types of benefits that can be generated from therecommendation.Style 4: ExpressiveEnthusiastic, intuitive, creative, inspirational, spontaneous, motivators, friendly, group-oriented, and energetic. Analysts delivering their findings to expressive clients shouldcommunicate with them often, be engaging, use multi-media, and be able to weave a

captivating "story" together.
In a similar fashion, analysts need to look inwardly at their own personality and preferences tomake sure that they are operating optimally in the communication process. Effective analystsrecognize the different preferences and personalities and align them between the communicatingparties.Do not even know whether the right people are getting communicated to with the right results.A surprising waste of analysis resources is common in those enterprises where analysts producereports, develop web-sites, write briefings or newsletters, and distribute these items to readerswho may never even know, or care, about receiving these items. We are aware of a great manyfirms where briefings would sit for weeks or months at a time before being read by the recipient,often rendering the content useless.We find this communication error is made most commonly where analysts do not have regular,active meetings with their decision makers and become too heavily reliant on one-way methodssuch as newsletters, web-sites, intranet portals, or even bulletin boards. It is highly dangerous toassume that material disseminated in this fashion will actually be absorbed at all, let aloneshortly after dispatch. Such a "scatter-gun" approach to communicating results ensures that littlecross-fertilization of knowledge takes place—a vital ingredient in the rich mix of an analyst'sappreciation of how information can impact in many ways, on more than one activity at any onetime.
Effective Listening and Answering the Questions of DecisionMakers
Analysts should also be competent in answering their client's questions and manage Q&A sessionseffectively. One of the best things the analyst can do is to establish, up front, the guidelines anddeadlines under which their presentation will operate. Some other tips analysts should demonstratemastery of are the following:
Never get into a debate, argue with, or criticize a questioner.Analysts who view every question as an attack on the integrity of their work or their personalintegrity typically respond in defensive ways to questions. They will then attack the questioner,and this is unlikely to help them to become a trusted ally of the decision maker. Although somedecision makers will commonly be argumentative with analysts, it will be important for theanalyst to identify something the two parties can agree on, thank the arguer for their input, andmove on to other facets of their dialogue.Answer questions succinctly.Most executives will quickly lose patience with an analyst who drones on and on about thingswithout bothering to take a breath and assessing whether the client is still interested. Long-winded answers usually raise more questions than they answer. Short, concise, and "to the point"responses are generally favored by decision makers, and it is these that the analyst should aim toprovide.
Being able to admit they don't know something.Analysts cannot be afraid to say, "I don't know." It is surprising just how many people simplycannot say those three words when their client asks them a question. There is no way that youcan have pre-empted and prepared for all the likely questions that can come from so manydifferent perspectives. What they don't want to hear, though, after a dynamic presentation, is 30seconds of mindless drivel while you try to make up a good answer to an unexpected question.Offer to find out the answer and get back to them by the end of the day. If you haven't found theanswer by then, tell them so and keep looking unless, or until, you're told to stop.Start and end any meetings on time.Decision-making executives are well paid, and their time is highly valuable. One of the worstthings an analyst can do in a communication activity is to either start a meeting after theappointed time or to end it late. Analysts should not let their poor attention to time managementbe the main thing their decision makers remember about their performance.
Conduct Communication Follow-Up and Gather Feedback
An element of most communication processes that is commonly overlooked is the gathering offeedback and subsequent measurement of the communication and client engagement process.Whenever possible, the analyst should take the opportunity to gain feedback from the audience, asclose as possible to the event. Informal questions that can be asked might be:
"Was that useful?""Was there anything you'd like me to clarify or elaborate upon?""Did I miss anything you would like me to have covered?""Did you get what you needed?""Was this information valuable?""Did you feel confident about acting on my recommendations?""Was there anything you'd suggest I do differently next time?"
It is essential, though, that this does not come across as the actions of a less than confident analyst,engaging in "approval-seeking" or "compliment-fishing" behavior that normally delivers onlyplatitudes and not a truthful opinion on an individual's performance.One thing that is often valuable to competitive analysts is to maintain a rolling audit of their outputs,their effectiveness in communicating these to their audience, and an account of any actions taken as aconsequence. This will help them shape the overall process and enable all parties to identify anydeficiencies.
Pragmatic Considerations
There are a variety of considerations that should always be taken into account when communicatingacross cultures or geographies.19 This topic has received considerable treatment from many authors,
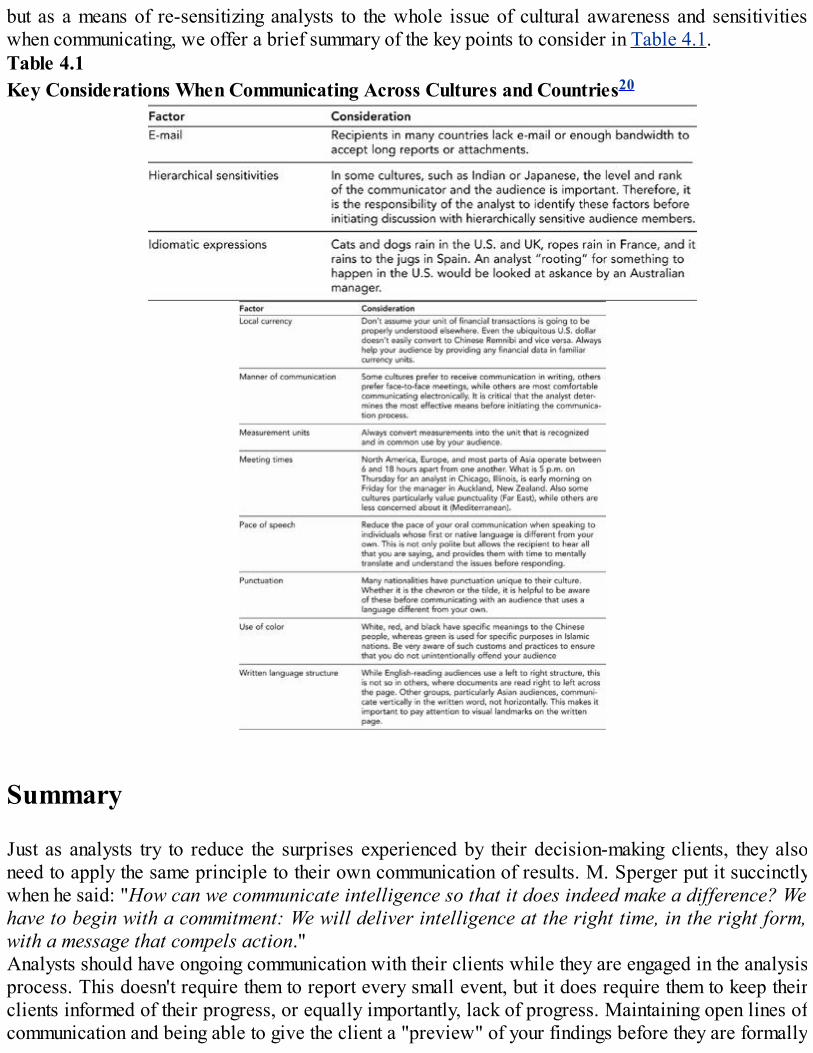
but as a means of re-sensitizing analysts to the whole issue of cultural awareness and sensitivitieswhen communicating, we offer a brief summary of the key points to consider in Table 4.1.Table 4.1Key Considerations When Communicating Across Cultures and Countries20
Summary
Just as analysts try to reduce the surprises experienced by their decision-making clients, they alsoneed to apply the same principle to their own communication of results. M. Sperger put it succinctlywhen he said: "How can we communicate intelligence so that it does indeed make a difference? Wehave to begin with a commitment: We will deliver intelligence at the right time, in the right form,with a message that compels action."Analysts should have ongoing communication with their clients while they are engaged in the analysisprocess. This doesn't require them to report every small event, but it does require them to keep theirclients informed of their progress, or equally importantly, lack of progress. Maintaining open lines ofcommunication and being able to give the client a "preview" of your findings before they are formally
offered can minimize any adverse surprises. This also allows the decision maker to raise potentialissues that the analyst may not have thought of and still has time to address before the analysis processand project is brought to its conclusion.Knowing when to begin the formal communication of results is also a delicate balancing act that theanalyst must master. Releasing results prematurely, possibly before the analyst achieves a highenough degree of confidence in their findings, can result in poor decisions. Communicating one'sresults too late, possibly because the analyst wanted to be very certain of their insights, may renderthe findings obsolete and useless if the actions that needed to be taken were delayed unnecessarily bythe analyst's reluctance to finish.21
Last, but certainly not least, in order to develop and keep their clients' trust, analysts must constantlyacquire and enhance an in-depth understanding of their enterprise's business, industry, and markets.Additionally, they must always relate their key conclusions and recommendations back to what isimportant to their business. If they do not, they will have little ability to persuade their customers,build their influence, or impact business decisions.
References
Buchwitz, L. (1998). "Monitoring Competitive Intelligence Using Internet Push Technology,"available from http://home.eol.ca/~lillyb/CI_paper.html.Clark, R.M. (2004). Intelligence Analysis: A Target-Centric Approach. Washington, DC: CQ Press.DeSouza, K. (2001). "The communication of intelligence: Three lessons," Competitive IntelligenceMagazine, 6(5), pp. 42–44.Dugal, M. (1998). "CI product line: A tool for enhancing user acceptance of CI," CompetitiveIntelligence Review, 9(2), pp. 17–25.Fehringer, D. (2001). "Hot off the wires: Improve the effectiveness of your CI Newsletter,"Competitive Intelligence Magazine, 4(3), May–June, pp. 11, 14.Herring, J.P. (1999). "Key intelligence topics: A process to identify and define intelligence needs,"Competitive Intelligence Review, 10(4), pp. 10–19.Kalinowski, D.J. (2003). "Managing expectations: Will clients ever fully understand?," CompetitiveIntelligence Magazine, 6(6), pp. 25–29.Kopec, J.A. (1982). "The communication audit," Public Relations Journal, 38(5), May, p. 24.Laalo, A.T. (2000). "Intranets and competitive intelligence: Creating access to knowledge,"Competitive Intelligence Review, 9(4), pp. 63–72.McGonagle, J.J., and C.M. Vella (2002). Bottom Line Competitive Intelligence. Westport, CT:Quorum Books.Mockus, D.S. (2001). "Avoid the intelligence disconnect," Competitive Intelligence Magazine,2001, 4(6), pp. 9–12.Parker, D.A. (2003). Confident Communication: Speaking Tips for Educators. Thousand Oaks, CA:Corwin Press, Inc.Sawka, K. (2000). The analyst's corner: Keep your messages short and sweet," CompetitiveIntelligence Magazine, 3(1), Jan–Mar, pp. 54–55.Severin, W., and J. Tankard (1997). Communication Theories. 4th ed. New York, NY: Longman.Shaker, M., and S. Gembicki (1999). The WarRoom Guide to Competitive Intelligence. New York,

NY: McGraw-Hill.Shannon, C.E., and W. Weaver (1949). A Mathematical Model of Communication. Urbana, IL:University of Illinois Press.Sperger, M. (2005). "Managing the message: Communicating intelligence that makes a difference,"Competitive Intelligence Magazine, 8(1), pp. 12–17.Stanat, R. (1998). Global Gold: Panning for Profits in Foreign Markets. New York, NY:AMACOM.Tyson, K.W.M. (2002). The Complete Guide to Competitive Intelligence. 2nd edition. Chicago, IL:Leading Edge Publications.Waters Jr., T. (2001). "Special delivery: High impact presentation tactics for CI professionals,"Competitive Intelligence Magazine, 4(6), Nov–Dec pp. 13–17.
Endnotes
1 McGonagle and Vella, 2002.2 Buchwitz, 1998.3 DeSouza, 2001.4 Clark, 2004.5 Thanks to Melanie Wing for raising the importance of this premise in the communication ofintelligence.6 See McGonagle and Vella, 2002; Tyson, 2002.7 Sawka, 2000.8 See Chapter 18 in Fleisher and Bensoussan, 2003.9 Shaker and Gembicki, 1999.10 Fehringer, 2001.11 A special note of thanks to Timothy Kindler for reminding us of the cumulative importance ofcommunicating with decision makers.12 Tyson, 2002.13 Laalo, 2000.14 Severin and Tankard, 1997.15 Waters, 2001.16 Herring, 1999.17 Parker, 2003.18 Tyson, 2002.19 Sperger, 2005; Stanat, 1998.20 These factors were adapted from the cultural awareness data presented in Communicaid(www.communicaid.com), Sperger, 2005; Stanat, 1998; and www.WorldBiz.com.21 De Souza, 2001.
5Applying the FAROUT Method
Choosing from an increasing array of techniques can be one of the most difficult tasks facing ananalyst. Research of the use of conceptual tools and techniques suggests that executives heavilysupport the idea that executives who use the right tools will succeed, while simultaneouslyrecognizing that most tools over-promise and under-deliver results.1 We think one of the reasons thisis believed is that the tools selected and used by analysts are frequently incorrect and inappropriate totheir needs.There are hundreds of analytical tools and techniques identified in the literature.2 Some techniquesare briefly referred to, while others are treated through book length treatises. Many more are appliedin unique or proprietary ways by analysts in addressing their challenges. We are not surprised that"tools" are seen as over-ambitious and under-performing. The well-worn analogy that a worker withonly a hammer sees every task as simply a decision on how many nails to use holds true in the case ofcompetitive analysis. We might also suggest that just because a worker has hundreds of differenttools, it does not mean that he can apply them all effectively. Most specialists have a handful that theyprefer and can apply most effectively. Fortunately, we believe that there are some considerations thatanalysts can make to lessen the likelihood of using the wrong tool for the job.Techniques have an important role to play in the larger competitive and strategic analysis process.Individuals who study for a Master of Business Administration degree (MBA) or other higher-levelbusiness program will be exposed to some of these techniques in their marketing or strategy courses.Among the benefits that analysts and their organizations gain from using techniques correctly are thefollowing:
1. 1 . Greater understanding of relationships and situations—Virtually every technique andcombination of techniques requires the analyst to ask numerous questions including "what?,""how?," "when?," "who?," "where?," and most importantly, "why?." These questions lessen thelikelihood that they will miss or overlook important facets of the analysis being undertaken.
2. 2. Initially focus the analyst on data and facts—Most techniques require data and facts firstand discourage the use of unqualified opinions, beliefs, rumors, or feelings. Although sometechniques are highly qualitative, and others highly quantitative, nearly all of them require theanalyst to maintain a keen understanding of the soundness of data input.
3. 3. Guide efficient data collection efforts—On agreeing which questions are to be answered,the analyst can then consider which techniques will be of most use. This then drives the datacollection effort and lessens the likelihood that time and resources will be spent on collectingunnecessary or redundant information.
4. 4 . Encourages analysts to be rigorous—Most techniques compel the analysts to consider awider and deeper range of possibilities than they would normally accomplish alone. This isexemplified by the processes we outline in this book that can require multiple steps, which inturn require many checks and balances between these steps. Hasty analyses, badly organizedinformation, and only using convenient data always leads to dissatisfied decision makers andshort careers for the analysts who operate in this fashion.
5. 5 . Forces analysts to think critically—Analysts should consider the benefits and limitationsinherent in looking at data and information in specific ways. Most of the techniques presented

here, along with the information we urge analysts to consider, should help them to preparedefensible and well-reasoned insights that will stand up to the critical scrutiny of demandingdecision makers. Many of these techniques are subsequently modified for particular proprietaryapplications in enterprises, which often then become part of the enterprise's analyticalrepertoire.
6. 6. Promotes a proactive attitude to analysis—Most techniques require the analyst to considerthe options and think through the relative value of each before use. Utilizing selection criteria tochoose the best technique(s) for particular challenges causes analysts to think ahead in terms ofthe data they will need to operate each and the type of outcome each will deliver. This helps todetermine their suitability to address the question(s) being asked.
Studies of the use of competitive analysis tools and techniques have demonstrated the extent of theiruse, as well as perceived judgments of their effectiveness. According to A. Gib and R. Gooding'ssurvey of competitive analysts, the most-utilized tools included competitor profiling, product/marketanalysis, industry analysis, qualitative research methods, and customer satisfaction surveys. Thesetools all tended to be rated highly in terms of their perceived effectiveness, along with managementprofiling. The least-utilized tools included spire analysis, dialectic inquiry/devil's advocacy, gamingtheory, force field analysis, and experience curve analysis.As advisors and consultants in the area of competitive and strategic analysis, we are not surprised bythe finding that a tool's extensive use and its perceived effectiveness would be highly correlated.Analysts will use tools they perceive to be effective and will shy away from ones they perceive to beineffective. Having said that, we have no knowledge of how well trained the analysts were inapplying the thirty tools that were rated, the nature of the questions or topics that their decision-making clients had asked them to address, the context in which they applied the tools, or the quality ofthe data/information used in employing the techniques.
Applying the Techniques
There is a process to properly identify analysis techniques, and analysts should think through a seriesof questions before they make their choice:
1. 1. What is the full range of techniques that can be used to respond to the question asked?2. 2. What is the focus and scope of the competitive phenomenon being analyzed?3. 3. What are the constraints—personal, informational, organizational, resources, and contextual
—that might affect the analysis process?
Every technique we detail in this book delivers certain things very well, but most also havedrawbacks of which the astute analyst must be aware, and we draw attention to these individually.In the "Background" section of each technique, we provide our readers with the context in which thetool was originally developed. A good number of the tools presented in this and our prior book3 weredeveloped decades ago by individuals who recognized problems at the time and sought a conceptualand/or methodological means for solving it. They often become popularized through a managementguru or large consultancy practice.4 Many of these tools have been in use, taught, and improved
through the years to the point where they are now viewed as standard models for use by an analyst.These tools are also the most likely to have been customized or adapted for use by an enterprise,especially as they are more likely to be well understood and regularly employed in analysis work.Other techniques have been developed more recently, often in response to new phenomena beingencountered. These tools have not had the benefit of decades of critical scholarly scrutiny orimprovement through practice and teaching and may yet still evolve dramatically. This does not makethem more or less useful to the analyst, and time will be the best arbiter over whether they toobecome part of the standard competencies of the competitive analyst.We try to point out the "strategic rationale" for the tool's development, and we demonstrate theimportant links the tool has to other strategic concepts. We also suggest what implications theanalyst's application of the tool and the results that are generated from its application will have forthe specific decisions being made.In each section, we look at both the "strengths and advantages" and "weaknesses and limitations" ofeach tool identified. We caution readers against reading too much into the length or the number ofstrengths or weaknesses identified. It was not our goal to be exhaustive but to highlight the moreprominent items that the analyst must consider. Readers should critically consider each of the pointsmade in this section independently and factor them into their application of the tool. This will help toguide the level of confidence by which they communicate their findings.Very few questions can be satisfactorily answered through the application of a single analyticaltechnique. If it were that easy, then there would be no need for this book. Most strategic, business,and competitive questions are complex, dynamic, and cognitively challenging. This requires theanalyst to identify the sequence and range of techniques that need to be applied, and every time thatthis is done, a different answer will emerge. Some application sequences will be more efficient andeffective than others, sometimes, but not always. The analyst also needs to identify the nature andrange of data that is already available or can be acquired before making a decision. Some techniqueswill have to be discarded simply because it is impossible to obtain the required information in atimely manner.
An Evaluation Scheme for Assessing the Adequacy of Tools andTechniques: FAROUT
Any form of intelligence generated must ultimately satisfy a decision maker and the organization'sneeds. An effective analyst needs to know how the intelligence generated by the application of atechnique will be used. Although these principles may appear simple to apply on the surface, thereare a variety of objective considerations that make the execution of an analyst's responsibilities farmore difficult in practice.After years of conducting strategic and competitive analysis projects, some authors realized that therewere a limited number of key considerations common to all high-value analysis.5A unique concept we have developed for analysts is the FAROUT approach. The FAROUT profilewe developed for every technique can be beneficial in helping analysts make choices from thetechniques we detail in this book. Applying FAROUT to their selection process will support analystsin selecting the particular technique or combination of techniques to best meet their unique situations.Having said that, we want to be clear that FAROUT is only a guide, and, as such, is only one input
among many others that an analyst needs to consider in developing their craft. It is designed to assistanalysts in knowing which techniques are appropriate for any given situation.FAROUT is based on the premise that for analytical output to be insightful, intelligent, and valuableto business decision makers, it needs to meet a number of common characteristics. The output needsto be
Future-orientedAccurateResource efficientObjectiveUseful andTimely
Failure to meet all these criteria to a satisfactory level will result in the analytical output being lessthan optimal and of lesser value to the decision maker.The six components of FAROUT are described next.Future-orientation: Relying on the past as predictor of the future can be dangerous. This isparticularly true when innovation, science, and technology factors can quickly disrupt a market. Thishas been very evident in the rapid adoption and development of e-commerce causingdisintermediation of entire industries. By definition, the intelligence resulting from an analyst's workmust be future-oriented, looking both deeply and broadly at what might happen. They must be willingto take risks to some degree by being both inventive and predictive. Early warning, foresight,prescience, or prevision cannot be adequately generated by using historical data that are focusedentirely on the past. The better analytical methods for developing intelligence are indeed future-oriented.Accuracy: The effective analyst should develop outputs that aim for high levels of accuracy. Thismeans that the insights gained are precise. Accuracy also means that the analyst's insights are asclosely matched as possible to the actual conditions of the phenomena being analyzed. High levels ofaccuracy are difficult to attain in practice when the data underlying the analysis
has come from only one source;has not been cross-validated against both hard and soft information;is collected under time constraints that restrict the comprehensiveness of the collection process;needs to be converted from sources in ways that it was not originally designed for; and/orcomes from sources filled with high levels of bias in the first place.
Although achieving the highest levels of accuracy is theoretically desirable, the analyst usually has totrade-off against other conceptual and pragmatic considerations. Experienced practitioners havesuggested that in a good proportion of competitive marketplace contexts, accuracy or precision mayoften be much less important than developing an enhanced understanding or perspective.Resource efficiency: To produce effective analysis, data needs to come from sources that cost lessthan the resultant output is worth. This equation refers to the marginal value of gathering theadditional information required. At the margin, the subsequent use of a tool is valuable to the extentthat it will increase the value of the insights more than the resources expended by the enterprise'sanalyst in applying it. Executives commonly lament that their organizations gather enormous amountsof data, with the thought that it eventually may be needed. Their experiences suggest that much, if notmost, of the data will likely lay dormant for years inside contemporary, high volume, digital storage

devices. Although an Internet search may conveniently produce volumes of apparent "hits," one phonecall to a well-placed and knowledgeable contact would most likely have produced far superiorinformation in a fraction of the time.Objectivity: The application of a given method affects the degree of bias held by the analyst, analystgroups, and/or organizations.6 Too many otherwise "good" analyses can be clouded by cognitive orsocial biases ranging from prior hypothesis bias through recentness and availability to groupthink,all of which provide comfort in dealing with risk or uncertainty.7 To minimize the potentiallydestructive nature of these common biases, data or information should be viewed by analysts in adispassionate, impersonal, rational, and systematic manner. In other words, objectivity helps tominimize the destructive potential of analytical and decision-oriented biases. It is also essential foranalysts to recognize the potential for and avoid the selective use of facts to provide support for pre-ordained or desirous conclusions. Experienced analysts recognize that delivering bad news is just asmuch a part of their job as delivering good news, and they will tackle each with equal skill andobjectivity.Usefulness: Almost by definition, valuable analytical outputs will meet the critical intelligence needsspecified by a particular decision maker. The output of some techniques and models can be quicklyunderstood, whereas others may be less easily digested and can require the decision maker to furtherengage with the analyst before they are confident of making decisions. It helps if the analyst and thedecision maker can design a process that helps each of them to develop a clear understanding of theproblems and intelligence needs, as well as a deep and broad appreciation of the decision context.This understanding does not always come easily, and for many, will only emerge over a lengthyperiod of time, which engenders trust and respect for the tasks and responsibilities of each.Ultimately, effective analysts strive to produce outputs that meet, or surpass, the requirements of thedecision maker.Timeliness: Strategic business information or competitive data frequently has a limited "shelf life,"especially where those decisions are being made in dynamic, hyper-competitive, or turbulentenvironmental contexts. Consequently, raw data loses its value the longer it remains excluded fromthe decisions underlying organizational action. Some methods of analysis may provide theintelligence required by clients for decisions but take far too long to develop. This could happenwhen there is a need to subject the data to multiple phases of analysis, the need to gather a certainvolume or variety of data that is not quickly accessible, or to employ other, less readily availableindividuals in the process. On the other hand, some methods of analysis may require little time toperform but do not deliver the other required features of objectivity, accuracy, utility, and resourceefficiencies. Valuable analysis will provide decision makers with enough time to implement thecourse of action recommended by the analysis.
Using the FAROUT Rating System
Managing the analysis of business and competitive data is a challenging task, and we are not aware ofany Analysis for Dummies books or magic software that can replace an analyst who knows how toemploy a good balance of both science and creativity. We do know from experience, it is highlyunlikely that good analytical output will be based on just one analytical method or tool. Rather, acombination of several techniques will be required.

Each analytical method has unique limitations, and these limitations multiply when placed in specificorganizational contexts. The FAROUT system will enable the analyst to mix the appropriate tools tobe applied in analysis tasks so as to maximize the insights generated for their decision makers. It isour view that the more successful analysts recognize and are sensitive to the limitations associatedwith any particular analytical method or technique. The sensitized analyst can address these issuesthroughout the whole of the competitive and strategy analysis process to overcome such limitations.We utilize a five-point rating scale to assess each analytical technique contained in Part Two. Thefive-point scale ranges from low (1) to high (5) and is expanded in Table 5.1. Every technique isassessed against the six FAROUT elements. Our objective in offering the FAROUT framework is toassist analysts in assessing the outputs of different analytical methods to ensure high intelligencevalue. If the analysis delivers on all six characteristics, analysts and decision makers can bereasonably confident that the output will make a difference. All the techniques and their ratings aresummarized for easy reference in Table 5.2.Table 5.1Assessment of Analysis Techniques Using the FAROUT Scheme
Table 5.2FAROUT Summary of Methods

References
Clark, D.N. (1997). "Strategic management tool usage: A comparative study," Strategic Change,6(7), 417–427.Fahey, L. (1999). Competitors: Outwitting, Outmaneuvering, and Outperforming. New York, NY:John Wiley & Sons.Fleisher, C.S., and B.E. Bensoussan (2003). Strategic and Competitive Analysis: Methods andTechniques for Analyzing Business Competition. Upper Saddle River, NJ: Prentice Hall.Gib, A., and R. Gooding (1998). "CI tool time: What's missing from your toolbag?," pp. 25–39 in theProceedings of the 1998 international conference of the Society of Competitive IntelligenceProfessionals, Chicago, IL.Harris, S.G. (1994). "Organizational culture and individual sense making: A schema-basedperspective," Organization Science, 5(3), 309–321.Hawkins, S., and R Hastie (1990). "Hindsight: Biased judgments of past events after the outcomes areknown," Psychological Bulletin, 10(3), 311–327.Hogarth, R.M. (1980). Judgment and Choice: The Psychology of Decision. New York, NY: JohnWiley & Sons.Hogarth, R.M., and S. Makridakis (1981). "Forecasting and planning: An evaluation," ManagementScience, 27(2), 115–138.Mathey, C.J. (1990). "Competitive analysis mapping," Competitive Intelligence Review, 1(2), Fall,16–17.McGonagle, J.J. (2004). "Analytical techniques," Competitive Intelligence Magazine, 7(4), 51, 54.Prescott, J.E. (1986). "A process for applying analytic models in competitive analysis," pp. 222–251in King, W. and D. Cleland [eds.], Strategic Planning and Management Handbook. New York, NY:Van Nostrand Reinhold and Company.Rigby, D.K. (2003). Management Tools 2003. White Paper. Boston, MA: Bain & Company, Inc.Rigby, D.K. (2001). "Putting the tools to the test: Senior executives rate 25 top management tools,"Strategy and Leadership, 29(3), 4–12.Sandman, M.A. (2000). "Analytical models and techniques," pp. 69–98 in Miller, J. [ed.],Millennium Intelligence: Understanding and Conducting Intelligence in the Digital Age. Medford,NJ: Information Today.Webster, J., Reif, W.E., and J.S. Bracker (1989). "The manager's guide to strategic planning tools andtechniques," Planning Review, 17(6), Nov/Dec., 4–13.
Endnotes
1 Rigby, 2001.2 For example—Clark, 1997;Fahey, 1999; Fleisher and Bensoussan, 2003; Mathey, 1990;McGonagle, 2004; Prescott, 1986; Sandman, 2000; Webster et al., 1989.3 See Fleisher and Bensoussan, 2003.4 Rigby, 2003.5 Fleisher and Bensoussan, 2003.

6 Harris, 1994; Hawkins and Hastie, 1990.7 Hogarth, 1980; Hogarth and Makridakis, 1981.

6Industry Analysis (The Nine Forces)
Short Description
This chapter combines the two substantial topic areas of macro-environmental analysis with industryanalysis and demonstrates the unique creativity that is part of the world of business and competitiveanalysis.Organizations and the industries in which they operate are embedded in a broad environment, whichcan significantly impact the competitiveness of both industries and organizations.The starting point then of any strategic analysis is some form of environmental analysis—generallySTEEP/PEST analysis1—followed by Industry Analysis or Porter's Five Forces,2 which togetherprovide a structural framework outlining an industry and a unique and perhaps more holisticperspective on a firm's competitiveness.Uniting these two techniques creates a powerful framework for not only identifying the forcesoperating in a particular industry, but the impact of environmental factors on these very forces. Thesetwo techniques combined provide a much broader approach to business and competitive analysis.The technique is called "The Nine Forces."
Background
A firm's environment is defined generally as the broad set of forces coming or operating from outsidethe firm that can affect its competitive performance. Firms are open systems subject to a range ofexternal inputs and influences. They all "import" outside resources like finances, people, rawmaterials, and most "export" products or services back out into that environment. Because theenvironment influences the form and behavior of a firm, competitively successful firms musteffectively evaluate that environment.Most environmental analysis is based on the assumption that industry forces are not the soleexplanation of all that occurs within the industry. The environment beyond an industry's boundariescan be a primary determinant or will in some way influence what actually takes place within thatindustry. External factors for change can be among the primary determinants of competition andcompetitiveness in a global marketplace or economy.On the other hand, with industry analysis, the dominant aspects of a firm's environment are assumed toexist in and around the industry or industries in which the firm completes. An industry environmentwould consist of a particular set of competitive forces that create both threats and opportunities.Porter's Five Forces model addresses this perspective and is shown in Figure 6.1.Figure 6.1 Generic framework of industry analysis

The definition of a firm's environment and the approach by which it may be strategically andcompetitively analyzed will often differ depending on the perspective the firm's members choose topursue. By combining both analytical techniques, differing organizational perspectives can be takeninto account through the broader analysis of nine forces.To perform the Nine Forces analysis, an analyst needs to address the three basic levels oforganizational environments: the general environment, the operating or industry environment, and theinternal environment. Figure 6.2 illustrates the relationship of each of these levels with each other andwith the firm at large.Figure 6.2 Three levels of the environment
General Environment
The general environment is that level of a firm's environment that is broad in scope and has long-termimplications for managers, firms, and strategies. These are usually understood to be beyond the directinfluence or primary control of any single organization. STEEP/PEST analysis is one way ofaddressing and studying the broader issues that affect the general environment in which a firmoperates.The acronym STEEP stands for social, technological, economic, ecological, and political/legalsectors. PEST represents the same approach and stands for political/legal, economic, social, andtechnological sectors (see Figure 6.3). Each sector operates over a large geographic area (e.g.,global, international, multinational, regional, national, provincial/state, and local) and over time (i.e.,
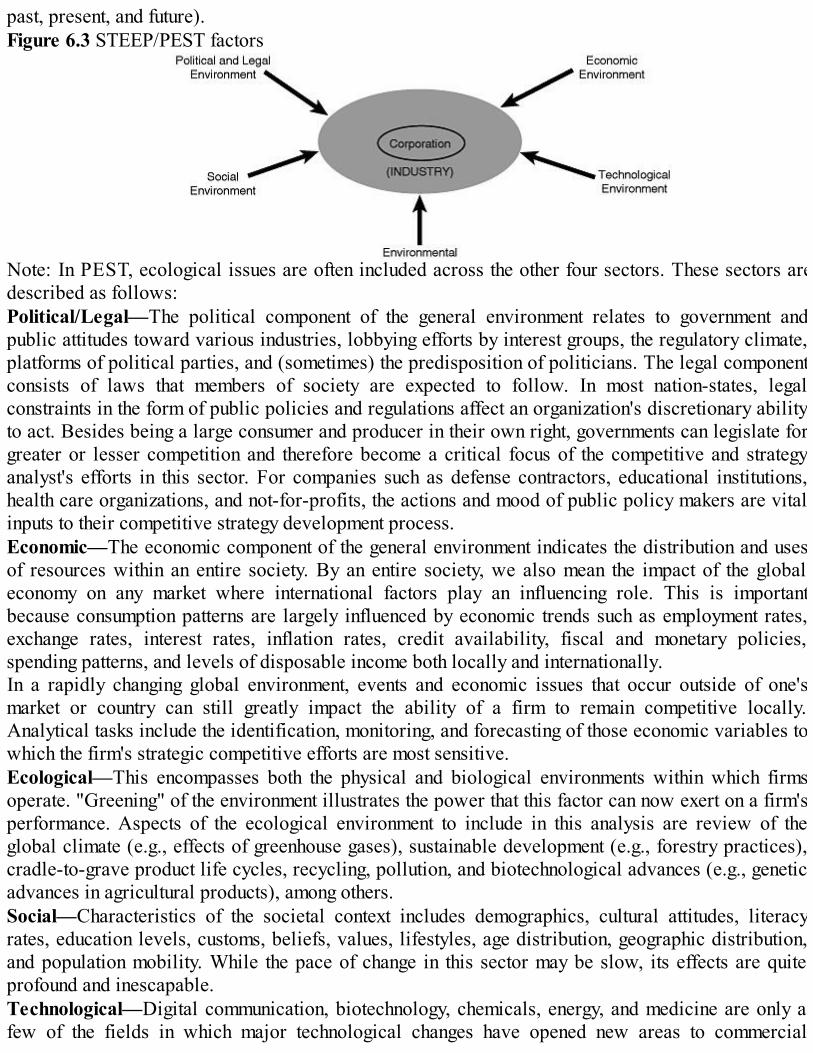
past, present, and future).Figure 6.3 STEEP/PEST factors
Note: In PEST, ecological issues are often included across the other four sectors. These sectors aredescribed as follows:Political/Legal—The political component of the general environment relates to government andpublic attitudes toward various industries, lobbying efforts by interest groups, the regulatory climate,platforms of political parties, and (sometimes) the predisposition of politicians. The legal componentconsists of laws that members of society are expected to follow. In most nation-states, legalconstraints in the form of public policies and regulations affect an organization's discretionary abilityto act. Besides being a large consumer and producer in their own right, governments can legislate forgreater or lesser competition and therefore become a critical focus of the competitive and strategyanalyst's efforts in this sector. For companies such as defense contractors, educational institutions,health care organizations, and not-for-profits, the actions and mood of public policy makers are vitalinputs to their competitive strategy development process.Economic—The economic component of the general environment indicates the distribution and usesof resources within an entire society. By an entire society, we also mean the impact of the globaleconomy on any market where international factors play an influencing role. This is importantbecause consumption patterns are largely influenced by economic trends such as employment rates,exchange rates, interest rates, inflation rates, credit availability, fiscal and monetary policies,spending patterns, and levels of disposable income both locally and internationally.In a rapidly changing global environment, events and economic issues that occur outside of one'smarket or country can still greatly impact the ability of a firm to remain competitive locally.Analytical tasks include the identification, monitoring, and forecasting of those economic variables towhich the firm's strategic competitive efforts are most sensitive.Ecological—This encompasses both the physical and biological environments within which firmsoperate. "Greening" of the environment illustrates the power that this factor can now exert on a firm'sperformance. Aspects of the ecological environment to include in this analysis are review of theglobal climate (e.g., effects of greenhouse gases), sustainable development (e.g., forestry practices),cradle-to-grave product life cycles, recycling, pollution, and biotechnological advances (e.g., geneticadvances in agricultural products), among others.Social—Characteristics of the societal context includes demographics, cultural attitudes, literacyrates, education levels, customs, beliefs, values, lifestyles, age distribution, geographic distribution,and population mobility. While the pace of change in this sector may be slow, its effects are quiteprofound and inescapable.Technological—Digital communication, biotechnology, chemicals, energy, and medicine are only afew of the fields in which major technological changes have opened new areas to commercial

competition. The technological component of the general environment is compounded by the impact ofscience and technology in product and process innovation as well. This includes new approaches toproducing goods and services such as new procedures and new equipment.The analytical task is to identify and monitor the effects of technological change as it affectscompetitive strategy. This can be seen not only in the final goods and services market, but also in newproduct and process innovation, and even communication, human resource attraction, and marketingmethods. Interfacing with the organization's R&D functions is an obvious requirement for businessand competitive analysts.It is important to monitor and evaluate each of these nonmarket factors and their impact in terms of afirm's overall strategic directions.
Operating Environment/Industry Analysis
The operating environment, sometimes termed the competitive or market environment, is that level ofthe firm's external environment with components that normally have relatively specific and immediateimplications for managing the firm.The three main components of the operating environment are customers, suppliers, and competitors.Unlike the general environment, the operating environment can be influenced by individual firms.The Customer component of the operating environment describes characteristics and behavior ofthose who buy or could buy the firm's goods and services. Customers are those who buy direct from afirm. They may not, however, be the final consumers of particular products or services. The customercomponent may therefore include direct buyers all the way to the end consumers. Analysts may wantto break this group down into actual buyers (sometimes referred to as clients or customers) toretailers, wholesalers, or distributors, to end consumers.The Supplier component refers to the role of external resources on the firm. Firms purchase andtransform resources during production into goods and services, so issues like how many vendorsoffer specialized resources for sale, relative quality of material offered, reliability of deliveries,credit terms offered, and the potential for strategic linkages all affect managing the suppliercomponent.The Competitor component consists of rivals, present and prospective, that an organization mustovercome in order to reach its objectives. Analysis and understanding of competitors is critical todeveloping an effective strategy. Competitor analysis should assist management appreciate thestrengths, weaknesses, and capabilities of existing and potential competitors and predict theirresponses to both strategic and tactical initiatives.The structure of key relationships in this operating environment, or environments when the firmoperates in multiple industries, affects both profit potential and prospects for achieving competitiveadvantage.
Internal Environment
The firm's internal environment includes forces that operate inside the firm with specific implicationsfor managing a firm's performance. Unlike externally derived components of the general and operating
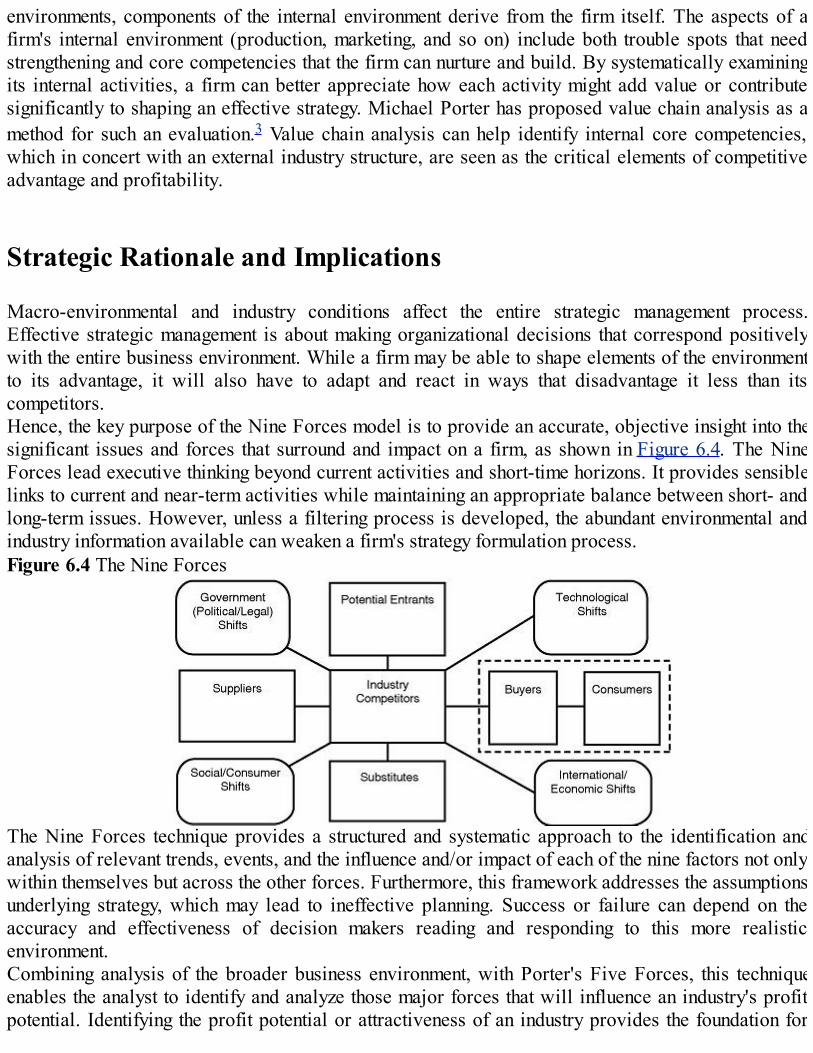
environments, components of the internal environment derive from the firm itself. The aspects of afirm's internal environment (production, marketing, and so on) include both trouble spots that needstrengthening and core competencies that the firm can nurture and build. By systematically examiningits internal activities, a firm can better appreciate how each activity might add value or contributesignificantly to shaping an effective strategy. Michael Porter has proposed value chain analysis as amethod for such an evaluation.3 Value chain analysis can help identify internal core competencies,which in concert with an external industry structure, are seen as the critical elements of competitiveadvantage and profitability.
Strategic Rationale and Implications
Macro-environmental and industry conditions affect the entire strategic management process.Effective strategic management is about making organizational decisions that correspond positivelywith the entire business environment. While a firm may be able to shape elements of the environmentto its advantage, it will also have to adapt and react in ways that disadvantage it less than itscompetitors.Hence, the key purpose of the Nine Forces model is to provide an accurate, objective insight into thesignificant issues and forces that surround and impact on a firm, as shown in Figure 6.4. The NineForces lead executive thinking beyond current activities and short-time horizons. It provides sensiblelinks to current and near-term activities while maintaining an appropriate balance between short- andlong-term issues. However, unless a filtering process is developed, the abundant environmental andindustry information available can weaken a firm's strategy formulation process.Figure 6.4 The Nine Forces
The Nine Forces technique provides a structured and systematic approach to the identification andanalysis of relevant trends, events, and the influence and/or impact of each of the nine factors not onlywithin themselves but across the other forces. Furthermore, this framework addresses the assumptionsunderlying strategy, which may lead to ineffective planning. Success or failure can depend on theaccuracy and effectiveness of decision makers reading and responding to this more realisticenvironment.Combining analysis of the broader business environment, with Porter's Five Forces, this techniqueenables the analyst to identify and analyze those major forces that will influence an industry's profitpotential. Identifying the profit potential or attractiveness of an industry provides the foundation for
building the strategy that bridges the gap between the firm's external environment and its resources.Analysts can, within this framework, address Porter's "rules of competition,"4 which are as follows:
Threat of New Entrants—Entry barriers define the level of difficulty facing those firmsconsidering competitive entry into the industry. When barriers are low, new competition willadd capacity to the industry and increase demand and prices for inputs, resulting in lowerindustry profitability.Bargaining Power of Suppliers—This force refers to the ability of the suppliers to influence thecost, availability, and quality of input materials to firms in the industry.Bargaining Power of Buyers—The firm's customers have a major role in defining industrystructure by virtue of their ability to force down prices via comparison shopping or by raisingquality expectations.Threat of Substitute Products or Services—This force describes the risk of marketdisplacement by existing or potential substitutes.Rivalry Among Existing Competitors—Intensity of competition within an industry. This forcehas been empirically demonstrated in a large number of instances to be the most influential of thefive forces.
By combining STEEP/PEST and Porter's Five Forces, the Nine Forces technique provides arobustness to any industry and environmental analysis and delivers a unique combination of insightsthat are not apparent when doing either of these analytical techniques in isolation. The purpose then ofthis analytical technique is to help analysts to answer the following two questions: Based on thisenvironment, how attractive is the industry? How can your firm best compete?
Strengths and Advantages
Research has demonstrated that companies in some environments can gain an advantage over theircompetition based on the quality of their environmental analysis.5 Using the Nine Forces provides oneway of integrating key personnel and cross-functional information into some facet of environmentaland industry analysis. Further, this framework implies that managers should focus on broaderenvironmental characteristics, and it encourages investment in understanding influencing industryfactors and structure. This analysis can additionally identify existing and potential strengths,weaknesses, opportunities, and threats suggested by components of the firm's environment.Throughout the firm, people can contribute to this analytical process. Various contributions can beimportant in and of themselves as they can create an evergreen forum for sharing and debatingdivergent views on relevant general environmental changes. The more individuals involved, thegreater the opportunity to identify and challenge opportunities or threats in the environment. However,as the firm must gather and act on diverse information in a timely manner, cross-functional teams ofinternal specialists can often perform the Nine Forces analysis most effectively.The Nine Forces analysis can assist in developing a firm's positioning strategy by matching a firm'sstrength and weaknesses within the current environment. Competitive forces analysis identifiessources and strengths of competitive pressures whether they be from within the industry or from thebroader environment. To be successful, strategy must be designed to cope effectively with key

competitive pressures to build a strong market position based on competitive advantage.Unattractive competitive environments may exist when government plays a strong role, rivalry isintense, entry barriers are low, competition from substitutes is strong, and suppliers and customershave stronger bargaining power. Attractive competitive environments may exist when entry barriersare relatively high, no good substitutes exist, and both suppliers and customers have weak bargainingpositions. In general, weak competitive forces mean greater firm profits. A company whose strategyand market position provides a good defense against these forces can earn better profits despite someor all of these forces being strong.The Nine Forces model provides us with a broad analytical tool to develop strategies that willprotect the company from competitive forces, provide a strong position from which "to play thegame" of competition, and help create competitive advantage.This technique can also be used to develop a proactive strategy influencing industry dynamics in afirm's favor. Industry evolution is an important component of the Nine Forces model since it allowsus to identify windows of opportunity to capitalize on changes in force of industry structure or theinfluencing factors from the general environment.The Nine Forces are interrelated to such an extent that a change in one force may impact the otherforces. The essential tasks in this analysis are to identify the following:
Forecasted changes in each of the nine competitive forces.How these changes impact other forces.How results of interrelated changes will impact future profitability of the industry.The predicted strength of the firm's position in this future scenario when employing the currentstrategy.How strategy might be changed to exploit changing industry structure and environmental factorsby either reacting to competitor actions or by proactively seeking to secure competitiveadvantage through strategic change.
Because both the STEEP/PEST and Five Forces models place a strong emphasis on environmentaland industry evolution respectively, they provide strong foundations for scenario analysis. By firstexamining each of the Nine Forces and then understanding the mutual dependency between the variousforces, analysts can establish the proper mindset for long-range analysis.The Nine Forces uniquely combines the strengths of both STEEP/PEST and the Five Forces analysis,while addressing some of the more common weaknesses of each technique.
Weaknesses and Limitations
Nine Forces analysis is not an easy analytical task because differing perceptions of the environmentalcontext come into play. Apart from the identified weaknesses and limitations of both STEEP/PESTand the Five Forces, analysts may find that decision makers often have difficulty in defining whattheir environment is and in placing limits around it. Difficulties may also exist in interpreting theresults and specific impacts, which in turn will affect choosing effective responses. Potentialinterpretation weaknesses include: structuring robust studies; showing financial impact; understandingboth short- and long-term implications; insufficient senior management involvement in the analysis;
difficulties in translating potential opportunities into action plans; and the time and resources requiredto do accurate analysis. As a result, the analytical output can be inaccurate.With many firms also focused on the short-term perspective, executives may forestall theenvironmental analysis process. Many decision makers dislike spending "real" money today forspeculative actions about tomorrow. Many firms also cut back their resources for in-depth analysisduring tough economic times, viewing it as a luxury rather than a necessity. However, this is oftenwhen the analysis is most needed.Many companies do not accept the value of the Nine Forces analysis and therefore do not take thetime to do it well. It can be poorly understood and thus under-valued by management. The failure tolink the Nine Forces analysis to competitive implications is common. The key goal of this process isthe identification of competitive implications for the firm based on this broader environment analysis.In his book, The Fifth Discipline, Peter Senge6 stated, "More specifically, new insights fail to get putinto practice because they conflict with deeply held internal images about how the world works,images that limit us to familiar ways of thinking and acting." Many decision makers hold narrow,limited, or invalid perceptions about the world in which they operate. For example, they think in localterms as opposed to global terms, or since this type of analysis was not covered in their formaltraining, it must be of lesser importance.Finally, diversified businesses can bring great complexity for analysts, as they seek to grasp theimplications of many environmental and organizational dynamics. Biases, prior experience, andhuman limitations will affect their approach. Particularly in multinational environments, home-countrybiases and attitudes often lead organizations to assume and superimpose their own experiences,views, and understandings on variables operating in other countries.
Process for Applying the Technique
Begin with the firm's decision makers defining environmental and industry boundaries to limit thebreadth, depth, and forecasting horizon of the analysis. Breadth refers to the topical coverage of theenvironmental data that are collected. Depth determines the amount of detailed data sought andanalyzed in the Nine Forces. Forecasting horizons span short, medium, and long terms, as dictatedwithin the firm's specific environment.To establish the boundaries of the firm, management may look at the organization's strategic posturewith respect to its geographic diversity (i.e., where it does and does not compete), its product orservice market scope, its return horizon on its fixed resource commitments, technology andinnovation, sources of its resources (capital, human, other financial, and raw materials), regulatorymandate, and flexibility.Once definition and delimitation have occurred, the process essentially involved three key steps.First, collect information to identify the characteristics of each force (refer to Figure 6.4). Theobjective is to understand each force being analyzed and its relationship to the other forces.Questions that may be addressed include:What are the interrelationships between trends? This requires the analyst to use his or her creativecapacity in identifying interrelationships between environmental and industry segments. The analystshould be looking for areas where trends are suggesting redefinitions or changes from the expectedevolutionary path or where trends are reinforcing one another.
What are the conflicts between trends? Trends often push in opposite directions. For example,people are becoming more committed to their work at the same time that they are seeking more familytime outside of the workplace.Not all trends are of equal importance to a firm or an industry. Some will have a direct impact, whileothers may have only tangential impact depending on how the trend interacts with the firm's strategy.It is crucial that the analyst identify those trends and trend combinations that are likely to have thehighest impact on the firm's goal pursuits. Critical trends are "issues" for the organization.Forecasting the future evolution of a trend or set of trends within the issue requires analysis of thedriving forces behind the issue. It is critical to distinguish between symptoms and causes, but it maybe very difficult. Often driving forces work against one another and push simultaneously in multipledirections. Once the causes are accurately identified, the analyst can then develop alternativeprojections of the issue's evolution.The objective is to examine and assess the impact of all Nine Forces on the industry and/or firm.Secondary sources can provide much of the information in this step; however, primary sources shouldbe consulted to improve objectivity.The process for analyzing the nine competitive forces looks to identifying the main sources of poweror competitive pressures among each force.For the next step, the analyst needs to determine the relative strength of each force by ascribing avalue to each, indicating if it is strong, moderate, or weak. Another way is to rank the forces using ascale of 1 to 10, with 10 indicating a strong force and 1 a weak force. Again, important to theanalytical process is the need to determine a logical explanation of how each competitive forceworks and understand its role in the overall competitive picture.Next, collectively assess and evaluate the nine forces in light of your firm's competitive ability. Theultimate goal is to identify the ability of your firm to successfully compete within this industry andenvironment, given the collective strength of these forces. Further, making a comparison between thefirm's resources and strengths against the "fit," or gaps, with the Nine Forces will provide valuableinsights to the firm's opportunities and threats. The need here is to integrate the entire analysis withinthe broader context of corporate strategy—find the tightest fit between the firm's resources andcapabilities and the broad external environment.This involves three types of strategic analysis: reactive strategy against likely competitor moves;proactive strategy to manipulate changing forces already in motion; and proactive strategy toexplicitly force change in one or all of the Nine Forces.To improve the usefulness of this technique, identify long-term environmental and industry trends anddetermine whether industry profitability is sustainable. Further, determine effects of long-term trendson your firm's competitive position.Each competitive force should be constantly monitored for its impact on the current strategy and theopportunities it represents for extending competitive advantage. Finally, not all industries are alike.Therefore, for companies with product portfolios across numerous industries, this model must berepeated for each unique industry served.
Case Study: Rating the Nine Forces Model in the AustralianAirline Industry

(10 = strong, 1 = weak)
Barriers to Entry—Weighting 9
While deregulation reduced legislative barriers, the small size of the Australian market meansgreat efficiencies must be achieved to make this a viable market for any player.Capital intensity offset to some extent by ability to lease aircraft and hire ground crews oncontract.Limited availability of terminal slots in major capital cities.
Bargaining Power of Buyers—Weighting 6
The Internet has made air travel a readily accessible commodity (i.e., price driven).Price sensitivity of consumers has not been significantly offset by loyalty programs.Market share warfare is the industry norm.Domestic travel within Australia almost always involves long distances.
Bargaining Power of Suppliers—Weighting 6
Airport authorities, pilot, flight attendants, and other aviation unions have eroded economic rentassociated with producer surplus.Aircraft manufacturing companies compete heavily for new sales providing alternativefinancing.
Government—Weighting 6
Government ownership of many international airlines makes exit or capacity reduction unlikelydue to conflicting sociopolitical considerations.Government protection policies impact the level of new entrants and their local operationaleffectiveness.Competition Commission, on the other hand, forces the establishment and maintenance of acompetitive choice for travelers.Privatization of airport infrastructure management and services.
Social—Weighting 5
Total growth is limited to the size of the Australian market and international tourism toAustralia. Main growth appears to be in price-sensitive, low-cost economy travel class.The combined impact of terrorism, viruses, wars, and the heightened need for security hasincreased the reticence of travelers for particular destinations.
Competitors—Weighting 9
Predominantly a duopoly—Qantas and Virgin.Majority of costs are fixed regardless of load. Resulting variable cost pricing through heavydiscounting to maximize contribution margin from excess capacity.Growth in low-cost airlines results in substantial capacity increases and lower margins.Long history of Qantas as the major airline in Australia for both domestic and internationaltravel.
Technology—Weighting 8
The business travel market is being impacted by video conferencing and other technology,reducing the need for physical face-to-face communication.New airplane technology allows for greater load capacity, better fuel consumption, and longerdistances, reducing requirements for airlines to operate through hubs.
Substitutes—Weighting 3
Ships, trains, buses, and cars—with the time-pressed individuals of today, these substitutes havea weakened competitive position when it comes to travel across long distances. There ispresently minimal loss of industry revenue to substitutes.
International—Weighting 6
Competitive international airfares and a strong Australian dollar has encouraged strong growthin outbound travel by Australians.Australia is seen as a "safe" holiday destination increasing inbound travelers.Conflicts in the Middle East and North Africa impact on the cost of airline fuel.
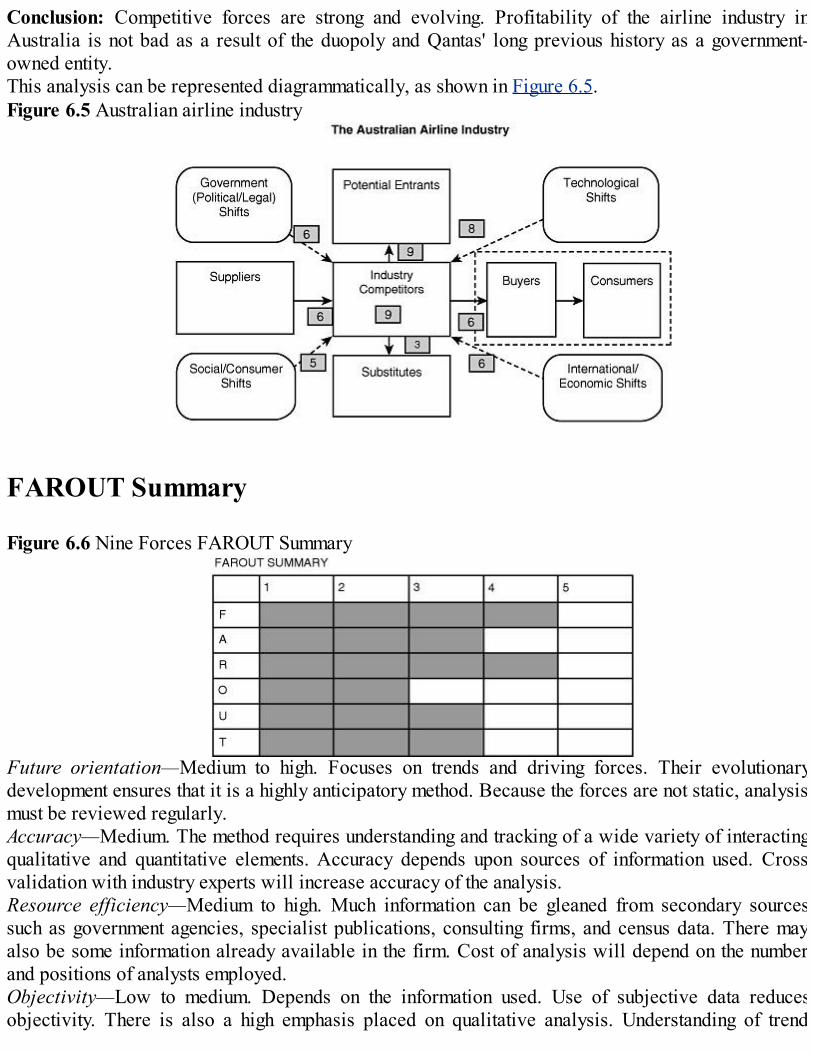
Conclusion: Competitive forces are strong and evolving. Profitability of the airline industry inAustralia is not bad as a result of the duopoly and Qantas' long previous history as a government-owned entity.This analysis can be represented diagrammatically, as shown in Figure 6.5.Figure 6.5 Australian airline industry
FAROUT Summary
Figure 6.6 Nine Forces FAROUT Summary
Future orientation—Medium to high. Focuses on trends and driving forces. Their evolutionarydevelopment ensures that it is a highly anticipatory method. Because the forces are not static, analysismust be reviewed regularly.Accuracy—Medium. The method requires understanding and tracking of a wide variety of interactingqualitative and quantitative elements. Accuracy depends upon sources of information used. Crossvalidation with industry experts will increase accuracy of the analysis.Resource efficiency—Medium to high. Much information can be gleaned from secondary sourcessuch as government agencies, specialist publications, consulting firms, and census data. There mayalso be some information already available in the firm. Cost of analysis will depend on the numberand positions of analysts employed.Objectivity—Low to medium. Depends on the information used. Use of subjective data reducesobjectivity. There is also a high emphasis placed on qualitative analysis. Understanding of trend
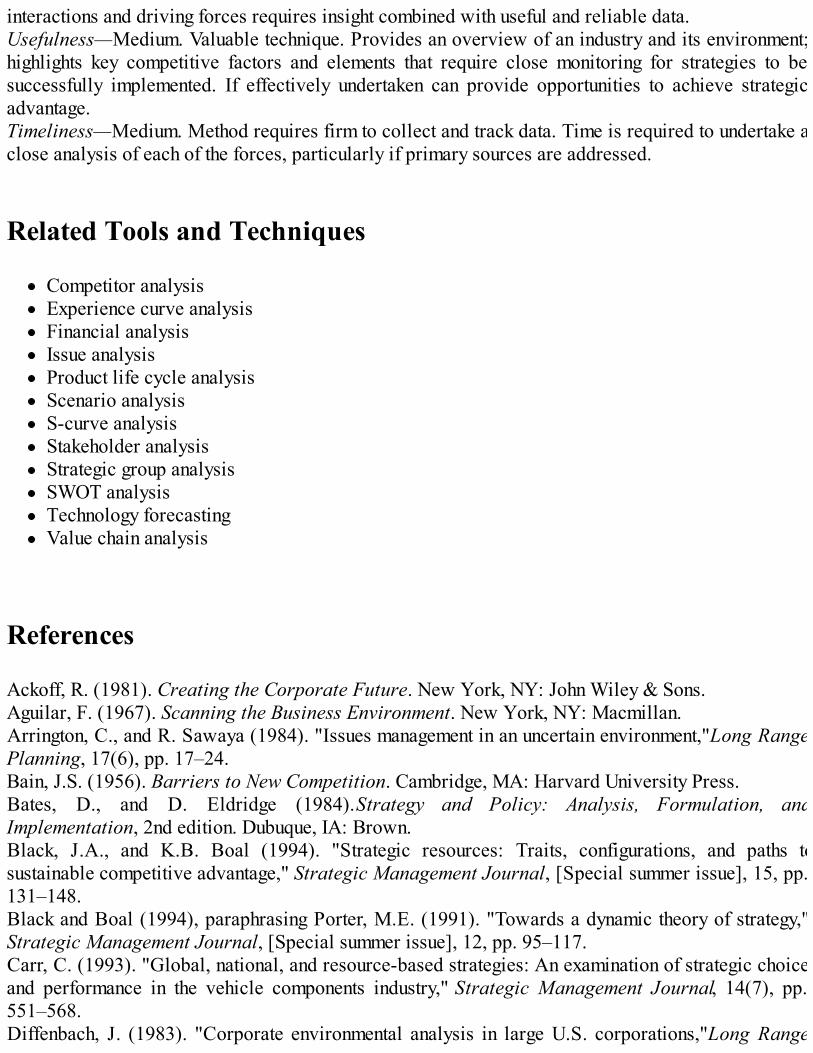
interactions and driving forces requires insight combined with useful and reliable data.Usefulness—Medium. Valuable technique. Provides an overview of an industry and its environment;highlights key competitive factors and elements that require close monitoring for strategies to besuccessfully implemented. If effectively undertaken can provide opportunities to achieve strategicadvantage.Timeliness—Medium. Method requires firm to collect and track data. Time is required to undertake aclose analysis of each of the forces, particularly if primary sources are addressed.
Related Tools and Techniques
Competitor analysisExperience curve analysisFinancial analysisIssue analysisProduct life cycle analysisScenario analysisS-curve analysisStakeholder analysisStrategic group analysisSWOT analysisTechnology forecastingValue chain analysis
References
Ackoff, R. (1981). Creating the Corporate Future. New York, NY: John Wiley & Sons.Aguilar, F. (1967). Scanning the Business Environment. New York, NY: Macmillan.Arrington, C., and R. Sawaya (1984). "Issues management in an uncertain environment," Long RangePlanning, 17(6), pp. 17–24.Bain, J.S. (1956). Barriers to New Competition. Cambridge, MA: Harvard University Press.Bates, D., and D. Eldridge (1984). Strategy and Policy: Analysis, Formulation, andImplementation, 2nd edition. Dubuque, IA: Brown.Black, J.A., and K.B. Boal (1994). "Strategic resources: Traits, configurations, and paths tosustainable competitive advantage," Strategic Management Journal, [Special summer issue], 15, pp.131–148.Black and Boal (1994), paraphrasing Porter, M.E. (1991). "Towards a dynamic theory of strategy,"Strategic Management Journal, [Special summer issue], 12, pp. 95–117.Carr, C. (1993). "Global, national, and resource-based strategies: An examination of strategic choiceand performance in the vehicle components industry," Strategic Management Journal, 14(7), pp.551–568.Diffenbach, J. (1983). "Corporate environmental analysis in large U.S. corporations," Long Range

Planning, 16(3), pp. 107–116.Dill, W. (1958). "Environment as an influence on managerial autonomy," Administrative ScienceQuarterly, 2(2), pp. 409–443.Fahey, L. (1989). "Understanding the macroenvironment: A framework for analysis," In L. Fahey,(ed.), The Strategic Planning Management Reader, Englewood Cliffs, NJ: Prentice Hall, pp. 38–43.Fahey, L., King, W., and V. Narayanan (1981). "Environmental scanning and forecasting in strategicplanning—The state of the art." Long Range Planning, 14(1), pp. 32–39.Fleisher, C.S, and Bensoussan, B. E. (2003), 'Strategic and Competitive Analysis', Prentice Hall,Upper Saddle River, N.JGrinyer, P.H., and D. Norburn (1977/1978). "Planning for existing markets: An empirical study,"International Studies in Management and Organization, Vol 7, pp. 99–122.Lenz, R., and J. Engledow (1986). "Environmental analysis: The applicability of current theory."Strategic Management Journal, 7, pp. 329–346.McWilliams, A., and D.L. Smart (1993). "Efficiency v. structure conduct performance: Implicationsfor strategy and practice," Journal of Management, 19, pp. 63–79.Miller, D., and P. Friesen (1977). "Strategy making in context: Ten empirical archetypes," Journal ofManagement Studies, 14(3), pp. 253–280.Porter, M.E. (1979). "How competitive forces shape strategy," Harvard Business Review, 57(2), pp.137–145.Porter, M.E. (1979). "The Structure within Industries and Companies Performance," The Review ofEconomics and Statistics, 61(2), pp. 214–227.Porter, M.E. (1980). Competitive Strategy: Techniques for Analyzing Industries and Competitors.London: Collier Macmillan Publishers.Porter, M.E. (1980). "Industry structure and competitive strategy: Keys to profitability," FinancialAnalysts Journal, 36(4), pp. 30–41.Porter, M.E. (1985). Competitive Advantage : Creating and Sustaining Superior Performance.London: Collier Macmillan Publishers.Roquebert, J., Phillips, R., and C. Duran (1993). "How much does strategic management matter?,"Presentation at the meeting of the National Academy of Management, Atlanta, GA.Rumelt, R.P. (1991). "How much does industry matter?," Strategic Management Journal, 12(3), pp.167–185.Scherer, F.M. (1970). Industrial Market Structure and Economic Performance. Chicago, IL: RandMcNally.Schumpeter, J.A. (1943). Capitalism, Socialism, and Democracy. London: George Allen and UnwinLtd.Senge, P. (1992). The Fifth Discipline. New York, NY: Currency DoubleDay.Starbuck, W. (1976). "Organizations and their environments." In M. Dunnette (ed.), Handbook ofIndustrial and Organizational Psychology. Chicago, IL: Rand McNally.Stubbart, C. (1982). "Are environmental scanning units effective?," Long Range Planning, 15(3), pp.139–145.Suutari, R. (2000). "Understanding industry structure," CMA Management, 73(10), pp. 34–37.Thompson, J. (1967). Organizations in Action. New York, NY: McGraw-Hill.Wilson, I. (1982). "Environmental scanning and strategic planning." In G. Steiner et al. (eds.)Management Policy and Strategy (Reading 7). New York, NY: Macmillan.

Endnotes
1 See Fleisher and Bensoussan (2003), Chapter 17.2 See Fleisher and Bensoussan (2003), Chapter 6.3 See Fleisher and Bensoussan (2003), Chapter 9.4 See Fleisher and Bensoussan (2003), Chapter 6.5 Miller and Friesen, 1977; Grinyer and Norburn, 1977/78.6 Senge, P. (1992).

7Competitive Positioning Analysis
Short Description
Competitive positioning analysis is conducted to enable a firm to make strategic plans in relation toits current competitive position: These may be to preserve an advantage, attempt an improvement, orwithdraw from a market. The analysis assesses market share, client perception of products andservice, current marketing strategies, prices, and costs. It also provides information about the relativemarket positions and strengths and weaknesses of a firm's competitors. The process identifiesopportunities and points to strategies to exploit these opportunities in an industry or market.
Background
A firm's competitive position refers to its place in an industry or market in comparison with itscompetitors. The concept of "positioning" appears to have come from Jack Trout's 1969 paper,1
"Positioning' is a game people play in today's me-too marketplace." At the time, it revolutionized theidea of communication with a market. Where traditional marketing had been based on the idea oftelling clients about the benefits of your product in comparison with your competitors, positioningattempts to change the perception of your product in the mind of a target audience by giving yourproduct a unique position.Competitive positioning explores an industry in part by researching the perceptions of the clientsserviced by it and looks for ways to improve perceptions of your firm overall. It also extends thepositioning concept beyond product marketing and feeds information into the firm's strategic planningand strategic management.Strategic planning and strategic management evolved around the same time as positioning. LindenBrown2 notes that "corporate planning" employed by firms up to the 1960s was founded onreasonably steady expansion in a relatively stable financial environment. Corporate planning couldnot guide firms through the turbulent economic conditions and rapidly changing markets of the late1960s and early 1970s. Strategic planning and strategic management evolved to provide firms withtools to review their performance and plan for the future in order to cope with increasinglycompetitive and volatile markets.Competitive positioning is an umbrella term for a variety of different tools and processes designed toapprise a firm of its competitive position and inform strategic decisions made in relation to it.Competitive positioning is also the name given to the action of strategically changing a firm's positionin the marketplace.Competitive positioning analysis provides information with direct importance to the development of astrategic plan by giving a firm an overview of its industry and enabling it to apprise its owncompetitive position. Essentially, it assesses factors that impact on market performance and profit
performance. It examines a particular industry and the participants within it to provide anunderstanding of the industry and the competition. It looks at who is competing and how, what marketshare they have, how clients perceive the participants in the industry, how the various participantsoperate in the marketplace, and their strengths and weaknesses.
Strategic Rationale and Implications
Competitive positioning is based on the truism that business is characterized by competition. Wheremore than one participant is involved in an industry, competition exists not only to win the business ofclients by convincing them that they need your product, but to do so better than your competitors. Thisnecessitates a marketing strategy for your products and/or services and also a competitive marketingstrategy to differentiate your firm from its competitors.Undertaking an analysis of your competitive position compares your firm's position in an industry ormarket with that of its competitors. Such an analysis should include information about the structure ofthe industry and the participants; outline their operating practices; cover customer satisfaction andprofitability issues; and provide an overall appraisal of your firm's position.The competitive positioning process requires a detailed analysis of a firm's own business and thevarious markets (or market segments) in which it competes. Competitive positioning analysis isdesigned to give you an understanding of your firm's competitive position within its industry and anoverview of the industry as a whole. This is fundamentally important to developing an effectivecompetitive marketing strategy as it broadens your outlook beyond your own revenue, products, andservices, and gives an industry-wide perspective of your firm's performance and opportunities.The most common structure found in a market is for there to be one clear market leader; a secondmajor player differentiated from the leader; a substantial amount of lower-priced competition; andthen niche specialists, who generally charge a price premium and cater to specific needs. Onevariation on this structure is the situation where a market is dominated by two firms of roughly thesame size, which hold a large majority of market share (that is, a duopoly).Using a variety of different tools and processes, a firm can address its current competitive positionand inform strategic decisions made in relation to it. The key outcome of the analysis is some actionof strategically changing a firm's position in the marketplace.Porter's Five Forces Industry analysis and the Nine Forces Industry analysis, for example, are allsophisticated tools for identifying a firm's competitive position (see Chapter 6, "Industry Analysis(The Nine Forces)").A variety of modeling concepts are also useful in analyzing competitive position. These include theBCG matrix, McKinsey matrix, and perceptual maps. By feeding the relevant information into one ofthese analytical models, a firm's competitive position may be readily visualized.There are four basic directions for any competitive strategy, as follows:
To develop and build on a firm's positionTo maintain and hold a firm's strong market positionTo defend a dominant positionTo withdraw from a market with minimal loss
Develop and Build on the Firm's Position
There are three broad situations where a firm may wish to develop and build its position. These arethe following:
1. 1. A niche firm looking to expand its business2. 2. A minor competitor seeking to become a dominant force3. 3. A firm in a position of joint dominance wishing to move to sole dominance
These three competitive positions may also be viewed as a progression of strategic position fromniche to broad market dominance.A firm in any one of these positions will be looking for weaknesses in its competitors, which can beeasily exploited to its own advantage. A niche firm may be looking for unfulfilled segments in themarket. These may be segments viewed as not profitable enough for the dominant firm to pursue butmay be worthwhile for a niche firm seeking to consolidate its position as a force in the marketplace.A minor competitor may try to focus on gaps in the market not properly serviced by the dominant firm.Where a market is dominated by two or more major firms, competitive positioning analysis may giveinsight into how one of these may differentiate itself from its competitors or reposition itsproduct/service within the market in order to gain a competitive advantage and market dominance.
Maintain and Hold the Firm's Strong Market Position
In this situation, a firm is not seeking dominance within a market, but wishes to hold onto its share ofthe market against all incumbents. Where a market is mature and no longer expanding, it is unlikelythat there will be interest to invest in expanding market share. The ideal position for a firm in thismarket would be to preserve its market share (and revenue) for as long as the market remainsprofitable with minimal outlay of resources.
Defend a Dominant Position
A position of dominance in a market has advantages going beyond the immediate revenue stream andeconomies of scale that come with size. Market dominance allows a firm to manage the market andcontrol competition to some extent. Often the dominant product in a market can be perceived as thestandard by clients.Apart from consolidating its position against its major competitors, the dominant firm should also beaware of any developing "third force" coming between it and its traditional competitors. Theemergence of significant new competition can undercut profits for all existing players by siphoningaway market share.The dominant firm in the market generally has a variety of strategies available to it to fend offcompetition. It may choose to follow a price-cutting strategy, although this is costly and may have a
negative affect on clients by changing cost expectations or perceptions of product quality. A dominantfirm may launch new products in direct competition with any competitor that tries to fill in gaps in themarket. These new products may trade on the high esteem in which clients hold the dominant firm ormay simply dilute the profitability of new products for smaller firms, leading them to withdraw fromthe market.
Withdraw from a Market
There are times when it may be best for a firm's overall competitive position to withdraw completelyfrom a particular market, leaving the firm to concentrate on more profitable markets. This may occurwhere the market itself is declining—for example, because technology is rendering it obsolete. Adeclining market is one where profits are falling and the costs of doing business will eventuallyoutweigh possible revenue, even for the market leader. Ideally, where a market is declining, a firmshould aim to get its clients to substitute the product being withdrawn with another product from thesame firm or at least to withdraw the product with as little inconvenience to clients as possible.Unsuccessful expansion or diversification by a firm into a new market may also leave the firm in anunprofitable position and thereby needing to withdraw. Additionally analysis of competitors maypoint to the likelihood of a market player being able to sustain the investment necessary to support theexpansion/diversification in the face of defensive strategies from existing market players.Once you have a detailed understanding of your firm's competitive position and the industry it issituated in, you are then equipped to design and implement strategic plans to defend or improve yourcompetitive position or even to cut your losses and withdraw from the market.
Strengths and Advantages
Competitive positioning analysis provides detailed and practical information about the industry andmarkets in which a firm competes. It generates practical strategic information to improve competitiveposition that may be immediately incorporated into the firm's strategic plan.The process will provide useful information to firms of all sizes and in many different competitivepositions. Major firms with market dominance may use the results to consolidate their positions.Minor players in an industry may use the results to increase market share and expand the markets inwhich they participate. Established firms may use the results to keep up with changes in their industryor markets. New firms may get valuable information about how to go about establishing themselveswithin an industry or market. Gaps uncovered in a market may point to a need or desire in amarketplace for particular new products or styles of products or services.Competitive positioning analysis may also provide information about the viability of particularproducts or markets within an industry, allowing informed decisions about developing ordiscontinuing products. It may further be used to provide information about competition in newmarkets and give guidance about how to best enter a particular new market.Improving your firm's competitive position additionally puts it in a better position to attractinvestment and enter strategically desirable alliances.
Weaknesses and Limitations
The quality of the information obtained by conducting a competitive positioning analysis will dependon the design of the process. Care must be taken when defining the industry or markets you wish tostudy. The analysis will be compromised where the industry examined is defined too narrowly (andimportant or potentially important competitors are omitted), and where the industry is defined toowidely (and meaningless comparisons are made with firms that are not relevant competitors).It is important to take care in accurately and comprehensively identifying relevant markets andproducts for the same reasons.Another limitation of competitive positioning analysis is its reliance on information aboutcompetitors. In some industries, competitor information is not readily available. In other industries,there may be individual firms that do make particular information available. It is also possible that afirm will not be able to gather meaningfully detailed information about the new products indevelopment with competitors. It is also possible to find that competitors have been circulatingmisinformation specifically to confound any competitive positioning analysis undertaken by theirmarket rivals. Gaps in the information you are able to gather may compromise the reliability of theanalysis you conduct.A firm that chooses to carry out its own competitive positioning analysis and draw its own strategicconclusions may find the final strategies are limited by internal biases. Incomplete briefing of a third-party analyst may result in a misdirected analysis and missing important nuances in the industryand/or market.
Process for Applying the Technique
Competitive positioning can be understood as a broad three-step process:
1. 1. Identify the focus of your firm's current strategy and identify analysis parameters such asmarket or products to be assessed.
2. 2. Conduct analysis with the following:1. (a) Undertake market segmentation to gain a better understanding of competitors and the
breakdown of your industry.2. (b) Undertake industry analysis to get a more detailed understanding of the competitive
environment.3. (c) Conduct market research to gain insight into client perceptions of the market, products,
and competitors (including your own firm).3. 3. Derive insights from the preceding analysis and formulate a positioning strategy for your firm.
Both primary information (focusing on the needs and perceptions of clients) and secondaryinformation (which looks at facts and trends) are used throughout the competitive positioninganalytical process.Secondary research should provide you with objective information about market share, market size,expected growth, and general economic conditions in the marketplace.Although this information is available from publicly available sources, such as online databases and
industry publications, it may be more expedient to get a professional researcher to undertake this partof the project, even if the rest of the project is being run in-house. Unless you have internal staff whoregularly monitor this sort of information, tracking all the background information can be time-consuming.A particularly interesting source of secondary information for competitive positioning may be thePIMS database, which provides market and competitive profiles and business results from some3,000 firms arranged by industry category. The PIMS (profit impact of market strategy) project hasbeen collating information since 1972 and aims to pool collective business experience for the benefitof other firms in similar industries. Although PIMS data has no accurate predictive power, it can giveinsight into how the structural attributes of a business may have an impact on its competitive position.The database may be accessed at www.pimsonline.com. It is a subscription service.
Identify Current Strategy and Market/Product/Project Parameters
Assessing your current business and marketing strategies will provide you a background to yourfirm's current position in the market and a starting point from which to plan the strategies arising fromthe competitive positioning project. This is also the step in the process when you will be defining thescope of the project and what you hope to gain out of it.One of the issues then to be addressed in this step is how you plan to use the information you obtain.This will have an impact on the depth of analysis you undertake throughout this process. For example,a project that is looking for competitive positioning strategies relating to distribution has a muchnarrower focus than a complete competitive positioning analysis. Whatever level of detail you areaiming for, you need to make early decisions about categories of information you will need to gather.The division of information into categories is arbitrary and is a fundamental part of the projectdesign.Another point that needs to be considered is the level of detail you plan to go into with your researchitself. The level of analysis will depend on the size of any investment likely to flow from thecompetitive positioning process. For example, if a multi-million dollar refit of a manufacturing plantis contemplated, then a more expensive and detailed analysis is not only justified but advisable.Linden Brown observes that the factors considered in appraising competitive position are basicallyall the factors that have an impact on market performance—for example, market share, revenue, brandimage, and profit performance, including costs, margins, prices, and productivity. These factors maybe examined at the industry level or at the level of individual niche product markets within anindustry.A preliminary investigation of your firm's current portfolio is often a useful place to start and mightbe typical of a product/market matrix, as shown in Figure 7.1.Figure 7.1 Product/market matrix
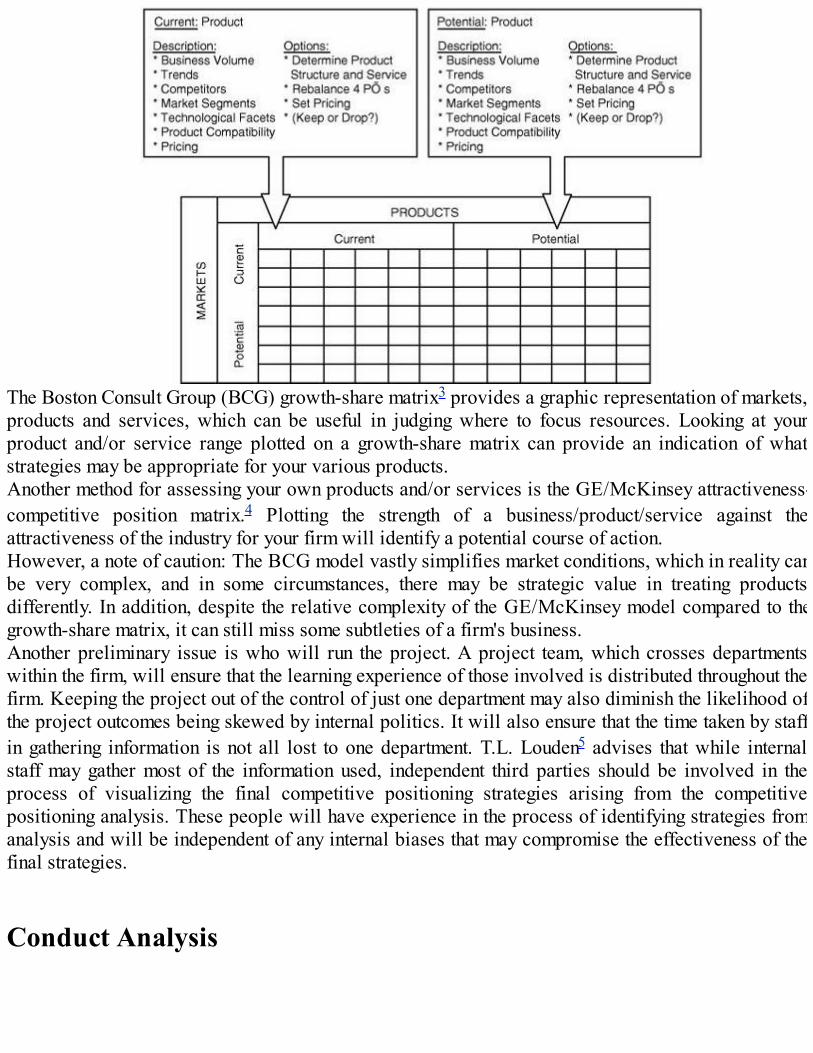
The Boston Consult Group (BCG) growth-share matrix3 provides a graphic representation of markets,products and services, which can be useful in judging where to focus resources. Looking at yourproduct and/or service range plotted on a growth-share matrix can provide an indication of whatstrategies may be appropriate for your various products.Another method for assessing your own products and/or services is the GE/McKinsey attractiveness-competitive position matrix.4 Plotting the strength of a business/product/service against theattractiveness of the industry for your firm will identify a potential course of action.However, a note of caution: The BCG model vastly simplifies market conditions, which in reality canbe very complex, and in some circumstances, there may be strategic value in treating productsdifferently. In addition, despite the relative complexity of the GE/McKinsey model compared to thegrowth-share matrix, it can still miss some subtleties of a firm's business.Another preliminary issue is who will run the project. A project team, which crosses departmentswithin the firm, will ensure that the learning experience of those involved is distributed throughout thefirm. Keeping the project out of the control of just one department may also diminish the likelihood ofthe project outcomes being skewed by internal politics. It will also ensure that the time taken by staffin gathering information is not all lost to one department. T.L. Louden5 advises that while internalstaff may gather most of the information used, independent third parties should be involved in theprocess of visualizing the final competitive positioning strategies arising from the competitivepositioning analysis. These people will have experience in the process of identifying strategies fromanalysis and will be independent of any internal biases that may compromise the effectiveness of thefinal strategies.
Conduct Analysis

(a) Market Segmentation
Market segmentation is a process that divides your market into distinct groups of clients who shareparticular characteristics. A market segment is a way to conceptualize a target market. A marketsegment must be identifiable and measurable; accessible by communication/distribution channels;have unique needs (compared to other market segments); be relatively stable over time; and be largeenough to be profitably targeted for its business.These segments may be made up of individual consumers or industry consumers, and the basis fordividing them into segments varies slightly between the two client groups. Individual consumers aredivided into market segments on four broad bases: geography (which includes not only location, butalso population density and growth); demographics (age, gender, etc.); psychographic variables(including values, lifestyle, and attitudes); and client behavior (including brand loyalty, usage madeof product, and sensitivity to price). An industry client segment will be identified by geography(concentration of clients, regional growth, and international considerations); client type (how big areclient organizations, what industry are they part of); and how the clients behave (are they loyal tosuppliers, and how big and/or frequent are their orders).Segmenting your markets in this way will narrow your client base into smaller groups and make iteasy for you to identify the competitors who also compete for each segment's business.Segmentation is a valuable exercise from a planning point of view, as it will provide obviouscategories of clients to target with specific products and/or specific marketing strategies.As an alternative to market segmentation, Pankaj Ghemawat6 suggests breaking your firm's activitiesinto economically meaningful categories to allow close attention to the impact of costs and clientwillingness to pay for product. This can be done by undertaking value chain analysis.7Another approach might be to focus on key assets and skills you judge to be essential to competitionin your industry or individual product markets within your industry. In Developing BusinessStrategies, David Aaker8 suggests four broad areas to concentrate on when you are determining whatare the key assets and skills in your particular industry (or within a market): reasons some firms aresuccessful and some are not; major motivations for clients in deciding who to do business with; majorcomponent costs; and the ease with which firms may enter or reposition themselves within theindustry (or market).
(b) Industry Analysis
Areas you may focus on include investigating current and potential products and markets of yourcompetitors. Additionally, you will need to understand the structural characteristics of the industry.For example, is it very competitive? How many competitors exist in the field? Is it subject toregulation? Is ownership of firms in the industry stable? Is the industry concentrated in onegeographical area? Are there gaps in market coverage?Industry analysis provides a strategic assessment of the competitive position of each of yourcompetitors within a given market. This analysis considers the existing rivalry between suppliers inthe market; the threat posed by new entrants; the bargaining power of clients in the marketplace; thepower of suppliers; and any threat to the market posed by substitute products. It can also address thebroader industry framework to identify the trends that will impact the long-term direction of a market.

(See Chapter 6 for detailed information about how to conduct this type of analysis.)A SWOT analysis9 or competitor analysis10 of your competitors may also be useful in identifyingcompetitors' existing strengths and weaknesses and opportunities arising for your firm. It may alsoidentify any threats to your competitors, which you may be able to utilize to your competitiveadvantage.
(c) Market Research
Traditional market research will give valuable insight into client perceptions of a marketplace andthe suppliers servicing it (these are your firm and your competitors). Feedback may be sought onvarious product types, individual products, various services, various suppliers, and client desires interms of improved product or service.Market research may be undertaken via telemarketing or face-to-face interviews—preferably by anindependent third party to limit internal firm biases. It may also use detailed surveys designed andadministered by specialist researchers to generate statistically comparable empirical information.The scope of your competitive positioning project as identified in the first step will inform yourdecision as to who and how to undertake this research.
Review Results and Formulate Positioning Strategy
A great deal of detailed information will be obtained in undertaking competitive positioning analysis.The simplest and most commonly used way to get an overview of the results of your research may beto use perceptual maps to give a quick graphic summary of the main findings.A perceptual map plots the position of a firm or product in space generally using two axes.Information may be plotted using more than one axis; however, this may be difficult to represent as atwo-dimensional graphic.Perceptual maps plot perceptual information and may include vectors indicating the preferredperformance for a product/service/firm across the two axes commonly attributed by clients. Thesemaps can be generated by software.Figure 7.2 shows a perceptual map addressing the pain relief tablet market. The axes are based onkey criteria as identified by clients.Figure 7.2 Perceptual map with ideal vectors in the pain relief marketSource: http://en.wikipedia.org/wiki/Perceptual_map (last accessed October 2006).

However, these are not accurate reflections of reality, being based on perceptions to start with andthen subject to possible distortion in the process of converting verbal opinions into a numericallygenerated graph. Perceptual maps have attracted criticism for being no more than intuitive reflectionsof pre-existing biases.It is important that perceptual maps should be interpreted in tandem with the detailed informationfrom which they are drawn. Used with caution, perceptual maps can give a quick picture ofcompetition in the marketplace from the point of view of clients.Another way to conduct an appraisal of the analysis and to help formulate appropriate strategies is tocompile evaluations of your firm's and each competitor's strengths and weaknesses in terms of amatrix. For each key business area or critical success factor, competitors can be evaluated in a matrixrelative to your own abilities. This provides an overview and understanding of your position againstkey competitive factors in your industry. Figure 7.3 shows an example of a matrix relating to thequality of a marketing communications.Figure 7.3 Strength/weakness evaluation matrix
Compiling matrices or perceptual maps and referring back to the information gathered should enablethe analyst and the project team to generate a list of opportunities available to not only improve thefirms competitive positioning but to address specific problem areas for longer term competitiveadvantage.
T. L. Louden11 advises that while internal staff may competently gather most of the information used,independent third parties should be involved in the process of visualizing the final competitivepositioning strategies arising from the competitive positioning analysis. These people will haveexperience in the process of identifying strategies from analysis and will be independent of anyinternal biases that may compromise the effectiveness of the final strategies.
Summary
In essence, a complete competitive positioning analysis will put together the following:
1. 1. A clear outline of your own firm's current and potential markets and products. Some optionsfor management may start to be identified. The product/market matrix reproduced in Figure 7.1may be a useful template.
2. 2. Identify competitive practices in the industry, covering such areas as the principalrelationships between costs, revenue, and profits; who has competitive advantage in whichareas; the level to which the industry is tradition bound; opportunities for innovation; advantagesarising for differing geographical/environmental factors; weaknesses to exploit; and strengths toovercome or avoid.Additionally, competitor profiles may expose an organization and management style; corporategoals; marketing, sales, and customer support strategies and practice; production processes(particularly productively and costs); technical and support systems; finance (includingaccounting and control systems); investment management (portfolio and performance); and staff(including turnover, level of remuneration, and personnel policies).
3. 3. Review general and specific factors contributing to client satisfaction with their currentsuppliers (your firm and your competitors) including: quality of product (including whetherproducts are perceived as meeting needs); client ability to understand value of purchases;whether the market prefers one-stop suppliers or specialist sources; availability andconvenience of products; quality of service; tendency to be loyal to their supplier or to shoparound; whether short- or long-term performance of products will reflect on reputation ofsupplier; and effort required to change suppliers. Any customer dissatisfaction suggests anopportunity for your firm to step in and meet the unmet need.
4. 4. Undertake an overall appraisal of the competitive environment to identify any strategies ortactics, which may improve your firm's competitive position and identified a set of strategies totake the firm where it wishes to go in an industry.
The detailed information gathered during the competitive positioning project give a comprehensivepicture of the industry, markets, and products on which it focuses. Any gaps in market coverage, orpotential weak points in the position of the dominant firm in the market, should be obvious. Thisinformation can be used to inform decisions about directions for new product development or provideclues as to what strategy might successfully attack the dominance of the market leader and steal awaysome market share.The satisfaction or otherwise of clients served by any particular market or unmet needs perceived byclients should be apparent. This analysis may also give clues for strategic development of a new
product or for more effective marketing and sales approaches in the market.
Case Study: Financial Services
Increasing competition and a slowdown in the economy prompted the capital mortgage division of avery large financial services firm to seek feedback from the market.In particular, the division wanted some direct information of client perceptions of it and its keycompetitors. It also wanted to check the progress of its strategic plans and marketing in themarketplace and from that get an indication of how it was traveling in implementing its strategicvision.It engaged a third party to conduct a competitive positioning study.The first step in the process was a telephone survey developed and designed to hone in on theperceptions of intermediaries and borrowers as two key segments of the firm's market. The surveywas presented to a sample of both existing and potential clients from various asset groups.The interview began with a qualitative blind study. The questions asked respondents to do thefollowing:
Identify the most important factors in deciding where to borrow.Define selection criteria in terms of behavior and the consequences of the decision.Nominate which lender they considered to be the market leader in terms of each selectioncriteria.
The second half of the interview asked each respondent for their perceptions of the client firm,addressing both the factors discussed in the first half of the interview and the strategic marketingundertaken by the firm.There were some surprise results from the survey, which showed that no one lender met all thecriteria for choosing a lender.While the client firm came out as leading the market in terms of the most important selection criteria,it was viewed much less favorably against other important factors. The firm received very favorablefeedback about brand image and service; however, these factors were relatively unimportant topotential clients when deciding who to approach for finance.The two segments of the market addressed in the study seemed unaware of the firm's current focus inthe marketplace, possibly due to a series of recent acquisitions and some resulting restructuring.The analysis pointed to opportunity to build on the firm's reputation by improving communicationwith the market. As a result, the firm adopted a strategy, which saw a single point of contact modeladopted.A follow-up study one year later indicated significant progress had been made.12
FAROUT Summary
Figure 7.4 Competitive positioning analysis FAROUT summary

Future orientation—Medium to high. Competitive positioning analysis identifies future strategies toimprove competitive position.Accuracy—Medium to high. Accuracy of the final strategies drawn from the analysis will depend onthe accuracy and comprehensiveness of the information gathered. This may range from medium tohigh, depending on circumstances. Statistical research and publicly available financial informationshould increase accuracy. Primary information or word of mouth sources may be less accurate.Resource efficiency—Medium to high. Where the work of gathering information is divided up intomanageable portions, the process should not be a drain on the firm's resources.Objectivity—Medium to high. The objectivity of the final strategies drawn from the analysis may becompromised by internal biases if carried out by firm staff. Objectivity should be higher where athird party is involved in the analysis.Usefulness—High. Competitive positioning analysis should provide practical insights about thenature of an industry or market and opportunities available in it.Timeliness—Medium. The implementation of competitive positioning analysis should be a simpleprocess once the project has been designed.
Related Tools and Techniques
BCG growth/share portfolio matrixBenchmarkingCompetitor analysisCustomer segmentation analysisFinancial ratio and statement analysisGE business screenIndustry analysisProduct line analysisSupply chain analysisSWOT analysisValue chain analysis
References

Aaker, D. (2001). Developing Business Strategies, 6th edition. New York, NY: Wiley.Brown, L. (1990). Competitive Marketing Strategy. Melbourne: Nelson.Fleisher, C.S, and Bensoussan, B. E. (2003). Strategic and Competitive Analysis. Prentice Hall,Upper Saddle River, N.J.Gantz Wiley Research. "Competitive Positioning Study Capital Mortgage Lender,"www.gantzwiley.com. Accessed June, 2006.Ghemawat, P. (1999). Strategy and the Business Landscape: Text and Cases. Reading, MA:Addison-Wesley.Louden, T.L (1991). "Take time out for competitive positioning," Health Industry Today, Marchissue.Trout, J. (1969). "'Positioning' is a game people play in today's me-too marketplace," IndustrialMarketing, 54(6), pp. 51–55.
Endnotes
1 Trout, J. (1969).2 Brown, L. (1990).3 See Fleisher and Bensoussan (2003), Chapter 4.4 See Fleisher and Bensoussan (2003), Chapter 5.5 Louden, T.L. (1991).6 Ghemawat, P. (1999).7 See Fleisher and Bensoussan (2003), Chapter 9.8 Aaker, D. (2001).9 See Fleisher and Bensoussan (2003), Chapter 8.10 See Fleisher and Bensoussan (2003), Chapter 11.11 Louden, T.L. (1991).12 Adapted from "Competitive Positioning Study Capital Mortgage Lender," published by GantzWiley Research.

8Business Model Analysis
Short Description
A business model has been defined as the "core logic by which a firm creates customer value."Organizations that take leadership positions in their industries succeed by having an outstandingbusiness model and executing it masterfully.Business model analysis (BMA) provides the tools to quantify the relative strength of anorganization's business model to generate economic rents from a product or service. It acts as the linkbetween the social domain, where economic rents are generated, and the creative domain, whereproducts and services are conceptualized. With a detailed examination of the components of thebusiness model, the analyst can determine what in particular makes one business model superior toanother, thus creating an effective understanding of the linkage between rents and the raw product orservice. However, a business model cannot exist in isolation and must be viewed thorough the lens ofcompetition; it is in this analysis that the superiority of one model over another may be established.The elements of the business model for companies to consider are the following:
The value proposition in the positions it adopts.The market segments it chooses to serve or avoid.Its value chain and the resulting costs from the activities it performs or the resources it employs.Its revenue model (or models) and the resulting profit potential.Its position and strength in the larger upstream and downstream value network, includingcompetitors and complementors.Its competitive strategy and how it seeks to gain a sustainable competitive advantage.
Understanding the elements of a model at a detailed level allows a firm to change it to potentiallygenerate larger economic rents, disrupt competitors, or to use it to competitive advantage.This analysis integrates the concepts of the value proposition, market segments, value and extendedvalue chains, revenue models, value migration, disruptive innovation, competitive strategy, andeconomic value.
Background
Business models have existed since humans first traded goods in barter and have evolved to providethe means to deliver and capture superior customer value. The oldest model still used today is theshopkeeper model. It involves setting up shop where customers are likely to be and displaying a goodor service for sale.Business models evolved from the "single-celled" shopkeeper model to more readily delivercustomer value and capture revenue. Such "multi-celled organisms" can be observed with tied

products, such as the razor and blades model attributed to King C. Gillette, where the razor is sold ata low price and the blade is sold at a significant premium. This model is used today to sell not onlyrazors and blades, but also items such as ink jet printers/cartridges and cell phones/air time. Othermodels leverage consumer density to deliver value—the telephone is an example of a networkefficiency model where the value provided to customers increases with the number of subscribers.Other well-known models include a subscription business model, trade associations, co-operatives,and franchises, which all may be classified as "collective" business models.The old style auction has embraced technology and is now conducted online with providers likeeBay, resulting in an immense increase in the number of potential buyers.But these models, if carefully considered, describe more how a firm will generate revenue—there isno market segmentation inherent in them.Other examples of recent business model innovations are: McDonald's in the 1950s with their"Speedee Service System" for hamburgers; Toyota with its introduction of a sub compact, the Datsun,to the North American market at a time when American cars were big; and Wal-Mart in the 1960s,which provided branded high-quality products at discount prices in small towns. The 1970s saw newmodels from Toys "R" Us, which disrupted existing toy departments and discount department stores.The 1980s saw Dell and Intel introduce their business models, and in the 1990s, we had eBay andAmazon.New business models are being introduced with great frequency, such as the technology of voice overInternet protocol (VOIP or voice over IP), which delivers telephone calls using the Internet, andthreatens traditional telephone companies and their associated business models. Numerous carriersare competing for VOIP business offering to carry voice calls across the Internet for a fraction of thecost of the traditional switched networks. However, as magical as this technology seems, itswidespread implementation will only succeed when a firm leveraging this technology as a disruptiveforce adopts a viable model. These introductions represent more than just the emergence of newcompetitors—the new concepts and new technologies embodied in these models will disrupt existingbusiness.The examples discussed previously represent only a small sample of well-known business modelsand represent a fraction of those in use today. Each successful new model has found a way to delivergreater value to customers and, equally importantly, successfully capture that value for the firm.Business models are not static constructs but undergo frequent changes in response to competition, themacro environment, and the introduction of new models.The end of the twentieth century saw the rise of business models that leveraged technology offered bythe Internet. These dot-coms were virtual companies, many existing only in cyberspace. Othersfollowed what was known as a "bricks and clicks" model. Companies that used the bricks and clicksmodel had a physical location but looked to the Internet as another channel to generate sales.The twenty-first century ushered in the "dot-com bust," where thousands of companies that describedtheir business model as being "Internet-based" simply ceased to exist, in turn losing billions ofdollars in venture capital. The pundits and the media told us that the old rules did not apply to thesedot-coms. Stock valuations with price to earnings multiples that were unheard of 10 years previouslywere okay because of the rules of the "new economy." Critical examination of the models of"Internet" companies was often poor, with attempts at separating the "model" from "strategy." In fact,there was no alchemical transmutation to change the laws of business. The pundits were wrong! Untilthe dot-com bust of 2000/2001, the term "business model" was poorly understood and poorly applied.Since then, academics and researchers have worked to understand, analyze, and clarify the definition

of business models and study their respective components.
Strategic Rationale and Implications
The dynamism of the business world must be translated to the model for a firm to remain in aleadership position. Technology disrupts existing businesses, markets, and the macro environment.New business models are a source of disruption as well. These disruptions can be harmful not only toexisting firms, but to entire industries and even nations. The model a firm uses must adapt to meet thechallenge of competition and the opportunities and threats posed. It must also provide the means for afirm to act on opportunities and leverage strengths. A superior business model will allow the firm tomaintain or gain a leadership position in its industry, while an inferior model can spell disaster—hence, it is imperative to understand the relative strengths and weaknesses of the firm's own businessmodel through the lens of competition.This analysis allows the firm to determine its value proposition, targeted market segments, valuechain, relative position in the value network, and revenue model and place it in a superior position todeliver value to the customer. The firm can determine if it has a temporary or sustainable competitiveadvantage with its model and if the model lends itself to delivering factors critical to the firm'ssuccess. Moreover, the same analysis applied to a competitor's model will provide a broadunderstanding of the competition's strengths that can be neutralized and weaknesses that can beleveraged.
The Business Model
Definitions of business models range from "an organization's core logic for creating value" to "a storythat explains how an enterprise works." Some researchers consider how the pieces of a business fittogether, but these approaches typically lack the critical aspects of strategy, which considerscompetition. Others view the business model as the missing link between strategy and businessprocesses. Alan Afuah1 provides a more complete definition of a business model, as follows:
"A business model is the set of which activities a firm performs, how it performs them, andwhen it performs them, as it uses its resources to perform activities, given its industry to createsuperior customer value and put itself in a position to appropriate that value."
There is, however, no real consensus of what a business model and its components are. The purposeof every business is to satisfy a customer's need. This can only be done by looking at the businessfrom the outside—from the point of view of the customer and the market.Chesborough and Rosenbloom2 proposed the definition of a business model as a link betweenproducts, services, and economic rents earned by the firm utilizing the model. They propose that abusiness model incorporates the following six elements:
1. 1. Value proposition—The value of the product or service from the customer's perspective andhow the product addresses customer's needs.
2. 2 . Market segment—With the recognition that consumers in different segments have diverse

needs and will value the product or service in distinct ways, the value may only be unlocked ifthe right segment is targeted.
3. 3 . Value chain and cost models—This is the structure required to create and distribute theproduct or service and the resulting cost models from performing activities and utilizingresources to deliver its value proposition to its target market.
4. 4. Revenue models—The revenue model and resulting profit potential.5. 5 . Value network—This is the firm's position in the chain linking upstream and downstream
activities to the final consumer of the product. It should include suppliers, competitors,complementors, and other downstream activities.
6. 6. Competitive strategy—How the firm seeks to gain a sustainable competitive advantage.
Figure 8.1 defines the various elements of a business model and how they fit together. It considerscompetition, or the relative ability and activities of the firm to create and deliver superior value insatisfying a customer need or want, and it should justify the financial capital needed to realize themodel.Figure 8.1 The Business modelSource: Adapted from Chesborough and Rosenbloom. "The role of the business model in capturingvalue from innovation: evidence from Xerox Corporation's technology spin-off companies,"Industrial and Corporate Change, Volume 11, Number 3, pp. 529–555.
Chesborough and Rosenbloom contrast the business model to strategy and suggest that there are threedistinctions, as follows:
1. 1. A business model's focus is on creating and capturing value. It seeks to define how that valuewill be created and the structure and method by which it will be captured. The strategic layergoes further by attempting to define how a firm seeks to generate a competitive advantage.
2. 2. A business model is a construct for converting the product or service into economic value, butit does not consider how to deliver that value to the shareholders that must be considered by thestrategic layer.
3. 3. Strategy depends on knowledge of the wider environment the firm is to operate in. Thebusiness model does not require such knowledge and requires only a limited understanding of itssurroundings. From a practical perspective, the business model needs to understand its targetmarket and the web that makes up its value network.
Classification of Business Models

Business models occur in an inestimable variety of shapes and sizes: One small disparity betweentwo models—for example, with the target market and the value proposition—and they becomesubstantially different. Extensive research has been directed at classifying the vast array of existingbusiness models. With the boom of the Internet economy, one focus has been classifying models thatuse the Internet; another has attempted to determine if one business model sharing a set of commoncharacteristics is superior to another.Two general approaches to model classification can be found. The first approach attempts to grouplike models based on a set of shared characteristics. The resulting structure is most often a two-dimensional construct: with position in the value chain, source of revenue, core profit-makingactivities, pricing policy, value integration, degree of economic control, and others being consideredalong x and y axes. Following are two examples of such schemes.Timmer's3 11 e-business models use the degree of innovation and the degree of integration as thecharacterizing dimensions, describing architecture for the product, service, and information flows.Linder and Cantrell4 propose a classification scheme based on a model's core profit-making activityand its relative position on the value chain. Linder and Cantrell's scheme is broader in scope anddoes not limit itself to e-models.In determining the superiority of one business model concept over another, Linder and Cantrellconcluded there is "no silver bullet," and one model in their classification system was not superior toanother. Researchers from MIT classified models based on the type of asset and the rights to the assetbeing sold. Their classification and analysis of the 1000 largest U.S. firms along those dimensionsstate, "some business models do indeed perform better than others." The results from researchers aremixed; however, we do know some firms consistently produce better results than others in the sameindustry—for example, Southwest in the airline industry and Bristol Meyers Squibb in thepharmaceutical industry. In general, the profitability of a firm is determined by both firm- andindustry-specific factors.Figure 8.2 E-business modelsSource: Adapted from Timmer's Classification Scheme (1998).
Figure 8.3 Operating model frameworkSource: Adapted from Linder, J., and S. Cantrell (2000), "Changing Business Models: Surveying theLandscape," Accenture Institute for Strategic Change.

BMA provides a means for bridging the gap between a firm's prosperity and its products andservices. For some firms, familiar business models cannot be applied, and new models must bedevised. Adapting the models themselves serves to change the economic value of the products orservice. In fact, changing any one of the elements of a model serves to change the economic rentderived from the good or service. Take, for example, the segment served in the airline industry—thebusiness traveler versus the tourist. Consider the activities in that value chain and the costs and therevenue-generation models. Continental and Southwest have different structures in their value chain,yet they basically start with the same raw material. Their revenue generation models differ. Theyoccupy the same location in the value chain. The various parts of the value net have differing abilityto generate economic rents; for example, suppliers of aircraft based on the forces at work in thatsegment of the value net capture a differing level of economic rent from air travel than the airlinesthemselves. In order to generate superior rents, the organization must create superior value and avoidcommoditization of its supply chain and distribution network to prevent value migration. Finally,competitive strategy determines how a firm creates a competitive strategic advantage over rivals. Asuperior business model will also ensure the value the firm appropriates from the customer is greaterthan the costs of the activities undertaken, resources employed, and positions adopted in deliveringthat value.BMA provides a holistic framework to combine all the activities of the firm in the pursuit ofcompetitive advantage and to maximize the value delivered to the targeted customer. It then becomespossible to deliver superior value propositions to the target market and receive higher prices for theproduct or service delivered.The Dow Jones Industrial Average (DJIA) was introduced in 1896 to create an index from theleading firms of the day. Only one firm has survived to this day—General Electric. The mortality offirms is well understood, estimates for first-year failure is an astonishing 70–80%; however, moreinteresting is the fall-out rate from the S&P 500 and the Fortune 500, which is estimated to bebetween 2–6%. This effectively means that between 10 and 30 companies depart their leadershippositions every year. Innovative business model introductions have caused the disruption ofestablished firms. Kmart, whose business models sustained it for 103 years, filed for Chapter 11bankruptcy protection early in 2002. Railroads, which were the basis of the Dow prior to the turn ofthe twentieth century, are minor players today. They saw their value migrate to other forms oftransportation and their value proposition diminish along with their leadership positions.

In 1994, Japan had 149 corporations listed in the Global 500 with $3.8 trillion in total revenue; thisfell to 82 corporations with $2.2 trillion in total revenue in 2004. This indicated that the businessmodels they employed no longer allowed them to occupy leadership positions. In the same timeframe,1994 to 2004, the total revenue generated by the Global 500 increased from $10.3 trillion to $14.9trillion. The inability to adapt business models to changing competitive and macro-economicconditions can spell disaster for firms, industries, and nations.As a result of this history, there are two subtly distinct philosophical directions regarding businessmodels. Christensen and Raynor5 focus on technological evolution disrupting business models.Mitchell and Coles6 suggest, "Improved business models will replace technology as the most frequentand most powerful source of business disruptions." This is a powerful proposition—where thebusiness model itself becomes a competitive weapon. It stands to reason that the ability to modify orconstruct a business model to disrupt competitors and avoid disruption can provide a significantadvantage to a firm.BMA will determine the viability of any business model for any type of concern, including thoseorganizations using multiple business models. Those organizations that do engage multiple modelswill benefit by understanding which part of their business is driving revenue and which models needimprovement. Additionally, conducting a BMA will allow a firm to understand its weaknesses andextend its advantages. BMA may also be used to disaggregate a competitor's position and understandwhere it is most vulnerable.
Strengths and Advantages
Comprehensive
BMA verifies the relationship of the firm's model—that is, its strategy, positions, activities, andresources—to the larger macro-environment, the industry, and its competitors. The value deliverymechanisms of the firm and their interaction with the customer and the environment are made evidentwith this analysis. BMA provides a comprehensive approach beyond strategic and operationaleffectiveness in describing why a firm is profitable or unprofitable.
Detailed Understanding
BMA allows a detailed understanding of the advantages and disadvantages of the firm's valuedelivery systems. This understanding makes it possible to modify part or all of a business model tocreate a competitive advantage. Those firms employing multiple models in multiple industries canquantify their relative strengths.As a corollary, it is possible to examine the relative position of competitors by using BMA and to usethe insights from this analysis to disrupt their business models.

Integration of Value Delivery Mechanism
BMA delivers the ability to integrate the value delivery mechanism of the model and charge superiorprices for the value delivered. This in turn will lead to maximizing revenue generation andconsequently increased profitability for the firm being analyzed.
Innovation
BMA can provide an impetus to innovate within the organization, either with the model itself, theservices and products that the firm provides to customers, or along any dimension of the valuedelivery mechanisms of the firm. Identification of advantages at the target firm or identification ofcompetitor weaknesses could enhance the innovation process.
Weaknesses and Limitations
Disruption from Outside the Industry
Firms may become blind to rivals offering innovative solutions or to those companies that are notconsidered direct competitors—this is a position detailed by Christensen and Raynor7 as the primarymeans of business disruption. Firms must then consider not only direct competitors, as emphasized inthis analysis, but must also avoid being blindsided by firms and industries that are not considereddirect rivals.
Innovation
Although this technique may be used to correct business model inconsistencies, it does notnecessarily provide the means to innovate and consequently to provide additional value to customers.If a firm defines its leadership position too closely with that of current rivals, it may become afollower by adopting models that are easily duplicated.
Market Orientation
This technique will only be useful to a firm that has a market orientation. It is irrelevant for a firm thatis producing a product and trying to sell it by targeting a heterogeneous market with a homogeneousmarketing strategy.
Process for Applying the Technique
Step 1: Articulate the Value Proposition
Value is determined by the customer—the firm needs to define the product or service it will provideand the forms in which a customer may use it. The value proposition will change depending on thetarget market specified, and there may be an iterative process between Steps 1 and 2, with a differentproposition specified for each target segment.The firm, through its value proposition, may choose to position its products or services as low cost,differentiated, or niche-focused.Low-cost provider strategies work best in cases where:
Price competition is especially vigorous.Competitive products are essentially identical.There are few ways to achieve product differentiation that are meaningful to buyers.Buyers incur low switching costs.Buyers are large and have significant power to bargain down prices.
Differentiation allows a firm to command a premium price for its product and/or increase unit sales.A firm can employ several differentiation themes; these can be based on product features, althoughthey are the easiest for competitors to copy. Differentiation themes that are difficult for competitors tocopy can provide a sustainable competitive advantage. Bases for differentiation that are moredifficult to imitate include the following:
Brand name or reputation. Coke, for example, is the best-known brand in the world.Where the good or service is available. An extensive and well-configured distribution networkmakes the product widely available to customers.Extreme positioning in levels of quality or delivery—a six-sigma or beyond level of quality maybe difficult to imitate.
The situation may be complicated by the fact that a firm supplies multiple products or services, andthe question is whether the firm is operating multiple models or a single model.Consider the case of a bicycle shop: The basic business of this shop is to retail bicycles, accessoriessuch as clothing, and bicycle parts, and to service bicycles. Bicycle service may account for 35–50%of revenue. Should this bicycle shop be considered two distinct businesses, a service business, and aretail business? Or is it a single business model with a sustainable competitive advantage in serviceover an online retailer who sells bicycles and accessories? What about General Electric, which is inthe business of supplying power systems as well as aircraft engines? The technology in these twoindustries may well be transferable, partially answering the question: "Why are we one business?"However, the question of disaggregating a business model is best answered from a customer's

perspective. A customer for a bicycle would definitely consider how their bicycle would be servicedwhen making their purchase decision.The customer, in defining value, also provides guidance in the consideration of models. If thecustomer sees the business offering as a whole, the separate activities undertaken by a firm should beconsidered as sources of advantage, or where they are not offered, and should be, as sources ofdisadvantage.
Step 2: Specify the Target Segment
Unless the firm is a very specific niche player, it may serve multiple segments of the market, and itmay need to specify the changing propositions for each segment it chooses to serve and from whom itwill derive economic rents. Quite often, a business provides more than one service or product; ourbicycle shop, for example, provides bicycles, clothing, accessories, and service. For somebodyseeking to purchase a new bicycle, these may be viewed as a bundle of services offered by the wholefirm, and the proposition presented to them may be quite different than to an individual alreadyowning a bicycle who wishes to have it serviced.Segments can be broken down broadly by: (a) customer characteristics unrelated to the product,generally known as demographics (i.e., geographic span, socioeconomics, etc.); and (b) productand/or service-related approaches that define user types, usage, and benefits generally known aspsychographics. The analyst should pursue a detailed analysis of each market segments served by thefirm—additional examples of segmentation bases are widely available8—and tie the valueproposition to customers who may desire different aspects of the product or service.The objective is that customers' needs must be understood, along with their growth potential; forexample, with airline flights, business consumers demand frequent, inexpensive flights with minimaldelays, no lost baggage, and polite courteous service. If a customer's needs are not well understood,analytical tools using customer focus groups, Kano model analysis, or quality function deployment(QFD) may be especially useful.
Step 3: Determine Competitors
A firm exists within its industry because it serves those customers who see its value proposition assuperior to its competitors. Typically, firms serving the same customer segments with the sameproduct or service are perceived as "the competition." These firms will occupy a similar positionalong the industry value chain and may have similar resource characteristics. However, there may befirms that provide substitute products; companies that operate in niche markets; and suppliers orcustomers that have a credible threat of forward or backward integration. Firms that cause companiesto forfeit their leadership positions are rarely obvious and do not attempt to compete directly againstestablished rivals; instead, they find new ways to deliver value to customers. Firms often surrendersegments that have become unprofitable due to commoditization and later discover that those samecompetitors have moved up the experience and learning curves and now threaten another segment.Interviews with customers and sales staff and systematic, regular competitor analysis conducted bythe firm will help identify current and future competition.

The analyst, after determining who the competitors are, will need to articulate the value propositionsof those competitors and the target markets served by those firms.
Step 4: Evaluate the Value Chain and the Cost Model
With the ultimate goal of delivering value to, and capturing economic value from, the customer, it isimperative that the value chain be understood. To deliver the right value to the appropriate marketsegments, price it correctly, and position itself properly, a firm must undertake a specific set ofactivities. Using value chain analysis,9 these activities can be analyzed to identify which step or stepsprovide economic advantage.A value chain identifies a series of activities that must be undertaken to transform inputs into aproduct or service delivered to customers. Figure 8.4 identifies the activities of a classic value chain.Figure 8.4 Classic value chain
On the other hand, a customer-focused activity value chain (AVC) emphasizes the activities that afirm engages in to learn about customer's needs and the work required with customers in design,development, delivery testing, and installation of the product or service. This type of value chain isbetter suited to firms that provide intangible products or services. The two value chains arecomplementary, and both may be used.Figure 8.5 Activity value chainSource: Adapted from Fahey, L. (1999). Competitors. New York, NY: John Wiley & Sons, p. 175.

The classic value chain facilitates an overview of what a firm does to access suppliers, itsmanufacturing, and service. A firm will pursue activities and employ resources to achieve its desiredposition and, as a result, will incur costs. Value chain analysis allows the analyst to determine thecurrent advantage or disadvantage of the firm along each segment of the value chain and the resultingcost structure. The customer-focused AVC, on the other hand, identifies all the direct and indirectinteraction with customers.Conduct a classic value chain and/or AVC analysis of the target firm. Compare the two value chainsto the firm's direct competitors, as determined from competitive positioning analysis. Firms that arecompeting using radically different positions may not pursue similar activities. Add the dimension oftime to the value chain and AVC for both direct competitors and the target firm if appropriate. Usethis analysis to extract where the firm has a competitive advantage or a competitive disadvantage.The time dimension should also include an understanding of experience curve effects.For the business model being analyzed, determine which resources a firm is leveraging to delivervalue to the customer. The resources may be tangible, such as plant and equipment, or intangible, suchas patents, brands, or copyrights. They can be human, structural, or based on R&D. A firm's ability toturn its assets into customer value for different market segments is part of its competence orcapability.Using the six asset categories identified in Figure 8.6, evaluate the assets the firm is using. Theanalyst should look beyond the firm's own assets; it is not necessary for a firm to control or own theassets it leverages in pursuit of its model. Alliances, relationships, and networks may provide anorganization with a competitive advantage by using assets that are owned or controlled by anotherentity. Assets vary between the following five attributes:Figure 8.6 Asset categoriesSource: Adapted from Fahey, L. (1999). Competitors. New York, NY: John Wiley & Sons, p. 300.

Availability—Not all assets are equally available; capital, for example, is not available inunlimited quantities.Specificity—An asset is specific to place, time, and space. An asset physically located in NorthAmerica may provide little to no advantage in the Chinese environment. The range of applicationtechnology is typically limited; for example, technology designed to improve the hardness ofrubber tires cannot suddenly be used in electronics.Sustainability—Performance, for example, can increase the stock of capital available, and poorquality may diminish the brand of the firm.Replicability—Organizational culture, knowledge, and other attributes may be difficult toreproduce. These may provide a source of great competitive advantage.Substitutability—Can a given asset be trumped by another asset, thus reducing the value of thatasset?
Step 5: Evaluate the Value Network
It is important to consider the value the firm is capable of capturing in its extended value chain or itsrelative position to its customers, suppliers, and rivals. The relative positioning of a product orservice is critical. If a firm produces a product or service that it can supply to only one customer, itwill be in an inferior position as its customer will have significant bargaining power.A firm may have developed a value network that is capable of competing in dimensions where it hasnot been able to before; for example, Sony, to compete in the game console market, establishedrelationships with both IBM and Toshiba to produce multi-core processor architecture for Playstationin order to compete with the Microsoft-Intel team, who had a clear lead in technical expertise.This value network analysis should include suppliers, customers, complementors, and competitors.
Step 6: Determine the Revenue Model for the Firm
The ability to appropriate value will depend on the revenue model the business uses. Examples are: asubscription model commonly used with magazines; fee for service commonly used by realtors andagents; direct sales to end users; and so on. It is important to ensure that revenues are greater thancosts. Analysis of the firm's and competitors' financial statements over time will reveal if the targetfirm enjoys an advantage over its competitors.The revenue model should describe each revenue stream and how each stream brings in revenue; forexample, a newspaper may have streams from direct newsstand sales, paper box sales, subscription,advertising, classifieds, and the Internet, and each of these revenue streams will incur a different cost.The evaluation of the revenue model should include an understanding of price compared to thecompetition, the value proposition, product quality, service, and the value customers perceive in themodel.The analyst should also be able to determine if the revenue/cost model at this stage is superior to thatof the competition and is likely to produce better profits. The key here is also profit potential, and thismay be determined from actual financial results, although they can be misleading if viewed from apoint in time—a firm may not have matured and may be in its startup stage; the more importantmeasure then becomes profit potential.
Step 7: Determine the Critical Success Factors for the Industry
Critical success factors (CSFs) are a limited set of aspects that are necessary to secure and gain acompetitive advantage. CSFs represent those areas that are critical to a firm's success, providing adirect link to organizational performance (see Chapter 3, "Avoiding Analytical Pitfalls").John F. Rockart10 defined four basic sources of CSFs, as follows:
Specific industry characteristics—The airline industry, for example, must provide frequent,on-time flights to successfully target business customers.Those arising from the chosen strategy of the business—High level of technical service is animportant factor for companies seeking to differentiate themselves in the welding industry.Environmental characteristics or those resulting from economic or technological change—For example, a telecommunications firm taking advantage of deregulation in the industry.Those arising from the internal needs of the firm—An organic structure may be critical to afirm that has to compete in a highly innovative environment.
Critical success factors that relate to position, activities, resources, and costs will be used todetermine the strength of the business model. Sources that may be useful in determining CSFs aremanagement tools such as the balanced scorecard and benchmarking. Other tools, such asenvironmental analysis, industry structure analysis, internal analysis, competitor analysis, or usingindustry and business experts, are other sources for determining CSFs.
Step 8: Complete an Analysis Grid Detailing Each Element of theBusiness Model

The objective of this analysis is to detail where in its business model a firm is capable of producing asuperior result. To complete the analysis, each element of the business model is placed in a grid, asshown in Table 8.1. Each element is ranked from 1 to 5 (superior) for the target firm and itscompetitors on an analysis grid.Table 8.1Business Model Analysis Grid
This grid should, at a glance, allow the analyst to determine which part of the business model issuperior or inferior to its competitors.Ultimately, the strength of firm's business model will be determined by its ability to convert theproduct/service domain to economic rents for the firm. The true value of this analysis lies in theability of the firm to achieve a detailed understanding of the components of its business model and tomake improvements in components of the model design. The firm may find ways to innovate along itsrevenue model, its value chain, or some other element, or disrupt its competition and generate greatereconomic rents. Because business models are not static constructs, the analyst will find it useful togenerate both a current state and future state analysis and to review the analysis on a regular basis.
Case Study: Dell Computer and the Printer Market
Dell Computer has been the darling of the personal computer industry, gaining market share—reported at 18.2% of all units shipped worldwide in 2004—and reporting revenue growth in doubledigits, outstripping its rivals year after year. Dell is a competitor to IBM, HP, and other firms, notonly in computers but also in areas such as printers, storage, handheld devices, and increasingly inconsumer electronics.Dell has entered the low-end printer business using its direct model and threatens market leader HP.Can Dell's printer model propel it to success, allowing it to capture sufficient market share to disruptHP?Dell's competitors in the printer market are HP (the market leader), Epson, Lexmark, and Canon. HPby far has the largest share, with 60% of the existing market, Epson has 16% and Lexmark 12%. Dellhas approximately 3% of the current market, selling a small number of printers to businesses while itsmost active market is the home consumer market. HP excels at R&D, rolls out new product lines toremain competitive, and expects to introduce digital printing, which could save corporations up to30% in costs each year. HP earns 70% of its profits from sales of ink and printers.Low-cost, high-quality, easy to use, readily available products win in the marketplace, and printersare no exception. However, innovative new printers that produce better pictures, use multimedia
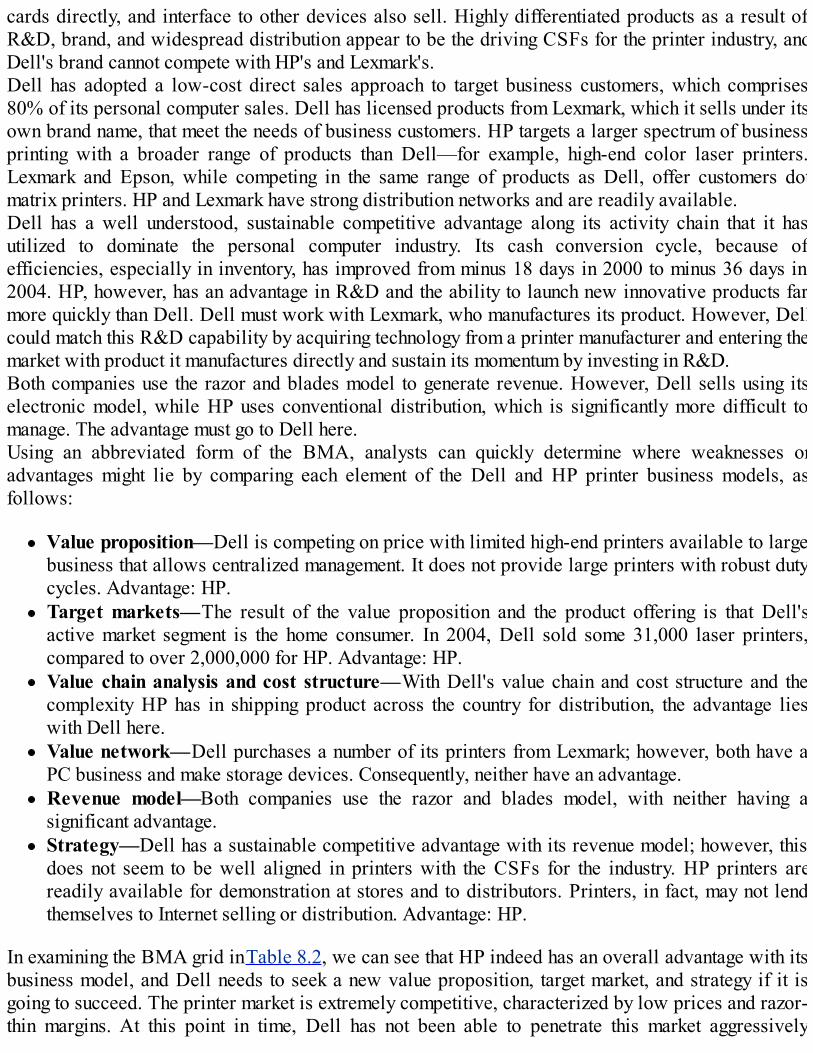
cards directly, and interface to other devices also sell. Highly differentiated products as a result ofR&D, brand, and widespread distribution appear to be the driving CSFs for the printer industry, andDell's brand cannot compete with HP's and Lexmark's.Dell has adopted a low-cost direct sales approach to target business customers, which comprises80% of its personal computer sales. Dell has licensed products from Lexmark, which it sells under itsown brand name, that meet the needs of business customers. HP targets a larger spectrum of businessprinting with a broader range of products than Dell—for example, high-end color laser printers.Lexmark and Epson, while competing in the same range of products as Dell, offer customers dotmatrix printers. HP and Lexmark have strong distribution networks and are readily available.Dell has a well understood, sustainable competitive advantage along its activity chain that it hasutilized to dominate the personal computer industry. Its cash conversion cycle, because ofefficiencies, especially in inventory, has improved from minus 18 days in 2000 to minus 36 days in2004. HP, however, has an advantage in R&D and the ability to launch new innovative products farmore quickly than Dell. Dell must work with Lexmark, who manufactures its product. However, Dellcould match this R&D capability by acquiring technology from a printer manufacturer and entering themarket with product it manufactures directly and sustain its momentum by investing in R&D.Both companies use the razor and blades model to generate revenue. However, Dell sells using itselectronic model, while HP uses conventional distribution, which is significantly more difficult tomanage. The advantage must go to Dell here.Using an abbreviated form of the BMA, analysts can quickly determine where weaknesses oradvantages might lie by comparing each element of the Dell and HP printer business models, asfollows:
Value proposition—Dell is competing on price with limited high-end printers available to largebusiness that allows centralized management. It does not provide large printers with robust dutycycles. Advantage: HP.Target markets—The result of the value proposition and the product offering is that Dell'sactive market segment is the home consumer. In 2004, Dell sold some 31,000 laser printers,compared to over 2,000,000 for HP. Advantage: HP.Value chain analysis and cost structure—With Dell's value chain and cost structure and thecomplexity HP has in shipping product across the country for distribution, the advantage lieswith Dell here.Value network—Dell purchases a number of its printers from Lexmark; however, both have aPC business and make storage devices. Consequently, neither have an advantage.Revenue model—Both companies use the razor and blades model, with neither having asignificant advantage.Strategy—Dell has a sustainable competitive advantage with its revenue model; however, thisdoes not seem to be well aligned in printers with the CSFs for the industry. HP printers arereadily available for demonstration at stores and to distributors. Printers, in fact, may not lendthemselves to Internet selling or distribution. Advantage: HP.
In examining the BMA grid in Table 8.2, we can see that HP indeed has an overall advantage with itsbusiness model, and Dell needs to seek a new value proposition, target market, and strategy if it isgoing to succeed. The printer market is extremely competitive, characterized by low prices and razor-thin margins. At this point in time, Dell has not been able to penetrate this market aggressively

because of issues with its positioning, active market segments, and strategy.Table 8.2Business Model Analysis Grid—Dell Versus HP
FAROUT Summary
Figure 8.7 Business model analysis FAROUT summary
Future orientation—Medium. BMA provides a medium orientation, giving the target firm acomprehensive view of its own business model and its integration with the industry and macroenvironment. This integrated forward-looking view is mitigated by the erosion of customer value bypotentially superior competitor offerings, or disruptive industry forces.Accuracy—Medium. While the analysis is somewhat subjective, its accuracy is determined by theaccuracy and skill of the analyst. This has been rated as "medium" but, depending on the quality of theanalyst, this can vary.Resource efficiency—Medium to high. Analysis of a firm can be completed rapidly; the researchrequired and the complexity of tools used are limited. Medium-high resource efficiency should beexpected.Objectivity—Medium. The detailed nature of the analysis, while allowing for some subjectivity,forces structure on the analyst.Usefulness—Medium to high. The analysis provides a comprehensive view of the business modeland an opportunity to correct model irregularities and attack competitor's weaknesses.Timeliness—Medium. Analysis can be completed readily but contingent on the detail required; incontrast to other analysis techniques, this is high.
Related Tools and Techniques
Activity value chain analysisCompetitor profilingCompetitor segmentation analysisCustomer value analysisFinancial ratio analysisFunctional capability and resource analysisIndustry analysisKano model analysisQuality function deploymentSTEEP analysisStrategic funds programmingStrategic group mapsValue chain analysis
References
Aaker, D. (2005). Strategic Market Management. Hoboken, NJ: John Wiley & Sons.Afuah, A. (2004). Business Models: A Strategic Management Approach. New York, NY: McGraw-Hill Irwin, pp. 3, 5, 12, 173–209.Chesbrough, H., and R. Rosenbloom (2002). "The role of the business model in capturing value frominnovation: Evidence from Xerox Corporation's technology spin-off companies," Industrial andCorporate Change, Volume 11, Number 3, pp. 529–555.Christensen, C.M., and M.E. Raynor (2003). The Innovators Solution. Boston, MA: HarvardBusiness School Press, pp. 56–65.Drucker, P.F. (2001). The Essential Drucker. New York, NY: Harper Collins.Fahey, L. (1999). Competitors. New York, NY: John Wiley & Sons, pp. 172–205.Fleisher, C.S., and B.E. Bensoussan (2003). Strategic and Competitive Analysis. Upper SaddleRiver, NJ: Prentice Hall, pp. 104–121, 216–219.Hjelet, P. (2004). "The Fortune Global 500," Fortune, July, p. 160.Langdon, M. (2003). "Business Model Warfare: A Strategy of Business Breakthroughs," InnovationsLabs white paper, Ackoff Center for the Advancement of Systems Approaches, University ofPennsylvania.Linder, J., and S. Cantrell (2000). Changing Business Models: Surveying the Landscape, AccentureInstitute for Strategic Change (www.accenture.com).Hermes Newsletter by ELTRUN (The eBusiness Center for the University of Athens), October–November 2002, http://www.eltrun.aueb.gr/newsletters/1/18.pdf, p. 1 (referenced July 17, 2004).Mitchell, D., and C. Coles (2003). The Ultimate Competitive Advantage. San Francisco, CA: BerettKoehler Publishers, Inc.National Bicycle Dealers Association, "Industry Overview," http://nbda.com/site/page.cfm?PageID=34 (referenced July 13, 2004).
Quick MBA, "The Business Model," http://www.quickmba.com/entre/business-model/ (referencedDecember 11, 2005).Osterwalder, A. (2004). "The Business Model Ontology" (PhD. thesis),http://www.hec.unil.ch/aosterwa/PhD/ (referenced October 19, 2004).Rockart, J.F. (1979). "Chief Executives Define Their Own Data Needs," Harvard Business Review,March–April, 52(2), pp. 81–93.Stalk Jr, G. (1988). "The Time Paradigm," Boston Consulting Group,http://www.bcg.com/publications/publication_view.jsp?pubID=300 (July 13, 2004).Thompson, A., Gamble, J., and A.J. Strickland (2004). Winning in the Marketplace. New York, NY:McGraw-Hill Irwin, pp. 121–123.Timmer, P. (1998). "Business models for electronic markets," Electronic Markets, 8(2), pp. 3–8.http://www.electronicmarkets.org/netacademy/publications.nsf/all_pk/949.Weil, P., Malone, T., D'Urso, V., and G. Herman (2004). "Do Some Business Models Perform BetterThan Others? A Study of the 1000 Largest U.S. Firms.," http://seeit.mit.edu/publications.asp(accessed July 11, 2004).Wikipedia, the free encyclopedia. "Collective Business System,"http://en.wikipedia.org/wiki/Collective_business_system (referenced October 24, 2004).
Endnotes
1 Afuah, A. (2004).2 Chesbrough, H. and R. Rosenbloom (2002).3 Timmer, P. (1998).4 Linder, J., and S. Cantrell (2002).5 Christensen, C.M., and M.E. Raynor (2003).6 Mitchell, D., and C. Coles (2003).7 Christensen, C.M., and M.E. Raynor (2003).8 See Fleisher and Bensoussan (2003), Chapter 12.9 See Fleisher and Bensoussan (2003), Chapter 9.10 Rockart, J.F. (1979).

9SERVO Analysis
Short Description
The SERVO (an acronym for strategy, environment, resources, values, organization ) analysisframework model is a diagnostic management tool used to build and test a firm's strategic decisionsand initiatives. Analysts examine the interactions and relationships among five critical elements totest the degree of consistency or fit between the firm's current and proposed strategies, itsorganization, capabilities, management preferences, and environment. It is a management tooldesigned to assess and facilitate the process of strategy formulation and implementation within thecontext of both market and organizational change.
Background
An analyst requires a way of organizing his or her thoughts, and conceptual models guide the analyst'sthinking by focusing on the most relevant and important features of a phenomenon underconsideration. Models are especially important in competitive and strategic analytical tasks becausethere are so many factors that need to be considered.The SERVO model detailed in this chapter is a broad, integrative framework that helps the analysthone in on the primary factors that need to be addressed in competitive response and strategydevelopment situations. In addition to being integrative, SERVO allows for a depth of analysis toaddress many strategy development situations. SERVO is similar to other strategy models in terms ofcontent but differs from most of them in that it is structured to emphasize the relationships amongactions or decisions.SERVO is useful for strategic analysis because it can be applied to many different situations and yetdoes not imply that every firm in a specific industry needs to compete in an identical fashion or haveidentical strategies. It attempts to achieve a beneficial balance between both internal (the S, R, V, andO elements) and external (the E element) dimensions impacting strategy. Each of the five elements inthe SERVO model consists of several components that can be analyzed separately and in theirrelationships with each other.The SERVO model explicitly addresses the need to build a tight, strategic fit between strategy, theenvironment, resources, values, and organization.1 Successful formulation and implementation ofstrategy requires explicit management of the interrelationships among the five elements, of whichstructure and strategy—the main focus of much strategy advice during the early decades of strategyliterature and practice—are only two."Fit" is a critical concept in the application of this model. It is a desirable and viable state that holdswhen all management decisions have produced consistency between the firm's resources andcapabilities and the external environment. In other words, better fit leads to better performance;

correspondingly, bad fit results in bad performance. In seeking to produce better fit, analysts try toidentify the managerial decisions that bring about the necessary alignment over both short and longtime frames. This requires that analysts recognize both static and dynamic dimensions of managementdecisions. See Figure 9.1 for a diagram of the "fit" concept.Figure 9.1 Illustration of the "fit" concept
The reality of most organizational situations is that some inconsistencies will nearly always existbetween the elements over time. This occurs because sometimes a firm will seek to pursueopportunities in the environment that put undue strain on it or its resources. At other times, a strategyor value that worked for many years may not hold up to environmental changes. The key for theanalyst is to decide which inconsistencies the firm must strategically address through recommendedactions and which ones it must overlook or accept.Each of the five SERVO elements is important on its own and also in the corporate sense. These fiveelements are discussed in turn next.
Strategy
Among the many formal definitions of strategy, several dominant themes are common. Strategy is theset of competitive decisions and actions made in response to the firm's environment. Strategy aims tobest position the firm's current capabilities and resources to secure competitive advantage over time.Because the firm's environment is constantly in a state of flux, so too must strategy change in order toprotect existing sources of competitive advantage. In addition, strategy must seek out newopportunities and acquire or develop the requisite resources and capabilities to turn ongoingenvironmental changes into new sources of competitive advantage. In sum, an effective strategy willclearly identify the firm's goals and objectives, the product/service and market spaces in which it willcompete, the business activities on which it will focus, the value it will offer to customers, and theapproaches it will use to provide superior offerings to competitors.For the analyst's purposes, strategy within the SERVO model can best be characterized as composedof four elements: the executive team's goals, scope, competitive basis/premise, and business model.These are discussed in greater depth in the following section:
1. 1. Goals—What is the mission of the firm? What is the vision for the firm held by key decisionmakers and employees? What does the firm intend to accomplish vis-à-vis its stakeholders'expectations? What are top management's expectations (both in quantitative and qualitativeterms) with respect to revenue growth, innovation, market share, quality, and profitability?
2. 2 . Scope—What products/services is the firm selling, and which ones would it like to sell?What customers is it aiming to provide value for? What markets will the firm compete in?
3. 3. Competitive basis/premise—In what ways will the firm attempt to beat competitors? Howwill the firm build capabilities or resources to achieve competitive advantage over time?

4. 4. Business model—Is the basic operating structure sound and reflective of appropriate choicesand priorities between in-house and outsourced activities? Is there an economic explanation ofhow the firm can deliver value to customers at a price and cost that yields satisfactoryprofitability? Do the revenues and costs associated with the goals, scope, and competitive basisdemonstrate viability over time?
The focus on strategy within the SERVO model is not necessarily on developing new strategies orprotecting existing ones. Rather, its inclusion underscores a core theme demonstrated in manyapplications of the model that strategy conception and formulation is often done very well in mostfirms. However, inconsistency between strategy and the other more manageable elements (R, V, andO [resources, values, and organization]) are more often the cause of ineffective implementationand/or strategic failure.
Environment
Environment as a larger concept for competitive and strategic analysis is ordinarily classified intoseveral strata. This is done to help reduce the level of complexity facing the analyst, as theenvironment can be simultaneously expansive, complex, dynamic, and ambiguous. Though eachcomponent has the word "environment" in it, there is only one environment with the components beingsimply different stratifications of the larger concept.The first division of the environment is into the external and internal environment. The externalenvironment includes all those things "outside" the legal boundaries of the firm; however, for theanalyst's purposes, it is limited to those decisions (beyond the direct control of executives) made bystakeholders outside the firm that may have a significant impact on the firm's performance. Theinternal environment includes stakeholders, forces, and conditions within the firm. It will include,prominently, stakeholders such as the board of directors, decision makers, and employees, as well asthe business functions, culture, organizational practices, processes, structure, and systems.The environment can also be segmented into several components ordered in terms of proximity to thedaily activities of the business. The internal environment is closest to the business, next is taskenvironment, followed by the industry environment, and, finally, the macro-environment.The task environment typically impacts strategy on a day-to-day basis, involves the specificcompetitive situation facing the business, and is populated by those specific organizations and groupsthat most directly influence the organization's strategy, including customers, competitors, partners, andsuppliers, but it can also include government regulators and labor unions.The industry environment deals with environmental factors and forces, which have the most impact onthe performance of the firm and its competitors. The value chain stretches all the way from the rawmaterials used to produce products/services through to after-sale services and includes connectedcommercial activities in which the industry is ensconced.The macro or general environment is the set of conditions and influences affecting economic activityand is ordinarily outside a typical firm's direct influence. One particularly valuable scheme for theanalyst who needs to further classify the general environment is the PEST/STEEP method.2 Finally,some classifications of the external environment also subdivide the first division geographically,usually by international, trans-national, national, regional, and/or local boundaries.

Resources
Resources are the assets and capabilities a firm uses to generate outputs (that is, goods and/orservices) for the marketplace. One way of classifying resources is to use the value chain,3 a conceptthat shows the linked set of value-creating activities a firm performs. Primary activities, such as rawmaterials acquisition, operations, outbound logistics, marketing and sales, and service, are the value-adding pursuits that best explain the primary business role of the firm. Secondary activities, such ascommunications, human resource management, management information systems, and government andpublic affairs, facilitate and enhance the performance of primary activities.Similar to the environment, analysts also need to reduce the complexity associated withclassifications of "resources." Business resources can usefully be grouped under several categories,as follows:
Financial Resources
A strategy that requires significant investment in new processes or products, distribution channels,production capacity, and working capital can place strains on the firm's financial resources and needscareful financial management. An examination of financial resources should include an assessment ofexisting resources, such as bank overdrafts, bank loans, cash balances, creditors, other loans,shareholders' capital, working capital, and the ability to raise new funds.
Human Resources
A firm's human resources are its skills base. The raw material of competitive advantage frequentlylies in the intangible core competencies and skills of its people. Environmental change (the "E")infers not only a change in strategy but also a change in the skill set of a firm's human resources thatwill act on a new set of key success factors. Successful organizational change often requiresincreased investment to acquire or develop new skills along with reduced investment in theestablished skill set that was more closely attuned to the old business models. This transition towardnew skill sets is a process that, if done poorly, will thwart the cultivation of conditions necessary togrow new organizational skills.When assessing these skills, the analyst must consider the following types of questions:
What skills does the firm already possess?Are they sufficient to meet the objectives of the desired strategy options?Could the skills base be enhanced, enlarged, or stretched to meet the new requirements?
Physical Resources
The category of physical resources covers a wide range of operational assets concerned with thefirm's physical capability to deliver its strategy into the marketplace. Sometimes referred to as plant,property, and equipment (PP&E), they include, among others, the following:
Information technology—Management information systems, information technology assets,databases, and integration of systems across the firm.Production facilities—Location of existing production facilities, capacity, investment andmaintenance requirements, current production processes, and particularly their quality, method,and organization. Ultimately, the analyst examining this area must consider the extent to whichproduction requirements of the strategy can be delivered by existing facilities.
Intangible Resources
It is easy to ignore the intangible resources of a business when assessing how to deliver a strategy—but they can be crucial. Prominent intangibles the analyst must consider include the following:
Brands—Strong brands are often the key factor as to whether a growth strategy is a success orfailure.Goodwill—The difference between the value of the tangible assets of the business and the actualvalue of the business (what someone would be prepared to pay for it).Intellectual assets (capital, property)—Key commercial rights protected by copyrights,patents, and trademarks may be an important factor in the firm's strategy.Reputation—The collective representation of the firm's previous actions and results thatdescribe its ability to deliver valuable and valued outcomes to stakeholders.
Values
To understand values, the analyst must attempt to capture the human as well as the social sides of thefirm's leading decision makers. Decision makers do not make their decisions in a vacuum; indeed,one of the purposes of this book is to emphasize how the analyst can support these decision makerswith beneficial insight.Executives' decisions are affected by personal, positional, and situational factors. Personal factorsaffect what the decision maker thinks, values, and prefers. Positional factors reflect what othersexpect of the decision maker as expressed through the demands they place personally on him or her.Situational factors are relevant to the lead up and time of the executive making a decision. Values arereflected both in the posture and managerial style of the decision maker when making businessdecisions.Managerial preferences refer to the actions and behavior of (senior) executives rather than what they

say. As such, the conduct of top management is an extremely valuable management tool that conveysand reinforces strong messages to stakeholders and particularly employees throughout theorganization. One of the most important barometers of executives' behavior is the way in which theyspend their time. By concentrating their individual and collective attention on managing criticalsuccess factors, executives can help their staff prioritize the essential activities that the organizationmust perform well.Another important barometer of executive leadership is symbolic or signaling behavior that can beseen as constantly reinforcing the fundamental value system of the firm. By fostering a firm-wide"strategic conversation" composed of formal and informal symbols, executives can instill a positiveculture consistent with the firm's strategic intent.Sometimes also referred to as super-ordinate goals, shared values represent the collective valuesystem that drives a firm's organizational culture. Often, shared values are informal and go beyond thefirm's mission statement by encompassing intangibles such as strategic intent, underlying beliefs,mental mindsets, and future direction. Shared values are sometimes viewed as the most fundamentalbuilding block of an organization, thereby providing a foundation for the other elements. Often, sharedvalues are short articulations of the essential meaning or driving force of the organization. Thedifficulty, and hence value, in creating strong shared values within an organization is exemplified bythe observation that only exceptional firms are able to consistently leverage this phenomenon overtime.4
Organization
The main components of organization in the SERVO model are culture, leadership, staffing, structure,and systems. Culture differs from firm to firm and refers to the character of a firm's work climate andpersonality. These are shaped by a firm's beliefs, history, modus operandi, stories, traditions, andvalues. Once established, a firm's culture tends to be perpetuated in a number of ways and can beresistant in the short term to managerial attempts to change it.Leadership is a highly visible organizational role that involves motivating people to best performtheir responsibilities. It is most directly exemplified by the actions and behaviors of the firm's topexecutives and decision makers.5Staffing involves the attraction, development, motivation, retention, and training of the individuals,which a business needs to operate. These tasks are ordinarily managed by a human resourcesdepartment but have broader firm-wide implications that go far beyond the auspices of only oneresponsibility center. Staffing can be among the most critical activities—explaining the strategicsuccess of firms in the knowledge economy—and has clearly risen in prominence as a point ofanalytical focus since the 1980s.Structure involves the allocation and division of responsibilities and the configuration of reportingrelationships within a firm; it is frequently represented by an organizational chart. The choice ofstructure involves a myriad of tradeoffs; for example, a firm's structure may be centralized ordecentralized, hierarchical or flattened, or specialized or integrated. The focus on structure within the"O" element of the SERVO model, however, helps concentrate the analyst's mind on two key aspectsof structure. First is the idea of coordination of all of the aspects of structure in the support ofstrategy. Second, the SERVO model seeks to isolate those aspects of structure, which are critical to
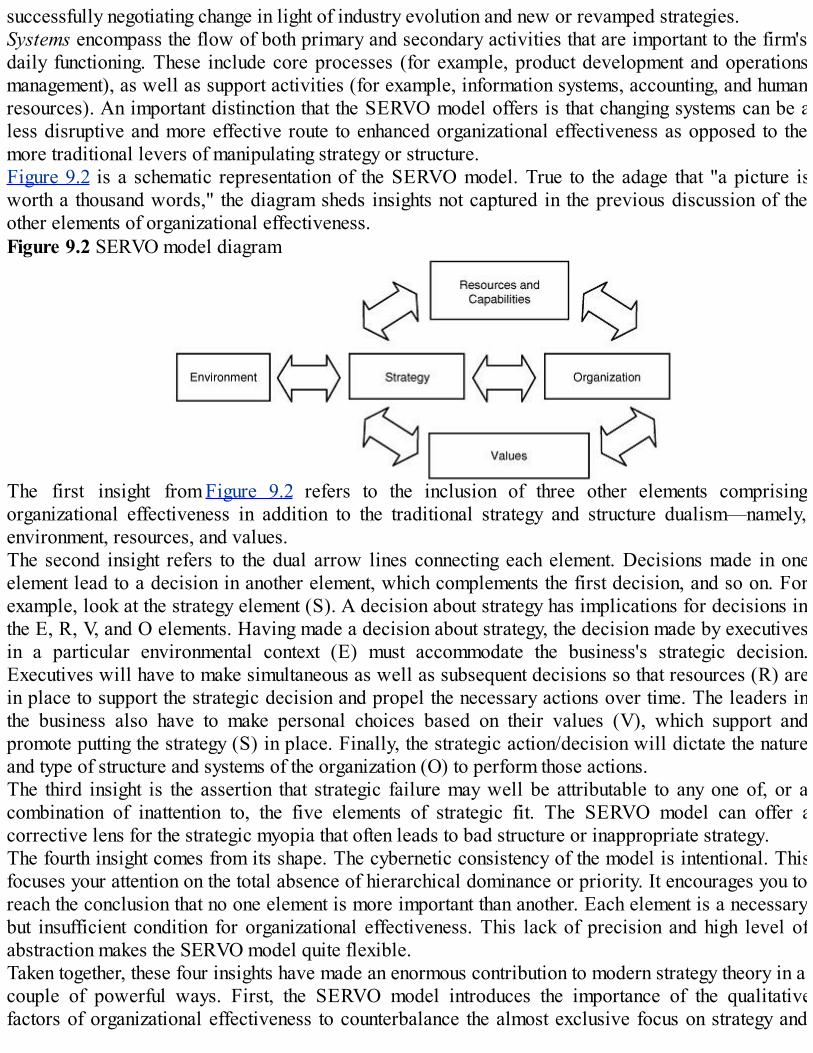
successfully negotiating change in light of industry evolution and new or revamped strategies.Systems encompass the flow of both primary and secondary activities that are important to the firm'sdaily functioning. These include core processes (for example, product development and operationsmanagement), as well as support activities (for example, information systems, accounting, and humanresources). An important distinction that the SERVO model offers is that changing systems can be aless disruptive and more effective route to enhanced organizational effectiveness as opposed to themore traditional levers of manipulating strategy or structure.Figure 9.2 is a schematic representation of the SERVO model. True to the adage that "a picture isworth a thousand words," the diagram sheds insights not captured in the previous discussion of theother elements of organizational effectiveness.Figure 9.2 SERVO model diagram
The first insight from Figure 9.2 refers to the inclusion of three other elements comprisingorganizational effectiveness in addition to the traditional strategy and structure dualism—namely,environment, resources, and values.The second insight refers to the dual arrow lines connecting each element. Decisions made in oneelement lead to a decision in another element, which complements the first decision, and so on. Forexample, look at the strategy element (S). A decision about strategy has implications for decisions inthe E, R, V, and O elements. Having made a decision about strategy, the decision made by executivesin a particular environmental context (E) must accommodate the business's strategic decision.Executives will have to make simultaneous as well as subsequent decisions so that resources (R) arein place to support the strategic decision and propel the necessary actions over time. The leaders inthe business also have to make personal choices based on their values (V), which support andpromote putting the strategy (S) in place. Finally, the strategic action/decision will dictate the natureand type of structure and systems of the organization (O) to perform those actions.The third insight is the assertion that strategic failure may well be attributable to any one of, or acombination of inattention to, the five elements of strategic fit. The SERVO model can offer acorrective lens for the strategic myopia that often leads to bad structure or inappropriate strategy.The fourth insight comes from its shape. The cybernetic consistency of the model is intentional. Thisfocuses your attention on the total absence of hierarchical dominance or priority. It encourages you toreach the conclusion that no one element is more important than another. Each element is a necessarybut insufficient condition for organizational effectiveness. This lack of precision and high level ofabstraction makes the SERVO model quite flexible.Taken together, these four insights have made an enormous contribution to modern strategy theory in acouple of powerful ways. First, the SERVO model introduces the importance of the qualitativefactors of organizational effectiveness to counterbalance the almost exclusive focus on strategy and
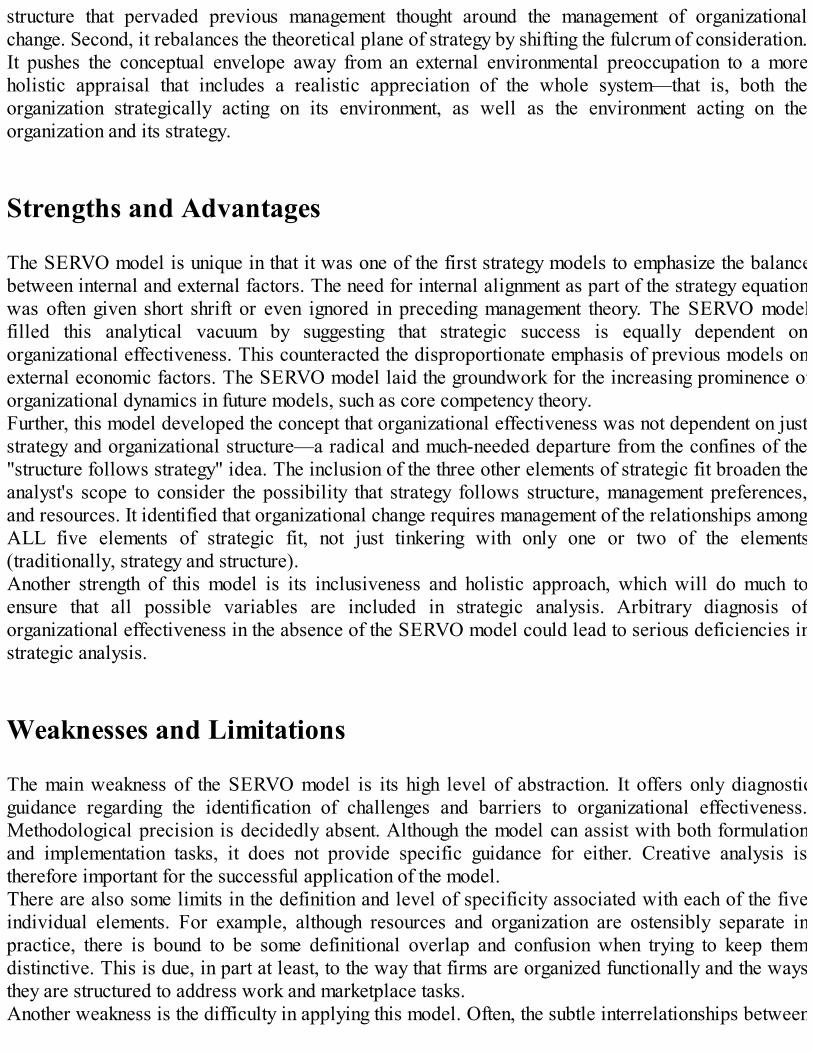
structure that pervaded previous management thought around the management of organizationalchange. Second, it rebalances the theoretical plane of strategy by shifting the fulcrum of consideration.It pushes the conceptual envelope away from an external environmental preoccupation to a moreholistic appraisal that includes a realistic appreciation of the whole system—that is, both theorganization strategically acting on its environment, as well as the environment acting on theorganization and its strategy.
Strengths and Advantages
The SERVO model is unique in that it was one of the first strategy models to emphasize the balancebetween internal and external factors. The need for internal alignment as part of the strategy equationwas often given short shrift or even ignored in preceding management theory. The SERVO modelfilled this analytical vacuum by suggesting that strategic success is equally dependent onorganizational effectiveness. This counteracted the disproportionate emphasis of previous models onexternal economic factors. The SERVO model laid the groundwork for the increasing prominence oforganizational dynamics in future models, such as core competency theory.Further, this model developed the concept that organizational effectiveness was not dependent on juststrategy and organizational structure—a radical and much-needed departure from the confines of the"structure follows strategy" idea. The inclusion of the three other elements of strategic fit broaden theanalyst's scope to consider the possibility that strategy follows structure, management preferences,and resources. It identified that organizational change requires management of the relationships amongALL five elements of strategic fit, not just tinkering with only one or two of the elements(traditionally, strategy and structure).Another strength of this model is its inclusiveness and holistic approach, which will do much toensure that all possible variables are included in strategic analysis. Arbitrary diagnosis oforganizational effectiveness in the absence of the SERVO model could lead to serious deficiencies instrategic analysis.
Weaknesses and Limitations
The main weakness of the SERVO model is its high level of abstraction. It offers only diagnosticguidance regarding the identification of challenges and barriers to organizational effectiveness.Methodological precision is decidedly absent. Although the model can assist with both formulationand implementation tasks, it does not provide specific guidance for either. Creative analysis istherefore important for the successful application of the model.There are also some limits in the definition and level of specificity associated with each of the fiveindividual elements. For example, although resources and organization are ostensibly separate inpractice, there is bound to be some definitional overlap and confusion when trying to keep themdistinctive. This is due, in part at least, to the way that firms are organized functionally and the waysthey are structured to address work and marketplace tasks.Another weakness is the difficulty in applying this model. Often, the subtle interrelationships between

the five elements are extremely difficult to discern. In order to manage this complexity, managers areoften predisposed to treat each variable separately, or only to look at two or three combinations thatmay lessen the influence of the other interactions present among all of the elements. This is more dueto the difficulty in dealing with simultaneous multi-variable interactive complexity—one that is onlyexposed to the light of day through this model.Last but not least, the SERVO model tends to be a static model. It is useful for looking at a snapshotof an organization's fit at any one time, but can be difficult to use when making longitudinal changes—unless it is developed and applied on a regular basis or with specific time periods built into theanalysis. The model's ability to address the challenges generated by dynamic firms and marketplacesis more limited than those models that expressly account for time as a critical variable.
Process for Applying the Technique
The process for applying the SERVO model is deceptively simple. It can be tempting at times tooverestimate the firm's ability to achieve alignment among all five elements. The SERVO model isamenable to testing both current and proposed strategy and, as such, assumes that these strategies havealready been conceptualized and formulated.
Step 1: Evaluate the Current Performance of the Firm
The first step is to assess whether the firm's performance has met both internal and external goals.This means understanding what decision makers seek to achieve as well as what other stakeholders,such as customers, suppliers, strategic partners, and employees hope the firm will do. Performanceshould also be compared to external references, such as market competitors and similarly focusedfirms in related industries. These comparisons must also be done over designated time periods,usually including the last few quarters and years, with projections of competitors' performance beingmade at least several quarters ahead. Many organizational analysts predominantly do these tasks byusing financial ratio and statement analysis.6If the analyst determines that the firm is not performing as well as it should against either internal orexternal references, then he must diagnose the potential causes of these performance problems. Thisdiagnosis can be performed by working through a fuller SERVO analysis, as described in Step 2. Ifthe analyst determines that the organization is performing well, his responsibility will shift toassessing risks and vulnerabilities and to identifying strategies that can exploit emergingopportunities.
Step 2: Assess the Current Strategy and Discern Whether ChangeIs Necessary
Relationships among the SERVO elements create the interdependencies that impact the firm'sstrategic and competitive actions. For the analyst serving a decision-making client, this means that in
making one decision, another decision has to be made to complement the first, either by supporting theprior decision, by adding features to it, or by lessening any adverse effects. When applying theSERVO model, the analyst must be mindful that the relationships among strategic actions or decisionsare important because the actions/decisions should complement each other. Complementary actionand decisions ordinarily work in conjunction with each other to produce desirable results. Whenactions are taken or decisions are made in isolation, there is a danger that they will not work together,sometimes even contradicting each other, and so produce inferior results.The number of relationships to consider is enormous because, theoretically, every strategic action ordecision needs to be considered in light of every other decision. Where does the analyst begin thistask? This dilemma is resolved partially by SERVO itself. It deals with the "big" picture, therebyfocusing the analyst on those relationships that are strategically important. If the rare, major, anddirection setting (that is, strategic) decisions are correctly made, then the operational and tacticaldecisions made in response to them should follow. This is why the diagnosis begins with the macrorelationships among the five SERVO elements. When this has been completed, the analyst considersthe details within each of the five elements.Even though there are only five elements in the SERVO model, 20 macro relationships exist if theactions and decisions in each element are related to actions/decisions in every other element. Inaddition to these macro relationships between the five elements, there are relationships among thecomponents within each element. Within the resource element, for example, we can uncoverrelationships between financial and other functional decisions. The financial decisions made aboutthe amount of equity and debt a firms uses to finance its operations may limit the potential for raisingnew capital for investments, even in earnings enhancing activities that are planned.The most common way that the analyst determines whether the relationships are effective or not is togauge their fit. The following section describes the nature and strength of various types of fit. Thesewill help the analyst to determine where decisions first need to be made, as well as where executiveattention must be focused. These are placed within SERVO grids to help the analyst organize andvisualize the relational diagnosis (see Figure 9.3).Figure 9.3 SERVO grid showing fits among elements
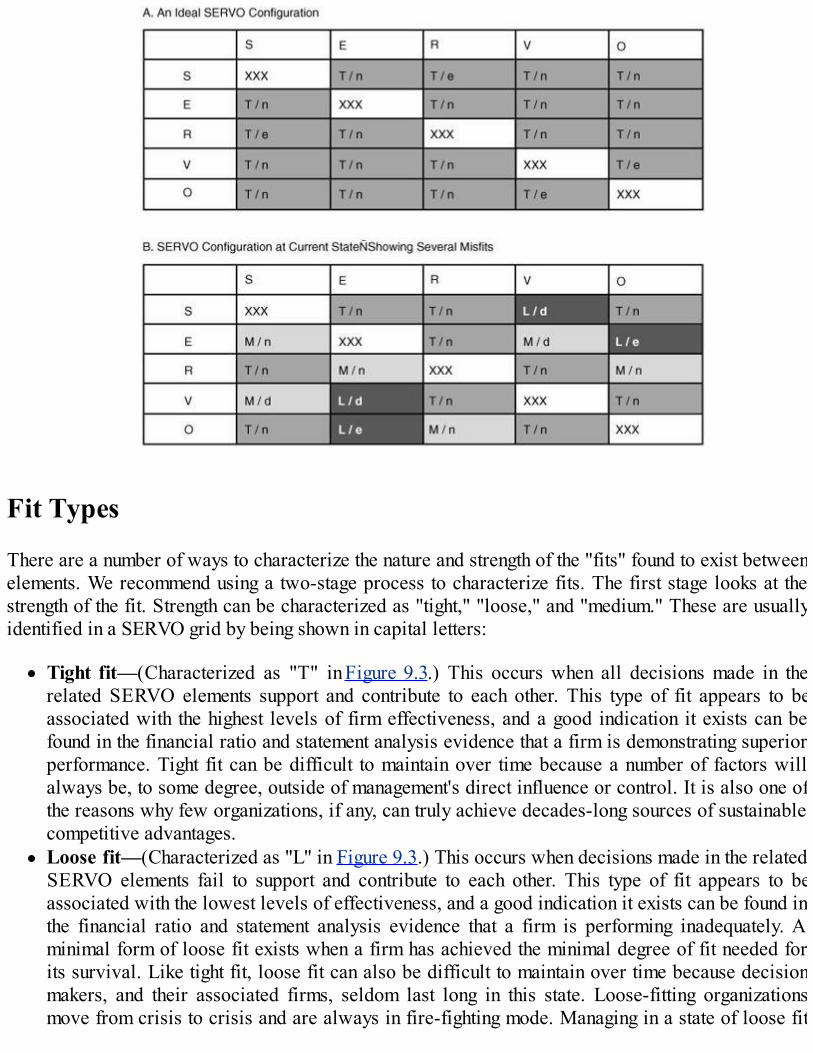
Fit Types
There are a number of ways to characterize the nature and strength of the "fits" found to exist betweenelements. We recommend using a two-stage process to characterize fits. The first stage looks at thestrength of the fit. Strength can be characterized as "tight," "loose," and "medium." These are usuallyidentified in a SERVO grid by being shown in capital letters:
Tight fit—(Characterized as "T" in Figure 9.3.) This occurs when all decisions made in therelated SERVO elements support and contribute to each other. This type of fit appears to beassociated with the highest levels of firm effectiveness, and a good indication it exists can befound in the financial ratio and statement analysis evidence that a firm is demonstrating superiorperformance. Tight fit can be difficult to maintain over time because a number of factors willalways be, to some degree, outside of management's direct influence or control. It is also one ofthe reasons why few organizations, if any, can truly achieve decades-long sources of sustainablecompetitive advantages.Loose fit—(Characterized as "L" in Figure 9.3.) This occurs when decisions made in the relatedSERVO elements fail to support and contribute to each other. This type of fit appears to beassociated with the lowest levels of effectiveness, and a good indication it exists can be found inthe financial ratio and statement analysis evidence that a firm is performing inadequately. Aminimal form of loose fit exists when a firm has achieved the minimal degree of fit needed forits survival. Like tight fit, loose fit can also be difficult to maintain over time because decisionmakers, and their associated firms, seldom last long in this state. Loose-fitting organizationsmove from crisis to crisis and are always in fire-fighting mode. Managing in a state of loose fit

may require a different set of knowledge, skills, abilities, and experiences of a firm's decisionmakers than is required to manage a firm that is in a state of tight fit.Medium fit—(Characterized as "M" in Figure 9.3.) This occurs when some decisions made inthe related SERVO elements support and contribute to one another, while others do not. This isthe most common state of fit evidenced in firms at any one time. The goal for the analyst is tohelp decision makers make choices and decisions that will lead to actions that will tighten the"loose" fits. Some medium fits may be more "fragile" (how vulnerable they are to change; howmuch resilience the firm retains in dealing with other related elements) than others, and thisshould be noted when characterizing the strength between elements as being a medium fit.
The second dimension to characterizing fit attempts to address the issue of time. In other words, fitschange over time—some more quickly and some more slowly than others. It is rare in anorganizational strategy context for a relationship to remain in a steady state for extended periods.There are essentially three forms of temporal fit: early, normal, or late fits. These are usuallyidentified in a SERVO grid by using small letters.
Early fit—(Characterized as "e" in Figure 9.3.) This means that the firm has discovered and iscreating a new pattern of fit between its SERVO elements before any other business. It isordinarily driven by the relationship of its strategy (S) and a number or sequenced combinationof the other elements. It can be a competitive advantage for the firm, especially if the pattern ishard for its competitors to imitate.Delayed fit—(Characterized as "d" in Figure 9.3.) Achieving this temporal state means that thefirm is/was among the slowest in a particular competitor comparison to respond to changingpatterns among its SERVO elements. This particularly exists in the relationship of the other fourelements to the environment (E). For example, a firm that is very slow to market with aproduct/service reflecting an accepted technological change would be characterized as having a"late fit" between its strategy (S) and environment (E) elements. A firm that was late to changeits human resources policies to adapt to changing standards, mores, or laws would have a late fitbetween its values (V) or resources (R) and environmental (E) relationship.Normal fit—(Characterized as "n" in Figure 9.3.) This means that the firm was neither fast norslow to respond to changes among its elements of SERVO. In other words, it adapts or changesat about the same time as a "typical" firm under consideration.
Empirical studies of these forms of fit face three major challenges: to determine the ideal profile tobe used as a base; to work out relative position from the ideal profile; and to relate the type of fit toperformance indicators.
Step 3: Develop and Evaluate Strategic Options and Programs
After isolating the nature of fit and the strategic distance between the five SERVO elements, there areessentially three options. The firm can work to change the required components of each element sothat they are consistent with strategy. Alternately, it may be wise to consider changing the strategy tofit the existing orientation of the other four elements of the model. Often, a compromise between eachof these two options is the realistic alternative.
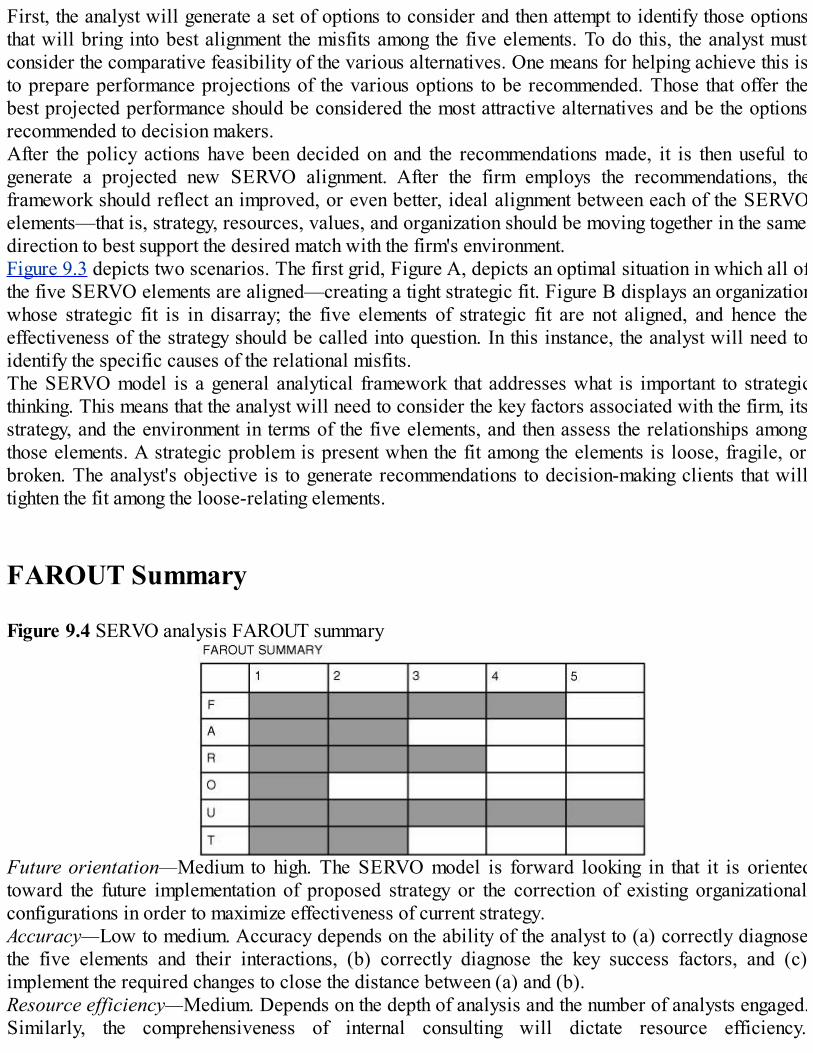
First, the analyst will generate a set of options to consider and then attempt to identify those optionsthat will bring into best alignment the misfits among the five elements. To do this, the analyst mustconsider the comparative feasibility of the various alternatives. One means for helping achieve this isto prepare performance projections of the various options to be recommended. Those that offer thebest projected performance should be considered the most attractive alternatives and be the optionsrecommended to decision makers.After the policy actions have been decided on and the recommendations made, it is then useful togenerate a projected new SERVO alignment. After the firm employs the recommendations, theframework should reflect an improved, or even better, ideal alignment between each of the SERVOelements—that is, strategy, resources, values, and organization should be moving together in the samedirection to best support the desired match with the firm's environment.Figure 9.3 depicts two scenarios. The first grid, Figure A, depicts an optimal situation in which all ofthe five SERVO elements are aligned—creating a tight strategic fit. Figure B displays an organizationwhose strategic fit is in disarray; the five elements of strategic fit are not aligned, and hence theeffectiveness of the strategy should be called into question. In this instance, the analyst will need toidentify the specific causes of the relational misfits.The SERVO model is a general analytical framework that addresses what is important to strategicthinking. This means that the analyst will need to consider the key factors associated with the firm, itsstrategy, and the environment in terms of the five elements, and then assess the relationships amongthose elements. A strategic problem is present when the fit among the elements is loose, fragile, orbroken. The analyst's objective is to generate recommendations to decision-making clients that willtighten the fit among the loose-relating elements.
FAROUT Summary
Figure 9.4 SERVO analysis FAROUT summary
Future orientation—Medium to high. The SERVO model is forward looking in that it is orientedtoward the future implementation of proposed strategy or the correction of existing organizationalconfigurations in order to maximize effectiveness of current strategy.Accuracy—Low to medium. Accuracy depends on the ability of the analyst to (a) correctly diagnosethe five elements and their interactions, (b) correctly diagnose the key success factors, and (c)implement the required changes to close the distance between (a) and (b).Resource efficiency—Medium. Depends on the depth of analysis and the number of analysts engaged.Similarly, the comprehensiveness of internal consulting will dictate resource efficiency.

Organizations with only a few elements out of alignment will achieve higher resource efficiency.Objectivity—Low. The requisite analysis is highly qualitative and subject to perception bias.Usefulness—Medium to high. The explicit purview of this model is exactly what many other modelsignore. As such, the SERVO model is compatible with, and complementary to, a good number ofother management tools and techniques.Timeliness—Low to medium. A comprehensive SERVO analysis is extremely comprehensive andcovers all facets of the firm. Additionally, correctly examining the intricate inter-relationshipsbetween the five elements can require a substantial amount of time.
Related Tools and Techniques
7S analysisCompetitive benchmarkingCustomer segmentation and needs analysisCustomer value analysisFinancial ratio and statement analysisFunctional capability and resource analysisSTEEP analysisSWOT analysisValue chain analysis
References
Andrews, K. (1980). The Concept of Corporate Strategy, rev. ed. Homewood, IL: Richard D. Irwin,Inc.Baker, D., and J. Cullen (1993). "Administrative reorganization and configurational context: Thecontingent effects of age, size, and change in size." Academy of Management Journal, 36(6), pp.1251–1277.Chandler, A.D. Jr. (1962). Strategy and Structure: Chapters in the History of the AmericanIndustrial Enterprise. Cambridge, MA: MIT Press.Collins, J., and J. Porras (2002). Built to Last: Successful Habits of Visionary Companies. NewYork, NY: Harper Collins.Darden Graduate Business School Sponsors (1983). American Telephone and Telegraph (A),Charlottesville, VA: University of Virginia.Fleisher, C., and B. Bensoussan (2003). Strategic and Competitive Analysis: Methods andTechniques for Analyzing Business Competition. Upper Saddle River, NJ: Prentice Hall.Fry, L., and D. Smith (1987). "Congruence, contingency, and theory building," Academy ofManagement Review, 12(1), pp. 117–132.Harling, K. (1999). "Note on strategic management," comments prepared for The Maple LeafConference, retrieved from http://info.wlu.ca/~wwwsbe/MapleLeaf/Strategic_Management.html.Hax, A.C., and N.S. Majluf (1983). "Organization design: A case on matching strategy and structure,"

The Journal of Business Strategy, Fall, 4(2), pp. 72–86.Ketchen, D., Thomas, J., and C. Snow (1993). "Organizational configurations and performance: Acomparison of theoretical perspectives," Academy of Management Journal, 36(6), pp. 1278–1313.Meyer, A., Tsui, A., and C. Hinings (1993). "Configurational approaches to organizational analysis,"Academy of Management Journal, 36(6), pp. 1175–1195.Peters, T.J. (1984). "Strategy follows structure: Developing distinctive skills," CaliforniaManagement Review, Spring, 26(3), pp. 111–125.Powel, T.C. (1992). "Organizational alignment as competitive advantage," Strategic ManagementJournal, February, 13(2), pp. 119–134.Waterman, R.H. Jr. (1982). "The Seven Elements of Strategic Fit," The Journal of Business Strategy,1982, 2(3), pp. 69–73.Waterman, R.H. Jr., Peters, T.J., and J.R. Phillips (1980). "Structure is not Organization," BusinessHorizons, June, pp. 14–26.
Endnotes
1 Andrews, 1980; Harling, 1999.2 See Fleisher and Bensoussan (2003), Chapter 17.3 See Fleisher and Bensoussan (2003), Chapter 9.4 Collins and Porras, 2002.5 As thousands of studies and books have been written on the topic of leadership, we will not dwellon this area of SERVO, but will suggest the analyst refer to our explanation of management profilingthat is captured in Chapter 15 of our prior book (Fleisher and Bensoussan, 2002).6 See Fleisher and Bensoussan (2003), Chapter 25.
10Supply Chain Management (SCM) Analysis
Short Description
The supply chain can be defined as a network of suppliers, manufacturers, distributors, retailers, andcustomers that are linked by information, wares, and capital that move among the participants.1Supply chain management (SCM) is the conduct of the interrelated elements among the supply chain'sfunctions, like procurement, logistics, and inventory management, as well as the interactions betweenthe firm and outside companies within the supply chain.2 In a general context, SCM can be defined as
. . . the systematic, strategic coordination of traditional business functions and the tactics acrossthese business functions within a particular company and across these businesses within thesupply chain, for the purposes of improving the long-term performance of the individualcompanies and the supply chain as a whole.3
In short, an effective supply chain will ensure that the right goods get to the right people, at the righttime, at minimal cost, and maximum efficiency to the company.4 It is important to note that this chapterwill look at analyzing the management of supply chains. As such, analyzing their management willrequire the analyst to answer the following questions, among others:
What is the relative bargaining power of suppliers to industry competitor's supply chains?Do competitors or one's own enterprise have too many different suppliers when a few well-managed relationships could ably fill capacity?How effective are your own enterprises, as well as competitors' supply chains, particularlycompared to the analyst's enterprise?Where are the vulnerabilities and strengths in the management of a competitor's supply chain?How does your own supply chain compare to industry competitors' as well as benchmarkpractices?
Background
Throughout history, goods and the people who want them have been in different places. In the daysbefore sophisticated transportation and refrigeration systems, communities sprung up close to foodsources and abundant natural resources. Because people lacked a good way to bring resources tothemselves, they brought themselves to the resources. However, as civilization advanced,communication and mobility improved, and trade allowed people to develop tastes for farawaycommodities. Individuals also quickly realized they could ship their excess goods to people whootherwise would not have had access to them.5 Over time, strong import and export markets began todevelop among numerous nation-states.

Compared to conditions only a century ago, communication and transportation mechanisms havebecome easier, faster, and less expensive. As a result, companies can source products from allcorners of the globe, communicate with partners in real time, and get sophisticated and specializedproducts to market in weeks—a task that would have been basically inconceivable only a generationago.6 All the while, many average families have shrunk in size, and many women are working outsidethe home, raising the level of disposable income available to consumers. This phenomenon has fueledthe desire for varieties of complex consumer goods to be available to whomever wants them,whenever they want them—a transition that the contemporary, well-managed supply chain willsupport and delivers value to. It naturally follows that how well a company manages all of thecomponents that go into its final product can determine how successful the product will be in themarketplace. How well your enterprise and your competitors are managing their supply chain canmean big opportunities or big challenges for your company.The notion of supply chain management (SCM) emerged around the 1960s, with more attention beingpaid to the subject into the 1980s, although the popularity of SCM did not really take off until the1990s. Up until this time, the predominant model for a company's supply chain was very company-centric, with little involvement from suppliers and customers. A good example of this is thedevelopment of a model combining supply chains understandings and operations research.In the mid 1990s, consultants at Pittiglio Rabin Todd & McGrath (PRTM) sensed the need for amodel that would help illustrate, and thus improve, the way companies in a supply chain worktogether. The result of their efforts and input from more than 75 manufacturers and the AdvancedManufacturing Research (AMR) firm was the Supply Chain Operations Research model (SCOR).Those 75 companies created an association called the Supply Chain Council (SCC) to further theseefforts.7Successful companies such as Wal-Mart, Dell, Best Buy, Procter & Gamble, and Volkswagen are allmanaging their supply chains in ways that allow these companies to compete more effectively in theirrelevant marketplaces. Supply chain management is increasingly seen as a source of competitiveadvantage for companies, and this area of competition is expected to be further leveraged in comingyears.8The field of SCM is still youthful and promises to evolve further as more sources of competitiveadvantage are realized through effective supply chain management. Many companies are nowrealizing that the new opportunity to add value and increase profits cannot be undertaken alone—cooperation with other members in the supply chain can optimize capabilities. Ultimately, thepartners that make up the chain will be more successful together than they could ever be bythemselves.9 Astute firms realize that in the future, the competitive arena will witness chainscompeting against chains rather than companies competing against companies.10Figure 10.1 stressesthe myopic, dated view of some companies that they are stand-alones, competing against only othersin their industry.Figure 10.1 Old model of competition
Figure 10.2 is a demonstration of the realization that an optimized value chain can be stronger than thesum of its parts. Gone are the days where companies can isolate themselves and expect to be able tomaintain a competitive advantage.

Figure 10.2 New model of competition
Strategic Rationale
As Henry Ford learned in the early 1900s, no company can operate completely independently. HenryFord made it his automotive company's sole mission to be totally self-sufficient. His procurementefforts involved owning glass factories, coal mines, forests, soybean fields, and even an entireBrazilian rubber plantation in order to guarantee sources for raw materials. He invested in shippinglines, railroads, and roadways, and constructed his own harbor to ensure that materials and inventoryhad reliable transportation. His reach extended globally, so he could control all of his operations,including plants, dealerships, and service operations, throughout all countries where Ford productswere produced and sold.11 However ambitious, Ford learned that the laws of competitive advantagedon't discriminate, and at the height of his vertical integration initiative, he was consistently beingoutperformed by smaller firms whose specialty could not be matched by his cumbersome regime.Ford learned a valuable lesson that is now part conventional business wisdom: "No firm can be self-sufficient."12
The pace of information and technology has lead to a marketplace that is dynamic, with ever-increasing customer expectations. The "bull-whip effect" refers to increased costs and inefficienciesthat travel along the supply chain as a result of demand/supply incongruities and informationdisparities.13 The effect can be reduced by effective supply chain management. This requires aparadigm shift from that of a reactive, myopic, ledger-driven organization, to that of a fully-integratedfuture-oriented, proactive, and agile supply chain member. The perspective is just the tip of theiceberg, however, and must be supported by technology, adequate and talented staff, and company-wide support.A 2003 survey of over 500 manufacturers by Deloitte Consulting revealed the increasingcomplexities and challenges that companies are now facing in trying to optimize their supply chains.Although a majority of manufacturers have operations overseas, some with more assets in foreigncountries than their home or headquarters country, most supply chain optimization efforts are directedat singular projects, facilities, and departments and tend to be local. Only about half of the surveyedmanufacturers had a senior-level executive in charge of end-to-end SCM. Although manymanufacturers cite flexibility as being very important, shorter cycle and lead times and pressure toreduce costs is making flexibility harder to attain. Managing supply chain risks is becoming moredifficult as well, as many manufacturers say they continue to fragment their supply chains. Less than8% of the surveyed executives said that they collaborate with customers on key initiatives. Fewerthan 2% of respondents felt that they had a world-class supply chain, although more than 90% of

respondents thought it was important.14 These empirical findings highlight that effective supply-chainmanagement is just now moving to the forefront of companies' collective consciousness, althoughthere still remains a long way to go until the typical company is effectively managing its supply chainto achieve competitive advantage.
Strengths and Advantages
Effective Supply Chain Management analysis can ultimately lead to a competitive advantage due todecreased costs, increased efficiency, better product availability, and increased sales. Manycompanies are using their supply chains to beat their competitors at cost control, which can result inmore pricing flexibility at the point where the goods interface with end customers. It can also result inhigher profit margins if companies with effective SCM price their goods at relatively similar levelsas their competitors with less effectively managed supply chains. As such, analyzing the managementof supply chains can help the analyst pinpoint potential sources of competitive advantage that manyother business or competitive analysis models may miss.Effective supply chain management can translate to competitive advantage if the flow of informationand products among the supply chain participants are synchronized and all parties' interests areconstructively aligned. Proper alignment and information sharing between parties leads to a "win-win" relationship and allow the supply chain-related parties to minimize inefficiencies. Additionally,these sources of competitive advantage are often hidden "below the surface," meaning that companiesusing their supply chains for advantage may build large leads in the marketplace before theircompetitors realize what is actually the source of the advantage. These network-based advantages canalso be difficult to spot using most other models of analysis, and SCM analysis allows for andencourages probing of resources, networks, and information sharing in ways that most other modelsdo not consider.For companies competing on a cost basis, effective SCM can be the difference between competitivesuccess and failure. Many companies find that an analysis of their supply chains lead to changes thathelp them better manage their assets, therefore decreasing costs. In particular, accounts receivable,physical inventories, demand cycles, and infrastructure, including buildings, plants, warehousing,retail outlets, and transportation, can all be better managed. For example, Wal-Mart's asset turnoverof 2.59 times in 2004 is a testament to the finely tuned supply chain for which they are famous. Target,a strong competitor in the competitive U.S. retailing market, struggled to catch them at 1.54 times.15
Today, effective supply chain management means building a product and information flow that willultimately benefit the customer. Combined with notions of customer centricity that flow out of otherapproaches like product line analysis, customer segmentation approaches, and marketing research,SCM can be a powerful weapon that resists competitor imitation, a fundamental recipe of resource-based strategic advantage. Increased efficiencies and better asset management should lead to lower-cost goods without compromising quality. Information sharing and predictive modeling should meanthat the product gets to market when the customer is looking for it. Principles like "Design for Supply"(where product designers understand the production costs and implications of their designs) utilizetechniques like "postponement, commonality, and standardization"16 to create products that are easierto customize to consumer group preferences without adding significant costs or steps in the supplychain. The result is a product that is more tailored to market groups. Ultimately, successfully

analyzing a supply chain will reveal how in touch the supply chain is with customer needs and wants,a powerful equation for success in competitive marketplaces.
Weaknesses and Limitations
Supply chain analysis of both one's own enterprise, and more particularly of competitors, is not aneasy task to accomplish. First of all, it requires a significant reservoir of comprehensive, timely, andaccurate supply chain-related data, for which many companies will not have even for their ownenterprises. For those companies that have experienced difficulties in analyzing the management oftheir own supply chains, imagine how difficult it will be for analysts trying to analyze the managementof their competitor's chains.One of the stranger limitations of SCM analysis is in how the analyst's decision-making clients maylook at the evidence coming out of an SCM analysis. If supply chain management analysis reveals thata firm is missing opportunities and experiencing inefficiencies due to a lack of technology andintegration, the firm is potentially looking at a very large financial and time investment to bring theminto line with their competitors. Many decision makers may intrinsically already know this and beunwilling to authorize either an analysis of SCM or the recommendations that flow from one since itrequires a risky, strategic decision. On the other hand, failing to improve one's own enterprise's SCMin the face of overwhelming evidence that competitors are using theirs to win in the marketplace istantamount to managerial irresponsibility.Analysts also need to have an understanding of some facets of the organization that require specialtyexpertise and knowledge. For example, the software that communicates supply chain dynamics toone's company uses complicated and sophisticated network modeling. Although they can add valueand improve decision making, massive computer skill and programming are typically required. Thisprocess can be costly and time consuming, and as no standard set of network modeling tools hasdeveloped, firms run the risk of running into compatibility issues with supply chain partners.Integrating network modeling tools with the SCOR model could provide a framework forstandardization at some point in the future.17 Until or unless this standardization occurs, making"apples to apples" comparisons among the management of competitor's supply chains will remain athorny issue among individuals performing SCM analysis.Another existing limitation of most SCM analysis models also is brought about by the realities oftoday's business environment. Rapid advances in technology now allow companies to create strategicalliances with other companies in their supply chain. These partnerships allow information to flowfreely between the organizations in real time. When this process is repeated in multiple organizations,networks are created. The current evolution of most SCM analysis frameworks or models have yet toallow for the comparative empirical illustration associated with how these supply chain networkscompete against one another.
Process for Applying the Technique
We suggest that it is important to start this section with a look at the SCOR (Supply Chain Operations

Reference) model developed by the Supply Chain Council (SCC). The SCOR model looks at SCMfrom a strategic, rather than operational or design perspective and should therefore be more helpful toanalysts looking to analyze SCM for business and competitive purposes. Numeric and analyticmodeling techniques, whose base is in engineering and day-to-day business principles can be used foroperational and design decisions, but strategic decisions require that the supply chain be viewed as awhole.18Figure 10.3 demonstrates the traditional model for companies to view themselves as soleentities, rather than links in a larger chain.Figure 10.3 Old supply chain configuration
The SCOR model helps executives see their part in the bigger chain by shifting the format away fromthe traditional supplier/manufacturer/customer perspective to four processes that each company mustundergo in each link of the chain. Planning is the first of the four processes and is central to managingthe other three processes, which are source, make, and deliver. Every time there is an exchange ofgoods between parties, all four processes are utilized. The SCOR model identifies three levels ofprocess detail. Level I is the top level and deals with process types (SCOR Version 7.0 overview). Itoutlines the SCOR model and sets performance targets. Level II deals with process categories. Theprocess categories are the basis for the supply chain to be custom configured, which in turn providesa format for the company to execute their operations strategy. Level III deals with process elementsand is the level at which processes are developed, articulated, and translate into competencies. Bestpractices, performance metrics, and the necessary systems for support are articulated at this level.The model emphasizes that all processes must be planned and gives a collaborative tool to aidcommunication because all components of the chain are visible, as is the flow of information andmaterials. Figure 10.4 demonstrates how partners in the chain are linked and the planning process iscentral to all supply chain activity.Figure 10.4 SCOR model of supply chain managementSource: Loosely adapted from SCOR Version 7.0 overview.
It is with this perspective in mind that we turn to some emerging and governing principles of effectivesupply chain management, which can aid in the process of analyzing supply chain management. The

process of benchmarking is an important first step. Although we provide a detailed description ofhow to conduct a benchmarking analysis in Chapter 11, "Benchmarking," for the purposes of thischapter, we will include a brief summary here. In short, the process of benchmarking involves fivesteps. These are as follows:
1. 1. Deciding what to benchmark2. 2. Forming a team that is capable and responsible to carry out the process3. 3. Identifying benchmark partners4. 4. Acquiring and analyzing benchmarking information5. 5. Implementing newly acquired best practices
We will show an application of SCM analysis using benchmarking by applying it to ten essentialrules of supply chain management. This example will show the process of SCM analysis in actionrelative to two different competitors in the consumer electronics market place. First, we'll illustratethe ten essential rules. Next, we'll apply the rules through benchmarking the different the managementof the different competitors' supply chains
Rules and Tools19
Rule #1: Effective supply chain management requires utilizing supplier and customer relationships totake advantage of scale economies when facing tough competition.Tool: Create collaborative relationships that can create switching costs. Use incentives and aligninterests, share information with suppliers and customers, clearly define roles and areas ofaccountability for all parties, and apportion costs, risks, and rewards accordingly.20 Companies areinherently self-interest seeking and will maximize their own interests if not aligned with partners inthe chain. When reconfiguring their supply chain, printer RR Donnelley asked suppliers for their inputin how to improve efficiencies and products, all the while offering to share in savings that resultedfrom the suppliers' ideas, thus using incentives to align interests.21
Rule #2: The supply chain network should allow access to global markets.Tool: Supply chain analysis should reveal if competitors are beating you on price or innovation dueto sources of supply or labor overseas. Additionally, moving operations overseas can open the supplychain to emerging markets.Rule #3: Successful supply chain management means meeting customer needs, wants, andexpectations. Customers are increasingly savvy and demanding. They have come to expect quality andfeatures at competitive prices. Customers expect products to be in stock when they want them and areput off by having to make multiple trips for one purchase.Tool: Design the supply chain from the customer backward, rather than the other way around. Engagemarket research firms to identify customer needs if necessary. This approach is known as "customer-centricity" and takes a holistic approach to designing the organization to optimize the customers'experience.Rule #4: Global capacity and rapid turnaround times mean companies must drive costs out of chainsand arrange access to supplies.Tool: Maintain a stock of small, non-perishable parts whose absence could cause delays. For
example, Spanish clothing manufacturer Zara keeps a supply of buttons and small fixtures so thatgarments can be completed even if shipments get inexplicably delayed or held up.22 Logistics systemsshould allow a company to rally in the event of unanticipated needs. Rather than invest in expensivesystems, it is useful to partner with a third-party logistics supplier.Rule #5: While other companies are merging for muscle and under-performing, focus on agilityinstead.Tool: Collaborative relationships are essential to achieving agility. Supply and demand changesshould be communicated to partners perpetually so they can react promptly. This can only happen, ofcourse, where collaboration and information sharing between partners is present. Lee illustrates theimportance of having a supply chain that is agile, adaptable, and aligned. The agile supply chain isadept at handling short-term supply/demand changes and responds to crises with minimal interruption.Design should only differentiate product at the latter stages of production—this is called"postponement" and promotes agility because the product is completed only when the firm hasinformation about end-user preferences.Rule #6: Adopt a position pivotal to chain success in order to have visibility and awareness ofchanging integrations among partners.Tool: Take a pro-active role in chain development. Identify strong executive level leadership whosejob this is, and make sure they have the resources they need. When Whirlpool's supply chain was inneed of an overhaul, then COO Jeff Fettig gave two executives—relative newcomer, Reuben Slone,and 25-year veteran, Paul Dittman—seven months and hundreds of man-hours to fix their supply chainproblems. The result was a supply chain investment costing more than any supply chain initiative inWhirlpool's history. The payoff has been a drop of $100 million in working capital in just one year, areduction in supply chain costs of $20 million, all the while realizing an order fill rate of 96% andproduct availability of over 95%.23
Rule #7: Technology creates challenges if adoption is piecemeal.Tool: The company's mindset must support a Digital Business Transformation (DBT), where everyfacet of every operation is examined to determine if it supports brand or product success. In DBT,technology should support customer value-maximizing processes, information sharing in real time,and customer-centric operations.24
Rule #8: Successful chains get products to market quickly.Tool: Support real-time information exchange. Use time and cycles as metrics to which incentives arelinked.Rule #9: Collaboration and integration blur organizational boundaries.Tool: Use supply chain risk management best practices:25
1. 1. Promote top-level awareness of exposure: an environment where information can be shared atall levels will ensure that executives know which suppliers are struggling and why, creating anawareness of potential commodity shortages and the ability to create a contingency plan.
2. 2. All suppliers should be continuously monitored. Companies with too many suppliers tomonitor should consider overhauling the supply chain and focusing on relationships that can beleveraged.
3. 3. Supplier information collection should be future-oriented—monitoring financial well-beingand current performance rather than past performance.
4. 4. Create an empowered culture: Benefits can be realized when those who operate closest to the
suppliers have the ability to assess and intervene in cases where they may not be able to meetdeadlines.
Rule #10: Pressure from stakeholders can mean conflict and little tolerance for growing pains.Tool: Wall Street measures market value, rather than absolute value. A "Triple-A supply chain," onethat is agile, aligned, and adaptable, will ultimately be successful.The following Case Study demonstrates how to use these rules and tools to analyze competitorssupply chains, or alternately, examine your own. When the ten areas are highlighted as strengths orweaknesses, areas for improvement or potential competitive advantage are easy to visualize. It isimportant to note that no amount of technology or resources will make a difference to supply chainperformance without good leadership, good people, and a supportive corporate culture to follow itthrough.Analysis of supply chain management is another effective technique in the tool-belt of the businessand competitive analyst. Employed effectively, it can enable the analyst to uncover otherwise hiddensources of competitive advantage. In a global marketplace that increasingly values the ability to getgoods to customers as quickly, cheaply, and effectively as possible, the management of supply chainswill remain an important competitive weapon that requires insightful analysis for decades to come.
Case Study: A Tale of Two Supply Chains: Best Buy vs.Sears/Kmart
The retail market has become very competitive. The market is crowded with stores of all formats,catering to every segment, from broad to niche, all clamoring to capture a loyal clientele.Unfortunately for them, in the eyes of many customers, there is little other than price to differentiateone retail outlet from the next. Many retailers are now realizing that a smart supply chain willleverage more in terms of profitability than increasing sales. Effective supply chain managementpresents opportunities to better serve customers, reduce markdowns, and respond to changing marketconditions.Based in Richfield, Minnesota, Best Buy is the largest consumer electronics retailer in NorthAmerica. When the company realized in the mid 1990s that mass market retailers Wal-Mart andTarget were eating away at its customer base, and approximately one-third of their customers wereleaving their stores unsatisfied, they knew something had to change. In 2004, its new CEO BradAnderson had authorized and supervised the introduction of a new competitive approach calledConcept VII, which he viewed as a revolutionary change. Concept VII was based on a strategic modelof customer centricity and was supported by three strategic pillars known as "efficient enterprise,""win the home with service," and "win entertainment." One result of Concept VII is a new supplychain management system that is taking three years to implement and that has been designed from thecustomer back.Sears is a venerable, mass-market retailer with a 100+ year history in North America. It offers homeappliances, tools, lawn and garden products, consumer (home) electronics, and automotive repair andmaintenance products. Sears' SCM strategy has been quite different from the one newly employed byBest Buy. Sears merged with Kmart in March 2005, and the result, for the most part, has beenconfusing.

Sears did not have strong asset turnover or return on assets (ROA) performance before the merger,26
and Kmart's frail inventory management and technology deficiencies helped put that discounter intobankruptcy in the first place. Since the merger, the retail behemoth has yet to determine how it willposition itself in the marketplace or how to merge the 37 software applications operating in bothcompanies. Currently, the company seems focused on sales strategies27 productivity and capitalexpenditure reduction rather than optimizing its supply chain.28
The following analysis of the two companies highlights the differences in supply chain management.The 10 rules of supply chain management are applied to current practices, and strengths andweaknesses are highlighted.Table 10.1Analyzing the Management of Competitors' Supply Chains

FAROUT Summary
Figure 10.5 Supply chain management analysis FAROUT summary
Future-oriented—Medium to High. Supply chain management structure cannot be changed quickly;thus, movement in a certain direction will most likely remain stable.Accurate—Medium. Competitors' supply chains may not be visible at all stages, leading to somespeculation.Resource efficiency—Medium. The technique is fairly simple to administer but requires substantialaccess to specialized supply chain knowledge and data to allow for comparisons.Objectivity—Medium to High. Supply chain management analysis relies very little on subjective data.Usefulness—High. Supply chain management is a big opportunity for many companies and will be anecessary skill for firms going forward.Timeliness—Medium. With access to recent data, timeliness is increased.
Related Tools and Techniques
BenchmarkingBusiness process re-engineeringFinancial resources and statement analysisKey success factorsNetwork analysisValue chain analysis
References
Ballou, R.H. (2004). Business Logistics/Supply Chain Management, 5th edition. Upper SaddleRiver, NJ: Pearson Education, Inc., pp. 1–789.Bowersox, D.J., and D.J. Closs (1996). Logistical Management. New York, NY: McGraw-Hill, pp.1–725.Bowersox, D.J., Closs, D.J., and R.W. Drayer (2005). "The digital transformation: Technology and
beyond," Supply Chain Management Review, 9, pp. 22–29.Brown, J.R., Dant, R.P., Ingene, C.A., and P.J. Kaufmann (2005). "Supply chain management and theevolution of the "Big Middle," Journal of Retailing, 81, pp. 97–105.Cotrill, K. (2005). "Best Buy's customer facing supply chain," Supply Chain Strategy, 2, Dec–Jan.Dewitt, W., Keebler, J.S., Min, S., Nix, N.W., Smith, C., and Z.G. Zacharia (2001). "Defining supplychain management," Journal of Business Logistics, 22, pp. 1–25.Dignan, L. (2004). "Oh yeah, the computers," Baseline, 38, December, p. 24.Fawcett, S.E., and G. Magnan (2005). "Beware the forces that affect your supply chain," SupplyChain Strategy: A Newsletter from Harvard Business School Publishing and the MIT Center forTransportation and Logistics. Harvard Business School.Fiala, P. (2005). "Information sharing in supply chains," Omega, 33, pp. 419–423."Global supply chain management study" (2003). Deloitte Touche Tohmatsu Global Homepage.(Accessed January 23, 2006):http://www.deloitte.com/dtt/research/0,1015,sid%253D%2526cid%253D18503,00.html.Huan, S.H., Sheoran, S.K., and G. Wang (2004). "A review and analysis of supply chain operationsreference (SCOR) model," Supply Chain Management, 9, pp. 23–29.Jorgensen, B. (2006). "How healthy is your supply chain?," Electronic Business, 32, pp. 16–18.Kay, E. (2005). "Sears holding corp. faces massive supply chain," Frontline Solutions, 6, pp. 14–15."Lampert defends Sears" (2005). Home Textiles Today, 27, December 12, pp. 1–19, 2p.Lee, H.L. (2004). "The triple-A supply chain," Harvard Business Review, 82, October, pp. 102–112.Liker, J.K., and T.Y. Choy (2004). "Building deep supplier relationships," Harvard BusinessReview, 82(12), December, pp. 104–113.Patterson, S. (2005). "Supply base optimization and integrated supply chain management," ContractManagement Magazine, January, pp. 24–35."Putting an end to islands of manufacturers" (1998). Modern Materials Handling: Special Report,53, pp. 40–41."SCOR version 7.0 overview" (2006). Supply-Chain Council, January 14: http://www.supply-chain.org/site/scor7booklet.jsp.Slone, R.E. (2004). "Leading a supply chain turnaround," Harvard Business Review, 82, October, pp.114–121.Trunick, P.A. (2005). "Forecast 2006: In search of better practices," Logistics Today, 46, December,pp. 1–8.
Endnotes
1 Fiala, 2005.2 Ballou, 2004.3 Mentzer, J.T., DeWitt, W., Keebler, J.S., Min, S., Nix, N.W., Smith, C., and Z.G. Zacharia (2001)."Defining Supply Chain Management," Journal of Business Logistics, Vol. 22, No. 2, pp. 1–25.4 Ballou, 2004.5 Ballou, 2004.6 Brown, Dant, Ingene, and Kaufmann, 2005.

7 Modern Materials Handling, 1998.8 Lee, 2004; Liker and Choy, 2004.9 Bowersox, Closs, and Drayer, 2005.10 Patterson, 2005.11 Bowersox and Closs, 1996.12 Bowersox and Closs, 1996, p. 89.13 Fiala, 2005.14 Deloitte Global Supply Chain Management Study, 2003.15 Brown, Dant, Ingene, and Kaufmann, 2005.16 Lee, 2004, p. 9.17 Huan, Sheoran, and Wang, 2004.18 Ibid.19 All rules adapted from: Fawcett, S.E., and G. Magnan (2005). "Beware the Forces that Affect YourSupply Chain." Supply Chain Strategy: A Newsletter from Harvard Business School Publishing andthe MIT Center for Transportation and Logistics. Harvard Business School.20 Lee, 2004.21 Lee, 2004.22 Lee, 2004.23 Slone, 2004.24 Lee, 2004.25 Jorgensen, 2006.26 Sears ROA was 8.4%, and asset turnover was 0.82 in 2002 (Brown, Dant, Ingene, and Kaufmann,2005). By comparison, Best Buy had inventory turnover of 9.9 in 2002, rising to 10.1 in 2003.27 "Sears Inside" strategy moves Sears brands into Kmart stores; Sears Essentials concept gives Searsoff-mall locale.28 Lee, 2004.
11Benchmarking Analysis
Short Description
Benchmarking is a method by which an organization identifies and examines key facets of anotherentity and then implements the learning from the examination into its own operations. Almost anythingcan be benchmarked, such as a campaign, product, service, practice, process, or strategy, as long as itcan be satisfactorily defined, measured, and compared to similar features in the comparisonorganization. Properly used, benchmarking can be a powerful learning tool and help the benchmarkingorganization to gain advantages over competitors, such as reducing costs, increasing productivity, andbetter aligning product/service features to customer needs.
Background
The first BCA application of benchmarking started in the mid-1950s through the practice ofcompetitive financial ratio comparison. Comparative ratio analysis was often used as a component ofindustry analysis in order to determine the firm's relative financial performance as a gauge of thefirm's competitive position. Comparing a financial ratio of the firm against that of its industry rivals,however, gives no indication regarding the underlying reasons for any performance divergence. Assuch, the value of comparative ratio analysis as a strategic tool proved to be limited.Benchmarking was developed to fill this analytical vacuum offering a methodology to determine howand why some organizations achieve superior and sustained financial performance—the hallmark ofcompetitive advantage. It provided the link between the result of competitive advantage (i.e.,outstanding profits) and its root cause (i.e., excellent processes and practices).One of the first firms to use benchmarking, or "industry tours" as the Japanese called them, wasToyota. This occurred when Toyota sent a number of their key people to the U.S. to understand andmonitor U.S. manufacturing processes after World War II. The Japanese executives took the ideasback to Japan and adapted and improved on them.In the 1970s, Xerox realized that in order to stay competitive with rapidly strengthening foreigncompetition in copier markets, it needed to improve its manufacturing process. The improvements itachieved through the application of benchmarking led it to adopt the method as a corporate-widepractice.Benchmarking involves examining firms with a world-class product/service, process, or strategy andincorporating the best ideas from them into your own business in order to gain a competitiveadvantage. Benchmarking is an ongoing process and should not be done as a one-off event to correctproblems. Ideally, it should be employed as a proactive tool to stay one step ahead of thecompetition.The original focus of benchmarking in the 1980s and early 1990s was more at the product level—

comparisons of competitor's products within the same industry. It then evolved into benchmarkingbusiness processes, practices, policies, and corporate strategies in unrelated industries.Benchmarking does not have to be done just on a competitor—it can also be done on anotherdepartment or division within the same firm, or on the practices of a firm in a totally unrelatedindustry. For example, if a firm in the hotel industry has a billing procedure that is world-class, aconstruction firm might use it to improve their own billing procedure. Benchmarking generallyinvolves the support of the entity that has the better process; this differs from competitor analysis,whereby the examining firm lacks the support of the entity.As mentioned, an issue, practice, policy, product/service, process, or strategy can be benchmarked.Benchmarking products or services usually involves examining factors such as price, technicalquality, ancillary product or service features, speed, reliability, and other performance characteristicsthrough direct product or service comparison. Process benchmarking involves closely examiningspecific work processes, such as billing systems or production line processes. Benchmarkingstrategies involves examining the successful long-range planning and implementation techniques otherfirms use to be successful in the marketplace. Strategic benchmarking provides long-term benefits andmay take time for results to show, whereas with the other two benchmarking categories, the resultsmay show up immediately.
Strategic Rationale and Implications
Benchmarking gives the analyst many strategic benefits. The main advantage is that, properlyemployed, it can help a firm gain an advantage over its competition. It also allows for realistic targetsand goals to be defined for an organization; for the validation of the strengths and weaknesses of afirm through hard numbers; and finally, the deciphering of future trends in the industry.Benchmarking can provide an efficient and effective means for a firm to take the best ideas from otherfirms, integrate them into their own, and take actions that may provide it with a strong advantage overtheir competitors. For example, if two firms are competing fiercely with each other and one of themdecides to benchmark an exceptional customer service model, it could win the battle for market shareand leave its competitor scrambling to recover.Realistic targets and goals can be set by an organization through the use of benchmarking becauseanother firm has already demonstrated that it is able to achieve a performance level that is desired bythe benchmarking organization, thereby giving it something tangible to work toward. Benchmarkingefforts should focus on those projects that relate directly to the firm's overall strategy and provide thegreatest room for improvement. For example, Federal Express ships packages across the worldeveryday. One of its main strategies is to ensure each customer receives their package on time and ingood condition. Therefore, Federal Express spends most of their benchmarking efforts on ensuringthat its customer service processes are the best.1Another reason to use benchmarking is that it helps to validate an organization's strengths andweaknesses through the identification and uncovering of empirical data in the form of hard numbers.Usually analysts have a good idea of their firm's strengths and weaknesses; however, having hardnumbers to back this up rather than just opinions increases confidence in the process. It shows howstrong a strength or weakness is over competitors in a particular area, as the benchmarking datashows the actual degree to which the firm is performing against a standard.

Benchmarking can also assist the analyst to determine the future trends in the industry, whichpotentially can play a significant role in management's strategy. Management is constantly scanningthe environment for trends five to 10 years in the future, and benchmarking gives managers anothermeans for doing this. For example, when computers were becoming common in the workplace, ananalyst who was benchmarking a firm with excellent response rates through direct mailing might haverealized that one-to-one database marketing was going to be the trend and build this into her strategy.This shows how benchmarking can allow a firm to be proactive rather than reactive to trends.
Taxonomy of Benchmarking
There are four different types of benchmarking, each with different applications but with significantcrossover potential around the same purpose:
Internal benchmarking—Involves the measurement and comparison of best practices within thefirm. For example, one division or strategic business unit may share information on bestpractices with another division in the same company. This is often the type of benchmarking thatfirms start with for several reasons. First, it is relatively easy, as the necessary data is in-houseand cooperation is easier to attain than in external benchmarking. Second, it can serve as a pilotstudy for future external benchmarking projects providing a low-risk learning environment andsecuring motivational early successes or "quick hits." Third, internal benchmarking is anexcellent way to gain a solid understanding of the firm's own value chain providing thenecessary base from which to compare against best practices of other organizations. Fourth, italso provides information with which to strengthen the reciprocal relationship with futurebenchmarking partners discussed next. Despite these benefits, it is important for the firm to moveout of internal benchmarking fairly quickly, as it can rapidly degenerate into a close cousin of thetraditional insularity it was designed to ameliorate.Competitive/external benchmarking—Refers to the benchmarking of competing firms in thesame strategic group or in the same industry. In contrast to internal benchmarking, this type is themost difficult to perform because competitors are often understandably loath to sharecompetitively sensitive information with direct competitors. Additionally, certain forms ofexternal benchmarking by direct market competitors may be considered by regulators astantamount to collusion. Despite these obstacles, competitive benchmarking is extremelyvaluable because it provides information on similar processes that the firm is directly competingon. There are two ways to effectively supplement any competitive benchmarking data that issecured. The first is to supplement any "hard" competitive data with "softer" qualitative datagleaned from customers and suppliers of the benchmarked competitor. The second method is touse anonymous benchmarking studies conducted by industry associations or consultants, as theyoften provide much valuable information on best practices while protecting against competitiveand legal sensitivities.Other industry benchmarking—Includes benchmarking organizations not in direct competitionwith the benchmarking firm. This type of benchmarking involves evaluating best practices ofnon-rival firms, evaluating best practices of potential rivals using similar processes in anunrelated industry, or evaluating best practices of potential rivals using different processes in an
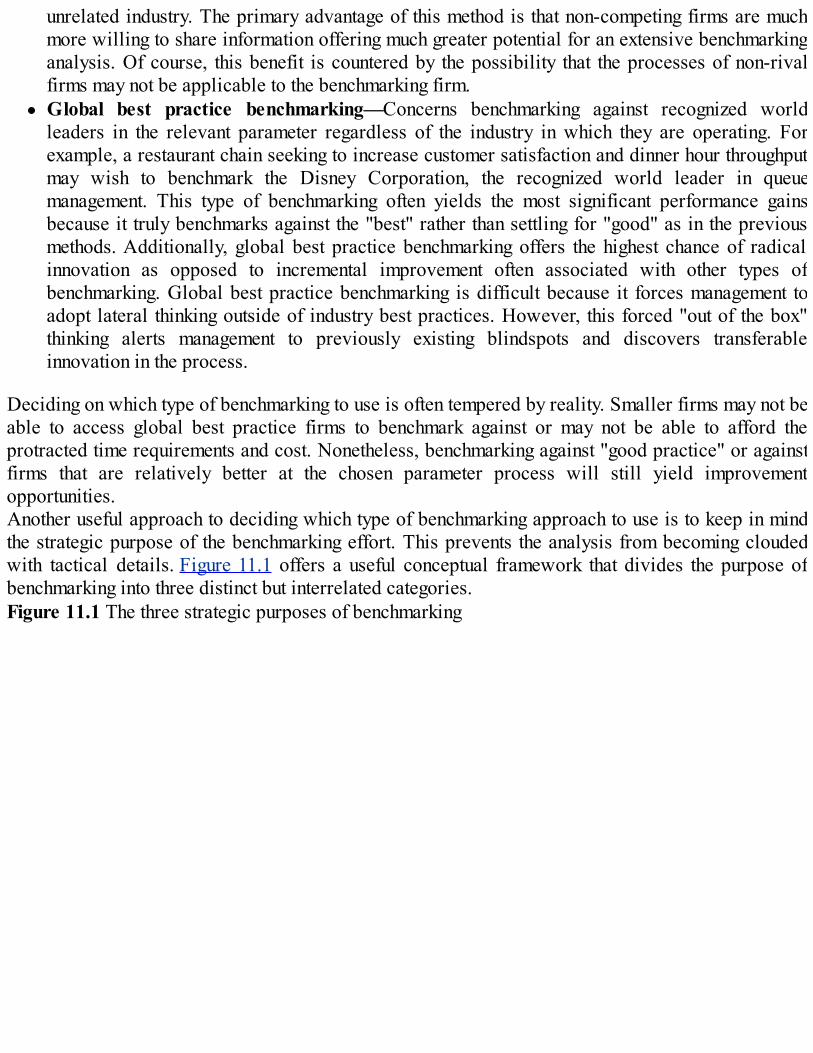
unrelated industry. The primary advantage of this method is that non-competing firms are muchmore willing to share information offering much greater potential for an extensive benchmarkinganalysis. Of course, this benefit is countered by the possibility that the processes of non-rivalfirms may not be applicable to the benchmarking firm.Global best practice benchmarking—Concerns benchmarking against recognized worldleaders in the relevant parameter regardless of the industry in which they are operating. Forexample, a restaurant chain seeking to increase customer satisfaction and dinner hour throughputmay wish to benchmark the Disney Corporation, the recognized world leader in queuemanagement. This type of benchmarking often yields the most significant performance gainsbecause it truly benchmarks against the "best" rather than settling for "good" as in the previousmethods. Additionally, global best practice benchmarking offers the highest chance of radicalinnovation as opposed to incremental improvement often associated with other types ofbenchmarking. Global best practice benchmarking is difficult because it forces management toadopt lateral thinking outside of industry best practices. However, this forced "out of the box"thinking alerts management to previously existing blindspots and discovers transferableinnovation in the process.
Deciding on which type of benchmarking to use is often tempered by reality. Smaller firms may not beable to access global best practice firms to benchmark against or may not be able to afford theprotracted time requirements and cost. Nonetheless, benchmarking against "good practice" or againstfirms that are relatively better at the chosen parameter process will still yield improvementopportunities.Another useful approach to deciding which type of benchmarking approach to use is to keep in mindthe strategic purpose of the benchmarking effort. This prevents the analysis from becoming cloudedwith tactical details. Figure 11.1 offers a useful conceptual framework that divides the purpose ofbenchmarking into three distinct but interrelated categories.Figure 11.1 The three strategic purposes of benchmarking
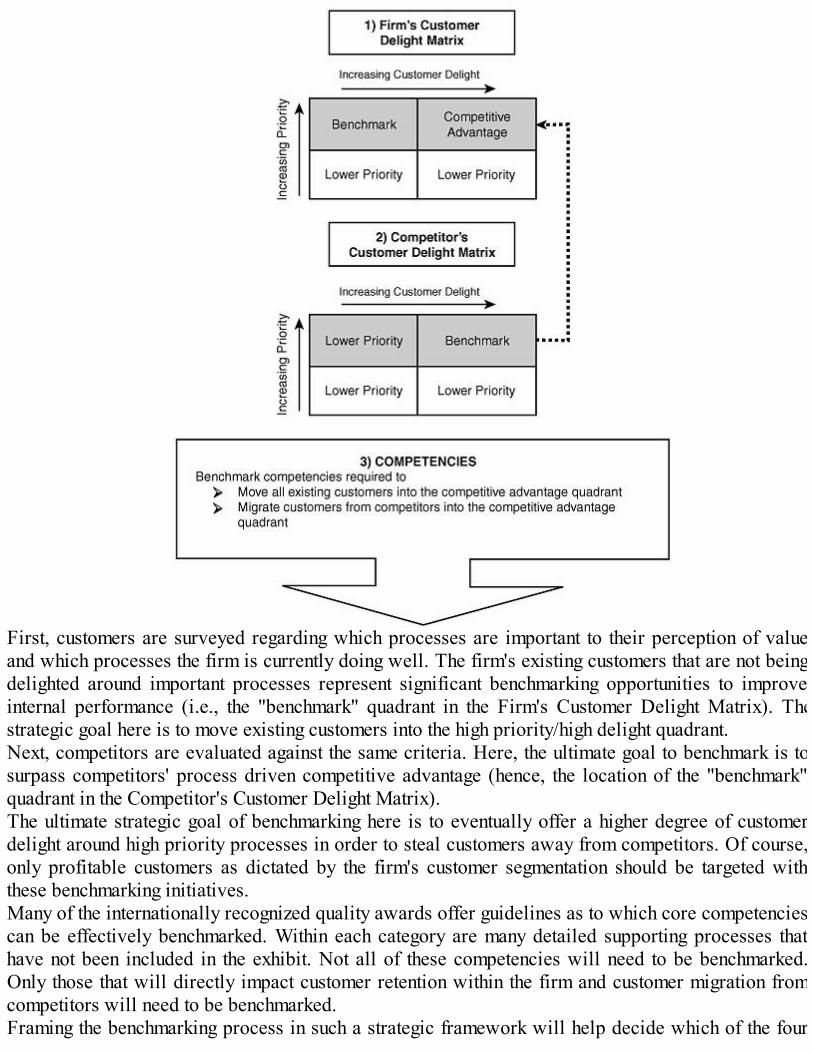
First, customers are surveyed regarding which processes are important to their perception of valueand which processes the firm is currently doing well. The firm's existing customers that are not beingdelighted around important processes represent significant benchmarking opportunities to improveinternal performance (i.e., the "benchmark" quadrant in the Firm's Customer Delight Matrix). Thestrategic goal here is to move existing customers into the high priority/high delight quadrant.Next, competitors are evaluated against the same criteria. Here, the ultimate goal to benchmark is tosurpass competitors' process driven competitive advantage (hence, the location of the "benchmark"quadrant in the Competitor's Customer Delight Matrix).The ultimate strategic goal of benchmarking here is to eventually offer a higher degree of customerdelight around high priority processes in order to steal customers away from competitors. Of course,only profitable customers as dictated by the firm's customer segmentation should be targeted withthese benchmarking initiatives.Many of the internationally recognized quality awards offer guidelines as to which core competenciescan be effectively benchmarked. Within each category are many detailed supporting processes thathave not been included in the exhibit. Not all of these competencies will need to be benchmarked.Only those that will directly impact customer retention within the firm and customer migration fromcompetitors will need to be benchmarked.Framing the benchmarking process in such a strategic framework will help decide which of the four
benchmarking types will yield results with the tightest application to the firm's strategy. It will alsohelp the firm decide which parameter(s) to benchmark around.Benchmarking can be conducted at three different levels in the firm's organizational hierarchy:
Strategic—Benchmarks around the critical success factors that the firm must perform well inorder to sustain its competitive position within its industry. Some examples include customervalue monitors, hurdle rates of return, operational efficiency, market share, etc.Functional—Benchmarks around the processes specific to the various functional areas of thefirm such as marketing, operations, finance, etc.Operational—Specific, tightly defined operational benchmarks that guide staff on the "shopfloor" and the "front lines" to excellent operational performance. For example, defects per houron an assembly machine or complaints per day in a service context may be chosen as operationalbenchmarks.
The three different purposes of benchmarking reflect the hierarchy that lies at the root of thismanagement tool. At the top of the hierarchy are strategic benchmarks that culminate in firm-wideperformance. The next lower benchmark level, functional benchmarks, support strategic benchmarksand are the culmination of the lowest level, the operational benchmarks. In this light, benchmarkingcan be seen as one way to operationalize organizational change within a learning context. Often, topmanagement is directly concerned with strategic benchmarks, middle management with functionalbenchmarks, and staff with operational benchmarks. Not only does this properly engage everyone inthe benchmarking process, it also ensures that all of the context levers are being pulled in the samedirection.Benchmarking is also often used as a vehicle for organizational change in concert with several othermethods of organizational change; namely balanced scorecard, business process reengineering, andorganizational learning. An extremely important aspect of the benchmarking philosophy is trust andopen communication. As such, the integrity and ultimate success of benchmarking depends onadherence to the well-accepted bilateral codes of conduct. One of the best ethical codes has beendeveloped by the American Quality and Productivity Center and can be found athttp://www.apqc.org/free/conduct.htm.
Strengths and Advantages
Powerful Competitive Analysis Tool
Benchmarking offers an excellent tool for finding opportunities to maintain the relativecompetitiveness of the firm. It provides the analyst a methodology that, at a minimum, will offer apath to achieve competitive parity with rivals. Benchmarking results in increased self-knowledge ofboth the analyst's internal organizational strengths and weaknesses, as well as those of competitors. Intoday's turbulent competitive environment, benchmarking offers an effective coping mechanism for thefirm to adapt to change by leveraging the knowledge of others.

Objective Stretch Goal Setting and Performance Measurement
Benchmarking heightens the firm's sensitivity to the fact that absolute improvements from internalhistorical performance may not be sufficient for competitive success. Rather, the explicit outward-looking orientation of benchmarking is an excellent prescription to correct strategic myopia. Often,benchmarking provides the motivation necessary to achieve stretch goals.
Flexibility
Benchmarking is an extremely flexible management tool in that it supports other equally importantstrategic change initiatives within the firm such as organizational learning and business processreengineering. It can be used to improve operations management, relative cost performance, andsecure temporary competitive advantage.
Removal of Blindspots
Competitive benchmarking will alert the firm to at least two important elements that are commonly thesource of blindspots. One, knowledge of rivals' process excellence and capabilities will help toprevent the firm from underestimating the potential competitive response to its own strategicinitiatives. Two, knowledge of potential rivals' process excellence and capability will give the firmknowledge of the potential for industry migration. This type of knowledge is becoming especiallyimportant as many value chains are being reconfigured as a result of the liberating economics ofinformation.
Improves Cost Efficiencies and Quality
By examining other firm's higher-performing processes, a firm will find better ways of performingtheir own processes. It could mean that it will find a better method of production that increases thenumber of items produced in a given day, an enhanced way to make a product last longer, or a bettermethod of providing services to customers. The end result, however, will be a demonstrableimprovement that can affect the firm's profitability.
Not Reinventing the Wheel but Redesigning It
The cost for any firm to develop a new product can be enormous, not to mention the level of riskassociated with a particularly daring new product. Much research goes into developing original
products and processes. Benchmarking has the advantage of examining what someone else hasalready done and fine tuning it to fit the needs of the firm. This provides an opportunity to comethrough with an incremental gain rather than a significant, green-field product innovation just toremain competitive.
Media Recognition
The media recognizes firms that excel at specific practices. Firms known to have "best practices" oroutstanding practices often get these reported in industry publications, local media, or even inresearch papers, business cases, professional meetings, or through business school instructionalchannels. The media recognition that comes from benchmarking successes can help supportimprovement of the benchmarking firm's financial performance including share performance.
Requirement for Other Certifications
Firms are often required to employ benchmarking in order to achieve various forms of publiccertification, including many of the ISO series standards. For example, the Malcolm BaldridgeNational Quality Award in the U.S. is awarded to firms that have a strong benchmarking program inplace, and it is the highest honor offered in the U.S. for quality and performance excellence. Othercountries' national awards also require organizations to perform benchmarking in order to be eligibleto receive their awards.
Creates an Innovative Culture Open to New Ideas
Benchmarking has the tendency to create a workplace that is always open to new ideas. It requiresanalysts and managers to think about how something may be done better elsewhere, thereby drivingout the "NIH" (not invented here) syndrome from a firm's practices. If management is alwaysemphasizing the importance of being the best, it requires frequent change to occur and results inemployees devoted to always improving the firm.
Weaknesses and Limitations
Copycat Syndrome
One of the strongest critics of the benchmarking approach has been Porter. His main oppositionrevolves around the fact that operational effectiveness is not strategy. As such, he asserts that

benchmarking should not be elevated to the status of strategic management. It should only beconsidered as a tactical management tool that is a necessary but insufficient condition for strategicsuccess. The underlying rationale of benchmarking refutes one of the main tenets of sustainablecompetitive advantage—inimitability. Simply put, best practices are easily copied, granting all rivalsabsolute gains along the productivity frontier at the expense of relative gains in strategic positioning.The core argument of Porter is that benchmarking only allows a firm to mimic the processes of rivals.Legitimate strategy, on the other hand, rests on the ability to do the same processes differently or topursue entirely different processes and practices. In industries where benchmarking is prevalent,strategy suffers two blows.First, to the effect that benchmarking often becomes an industry-wide obsession, the attractiveness ofthe industry structure declines as gains from productivity translate into consumer and supplier benefitsrather than producer benefits. Second, the strategic vision of participating firms becomes increasinglyblurred as they focus on operational effectiveness to the exclusion of strategic positioning. As aresult, the industry structure erodes even more, causing yet another "race to the bottom" as firms onceagain push out the productivity frontier with no accruing individual benefit. This reinforcing cyclerepresents a decidedly contrarian viewpoint to the acclaim that has embraced benchmarking fromother corners. This is not to discredit benchmarking, but rather, to cast a reality check on its strategicfunction. Benchmarking only represents table stakes. Walking away with the kitty remains whollycontingent upon creative strategic thinking, not imitation.
High Rate of Failure
Formal benchmarking projects often fail because the proper amount of planning with regards toorganizational readiness has not been done. Careful attention must be paid to such elements asforming a complementary mix of personnel composing the various benchmarking teams, psychologicalpurchase, and demonstrable commitment of top management, reducing lead time before tangibleresults become visible, etc. Despite the fact that planning is the most critical success factor, it is oftengiven short shrift as firms plunge headlong into the sexier aspects of the actual benchmarking process.
What Works Well in One Organization Might Not Work inAnother
One of the weaknesses of benchmarking is that a firm may have a proven practice that works well forit, but its application may not produce similar results in another organization. Although a firm may bebenchmarking a firm that is receiving extraordinary results through its best practice, the benchmarkermay not be able to significantly improve its own process, if at all, due to a variety of factors. Thefirm's culture, history, markets, structure, leadership, or business model, among other things, mayprevent the benchmarker from achieving desirable results. With benchmarking, it is particularlyimportant not to merely copy the best practices of the benchmarked firm but, rather, to adapt them touniquely fit into the benchmarker's firm.
Benchmarking Is Resource Intensive
There are many costs involved in benchmarking. These can include the direct costs of sending peopleout to observe other organization's processes, training staff to conduct the benchmarking process, aswell as the costs needed to implement the identified changes throughout the firm. A multi-firm, cross-industry benchmarking consortium can require significant amounts of an analyst's or executive's time.It is therefore important to ensure that the organization has made the appropriate resource investmentsin order to properly perform the benchmarking process. There must be support from top managementas well as the widely held belief of needing change in the organization. Benchmarking always worksbest when it is done over time and seldom delivers success when it is done as a one-off exercise orproject.
No Firm Does Everything the Best
A firm may have a world-class process; however, that does not mean that all of its other processesare world class. Often, a benchmarking organization is tempted, usually due to resource constraints,to benchmark multiple processes of a single partner even though some of the target's processes maynot have been demonstrated as outstanding. Therefore, it is recommended to find the bestbenchmarking partner for each practice needing significant improvement.
Low-Performing Firms Have a Disadvantage
Low-performing firms have been shown in some studies to be negatively impacted frombenchmarking.2 The reasons for this could be that low-performing firms may not feel comfortableapproaching higher-performing firms and therefore settle on a mediocre firm to benchmark. In thesecases, the resources needed to implement the change and perform the benchmarking end up being verycostly for something that doesn't greatly improve performance.
Some High-Performing Companies May Not Be Willing to ShareInformation
Benchmarking involves receiving a lot of information from the benchmarking partner and, therefore,some firms may be unwilling to open their processes to scrutiny and share their sensitive informationfor fear it will be leaked to competitors. Also it may be hard to benchmark a competitor for obviousreasons, but if the competitor wants something in return from the benchmarker, then it may be possibleto proceed.
Process for Applying the Technique

The process for applying benchmarking is fairly generic. Although some firms employ a four-stepmodel, others may use 10 to 12 steps or more; however, there is a fair degree of commonality of theactivities that need to be undertaken to conduct a successful benchmarking process. In this chapter'sdiscussion, the benchmarking process we describe consists of six steps, as follows:
1. 1. Identify the processes that need to be benchmarked.2. 2. Identify performance measures.3. 3. Evaluate your own firm's capabilities.4. 4. Identify firms to be benchmarked.5. 5. Conduct research from selected firms.6. 6. Analyze the collected data and develop an action plan.
Step 1: Identify the Processes That Need to Be Benchmarked
Benchmarking is a process that requires continuous monitoring of the environment for new and betterpractices, products, or services. Anything that can be observed or measured can be benchmarked.Areas of benchmarking include products or services, work processes, support functions,organizational performance, and strategies. Table 11.1 shows some key areas that can bebenchmarked.Table 11.1Common Areas for an Analyst to Benchmark
Some questions that managers should ask themselves are the following:
Is the topic important to customers?Is the topic consistent with the mission?Is the topic significant in terms of costs or key non-financial information?What processes are critical to our success?What problems do we need to overcome?Is the process resource intensive?What factors are causing the most problems?Does the project have a high potential for improvement?What functions have the greatest effect or potential for differentiating the organization from itscompetitors?
Benchmarking tasks should be prioritized for their importance to the overall mission of the firm,department, or unit seeking performance improvement.
Step 2: Identify Performance Measures
Once the topic to be benchmarked has been identified, measures of how well the current process,service/product, or strategy are performing need to be defined. This allows for the establishment ofindicators of how well a function is performing and for comparisons between it and the world-classfunction.In order to identify these measures, develop a detailed list of factors, then cut down the list to keysteps for those that will have the greatest impact. It is important to identify key measurements and notto make the list too long, as it is very costly if there are too many factors. Furthermore, thebenchmarking partner does not have a lot of time to provide large amounts of data.It is important to understand the critical success factors in the process that will help to identify keydrivers and measures of performance. It is also important when defining key performance measuresthat the data can be obtained from the benchmark partner. Ensure that the data retrieved fromcompetitors is in the same format so that apples can be compared to apples. Figure 11.2 outlinessome measures that might be considered for the benchmarking topics outlined in Step 1.Figure 11.2 Key performance measures

Step 3: Evaluate Your Own Firm's Capabilities
In order to be able to evaluate a benchmarking partner's capabilities, it is important that thebenchmarker know its own processes first. There are three important reasons for this:
The extent for improvement opportunities may not be fully realized.Your own capabilities may be overestimated or underestimated.It allows for greater productivity when conducting the collection of data from the benchmarkingpartner.
Opportunities may be missed if you do not know your own process, as you might not consider a factorwhen doing the benchmarking process that might have been evident if you had first evaluated yourown process. Also if you do not look at your own operations, you may not know how you compare onfactors to the partner—you may feel you are strong in that certain function, when really, you are veryweak. Finally, knowing your own operations allows you to easily identify performance gaps andtherefore spend time on those areas that need to be corrected, rather than on those that are already

strong.
Step 4: Identify Firms to Be Benchmarked
As it can be costly to perform the benchmarking process, it is important to select firms that are world-class leaders in a certain area. The benchmarking partners could be in the same industry or in adifferent industry. In order to select firms to benchmark, create a list of potential partners by lookingat media releases, literature from professional associations, talking to consultants or experts in thefield, reading through company literature, or looking for special award winners such as the MalcolmBaldrige National Quality Award.When you have a long list of firms, you need to narrow it down to those with whom you would like tobenchmark. Table 11.2 provides a list of some criteria that a firm may consider when searching forbenchmarking partners.Table 11.2Criteria to Select Benchmarking Partners
In order to select a firm, the analyst may use a pass/fail elimination system, whereby if the firm doesnot meet a certain criteria, then they are automatically eliminated; or by a weighting system, wherebyeach criterion is assigned a weighting and the firms with the most favorable ratings are selected. If theweighted rating system is used, the analyst must be aware of the halo effect, whereby if the firm ratesfavorably on one criterion, although it may not be the best in another, it is still given a high markbecause it excels in one of the criteria. The weight that each firm is given for each criterion differsbased on the goal of the benchmarking process and the type of benchmarking being done. Forexample, a firm with a similar product may be given a low-importance weight for its product if theitem being benchmarked is the billing process.One of the most important criteria in selecting a firm is that it is willing to provide you with therequired information.Other factors that may help determine which firms to benchmark include the following:
Process technologyFinancial performance indicatorsDistribution channelsManufacturing approach and volumeDecision-making style of managementTravel costs involved

Type of business
Step 5: Conduct Research of Selected Firms
Once you have determined the performance measures that will be researched from Step 2, the actualcollection of data can begin. It is important to plan ahead for this stage in order to ensure that thecollection of data flows smoothly. The major concern is for the data to be reliable, accurate, timely,cost efficient, useful, and usable.Data can be found from many sources and can be primary or secondary in nature. The collection ofsecondary data is the first source that should be used, as it is much cheaper than collecting primarydata. Secondary data may include, but is not limited to, newspaper or magazine publications, archivalresearch, annual reports, industry journals, professional association reports, conference minutes, 10-K filings, experts, and universities. If the information that the firm is looking for is not found in thisfirst step, then primary research can be done. In order to conduct primary research, the followingresources are valuable: personal or onsite visits, telephone interviews, surveys, and focus groups.
Step 6: Analyze the Collected Data and Develop an Action Plan
This is the stage where a firm is able to identify the gaps between their performance and theirbenchmark partners. It also helps identify where a firm's strengths lie. Although the main goal is toidentify the strengths and weaknesses of the process, it is also important to project what the world-class standard will be in the next five to 10 years in this stage as well.The data analysis method should already be decided on before it is collected, leaving this stage to theactual analysis of the data. Having the analysis methods in place will make the analysis go muchsmoother. One way to do this is to create a data matrix, as seen in Table 11.3.Table 11.3Benchmarking Data Organization Matrix Example: Factors Impacting Insurance AgentProductivity

This matrix should help the analyst to identify patterns in the data for both similarities anddifferences.Once the gaps between the benchmarking processes have been identified, their causes need to beunderstood so that the analyst can find out what the two firms do that is similar and different.It is important that the analyst ensures that the data is accurate. There could be many errors in the datacollection process that could dramatically affect results, such as differences in the makeup of acertain set of data or inaccuracies caused by different sources collecting the data.One of the most important components of this stage is to set a well-defined process to implement theimprovement initiatives and to monitor projected vs. actual progress on gap closure over time. Often,the source of improvement comes from adapting the best practices of the benchmarked firm to theunique circumstances of the benchmarking firm.Despite the length of time and effort required of benchmarking, it is critically important to realize thatbenchmarking is a snapshot in time. Dynamic competition necessitates constant monitoring of anychanges in the competitive environment to determine any impact on the benchmarked parameters. Inkeeping with the continuous improvement ethos, future performance needs to be projected andexisting benchmarks will have to be periodically adjusted and re-benchmarked in line withevolutionary change or performance slippage. Perhaps more importantly, innovative revolution willnecessitate new benchmarking around entirely new competitive processes.
Case Study: Delivery of Packages by Federal Express
Step 1: Identify the Process That Needs to Be Benchmarked
The question that must be answered in one area of FedEx's operations is, "How can we improve ourcustomer service between Toronto and Ottawa?"

Step 2: Identify Performance Measures
How many packages arrived at the wrong destination last year?How many packages arrived late last year?How many deliveries do we make each day from Toronto to Ottawa?How long on average does it take to request a delivery through a customer service agent?How many customers complained about the delivery of their package last year?How many packages were damaged last year?How much revenue was generated from packages shipped between the two cities?What costs did we entail in shipping these packages?
Step 3: Evaluate Own Firm's Capabilities
See the matrix developed in Step 5. This matrix incorporates the firm's capabilities as part of thewhole process of identifying the performance measures and benchmarks.
Step 4: Identify Firms to Be Benchmarked
United Parcel ServiceDHLCanada PostUnited States Postal ServicePurolator
Step 5: Conduct Research from Selected Firms
The following is a sample table demonstrating hypothetical performance data collected for the periodfrom November 1–30, of the prior year.
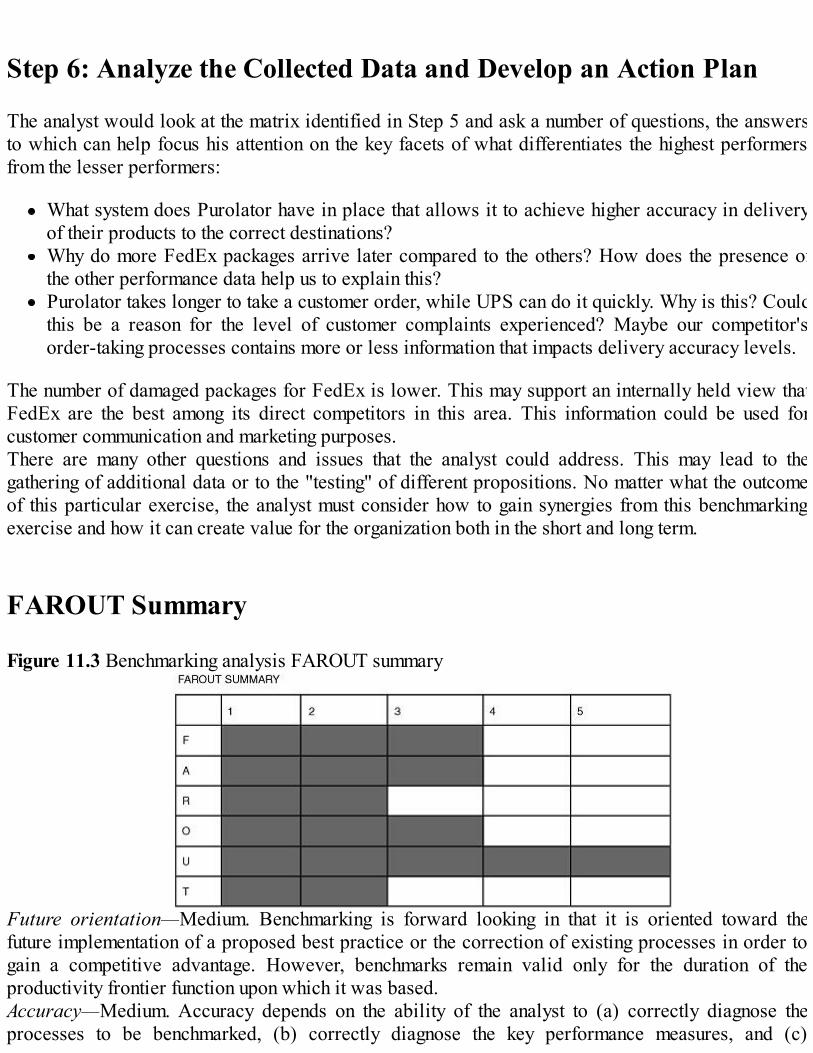
Step 6: Analyze the Collected Data and Develop an Action Plan
The analyst would look at the matrix identified in Step 5 and ask a number of questions, the answersto which can help focus his attention on the key facets of what differentiates the highest performersfrom the lesser performers:
What system does Purolator have in place that allows it to achieve higher accuracy in deliveryof their products to the correct destinations?Why do more FedEx packages arrive later compared to the others? How does the presence ofthe other performance data help us to explain this?Purolator takes longer to take a customer order, while UPS can do it quickly. Why is this? Couldthis be a reason for the level of customer complaints experienced? Maybe our competitor'sorder-taking processes contains more or less information that impacts delivery accuracy levels.
The number of damaged packages for FedEx is lower. This may support an internally held view thatFedEx are the best among its direct competitors in this area. This information could be used forcustomer communication and marketing purposes.There are many other questions and issues that the analyst could address. This may lead to thegathering of additional data or to the "testing" of different propositions. No matter what the outcomeof this particular exercise, the analyst must consider how to gain synergies from this benchmarkingexercise and how it can create value for the organization both in the short and long term.
FAROUT Summary
Figure 11.3 Benchmarking analysis FAROUT summary
Future orientation—Medium. Benchmarking is forward looking in that it is oriented toward thefuture implementation of a proposed best practice or the correction of existing processes in order togain a competitive advantage. However, benchmarks remain valid only for the duration of theproductivity frontier function upon which it was based.Accuracy—Medium. Accuracy depends on the ability of the analyst to (a) correctly diagnose theprocesses to be benchmarked, (b) correctly diagnose the key performance measures, and (c)

implement the required changes to close the distance between (a) and (b).Resource efficiency—Low to medium. Depends on the number of processes identified, the depth ofanalysis and the number of personnel engaged in the benchmarking process. Resource efficiencydepends in large part on the extent of data collection and analysis.Objectivity—Medium. The analysis and establishment of performance measures is subject toperception bias, particularly in defining the process to be measured and the evaluation criteria.Usefulness—High. Benchmarking provides not only improved costs efficiencies and quality forproducts and services, but also enhances the outward focus and innovation practices withinorganizational cultures.Timeliness—Low to medium. Benchmarking can be extremely comprehensive and covers all facets ofthe firm. Identifying the key processes that would benefit from benchmarking may take some time for aconsensus to be established. Additionally, correctly examining the intricate inter-relationshipsbetween different processes in an organization can take some time.
Related Tools and Techniques
Blindspot analysisCompetitor analysisCustomer segmentation and needs analysisCustomer value analysisComparative cost analysisFunctional capability and resource analysisIndustry structure analysisStrategic groups analysisSWOT analysisValue chain analysis
References
Aaker, D.A. (1998). Strategic Market Management, 5th Edition. New York, NY: John Wiley andSons.American Productivity and Quality Center (1994). The Best of Benchmarking: A Best PracticesGuide. Houston, TX: American Productivity and Quality Center.Bhote, K.R. (1989). "Motorola's long march to the Malcolm Baldridge National Quality Award,"National Productivity Review, Autumn.Bogan, C.E., and English, M.J. (1994). Benchmarking for Best Practices: Winning ThroughInnovative Adaptation. New York, NY: McGraw-Hill, Inc.Boxwell, R.J. (1995). Benchmarking for Competitive Advantage. New York, NY: McGraw-Hill.Camp, R. (1994). Business Process Benchmarking: Finding and Implementing Best Practices.Milwaukee, WI: ASQC Quality Press.Cook, S. (1995). Practical Benchmarking: A Manager's Guide to Creating a Competitive
Advantage. London, UK: Kogan Page.Deming, E.W. (1982). Quality, Productivity and Competitive Position. Center for AdvancedEngineering Study, Cambridge, MA: Massachusetts Institute of Technology.The Economist Intelligence Unit (1993). Global Benchmarking for Competitive Edge. London, UK:The Economist Intelligence Unit.Fuld, L.M. (1989). Monitoring the Competition: Find Out What Is Really Going on Out There.New York, NY: John Wiley and Sons.Garvin, D. (1991). "How the Baldridge Award really works," Harvard Business Review,November/December, pp. 80–93.Hammer, M. (1990). Reengineering Work: Don't Automate, Obliterate, July/August, 68(4), pp. 104–112.Harrington, H.J., and J.S. Harrington (1996). High Performance Benchmarking: 20 Steps toSuccess. New York, NY: McGraw-Hill.Jennings, K., and F. Westfall (1992). "Benchmarking for strategic action," Journal of BusinessStrategy, Fall, 13(3), pp. 22–25.Keehley, P., and S. Medlin, et al (1995). Benchmarking for Best Practices in the Public Sector. SanFrancisco, CA: Jossey-Bass, Inc.Main, J. (1992). "How to steal the best ideas around," Fortune, October, 126(8), pp. 102–106.National Institute of Standards and Technology (2004). "President and Commerce Secretary announcerecipients of nation's highest honour in quality and performance excellence," in the Award Recipientssection at Baldridge National Quality Program Web site.Porter, M. (1996). "What is strategy?," Harvard Business Review, 74(6), pp. 61–78.Spendolini, M.J. (1992). The Benchmarking Book. New York, NY: AMACOM.Society of Management Accountants of Canada (1993). Implementing Benchmarking. Hamilton:Canada.Society of Management Accountants of Canada (1995). Tools and Techniques for EffectiveBenchmarking Studies. Hamilton: Canada.Thor, C.G. (1995). Practical Benchmarking for Mutual Improvement. Portland, OR: ProductivityPress, Inc.Tucker, G.F., Zivian, S.M., and R.C. Camp (1987). "How to measure yourself against the best,"Harvard Business Review, January/February, 65(1).Watson, G.H. (1993). Strategic Benchmarking. New York, NY: John Wiley & Sons, Inc.Xerox Corporation (1988). Competitive Benchmarking: The Path to a Leadership Position.Stamford, Connecticut.
Endnotes
1 Bogan and English, 1994, p. 46.2 Harrington and Harrington, 1996, p. 134.

12McKinsey 7S Analysis
Short Description
The McKinsey 7S framework model is a diagnostic management tool used to test the strength of thestrategic degree of fit between a firm's current and proposed strategies. It is a management tooldesigned to facilitate the process of strategy implementation within the context of organizationalchange.
Background
Implementation has always been the difficult aspect of strategic management. Often the best-laid long-range plans have remained unimplemented because the organizational structure and culture have beenlacking. Although modern strategy theory offers the analyst a plethora of different models from whichto choose, there is a dearth of implementation methodology. The McKinsey 7S model was designed tofill this vacuum with a conceptual framework to guide the execution of strategy.In 1978, several consultants at McKinsey & Co.1 codeveloped the McKinsey 7S model. Theyrecognized a circular problem central to their client's failure to effectively implement strategy. Thelong-held conviction developed by Alfred Chandler in 1962 that organizational structure will followstrategy had been a prominent concept in modern strategy theory.Most strategies implicitly incorporate the assumption that structure follows strategy but offer noexecution guidance with regard to organizational structure. Because implementation is equallyimportant as conception, many strategies failed.The McKinsey 7S model challenged this implicit assumption by suggesting that the "structure followsstrategy" paradigm was not that at all; rather, not only must structure be actively managed, it must besupplemented with equal concern for organizational effectiveness as a whole.The McKinsey 7S model specially addresses the need to build a tight strategic fit between strategy,organizational structure, and five additional components of organizational effectiveness. Successfulimplementation of strategy requires explicit management of the interrelationships between these sevenelements. These seven elements of organizational design and effectiveness are discussed next:
1. 1 . Structure—The familiar organizational chart is a suitable proxy description of structure.Structure involves the reporting of relationships within a firm as well as the division andintegration of tasks. The choice of structure involves a myriad of tradeoffs. For example, a firm'sstructure may be centralized or decentralized, hierarchical or flattened, specialized orintegrated, or autonomous or outsourced. The focus on structure within the McKinsey 7S model,however, concentrates especially on two aspects of the realm of structure. First, the idea of thecoordination of all the aspects of structure in the support of strategy is prominent. Second is the

need to isolate those aspects that are critical to successfully managing and negotiating change inindustry evolution and new or revamped strategies.
2. 2 . Strategy—Among the many formal definitions of strategy, there are several common,dominant themes.Strategy is the set of competitive responses manifested through decisions and actions in responseto the firm's environment. Strategy aims to best position the firm's current capabilities andresources in a competitive marketplace to secure competitive advantage over time. Because thefirm's environment is constantly in a state of flux, so too must strategy change to protect andproject existing sources of competitive advantage.In addition, strategy must be designed to seek out new external opportunities and acquire orinternally develop the requisite resources and capabilities to exploit these environmentalchanges into new sources of competitive advantage. The focus on strategy within the McKinsey7S model is not on developing new strategies or protecting existing ones; rather, its inclusionunderscores the core theme of the model that asserts that strategy conception and formulation hasbeen well managed in many firms due to its emphasis through decades of reinforcement inbusiness schools and in the now-voluminous strategy literature. Problems in the other sixelements are more often the cause of ineffective implementation.
3. 3 . Systems—Systems encompass the flow of both primary and secondary activities that areimportant to the firm's daily functioning. These include core processes (for example, productdevelopment and operations management), as well as support activities (for example,information systems, accounting, and human resources). The important distinction that theMcKinsey 7S model makes with regard to systems is that changing systems is often a much lessdisruptive and more effective route to enhance organizational effectiveness, as opposed to themore traditional levers of manipulating strategy or structure.
4. 4. Style—Style refers to the actions and behavior of senior executives, rather than what they say.As such, the conduct of top management is an extremely valuable management tool that conveysand reinforces strong messages to stakeholders, and particularly employees, throughout theorganization. One of the most important barometers of executives' behavior is the way in whichthey spend their time. By concentrating their individual and collective attention on managingcritical success factors, executives can help their staff prioritize the essential activities that theorganization must perform well. Another important barometer of style is symbolic or signalingbehavior that can be seen as constantly reinforcing the fundamental value system of the company.By fostering a firm-wide "strategic conversation" composed of formal and informal symbols, topexecutives instill a positive culture consistent with the firm's strategic intent.
5. 5. Staff—The human resources of a firm are its most valuable strategic asset. The staff elementincludes both remuneration (compensation, incentives, and reward) and softer, more qualitative,motivational considerations. Specifically, in the 7S model, management attraction, recruitment,and development of employees are important to organizational effectiveness. Equipped with theorganization's culture and core values, managers will hopefully spend fruitful careers fosteringthese attributes to staff located in all parts of the firm. In this regard, putting young managers inpositions of authority close to the executive suite, with legitimate responsibility for some criticalaspect of the firm's business model and opportunities for advancement, will positively impactlong-term organizational effectiveness. By paying special attention to engaging the firm's futureexecutives in all seven elements of the model, the firm's future organizational effectiveness canbe successfully propagated.

6. 6 . Skills—The raw material of sustainable competitive advantage often lies in the intangiblecore competencies or skills of its people. The McKinsey 7S model focuses on skills becauseenvironmental change infers not only a change in strategy, but also an accompanying change inthe skill set of a firm's human resources. Successful organizational change often requiresincreased investment to acquire or develop new skills, along with reduced investment in theestablished skill set that was more closely attuned to the old business models. This transitiontoward new skills is a process that, if done poorly, will thwart the cultivation of conditionsnecessary to grow new organizational skills.
7. 7 . Shared values—Sometimes also referred to as "super-ordinate goals," shared valuesrepresent the collective value system that drives a firm's organizational culture. Often, sharedvalues are informal and go beyond the company's mission statement by encompassing intangiblessuch as strategic intent, underlying beliefs, mental mindsets, and future direction. Within the 7Smodel, shared values are commonly seen as the most fundamental building block of anorganization, thereby providing a foundation for the other six elements. Often, shared values areshort articulations of the essential meaning or driving force of the company. The difficulty, andhence value, of creating strong shared values within an organization is exemplified by theobservation that only exceptional firms are able to consistently leverage this phenomenon overtime.
Figure 12.1 is a schematic representation of the McKinsey 7S framework. This diagram identifies thesignificant cross relationships of the seven elements of organizational effectiveness.Figure 12.1 The 7S framework model2
There are four key insights that can be derived from this model. First, Figure 12.1 identifies the fiveother elements comprising organizational effectiveness in addition to the traditional strategy andstructure dualism; namely, systems, style, staff, skills, and shared values.Second, the lines connecting each element identify the mutual dependency between each element oforganizational effectiveness. Pulling one lever, as it were, will cause a ripple effect across the wholesystem. It is this concept of holistic interrelationships that runs through the most fundamental units of

the organization.The third insight is the assertion that strategic failure may well be attributable to inattention to anyone, or a combination of, the seven elements of strategic fit. This framework provides a correctivelens for the strategic myopia that often leads to inappropriate structure or poor strategy in the firstplace.The fourth insight comes from the shape of the diagram—the circular consistency of the modelfocuses the analyst's attention on the absence of hierarchical dominance. It encourages the analyst toconclude that no one element is more important than the others—each element is a necessary butinsufficient condition for organizational effectiveness. However, in some scenarios, one factor mayfigure more prominently than the rest. This lack of precision and high level of abstraction makes theMcKinsey 7S model very flexible.Taken together, these four insights have made an enormous contribution to modern strategy theory intwo powerful ways. First, the McKinsey 7S model introduced the importance of the qualitativefactors of organizational effectiveness to counterbalance the almost exclusive focus on strategy andstructure that pervaded previous thought around the management of organizational change. Second, itpushed the conceptual envelope away from an external environmental preoccupation to a moreholistic appraisal that includes a more realistic appreciation of the whole system—that is, both theorganization acting on its environment, as well as the environment acting on the organization.
Strengths and Advantages
The 7S model pays particular emphasis to a firm's strategy implementation. This key facet of thetraditional strategic management model was often given short shrift or even ignored in manypreceding management constructs. The McKinsey 7S model filled this analytical vacuum bysuggesting that strategic success in the competitive marketplace is also dependent on organizationaleffectiveness. This counteracted the disproportionate emphasis of previous models on external,economic, and marketplace factors. The McKinsey 7S model laid the groundwork for the increasingprominence of organizational dynamics in future models, such as core competency and resource-based theories.Further, the 7S model developed the concept that organizational effectiveness was not dependent onjust strategy and structure—a radical and much-needed departure from the confines of the decades-old (although admittedly still vibrant) "structure follows strategy" paradigm. The inclusion of theother elements of strategic fit broaden the analyst's scope to consider the possibility that for selectfirms, the reality of their context will be that strategy follows structure. At any rate, the analyst willsoon realize that organizational change requires strategic management of all seven elements ofstrategic fit, not just tinkering with one or two of the elements (traditionally only strategy andstructure).The greatest strength of the 7S model is in its comprehensiveness. Because the analysts must considereach of the seven broad-ranging constructs, as well as how each of them interacts with one another,they are unlikely to miss any potential gaps that may arise out of changed strategies or theirimplementation. This model is also one of the first to actually compel the analyst to consider strategyimplementation simultaneously with strategy development. These issues tended to be separated beforethe time of this model's introduction and popularization.

The 7S model was also one of the first to meld consideration of the "hard" (e.g., strategy, structure,and systems) and "soft" (i.e., shared valued, skills, staff, and style) aspects of the enterprise. Mostmodels before this one tended to focus most heavily on one side or the other, to the exclusion of theignored side of the equation. The 7S framework is valuable in supporting management thinking whenimplementing strategy and facilitating needed organizational changes.The 7S model also emphasizes to the analysts and their managers the need to coordinate key taskswithin the organization. The challenge lies in focusing on those dimensions that are important to theorganization's evolution. The organization must be able to refocus and reallocate efforts as crucialdimensions shift.The 7S model was also one of the first to help connect academic research with managerial practice.In particular, it emphasized how important shared values or corporate culture were in keeping theorganization in synch and in driving the successful execution of smart strategies. A critical result ofthis model was that enterprises could be viewed as independent social systems—whose artifacts inthe form of rituals, stories, symbols, and stated and exhibited values—create a powerful influence onemployee behavior and can be the difference between an organization operating in an empoweredfashion versus one that requires additional layers of bureaucracy to achieve its aims. This modelwould lead to a stream of subsequent academic research that has continued to inform consultants andmanagers to this day.
Weaknesses and Limitations
The primary weakness of the 7S is directly related to its greatest strength. Because the 7S requires theanalyst to consider not only the seven independent constructs, but also their interrelationships, theanalyst may miss some fine-grained areas in which gaps in strategy conception or execution cannaturally arise.There is little empirical support for the model or of its originator's conclusions.3 Indeed, severalyears after the model was popularized by Peters and Waterman in their best-selling 1982 book InSearch of Excellence, most of the companies that were highlighted had suffered from poorperformance and were no longer the paragons of excellence that had been originally touted.Despite the model's clear emphasis on looking inward at organizational factors and fits, it remainsdifficult to properly assess the degree of fit, particularly between strategy and the other elements.Strategy is the clear linking pin that should align the other elements, but this is far more complex toachieve in practice than a single construct can suggest.It is also difficult for analysts to explain, in practical terms, just exactly what should be done forimplementation in terms of using the model. The model encourages the analysts to consider the manyinteractions, but does not require them to consider the many different options available for changinginterrelationships among the seven concepts or most importantly, specify what order or sequencewithin which the needed changes should be made.The 7S is mostly a static model. It is useful for looking at a snapshot of the fit among the sevenconstructs at any single point in time; consequently, it can be difficult to use in recommending changesto relationships among the constructs over time, unless the model is developed, analyzed, and appliedon an ongoing basis—something that is rarely, if ever, done in practice due to the pragmaticconsiderations of time and effort required to effectively accomplish this outcome. As such, the
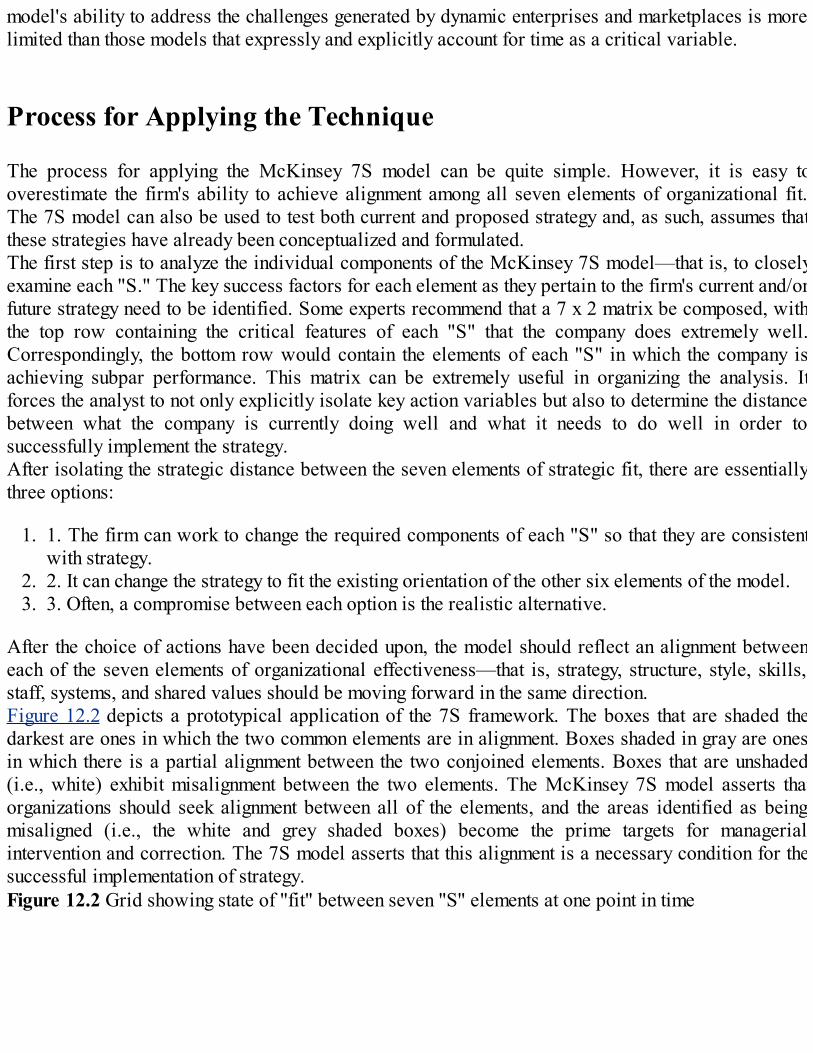
model's ability to address the challenges generated by dynamic enterprises and marketplaces is morelimited than those models that expressly and explicitly account for time as a critical variable.
Process for Applying the Technique
The process for applying the McKinsey 7S model can be quite simple. However, it is easy tooverestimate the firm's ability to achieve alignment among all seven elements of organizational fit.The 7S model can also be used to test both current and proposed strategy and, as such, assumes thatthese strategies have already been conceptualized and formulated.The first step is to analyze the individual components of the McKinsey 7S model—that is, to closelyexamine each "S." The key success factors for each element as they pertain to the firm's current and/orfuture strategy need to be identified. Some experts recommend that a 7 x 2 matrix be composed, withthe top row containing the critical features of each "S" that the company does extremely well.Correspondingly, the bottom row would contain the elements of each "S" in which the company isachieving subpar performance. This matrix can be extremely useful in organizing the analysis. Itforces the analyst to not only explicitly isolate key action variables but also to determine the distancebetween what the company is currently doing well and what it needs to do well in order tosuccessfully implement the strategy.After isolating the strategic distance between the seven elements of strategic fit, there are essentiallythree options:
1. 1. The firm can work to change the required components of each "S" so that they are consistentwith strategy.
2. 2. It can change the strategy to fit the existing orientation of the other six elements of the model.3. 3. Often, a compromise between each option is the realistic alternative.
After the choice of actions have been decided upon, the model should reflect an alignment betweeneach of the seven elements of organizational effectiveness—that is, strategy, structure, style, skills,staff, systems, and shared values should be moving forward in the same direction.Figure 12.2 depicts a prototypical application of the 7S framework. The boxes that are shaded thedarkest are ones in which the two common elements are in alignment. Boxes shaded in gray are onesin which there is a partial alignment between the two conjoined elements. Boxes that are unshaded(i.e., white) exhibit misalignment between the two elements. The McKinsey 7S model asserts thatorganizations should seek alignment between all of the elements, and the areas identified as beingmisaligned (i.e., the white and grey shaded boxes) become the prime targets for managerialintervention and correction. The 7S model asserts that this alignment is a necessary condition for thesuccessful implementation of strategy.Figure 12.2 Grid showing state of "fit" between seven "S" elements at one point in time

Case Study: Privatization of Kenya Airways in the NewMillennium
The 1960s were supposed to be a time of betterment and growth in Sub-Saharan Africa. The area wascompleting the decolonization process, and governments were creating new state-owned enterprises(SOEs) to lead their respective economies in major industrial, structural, and social improvement.However, these optimistic visions failed to materialize, as most SOEs were poorly run and almostnever profitable. By the 1980s, problems stemming from massive state intervention and a lack ofmarket forces led to economic disaster.Consequently, external pressures have forced these countries to fight against dictatorship andauthoritarianism in favor of democracy and privatization.Kenya Airways was originally established in 1977 as a corporation owned by the Kenyangovernment. Senior management was appointed by politicians and had virtually no airline experience.The company lacked structure and direction, had very little equipment (seven planes), and wasburdened with high interest foreign currency loans. By 1991, the airline was losing market share dueto poor service and unreliable flight schedules, and its debts were an enormous strain on the Kenyan

government. The only way to turn the fledgling airline toward profitability, it seemed, was toprivatize it.In 1991, the commercialization process began in order to prepare the airline for privatization. A newand capable management team was hired and given complete autonomy to restructure the company.Research was conducted to identify the needs of all stakeholders, and an IT department was createdto introduce new, consistent systems and controls for accounting, scheduling, operations, management,and ticketing. By 1994, the airline recorded its first profits and in 1995 created a strategic alliancewith KLM Royal Dutch Airlines. In 1996, the Kenyan Government sold 26% of its stock to KLM, andmost of the remainder of its stock to the Nairobi Stock Exchange, leaving only a 22% minorityownership block held in the airline.Privatization had forced Kenya Airways to become a self-sustaining profit-generating firm. It couldno longer rely on government protection or bail-outs.4 To successfully negotiate these challenges,Kenya Airways was required to assess threats and determine how to manipulate the seven elements ofstrategic fit to first survive the turmoil, and second to eventually prosper in a new competitiveenvironment (see Table 12.1).Table 12.1McKinsey 7S Comparison of Pre- and Postprivatized Kenya Airlines

Source: Tiller, 1997; Debrah and Toroitich, 2005; Major Milestones: Kenya Airways GlobalWebsite, 2006.
FAROUT Summary
Figure 12.3 McKinsey 7S analysis FAROUT summary
Future orientation—Medium to high. The McKinsey 7S model is forward looking in that it isoriented toward future implementation of proposed strategy or correction of existing organizationaleffectiveness to maximize the effectiveness of current strategy.

Accuracy—Low to medium. Accuracy depends on the ability of the analyst to: (a) correctly diagnosethe seven elements and their interactions; (b) correctly diagnose the key success factors; and (c)implement the required changes to close the distance between (a) and (b).Resource efficiency—Medium. This depends on the depth of analysis and the number of analystsengaged. Similarly, the comprehensiveness of internal consulting will dictate resource efficiency.Objectivity—Low. The requisite analysis is highly qualitative and subject to perception bias.Usefulness—Medium. The explicit purview of this model draws attention to what many other modelsignore. As such, the McKinsey 7S model is compatible with, and complementary to, a good number ofother management tools and techniques.Timeliness—Low to medium. A comprehensive McKinsey 7S model analysis is extremelycomprehensive and covers all facets of the firm. Additionally, correctly examining the intricateinterrelationships between the seven elements can require a substantial amount of time.
Related Tools and Techniques
Competitive benchmarkingCustomer segmentation and needs analysisCustomer value analysisFunctional capability and resource analysisSERVO analysisSWOT analysisValue chain analysis
References
Chandler, A.D. Jr. (1962). Strategy and Structure: Chapters in the History of the AmericanIndustrial Firm. Cambridge, MA: MIT Press.Darden Graduate Business School Sponsors (1983). American Telephone and Telegraph (A).Charlottesville, VA: University of Virginia.Debrah, Y.A. and O.K. Toroitich (2005). "The making of an African success story: The privitizationof Kenya Airways," Thunderbird International Business Review, 47(2), pp. 205-230.Hax, A.C., and N.S. Majluf (1983). "Organization design: A case on matching strategy and structure,"The Journal of Business Strategy, Fall, 4(2), pp. 72–86.Major Milestones at a Glance, Kenya Airways Global Website, accessed September 28, 2006 athttp://www.kenya-airways.com/kq/kqdispinfo.aspx?colm=69.Pascale, R. Managing on the Edge. London, UK: Penguin.Peters, T.J. (1984). "Strategy follows structure: Developing distinctive skills," CaliforniaManagement Review, Spring, 26(3), pp. 111–125.Peters, T.J., and R. Waterman (1982). In Search of Excellence. New York, NY: Harper and Row.Powel, T.C. (1992). "Organizational alignment as competitive advantage," Strategic ManagementJournal, February, 13(2), pp. 119–134.

"Privatization of Kenya Airways" (2005). Thunderbird International Business Review, March–April, 47(2), pp. 205–230. http://www.kenyaairways.com/root/pages/English/Home.asp (September8, 2005).Tiller, M. (1997). "A first for Africa: The privatization of Kenya Airways," Economic Perspectives:USIA Electronic Journals, 2(1), January, accessed September 28, 2006 athttp://usinfo.state.gov/journals/ites/0197/ijee/ej5case.htm.Waterman, R.H. Jr. (1982). "The seven elements of strategic fit," The Journal of Business Strategy,Winter, 2(3), pp. 69–73.Waterman, R.H. Jr., Peters, T.J., and J.R. Phillips (1980). "Structure is not organization," BusinessHorizons, June, pp. 14–26.
Endnotes
1 Waterman, R.H., Peters, T.J., and J.R. Phillips.2 Based on Peters and Waterman (1982).3 Pascale, 1990.4 Tiller, 1997; Debrah & Toroitich, 2005; Major Milestones: Kenya Airways Global Website, 2006.
13Shadowing
Short Description
Shadowing is one of the newer analytical techniques that monitors specific competitors or markets ina high degree of detail to learn how a specific competitor might think, reason, and react. It meanslearning as much as possible about a competing firm's managers in order to predict what they mightdo. The competitive knowledge afforded by shadowing will allow a firm to make reasonablyaccurate inferences regarding the strategic and tactical intentions of rivals.
Background
Shadowing is the commercial application of a concept long used by opposition politicians in theBritish parliamentary system and throughout the Commonwealth. Opposition members of legislativeassemblies or Parliaments regularly form "shadow cabinets," wherein each member of the oppositionparty follows and/or forecasts policy developments in each ministry or government department. Forexample, one opposition member of Parliament might be assigned to "shadow" the Ministry ofFinance. In this position, he or she would be given responsibility to do the following:
Monitor all changes in relevant policies such as tax, deficits, debt, and spendingTrack all changes in personnel within the Ministry of Finance, departments, and bureaucracyDevelop proprietary policy for her/his affiliated party as an alternative to the party in powerOffer rebuttals and critiques in response to recently developed initiatives to the party currentlyin powerForecast important issues in order to predict the government's response and to proactivelydevelop opposition policyBe prepared to assume the portfolio in the event of a change in power
All of these individual shadow members working together are known as the "shadow cabinet." Thisstrategic tactic has proved to be very effective in achieving the ultimate goals of opposition politicalparties. It has allowed political entrepreneurs to simultaneously counter the strategies of theincumbent government, as well as prepare for a hopeful electoral victory in the future by capturing amajority of the political "market."Since the late 1980s, shadowing has become an increasingly popular technique within the competitiveintelligence tactical toolkit. Many companies are now shadowing their competitors at a level of detailthat is of an order of magnitude higher than traditional environmental scanning and even competitorprofiling.Shadow teams today provide a mechanism for accessing internal resources, scanning the competitionand/or external environment, and integrating the insights to create new organizational learning. Fahey1
asserts that shadowing is useful when one or more of the following conditions prevail within a firm:
Managers have become complacent due to a firm's marketplace performance.A firm has become strongly committed to a set of assumptions underlying its historic strategy(and appears unwilling to evaluate them even in the face of significant marketplace change).The strategy planning process has largely degenerated into a routine (to be completed as quicklyas possible and reviewed maybe once a year).Little effort is being expended to search for new marketplace opportunities.
However, shadowing does not need to focus on existing direct competitors. One can addresssecondary or non-direct competitors or, even as Fahey suggests, one can create "invented"competitors. An invented competitor is a rival that could appear in the future but does not exist today.This approach may serve to explore what strategies might be possible at some future time; anticipatepotential new customer needs as well as the solutions required to satisfy them; identify possiblemarketplace opportunities that might otherwise be overlooked; and challenge your own firm to bemore radical in thinking about its potential future strategies, both how they might be developed andexecuted.Today when a cross-functional team focuses specifically on information about a major competitor ormarket, a shadow team has formed. The objective of shadowing is then to learn everything possibleabout a competitor—its people, processes, networks, and services—or a market, so that a firm canbegin to think, reason, and react like the competitor.
Strategic Rationale and Implications
Shadow teams perform as a think tank, operating between working on special projects and creating astorehouse of knowledge to draw from when special needs emerge. Using analytical, team dynamicand communications techniques, shadow teams can evolve into smoothly operating entities withstrong competitive and analytical skills.They collect and organize information and become an identified knowledge base. With stronganalytical skills, shadow teams can prove to be one of the greatest assets for the power brokers in afirm.The fundamental premise underlying shadowing comes from the belief that strategy is a result oforganizational structure and design. By closely monitoring the organizational structure and design ofrivals, it is suggested that a firm can gain valuable insights into their strategic intentions.In order to conduct this type of analysis, you must become intimate with every element of rival firm.Every minute detail, regardless of its apparent obscurity or immediate applicability, is taken intoconsideration. Often these details can be gleaned directly from your own firm's internal sources or byanalyzing publicly accessible information. In addition, the actions and behaviors of rivals will oftenyield important information.More important than the detail, however, is the holistic interpretation and analysis of the sum of thedetailed information gathered from shadowing. Shadowing yields important clues as to the futureplans of rival firms. Hence, the objective of shadowing is to be able to predict with reasonableaccuracy the strategic intentions of competitors in order to develop proactive strategy.
To facilitate this goal, two approaches to shadowing offer two distinct but related courses of action:
1. 1. Shadow planning—This technique involves the continuous monitoring of all of the relevantcomponents of a rival's strategy. For example, the goal of shadow product planning is to equipthe analyst with such an intimate knowledge of rival's product development plans so as todevelop a reasonably accurate understanding of its competitive mindset. This will allow you toanalyze contingencies in your firm's own product planning. The analytical output is a continuousstream of market intelligence necessary to strategically negotiate dynamic markets and intensecompetition.
2. 2. Developing a shadow market plan—This technique differs from the previous one in that it isa one-off project with a limited timeframe for completion. Its objective is to develop an accurateproxy for the actual marketing plans of rivals. The analytical product is a document with a finiteshelf life that closely resembles the formal marketing plan of a competitor.
These two approaches are not mutually exclusive, as shadow planning is used to build shadow marketplans. The continuous stream of shadow planning information provides a solid intellectual foundationfrom which to develop actionable recommendations and launch strategy—think of the shadow marketplan as the intelligence vehicle, and shadow planning as the maintenance that tunes it up regularly,making the engine run more effectively.Not only are these two tactical manifestations of shadowing closely integrated, but should be closelyintegrated into the firm's broader corporate strategy. A recurring debate in the field of strategy is thequestion of identifying the true source of the firm's competitive advantage. Does it lie inside the firmin the form of resources, core competencies, capabilities, organizational structure and businessprocesses, or does it lie outside the firm in the form of superior competitive position within markets,strategic groups, and industries? As with many arguments that attempt to delineate ambiguous orcircular constructs to their core, the answer to these questions is not black and white but, rather,several shades of gray. In reality, the location of the firm's competitive advantage is both internal andexternal. It is in this gray area where shadowing, if employed correctly, can shed much light onto thechallenge of crafting strategy.In order to fully leverage the power of shadowing within a firm, it is important to bridge the linkbetween the internal and external sources of a firm's competitive advantage. By having a number ofanalysts explicitly charged with learning as much as possible about rivals, the firm incorporatesseveral legitimate sources of strategic challenge inside itself.Shadow analysts with an accurate read on the competitive mindset of competitors, function in severalways to integrate the internal and external view of corporate strategy by
Testing the validity of the firm's own strategiesIdentifying potential weaknesses of rivals that the firm may exploitProtecting against weaknesses in the firm's current and future strategiesPredicting the contingent reaction of competitors to the firm's planned marketing strategiesIdentifying potential new competitive threats or opportunities in the broader market framework
Given that the goal of strategy is to find the best match between the firm's resources and opportunitiesto provide superior customer value, the knowledge that shadowing can bring to this process isextremely valuable. The competitive value of a firm's resources and the definition of superior
customer value are contingent upon competitive response. Shadowing provides reasonable inferencesregarding such contingent competitive response. Hence, shadowing is one of several effectivemethods to bridge internal and external views of strategy.Often, the role of shadowing is seen as duplicating the market research function. Certainly there is anoverlap, but shadowing is much more in-depth. A leading expert in this area, Rothberg2 asserts thatwhile traditional market research excels in securing knowledge of consumer research and the "FourPs" of the marketing mix, it stops short of securing the breadth of knowledge required for strategicsuccess. Shadowing supplements market research by providing insights into the entire value chain ofcompetitors.Shadowing is especially necessary for the heightened levels of competition that characterizes modernmarkets in which globalization is threatening once-secure markets. Similarly, technology is fosteringmarket migration by unraveling traditional linkages in many value chains.
Strengths and Advantages
A valuable benefit of shadowing is the removal of blindspots that commonly develop inside of thestrategic decision-making process. Without shadowing, firms often make incorrect assumptions aboutthe future direction of rival strategies. Similarly, firms often neglect to adequately consider thecontingent competitive reaction to the firm's planned strategy. Adopting the competitive mindset ofrivals through shadowing allows the firm to counter these two common blindspots.Shadow teams also become a firm's eyes and ears on a whole range of strategic and competitivematters. This means they are in a position to help a firm adjust to changes in its environment byattending to such matters as (to name a few):
Facilitating new product developmentAdjusting existing products and servicesInterpreting market signalsInvestigating rumorsIdentifying new technology
A well-constructed and nurtured shadow team can become an invaluable organizational asset. First,through sharing, collaboration, and analysis, the firm's knowledge assets increase. Second, a shadowteam can operate as investigators of competitive rumors and market signals, or they can serve asgeneral think tanks, providing unfiltered analysis directly to the strategic players. As a result,shadowing allows for a firm's learning to improve, as well as enhancing its ability to respond to itscompetitive environment.The key contributions and value of shadow teams are identified in Table 13.1.Table 13.1Characteristics and Contributions of Shadow Teams
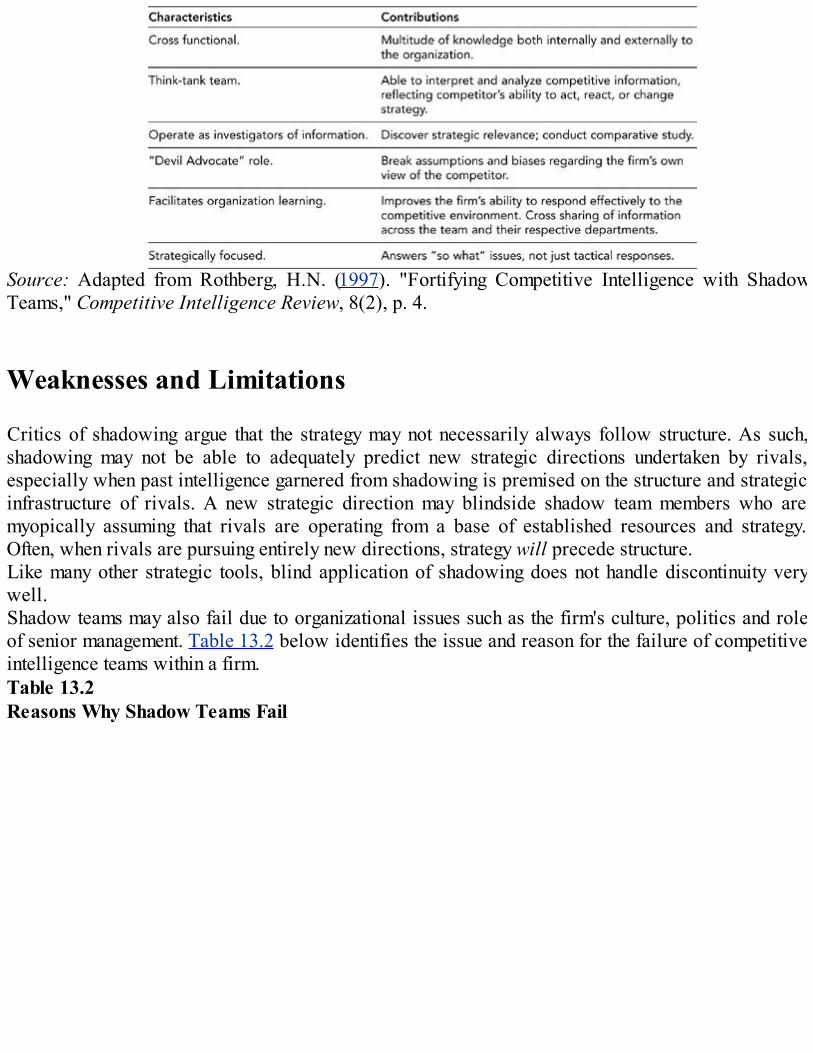
Source: Adapted from Rothberg, H.N. (1997). "Fortifying Competitive Intelligence with ShadowTeams," Competitive Intelligence Review, 8(2), p. 4.
Weaknesses and Limitations
Critics of shadowing argue that the strategy may not necessarily always follow structure. As such,shadowing may not be able to adequately predict new strategic directions undertaken by rivals,especially when past intelligence garnered from shadowing is premised on the structure and strategicinfrastructure of rivals. A new strategic direction may blindside shadow team members who aremyopically assuming that rivals are operating from a base of established resources and strategy.Often, when rivals are pursuing entirely new directions, strategy will precede structure.Like many other strategic tools, blind application of shadowing does not handle discontinuity verywell.Shadow teams may also fail due to organizational issues such as the firm's culture, politics and roleof senior management. Table 13.2 below identifies the issue and reason for the failure of competitiveintelligence teams within a firm.Table 13.2Reasons Why Shadow Teams Fail
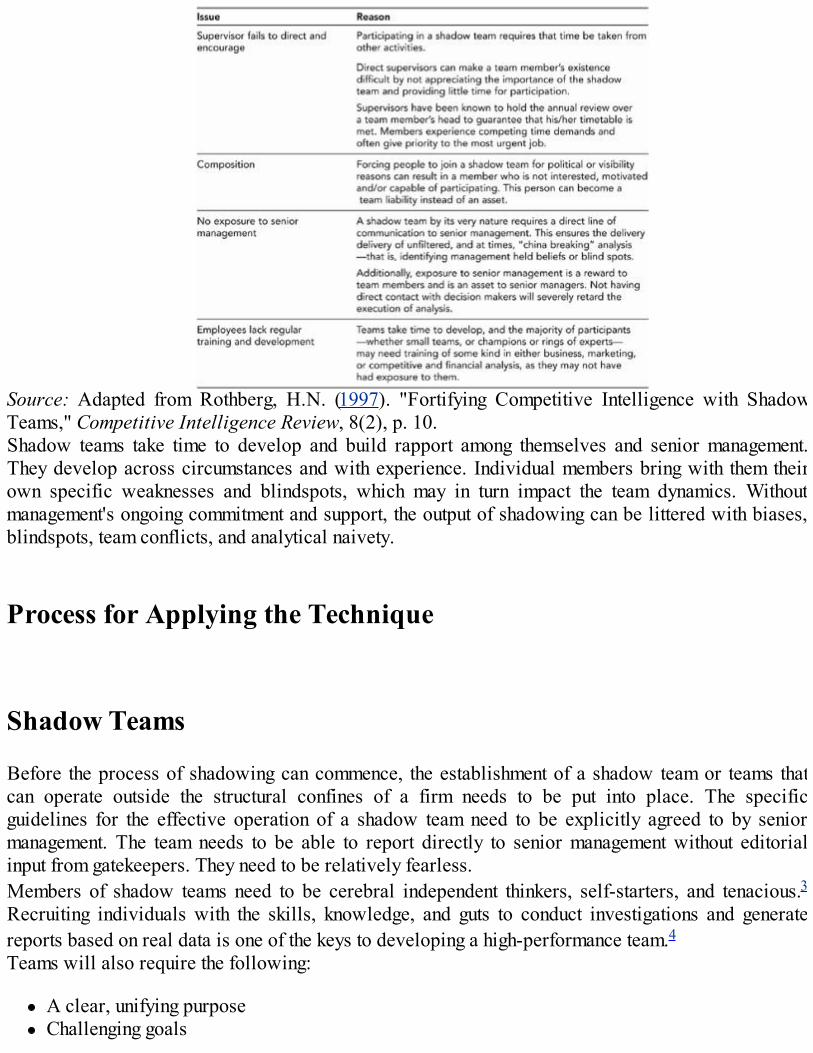
Source: Adapted from Rothberg, H.N. (1997). "Fortifying Competitive Intelligence with ShadowTeams," Competitive Intelligence Review, 8(2), p. 10.Shadow teams take time to develop and build rapport among themselves and senior management.They develop across circumstances and with experience. Individual members bring with them theirown specific weaknesses and blindspots, which may in turn impact the team dynamics. Withoutmanagement's ongoing commitment and support, the output of shadowing can be littered with biases,blindspots, team conflicts, and analytical naivety.
Process for Applying the Technique
Shadow Teams
Before the process of shadowing can commence, the establishment of a shadow team or teams thatcan operate outside the structural confines of a firm needs to be put into place. The specificguidelines for the effective operation of a shadow team need to be explicitly agreed to by seniormanagement. The team needs to be able to report directly to senior management without editorialinput from gatekeepers. They need to be relatively fearless.Members of shadow teams need to be cerebral independent thinkers, self-starters, and tenacious.3Recruiting individuals with the skills, knowledge, and guts to conduct investigations and generatereports based on real data is one of the keys to developing a high-performance team.4Teams will also require the following:
A clear, unifying purposeChallenging goals

Work that is meaningful with collective products and challenging performance criteria5
Ongoing training and coaching in such areas as team dynamics and analysis
Special attention must be given to three key performance issues for shadow teams, as follows:
1. 1. Team composition2. 2. Team structure3. 3. Performance goals
Team Composition
The objective is to create a balanced group of individuals who bring a combination of skills,diversity, knowledge, networks, disposition, personality mixed with creativity, out-of-the-boxthinking, and analytical ability. Rothberg suggests selection of team members could address thefollowing criteria:
1. 1. Intellectual capability—The ability to secure relevant information; relate and compare datafrom different sources; identify issues and relationships; and to be conceptual, analytical, andcreative
2. 2. Results-oriented—The ability to work toward outcomes and complete what one starts3. 3. Interpersonal skills—The ability to relate to the feelings and needs of others and to convey
interest and respect4. 4 . Planning and organizing—The ability to schedule time and prioritize for one's self and/or
others, to handle multiple activities, and to meet deadlines5. 5 . Team-oriented—The ability to work collaboratively within a complex organizational
structure6. 6 . Maturity—The willingness to be open and act responsibly when dealing with people and
situations7. 7. Presence—The ability to create a positive first impression and stand out tactfully (includes
verbal and nonverbal communication)
Team Structure
High performance shadow teams are small yet provide a representation of the required skills. (Note:large teams tend to take on the characteristics of a group, which may impede a cohesive approach tothe issue at hand and the timely delivery of the project goals and objectives.)Shadow teams are composed of the best and brightest in a firm and are made up of volunteers whodecide to take on this work in addition to their usual work responsibilities. A facilitator needs to beidentified to serve as an administrative and communication hub for team members and as a liaisonpoint between management and the team.

Performance Goals
Without focused, measurable goals and a belief that the goal is worthwhile, teams never achieve highperformance.6 Without clearly defined goals, members can become unfocused, politicized, lose theirurgency, or become irrelevant.In essence, when establishing a shadow team, the following guidelines should be observed. Theteams operate within a learning climate. They have the opportunity to learn from each other. Theyalso have some latitude for analysis to miss the mark as long as it is based on unfiltered informationand demonstrates analytical thinking:
Teams are comprised of diverse and cross-functional people who reflect the texture of thecompany.There are clear, meaningful, and measurable goals.There is management support.There is exposure to senior executives and executive strategic decision makers.Appropriate tools and training are available.
Shadowing
Once teams are in place, the process of shadowing and developing a shadow market plan can becommenced; however, the process cannot be described adequately by a formal sequential or step-by-step procedure. In general, the process is characterized by collection, analysis, and dissemination ofstrategic recommendations. However, these general stages are usually performed simultaneously andoften become intertwined through a complex web of formal and informal iteration.The first step is for the shadow team to learn as much as possible about every aspect of the rivalfirms. The goal of this knowledge will be to enable the shadow team to think like the competition. Inorder to achieve this, several methods are offered by two experts in the field of shadowing:7
Personnel hiring—An examination of the personnel changes in the executive suite, as well asthe functional areas in the firm, will often yield valuable insights on the strategic focus of rivals.For example, hiring marketing staff may indicate an expansion of marketing effort. Likewise,hiring research scientists may indicate that a rival is beefing up its innovation and internalproduct development capacity.Personnel departures—Monitoring the firings and resignations of key personnel can often shedinsight into which functional areas are receiving the most attention at rival firms. For example,the resignation of an operations manager and senior R&D personnel may indicate that otherareas of the firm are being pursued more aggressively. One may surmise that technicalinnovation may be taking a back seat at this particular rival; possibly, the real decision-makingpower may now rest in the finance function with a strategic focus on cost cutting.Full text of news releases and speeches—The full text of relevant sources will often provide

hints of strategic intent by allowing you to place the document in a fuller context and to searchfor meaning by "reading between the lines."Hometown media—Often minute but nonetheless significant, details are included in presscoverage of the newspaper or local business magazine published in the rival's hometown. Localpress digs deeper and provides more detail due to the importance of the company to the localeconomy. Other, more distant, press sources may leave out this detail due to detachment.Trade shows—Participants at trade shows involve members of the competitor's entire valuechain (that is, suppliers, customers, and distributors). Additionally, trade shows offer the chanceto meet members of rival firms. Face-to-face contact may offer you the best opportunity toevaluate the human resource capability of rivals. Conversations with them may also yield cluesas to their resources, industry outlook, priorities, or even veiled references to their current orplanned strategies.Corporate literature—This includes company newsletters, technical brochures, and productsupport material.Online databases—The Internet provides a cost-effective source of information in the form ofgeneral press coverage, hometown press coverage, and online databases. Additionally, theperceptions of the shadow team can be tested, and if needed objectified, by reading materialwritten by a wide variety of sources from official security firm analysts to the meandering "offthe cuff" unguarded comments in chat rooms and forums.Technological tracking—This is done through professional society papers, industry tradeassociation articles, and articles written by technical personnel of rivals.Background checks—This is done by assessing the totality of executive backgrounds includingeducation, previous positions, career track, past successes and failures, and hiring tendencies.Management personality profiling—This provides an understanding of how decision makers atrival firms are psychologically hardwired (what makes them "tick").Debriefing—Talking to employees who have previously worked with rivals either directlythrough an employment contract or indirectly through industry associations. Additionally, othervaluable sources of information include members of a rival's value chain, including salespeople,distributors, customers, suppliers, and advertising agencies.Regulatory tracking—This involves monitoring regulatory procedures with which competitorsare involved, such as patents pending, licensing, consumer, or environmental regulation.Financial statement analysis—Learning of the financial strength of rivals, as well as anyfinancial constraints facing rivals (for example, debt capacity, cash flow, and liquidity) mayyield insights into the success of their past strategies, as well as their propensity to intensify orchange strategies.Financial statement analysis is intentionally placed at the bottom of the list because the wholepoint of shadowing is to determine the future strategic plans of rivals before they materialize intofinancial results. This placement underscores the ultimate goal of shadowing to function as aleading rather than lagging indicator. Nonetheless, a solid understanding of a rival's financialsituation provides a necessary foundation for shadowing.
Once all of this information has been collected, analyzed, and internalized, the shadow team shouldbe ready to assume the role of strategic challenger. By functioning as a proxy for the competitor,shadow teams should be able to objectively filter any assumptions about rival firms that otherdecision makers in the firm may harbor. Similarly, shadow teams will be well placed within the firm

to infer the future strategic decisions and directions that rival firms may pursue.In order to maintain the integrity of this strategic capacity, this process should be continuous, or atleast updated regularly. Nothing stands still, and new forces may change the dynamics of themarketplace very quickly.Equally important, when conducting shadowing, you must be able to consciously divorce yourselffrom the firm's own decision-making processes, frameworks, and biases/blindspots; that is, in orderto be an effective and legitimate strategic challenger, you must act as the rival firm in order tochallenge the thinking within the firm. In the event that individuals with these capabilities cannot befound within the firm, external analysts may be considered. Table 13.3 outlines the various pros andcons of outsourcing the shadowing analysis to external experts. In general, the pros of developingshadowing capabilities in-house overpower arguments for outsourcing. Individual firm circumstancesmay, however, refute this generalization.Table 13.3Issues Around Outsourcing Shadowing Capability
Source: Adapted from Vella, C.M., and J.J. McGonagle, Jr. (1988) . Improved Business PlanningUsing Competitive Intelligence. Westport, CT: Quorum Books.
Developing a Shadow Market Plan
Intermittently, throughout the shadowing process, a shadow market plan is drawn up from theanalysis. A shadow market plan is essentially a document that captures all of the knowledge obtainedto date, which has been analyzed to derive some insight. Its purpose is to provide a proxy of theofficial marketing or business plans of rivals. Competitive analysis is essential in estimating thecapability of rivals, and specific analytical tools appropriate to the team's objectives are used at thistime as a foundation for strategic decisions yet to be made. This analysis may be the first level ofiteration of the shadow plan, with ongoing analysis occurring as further information is collected.A shadow market plan views the resources, competencies, capabilities, processes, strategies,strengths, weaknesses, opportunities, and threats from the perspective of rivals. As such, it attempts toview all of the parameters of strategic decision making made by the rival. This detached perspectiveallows the firm to establish with reasonable accuracy the current marketing and business strategy ofrivals. It will also enhance the firm's ability to project the future strategic direction of rivals or theirlikely reaction to strategic initiatives of the firm conducting the shadowing. An informal andqualitative sensitivity analysis is then conducted to predict different outcomes to various competitive

scenarios.A useful supplement to the shadow analysis plan is to conduct a reverse shadow market plan. Vellaand McGonagle8 suggest that firms may find it helpful to develop an analysis of how the rival actuallyviews your firm. Often the results can be quite disconcerting.The final step in the shadowing analysis process is to continuously monitor rivals and revise andadjust the shadow plans as required. If substantial enough, these revisions and adjustments will theninfluence subsequent strategic decisions. In this respect, labeling this step as the final one is amisnomer, as the shadowing process is more circular than linear in design and function.
Case Study: Illuminating Strategy by Shadowing
A hypothetical example is outlined next, which shows how the process of shadowing could improvestrategic decision making at a large insurance firm. Suppose that the objective of the shadow teamwas to develop a shadow market plan for a large competing insurer, Mega Insurance. Summarizedhere is an itemization of what each stage in the proposed shadowing process may look like:Specified objective—Delineate the analysis into the potential expansion of commercial lines by MegaInsurance in the Mid-Atlantic market.
Sources of Information
Insurance industry publications include the following:
Mega filings with the Securities CommissionTrade publications of industries to which Mega sells commercial insuranceCommonly reported Mega press releasesFull texts of Mega press releasesRegional business publicationsNewspapers covering the city in which Mega headquarters is locatedInternet marketing and financial reports of Mega by securities analystsCoverage of Mega's new facilities in computer industry trade publicationsInterviews of Mega executives in local business publicationsEvidence of zoning application or permissions for new Mega facilities at relevant municipalitiesEvidence of expansion from industrial development authorities regarding public financingMega's own Web siteOther Internet sources
Inferences
Mega is planning to initiate a new commercial line starting in Ohio.

Mega has engaged a contractor to build a new office in New Jersey.Mega has recently recruited an executive from a rival firm to manage the NJ office.Marketing materials distributed by Mega to target customers, agents, and brokers reveal currentdistribution, target market, and sales of new commercial lines.Shadowing also uncovers the planned grand opening of the NJ office to coincide with the marketlaunch.Management profiling reveals background, experience, and past successes and failures of thenew NJ office executive.
Confirmation
These sources and inferences are then confirmed and cross-referenced with existing information ofMega's strategy, past affiliations, and actions in the Mid-Atlantic market area. Next, these tentativeconclusions are meshed with an environmental analysis of the market conditions in the relevant areas.
Tentative Conclusions
A shadow market plan is built consisting of several prominent strategies, including the following:
Mega is planning a major expansion of its commercial lines.A regional marketing approach will initiate the product launch under the auspices of the newexecutive in the NJ office.The pioneering product will be the new commercial line.
Monitoring
The same sources discussed previously are used to monitor the progress of Mega's shadow marketplan. In addition, several additional sources are added, such as:
Monitoring new policies and rates of the new commercial line via records at state insuranceoffices in Mid-Atlantic statesDetermining the target market from advertisements placed in regional business publications9
Mini Case Studies

Case 1—Deregulating Utility
A shadow team at a large utility company in the midst of deregulation warned senior managementabout activities indicating a key competitor's acquisition intentions that would result in shrinking theutility's current market and tilting market power in the competitor's direction.
Result
Senior management responded quickly by pre-empting the competitor's offer with one of their own.The threat of a loss in market share was thwarted and actual market power increased.
Case 2—Packaged-Food Multinational
A new product development group in a multinational packaged food corporation was planning todevelop a challenger to a rival product category leader. The competitor shadow team was broughtinto the process to "war game" the potential rivalry with the group's new product offering. Theshadow team knew the rival's operations down to product P&L, had profiles on senior management(one who had his corporate roots in the product category), and possessed a clear understanding oftheir marketing mentality.
Result
The two-day simulation revealed that the rival could and would retaliate against all market movesand had a cost structure enabling it to win any ensuing price war. At the game's conclusion, thedecision was made to abandon the product line before investing further in its development.
Case 3—Ready-to-Eat Foods
A leader in "ready-to-eat" foods was gearing up to produce a new product for test marketing. Whilevisiting a remote out-of-state facility, a manufacturing employee noticed an unusual structure in anearby town owned by a rival. An internal search by the shadow team identified a recently hiredemployee who had worked for the rival and was familiar with the facility. Apparently, the rivalemployed the site as a testing ground for the manufacture of new products that the market had not yetproven worthy of full-scale operations. The shadow team's comparative financial analysis of thefirm's new product manufacturing process versus a flexible testing facility demonstrated that the rivalwas saving millions of dollars. The shadow team was also familiar with the rival's equipmentengineers and suppliers.

Result
Information leveraged from these network contacts increased the shadow team's contribution byrecommending a rudimentary test facility design of their own.
Case 4—Pharmaceutical Firm
A medium-sized American pharmaceutical firm structured shadow teams around ailmentclassifications. During scanning activities, a shadow member heard a rumor from a Federal DrugAdministration (FDA) contact, which was corroborated by a field salesperson, that a new drugpositioned to rival the firm's market leader was close to receiving approval. An upcoming conferencegave the shadow team the opportunity to gather intelligence and validate—or refute—the rumor.Network connections identified the academic institution conducting the competitor product trials.During an evening cocktail party, shadow team members independently engaged scientists indiscussion about chemistry and related topics. In time, they learned about the trials (although theproduct or sponsor was never noted by name), confirmed the FDA rumor, and, importantly, identifiedthe new procedures employed in clinical testing.
Result 1
The firm leveraged this information and launched a campaign to bolster its product's market share.During this time, the shadow team was charged with finding out why competitors were constantlybeating the firm to market with new categorical drugs. The team's experience with competitorscientists at the conference influenced their decision to launch a counter-intelligence investigation oftheir own firm. They learned that their own scientists, both in-house and those contracted to runclinical trials, behaved similarly.
Result 2
A program was created to generate awareness for protecting intellectual property and competitiveinformation throughout the organization. The shadow team drove home the importance of not onlylearning, but also of guarding knowledge.10
FAROUT Summary
Figure 13.1 Shadowing FAROUT summary
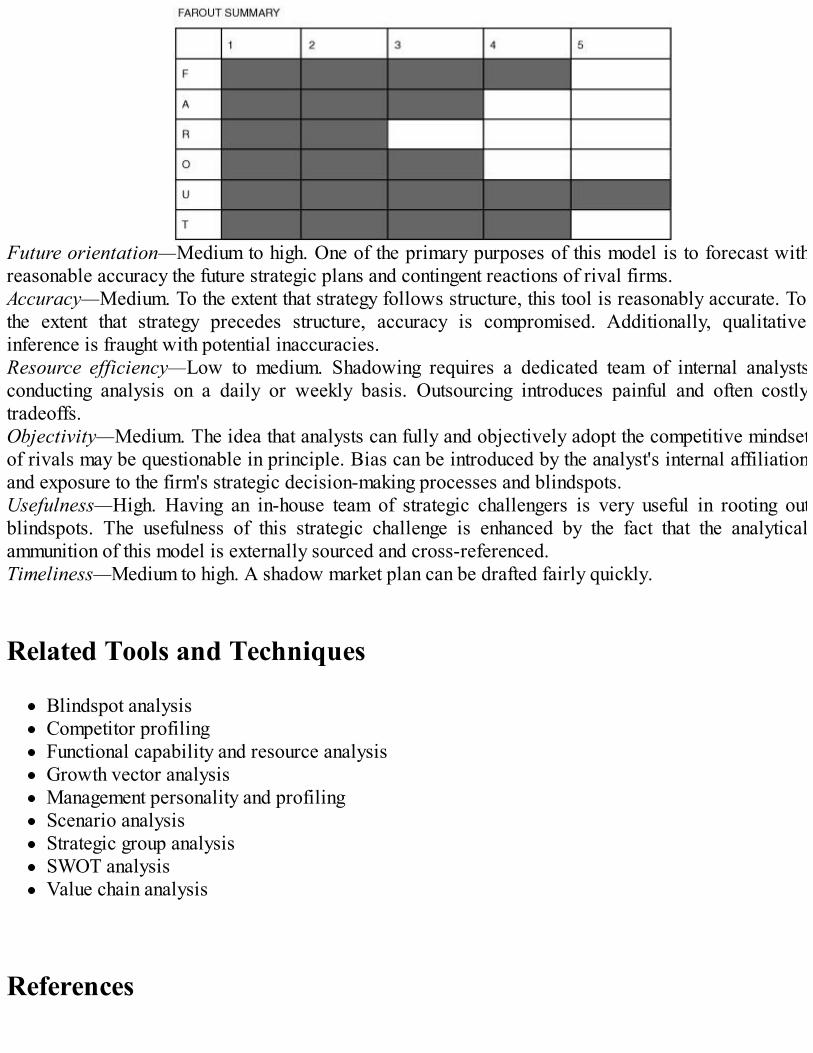
Future orientation—Medium to high. One of the primary purposes of this model is to forecast withreasonable accuracy the future strategic plans and contingent reactions of rival firms.Accuracy—Medium. To the extent that strategy follows structure, this tool is reasonably accurate. Tothe extent that strategy precedes structure, accuracy is compromised. Additionally, qualitativeinference is fraught with potential inaccuracies.Resource efficiency—Low to medium. Shadowing requires a dedicated team of internal analystsconducting analysis on a daily or weekly basis. Outsourcing introduces painful and often costlytradeoffs.Objectivity—Medium. The idea that analysts can fully and objectively adopt the competitive mindsetof rivals may be questionable in principle. Bias can be introduced by the analyst's internal affiliationand exposure to the firm's strategic decision-making processes and blindspots.Usefulness—High. Having an in-house team of strategic challengers is very useful in rooting outblindspots. The usefulness of this strategic challenge is enhanced by the fact that the analyticalammunition of this model is externally sourced and cross-referenced.Timeliness—Medium to high. A shadow market plan can be drafted fairly quickly.
Related Tools and Techniques
Blindspot analysisCompetitor profilingFunctional capability and resource analysisGrowth vector analysisManagement personality and profilingScenario analysisStrategic group analysisSWOT analysisValue chain analysis
References

Fahey, L. (2002). "Invented competitors: a new competitor analysis methodology," Strategy &Leadership, 30(6), pp. 5–12.Fleisher, C.S., and D.L. Blenkhorn (2003). Controversies in Competitive Intelligence: TheEnduring Issues. Westport, CT: Praeger Publishers.Gilad, B. (1994). Business Blindspots. Chicago, IL: Probus Publishing Company.Gilad, B. (2003). Early Warning: Using Competitive Intelligence to Anticipate Market Shifts,Control Risk and Create Powerful Strategies, AMACOM.Katzenbach, J.R., and D.K. Smith (1993). The Wisdom of Teams. New York, NY: HarperCollinsPublishers, Inc.McGonagle, J.J. Jr., and C.M. Vella (1996). A New Archetype for Competitive Intelligence.Westport, CT: Quorum Books.McGonagle, J.J. Jr., and C.M. Vella (1999). The Internet Age of Competitive Intelligence. Westport,CT: Quorum Books.Rothberg, H.N. (1997). "Fortifying competitive intelligence with shadow teams," CompetitiveIntelligence Review, 8(2), pp. 3–11.Rothberg, H.N. (1999). "Fortifying strategic decisions with shadow teams: A glance at productdevelopment," Competitive Intelligence Magazine, April/June, 2(2), pp. 9–11.Rothberg, H.N., and G.S. Erickson (2005). From Knowledge to Intelligence: Creating CompetitiveAdvantage in the Next Economy. Elsevier, Inc.Vella, C.M., and McGonagle, J.J. Jr. (1987). "Shadowing markets: A new competitive intelligencetechnique," Planning Review, September/October, 15(5), pp. 36–38.Vella, C.M., and McGonagle, J.J. Jr. (1988). Improved Business Planning Using CompetitiveIntelligence. Westport, CT: Quorum Books.Young, G. (2004). "Using shadowing to build creativity and continuity," KM Review, July/August,7(3), pp. 20–23.
Endnotes
1 Fahey, 2002.2 Rothberg, 1999.3 Larson and LaFasto, 1989.4 Rothberg, 1997.5 Katzenbach and Smith, 1993.6 Rothberg, 1997.7 Vella and McGonagle, 1988.8 Vella and McGonagle, 1988.9 Adapted from Vella, C.M., and J.J. McGonagle, Jr. (1988).10 Rothberg, H.N. (1999).
14Product Line Analysis
Short Description
Product line analysis is the process of examining a company's product line to determine if the line ismaximizing the company's use of resources and is able to meet its strategic goals. The processinvolves assessing whether the correct volume and type of products are present in the line, anawareness of the life-cycle stages products are in, the manner in which product markets aresegmented, the methods by which products are marketed to those segments, how the product isperceived by customers in the marketplace, and how a company allocates resources to productswithin its line.
Background
There were considerable advancements in products being made available in the marketplace after theSecond World War that made a difference in how people lived. All a company essentially had to dowas present the products with their fabulous features to waiting customers, and the growingmarketplace would flock to purchase the item. Disposable razors and nylon pantyhose were productslaunched during this time and were readily adopted. However, by the 1960s, the competition hadintensified, and managers became mindful of the fact that in order for a firm to prosper, a simple"build it and they will come" approach was not going to be sufficient. As competition for customers'favor intensified, the scope of managers' responsibilities—particularly marketing, brand, andproduct-related managers—started to include understanding the needs and wants of the customer anddesigning products to meet their actual (and not just assumed) needs. By the 1970s, concepts likesegmentation, perceptual mapping, consumer behavior, and the product life cycle had been formulatedand generally accepted, and the constructs aided in the product line analysis process.
Strategic Rationale
For those enterprises competing in global markets, the world's population is only growing at a littlemore than one percent per year.1 Managers increasingly recognize in industry after industry thatmarket share will not grow unless it is being taken from competitors. Products can achieve salesgrowth by out-performing or under-pricing competitors' offerings. In order to do this, it is importantfor managers to understand a product's potential, as well as the potential of all products that thecompany has in the competitive marketplace. For example, discerning managers will need to knowwhere the product is in its life cycle, what market the product is in, how that market is segmented, andhow profitable the product is to the firm.
The reality of just-in-time delivery systems, efficient value chains, and shorter business cycles meansthat product line managers are under increasing pressure to get products to market faster and havefewer margins for error with steadily empowered and newly enlightened customers.2 "Design forpostponement" strategies allow last-minute customizations to suit customers' preferences.3 These areamong the reasons that customers' expectations of products' abilities and features offered are athistorically high levels, putting more pressure on managers to get the product mix right the first time.Product line analysis is a beneficial tool used in both business and competitive analysis. Decisionsabout whether or not to add or subtract products can have large consequences. Many apparently wellthought-out new products have gone awry—wasting time, wasting money, and destroying careersalong the way. Experiencing adverse consequences such as these leads many company executives toadopt a fast follower strategy, thus avoiding the risks, and rewards that are associated with newproduct development.4In a competitive sense, knowing where a competitor's products are vulnerable can be a key facet ofunderstanding what tactics might be employed by your company in exploiting these vulnerabilities.Turned on its head, knowing where your own company's products are vulnerable to competitiveattacks allows you the opportunity to shore up the product's defenses or to employ cross-product orcross-line tactics and methods to maximize the return of the entire line of products in any given marketspace.
Strengths and Advantages
A critical tenet of economics suggests that competitive firms have limited resources. Product lineanalysis (PLA) is a valuable tool in determining where and which products should be the recipient ofscarce, valuable organizational resources. The product life cycle can help in the forecasting processand in the ability to compare firms' products in terms of past and future to other products in acompany's product line, and to competitors' products as well.5 Realistic expectations of profits,growth, and market share can be developed for the firm if each product and brand is viewedobjectively within the context of the entire product portfolio offering. This objectivity is important ifthe manager who is evaluating a products' viability is, in some way, emotionally attached to theproduct. If the manager helped develop a product or spent a great deal of time resurrecting ormarketing it, s/he may be less likely to cut it loose or alter it without persuasive empirical evidenceof why the resulting business decision is beneficial.Tools like the product life cycle (PLC), which are used in doing product line analysis, enablemarketers and managers to see product life stages for what they are. Profits can be forsaken formarket share in the beginning stages, and profits will follow in later stages when managers see the"big picture." Profit maximization for the life cycle can be most effectively realized when managersare not focused on the myopia of profit realization for the quarter or year.6The ability of PLA to help the analyst categorize markets and position products according to segmentsensures maximum efficiency in an overall product line. The process of analyzing the product line canreveal actual or potential cannibalization, duplications, met or unmet customer needs and wants, andavailability or shortcomings of market size or structure. The overall strategy of a company's productline is improved when viable segments are identified, and resources are allocated with the intent ofsatisfying needs and communicating product attributes effectively.

Weaknesses and Limitations
A limitation of product line analysis is that the outlook tends to be limited to organizationalphenomena, and external, less organizationally controlled factors like economic, social, and politicalcircumstances are not taken deeply into consideration. Potentially significant macro-environmentalconditions like recessions, demographic shifts, exchange rate fluctuations, and other risk factorsoutside the immediate control of the firm are frequently neglected; consequently, contingency plansfor maximizing profitability from a product line facing these conditions may not be put in place.From a business analysis perspective, there is a risk that product line analysis may lead to a too quickabandonment of some products or brands because they may appear to be at the end of their life cycle,even though they may have a loyal and still profitable (albeit less so than in the product's heyday)following for years to come. Product life cycles are not something that exists in absolution. They aremetaphorical tools used to classify certain stages that many products or brands potentially passthrough over a given period of time. If a manager views all products and brands through the productlife cycle lens, there is a risk that some products' longevity will therefore be thwarted simply becausethe manager is looking for them to expire. Many classic products are simply exempt from theconstruct or run an atypical cycle.7 For example, combinations of nostalgia, technologicaldevelopments, and/or good marketing have saved many toys from the scrap heap. Long-standingproducts like Hasbro's "My Little Pony," "Transformers," and "G.I. Joe" have all been resurrectedfrom the PLC-prescribed phase-out in time to regain popularity with the original market's children.Mattel's "Barbie" line and Hasbro's "Monopoly" line of games use landmark anniversaries to buildmomentum, rather than lose it.Another business-oriented risk inherent in product line analysis is that management become "product-focused" rather than "customer-focused." Entire industries have failed as a result of that veryperspective. Theodore Levitt noted decades ago that had the railways seen themselves in thetransportation industry (providing service that clients were actually looking for) rather than therailway industry (in the business of operating rail transportation), rail companies would be in a betterposition today.The result of the product line analysis is the risk that some managers will use these concepts as hardand fast rules to develop or eliminate strategies, without taking into consideration the manyunquantifiable nuances that can result from product line changes. A good example of this was theelimination of 25-cent coffees at Nordstrom stores. The Seattle-based retailer has built a reputationfor legendary customer service over its 100+ year history. For decades, coffee has been available inthe Nordstrom Café for a quarter. Payment is based completely on the honor system, and the productis there for anyone who wants it, customers and employees alike. In the late 1990s, Nordstrom shareprice was taking a beating in the stock market, and the company wanted to build a much more cost-conscious culture in order to help improve profitability. Some of the cost-cutting measures made a lotof sense—vastly reducing bloated inventories and speeding cycle times, as well as trainingemployees to be more aware of the true cost of sales. One cost-cutting measure, however, was theelimination of the quarter coffee. Overnight, the cup of coffee was raised to a dollar! The outrage thatresulted from the elimination of one little gesture, a coffee for 25 cents, and the nostalgia that was lostalong the way, left a bitter taste with many loyal customers and employees, and may have ended up

costing the company more money than it saved.
Process for Applying the Technique
Ideally, at the time of analyzing a product line, the analyst (or product manager) has firmly defined thegoals of the product(s) in questions, and these are checked for consistency with the overall corporatestrategy. It is also worthwhile to identify whether the target market has been identified and themarketing, pricing, and promotion strategies are consistent with the goals. The process of analyzingthe product line will identify if the products are able to meet these goals given their current position,if the products need to be replaced with newer options, improved, or if market opportunities arebeing missed because the firms lacks a certain offering.
Step 1: Initial Product Audit
Volume of products in a line: The goal of maximizing profit over the long term is complicated whennumerous products exist in a line. If a company is looking to exploit a low-cost strategy, they maychoose to try and drive out costs by eliminating products that in any way duplicate or cannibalizesales of other products in the line. Alternatively, if a company is pursuing a differentiation strategy,they may seek to have more products in the line, which are tailored for and customized to differentmarket segments. In a perfect world, any company product would not cannibalize the sales of otherproducts within the company; nevertheless, cannibalization does occur to varying degrees wheresimilar products are offered, and it is important for managers to be able to assess the impact of thisphenomenon. Likewise, they must be able to assess any potential cannibalization that may occur toexisting products if a new product is being introduced. Customer information systems, like CRMsoftware, can be used to track how many mature-product sales are being lost to new products.8However, cannibalization by itself, even if deemed at an intolerable level, is not a sufficient reason toeliminate products without properly evaluating alternatives. Data optimization techniques can usesophisticated mathematical modeling to generate revenue projection based on objectives andconstraints. Programs like Excel Solver, Crystal Ball, and others use programming techniques, likelinear, non-linear, dynamic, and stochastic techniques to attach a fiscal value to competing options.9
Ideally, these optimization techniques will identify a range where long-term goals and profits canboth be realized, which helps managers decide how to apportion resources to different products. Theprocess should aid in incremental analysis. Basically, for each additional unit produced, how muchprofit can the enterprise expect to realize?Raw data alone cannot be the full extent of this step of the analysis. Each product must be viewedwithin the context of where it is in its expected life. In the same way that we would not expect a five-year-old child to perform the way we would expect a 15-year-old child to perform, organizationsshould have different expectations of products at different stages in the life cycle.
Step 2: Assess the Product Relative to Its Position in the Product

Life Cycle
The product life cycle (PLC) is a marketing construct that applies a stylized life span to brands orproducts. The idea is that generally speaking, a product will experience four stages during its life,measured in terms of sales, profit, market share, or some combination. 10
During Stage 1, the product will experience introductory minimal sales and slow growth in itsinfancy, while the product is still "catching on" and glitches are worked out. Depending on theproduct, marketers will choose a "price skimming" strategy with a very high introductory price todiscourage demand that the company is unable to fulfill or a "penetration pricing" strategy, selling theitem at a low price in order to gain market share and then slowly raising the price in the growth stage.In Stage 2, the product will start to gain momentum and experience the greatest sales growth of thecycle. Stage 3 will see maturity and saturation, reflected in consistent sales, followed by Stage 4, theperiod of sales decline. Figure 14.1 is a summary of some of the trends that are represented in eachstage of a traditional product life cycle.Figure 14.1 Traditional product life cycle framework
There are variations of this traditional cycle. As many as 11 different types of life cycle patterns havebeen identified in the literature, and probably more exist than this number.11 Life cycle performancecan partly be determined by market demand (external, outside the direct control of firm) and partly bymarketing efforts (i.e., internal locus of control). Not only will managers want to know where their ortheir competitor's products are in a life cycle at any given time, they will also want to know what sortof cycle the product is likely to experience and how sensitive the product's market is to expansion
efforts. It is important to note that products' fates are not necessarily at the whim of pre-determinedcycles—many elements will combine to determine products' longevity.12
Once one is familiar with the product life cycle, product line analysis will include examining data onall products, keeping in mind each product's holistic revenue and profit implications for each stage inthe life cycle.13
Cost and revenue projections should be developed for the product at each stage of the product lifecycle, particularly those in the future. Product success using this conceptual lens can be evaluated notbased on comparisons between products, but how each product performs or has performed at thevarious stages. Product substitutions, extensions, sequels, and improvements can also be planned orprojected by stage. Last but not least, the product life cycle can highlight profit contribution of theproduct, sales trends, and customer migration patterns within a valid construct.
Product Market Segmentation
A key to product line analysis is to develop an understanding of how the product is actuallysegmented among customers in the market. After all, the customer has to see the product in terms offeatures that matter to them and meets their needs, be it on price, quality, service, or other attributes.Being able to segment the market means being able to identify relatively homogeneous groups ofcustomers, understanding what matters to these groups and how they behave. Apart fromunderstanding the groups, product line analysis is also aided by segmenting because the process canidentify if the segment is big enough to be served in a cost-effective manner.Segments can be broken down into two types: customer-related and product-related. A segmentationperspective assumes that competition comes from other products in the same product category. Forexample, a company may see mint-flavored toothpaste products as competing against one another, butnot competing against baking soda, a product that, aside from doing other things, can clean teeth. Acustomer segmentation approach, however, might see mint-flavored toothpastes as competitionagainst baking soda, if the target group is being segmented based on their values and self-image. Acustomer may value baking soda over mint-flavored toothpastes if they see it as environmentallyfriendly, less expensive, creative, and/or it satisfies a customer segment's desire for a multi-use, all-natural product. Table 14.1 gives an example of how markets can be segmented within thesecategories. The answers to the product or customer-market questions in Table 14.1 can aid analysts indeveloping an understanding of products' overall strategies, based on needs, wants, preferences, andmotivations that are revealed by this process. The answers can also provide an idea of the proportionof products purchased by segments and shed light not only on the segment where marketing may bedirected, but how they are being communicated with and whether there are problems in the processthat can be addressed through insightful tactics or strategies.Table 14.1Product- versus Customer-Related Perspectives on Segmentation

Once this process is complete, managers should know if their or their competitors' strategic goals andproduct offerings are aligned. They should know if they are offering too many or not enough productsto customers and which of those products are meeting the needs of desirable segments.
Understanding Positioning
Along with product positioning comes the more elusive task of deciphering how customers relate to aproduct's image and how that image compares with competing brands in the marketplace. The key tosuccessful positioning is that a product delivers real desired benefits to the consumer in a form thatthey can easily understand and relate to.15
An assumption underlying most businesses is that in order to be viable, the company's goal is to growand prosper over time. The growth can occur in profits, market share, geographical reach, and thelike, but fundamentally, a company's overall product strategy in order to realize these goals will fallinto the differentiation or low-cost strategy categories. Porter's Generic Strategies, as they are known,are attractive because they can be applied to one-product firms or multinational corporations. Inshort, the low-cost strategy seeks to gain competitive advantage by bringing a product to market,which is equivalent to competitors' in features and quality, at a lower price than the competitor. Thedifferentiation strategy is where the company seeks to gain market share by offering a product that hassuperior features, quality, or services than the competitors. The low-cost and differentiation strategiescan further be segmented by the scope of the product's market. The product's target can be broad(mass) or narrow (niche). The result is four generic strategies that can be applied to companies,product lines, and products. In summary, these four strategies are discussed next.
Cost Leadership
This is where enterprises try to provide low-cost products that have a mass market appeal. Thisrequires these enterprises to employ very strict management controls and drive out costs at everylevel from production and distribution to sales and marketing. Examples of products in this categoryinclude the so-called "house brands," which are found at nearly every major supermarket chain.Companies using this generic strategy use their lower-cost edge to under-price competitors and attractprice-sensitive buyers in great numbers to their products as a means of increasing their total profits.Alternatively, they can avoid price reductions and maintain an average price in the marketplace anduse their lower cost edge to earn a higher profit margin on each unit of the product actually sold.
Differentiation
A product or business with a differentiation strategy appeals to the mass market but seeks to set itapart by offering a product that is better than the competitors in some way that matters to the customer,like features or quality. Procter & Gamble's Tide is an example of a product that appeals to a massmarket and charges a premium based on its ability to fight stains, which is something that is importantto people when they wash their clothes. This strategy has also pushed the Tide brand to developinnovative products like the Tide-to-Go Pen, Tide Coldwater, and Tide for High Efficiency washingmachines. Consumers are typically willing to pay more for these products because of the convenienceand effectiveness that they offer.What sets the two focused strategies, discussed next, apart from cost leadership or differentiationstrategies, is that the enterprise's focus is on products aimed at a narrow slice of the total market. Thetarget segment or niche can be defined by geographic uniqueness (e.g., a restaurant chain that focuseson only the major cities of the UK), by specialized requirements in using the product (e.g., portablegame playing units like the Nintendo Game Boy or Sony PlayStation Portables that are able to beplayed anywhere by their owners), or by special product attributes that appeal only to niche members(e.g., banks that offer certain financial products and services only to their wealthiest customers).Generic focus strategies gain in their overall attraction as more of the following conditions are met:
The industry has a wide variety of customers and different customer needs, thereby providing theopportunity to target products at many different segments.The focused segments are not being targeted by strong rivals.The focuser has built up unique capabilities or resources that allow it to serve the targeted nichein ways that are difficult for rivals to match.The niche targeted by the enterprise's products is large enough to be profitable and may alsogrow over time.The market share leaders in the larger product category don't perceive the niche as one that iscrucial to their profitability.
Cost Focus
This is a low-cost strategy that targets a particular pre-determined group of buyers. Companiesemploying a cost-focus strategy are focused on securing a competitive advantage by servingcustomers in the targeted market niche at a lower price than rival competitors. An example of acompany employing this strategy is Motel 6, a provider of overnight lodging in the U.S., which catersto price-conscious travelers seeking a clean, no-frills room for a night.
Differentiation Focus
A focused strategy based on differentiation aims at securing competitive advantage by offering thetargeted niche customers something they perceive is more closely aligned to their own unique needsor preferences compared to the products offered by rival sellers.This strategy focuses on a narrowly defined segment and seeks to differentiate the product based onproduct features, service, or convenience. The philosophy is that the focused strategy can serve theunique needs of the market better than any generalist. Local wineries often successfully employ thisgeneric strategy.The number and type of products offered in a product line will depend on what category the productis in. If a category is dominated by value brands with little differentiation, a variety of product typeswith innovative features will not be appreciated in the marketplace. Differentiation and innovativefeatures should be saved for categories dominated by high-end niche markets where consumers arewilling to pay more for product quality and features.16
Categories dominated by house brands where products are hard to differentiate between one anothershould focus on cost reduction and efficiencies, resulting in less SKUs and economies of scale.A perceptual map can be a useful tool to understand where the consumers see firms in the marketplace in terms of image and product offerings. Not only can a perceptual map help managersunderstand where their product stands relative to other products in the marketplace, it can revealholes or openings in the marketplace, where a company may want to direct future efforts.17 In order toconstruct a perceptual map, we must know the following:
1. 1. What criteria customers use to evaluate competitive product offerings2. 2. How important this criterion is in the marketplace3. 3. Where our product is perceived in the marketplace relative to competitors
Because positioning has an external locus of control (it is in the mind of the consumer), marketresearch is a good way to obtain this information. Sometimes companies will conduct surveys orfocus groups as a way of understanding customers' priorities and how well their product isperforming in the areas that matter. Companies can also hire third-party market research firms to getunbiased feedback through surveys and data mining.Figure 14.2 is an example of a perceptual map for laundry detergents available to customers in NorthAmerica. In this example, a company would have determined on their own, or by purchasing research,that price and innovative product offerings, like special detergents for dark colors, high-efficiencywashers, or organic stains, are important to the majority of purchasers. Then the company orresearcher would determine how the product in question and those of the closest competitors areperforming in meeting price and innovation expectations in the mind of the customer. In this example,
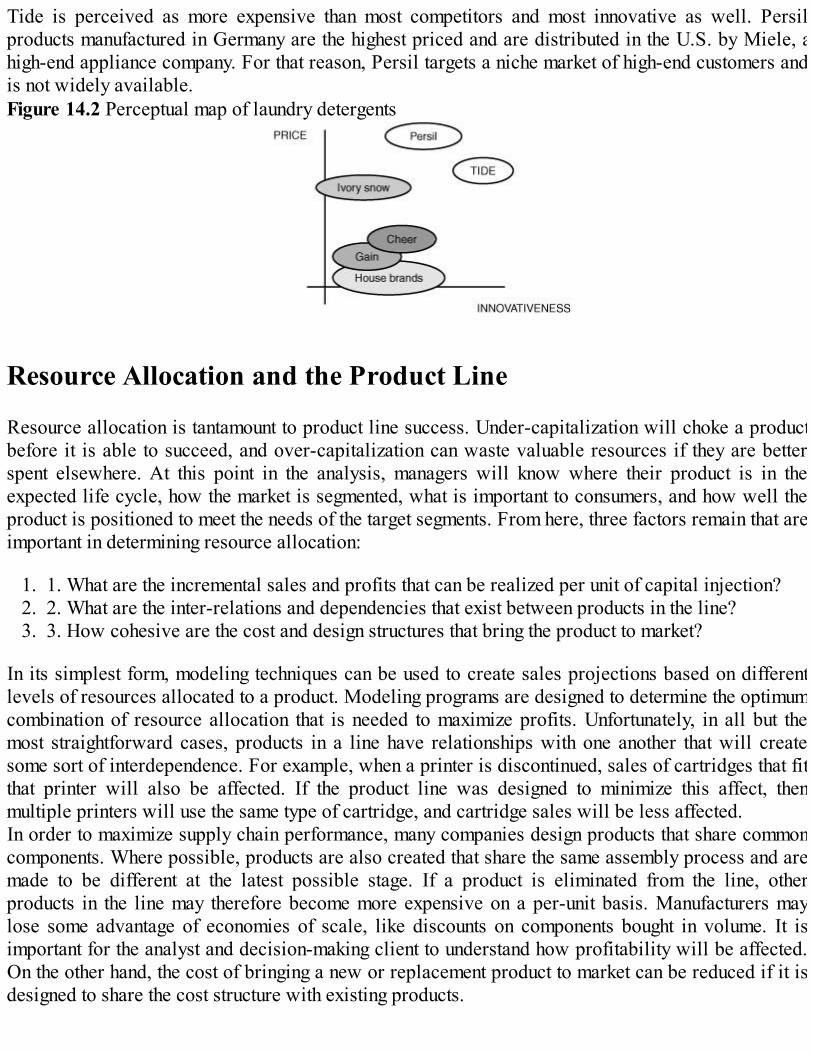
Tide is perceived as more expensive than most competitors and most innovative as well. Persilproducts manufactured in Germany are the highest priced and are distributed in the U.S. by Miele, ahigh-end appliance company. For that reason, Persil targets a niche market of high-end customers andis not widely available.Figure 14.2 Perceptual map of laundry detergents
Resource Allocation and the Product Line
Resource allocation is tantamount to product line success. Under-capitalization will choke a productbefore it is able to succeed, and over-capitalization can waste valuable resources if they are betterspent elsewhere. At this point in the analysis, managers will know where their product is in theexpected life cycle, how the market is segmented, what is important to consumers, and how well theproduct is positioned to meet the needs of the target segments. From here, three factors remain that areimportant in determining resource allocation:
1. 1. What are the incremental sales and profits that can be realized per unit of capital injection?2. 2. What are the inter-relations and dependencies that exist between products in the line?3. 3. How cohesive are the cost and design structures that bring the product to market?
In its simplest form, modeling techniques can be used to create sales projections based on differentlevels of resources allocated to a product. Modeling programs are designed to determine the optimumcombination of resource allocation that is needed to maximize profits. Unfortunately, in all but themost straightforward cases, products in a line have relationships with one another that will createsome sort of interdependence. For example, when a printer is discontinued, sales of cartridges that fitthat printer will also be affected. If the product line was designed to minimize this affect, thenmultiple printers will use the same type of cartridge, and cartridge sales will be less affected.In order to maximize supply chain performance, many companies design products that share commoncomponents. Where possible, products are also created that share the same assembly process and aremade to be different at the latest possible stage. If a product is eliminated from the line, otherproducts in the line may therefore become more expensive on a per-unit basis. Manufacturers maylose some advantage of economies of scale, like discounts on components bought in volume. It isimportant for the analyst and decision-making client to understand how profitability will be affected.On the other hand, the cost of bringing a new or replacement product to market can be reduced if it isdesigned to share the cost structure with existing products.

Case Study: eBay, Inc. in 2004
This case study provides an illustration of how you perform product line analysis along the lines justdescribed. The analysis looks at online auctioneer eBay's product line and shows how the processdescribed previously can answer key questions about its product lines.eBay is a person-to-person, business-to-person, and B2B online auction service provider. eBay'smission is "to provide a global trading platform where practically anyone can trade practicallyanything." eBay has created the world's largest online auction community where people buy and sellgoods of all kinds, including collectibles, artwork, memorabilia, and increasingly larger ticket itemslike cars, boats, and real estate.eBay has some considerations in product line development:
1. 1. Should eBay continue to grow by securing a global presence?2. 2. Should eBay grow their fixed price format and go toe to toe with e-tailers like Amazon.com
and brick and mortar stores with online selling?
eBay will start with a product audit, examining the products in their product line, looking at salestrends, and customer migration patterns. Currently, eBay's platform supports three formats, orproducts in their line:
1. 1. Online auction format, where buyers bid on items.2. 2. Fixed price format, where buyers have the opportunity to submit a best offer or pay a fixed
"Buy it Now" price.3. 3. Store inventory format, where registered users have their own store pages and can manage
and showcase their inventory, combine shipping, and create their own marketing plan orincentives.
eBay's sales trends are tremendous. The company's 41,000 registered users in 1996 grew to94,900,000 registered users by the beginning of 2004, realizing a compound annual growth rate of202%.18 In 1996, eBay reported $7 million in merchandise sales, which grew to $24 billion in 2003,representing a compound annual growth rate of 220%. This seems to demonstrate that the value ofmerchandise sold is increasing even faster than the number of users, meaning that existing users areincreasing their usage, while new users are being attracted. Since eBay's inception in 1996, the usershave shifted in focus from collectors to bargain hunters. The fixed price format is increasing inpopularity, and this could represent a migration away from the auction format toward a general e-tailing format, changing the nature of eBay's competitive landscape. This shift would bring eBay intodirect competition with e-tailers and traditional retailers with online presence like Amazon.com,Staples, Best Buy, and Wal-Mart. However, eBay's CEO, Meg Whitman, is wary of abandoning thecore business too soon.The online auction industry is in a tremendous growth stage, with eBay enjoying approximately 88%market share. Figure 14.3 reveals that eBay's products have reached Stage 2, or the growth stage.Figure 14.3 eBay's sales growth

eBay employed a first mover strategy in Stage 1. During that time, eBay avoided mass media in favorof careful PR and a community building approach. The user-friendly format attracted users who thentouted eBay's benefits, and the company is now enjoying the affects of being the first to many marketsand accumulating the critical mass that is creating global dominance. During Stage 2, or the growthstage, eBay's revenue is soaring, and sales and marketing costs are decreasing on a per-user basis.eBay started to use more mass-marketing techniques after 2002 and acquired many more auctionformats in international markets. Stage 2 is typically when competitors will adopt a fast followerstrategy and is crucial for positioning.eBay's culture is unique in that the users have a sense of bonding with the company and other users.This phenomenon can translate to a core competence when the critical mass has been accumulatedand their needs are continually anticipated and met. Although switching costs to other platforms arelow, the feeling of comfort with a different platform would be hard to replicate, and the credibilitythat users have gained over time through eBay's rating system is not transferable to other sites.eBay's position in the marketplace is consistent with the differentiation positioning strategy. Theglobal Internet retail sector is very fragmented. Only 5.7% of the global sector value belongs to thetop-five companies. The nature of the Internet lends itself to segments that are niche—focusing on oneindustry segment—but eBay has gone against the grain and resisted the urge to chase growth throughtraditional methods. Figure 14.4 demonstrates eBay's valuable positioning in the marketplace on theperceptual map, being the brand with the most awareness and greatest geographical scope.Figure 14.4 Perceptual map positions
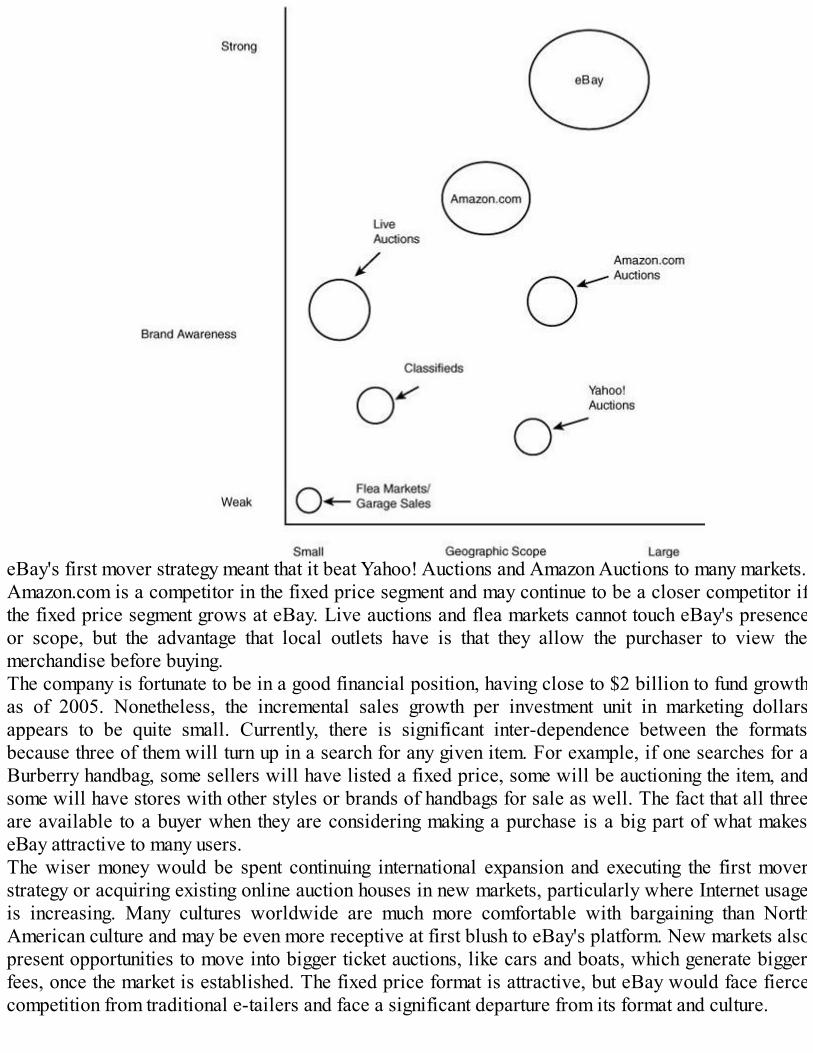
eBay's first mover strategy meant that it beat Yahoo! Auctions and Amazon Auctions to many markets.Amazon.com is a competitor in the fixed price segment and may continue to be a closer competitor ifthe fixed price segment grows at eBay. Live auctions and flea markets cannot touch eBay's presenceor scope, but the advantage that local outlets have is that they allow the purchaser to view themerchandise before buying.The company is fortunate to be in a good financial position, having close to $2 billion to fund growthas of 2005. Nonetheless, the incremental sales growth per investment unit in marketing dollarsappears to be quite small. Currently, there is significant inter-dependence between the formatsbecause three of them will turn up in a search for any given item. For example, if one searches for aBurberry handbag, some sellers will have listed a fixed price, some will be auctioning the item, andsome will have stores with other styles or brands of handbags for sale as well. The fact that all threeare available to a buyer when they are considering making a purchase is a big part of what makeseBay attractive to many users.The wiser money would be spent continuing international expansion and executing the first moverstrategy or acquiring existing online auction houses in new markets, particularly where Internet usageis increasing. Many cultures worldwide are much more comfortable with bargaining than NorthAmerican culture and may be even more receptive at first blush to eBay's platform. New markets alsopresent opportunities to move into bigger ticket auctions, like cars and boats, which generate biggerfees, once the market is established. The fixed price format is attractive, but eBay would face fiercecompetition from traditional e-tailers and face a significant departure from its format and culture.

FAROUT Summary
Figure 14.5 Product line analysis FAROUT summary
Future orientation—Medium. The focus of product line analysis is more current than future.Accuracy—Medium. There are many factors that influence product performance, some of whichinclude social and political forces, and not within the scope of the technique.Resource efficiency—Medium. A lot of information is required in order to do a thorough analysis ofa product line.Objectivity—Medium to high. The process of analyzing the product line is meant to lessen some ofthe subjectivity that managers, particularly those with a vested interest in seeing certain resultsbecome a reality, project onto products.Usefulness—Medium. This normally needs to be done in addition to a variety of other analyses, andas such, in and of itself offers only moderate utility.Timeliness—Low to medium. It can take a while to conduct a very thorough product line analysis.
Related Tools and Techniques
Customer segmentation analysisGE Business Screen/portfolio analysisPorter's Five ForcesProduct life cycle analysisStrategic group analysisSWOT analysisValue chain analysis
References
Buchalter, A., and H. Sakhnini (2006). "Fighting cannibalization," McKinsey Quarterly, 1, pp. 12–13.Cox, W.E. (1967). "Product life cycles of marketing models," The Journal of Business (University of

Chicago), 40, pp. 375–384.Dhalla, N.K., and S. Yuspeh (1976). "Forget the product life cycle concept!," Harvard BusinessReview, 54, pp. 102–111."eBay Canada: About eBay: Company overview." ebay.ca. Accessed Feb. 28, 2006:http://pages.ebay.ca/aboutebay/thecompany/companyoverview.html.Fleisher, C.S., and B.E. Bensoussan (2003). Strategic and Competitive Analysis: Methods andTechniques for Analyzing Business Competition. Upper Saddle River, NJ: Prentice Hall.Jones, M.C. (2004). "eBay lays its cards on the global table," Brand Strategy, September, pp. 12–13.Lee, H.L. (2004). "The triple-A supply chain," Harvard Business Review, 82, October, pp. 102–112.Lefton, L.A., Brannon, L., Boyes, M.C., and N.A. Ogden (2005). Psychology, 2nd edition. Toronto:Pearson Education Canada, pp. 1–757.Levitt, T. (1960). "Marketing myopia," Harvard Business Review, 38, pp. 45–56.Levitt, T. (1965). "Exploit the product life cycle," Harvard Business Review, 43, pp. 81–94.Marino, L., and P. Kreiser (2006). "eBay: In a league by itself," pp. C322–C352 in Thompson, A.,Gamble, J.E., and A.J. Strickland III. Strategy: Winning in the Marketplace, 2nd edition, New York,NY: McGraw-Hill Irwin.Porter, M.E. (1985). Competitive Advantage. New York, NY: Free Press, pp. 317–382.Quelch, J.A., Farris, P.W., and J. Olver (1987). "The product management audit: Design and surveyfindings," The Journal of Consumer Marketing, 4, pp. 45–58.Sellers, P. "eBay's secret." Fortune, Oct. 18, 2004, March 2, 2006:http://money.cnn.com/magazines/fortune/fortune_archive/2004/10/18/8188091/index.htm.Shewchuk, J. (1992). "Life cycle thinking," CMA Magazine, May, pp. 34–36.Swan, J.E., and D.R. Rink (1982). "Fitting market strategy to varying product life cycles," BusinessHorizons, 25, pp. 72–76."The World Factbook: United States." CIA—The World Factbook. January 10, 2006. February 21,2006: http://www.odci.gov/cia/publications/factbook/geos/us.html.Tractinsky, N., and O. Lowengart (2003). "E-retailers' competitive intensity: A positioning mappinganalysis," Journal of Targeting, Measurement, and Analysis for Marketing, 12, pp. 114–136.Vishwanath, V., and J. Mark (1997). "Your brand's best strategy," Harvard Business Review, 75, pp.123–129.
Endnotes
1 2005 estimate of 1.14% comes from the CIA World Factbook.2 Quelch, Ferris, and Olver, 1987.3 Lee, 2004, p. 105.4 Levitt, 1965.5 Cox, 1967.6 Shewchuk, 1992.7 Dhalla and Yuspeh, 1976.8 Buchalter and Sakhnini, 2006.9 Buchalter and Sakhnini, 2006.

10 Cox, 1967; Fleisher and Bensoussan, 2003.11 Swan and Rink, 1982.12 Fleisher and Bensoussan, 2003.13 Shewchuk, 1992.14 Lefton, Brannon, Boyes, and Ogden, 2005.15 Tractinsky and Lowengart, 2003.16 Vishwanath and Mark, 1997.17 Tractinsky and Lowengart, 2003.18 Marino and Kreiser, 2006.

15Win/Loss Analysis
Short Description
Win/loss analysis (WLA) is a cost-effective, insightful, and ethical method for gathering andanalyzing information about your market, customers, and competitors. WLA identifies your customer'sperceptions of specific sales situations and how you compare to your competitors. It provides awindow as to why a customer is buying or not buying your products and/or services. The analysisprovides information about the performance of both your firm and your competitors. This informationcan then be actively used to focus sales staff more effectively in the marketplace and also to informresearch and development of products.
Background
Many companies believe they are already doing WLA, as they do keep track of their wins and lossesand do conduct post mortems. However, these results are generally not shared across the firm; onlysalespeople are involved, and a history of "lessons learned" is lost.WLA is a management tool that allows managers to understand the effectiveness of their sales teamand the effectiveness of competitors. It is an analytical tool that sits well in the competitiveintelligence framework, providing knowledge about a firm's sales performance. If you know yourselfand your competitors from a customer perspective, then your ability to improve your sales success isincreased.WLA requires the gathering of direct feedback from a client or potential client about why you won orlost a specific sale or contract. It must include both wins and losses. The wins commonly highlightyour firm's strengths and your competition's weaknesses, while the losses typically highlight yourfirm's weaknesses and your competition's strengths.1The feedback obtained from a number of these interviews is analyzed. The results illustrate yourfirm's position in the market and that of your competitors. WLA provides information you can activelyuse to improve both the performance of your sales force and your existing products, and to guide yourfirm in the research and development of new products.To be most effective, a win/loss program should be established as an ongoing process conducted on aregular basis by a third-party supplier for maximum objectivity. Key elements suggested by Schulz2
include the following:
Ongoing (not a temporary event around a particular client, product, or sales representative)Uses customer feedback (rather than or in addition to sales representative feedback)Timing (within a reasonably short time following the buying decision)Employs a consistent methodology
Consists of clearly defined users
The feedback incorporating the preceding elements and obtained using the WLA process providesmore detailed and useful information than the traditional sales post mortem. A sales post morteminvolves your sales team discussing its experience of the sale after it is won or lost. WLA directlyinvolves the decision maker with the client firm responsible for the sale or non-sale. It providesaccess to information your client may use in deciding whether or not to do business with you that yoursales team may not aware of; for example, internal budget constraints or the nature of deals offered byyour competitors. It gives insight into the client's relationship with both your own sales team and yourcompetitor's sales team and into the market perception of your products and after sales service.
Strategic Rationale and Implications
WLA is a unique tool that brings together all the elements of strategy—information about customers,competitors, and your own firm—within the context of a most critical element for a business, thebuying decision. As a market listening tool, it is designed to provide a firm with information that canactively be used to increase its sales. By seeking feedback directly from the target market andsubjecting this to analysis, a firm can gain a more objective understanding of its place in the marketand use this to improve its position.From win/loss interviews, a firm can identify how a competitor is developing their products and/orservices or whether they have or have not delivered on promises. It can provide an avenue to re-opendoors with former clients. As a tool, it makes existing and potential clients realize the commitmentyour firm has to maintaining good customer relationships.However, the strategic implications of WLA are highly dependent on the quality of the raw data. Theraw data gathered from clients should be free from any political or strategic bias and subjectiveperspective—particularly where employees within a firm may distort information. Sales staff, forexample, are not the best group to conduct WLA, as they often may be too biased or emotionallyinvolved with their accounts to be objective when conducting a WLA. Many firms employ third-partyinterviewers to gather the feedback for WLA specifically to avoid subjective influences from taintingthe data and conduct parallel interviews with relevant sales staff, as well as clients, to allowcomparison of these differing perspectives of the same sale/non-sale.The results of WLA performed on feedback interviews will give information about salesperformance, sales opportunities, market perception of your and your competitors' products, and yourcompetitors' strategies. It can provide a measurement of how your firm is positioned with decisionmakers and key influencers within a client's firm. When acted on, this information can enable yourfirm to improve sales, increase market share, understand the market to maximize businessopportunities, and focus marketing and sales resources to increase revenue.Naylor identifies tactical and strategic benefits flowing from WLA. Tactical benefits tend to focus onsales performance, while strategic ones flow beyond the sales team to assist with productmanagement, mergers and alliances, and product research and development. These are summarized inTable 15.1.Table 15.1Tactical and Strategic Benefits of WLA

Source: Adapted from Naylor, E. (2002). "Increasing sales through win/loss analysis," CompetitiveIntelligence Magazine, 5(5), pp. 5–8.WLA must not be confused with typical sales post mortems. First, analysts have the opportunity tolearn about customers' perceptions. Customers' perceptions are the basis for their decision-makingprocesses and ultimately impact a firm's sales performance. As Ritchie points out, "widely heldperceptions, or misconceptions, must not be discounted. Instead they must be managed or changed infuture sales encounters."Second, WLA should be an independent evaluation and conducted regularly to allow medium- andlong-term trends in the market to be identified. Most firms adopt a monthly or quarterly cycle.Third, when conducted systematically and regularly, WLA enables a firm to keep a close eye on itsmarket, to monitor its own performance, and to gain timely feedback on its strategies and practices.
Strengths and Advantages
WLA is a systematic analysis of nominated sales results—both wins and losses. It encompassesfeedback from strategically important existing clients, former clients, and potential clients.Conducting win/loss interviews is a direct demonstration to your clients and potential clients thatyour firm values its relationship with them.Interviews are conducted as close as possible to the actual sale or non-sale being investigated toensure accurate recall of the circumstances. Because interviews are conducted by an independentthird-party interviewer, information bias is limited, and particular issues relevant to its business arecovered in a more transparent way. Obtaining information that addresses specific issues ensuresmeaningful comparison can be made when analyzing the responses obtained at individual interviews.Regular and systematic WLA processes provides not only immediate feedback, but can also be usedto compare and uncover trends over time.The WLA process allows for direct feedback on what the decision-making criteria employed by yourclients, in awarding your firm their business or taking it to a competitor, are. An expert interviewer
can go beyond the standard questionnaire to probe a client and give him or her a chance to directlyexpress their needs and preferences. This in turn gives your firm the opportunity to make meaningfulchanges acting on customer advice to improve practices and win new sales.The benefits of conducting WLA extend beyond providing tactics to improve sales. WLA also has animpact on marketing, product improvement, and research and development. Information coming out ofWLA can be distributed throughout the firm to aid in overall performance improvements. The resultsobtained from WLA may be used to inform other strategic programs within a firm. For example, itmay assist in the development of training programs for sales staff or assist in product improvementprojects.The WLA process will give an indication in real time of the market's response to new businessstrategies and products. It will enable the firm to identify and respond to trends over time in themarket and assist in sales forecasting. If undertaken in a systematic way, it will assist in growingrevenues both in the short and long term.In summary, WLA establishes a market listening and positioning tool with consistent analysisallowing for improved and informed decision making in an organization by
Helping decision makers understand the customer's perspective.Providing objective input into sales and marketing strategies.Identifying opportunities, including target markets, key sales propositions, and winning attitudes.Improving business performance at the expense of competitors.
Weaknesses and Limitations
WLA is based on data obtained from interviews arising out of sales results. It is to that extent reactiveand event-driven. Care must be taken to ensure that a good mix of sales results is followed up.Results will be skewed, for example, if in one round of WLA, only successful sales to existing clientsare analyzed.A key weakness of this process is that interviews are only as good as the interviewer conductingthem. When an interviewer is inexperienced or has not been thoroughly briefed on the sensitivities ofthe market in question, the quality of the data obtained will be compromised. An inexperiencedinterviewer may lack the confidence to ask questions beyond those contained in the standardquestionnaire developed for the WLA process. Even the most experienced interviewer will be unableto gain all the useful information potentially available if they are not sufficiently aware of the issuesin the market to know when to probe for further detail in an interview and when it is not relevant.There is no value in information gathered if it is not systematically disseminated to those who can acton it. As is a danger with any information-gathering process in a firm, it is possible for the results ofWLA to end up being fiercely guarded rather than distributed. On the other hand, it is possible toundermine the process by giving all of the results to everyone and no one having time to read them, letalone act on them.The value of WLA will only be as good as the system set up to inform interested parties of the results.Information taken out of context—for example, in an attempt to extrapolate widely from oneindividual analysis—will not be reliable. The true value of WLA is in the ongoing process.

WLA must be conducted systematically and in a timely fashion. Interviews must be organized andfollowed up as soon as possible after the sale is won or lost. Delay in interviewing may result ininaccurate recall, so the analysis performed does not reflect the real reasons behind the decision to dobusiness with your firm or with your competition. WLA itself should be conducted regularly to givetruly comparable results. The analysis must not, for example, be shelved while more important issuesare dealt with, as sporadic WLA will not give reliable information.The fact that WLA focuses on sales results may lead to a politicizing of the process within a firm. Thesales team may be reluctant to cooperate fully with the process if they feel they are being singled outunfairly. Other parts of the firm may try to ambush the process to push their own agendas. The teamresponsible for running WLA must be very carefully chosen and trained to ensure the members fullyunderstand the WLA process and are prepared to implement it properly.
Process for Applying the Technique
Numerous writers in the field suggest that there are up to seven steps to consider in creating andimplementing a WLA process. These steps are shown in Figure 15.1. Each of the steps in the WLAprocess are described next.Figure 15.1 The win/loss process
Step 1: Determine the Target Segments and Identify Prospects
Target the right accounts to analyze and the right interval to conduct analysis. A good starting point isto look at the accounts that generate most of your firm's revenue (the 80/20 rule—80% of a firm'srevenue comes from 20% of its customers). However, other considerations in choosing whom tointerview may include whether your firm wishes to pick up business from particular potential clientsor ex-clients or whether there are plans to introduce new products to the market. Specific companies
that meet the firm's chosen criteria need to be identified and singled out and reviewed to ensure thatthe targets are worth the investment.Powell and Allgaier suggest that one needs to start by segmenting the specific market group or target,particularly if the purpose of WLA is to identify sales sources. Once target segments and their criteriaare identified, key information needs to be collected to qualify potential prospects.The interval over which you run your WLA will depend on your firm's requirements. Monthlyanalysis requires a greater commitment of time and money but will provide very quick marketfeedback. Some firms prefer to run a large win/loss study annually. The interval chosen will also beaffected by how quickly you wish to be able to act on the information you obtain as well as thefrequency of sales opportunities experienced.
Step 2: Understand Internal Cultural Issues
Understanding your firm's culture will provide a guide as to how information will be used. Forexample, in a learning and consultative culture, sales representatives and their managers mightbecome highly involved in both the collection and evaluation of information.It is also important to ensure that involvement in the process extends beyond the sales team. Other keystakeholders need to be clearly identified, and creating cross-functional teams may be a way ofaddressing the differing needs of critical groups.The results of WLA have implications that go beyond increasing sales. To get the most out of theprocess, the team running the program should include members from other departments and have thesupport of senior management. Schulz points out the wisdom of involving senior management (evenup to the CEO) to help to keep internal politics out of WLA. The objectives of the program must alsobe well defined. The roles of designing and implementing the program should be clearly understood,as these may be assigned to different people.Those who are likely to be affected by the information obtained from the WLA program should beeducated about the process to ensure they support it. This should reduce internal resistance to WLA.Some staff, particularly in sales, may feel that their performance is being unfairly singled out forattention by the program. Staff should be reassured that the WLA program has wider implications forthe firm than simply monitoring the performance of individuals in the sales team.The decision must be made whether to use an independent third party to conduct the interviews orwhether to use your sales team. Use of a third-party interviewer has cost implications. It will alsorequire a commitment of time from internal staff to brief the interviewer. The use the firm intends tomake of the information will also direct the decision of who conducts interviews. When the results ofthe interviews will be used in part to evaluate the performance of members of the sales team, Schulzsuggests keeping sales staff involvement in the interview process to a minimum. However, parallelinterviews of client and sales representative can reveal valuable information about the differentperceptions they have of the same sales negotiations.
Step 3: Develop the Questionnaire
A WLA questionnaire needs to cover a number of broad areas. Naylor suggests four, as follows:

Sales attributes—This will cover the professionalism of your sales team, the quality of therelationship your firm has with the client, and the esteem in which the client holds your firmcompared to your competitors.Company reputation—This includes questions about the perception of your firm's and yourcompetitors' image in the marketplace, the stability of your firm, and its reliability as a supplierand the quality and performance of your products.Product attributes—This is a wide area basically covering whether your products actuallyperform as promoted and covers issues of price and technology.Service issues—These questions will cover the delivery and implementation, maintenance/aftersales service, and training provided to clients.
Depending on the purpose of the WLA, other areas that might be included in the questionnaire couldaddress matters relating to how the purchase decision will be made. Will it be made by a group orindividual? What are the decision criteria? When will the decision be made? Are there otherstakeholders involved?Another consideration will be the sophistication of the analysis you plan to carry out on the results.When analysis will stop at the quick identification of market trends, numerous detailed questions maynot be necessary. When statistical analysis is the aim, the information must be sufficiently detailed toaddress the required level of analysis and still be of practical value.Standard issues need to be identified in the questionnaire to ensure that the data from multipleinterviews can be effectively analyzed together. At the same time, some flexibility in the interviewprocess will enable valuable exploration of individual situations.
Step 4: Preparation for the Interviews
The interviewer now needs to be briefed about the significance of winning or losing each sale. To getthe most out of the interview, the interviewer must be aware of all relevant details and sensitivities ofthe sale/non-sale being investigated.When an interviewer does not fully understand the background of a particular sale negotiation, he orshe is unlikely to be able to stray from the standard form questionnaire to probe for detailed situation-specific feedback. Specific and detailed information can greatly enhance the overall value of theWLA process.
Step 5: Conducting Interviews
Carefully consider how you wish to go about conducting interviews. This decision will depend to anextent on whether you plan to use a third-party interviewer or your own sales team. Experts in thisfield highly recommend the use of an independent third party to avoid interview results being skewedby any pre-existing relationship between a salesperson and his or her client. For example, theinterviewer may direct the responses they receive with unintentional body language cues.One option is to conduct interviews by telephone. This is a common practice in the U.S. and is quitetime and cost effective. However, in some situations—for example, for big-ticket purchase items—it

may be preferable to conduct face-to-face interviews in order to obtain optimal results in a particularsituation. Here you will need to rely on your sales team to advise when face-to-face interviewswould be better. It should be noted that face-to-face interviews provide a much greater opportunity togarner in-depth information and to build on customer relationships than do telephone interviews.Interviews should be conducted as close in time to the actual sale/non-sale so to avoid memories ofthe negotiations fading. Some firms may also interview the salesperson involved in the particularsale/non-sale to investigate differences between the firm's own internal perception of the negotiationsand those of the client.
Step 6: Analysis and Interpretation
Once the interviews are completed, the results need to be tallied and analyzed. The interviewer willgenerally summarize each completed interview and provide an analysis of key trends or issuesidentified as a result of the interviews in a report. If the interviews are carried out by internal staff,then training and support must be provided to carry out these tasks effectively and to aid with thereport development. WLA must be given clear priority over other duties when analysis is due to bedone. The value of WLA can be compromised by sporadic rather than regular analysis.As the WLA program continues over time, trends will emerge from the analytical results. These needto be interpreted in light of the firm's strategic and competitive intentions.Further, over time, WLA becomes more valuable in identifying trends that impact productdevelopment and sales forecasting. Companies have been known to adjust their product plans in lightof client feedback from WLA.
Step 7: Dissemination
The report and results can now be disseminated. There will be information arising out of WLA that isrelevant to different departments in the firm such as research and development, marketing, and sales.The program team should ensure that each department receives the information relevant to it. Thisshould hopefully increase the likelihood that the information is read and supports decision making inthe appropriate department. The results may be presented in different forms depending onpreferences.Different staff will have different preferences for how the WLA results should be communicated tothem—from verbal presentations at the completion of interviews to half-yearly reports. Schulzhighlights a WLA program where senior management received a monthly report summarizingquantified results, while the sales team had results incorporated into their regular e-mail alerts.Properly conducted WLA is one of the most valuable tools for sales account strategies. WLA helpsfirms understand the value of customers and the cost of retaining them versus acquiring new ones.Simultaneously, it allows firms to capture best practices in sales and identify trends to enhance futurerevenue streams.
Case Study: Microsoft Business Solutions
Microsoft Business Solutions (now known as Microsoft Dynamics) provides a line of financial,customer relationship, and supply chain management solutions to help businesses improve theirperformances. Delivered through a network of specialized partners, these integrated businessmanagement solutions work with Microsoft software to streamline processes across an entirebusiness and include applications and services for retailers, manufacturers, wholesale distributors,and service companies, doing business domestically or in multiple countries.At the time of this case study, Microsoft Business Solutions was well positioned to be the dominantplayer in the mid-level financial software market with its Great Plains solution. This solutionprovides a financial, analytics, and business management system that unifies data and processesacross a business, integrating easily with other solutions, and connecting employees, customers, andsuppliers regardless of time or location.With a strong product and a large sales force, Microsoft had the potential of winning the majority ofcompetitive opportunities.The challenge facing Microsoft Business Solutions was to understand the competitive environment inorder to leverage its strengths and capitalize on the weaknesses of its competitors with the goal ofwinning the lion's share of opportunities.
Understanding the Environment
Primary Intelligence conducted a win/loss assessment of Microsoft Great Plain's previous 100opportunities, comprised of 50 wins and 50 losses. Information was gathered on purchase selectioncriteria, primary competitors' strengths and weaknesses, the efficacy of various marketing activities,and customer satisfaction.Analysis of the gathered information yielded a clear picture of the competitive environment, focusingon areas of differentiation—both in product and in sales methodology. It became apparent thatMicrosoft Business Solutions had clear advantages in certain areas that had not been previouslyidentified and that although the competition was strong in most areas, they exhibited specificweaknesses that contributed to Microsoft wins.
Learning from Their Losses
Two important, related things Microsoft Business Solutions learned from their losses were that: a)prospects didn't perceive that they or their partners understood their needs; and b) one of the waysprospects expressed this was in lower marks for industry experience and knowledge.Because of the knowledge gained in the win/loss report, Microsoft Business Solutions subsequentlyannounced industry-focused strategies in four major industry sectors that they believe will help themand their partners be more successful in the mid-market.

Leveraging the Data
As part of the Primary Intelligence solution, senior analysts helped Microsoft Business Solutionsleverage the data in the report to improve their competitive position in the marketplace, provide evenfurther insight into the competitive sales cycle that Microsoft Business Solutions' channel partnerscurrently face in today's market conditions, and gain important insight into potential new strategiesand programs that could be implemented to ultimately help the partner win more business incompetitive situations.
Keeping Current
Another valuable tool for Microsoft Business Solutions was the comparison Primary Intelligenceprovided with the previous year's win/loss study. Analysis of the differences showed that certainshortcomings had been addressed, while new potential problems had surfaced. It also showed theprogress, or lack of progress, of the competition, making it possible to assess new threats and exploitnew opportunities.This ongoing assessment made it possible for Microsoft Business Solutions to track the dynamics ofthe industry, respond quickly to change, and stay one step ahead of the competition.3
FAROUT Summary
Figure 15.2 Win/loss analysis FAROUT summary
Future orientation—Medium to long term. Each time WLA is conducted, information will beobtained about how to improve sales by optimizing the focus of sales resources. Over the long term,market trends are revealed and can be used to fine tune strategic planning, research, and development.Accuracy—Medium. Accuracy will depend on the integrity of the interviews conducted. Use of anindependent third party will improve accuracy.Resource efficiency—Medium to high. A third party specialist will be able to run a firm's WLAprogram very efficiently, albeit in a more costly manner. When internal staff take a greater role, therewill be a decrease in the resource efficiency due to the utilization of staff time.Objectivity—Medium to high. When interviews are conducted by a third party, objectivity should be

high. However, use of staff to conduct interviews will probably result in a lowering of objectivity asinternal biases creep in.Usefulness—High. WLA provides useful practical and insightful information on customer perceptionsand competitors' activities.Timeliness—Low to medium. The timeliness of the information obtained will depend on the intervalchosen for the WLA process and how often it is repeated.
Related Tools and Techniques
BenchmarkingBlindspot analysisComparative cost analysisCompetitive positioning analysisCompetitor analysisCustomer segmentation and needs analysisCustomer value analysisFunctional capability and resource analysisScenario analysisSWOT analysisValue chain analysis
References
Gale, B. (1994). Managing Customer Value: Creating Quality and Service that Customers CanSee. New York, NY: Free Press.Levy, S. (2003). "A call to integrate: CI, customer relationship management, and sales forceautomation," Competitive Intelligence Magazine, March–April.Naylor, E. (2002). "Increasing sales through win/loss analysis," Competitive Intelligence Magazine,5(5), pp. 5–8.Powell, T., and C. Allgaier (1998). "Enhancing sales and marketing effectiveness through competitiveintelligence," Competitive Intelligence Review, 9(4), pp. 29–41.Powell, T., and C. Allgaier (2003). "How high is your sales IQ?," Competitive IntelligenceMagazine, 6(6), pp. 30–35.Prescott, J., and C. Miree (2000). "TAP-IN to strategic and tactical intelligence in the sales andmarketing functions," Competitive Intelligence Review, 11(1), pp. 4–16.Ritchie, J. (1992). "Competitor assessment tools: win/loss analysis," Competitive IntelligenceReview, Winter, pp. 18–19.Schulz, S. (2002). "Seven steps to building a successful win/loss program," Competitive IntelligenceMagazine, 5(5), pp. 9–12.Web sites (all accessed March 12, 2006):www.graffgroup.com/winlossarticle.html

www.lassiterassociates.com/winloss_casestudy.htmlwww.marketing-intelligence.co.uk/resources/competitor-analysis.htmwww.primary-intel.com.solutions/winloss.aspxwww.webpronews.com/ebusiness/sales/wpn-9-20041209HowWinLossAnalysisCanImproveYourSalesPerformance.html
Endnotes
1 Ritchie, 1992.2 Schulz, 2002.3 Source: Web site: http://www.primary-intel.com/solutions/winloss.aspx, Primary Intelligence(accessed March 12, 2006).
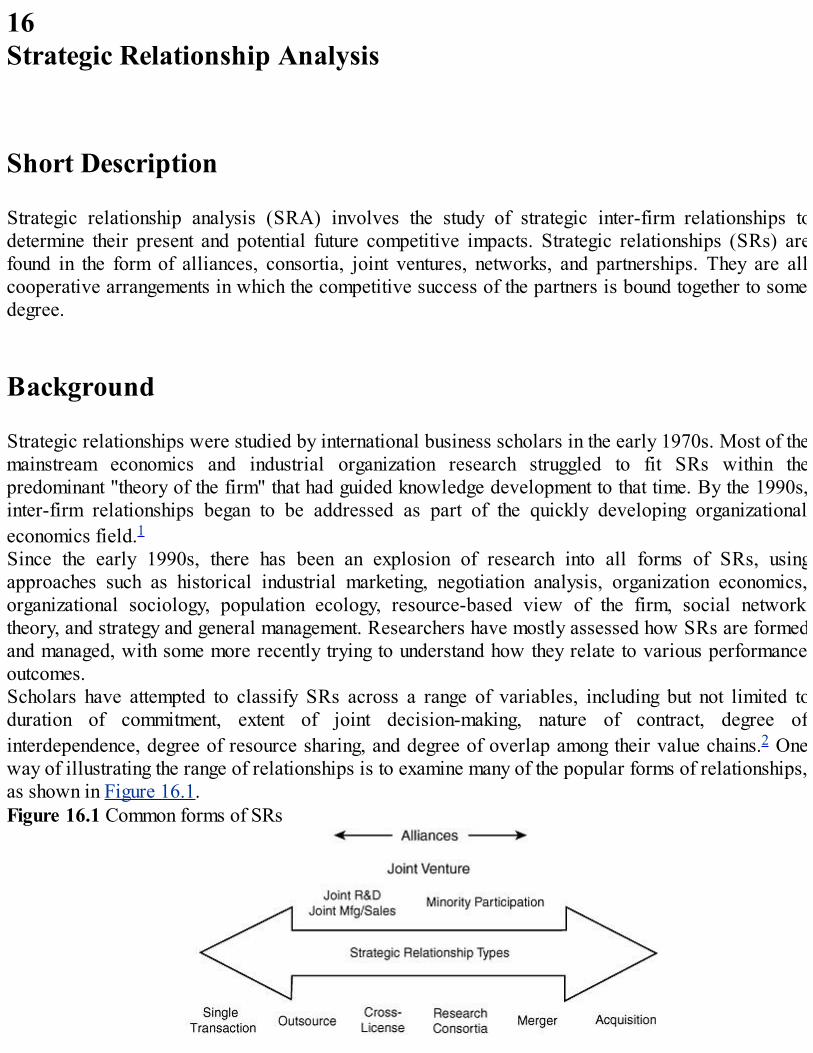
16Strategic Relationship Analysis
Short Description
Strategic relationship analysis (SRA) involves the study of strategic inter-firm relationships todetermine their present and potential future competitive impacts. Strategic relationships (SRs) arefound in the form of alliances, consortia, joint ventures, networks, and partnerships. They are allcooperative arrangements in which the competitive success of the partners is bound together to somedegree.
Background
Strategic relationships were studied by international business scholars in the early 1970s. Most of themainstream economics and industrial organization research struggled to fit SRs within thepredominant "theory of the firm" that had guided knowledge development to that time. By the 1990s,inter-firm relationships began to be addressed as part of the quickly developing organizationaleconomics field.1Since the early 1990s, there has been an explosion of research into all forms of SRs, usingapproaches such as historical industrial marketing, negotiation analysis, organization economics,organizational sociology, population ecology, resource-based view of the firm, social networktheory, and strategy and general management. Researchers have mostly assessed how SRs are formedand managed, with some more recently trying to understand how they relate to various performanceoutcomes.Scholars have attempted to classify SRs across a range of variables, including but not limited toduration of commitment, extent of joint decision-making, nature of contract, degree ofinterdependence, degree of resource sharing, and degree of overlap among their value chains.2 Oneway of illustrating the range of relationships is to examine many of the popular forms of relationships,as shown in Figure 16.1.Figure 16.1 Common forms of SRs
In this instance, we are particularly interested in inter-firm relationships between businessorganizations. This is not to discount the value of management network analysis, which examines therelationships between individuals within and around an organization. Indeed, many of the conceptsdeveloped at the micro-level of network analysis are adaptable for use at the more macro-level ofinter-organizational or inter-firm analysis, and vice versa. Common forms of strategic inter-firmrelationships include, but are not limited to, those described next.Consortia—An association of firms who cooperate for some definite purpose. Cooperation isnormally formed through contracts. Each party retains its separate legal status, and the consortium'scontrol over each participant is generally limited to activities involving the joint endeavor,particularly the allocation of profits. A well-known consortium is Airbus Industrie, one of the world'spremier airplane manufacturers that operates mainly in Europe. Airbus is owned by EADS andBritish Aerospace. EADS itself is a merger of France's Aeropspatiale-Matra, Germany's Daimler-Chrysler Aerospace, and Spain's Construcciones Aeronauticas, all of whom were originally separatepartners in the consortium. Airbus' status as a consortium means that profits accrue to the partnerfirms relative to their ownership interests.Constellations/alliance groups/strategic networks—A constellation is a set of firms linked togetherthrough alliances that compete in a particular competitive domain, business, market, or technology.These are portfolios of alliances that come together either formally or informally within a largernetwork. Popular examples of these constellations are the global airline relationships that competeunder the Star Alliance global partnership, OneWorld, or SkyTeam Global Alliance umbrellas.Joint ventures (JVs)—Contractual agreements bringing together two or more organizations for thepurpose of executing a particular business undertaking. The contracting parties form a new legalentity and agree to share in the profits and losses of the JV. These can be either operating or non-operating forms. Operating JVs create a new firm with its own facilities to perform designatedfunctions. Non-operating JVs are purely administrative or legal entities that contract with their parentfirms for certain activities.Licensing agreements—The granting of permission by a firm to use intellectual property rights, suchas patents technology, or trademarks under certain defined conditions. The sponsor is typically alarger and more established partner that provides the smaller party with needed capital to develop apromising product. These can include simple product development funding agreements with orwithout options to acquire the resulting output or non-specific development funding that was targetedto help the sponsor obtain access to more preliminary developmental work or research that may notbe immediately applicable to its business.Mergers and acquisitions (M&As)—Sometimes viewed as an alternative strategy to an alliancebecause the relationship involves a complete transfer of ownership of one organization to the other(that is, the relationship essentially ends after the acquisition is completed). These need to beconsidered and compared as strategic options for one another.3 M&As are especially well suited forsituations where the popular forms of SRs do not go far enough in providing a firm with access to theresources it needs to compete more effectively. Many M&As are driven by strategies to achieve oneof the following objectives:4
Allow the acquiring firm to immediately gain more market share.Eliminate surplus capacity in an industry by removing the "fat" from bloated operations.Facilitate a firm's entry to new geographic territories or international markets.Extend the firm's business into new product or service categories.

Provide speedier access to developing technologies as opposed to performing time-consumingR&D.Lead the convergence of existing industries whose boundaries are being blurred by disruptionand new market opportunities.
Minority investments—A relationship in which one firm makes an investment in the shares ofanother, but whose ownership of the firm is less than 50 percent of its outstanding shares. These areoften made by large, established businesses that make purchases in high-potential businesses at anearly stage of those businesses' development.Networks—An intricately connected system of firms. Derived from social network analysis, this isthe study of the structural form of the ties that link organizations or individuals. 5 It is a particularlyuseful tool for mergers and acquisitions, JV analysis, and inter-firm relationships.Outsourcing—Work is performed for a firm by people other than the firm's full-time employees. Thetwo big drivers behind outsourcing are that outsource providers can provide services better, cheaper,or more quickly than the firm can or that it allows the firm to focus its capabilities on what it doesbest in the marketplace.Strategic alliances (SAs)—Agreements between organizations in which each mutually commitsresources to achieve shared objectives. Firms may form strategic alliances with a wide variety ofplayers: customers, suppliers, competitors, universities, or divisions of government. Throughstrategic alliances, firms can improve competitive positioning, gain entry to new markets, supplementcritical skills, and share the risk or cost of major development projects. When these cut acrossnational boundaries, and depending on how many boundaries are involved, they are sometimesreferred to as cross-national, multinational, or global strategic alliances. Others define these morerestrictively; for example, Professor Benjamin Gomes-Casseres of Brandeis University views themas open-ended, incomplete agreements with shared control that create value by combining thecapabilities of separate firms. An "incomplete" agreement means that the full terms or conditions ofthe alliance are not fully established at its conception because if they were, the need for a strategicalliance would not exist. Professor Gomes-Casseres summarizes why these are used when he states,"With an alliance, you can pinpoint where the greatest value creation potential lies and form thepartnership around those specific areas only."
Strategic Rationale
Over the last few decades, firms across nearly every industry and in all parts of the world haveelected to form SRs to help them accomplish their strategic initiatives and enhance theircompetitiveness in domestic and international markets. There is evidence that firms are increasinglylooking to SRs as a way of achieving greater scale, incorporating new expertise, or quickly movinginto a new geographic region, particularly if they view the complexity and resources required tomerge with, or acquire another, firm to be too daunting. Gomes-Casseres notes that we nowunderstand better about how firms and alliances are organized, but are still lagging in understandinghow these relationships impact marketplace dynamics; nevertheless, there are a number of reasonswhy organizations pursue these relationships as a means of enhancing their competitiveness.
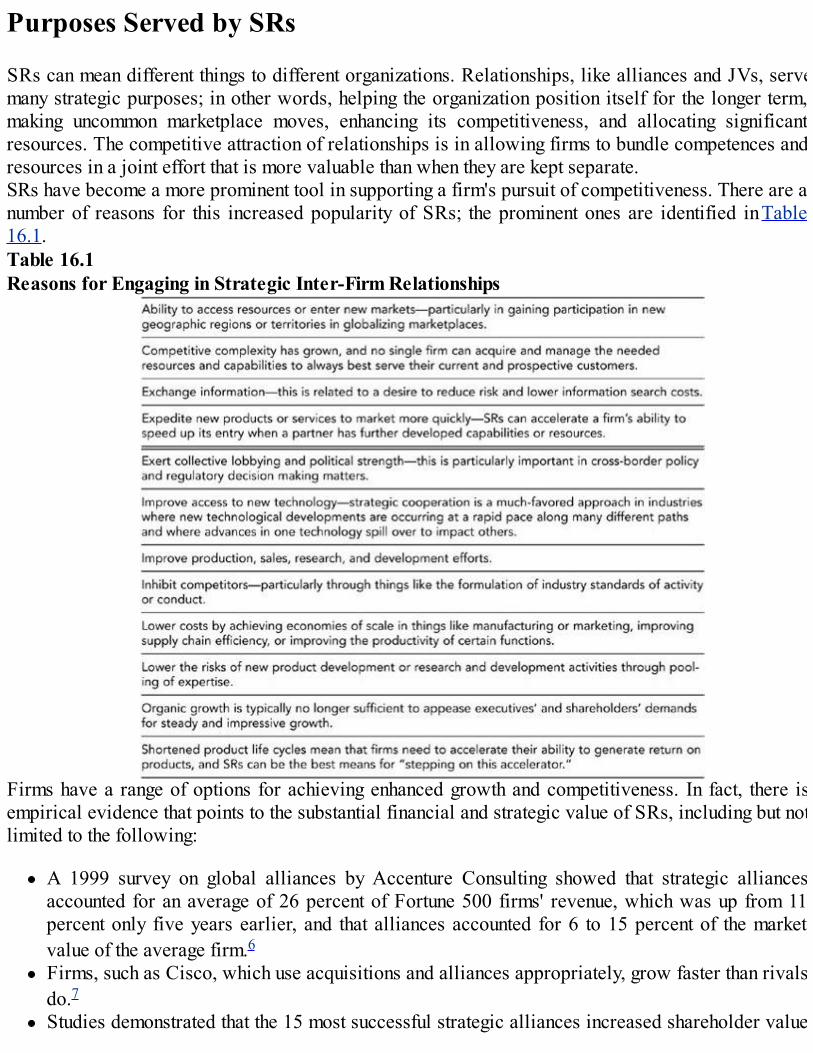
Purposes Served by SRs
SRs can mean different things to different organizations. Relationships, like alliances and JVs, servemany strategic purposes; in other words, helping the organization position itself for the longer term,making uncommon marketplace moves, enhancing its competitiveness, and allocating significantresources. The competitive attraction of relationships is in allowing firms to bundle competences andresources in a joint effort that is more valuable than when they are kept separate.SRs have become a more prominent tool in supporting a firm's pursuit of competitiveness. There are anumber of reasons for this increased popularity of SRs; the prominent ones are identified in Table16.1.Table 16.1Reasons for Engaging in Strategic Inter-Firm Relationships
Firms have a range of options for achieving enhanced growth and competitiveness. In fact, there isempirical evidence that points to the substantial financial and strategic value of SRs, including but notlimited to the following:
A 1999 survey on global alliances by Accenture Consulting showed that strategic alliancesaccounted for an average of 26 percent of Fortune 500 firms' revenue, which was up from 11percent only five years earlier, and that alliances accounted for 6 to 15 percent of the marketvalue of the average firm.6Firms, such as Cisco, which use acquisitions and alliances appropriately, grow faster than rivalsdo.7Studies demonstrated that the 15 most successful strategic alliances increased shareholder value

by $72 billion, while the 15 least successful ones generated a loss of market capitalization ofaround $43 billion.8American firms announced 74,000 acquisitions and 57,000 SAs between 1996 and 2001. Duringthat period, the acquisitions' combined value was driven upward by $12 trillion.9
Developing and maintaining successful relationships in a variety of forms with other firms is criticalto achieving competitive advantage for many firms.10 Firms like Cisco, HP, IBM, Oracle, and Procter& Gamble, among others, are increasingly looking to alliances to enhance their competitivecapabilities and win new marketplaces. Relationships have also become more critical to thesuccessful execution of business strategies, particularly in the global marketplace. They are a flexiblealternative to acquisition or growing organically and can provide better access to resources andcapabilities. With the growing number and complexity of relationships, however, most firms are notas process focused and disciplined as those whose relationship successes are commonly heard aboutin the general and business media.There is always an element of co-operation present in the realm of competition; even long-time rivalsform relationships to achieve common aims. Notable examples are the Airbus consortium ofEuropean aircraft manufacturers described earlier, different banks working together to launch Visaand Mastercard, the Sematech consortium of U.S. semiconductor manufacturers, and milk and dairyfarmers using the Dairy Farmers of America organization to achieve cooperative marketing,distribution, supplies purchasing, and market access in that agricultural sector. The development oftrust and commitment in these collaborative and competitive relationships will usually lead to morebeneficial outcomes.11
SRs take on a greater role for multinational corporations in a rapidly globalizing marketplace. A firmthat seeks global market leadership requires relationships to assist it in accomplishing what it cannoteasily do alone. For example, SRs can help a firm get into critical country markets more quickly thanit can alone, acquire inside knowledge about unfamiliar markets and cultures through its relationshipswith local partners, or access valuable skills and competencies that are concentrated in particulargeographic locations.12
Two Key Strategic Relationship Processes
All SRs will compose at least the following two critical processes that will be of prime interest tothe business and competitive analyst:
1. 1. The process of forming the strategic relationship2. 2. The process of managing the relationship
Each of these processes should be studied by the analyst as they can offer clues that can impact arival's, or your own firm's, competitiveness.Although successful SRs can be prime vehicles for future growth and increase the shareholder valueof the participating parties, many firms are finding it increasingly difficult to capture the full value oftheir relationships. It is commonly accepted that a majority of strategic alliances under-perform orend prematurely, and a number of the failed relationships have resulted in dramatic decreases in

market capitalization.13 Two primary reasons for relationship failure are insufficient attention to theworking relationship between partners and lack of a corporate alliance management capability. Firmsthat have demonstrated the best performance in alliance management are those for whom relationshipcompetencies are a corporate capability and the relationship management process is viewed as acentral feature to their firm's success.Gomes-Casseres identified 10 factors to be critical to success in both alliance formation andmanagement processes:
1. 1. Alliances must serve a clear strategic purpose that is related to the larger business strategy ofthe firm.
2. 2. Partners must have complementary objectives and capabilities.3. 3. Partners must be able to work on those tasks in the relationship for which they are uniquely
qualified.4. 4. Incentives must be structured to encourage co-operation among the partners.5. 5. Areas of potential conflict between the partners must be identified in advance and minimized.6. 6. Communication must be active, two-way, and candid to encourage the development of shared
trust.7. 7. Personnel must move in both directions between partners.8. 8. Partners need to retain a focus on their long-term shared objectives and sometimes be willing
to suffer inconvenience or pain in the short term.9. 9. Partners should try and develop a number of projects on which they can collaborate together
so that all their eggs are not in one risky basket.10. 10. Partners should retain and build in as much flexibility into their arrangements as feasible in
order to evolve with changes in the environment.
Despite the many benefits that have been achieved by partners in SRs, there is growing evidence thatoverall performance in relationships may not be as positive as was initially thought.14 Many SRsbecome unstable, break apart, and are discontinued. The longevity of an alliance depends on howwell the partners work together, their success in responding to and adapting to changing internal andexternal conditions, and their willingness to renegotiate the bargain if circumstance so warrant.There are also dangers for firms that rely too heavily on SRs. A key vulnerability is one partybecoming dependent on other firms in their relationships for essential expertise and capabilities overthe long term. Because of these varied performance outcomes, it is critical that you be able tounderstand and decipher the signs of changing competitiveness within relationships affecting thefirms, their industries, and their rivals.
Strengths and Advantages
SRs have grown in prominence in recent years and are expected to continue this trend. Because of thecompetitive importance and sheer value of these inter-firm combinations, business and competitiveanalysts need techniques that allow them to draw insights into the decisions and actions their ownfirms need to take to improve their competitive context. Effectively combined with other tools, SRAcan be a powerful weapon in the analytical arsenal of the analyst.
SRA assists the analyst in focusing on competition in the way that it is increasingly being structured. Ithelps you to understand the nature of competition as it is conducted by different combinations offirms. It can also be used to provide insights into competition at a more micro-level (for example,relationships at a particular stage of an industry's value chain) than some other techniques.SRA can be supported by software applications expressly developed for the purpose of helping youvisualize competition as it occurs in networks or constellations. These applications have grown inboth availability and functionality in recent years. Combined with the growth of data available on theWorld Wide Web, these techniques can uncover relationships that would have previously goneunnoticed.SRA is one of the newest and fastest-developing fields of analysis. Analysts can apply and use thistechnique in ways that were not even considered a few years ago. As such, an analyst's ability todevelop new insights and to better support decisions and actions could be a strategic advantage forthe firms who are successfully employing this method.
Weaknesses and Limitations
The application of SRA does not provide ready-made insights or provide immediate decision-makingsupport, but it does provide a wealth of newly organized data and information, often in complex andintricate graphic forms. In order to accomplish the task of developing strategic insight, SRA must becombined with other techniques to get actionable insights. It must also be combined with the growingbody of knowledge in this area since there are still no ready-made guidelines that can be universallyapplied to help you understand competition within strategic inter-firm relationships.Many SRA efforts, especially those supported through task-specific software applications, quicklybecome exercises in developing complex network diagrams that provide little practical insight. Mostdecision makers will not easily or quickly appreciate these visualizations, as they are not the type ofdata (that is, ordinarily condensed, synthesized, and succinctly summarized) that usually cross theirdesks. The analyst must make sense of these diagrams in ways that the decision maker willappreciate. This is an area of competitive analysis that is only now receiving attention, and thereremains a lot to learn.SRA requires specific forms of data to be effective. Much of this data will not be easily orinexpensively available or will not be available in a format that will promote the application of SRAtechniques. This will require analysts to work with their firm's information specialists and beincluded when information communication and technology purchasing decisions are being made. Eventhese decisions will be difficult for analysts and their firm's IT specialists, since many of theapplications that would support the gathering and organization of data for studying relationship-basedcompetition are in the development phase, and there are few lengthy track records of experienceabout the vendors of these systems.
Process for Applying the Technique
There are two major processes that an analyst needs to understand in analyzing SRs. The first
requires you to assess the firm's strategic relationship readiness and capability. The second requiresyou to assess your rival's relationships, relationship resources, and capabilities. Each of these isdiscussed in turn in the following section.
1. Studying Your Own Firm's Relationship Formation Readiness
In forming a strategic relationship, firms should begin by assessing their readiness to be involved in arelationship. Among other things, this includes having in place negotiation skills, change managementexpertise, relationship management competence, interoperable systems and processes, support fromsenior executives, and governance in the form of a relationship management structure.Relationship-seeking firms should also define their business vision and strategy in order tounderstand how an alliance fits their objectives. Establishing goals and objectives for the relationshipis usually the best place to start, followed by figuring out how closely matched they are to the firm'slarger business and strategy goals. This stage of the formation process should also include anunderstanding of the benefits and costs that will potentially be generated within the relationship.Intangible benefits in the form of risk reduction, increased visibility or publicity, knowledgetransfers, rival inhibition, and customer goodwill need to be considered.Alternatives to a strategic relationship, including building the capabilities or seeking the benefitsthrough the firm's own (that is, organic) activity, or mergers and acquisitions, should also beconsidered to determine if a relationship is a superior means of helping the firm meet its goals. Thefirm can usually proceed to the next step if it determines at this step that the goals of the potentialrelationship fit neatly with its larger strategy, the net gains of engaging in the relationship outweighthe estimated losses, harms and/or risks, there are no unacceptable risks, and a relationship is asuperior option to the others available to achieve its goals.The next step is for you to evaluate and select potential partners based on the level of mutual benefitthat can be generated and the perceived ability of the firms to work well together. Analysts shouldconsider: the complementariness of the partner's operational/production and technical capabilities;whether it has been involved successfully in any prior relationships and if it has the capabilities tomanage the relationship; and whether it has the resources to make a good "go" of the relationship. Itusually also helps to understand the partner's reputation in the marketplace, as the new relationshipwill be based at least partly upon that facet. Finally, it is useful to work through several of the so-called soft "S" elements of the McKinsey 7S framework (see Chapter 12, "McKinsey 7S Analysis"),such as shared values, leadership style of decision makers, and skills in order to determine whetherthe potential "fit" of these elements will be supportive to the proposed relationship. Assuming theresponses to all of these areas are positive, you can recommend pursuing negotiations.What occurs next in the relationship formation process is a meeting with the top prospectiverelationship partner to discuss the future of the potential relationship. This ordinarily begins byspecialists in the firm developing a working relationship and mutual recognition of opportunities withthe prospective partner. The firm should have confidence in its ability to negotiate reasonable, if notmutually favorable, terms with the partner. It should also have confidence in its ability to resolve anypotential differences in establishing the relationship objectives, gaining agreement on the allocationof resources, melding different communication and information infrastructures, creating shared humanresource policies and plans, gaining exclusivity on forming relationships with other firms, and
establishing performance management and measurement systems, as well as developing controls toassure both parties that the relationship is operating according to both parties' wishes.Once the relationship is agreed and established, the next task is to provide the appropriate level andquality of management to the relationship. Like most other organizational forms, relationships canevolve over time in a life cycle pattern. A relationship life cycle would include stages of pre-relationship (identification of potential partners), negotiation, introduction (the launch of therelationship), relationship management, and the latest stage of dissolution or restructuring. The lifecycle concept can help you understand the phases of the relationship and may provide some keys as towhat the partners in the relationship might do in terms of future investments, resource allocations, andother tactical options.Relationship management is a unique facet of the SR process and requires the partners to demonstratethey have the capabilities to effectively manage their relationship with one another. Some firmsdesignate particular individuals or groups to take on this responsibility. Here are some of the tasks atwhich an analyst needs to become adept when assessing SRs:
Assessing the degree of fit between the relationship portfolio and the firm's business orcorporate strategy, goals, and objectivesAssessing the overall performance and value in the firm's portfolio of relationshipsAssessing the performance of individual relationshipsReviewing all relationships to identify current and potential synergiesRemoving underperforming relationships from the portfolioIdentifying the fastest-growing relationships for additional resource allocation and funding forgreatest returnEvaluating prospective partners and offering negotiation consultation and assistanceDefining the parties' roles and responsibilities in the originating and originated relationshipFacilitating the launch of new relationships by establishing appropriate governance structuresand operating protocolsRe-launching poorly performing alliancesAssessing the health of the working relationship between your firm and your partnersComparing alliance management capability against demonstrated and proven practices (seeChapter 11, "Benchmarking," for more on this task)Facilitating the creation of knowledge and performance management systems to facilitate thesharing of lessons and learning across the relationship portfolio
Having done the preceding tasks, the analyst should be in a better position to provide insights todecision makers who need to make determinations about relationships as a means for accomplishingtheir strategies. The next task will be to study the relationships maintained and potentially sought bymarket rivals. This is done in order to identify opportunities and threats facing your firm so you canmake decisions and take actions to improve your competitive position.
2. Studying a Rival's Relationships
There are a variety of techniques for studying a rival's relationships. The method we recommend is afairly typical three-step process, which includes the following:

1. 1. Identify relationships.2. 2. Map relationships.3. 3. Assess and analyze the relationships.
These are discussed in order next.
1. Identify Relationships
Many relationships are subtle and unannounced; others are bold and "in your face." For publiclytraded rivals with highly visible products targeted at consumers, it is generally easier to identify theirrelationships. A big part of this process involves taking the results of the rival's business modelanalysis (see Chapter 8, "Business Model Analysis") and SWOT.15 A business model analysis has,for example, shown that two firms in the operating systems marketplace took very differentapproaches to leveraging their primary products. Microsoft had a closed platform and deliberatelymade it difficult for others to partner with them unless it was squarely on Microsoft's terms. Red Hattook the opposite approach with its Linux systems and essentially tried to leverage its open platformthrough relationships with whatever parties could benefit from a relationship with it.It is also important at this stage to identify the nature of the relationships. Does the rival tend to preferusing strategic alliances? Has it been dependent on JVs? Does it have relationships with certainconsortia that it relies upon for its competitiveness? The analyst should try and uncover the rival'schoice of relationships in the recent past, as this may indicate its predilection toward the future. Ahistoriographical approach (see Chapter 25, "Historiographical Analysis") can be used to facilitatethis examination of past relationships.
2. Map Relationships
Where the nature of a rival's relationships are predominantly in network forms (for example,constellations, strategic alliances, and consortia), it is usually best at this point for you to employmapping techniques so that these relationships can be studied visually. These maps can be developedin two primary ways: by using whiteboards and markers/pen and paper, or by using digital mapping,modeling, and/or visualization software. Because of the overwhelming volume of data associatedwith a rival's relationships, analysts need "maps" of the pathways between firms, especially incomplex industries or marketplaces. These maps can provide a sense of context that is absent frommost hierarchical presentations of data in linear text form. The map can also help you to quickly getan adequate overview of the relationships in an unfamiliar area to guide the efficient use ofconventional analysis methods.One of the newer ways of understanding relationships is to do an analysis of relationships usinginformation available on the Internet. Search engines such as HotBot, Google, and Alta Vista providethe "reverse link look-up" for links that lead into a firm's main Web site. The links indicate eitherofficial or unofficial relationships. Using this form of hypertext link analysis, you can often uncoverrelationships between firms that may not have been as clearly uncovered through traditional methodsof human source or media analysis collection. Reid extensively describes how this form of Web link
analysis can uncover otherwise hidden relationships within the World Wide Web, particularly as therelationships may provide you with competitive analysis insights.In this book, we are mainly looking at the relationships between firms. Although we focus ourcomments to this level, this does not preclude you from looking at the nature, type, and directions ofindividual or personal relationships. Each of these levels of analysis can help you gain a richerunderstanding of the firm's rivals, its relationships, opportunities, and vulnerabilities.16 Corporaterelationships are the formal and informal relationships that a rival has with other organizations. Mostrelationships are created because there are some important exchanges of resources (funds, expertiseindividuals, and assets) occurring between the related organizations. These exchanges ordinarilyleave a trail of visible evidence that is among the easiest for good intelligence practitioners to locateand gather.
3. Assess and Analyze the Relationships
Once the analyst has mapped the relationships that rivals maintain, he needs to examine the structure,developmental and managerial process, and context of these relationships for a variety of factors.Among the factors are the following: 17
Age or timing of the relationship. SRs have been known to follow a traditional life cycle pattern,18
and the age of the relationship can provide clues as to what might transpire with the SR in the nearfuture. SRs tend to go one of two ways after a number of years: They either disband due to the failureof the relationship to accomplish the partners' goals, or they are restructured to create a new,independent entity or a different organizational form to maximize the ability of the relating partners tosucceed in the marketplace. On the emergent side of the life cycle, Eisenhardt and Schoonhoven arguethat firms exhibit a higher propensity to enter into alliances in markets with many competitors, as wellas in markets that are in an emergent life cycle stage. Some industries—for example, biotechnology—also exhibit patterns whereby high levels of relationships are formed at an early stage of technologyevolution.19
Location of the relationships. You need to assess whether the rival tends to use its relationships incertain geographic markets (that is, it has JVs in Asia, but not in Western Europe), or whether therelationships are located at a particular point in the rival's value chain (for example, some firms inchemicals, biotechnology, and pharmaceutical industries are known to rely heavily on SRs to helpthem perform their research and development activities; auto manufacturers rely heavily onrelationships in the purchasing and sourcing areas, as well as the development of advancedtechnologies).Management's relationship capacity and expertise. Many firms active in pursuing and participatingin relationships will have individuals (for example, relationship portfolio managers) and structures(for example, an alliance management function) designed to manage their portfolio of relationships;this is usually a sign that it views this activity as important to its success. Relationship managementcapabilities have become increasingly important in firms that simultaneously manage a large numberof relationships. These firms are essentially forced to institutionalize relationship managementpractices. Due to the strategic importance of relationships in many of these firms, relationshipmanagement capabilities have the potential to be a source of competitive advantage. On the otherhand, firms that have no history of being in relationships before may experience greater difficulties in
developing these relationships.Market context of relationships. In order to determine whether a relationship will actually impactthe profitability or market share of your firm, you should attempt to answer the following questions:
What is the size and relative attractiveness in terms of profit potential of the market targeted bythe relationship?What share of the market do the potential partners currently hold?How quickly is this particular area of the prospective partners' business growing?Have prospective partners been improving their capability in the targeted relationships' marketarea?
Combining these questions with already conducted techniques, such as critical success factor analysis(see Chapter 18, "Critical Success Factors Analysis"), industry analyses (see Chapter 6, "IndustryAnalysis (The Nine Forces)"), competitor analyses,20 and/or SWOT can be highly beneficial inanswering these questions.Mix of relationships. This requires you to look at the types of relationships the rival has. Does therival primarily use strategic alliances, or do they rely heavily on licensing agreements or co-activity(that is, co-marketing, co-production, and co-purchasing) arrangements? Assuming the rival offersproducts or services across a range of markets, does it use certain forms of relationships in somemarkets, while using different forms in others? The mix of relationships it uses may provide you withinsight into what it is trying to achieve and the next steps it may choose to make.Number of relationships. Some firms are known for making heavy use of relationships in the waythey approach their marketplaces; others are known for avoiding them. The number of relationships arival has, particularly as it compares to other rivals in similar marketplaces, can give helpful insightsinto the approach, resources, and capabilities of the rival.Position in the relationship. The positions of members in the relationship, particularly in networksor consortia, can indicate much about the behavior of firms or the entire relationship. Firmspositioned at the center of a relationship often display a greater ability to influence the outcome.Networks or consortia with a powerful, centrally positioned firm will often take on these attitudesand behavior, as opposed to the characteristics of the more peripheral parties.Potential for knowledge spillovers. SRs are often formed to capitalize on knowledge, two types ofwhich are of particular interest to the analysts since they signal different things: migratory knowledge,often technical in nature, which can be transferred easily between people or organizations in aformula or product; and embedded knowledge, which defines how a particular firm organizes itself todo business.21 SRs take place between myriad organizations in many industries, and largemultinational corporations can be involved in hundreds of relationships simultaneously.22 Therefore,it is often important not only to identify your rival's partners but also its partner's relationships aswell. A rival's partner may also be your competitor or collaborator in another relationship, so caremust be taken that information or knowledge shared in one relationship doesn't leak over to your rivalthrough another relationship.Size of the firms in the relationship. The research remains unclear about the relationship between thesize of firms and the likelihood to either form or behave in certain ways in relationships. Gomes-Casseres suggests that absolute size may be less important for the partnering behavior of small firmscompared to their relative size with direct rivals. He notes that firms that lead their market segmentsand are large compared to their direct competitors are likely to have less incentive to seek alliances.

Strength and positions of the parties in the relationships. Some relationships are more important toa rival firm than others; for example, one in which the rival is benefiting unevenly or is in a sectorthat it considers to be critical for its future or growth will be more closely guarded and given moremanagerial attention than relationships that are at the periphery of their strategy. Eisenhardt andSchoonhoven suggest that firms are more likely to form alliances if they are in a vulnerable strategicposition. They define strategic position through the number of competitors, the stage of marketdevelopment and the strategy of the firm. Another key facet to the strength of the relationships is tolook at the resources strength and capabilities of the partners involved. Well-managed relationshipsbetween strong partners can often result in more powerful rivals in the marketplace.Clusters of relationships. As opposed to only assessing micro-level dyadic relations between firms,you also need to look at multi-level relationships in the form of alliance blocks, clusters orconstellations. Competition between alliance blocks is a form of rivalry in which groups or clustersof firms that link together for a common purpose by means of SRs, is superimposed on competitionbetween individual firms.23 Driving forces and competitive pressures often favor some clusters whilehurting others. The profit potential of different clusters varies due to strengths and weaknesses in eachcluster's market position. A good example of clusters of relationships is the constellation ofrelationships present among air transportation firms. Table 16.2 shows the constellation ofrelationships that constitutes these relationships as of 2006.Table 16.2Major Constellations in the Air Transportation Industry Circa 2006
Source: Market shares are of all air passengers as of end 2004 and were drawn from data in theIATA 2005 annual report.After having studied the relationships and worked through these questions, you should be in a goodposition to make sense of the competitive impact of the rival's relationships. At this point, it will beimportant to recommend insights to decision makers that can leverage them. For example, arecommendation might be to fund opportunities to weaken a rival's position by weakening itsrelationships or to strengthen one of your own firm's relationships as a means of precluding a rivalfrom gaining an advantage. The kinds of recommendation that can emanate from SRA are often highlevel and of high value and therefore should be most appealing to the senior decision makers andexecutives in your firm.
FAROUT Summary

Figure 16.2 Strategic relationship analysis FAROUT summary
Future orientation—Low to medium term. Projecting the nature of SRs into the future is not an easytask, and most forms of SRA have yet to build in the ability to extrapolate relational behavior intoanything beyond the short term.Accuracy—Medium to high. Most SRA requires sophisticated mapping, mathematical modeling, andstatistical skills, assuming the presence of the appropriate data underlying these applications.Resource efficiency—Low to medium. Gathering the data needed to perform a sophisticated SRA canrequire substantial digital as well as human resources. The establishment of databases for thispurpose can require a significant amount of cumulative effort over time.Objectivity—Medium to high. To the extent that this analysis is not supported through sophisticatedmodels and databases, there can be a high degree of subjectivity involved in interpreting the results ofthe relationship analysis.Usefulness—Medium. SRA is most useful when combined with other tools. It can answer sometactical questions easily and quickly, but to help promote strategy development, it needs to be usefullycombined with other techniques.Timeliness—Medium. This depends on the presence of the appropriate data, the nature of SRAapplications employed, and the nature of the decision-making task to which it is being applied.
Related Tools and Techniques
Industry analysisIssue analysisManagement network analysisStakeholder analysisSTEEP/PEST analysisStrategic group analysisSWOT analysis
References

Badaracco Jr., J.L. (1991). The Knowledge Link: How Firms Compete Through Strategic Alliances.Cambridge, MA: Harvard Business School Press.Bamford, J.D., Gomes-Casseres, B., and M.S. Robinson (2003). Mastering Alliance Strategy: AComprehensive Guide to Design, Management and Organization. San Francisco, CA: Jossey Bass.Borgatti, S.P., and J.L Molina (2003). "Ethical and strategic issues in organizational networkanalysis," Journal of Applied Behavioral Science, 39(3), pp. 337–350.Borgatti, S.P., and P. Foster (2003). "The network paradigm in organizational research: A review andtypology," Journal of Management, 29(6), pp. 991–1013.Cainarca, G.C., Colombo, M.G., and S. Mariotti (1992). "Agreements between firms and thetechnological life cycle model: Evidence from information technologies," Research Policy, 21, pp.45–62.Churchwell, C.D. (2004). "Rethink the value of joint ventures," Harvard Business School WorkingKnowledge newsletter, May 10 edition.Cross, R., Parker, A., and S.P. Borgatti (2002). "Making invisible work visible: Using socialnetwork analysis to support strategic collaboration," California Management Review, 44(2), pp. 25–46.Cross, R., Parker, A., Prusak, L., and S.P. Borgatti (2001). "Knowing what we know: Supportingknowledge creation and sharing in social networks," Organizational Dynamics, 30(2), pp. 100–120.Cross, R.L., Parker, A., and S.P. Borgatti (2000). "A birds-eye view: Using social network analysisto improve knowledge creation and sharing," Knowledge Directions, 2(1), pp. 48–61.De Man, A.P. (2002). "How to analyze alliance networks," Competitive Intelligence Magazine,5(4), pp. 14–16.Doz, Y.L., and G. Hamel (1998). Alliance Advantage. Cambridge, MA: Harvard Business SchoolPress.Dyer, J.H., Kale, P., and H. Singh (2004). "When to ally and when to acquire," Harvard BusinessReview, July, pp. 108–115.Eisenhardt, K., and C.B. Schoonhaven (1996). "Resource-based view of strategic alliance formation:Strategic and social effects in entrepreneurial firms," Organization Science, 7, pp. 136–150.Fleisher, C.S., and B.L. Bensoussan (2003). Strategic and Competitive Analysis: Methods andTechniques for Analyzing Business Competition. Upper Saddle River, NJ: Prentice Hall.Gary, L. (2004). "A growing reliance on alliance," Harvard Management Update, April, articlereprint U0404B.Gomes-Casseres, B. (2005). "How alliances reshape competition," Ch. 3 in Shenker, O., and J.J.Reuer (eds.), Handbook of Strategic Alliances. Newbury Park, CA: Sage Publications.Gomes-Casseres, B. (1998). "Strategy before structure," Alliance Analyst, August, online textavailable at http://www.alliancestrategy.com/MainPages/Publications/Managerial.shtml.Gomes-Casseres, B. (1997). "Alliance strategies of small firms," Small Business Economics, 9, pp.33–44.Gomes-Casseres, B. (1996). The Alliance Revolution. Cambridge, MA: Harvard University Press.Gompers, P.A. (2001). "A note on strategic alliances," note 9-298-047, Boston, MA: HarvardBusiness School.Gonzalez, M. (2001). "Strategic alliances: The right way to compete in the 21st century," IveyBusiness Journal, 66(1), Sept/Oct, pp. 47–51.Jagersma, P.K. (2005). "Cross-border alliances: Advice from the executive suite," Journal ofBusiness Strategy, 26(1), pp. 44–50.

Kassler, H. (2000). "Competitive intelligence and the Internet: Going for the gold," InformationOutlook, 4(2), pp. 37–42.Khanna, T. (2001). "Inter-firm alliances: Analysis and design," Administrative Science Quarterly,46(3), pp. 582–585.Krackhardt, D., and J. Hansen (1993). "Informal networks: The firm behind the chart," HarvardBusiness Review, July/August, pp. 104–111.Kuglin, F.A., with J. Hook (2002). Building, Leading, and Managing Strategic Alliances. NewYork, NY: AMACOM.Lorange, P., and J. Roos (1993). Strategic Alliances: Formation, Implementation, and Evolution.Malden, MA: Blackwell.Lyles, M.A. (1988). "Learning among joint venture-sophisticated firms," pp. 301–316 in Contractor,F., and P. Lorange (eds.), Cooperative Strategies in International Business. Lexington, MA:Lexington Books.Mockus, D. (2003). "Do you REALLY know what the competition is doing?" Journal of BusinessStrategy, 24(1), Jan/Feb, pp. 8–10.Park, S.O., and G.R. Ungson (2001). "Interfirm rivalry and managerial complexity: A conceptualframework of alliance failure," Organization Science, 12(1), pp. 37–53.Reid, E. (2004). "Using web link analysis to detect and analyze hidden web communities," in Vriens,D.J. (ed.), Information and Communications Technology for Competitive Intelligence. Hershey,PA: Idea Group Publishing.Segil, L. (2004). Measuring the Value of Partnering: How to Use Metrics to Plan, Develop, andImplement Successful Alliances. New York, NY: AMACOM.Segil, L. (2003). "Relationship management as a corporate capability," The CEO Refresher (an e-magazine), retrieved from the Web on March 10, 2006 athttp://www.refresher.com/!lscapability.html.Thompson, A.A., Gamble, J.E., and A.J. Strickland (2006). Strategy: Winning in the Marketplace,2nd edition. New York, NY: McGraw-Hill.Vanhaverbeke, W., and N.G. Norderhaven (2001). "Competition between alliance blocks: The caseof the RISC microprocessor technology," Organization Studies, 22(1), January, pp. 1–30.Walker, G., Kogut, B., and W. Shan (1997). "Social capital, structural holes and the formation of anindustry network," Organization Science, 8(2), pp. 109–125.Wallace, R.L. (2004). Strategic Partnerships: An Entrepreneur's Guide to Joint Ventures andAlliances. Chicago, IL: Dearborn Trade Publishing.Yoshino, M.Y., and U.S. Rangan (1995). Strategic Alliances: An Entrepreneurial Approach toGlobalization. Boston, MA: Harvard Business School Press.
Endnotes
1 Gomes-Casseres, 2005.2 Bamford, Gomes-Casseres, and Robinson, 2003; Gomes-Casseres, 1996.3 Dyer, Kale, and Singh, 2004.4 Thompson, Gamble, and Strickland, 2006.
5 Krackhardt and Hansen, 1993.6 Gonzalez, 2001.7 Dyer, Kale, and Singh, 2004.8 Gonzalez, 2001.9 Dyer, Kale, and Singh, 2004.10 One bit of evidence that relationships have become more prominent among business professionalshas been the formation of associations dedicated to meeting the needs of those individuals whoperform in strategic relationship roles—for example, the Association of Strategic AllianceProfessionals (ASAP), Inc., headquartered in Massachusetts (see http://www.strategic-alliances.org).This association assists both those involved in developing alliances, as well as those executives whomust manage them.11 Lorange and Roos, 1993.12 Badaracco Jr., 1991; Jagersma, 2005.13 Dyer, Kale, and Singh, 2004; Gonzalez, 2001.14 Churchwell, 2004; Park and Ungson, 2001.15 See Fleisher and Bensoussan, 2003, Chapter 8.16 For literature and guidance on conducting this form of network analysis at the level of individual toindividual relationships, see Borgatti and Foster, 2003; Cross, Parker, and Borgatti, 2002, 2000;Cross et al., 2001; and Krackhardt and Hansen, 1993.17 de Man, 2002; Gomes-Casseres, 2005; Mockus, 2003.18 See Fleisher and Bensoussan, 2003, Chapter 24.19 Walker, Kogut, and Shan, 1997.20 See Fleisher and Bensoussan, 2003, Chapter 11.21 Badaracco Jr., 1991.22 Doz and Hamel, 1998.23 Vanhaverbeke and Norderhaven, 2001.
17Corporate Reputation Analysis
Short Description
Corporate reputation analysis (CRA) identifies a firm's or industry's perceptual image among keystakeholders based on a given set of factors. The CRA process sets out to give strategic managers asolid understanding of the firm's current image with their stakeholders to enable it to improve itsrelations with them in the future, ultimately increasing the firm's performance. The results of CRAprovide a solid foundation to plan effective reputation management.
Background
In 1983, Fortune Magazine published their first edition, featuring its list of America's Most AdmiredCompanies. In many regards, this was the first real introduction of CRA to the general public.Since then, many variations and modifications have been made to the general idea of what is"admired" in firms, and CRA has emerged as a process to be used for analysis over various differentspecific criteria. Corporate reputation became recognized as a valuable asset.Popular media organizations used CRA to create "most admired" or "top ten" lists of firms thatreflected the interests of their target audiences, whether these are gender-specific or based on broaderconcerns such as diversity, the environment, etc. These lists were, and still are, usually constructedusing opinion sought from CEOs and industry analysts.Over time, CRA moved beyond media organizations and was adopted by many consulting firms,communications agencies, as well as internal marketing departments who conducted the analysis andused the results for reputation management.It was not until 1999 that a systematic attempt was made to standardize CRA and make the processless subjective. Charles Fombrun, who founded The Reputation Institute, developed, with NaomiGardberg and Joy Sever, a standardized formula for CRA, which they called the Reputation Quotient.The article they published about it in 2000 notes that their aim was to broaden CRA, taking it beyondthe narrow range of opinion traditionally sought by the media and open the process to encompass theperceptions of multiple stakeholder groups. Their plan was to develop CRA into a robust analyticalinstrument that was both statistically valid and reliable.While this standardized process was a great advancement for the analytical technique, many firmscontinue to construct their own CRA processes to meet their own specific purposes. Reputationmanagement can be shown diagrammatically as follows in Figure 17.1.Figure 17.1 Reputation management

In recent times, a number of firms throughout the world sadly have damaged their corporatereputations through the behavior of their senior executives. Increasingly reputation risk management isbecoming an agenda item for directors and in boardrooms.So whatever method they employ, individual firms that actively monitor their reputation amongstakeholders can use the information they obtain to strategically manage their reputation on acontinuous basis.Charles Fombrun and Christopher Foss quote Alan Greenspan's commencement speech as Chairmanof the U.S. Federal Reserve—"In today's world, where ideas are increasingly displacing the physicalin the production of economic value, competition for reputation becomes a significant driving force,propelling our economy forward. Manufactured goods often can be evaluated before the completionof a transaction. Service providers, on the other hand, usually can offer only their reputations."
Strategic Rationale and Implications
According to Grahame Dowling: "When strategy involves either growth or innovation, a companyputs its corporate reputation into play. Growth involves stretching the company's operations,sometimes to the breaking point. Innovation involves doing something new."1
CRA seeks to identify and possibly enhance a firm's, or group of firms', image(s) among theirstakeholders. The process may be undertaken by an individual firm to obtain information about itscurrent reputation and help it design strategies to improve its reputation. The process may also beapplied across an industry to accurately gauge how a firm's reputation compares to those of itscompetitors. Comparative information can then be used to differentiate the firm from its competitors.While the particular reputation factors examined in a given analysis may vary, they all relate to thereputation of the firm in the eyes of stakeholders and should give an indication of the success orotherwise of the firm's reputation management strategies.
Dowling suggests that the major sources of corporate reputation risk fall into six broad areas:
1. 1. The industry in which a firm operates.2. 2. Identifying strategies.3. 3. The culture and daily operations of the firm.4. 4. The comments and behavior of senior executives.5. 5. Managing stakeholder relationships.6. 6. Response to a crisis.
Firms that can effectively monitor their reputation among selected stakeholders across the six boardareas mentioned previously will have a useful view of what type of strategic initiatives might berequired to enhance their image. It will give the firm direct feedback of its reputation as perceived bystakeholders after the affects of public relations and advertising (both by the firm and by itscompetitors), media exposure, and any other external influences (for example, market speculation) aretaken into account.Successfully managing a company's reputation on a continuous basis is referred to as reputationmanagement and is becoming increasingly important to senior management. Reputation managementis usually a function of the public relations department and requires every aspect of a firm's operationto be consciously communicated with an overall strategy of improving or maintaining reputation. Itmay entail differently constructed messages tailored for specific groups of stakeholders—forexample, more technical information being made available to industry analysts than is provided inpress releases to general media outlets.The image a firm communicates can heavily influence the actions of key stakeholders of the firm,including customers, employees, investors, and so on. The result of this is that the firm's reputationalso has an impact on the overall value of the business, in dollar terms and also in terms of its valueas a potential business partner in strategic alliances. The management of corporate reputation, then,can be seen to be an important part of the successful management of a firm overall.
Strengths and Advantages
Universal
The main advantage of CRA is that the process can be applied to any firm, no matter what type ofindustry it operates in or what size it is. The need to be aware of the image portrayed to keystakeholders is universal to all business. Small businesses may earn a good reputation in the eyes ofthe general public in a variety of ways—for example, by sponsoring local events, through the build upof customer loyalty and resulting word-of-mouth recommendations, or a network of friendshipslinking many people within the community directly to those participating in the business. Similarly,large firms earn their reputation in many ways (for example, sponsoring events or supporting charity),but quite often the image of the top executive has a very strong affect on the firm's overall reputation.For example, firms such as Apple, Ford, and GE have very prominent CEOs.
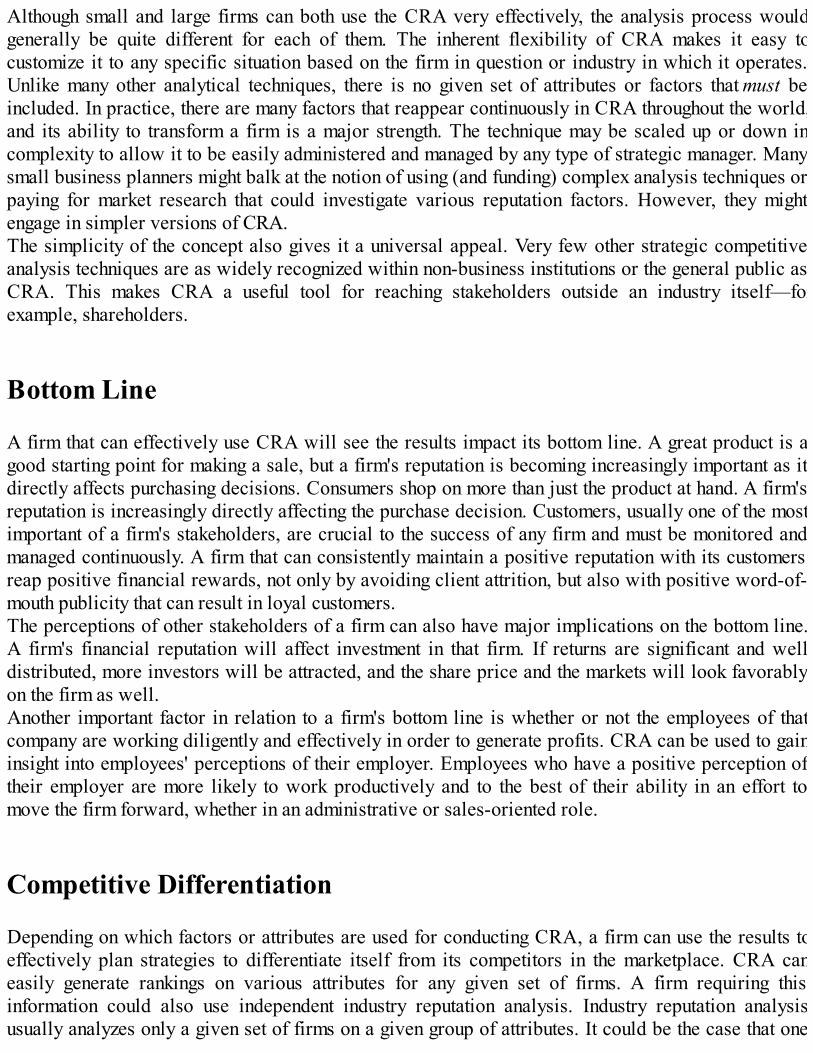
Although small and large firms can both use the CRA very effectively, the analysis process wouldgenerally be quite different for each of them. The inherent flexibility of CRA makes it easy tocustomize it to any specific situation based on the firm in question or industry in which it operates.Unlike many other analytical techniques, there is no given set of attributes or factors that must beincluded. In practice, there are many factors that reappear continuously in CRA throughout the world,and its ability to transform a firm is a major strength. The technique may be scaled up or down incomplexity to allow it to be easily administered and managed by any type of strategic manager. Manysmall business planners might balk at the notion of using (and funding) complex analysis techniques orpaying for market research that could investigate various reputation factors. However, they mightengage in simpler versions of CRA.The simplicity of the concept also gives it a universal appeal. Very few other strategic competitiveanalysis techniques are as widely recognized within non-business institutions or the general public asCRA. This makes CRA a useful tool for reaching stakeholders outside an industry itself—forexample, shareholders.
Bottom Line
A firm that can effectively use CRA will see the results impact its bottom line. A great product is agood starting point for making a sale, but a firm's reputation is becoming increasingly important as itdirectly affects purchasing decisions. Consumers shop on more than just the product at hand. A firm'sreputation is increasingly directly affecting the purchase decision. Customers, usually one of the mostimportant of a firm's stakeholders, are crucial to the success of any firm and must be monitored andmanaged continuously. A firm that can consistently maintain a positive reputation with its customersreap positive financial rewards, not only by avoiding client attrition, but also with positive word-of-mouth publicity that can result in loyal customers.The perceptions of other stakeholders of a firm can also have major implications on the bottom line.A firm's financial reputation will affect investment in that firm. If returns are significant and welldistributed, more investors will be attracted, and the share price and the markets will look favorablyon the firm as well.Another important factor in relation to a firm's bottom line is whether or not the employees of thatcompany are working diligently and effectively in order to generate profits. CRA can be used to gaininsight into employees' perceptions of their employer. Employees who have a positive perception oftheir employer are more likely to work productively and to the best of their ability in an effort tomove the firm forward, whether in an administrative or sales-oriented role.
Competitive Differentiation
Depending on which factors or attributes are used for conducting CRA, a firm can use the results toeffectively plan strategies to differentiate itself from its competitors in the marketplace. CRA caneasily generate rankings on various attributes for any given set of firms. A firm requiring thisinformation could also use independent industry reputation analysis. Industry reputation analysisusually analyzes only a given set of firms on a given group of attributes. It could be the case that one

firm is viewed as very community minded, while its direct competitors might be viewed as beingmore environmentally friendly. Either image has its advantages and could be used as part of adetailed differentiation strategy.Using CRA for differentiation purposes involves the adoption of reputation management as a strategicfunction within the firm. The information generated by CRA can be used by a firm to analyze itsexisting strategies and create specific new strategies to maintain or develop a desired reputationposition. There is no right way to manage reputation, nor is there any specific reputation that isperfect for every firm.Healthy competitive differentiation could reach beyond the firms themselves and strengthen theindustry in a 1 + 1 = 3 type of growth pattern. The total industry-wide effect of all firms' activelymanaging their reputations may be greater than the sum of individual firm efforts alone.
Qualitative
Although CRA uses statistical methods to interpret data and sometimes includes financialperformance as an evaluation factor, the information given by CRA is frequently qualitative ratherthan quantitative, even when the Reputation Quotient is used. Where quantitative methods can provideinsightful ratios and numeric analysis, qualitative analysis can usually provide more practicalinformation in terms of future strategic planning so far as reputation is concerned.Firms in various industries all over the world actively communicate certain information to their keystakeholders. These messages may become distorted by unusual circumstances or events and end upbeing heard by their audience as something entirely different from what was originally intended. CRAtaps into the perceptual image formed by the final message recipient, giving the firm a clear grasp andunderstanding of its reputation.
Weaknesses and Limitations
Practical Uses
Simple CRA on its own, aside from enabling reputation management, provides little actionableinformation for the strategic analyst. The qualitative information so useful to reputation managementdoes not provide the hard figures needed for wider strategic planning. This limits the technique as faras its usefulness to strategic planning is concerned. Many other qualitative analysis techniques, suchas scenario analysis, issue analysis, and so on, can provide direct input into the strategic planningprocess. CRA, however, simply identifies a firm's image and can only provide analysis of currentperceptions from their key stakeholders.More complex versions of CRA can deliver a wide variety of reputation feedback based on a greatnumber evaluation factors. However, where a large quantity of the factors are utilized, the set ofresults may be far too large to clearly convey any actionable recommendations.

At the board level, where reputation management responsibility should reside, there are two majorweaknesses with CRA. The first one is that the board may be the last to receive early warning signalsabout factors affecting the firm's reputation. Second, the information they receive is filtered throughmanagers and/or external service providers. This then impacts the practicality of the CRA output forthe board.
Reliability of Results
Generally CRA begins with the use of focus groups to select the appropriate factors for analysis. Theinherent weakness in using focus groups is that the research analysis can never be replicated. Theresults of CRA must be taken for what they are—that is, a record of the perceptions of thestakeholders questioned at the particular time of the analysis.The second step of the CRA process frequently involves the use of private information to evaluate thefirm on the selected factors. This private information usually comes from internal research done byprivate institutions, for example through personal interviews, Internet or telephone surveys. Thesemethods not only provide information, which may be subject to privacy regulation by law, but theyare not necessarily verifiable information sources either.Because CRA results in information that cannot be verified or replicated, any changes in any givenfactor over repeated application of CRA cannot be proven to be significant. Statistically, the onlyway to show that a change is significant is to show that the research can be verified and repeated.
Return on Investment
After conducting CRA, executives within a firm must use the information obtained in some form oranother. Usually the public relations department of any given firm will be directly responsible for themanagement of a firm's reputation. Any action taken on the basis of information obtained by CRAmay, however, be limited by funding. Generally, then, it is difficult to guarantee specific returns fromspending funds on public relations activities.As a general rule, investing more equates to realizing more value; however, any public relationsexercise is subject to extraneous information interfering with its message, and so spending on publicrelations cannot guarantee positive results for corporate reputation.
Process for Applying the Technique
Unlike many forms of strategic competitive analytical techniques, CRA can be very simple or quitecomplex. Simple CRA can be done virtually by anyone interested in a firm's image among itsstakeholders. However, more complex forms of CRA—ones that evaluate an extended number offactors—require knowledge of and experience in descriptive research methods. Expertise is neededin all areas of the process, including data collection, coding, and interpretation. Mistakes in any onepart of the process may compromise the integrity of the entire exercise.

Because the method is so simple as a concept, there are many different processes that can be used toeffectively conduct CRA. These processes include the following:
Reputation QuotientFocused CRAMedia ranking and monitoringReputation management
A single firm looking to gain insight into its reputation may use one form, while the popular mediarankings, which rank several firms in various industries, use another. These media rankings requirethe CRA to be much more standardized because of its application over a wide selection of firms andthe need to communicate results to a wider audience.
Reputation Quotient
The Reputation Quotient was developed in 1999 to try to standardize CRA. The need for theReputation Quotient arose from the wide range of non-standard methods that existed prior to itsformation and the narrow bases used in some corporate reputation research. Marketing research firm,Harris Interactive, worked with Charles Fombrun to create a standardized process that wouldovercome the inherent biases of different rating systems in use at the time.The first step in developing the Reputation Quotient was to ask focus groups from a variety ofindustries to nominate the firms that they either had very positive or very negative perceptions of. Theresults were analyzed, and it was discovered that these selections were based mainly on 20 attributesfrom six given dimensions.These six core dimensions can be described as follows:
Emotional appeal—Evaluators tend to rate a given firm very well if they have gained some sortof emotional attachment with the firm. The results are based on how much the firm is liked,admired, and respected by each given stakeholder.Products and services—Better-regarded firms appear to earn reputation by offering betterquality and more innovative products and services. Their reputations may suffer when theyproduce controversial products (for example, tobacco, alcohol, nuclear energy, weapons, orunhealthy foods).Vision and leadership—Better-regarded firms are those demonstrating clear vision and strongleadership and are also expected to establish an organizational infrastructure that supports notonly equality of opportunity and diversity, but also one that stimulates improved ethicalbehavior.Workplace environment—Evaluators favor firms that offer greater job security, better relativepay and conditions, have good labor relations, employee stock ownership, and profit sharing.Employees demonstrate pride in their work and have regular and close contact with topmanagement.Social responsibility—Firms with a good reputation for their community involvement appear tomake more charitable contributions, are more philanthropic, encourage more employee volunteerprograms, and have greater local economic impact (tax revenues, jobs, and investments).
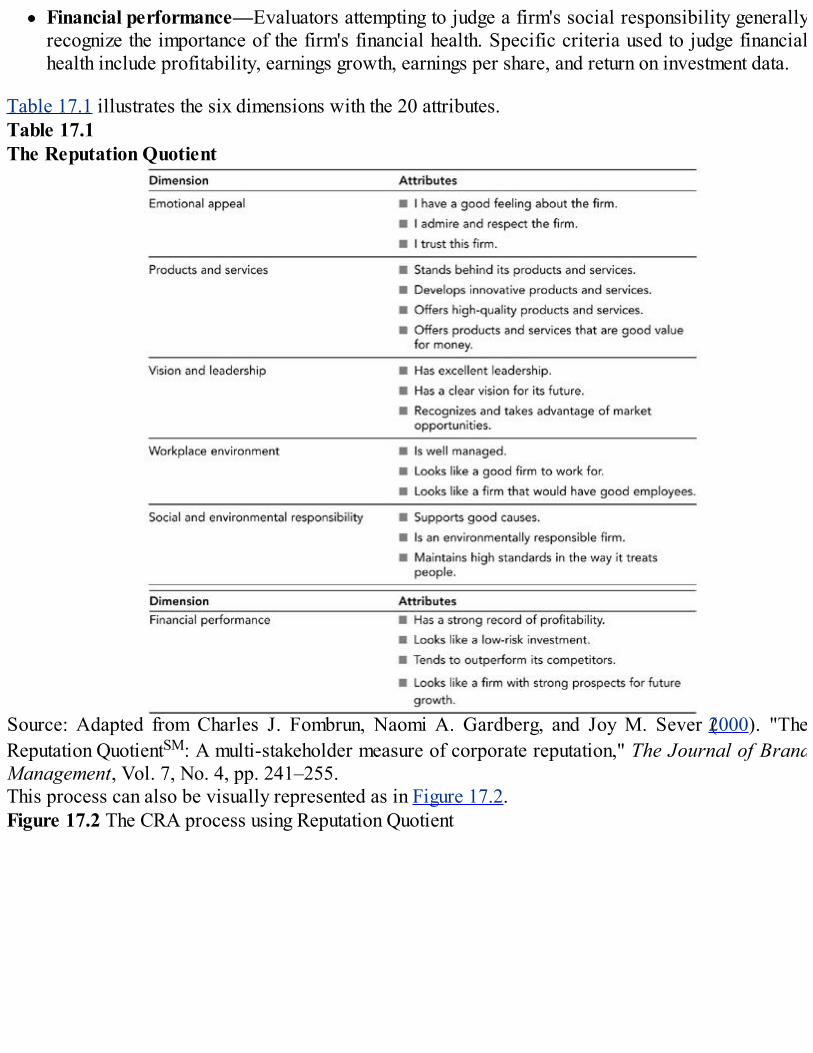
Financial performance—Evaluators attempting to judge a firm's social responsibility generallyrecognize the importance of the firm's financial health. Specific criteria used to judge financialhealth include profitability, earnings growth, earnings per share, and return on investment data.
Table 17.1 illustrates the six dimensions with the 20 attributes.Table 17.1The Reputation Quotient
Source: Adapted from Charles J. Fombrun, Naomi A. Gardberg, and Joy M. Sever (2000). "TheReputation QuotientSM: A multi-stakeholder measure of corporate reputation," The Journal of BrandManagement, Vol. 7, No. 4, pp. 241–255.This process can also be visually represented as in Figure 17.2.Figure 17.2 The CRA process using Reputation Quotient
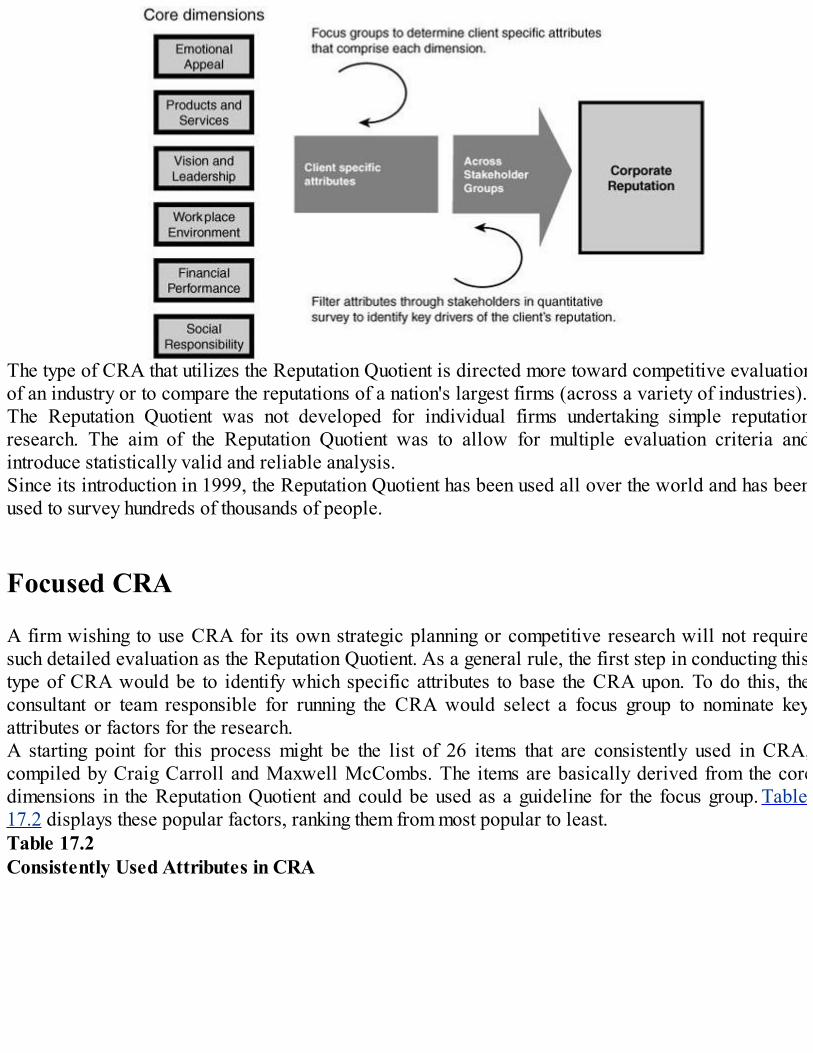
The type of CRA that utilizes the Reputation Quotient is directed more toward competitive evaluationof an industry or to compare the reputations of a nation's largest firms (across a variety of industries).The Reputation Quotient was not developed for individual firms undertaking simple reputationresearch. The aim of the Reputation Quotient was to allow for multiple evaluation criteria andintroduce statistically valid and reliable analysis.Since its introduction in 1999, the Reputation Quotient has been used all over the world and has beenused to survey hundreds of thousands of people.
Focused CRA
A firm wishing to use CRA for its own strategic planning or competitive research will not requiresuch detailed evaluation as the Reputation Quotient. As a general rule, the first step in conducting thistype of CRA would be to identify which specific attributes to base the CRA upon. To do this, theconsultant or team responsible for running the CRA would select a focus group to nominate keyattributes or factors for the research.A starting point for this process might be the list of 26 items that are consistently used in CRA,compiled by Craig Carroll and Maxwell McCombs. The items are basically derived from the coredimensions in the Reputation Quotient and could be used as a guideline for the focus group. Table17.2 displays these popular factors, ranking them from most popular to least.Table 17.2Consistently Used Attributes in CRA
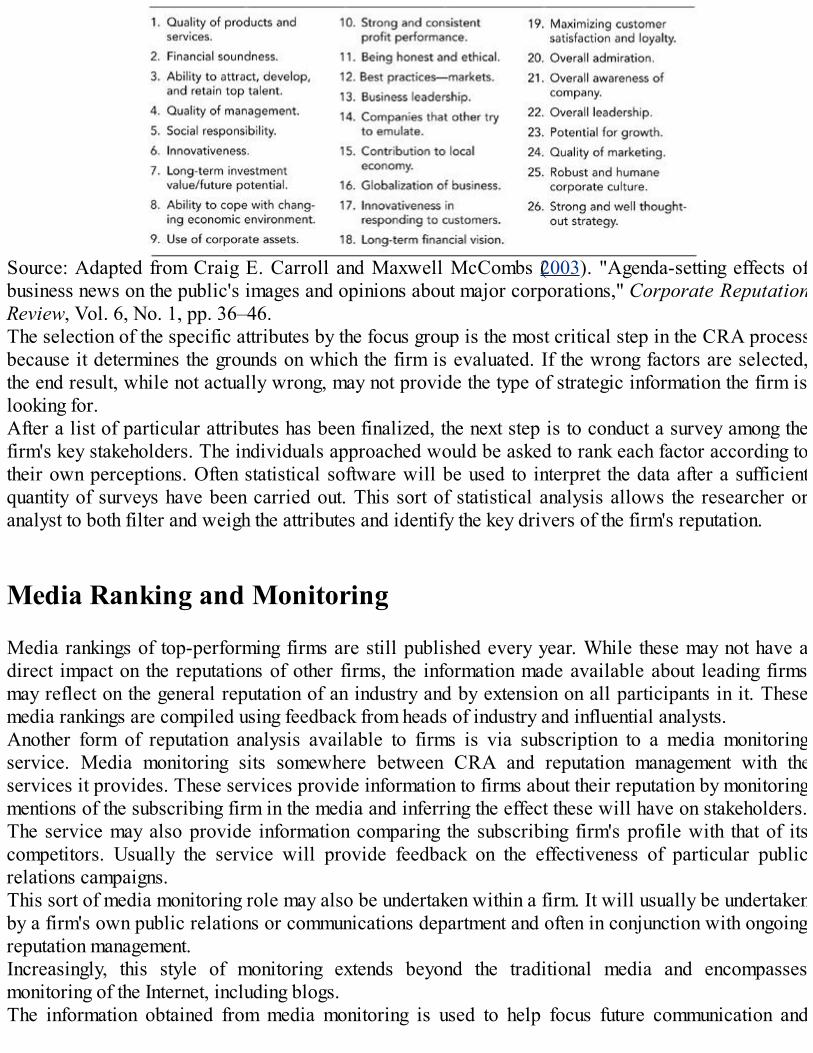
Source: Adapted from Craig E. Carroll and Maxwell McCombs (2003). "Agenda-setting effects ofbusiness news on the public's images and opinions about major corporations," Corporate ReputationReview, Vol. 6, No. 1, pp. 36–46.The selection of the specific attributes by the focus group is the most critical step in the CRA processbecause it determines the grounds on which the firm is evaluated. If the wrong factors are selected,the end result, while not actually wrong, may not provide the type of strategic information the firm islooking for.After a list of particular attributes has been finalized, the next step is to conduct a survey among thefirm's key stakeholders. The individuals approached would be asked to rank each factor according totheir own perceptions. Often statistical software will be used to interpret the data after a sufficientquantity of surveys have been carried out. This sort of statistical analysis allows the researcher oranalyst to both filter and weigh the attributes and identify the key drivers of the firm's reputation.
Media Ranking and Monitoring
Media rankings of top-performing firms are still published every year. While these may not have adirect impact on the reputations of other firms, the information made available about leading firmsmay reflect on the general reputation of an industry and by extension on all participants in it. Thesemedia rankings are compiled using feedback from heads of industry and influential analysts.Another form of reputation analysis available to firms is via subscription to a media monitoringservice. Media monitoring sits somewhere between CRA and reputation management with theservices it provides. These services provide information to firms about their reputation by monitoringmentions of the subscribing firm in the media and inferring the effect these will have on stakeholders.The service may also provide information comparing the subscribing firm's profile with that of itscompetitors. Usually the service will provide feedback on the effectiveness of particular publicrelations campaigns.This sort of media monitoring role may also be undertaken within a firm. It will usually be undertakenby a firm's own public relations or communications department and often in conjunction with ongoingreputation management.Increasingly, this style of monitoring extends beyond the traditional media and encompassesmonitoring of the Internet, including blogs.The information obtained from media monitoring is used to help focus future communication and

public relations strategies on areas requiring reputation improvement and/or on differentiationstrategies.
Reputation Management
Once reputation analysis has been carried out, the next step is to translate the findings into action bydeveloping a longer-term strategic management plan to maintain/improve corporate reputation basedupon the results. Ongoing reputation management is usually the responsibility of the company's publicrelations or communications department and will include both management and monitoring functions.Other strategic competitive analytical techniques may also contribute valuable information to thereputation management process.There are five principles that have arisen in the conduct of CRA, noted by Fombrun and Foss, whichmay be used as a guide to implementing effective reputation management. These guiding factors are asfollows:
1. 1. The principle of distinctiveness.This is also called differentiation. A firm that owns a distinctive position in the minds ofstakeholders will have a strong reputation.
2. 2. The principle of focus.A firm that concentrates its communication with stakeholders around one central theme will havea stronger reputation. The firm may choose to emphasize its national loyalty, its financialstrength, or perhaps its trustworthiness.
3. 3. The principle of consistency.A firm that is consistent in its actions and communications to all stakeholders will have a strongreputation. This means a holistic approach should be taken to the image of the firmcommunicated by each internal department to all different groups of stakeholders.
4. 4. The principle of identity.A firm that wants a strong reputation must ensure that it always acts in ways consistent with theidentity it communicates. Spin is anathema to reputation building, and in time all efforts tomanipulate external images that rely purely on advertising and public relations fail when they aredisconnected from the company's identity.
5. 5. The principle of transparency.A firm with a strong reputation tends to be visible across all media, communicating in ways thatshow they are transparent in the way they conduct their affairs. Transparency requires a lot ofcommunication, and firms must be willing to disclose more information about themselves and bemore willing to engage stakeholders in a dialog.
These five principles give scope for the management of a firm's reputation. While each of theprinciples relates to reputation, principle 1 contemplates traditional competitive positioning in themarketplace; principles 2 and 3 focus on the unity of a firm's communications; and principles 4 and 5look to ethics.The scale of the reputation management undertaken by a firm will depend on a variety of factors—forexample, how big is the firm and how many resources can be devoted to the reputation managementfunction? The internal complexity of the firm's organization will also have an impact on how
reputation management will work in practice. For example, where a large firm has separate publicrelations, marketing, sales, customer service, human resources, and purchasing departments, each ofthese will have a direct role in and impact on reputation management (see Principle 3).It should be noted that not only will internal staff be responsible for managing the corporatereputation of their employer firm, but that the firm also needs to be managing its reputation with itsinternal staff.In summary, reputation management is an ongoing process and includes
1. 1. Measuring the reputation of the firm across key stakeholder groups2. 2. Prioritizing the reputation risks and developing protocols to handle these risks3. 3. Equipping and empowering line managers to deal with these risks4. Creating ways to listen and communicate with stakeholders on an ongoing basis
Case Study
In 1995, Royal Dutch/Shell found its reputation in tatters after two publicity disasters.Shell had planned to get rid of the Brent Spar, a disused oil storage platform, by sinking it in theNorth Sea. In 1995, Greenpeace protested the decision. Shell found itself the center of worldwideprotests and boycotts, which cost the firm millions.Also in 1995, nine environmentalists were hanged by the government of Nigeria because they hadspoken out against the government and Shell for the exploitation of the Ogoni people in the NigerDelta as a result of oil extraction there. Initially Shell publicly refused to intervene for clemency onbehalf of the environmentalists. It eventually did make an appeal to the government, but this wasineffective. Again Shell was the subject of costly international product boycotts.The affects of these disasters not only cost the firm money, but also reputation.In 1996, Shell started a process of consultation involving 7500 members of the public in 10 countriesand 1300 opinion leaders in 25 countries. The review was to explore two issues:
Shell wanted a better understanding of what the public expects from transnational companies(like itself).Shell wanted to understand what people thought of them. What was the standing and reputation ofthe firm?
The focus groups showed that a small but significant group of people thought that Shell was "wantingin its care for the environment and human rights . . . We had looked in the mirror and we neitherrecognized nor liked what we saw," Shell concluded in its 1998 report from the review: Profits orprinciples—does there have to be a choice?As a result of the review, Shell took several steps to improve its reputation.Shell redefined its corporate mission, strengthened management and reporting to prioritize socialperformance. Another strategy was to improve its communications with the public. Shellacknowledged it had misjudged public sentiment in the past and sought to avoid repeating itsmistakes.In 1997, Shell initiated a 12-member Social Accountability Committee, which put together a human
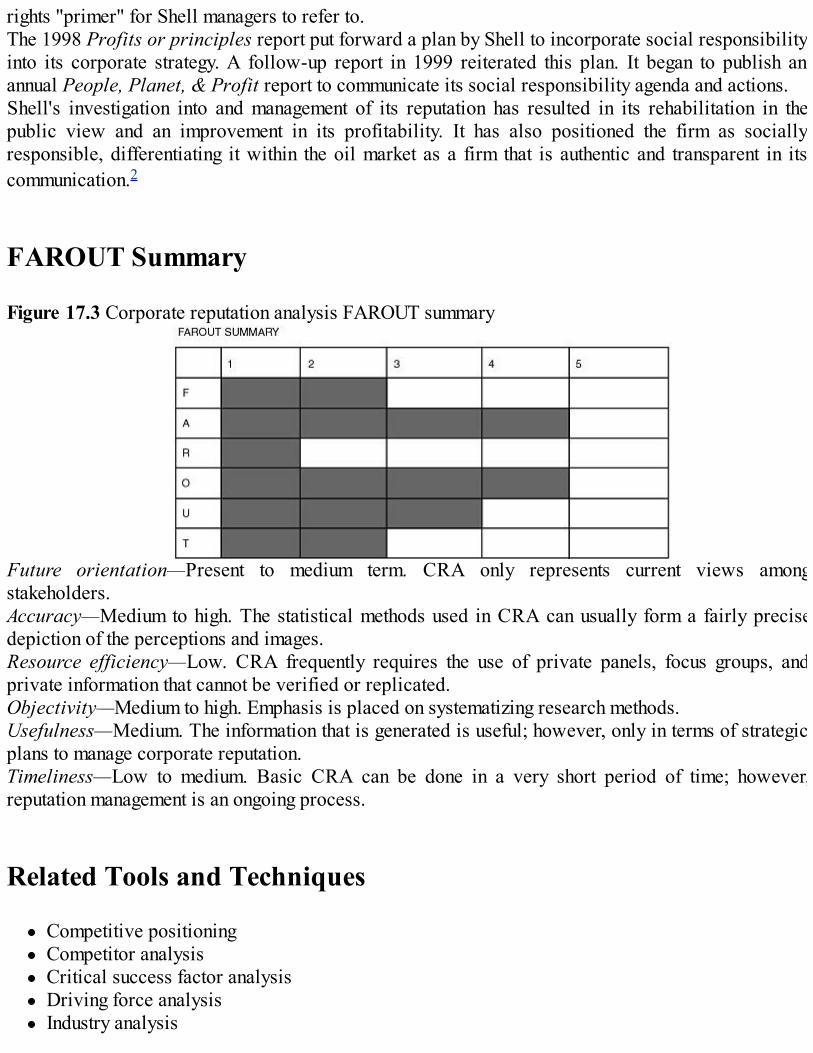
rights "primer" for Shell managers to refer to.The 1998 Profits or principles report put forward a plan by Shell to incorporate social responsibilityinto its corporate strategy. A follow-up report in 1999 reiterated this plan. It began to publish anannual People, Planet, & Profit report to communicate its social responsibility agenda and actions.Shell's investigation into and management of its reputation has resulted in its rehabilitation in thepublic view and an improvement in its profitability. It has also positioned the firm as sociallyresponsible, differentiating it within the oil market as a firm that is authentic and transparent in itscommunication.2
FAROUT Summary
Figure 17.3 Corporate reputation analysis FAROUT summary
Future orientation—Present to medium term. CRA only represents current views amongstakeholders.Accuracy—Medium to high. The statistical methods used in CRA can usually form a fairly precisedepiction of the perceptions and images.Resource efficiency—Low. CRA frequently requires the use of private panels, focus groups, andprivate information that cannot be verified or replicated.Objectivity—Medium to high. Emphasis is placed on systematizing research methods.Usefulness—Medium. The information that is generated is useful; however, only in terms of strategicplans to manage corporate reputation.Timeliness—Low to medium. Basic CRA can be done in a very short period of time; however,reputation management is an ongoing process.
Related Tools and Techniques
Competitive positioningCompetitor analysisCritical success factor analysisDriving force analysisIndustry analysis
Issue analysisSERVO analysisStakeholder analysisSWOT analysis
References
Carroll, C.E., and M. McCombs (2003). "Agenda-setting effects of business news on the public'simages and opinions about major corporations," Corporate Reputation Review, Vol. 6, No. 1, pp.36–46.Coupland, C. and A.D. Brown (2004). "Constructing organizational identities on the Web: A casestudy of Royal Dutch/Shell," Journal of Management Studies 41(8), pp. 1325-1347Dowling, G. (2006). "Corporate reputation risk," Company Director, April, Vol. 22, No. 3, pp. 42–43.Fombrun, C.J., and C.B. Foss (2001). "The Reputation Quotient," The Gauge, Vol. 14, No. 3.Fombrun, C.J., Gardberg, N.A., and J.M. Sever (2000). "The Reputation QuotientSM: A multi-stakeholder measure of corporate reputation," The Journal of Brand Management, Vol. 7, No. 4, pp.241–255.Henderson, T. and J. Williams (2002). "Shell: Managing a corporate reputation globally," in PublicRelations Cases: International Perspective, eds. D. Moss and B. DeSanto, London, UK: Routledge,pp. 10-26Skinner, P. (2003). "Shell's bid to rebuild its reputation: Group Director Paul Skinner discusses theneed for trust," Strategic Direction, 19(7), pp. 9-11.Yearly, S. and J. Forrester (2000). "Shell: A sure target for global environmental campaigning?", inR. Cohen & S. Rai (eds), Global Social Movements, London, UK: The Athlone Press.www.reputationinstitute.comwww.fni.no/pdf/FNI-R0103.pdf
Endnotes
1 Dowling, 2006.2 Sources used for case study: Coupland & Brown, 2004; Henderson & Wlliams, 2002; Skinner,2003; Yearly & Forrester, 2000.
18Critical Success Factors Analysis
Short Description
Identifying critical success factors (CSFs) is a valuable and necessary part of strategy development."Critical success factors are the few things that must go well to ensure success for a manager or anorganization and, therefore, they represent those managerial or firm areas that must be given specialand continual attention to bring about high performance."1 The CSF concept emphasizes theimportance of ongoing industry monitoring. The CSF method helps the analyst to identify the keyfactors that have to be performed well in order to achieve a superior level of competitiveperformance in an industry.
Background
Although the CSF concept apparently stems from military psychologist John Flannagan's "CriticalIncident Technique," its use in business was likely introduced by McKinsey consultant J. RonaldDaniel in his article, "Management Information Crisis," published in the Harvard Business Review inthe fall of 1961.2 Daniel noticed the problem of managers who were over burdened with information,with much of it distracting their attention and focus away from the most important factors affecting thefirm's competitive success in the marketplace. Daniel discussed the importance of senior managers tohave correct and useful information for competitive success. In particular, Daniel noted it was usuallythree to six factors that distinguished successful competitors in an industry from their less-successfulpeers.The use of CSFs evolved in conjunction with the rapid growth in business planning efforts by firms inthe late 1960s. The concept was further defined in the late 1970s and early to mid-1980s. Theapplication of the CSF concept was boosted by John F. Rockart, who showed how the method couldbe used as a tool for senior executives to identify where their priorities should lie and developmeasures to test how well the organization was performing. Although primarily looking at theapplication in the context of information technology (IT) decision-making, Rockart defined CSFs as"the limited number of areas in which satisfactory results will ensure successful competitiveperformance for the individual, department, or organization."3 His recommended technique involveda multi-stage interview process as a means for discovering the factors, followed by a performancemonitoring process matched to the uncovered CSFs.The technique was later refined by both Christine Bullen and John Rockart as an aid in developingcomputer information systems that would effectively focus and measure work effort. By the mid-1980s, Anthony Boynton and Robert Zmud gained notoriety for applying the technique primarily in theMIS planning context. Through the 1980s, the technique was expanded to the strategic planning area,focusing on key areas to achieve performance goals. Because of these developments, it essentially

became a framework for senior managers and stakeholders to monitor their strategy processes andresults.4Some key writers5 outline methods for identifying differing levels of CSFs. Because this book focuseson strategy and competition of firms in the marketplace and in providing analysis that benefits thedecision makers, this chapter focuses exclusively on industry-level CSFs that best explaincompetitive success at this level, and not at the application on the micro-level for examining thefunctional, product/service and unit-level, or project-focused techniques as an example.Analysis by human nature tends to favor the known and the familiar. For those analysts who areunfamiliar with the CSF concept, we have seen a tendency for them to project firm-level CSFs ontothose of the industry. If the focal firm is the industry leader or exists in a monopolistic context, theremay be some validity in doing this, but if the firm is in any other position, the efficacy of extrapolatingthis analysis in this fashion is lessened. The extrapolation of firm-level CSFs to the industry can bemisleading and is likely to be more problematic than first identifying the industry level CSFs andassessing how the firm, its strategy, and its performance compares against them.The process of developing CSFs at the industry level will assist executives in understanding howtheir organization matches up against these factors. The typically inclusive process of determiningCSFs enables managers from different areas and levels to partake in crafting the strategic direction ofthe company; consequently, they will have a greater ownership in the developed strategy. Allowingthe company as a whole to understand and embrace the strategy presented by sharing in the agreementof the CSFs will enable the company to direct its efforts at succeeding in the key areas of the businessthat matter the most.A benefit of identifying CSFs is to be able to view one's business in a larger industry context and tobe able to assess your own firm's strengths and weaknesses in relation to the industry's CSFs. Thiscomparison will not be properly done if you compare your firm and its CSFs against itself. We wouldagree that it is important to be aware of what a firm is doing well within its own purview, but thatdetermination is better defined by specific internal analysis techniques, such as McKinsey's 7SFramework (see Chapter 12, "McKinsey 7S Analysis"), SERVO analysis (see Chapter 9, "SERVOAnalysis"), or functional capabilities and resources analysis.6 Last, the concept, as we discuss it atthe industry level, can be readily adapted for use in more micro-level applications, like requirementanalysis and project management. Indeed, the original evolution of the concept as previouslydescribed occurred in just this fashion.
Strategic Rationale and Implications
Most competitive enterprise and strategic business analysts clearly recognize the growing gap createdby the volume of information being generated for managers in typical firms and the level to whichthey can make efficient use of that information. This information explosion has, to at least somedegree, adversely influenced the rate at which companies make decisions, modify strategies, takeactions, and react to market forces and key players. Contemporary decision makers need mechanismsto aid strategic planning that are concentrated on those areas that are the most crucial to their firm'ssuccess. The CSF methodology described in this chapter helps identify what those factors are andwhich of those among a much larger set of potentially viable competitive factors are most important.Figure 18.1 represents the cyclical and ongoing nature of CSF identification and monitoring as they

are used in the strategy function of a typical enterprise.Figure 18.1 CSF identification and monitoring
By presenting CSFs to the decision makers, analysts can facilitate their understanding of therationales for adopting particular competitive strategies. An organization-wide understanding of thecompetitive environment will help direct effort toward areas that are necessary for success in thislimited number of critical areas. It is important for managers to communicate to their employees howthe firm's strategy matches up against the industry's CSFs. The more employees understand about this,the less arbitrary will be the resulting expectations, goals, and urgency of senior managers in helpingemployees attain certain performance levels in the firm's most critical activity areas or processes.It follows then, that the top-level strategies and executives' priorities will trickle down to theoperational and tactical levels. It seems obvious, but has not always worked out that way in real-world business practice. For example, Robert Cooper outlines that the product development processstill showed strains despite the fact that the CSF method had been regularly used in many firms. Hesuggested that this outcome was caused either by many businesses simply not being in tune with theircustomers or that they did not adopt cogent understandings of the industry's critical success factors.One means for better employing the CSF method concept is to break it down into those process areasthat help define competitive behavior in an industry. For example, CSFs can be broken down into thefollowing segments:7
Technology related—CSFs in this area can include expertise in particular research ordevelopmental processes, innovative production processes, access to potential partners withbasic and applied scientific research expertise, and/or use of alliances or partnerships withuniversities or research consortia. Industries that tend to demonstrate the presence of these CSFswould include, for example, pharmaceuticals, advanced materials, chemical manufacturing,semi-conductor and electronic component manufacturing, and aerospace product and partsmanufacturing.Manufacturing related—Expertise in quality management systems, Six Sigma processes,access to low-cost production inputs, high levels of employee productivity, low-cost or fast-cycle design and engineering, and so on. Industries that would tend to demonstrate the presenceof these CSFs would be electrical equipment manufacturing, motor vehicle manufacturing,instruments manufacturing, and so on.Distribution related—This would include how products are moved from the manufacturer to the
end-user, providing local inventory, technical product support, and sales and service. As such,CSFs may be found in supply chain management expertise, well known dealer networks orwholesale distributors with the ability to secure shelf space at the retail level and with stronginternal sales capabilities. Industries that would tend to demonstrate the presence of these CSFswould be those in which distribution activities account for a higher than average proportion oftotal costs, those involved in most vertical markets, and other aspects of distribution includingbut not limited to operations, accounting, sales and marketing, purchasing, inventory, and profitmanagement.Marketing related—These would be related to any of the "4 Ps" of marketing (price,promotion, place, or product). As such, marketing related CSFs could include respected brandnames, well received products/services, breadth or depth of product/service line,product/service consistency, penetrating marketing research and an understanding of consumerbehavior, effective product/service assistance, valuable guarantees and warrantees. Massmarket, customer-oriented industries, such as those specialized retailing, consumer products,and/or entertainment and media tend to be ones in which these CSFs are most commonly found.Skills and capability related—Historical advantages, such as location or large scale contracts,short production or delivery cycle times, effective supply chain management capabilities,uniquely skilled or experienced employees, and strong e-commerce capabilities, adaptivecorporate cultures, and flexible structures.Other CSF types—Locational convenience, historical monopoly protection in particularregions, having patent protections, or strong balance sheets.
CSFs vary from industry to industry, as well as over time. By considering the example of a number ofindustries, it is easy to see how certain processes can be most significantly related to competitivesuccess. This is demonstrated by Table 18.1.Table 18.1Key Processes That May Constitute CSFs in Particular Industries

For example, Table 18.2 offers a summary of CSFs for the banking industry in the wake ofgovernment de-regulation in Taiwan.8 We have added the CSF area from the preceding list that eachfactor would fit in to.Table 18.2CSFs and CSF Areas for the Banking Industry in Taiwan
Source: Adapted from Chen, T. (1999). "Critical success factors for various strategies in the bankingindustry," International Journal of Bank Marketing, 17(2), pp. 83–91.

Note that the first three CSFs in Table 18.2 are "controllable" by the participants in the bankingindustry, but the fourth CSF, "Ability of financial market management," is an item that tends to defyany particular firm's influence, which is not unusual in cases involving government policies and theaggregate performance of a stock market. Our own view of CSFs would suggest that the fourth factormay not be a CSF at all since it is not a variable that management can influence through its decisions.Correctly identifying CFSs in those areas of industry competition can provide a competitiveadvantage or be a distinctive competency for a firm9 and, therefore, should be of keen interest toanalysts. The idea behind this is that a firm is likely to be successful if it is competitively better thanits competitors in one or more industry-level CSFs. If it is better than its rivals in all the CSFs, it hasa powerful competitive advantage and should earn higher levels of profitability than its rivals. Thekey facets that the analyst needs to identify are the sources of those advantages that align so well withthe industry's CSFs.The top-down nature of the CSF methodology provides a mechanism to direct the entire organizationtoward common goals and understand what the firm's priorities are. It is also important to align CSFswith key individuals in the organization who will have responsibility in areas determined as mostimportant to achieving CSFs. Consistency and synergies are easier to achieve when upper- andlower-level managers alike understand the firm's priorities and are measured on the correspondingcriteria. As such, the firm's information and measurement system should naturally support these CSFsas well.An important component of CSFs that must be emphasized is that they are dynamic. Because of thechanging nature of the environmental context, customer, and competition impacting a marketplace, akey factor needed for industry success in the past or the present may not be as important in the future.Constant monitoring and revision are necessary to be able to identify future CSFs and develop astrategy for building long-term competitive advantage. It is essential that analysts always be on thelookout for emerging and changing CSFs. This is particularly important for markets experiencing highgrowth.10
For example, as product-based industries move along the life cycle, they will often move fromstressing "product technology" to "process technology." One thing this suggests that as "fastfollowers" enter a market and competition substantially increases, cost control becomes increasinglyimportant, regardless of whether or not the firm is a low-cost provider. Another change is in the trendtoward shareholder activism and increasing attention to governance matters. CSFs may be usedincreasingly in the future by financial analysts or investors assessing a firm's performance in theirgiven industry.Identification of CSFs is important both for big corporations competing for global domination andsmall businesses. Dickinson et al, makes the point that some characteristics of small businesses arescarce resources and tight cash flows, and knowing where to direct those resources can be critical tosurvival.11 Also note that this concept has wide application in government agencies and organizationsand is often linked to the establishment of their key performance indicators.12
Strengths and Advantages
There are a number of strengths of the CSF method that account for its acceptance and popularity. Aspreviously discussed, senior managers are plagued by too much information. The CSF methodology is
appealing to both analysts and decision makers because it forces them to identify which information isimportant and where to focus their planning efforts. The concept is quite easy for decision-makingcustomers to grasp and is viewed as being relatively more trustworthy than other more complexindustry level focused concepts.Because the CSF method helps focus attention on a small number of key factors that can best leverageaction in a marketplace, it helps managers to prioritize their investment and resources allocationdecisions. As such, the process is likely to lead to a better return on investment in analysis, andinformation gathering and collection activities, and a better level of success in generating positivereturns on investments supported by the keener understanding of the CSFs themselves.Another primary appeal of the concept is the top-down structure and the focus it provides to seniormanagers.13 Because being better than competitors in one or more CSFs can be the difference inachieving competitive success, they should always be incorporated into sound strategic decisionmaking. The method provides analysts or the firm's decision makers the focal context from which torecommend/design strategies and direct resources toward a common goal or set of goals. The methodalso stresses and encourages continuous monitoring of the organization's pursuit of these goals. Thisis a key reason why the method is intuitively understood and generally accepted by senior managers.Another strength is that the process exposes the critical bits of information the analysts and decisionmakers need in order to direct strategic activity. As such, information systems can then be developedthat will monitor proficiency in the areas identified as CSFs, rendering the use of these systems moreaccurate and comprehensive. This can lead to more tightly aligned information systems strategyprocesses, which should benefit all levels of decision making.
Weaknesses and Limitations
At a philosophical level, the CSF concept in strategy formulation has been criticized by somestrategists. Pankaj Ghemawat has said that ". . . the whole idea of identifying a success factor andchasing it seems to have something in common with the ill-considered medieval hunt for thephilosopher's stone, a substance that would transmute everything it touched into gold."14 The biggestweakness here is that either the CSFs will be so obvious that they will not necessarily provide anyinformational advantage to the firm or that they will be so elusive that they will defy any decisionmaking or action being taken to exploit them in the marketplace.The CSF concept has a limitation at a tactical level as well. CSFs must be developed by individualswho have unique and specific training in this area. The level of the analyst's knowledge, skills,industry experience, and prior applications of the technique will likely influence the quality of theirCSF understandings. Some of the concept's biggest advocates note that it is difficult for the layman touse, thereby rendering it inappropriate for firms that do not have access to qualified analysts. Also theability to think creatively in the identification and development of CSFs may be a limitation for someanalysts.There is also the problem of staying focused at a particular level of analysis. Identification of brand,product/service, functional, firm, or firm-specific CSFs are often confused with industry-level CSFs,which we know are not necessarily the same and are amenable to added layers of analyticcomplexity. The broader outlook of identifying CSFs for an entire industry is a harder view toconceptualize for those not adept at using the techniques.
Even in the event of an experienced analyst using the technique, it has also been criticized forpotentially being subjective. By definition, this is an inherent risk in any process that requires thecommunication and interpretation of outside information. Where interview processes are used touncover CSFs, this weakness can be minimized by having skilled interviewers who can isolate andcircumvent prevalent informational biases.
Process for Applying the Technique
There is a basic two-step process for performing the CSF methodology.
First, the analyst must creatively, comprehensively, and accurately identify the set of CSFs in theindustry, emphasizing the generation of proactive and forward-looking CSFs created by drivingforces in the industry.15 Some studies have identified as many as 25 CSFs, but typically thenumber that will be identified will be somewhere between three and eight, with five being themost frequently occurring number in our experience and a general rule of thumb we suggestinitially.Once the CSFs are identified, it helps to determine which two or three of the larger set are themost important.16 Remember that the whole purpose of identifying CSFs is to help focus theallocation of the firm's resources and to direct its strategy efforts, so it is important to choose theones that are as close as possible to the center, not periphery, of success in the industry.
There are varying depths to which one can go to identify CSFs. One helpful starting point is outlinedby Thompson, Gamble, and Strickland. They suggest that the analyst proceeds by asking a series ofthree questions, as follows:
On what basis (attributes, characteristics) do buyers of the industry's product or service choosebetween sellers' competing brands?Given the nature of competitive forces and rivalry, what capabilities and resources does a firmrequire in order to be a competitive success?What limitations or shortcomings among product/service attributes, competencies, capabilities,or historical market achievements are almost certain to put a firm at a significant competitivedisadvantage?
An effective viewpoint for the analyst is to examine the industry from the customer's, rather than thecompetitor's, stance. Using market research and customer-derived data, the analyst tries to answer thefollowing:
Why does the industry exist?For what purpose and to serve whom?What do those customers desire/demand?What don't customers know they want/need?
Leidecker and Bruno suggest a variety of different methods for identifying CSFs. They note thatindividually, they may not be sufficient to identify a CSF, but by combining two or more methods, the

risk is lowered that the analyst will miss a CSF or the relative importance of one. A triangulatedapproach may verify the authenticity of the CSF because several different applications support itsexistence and priority.Leidecker and Bruno outline eight CSF identification techniques that span three levels of analysis.Those three levels are as follows:
1. 1. Environment or socio-political2. 2. Industry3. 3. The firm-level
In the "Background" section of this chapter, we presented our reasons for focusing exclusively on theindustry level of CSF identification. As industry level analysis ordinarily follows from analysis of theenvironment, a look at environmental identification techniques will commonly act as a prerequisitefor industry analysis. Figure 18.2 is our adaptation of Leidecker and Bruno's identification techniquesand subsequent explanation of their eight techniques. It is useful to recognize that five techniques areoriented from macro to more micro levels of analytics for identifying CSFs at the industry level.Figure 18.2 Popular industry level CSF identification techniquesSource: Adapted from "Identifying and Using Critical Success Factors," by Joel. K. Leidecker andAlbert V. Bruno, 1984, pp. 25–29.
We will take a brief look at each of the five identification techniques and examine some of thestrengths and weaknesses associated with them.17 It is important to reiterate that any of these steps ontheir own is not sufficient to identify a CSF—at least two or more need to be used.
Leidecker and Bruno's Identification Techniques
Socio-Political/Environmental Analysis

This technique is often called PEST or STEEP analysis.18 In the context of understanding itsrelationship to identifying CSF, we'll stress again that doing a PEST/STEEP analysis is ordinarily aprerequisite to understanding the industry, as it forces the analyst to thoroughly examine theenvironment within which the industry operates. Industries that are heavily regulated or whosesurvival depends on forces over which it has little or no control will be particularly affected byenvironmental factors. Some of these include inflation, exchange rates, government regulation, or de-regulation and politics. Some sources for macro-environmental forces identification includeenvironmental scanning, econometric modeling, census and other government statistical information,and independent consultants who specialize in providing this sort of information, among others. Theadvantage to this outlook is that it is broad and can provide a comprehensive understanding of theindustry's context. The disadvantage is that it is not usually sufficient to identify more micro-levelindustry CSFs. Looking at environment and socio-political factors merely presents a starting point.Environmental analysis will reveal forces affecting all companies in a particular industry, but it doesnot distinguish between how individual companies deal with these forces through their uniquestrategies, nor does it focus on the performance aspects of these firm's competitive efforts.
Porter's Five Forces Model
Porter's Five Forces model19 is widely known as a tool for performing industry structure analysis.Viewed together, all five forces provide an excellent lens through which to consider the intensity ofindustry competition, as well as the pressures being applied to industry participants by buyers,suppliers, new entrants, and substitutes. Being able to understand how the five forces relate to oneanother is another asset of this framework, and gives the analyst a tool to gauge the potential forgrowth and profitability in the industry. Porter's Five Forces model is best used by analysts at severalpoints in time (for example, 2004, 2006, and 2008) in order to facilitate the detection of movementand trends in an industry's attractiveness and its profitability profile.The key to using Porter's Five Forces model and related industry analysis for CSF identification is totarget those forces and underlying factors that are creating the greatest pressures on industryprofitability. Once they are identified, it will enable the analyst to identify those product/servicecharacteristics, competencies, resources, or processes that can most significantly lessen the impact ofthese pressures. It is within these areas that CSFs usually can be identified.
Industry/Business Experts
The analyst needs to compile the views, experiences, and insights of individuals or experts with in-depth knowledge of the industry. Some good places to locate industry experts include industry, tradeor professional organizations, consultants to the industry, financial analysts, and industry veterans.They are often a good sounding board to either verify CSFs or play the "devil's advocate" role to thetraditional wisdom or beliefs about competition in the industry. Industry experts can also exposenuances of an industry that only experience can provide. The obvious weakness of this technique,apart from the fact that it may cost the firm more in funds or time to acquire the expert's advice, is thatit is more subjective than other methods, depending on the unique positioning and analytical prisms

applied by the experts themselves; therefore, on its own application, using experts is precarious as ameans to identify CSFs. Having said that, the method can be helpful when used in conjunction withmore objective techniques, including some of the others described in this section (for example,Porter's Five Forces and competitive analysis).
Analyze Competition
Analyzing competition focuses solely on the "how firms compete" facet of industry dynamics. Usingcompetition as an identifier of CSFs isolates it from the other four of Porter's industry structurecomponents (that is, bargaining power of buyers, bargaining power of suppliers, threat of newentrants, and threat of substitutes). Some sources to understanding industry competition are industryconsultants and line or department managers. Some tools we discuss that aid the analyst in performingcompetition analysis are weighted competitive strength assessment charts and strategic group maps.20
An advantage to taking a detailed look at the competitive nature of an industry is that it stresses theimportance of competition in it, rather than diffusing its influence among other forces. The ability toquickly focus in on players in an industry and identify their relative positions and strengths isfrequently beneficial. However, this technique can cause analysts to be myopic if it is not used inconjunction with other methods, primarily because it doesn't take any of the other forces, whethercompetitive or driving ones, into consideration. It also leaves out the possibility that CSFs havechanged at the margins of an industry in which disruption is occurring, changing the scope andboundaries of the industry itself.
Industry Leader Analysis
By definition, dominant firms in an industry are likely to be skillful in at least one industry CSF andpossibly more. Identifying why and where they succeed and how they achieve these superiorperformance levels can be a useful gauge to assess one's own firm's strengths and weaknesses—thisis a form of reverse CSF analysis.This technique is the narrowest of those we present and is by no means sufficient to use on its own. Itmay suggest a causal relationship that is overly simplified or invalid and prevent the discovery ofCSFs not related to a particular firm. It can also be complex because many firms are parts of largerorganizations (for example, corporate ones), and trying to isolate a particular set of CSFs attached toa firm in a particular industry may mean disaggregating a large number of other factors that maycontribute to the existence of the industry-level CSF. Although some studies have attempted to link thesuccess of one generic strategy (for example, low cost, differentiation, niche focus) and industryCSFs, it is commonly recognized that there is room for more than one successful generic strategy in anindustry, and attempting to relate dominant firm success factors with CSFs can be fallacious in somecircumstances.Table 18.3 summarizes the five techniques discussed previously and highlights some of the strengthsand weaknesses associated with each technique.Table 18.3Summary of Identification Technique Advantages and Disadvantages

Source: Adapted from "Identifying and Using Critical Success Factors" by Joel. K. Leidecker andAlbert V. Bruno, 1984, p. 26.
Determining Critical Success Factor Importance
Once CSFs have been identified and narrowed down to a handful of factors (for example, betweenthree to eight factors), the next step is to identify which, relatively, are the most important ones. Thereare three characteristics that will help identify which sample of CSFs of a larger population are themost crucial. The three criteria outlined by Leidecker and Bruno are helpful in this regard. Theystress that profit impact analysis is a key to identifying relative factor importance. They go on to notethat the three characteristics to consider when determining the relative importance of potential CSFcandidates include the following:
Major Business Activity
Typically, a CSF exists in an area or activity that is central to the business and its success, rather thanbeing peripheral. For example, in the auto parts or steel production industries, manufacturing andoperations are central business activities and will frequently have a CSF associated with it, but CSFswill generally not be associated with marketing processes or capabilities. For luxury hotels orprestige brands industries, on the other hand, marketing resources and capabilities probably are agood place to look for a CSF.
Involvement of Heavy Monetary Resources

An important CSF will probably have a substantial amount of financial resources attached to it. Forexample, inventory is a major cost for most retailers. It stands to reason that the ability of a retailer toquickly and efficiently acquire popular goods at a reasonable cost might be a CSF, as it shouldimprove profit margins. Major air carriers or airlines, because of the high fixed-cost nature of thebusiness, will have a CSF around their load factors (that is, an indicator that measures the percentageof available seating capacity that is filled with passengers—the higher, the better).
Major Profit Impact
This speaks to the sensitivity of certain business activities to related forces. CSF-related activitiestend to be particularly sensitive to major change. For example, a change in the price of raw materialswill have a major profit impact in a manufacturing-based industry like housing construction, whereasa significant change in the price of advertising services will not be likely to have a significant impacton a housing developer's profit.
Summary
The purpose of this chapter was to demonstrate the value and use of CSF analysis in strategydevelopment and decision making. CSFs remain a popular and easily communicated method by whichanalysts and decision makers can work with others in the firm on focusing attention on a limited set offactors that can help achieve success. Properly performed, CSF analysis can assist decision-makingclients in allocating resources to those places that require their greatest attention.
FAROUT Summary
Figure 18.3 Critical success factors analysis FAROUT summary
Future orientation—Medium. The emphasis on continued monitoring and strategic planning infer afuture orientation, but CSF analysis is often done in a static manner in actual practice.Accuracy—Medium to high. Used correctly, with more than one supporting/complementary techniquebeing applied, a skilled analyst as the executor, the potential for accuracy improves, but a subjective

element will remain.Resource efficiency—Medium. This depends on the form of data gathered and the manner in which itis collected. If experts are used, the interview process can be time consuming. If the industry isheavily populated by privately owned firms, performance metrics may not be easily accessible.Objectivity—Low to medium. The degree of objectivity will depend on which discovery methodshave been used. If an analyst has relied primarily on secondary sources or non-proprietary expertise,the objectivity will be lower.Usefulness—High. The notion of a critical success factor links performance measurement andstrategic planning with an emphasis on directing resources to the most important areas of theorganization. The holistic and structured nature of the concept is highly organized and usable.Timeliness—Medium. The initial process of identifying and determining the importance of criticalsuccess factors can be time-consuming, but once they are identified, they are quick and easy to useunless the industry environment undergoes a drastic change.
Related Tools and Techniques
Balanced scorecardBenchmarkingCluster analysisFunctional capability and resource analysisPorter's Five Forces analysisProduct line analysisStrategic group mappingWeighted competitive strength analysis
References
Aaker, D.A. (2001). Strategic Market Management. Hoboken, NJ: John Wiley and Sons, Inc.Anthony, R.N., Dearden, J., and R.F. Vancil (1972). Management Control Systems, Text Cases, andReadings. Homewood, IL: Richard D. Irwin, Inc.Boynton, A.C., and R.W. Zmud (1984). "An assessment of critical success factors," SloanManagement Review, 26(4), Summer, pp. 17–27.Bullen, C., and J.F. Rockart (1981). A Primer on Critical Success Factors. Boston, MA: SloanSchool of Management, Massachusetts Institute of Technology.Byers, C.R., and D. Blume (1994). "Tying critical success factors to systems development,"Information & Management, 26(1), pp. 51–61.Chen, T. (1999). "Critical success factors for various strategies in the banking industry,"International Journal of Bank Marketing, 17(2), pp. 83–91.Cooper, R.G. (1999). "From experience: The invisible success factors in product innovation,"Journal of Product Innovation and Management, 16, pp. 115–133.Daniel, D.R. (1961). "Management information crisis," Harvard Business Review, 39(5),

September–October, p. 111.Dobbins, J.H., and R.G. Donnelly (1998). "Summary research report on critical success factors infederal government program management," Acquisition Review Quarterly, Winter, pp. 61–81.Fleisher, C.S., and B. Bensoussan (2003). Strategic and Competitive Analysis: Methods andTechniques for Analyzing Business Competition. Upper Saddle River, NJ: Prentice Hall.Garner, L. (1986). "Critical success factors in social services management," New England Journal ofHuman Services, VI(1), pp. 27–31.Grant, R.M. (1999). Contemporary Strategy Analysis. Oxford, UK: Blackwell Publishers Ltd.Jenster, P.V. (1987). "Using critical success factors in planning," Long Range Planning, 20(4), pp.102–109.Leidecker, J.K., and A.V. Bruno (1984). "Identifying and using critical success factors," Long RangePlanning, 17(1), pp. 23–32.Leidecker, J.K., and A.V. Bruno (1987). "Critical success factor analysis and the strategydevelopment process," pp. 333–351 in King, W.R., and D. Cleland (eds.), Strategic Planning andManagement Handbook. New York, NY: Van Nostrand Reinhold Co.Lester, D.H. (1998). "Critical success factors for new product development," Research TechnologyManagement, 41(1), pp. 36–43.Lilley, W. (May 27, 2005). "We're not gonna take it," The Globe and Mail, retrieved June 29, 2005from http://theglobeandmail.com/servlet/story/LAC.20050527.RO6TAKEIT/PPVStory/?DENIED=1.Porter, M.E. (1980). Competitive Strategy. New York, NY: The Free Press, MacMillan Inc.Rockart, J.F. (1979). "Chief executives define their own data needs," Harvard Business Review,March–April, p. 85.Thompson, A.A., Gamble, J.E., and A.J. Strickland (2006). Strategy: Winning in the Marketplace,2nd edition. New York, NY: McGraw-Hill.Westerveld, E. (2003). "The Project Excellence Model: linking success criteria and critical successfactors," International Journal of Project Management, 21, pp. 411–418.
Endnotes
1 Boynton and Zmud, 1984:17.2 Daniel, 1961; Anthony et al., 1972.3 Rockart, 1979: 85.4 Boynton and Zmud, 1984.5 Leidecker in particular—see Leidecker and Bruno, 1984.6 See Fleisher and Bensoussan (2003), Chapter 14.7 Thompson, Gamble, and Strickland, 2006: 76.8 Adapted from Chen, 1999: 88.9 Thompson, Gamble, and Strickland, 2006.10 Aaker, 2001: 91.11 Leidecker and Bruno, 1987: 347.12 See Dobbins and Donnelly, 1998; Garner, 1986.

13 Boynton and Zmud, 1984: 18.14 Grant, 1999: 79.15 Leidecker and Bruno, 1987.16 Strickland, page 72.17 Leidecker & Bruno, 1984.18 We describe this technique as PEST/STEEP analysis in Chapter 17 of our previous book andprovide a detailed explanation of its background and how to perform this technique.19 The Porter's Five Forces model is covered thoroughly in Chapter 6 of our previous book.20 See Fleisher and Bensoussan, 2003, Chapter 7.

19Country Risk Analysis
Short Description
Country risk assessment (CRA) deals with how a firm addresses the risks involved in makinginvestments in a foreign country. Country risk is the risk that economic, political, or social conditionsand events in a foreign country will adversely affect a firm's financial and strategic interests.Decision makers need to weigh any potential loss of invested capital that could result fromtroublesome circumstances in a foreign country. CRA as a discipline seeks to identify these risks anddetermine the degree to which they will negatively impact their return on investment (ROI). Countryrisk can be segmented into the following six distinct, yet interrelated, categories:
Economic riskTransfer riskExchange rate riskLocation or neighborhood riskSovereign riskPolitical risk
Background
Risks are generically viewed as the potential damage or harm that may arise in the present or future.Risks are often mapped to the probability of some future event or current process, which may result inan undesirable outcome. CRA is primarily used for business analysis, although it can also be used toassess the vulnerability associated with rivals' foreign investments and market entry.CRA became popular in the 1970s and was refined in subsequent decades. Its first manifestationswere designed to help private investor banks make educated decisions about lending money toentities in foreign countries. Following the oil crisis in the 1970s, CRA took a more quantitativeapproach. Risk assessment forecasting services from agencies such as the International MonetaryFund, the Economist's Economic Intelligence Unit, and the Wharton Economic Forecasting Associates(WEFA) grew and became more sophisticated, often with the assistance of analytical models that hadbenefited from years of empirical testing and experience.Indices that rated country risk began to be developed, often with data collected from vast andknowledgeable sources. These services typically used a combination of qualitative and quantitativemeasures to regularly rank over 200 different countries. A range of experts from universities,government, and organizations would be surveyed by the respective indices developers to produce anindividual score and or ranking.Unfortunately, there were often differences in ratings/rankings between indices because experts'
definition and conversion of the data into measurable actions and behaviors could differ. Thus, therewas an element of subjectivity in the models. Additionally, they were often too general for mostbusiness people and decision makers to use in their planning considerations because they wereprimarily prepared for banks and institutional lenders for a fee. They also commonly lacked thespecificity of which risks were more prevalent in different types of investments or market entryactivities. With such international events as the change of governments in Iran and Nicaragua in thelate 1970s, the models became more refined in the 1980s and 1990s and began to make use of moretypes of quantitative measures and the inclusion of investment limits and statistical significance forcommercial CRA services and indices.
Strategic Rationale
Today's reality is that firms interested in becoming industry leaders must seek global, not local,market dominance. Global expansion is becoming increasingly attractive for firms whose homemarkets have reached maturity or are simply too small to allow exploitation of economies of scale orlearning curve advantages.1 Multinationals are locating manufacturing facilities in foreign countries,outsourcing, joint venturing, and exploring licensing opportunities to gain access to developingmarkets.2 All of these situations will present risks that the firm may not have experienced in its homecountry.The term "investment" covers a range of actions that a firm can take to extend its operations into aforeign country. A strategy as simple as selling products in another country can represent a risk in theshort term. These risks include not getting paid for the full cash value of the goods, or getting paid in avalueless currency.3 Many expansion strategies require longer-term investments and acorrespondingly longer period over which a risk may be experienced, such as the construction ofmanufacturing facilities or development of strategic alliances.Although international expansion or investments can provide many positive opportunities to generateprofitability and wealth, the risks associated with investing in a foreign country are numerous. Someof these risks include a foreign entity defaulting on its debt; renegotiating or rescheduling obligationsin order to alleviate problems associated with the financing instruments or processes; and the transferof risk, which includes losses to the home country firm that emanate from foreign exchange rates andcontrols.4 Firms will want to assess the potential that their ROI may fall short of what might bereasonably projected.5 Firms' or governments' financial positions in the foreign market are affected bychanges in taxation, exchange rates, and exchange controls.In the twentieth century, there were numerous situations where domestic debtors were relieved ofobligations to foreign investors, leaving foreign investors few options for recourse to compensation.One reason for this was because the laws of independent countries were outside the bounds foreigncourts. Even with a ruling by the International Court of Justice (the World Court or ICJ) in TheHague, if the situation would even qualify, firms receive little more than moral vindication if theguilty country refuses to act on the ruling.
Strengths and Advantages

Foreign markets enable firms to gain access to less-developed markets, capitalize on economies ofscale, and develop more cost-effective value chains. For firms looking to expand abroad, it isimportant to be educated about the potential risks and create contingency plans where possible. CRAis important to enhance the firm's understanding of the kind and degree of risks that are associatedwith a potential foreign investment. Firms that have a realistic grasp of risks stand a much betterchance of achieving success with their investments over the long term.CRA also helps you to identify not only the nature of the risks inherent in making investments abroad,but may also allow you to identify remedies to minimize or even eliminate taking on all of the risk. Inaddition, certain risks can be insured against or hedged—for example, exchange rate risk, which canhelp firms weather the tough times that they would not experience in their home market.When a firm has an investment choice among several countries, CRA can help it make relativedeterminations and prioritize those places, which are likely to generate the most favorable return/risktrade-offs. Analysts can help their decision makers gain confidence in their investment decisions bychoosing countries that have lower risk levels.CRA may also help you identify other firms, particularly those in non-competing markets, which havepreviously invested in risky countries. This can help you to identify the actions those firms took tolessen country risk. As such, this becomes a form of benchmarking that can help the firm adaptpractices that have been successful elsewhere (see Chapter 11, "Benchmarking," for more aboutbenchmarking).Finally, CRA is part of the cultural awareness a firm must develop for long-term success wheninvesting and operating in a foreign country. A comprehensive CRA helps to educate analysts,managers, and decision makers about a country's political system, history, economic, judicial, andcommercial factors in advance of making a major investment. Hence, it accelerates the firm up the"learning curve" and can potentially also facilitate an adjustment into a foreign country after adecision to invest has been made.
Weaknesses and Limitations
Concerns arising from data collection, lack of objectivity, looking to past events to predict the future,and lack of specificity are problems that plague the CRA discipline. Many attempts by CRA expertsand advisory agencies to standardize and quantify dynamic, simultaneous events and isolate them areconducted upon a shaky foundation of causal and affective relationships. Ultimately, CRA tries toassign quantitative measures to human events, actions, and concepts that are themselves constantlydeveloping and unfolding.6 As such, analysts need not only to understand how to interpret the variouscountry risk ratings or rankings they encounter, but also to have a reasonable conceptualunderstanding (meaning that they can explain it in common sense terms to their decision makers) ofthe modeling that underlies and provides the computational foundations of these results. To increaseconfidence in their findings, analysts will need to focus on the root causes of the problems, not just onthe more visible symptoms of these problems. However, even with the elaborate techniques andmodels used by many firms, research has shown the results are often subsequently wrong.7A CRA model based on substantial volumes of historical data may also be flawed. This occursbecause past actions may be unreliable indications of future behavior. A country with a high level ofrisk in the past may have taken actions to reduce these factors, while countries with lower levels may
have become riskier in recent years. This is one reason why data gathering for CRA purposes must bekept active and regularly updated.The data collection efforts that provide the raw data to calculate country risk scores are often flawed.Political risk assessment models are often comparative, and it is difficult to procure the same data fordifferent countries when it is subjective. Much of the data is based on opinion, which is highlysubjective, and can be biased. An interviewee that is an "insider" (that is, a resident or citizen of thecountry in question) may be biased toward the country or biased against the home country of theinterviewer. As such, different studies of the same country will often deliver dramatically differentresults. Apart from potential respondent biases, expert interviewees and interviewers may simplyattach different meanings to a variable or interpret questions or answers differently, therebyintroducing an additional bias.8In underdeveloped or slowly developing countries, much of the economic data needed to accuratelycalculate risk scores using today's sophisticated quantitative models may not be published. If this datais published, it may not reflect the actual state or an accurate picture of the market in the globaleconomy. Many countries have well-developed black markets where the exchange of cash, bribes,and goods, both legal and illicit, go unrecorded, and the data captured about economic activity iscorrupt, or suspect at best.Finally, CRA is helpful in illuminating the risks of investing or establishing operations in a foreigncountry, but it is not so helpful in providing an understanding of the other side of the risk andreward/return equation—that being the benefits to be generated for the firm from making theseinvestments. You will need to employ different techniques, particularly those associated withmodeling financial returns over time, and even more economic models like Porter's Diamond ofNational Advantage, in order to have a strong sense of the entire risk/reward equation.
Process for Applying the Technique
The investment decision-making process for a firm looking to enter a foreign market often follows acommon pattern, and it can be adapted to a large or smaller scale project. Country risk ratings arecommonly used to summarize the conclusions of the CRA process. The ratings provide a frameworkfor establishing country exposure limits that reflect the firm's risk tolerance and willingness tobalance potential rewards against these risks.Business and competitive analysts can play a prominent role on a CRA effort. This will become moreevident once we describe the organizational process for performing CRA. The following fairlystandard methodology is adapted from one recommended by D.H. Meldrum:
1. 1. Create a foreign country market risk assessment team. The team will be responsible forassessing risk in terms of the specific kind of investment being contemplated. For example, if thefirm is considering locating a plant in a foreign country, longer-term risk factors, like economicrisk, will be viewed as more important. If it is to be financed by the home firm, sovereign riskwill not require consideration. If a firm is looking at a shorter-term investment, for example,selling goods in the private sector, economic outlook and exchange rate risk may reflect morepressing issues.
2. 2. Analysts should help executives decide how important or potentially influential each of the
different risk categories will be to the decision under consideration. The most influential receivethe highest relative weight, and the least influential receive the lowest relative weight. Theseweights must be established for a particular time period because they will not likely be fixed atthe same weights over long periods of time.
3. 3. The team should select appropriate measures or metrics for each of type of risk. At this point,focus on a small number of quantifiable indicators (say between five and 10, which appear to beparticularly relevant), such as GDP and debt service ratios, and determine if those indices arefalling within a desirable range. Each index is given a score between 1 and 5, according to howclosely the measure reflects low risk. Some samples of indicators for each type of risk areoutlined in the risk descriptors described in subsequent paragraphs of this section.
4. 4. For qualitative indicators, analysts should canvas risk experts (or the consensus of severalexperts) for their opinion on conditions in the country in question, and those outcomes are givena score from 1 to 5.
5. 5. The resulting values can all be combined for each risk factor.6. 6. Each risk factor's score can then be multiplied by its weight, and all weighted scores can then
be aggregated to create a total country risk score. If different countries are being compared, it isimportant to use the same weighting scheme consistently for all countries in order to get arelative assessment of country risk. Although this step results in a quantitative score, it isimportant not to attribute any spurious accuracy or confidence intervals to the results.
Assessing country risk ordinarily requires the use of a variety of sophisticated quantitativetechniques. In many typical country analysis or planning situations, the analyst will begin with anindex acquired through subscription or fee payment from a country risk consultancy or reporting body.Country risk reports can be purchased from the Business Environment Risk Intelligence (BERI) S.A.,Control Risks Information Services (CRIS), Economist Intelligence Unit (EIU), Euromoney,Institutional Investor, Moody's Investor Services, Standard and Poor's Rating Group, and PoliticalRisk Services: International Country Risk Guide (ICRG), among others. These reports are generatedby groups that continually monitor and assess country risk and publish them on a regular andsystematic basis.The advantage of commercial reports is the vast resources and knowledge they have at theirfingertips. Most, like the WEFA, IMF, and EIU reports, provide timely and regularly updatedinformation on over 200 countries as well as periodic global reports. It is almost impossible for anyother than the most resourceful firms to attempt to match the reach and capabilities that thesecommercial services provide. That said, the commercial reports are general overviews, not tailoredto any particular type of investment or situation and not necessarily designed to answer the kind ofinvestment oriented questions that a firm might be called upon to address. That is why a combinationof commercially available material, adapted to and complemented with other analysis that apply to afirm's specific investment situation, is a preferable country risk assessment method for most firmslooking to expand and invest abroad.Acquiring these reports is a helpful but not a sufficient step in doing CRA for competitive or strategicdecision-making purposes. None of the indices is sufficient to predict the array of social, political,and economic factors that can align to create a good or bad environment on any given day or at thetime your firm is planning to make its investment. Very generally, the more stable a country is, theeasier it is to make predictions about the nature and level of risk that will be experienced.As assessing country risk for the strategic analyst is as much "art" as it is "science," the technique can
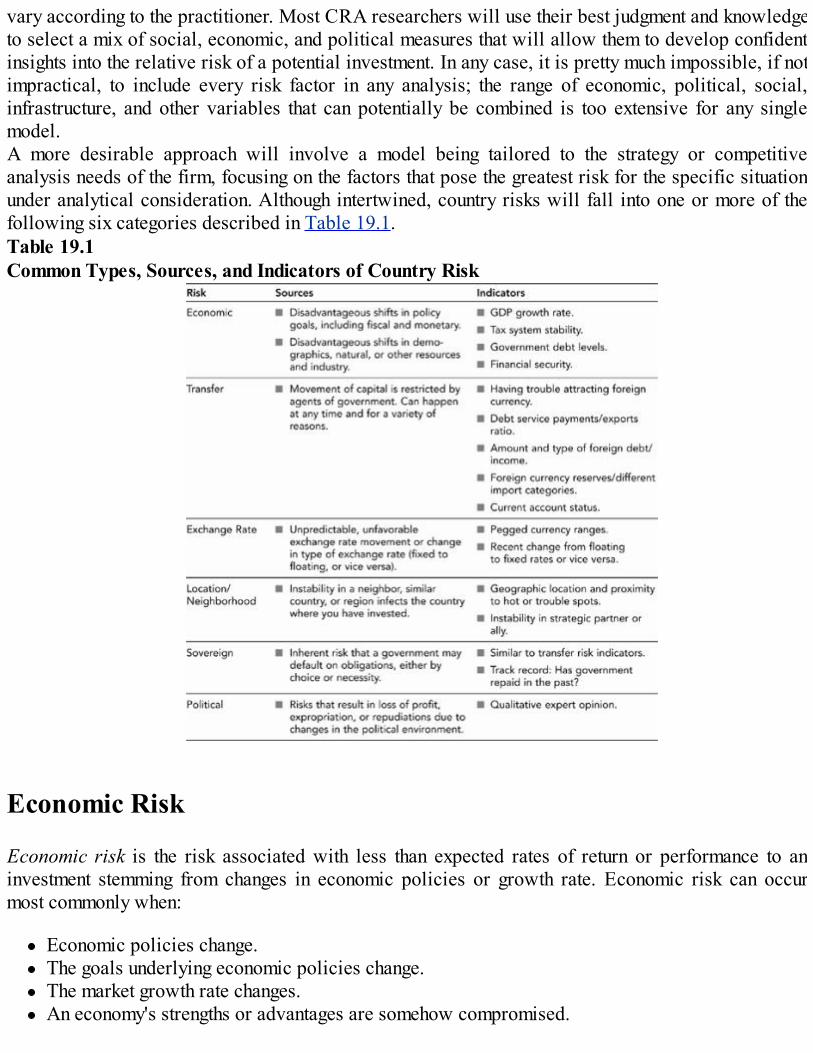
vary according to the practitioner. Most CRA researchers will use their best judgment and knowledgeto select a mix of social, economic, and political measures that will allow them to develop confidentinsights into the relative risk of a potential investment. In any case, it is pretty much impossible, if notimpractical, to include every risk factor in any analysis; the range of economic, political, social,infrastructure, and other variables that can potentially be combined is too extensive for any singlemodel.A more desirable approach will involve a model being tailored to the strategy or competitiveanalysis needs of the firm, focusing on the factors that pose the greatest risk for the specific situationunder analytical consideration. Although intertwined, country risks will fall into one or more of thefollowing six categories described in Table 19.1.Table 19.1Common Types, Sources, and Indicators of Country Risk
Economic Risk
Economic risk is the risk associated with less than expected rates of return or performance to aninvestment stemming from changes in economic policies or growth rate. Economic risk can occurmost commonly when:
Economic policies change.The goals underlying economic policies change.The market growth rate changes.An economy's strengths or advantages are somehow compromised.
Material changes in a country's natural or human resources, demographics, or industry performancecan all result in economic risk. Political risk and economic risk may be closely intertwined. Somemodels for assessing political risk will put economic risk under the political risk umbrella, asgovernment economic policies affect both the political and economic climates.
Economic Risk Indicators
There are numerous ratios that can be used to determine the relative level of health of a country'seconomy. A simple and accessible indicator is the gross domestic product (GDP) growth rate. A highgrowth rate can frequently indicate a developing country whose economy is experiencing rapidchange, whereas a slow growth rate can indicate a mature market. In order to determine the amountand burden of external debt, one can look at the ratio of Net External Debt (NED) to GDP or the ratioof Net External Debt to exports of goods and services. These ratios give an indication of the country'sability to service its debt. As a rule of thumb, a debt service ratio under 10 percent is a positive sign,while anything over 20 percent is a negative sign. The amount and growth of GDP and the current taxsystem are also factors you should consider examining.
Transfer Risk
Transfer risk is the potential for a government, public agencies, or its officials to confine or hindercapital movement from their country to another. This can make it difficult or impossible for a firm toshift (or transfer) profit or capital assets back to their home country or elsewhere. Countries canhinder capital movement at any time through a variety of measures. Generally, countries that arehaving a hard time attracting foreign currency are more likely to enact capital restrictions. Likeeconomic risk, some models for assessing political risk put transfer risk under the political riskumbrella, as political policies can also affect the flow of goods.
Transfer Risk Indicators
Imbalances in quantitative figures can expose the risk of transfer restrictions. It is more important tolook at the trend of consistency or inconsistency in these figures than the absolute figures themselves.Some ratios to examine to determine transfer risk are: debt service payments to exports, foreign debtto income ratios, foreign currency reserves to imports (in categories), and relative current accountstatus. Adverse imbalances in accounts could create a situation where governments will restrictcapital in order to cover up deficits.
Exchange Risk
Exchange risk generally entails a quick or unexpected movement in the exchange rate between

countries that causes detrimental investment results. This can include a country switching from fixedto floating exchange rate systems or vice versa. Currency traders and analysts are trained in makinglonger term predictions and can be a valuable source of information in assessing exchange rateactivity. Short-term exchange risk can be mitigated by the use of hedging tactics. For the longer term,the firm will want to look at whether costs and revenues in the same currency match up or build insafety nets to cushion against currency fluctuations. The structure of the exchange rate policy is alsoan indicator. Floating rates, particularly when the country is an active participant in global tradingregimes and its currency is regularly traded and exchanged, often produce less-unexpectedmovements. Managed floats, the situation in which governments are trying to keep their currency'srate of exchange pegged within a certain range, often increase this risk.
Exchange Risk Indicators
Transfer risk indicators can also be useful in determining exchange rate movement because overvaluation of a currency can lead to increased imbalances that increase transfer risk. Alternatively, acurrency devaluation can decrease these kinds of imbalances.
Location/Neighborhood Risk
These risks exist by virtue of being physically close to an unstable environment. They can occurwherever there are problems in a particular region: problems with a geographically near tradingpartner, with a neighboring country, or a country with similar traits or characteristics. For example,religious or racial persecution can lead to a flood of refugees to neighboring countries and causedisruption in commerce and trade.
Location/Neighborhood Risk Indicators
The best indicator for neighborhood risk is geographic proximity. Proximity to superpowers, troublednations, unstable, warring, or impoverished countries can increase the levels of this risk. The numberof borders (particularly pertinent for land-locked nations within larger continents), border disputes,and membership (or lack thereof) of alliances or trade agreements can also have an effect on this formof risk.
Sovereign Risk
The unique characteristic with sovereign risk is not so much the risk of loss, but the lack ofrepercussions in the event of loss, due to the sovereignty of nations. Any form of investment orpartnership by a private investor with a government or one of its designated agencies runs the risk ofdefault due to an inability or refusal by a country's government to honor its commitments. An inability

to pay is related to economic and transfer risk, and a refusal to cooperate may be politicallymotivated. International law states that a private investor cannot sue a sovereign government withoutthe government's permission.Transfer risk indices are helpful in determining if a country will be able to honor financialcommitments. Willingness to pay is a little trickier. It can be helpful to look at the historical record ofpayment by a particular nation and its respective governments. Although past actions are no guaranteeof future behavior, an historical trend of not paying is a track record to be mindful of. The analystmust also consider the consequences to the nation/its government and the firm if the government doesnot pay. Could the nation experience potentially damaging consumer boycotts or receive strongpressure from other nations?
Political Risk
Generally speaking, assessing political risk is another elusive and varied task. Briefly, these are risksthat result from political changes. Macro- and micro-risk can be further divided into two categories:societal and governmental.Societal macro-risk refers to instability caused by civil wars, terrorism, coups, dramatic shifts insocietal values, pressures by powerful unions, religious disagreements, revolutions, national workstoppages, or any other politically charged civil event that is detrimental to the activities of a foreignfirm.Governmental macro-risk encompasses all actions by the host government that can have negativeeffects on foreign businesses. These include nationalization and expropriation, limits on therepatriation of assets and profits, a dramatic change in leadership, and/or general bureaucracy. A lessextreme, though far more common, example is the incongruence that results from high tariffs incountries that are trying to attract foreign business.Societal micro-risks include boycotts, activism, some acts of terrorism, and competition from othermultinationals.Governmental micro-risks are those that are directed toward a specific foreign country or industry.They include selective nationalization, prejudicial tax systems, equity, content and hiring regulations,supporting indigenous competition, disregarding contracts, and putting controls on pricing.In most cases of political risk analysis, either a business or political risk assessment service willinterview experts (academics, business people, politicians, and consultants) and quantify the resultsinto a numerical score or index in order to evaluate the country in relation to other countries. Thesepolitical risk scores have been criticized as being inconsistent, subjective, and lacking futureorientation.Other techniques for gauging political risk include the "grand tours" technique, whereby a firmrepresentative investigates the investment site and interviews local officials and businesses. Anothermethod is the "old hands" technique, where the firm seeks out country experts and veterans in order togather their views and insights.This six-step process is best demonstrated via an example. The case study in this chapter is for afairly standard application of the CRA process and will provide you with a better understanding ofthe process just outlined.Although the nature of the CRA process and the level of analytical resources devoted to it will vary
from firm to firm depending on the size and sophistication of its international operations, a number ofconsiderations are relevant to evaluating the process:
Is there a quantitative and qualitative assessment of the risk associated with each country inwhich the firm is operating or planning to conduct business?Is a formal analysis of country risk conducted at least annually, and does the firm have aneffective system for monitoring prominent developments in the interim?Does the analysis take into account all aspects of the broadly defined concept of country risk, aswell as any special risks associated with specific groups of counterparties the firm may havetargeted in its business or market strategy?Is the analysis adequately documented, and are conclusions concerning the level of riskcommunicated in a way that provides decision makers with a reasonable basis for determiningthe nature and level of the firm's exposures or potential exposures in a country?Given the size and sophistication of the firm's international activities, are the resources (that is,data gathering, analysts, processes, systems, and time) devoted to the CRA process adequate?Have analysts checked with their decision makers to assess their satisfaction with previouscountry risk analyses? Did decision makers make use of the provided CRAs? Were the resultsprovided credible? Have decision makers been surprised by an adverse event occurring in acountry where an analysis was performed?As a final check of the process, are the analyst's conclusions concerning a country reasonable inlight of information available from other sources, including external research and ratingservices?
CRA is important in an increasingly global marketplace, particularly for small- to medium-sizedfirms that are planning to make investments abroad for the first time. Conclusions about the level ofcountry risk provide an evaluation of prevailing (and possible future) economic, political, and socialconditions, which reflect on a country's ability to meet its obligations, as well as the credit risk onindividual counterparties located in the country. CRA should be combined with other tools toimprove the firm's ability to make better decisions about its international business activities.
Case Study: Zyboldt Metals (ZMC) Expansion into EasternEurope
Zyboldt Metals Corporation (ZMC), headquartered in the mid-western part of the U.S., is a spin-offof a large American conglomerate that had gone through a massive restructuring and divestureinitiative in order to focus on its core businesses of metal and plastics. ZMC, a firm with close to$130 million in sales in 2004 (nearly all of which were in Canada and the U.S.), viewed homecanning products as a key part of the firm's product offering. The firm hoped to achieve at least a 50percent growth in its home canning sales within the next three years, and an expansion into EasternEurope, the first investment the firm would make outside of North America, would potentially be partof the strategy.An observant CEO, Arthur Rieden, noticed some interesting things while on a six-week pleasure tripto several nations in Eastern Europe during July and August 2005. He observed that many people in

the bed and breakfast facilities, as well as small hotels he stayed in, had their own vegetable gardens,with the Hungarians, Poles, Romanians, and Ukrainians having sizable vegetable gardens. When heasked his hosts about the produce from their gardens, he discovered that most of the peoplerepetitively used the same jars to store their vegetables, and many of these jars lacked the properseals; hence, they had to use a large volume of various preservatives in the canning process to avoidthe contents being spoiled when bacteria, enzyme, mold, and yeast grew out of control.Rieden knew that his canning products, properly applied, would control the spoilage, allowing thecanned food to be kept for a substantially longer time. Market research the firm had authorized someyears ago also showed that families in this part of the world generally preferred the ZMC canningprocess and its preservative-free taste.With this information and forecasted market potential of around 60 million jars per year, expansioninto Eastern European markets looked promising. While lids would be imported from Canada,upwards of eight million dollars for the glass jars molds and production, carton design andproduction, and an extensive multi-media advertising campaign would be invested directly in thecountry of entry. Based on his visits, the views of some of his well-traveled employees, and somesparse country data he was able to acquire, Rieden considered Hungary and Ukraine good entrypoints to establish an Eastern European market.Before making the investment, Rieden asked his firm's analysts to perform a CRA, along with anumber of other complementary market, competitor, and partner analyses of the two countries. For theCRA, he wanted to know if the potential benefits of investing in these countries would outweigh theassociated risks. He asked the analyst to compare Hungary and Ukraine and their relative countryrisk. This study was carried out in late 2005.Step One: What kind of investment is ZMC making? Which types of country risk will ZMCpotentially be exposed to?As the firm is outsourcing suppliers for jars, packaging, distribution, and advertising, the expansioninto Eastern Europe can be classified as "Direct Investment—Private Sector." Therefore, the riskimpact would be as follows:
Source: Adapted from Meldrum, 2000.Step Two: Choose weighting for each risk type, as follows:
Step Three: Select indicators:Grading Guide: A = 0 points, B = 1 point, C = 2 points, D = 3 points, F = 4 points, +/– = add/subtract.25 points.
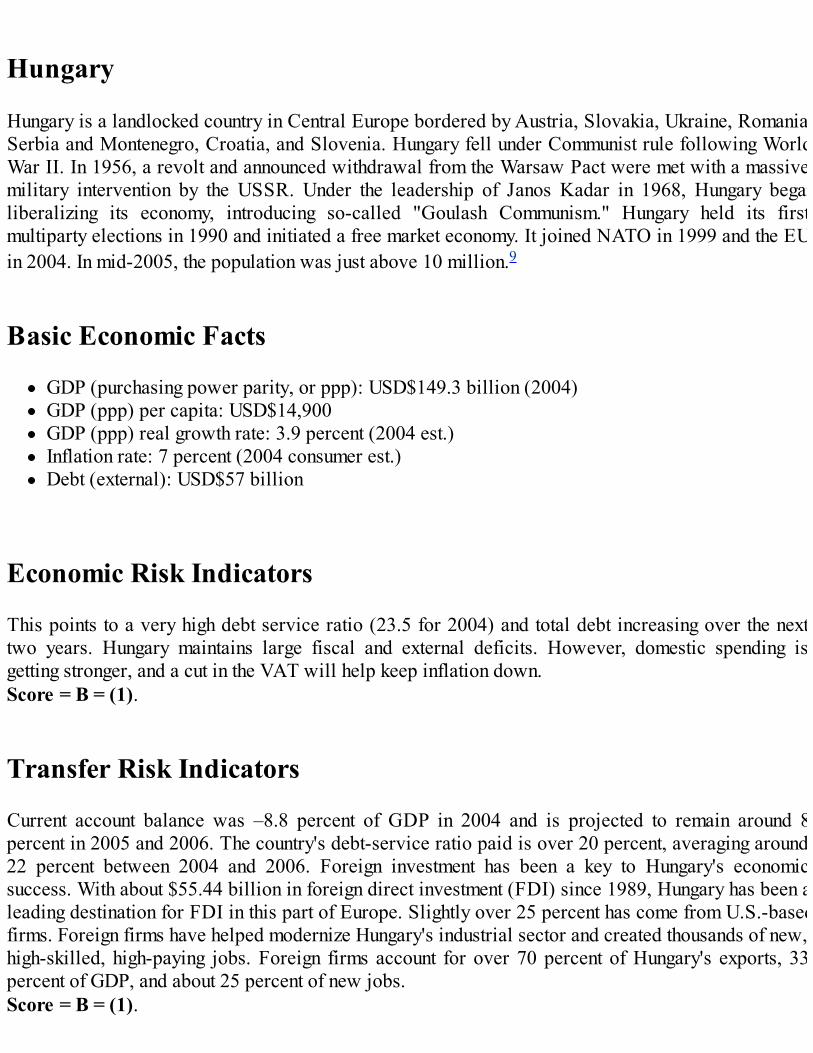
Hungary
Hungary is a landlocked country in Central Europe bordered by Austria, Slovakia, Ukraine, Romania,Serbia and Montenegro, Croatia, and Slovenia. Hungary fell under Communist rule following WorldWar II. In 1956, a revolt and announced withdrawal from the Warsaw Pact were met with a massivemilitary intervention by the USSR. Under the leadership of Janos Kadar in 1968, Hungary beganliberalizing its economy, introducing so-called "Goulash Communism." Hungary held its firstmultiparty elections in 1990 and initiated a free market economy. It joined NATO in 1999 and the EUin 2004. In mid-2005, the population was just above 10 million.9
Basic Economic Facts
GDP (purchasing power parity, or ppp): USD$149.3 billion (2004)GDP (ppp) per capita: USD$14,900GDP (ppp) real growth rate: 3.9 percent (2004 est.)Inflation rate: 7 percent (2004 consumer est.)Debt (external): USD$57 billion
Economic Risk Indicators
This points to a very high debt service ratio (23.5 for 2004) and total debt increasing over the nexttwo years. Hungary maintains large fiscal and external deficits. However, domestic spending isgetting stronger, and a cut in the VAT will help keep inflation down. Score = B = (1).
Transfer Risk Indicators
Current account balance was –8.8 percent of GDP in 2004 and is projected to remain around 8percent in 2005 and 2006. The country's debt-service ratio paid is over 20 percent, averaging around22 percent between 2004 and 2006. Foreign investment has been a key to Hungary's economicsuccess. With about $55.44 billion in foreign direct investment (FDI) since 1989, Hungary has been aleading destination for FDI in this part of Europe. Slightly over 25 percent has come from U.S.-basedfirms. Foreign firms have helped modernize Hungary's industrial sector and created thousands of new,high-skilled, high-paying jobs. Foreign firms account for over 70 percent of Hungary's exports, 33percent of GDP, and about 25 percent of new jobs. Score = B = (1).
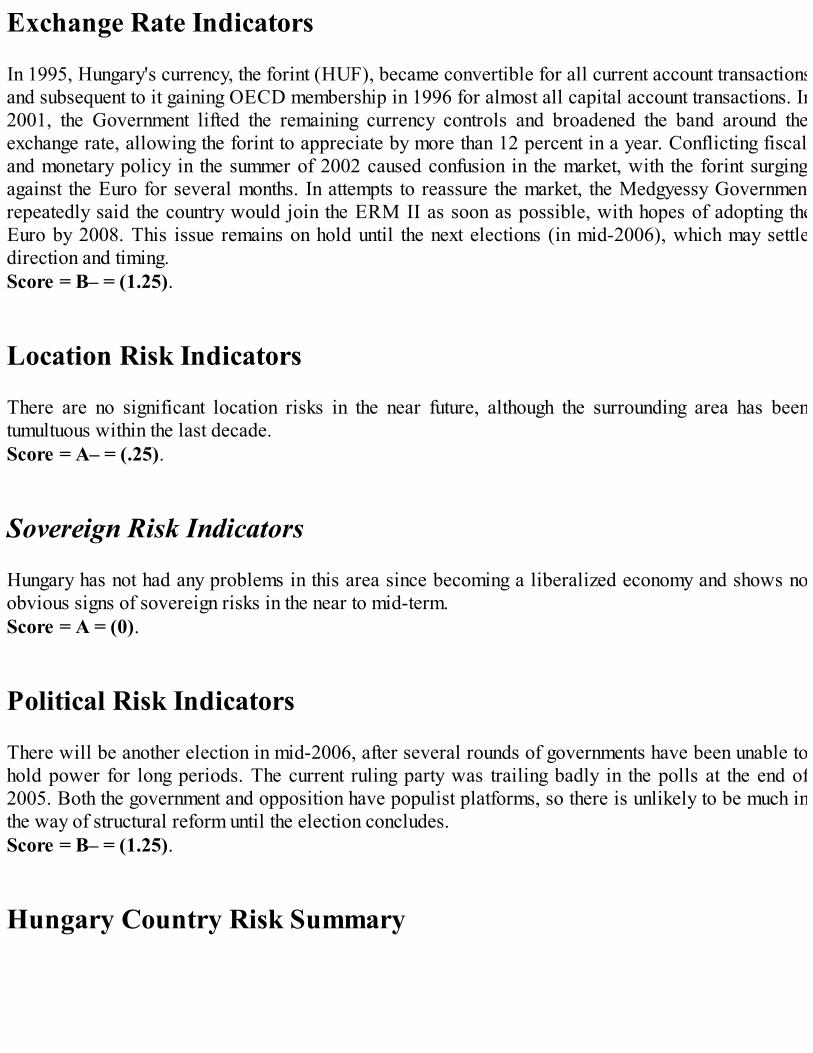
Exchange Rate Indicators
In 1995, Hungary's currency, the forint (HUF), became convertible for all current account transactionsand subsequent to it gaining OECD membership in 1996 for almost all capital account transactions. In2001, the Government lifted the remaining currency controls and broadened the band around theexchange rate, allowing the forint to appreciate by more than 12 percent in a year. Conflicting fiscaland monetary policy in the summer of 2002 caused confusion in the market, with the forint surgingagainst the Euro for several months. In attempts to reassure the market, the Medgyessy Governmentrepeatedly said the country would join the ERM II as soon as possible, with hopes of adopting theEuro by 2008. This issue remains on hold until the next elections (in mid-2006), which may settledirection and timing. Score = B– = (1.25).
Location Risk Indicators
There are no significant location risks in the near future, although the surrounding area has beentumultuous within the last decade. Score = A– = (.25).
Sovereign Risk Indicators
Hungary has not had any problems in this area since becoming a liberalized economy and shows noobvious signs of sovereign risks in the near to mid-term. Score = A = (0).
Political Risk Indicators
There will be another election in mid-2006, after several rounds of governments have been unable tohold power for long periods. The current ruling party was trailing badly in the polls at the end of2005. Both the government and opposition have populist platforms, so there is unlikely to be much inthe way of structural reform until the election concludes. Score = B– = (1.25).
Hungary Country Risk Summary

The analyst concluded that Hungary did not have high levels of country risk for the firm's EasternEuropean expansion. Nevertheless, the charge by CEO Rieden was to compare the relative risk levelsof Hungary to Ukraine. The next section performs the same CRA process on Ukraine.
Ukraine
Situated in East-Central Europe, Ukraine is bordered by Poland, Slovakia, Hungary, Romania, andMoldova to the West, by Belarus to the North, and by the Russian Federation to the North-East andEast. To the south of the country lies the Black Sea. The capital is Kiev.Ukraine became independent in 1991 with the dissolution of the USSR. Since that time, democracyhas remained elusive as the legacy of state control and endemic corruption stalled efforts to improvecivil liberties, achieve economic reform, and accelerate privatization. A peaceful mass protest (the"Orange Revolution") toward the end of 2004 compelled the authorities to overturn a riggedpresidential election and to allow a new internationally monitored vote. This election swept intopower a reformist slate under Viktor Yushchenko. The population was around 47.4 million in themiddle of 2005.10
Basic Economic Facts
GDP (ppp): USD$299.1 billionGDP (ppp) per capita: USD$6300GDP (ppp) growth: 12 percent (2004)Inflation rate: 12 percent (2004 est.)Debt external: USD$16.4 billion (est. 2004)
Economic Risk Indicators
Ukraine has many of the components of a major European economy—rich farmlands, a well-developed industrial base, highly trained labor, and a good education system. The countryexperienced a sharp period of economic decline in the 1990s, and the standard of living for mostcitizens declined steadily, leading to widespread poverty. Beginning in 2000, economic growth hasaveraged almost 9 percent per year, reaching 9.4 percent in 2003 and 12.5 percent in 2004. The GDP

in 2000 showed strong export-based growth of 6 percent (the first growth since independence), andindustrial production grew 12.9 percent. The economy continued to expand in 2001 as real GDP rose9 percent and industrial output grew by over 14 percent. Growth was driven by strong domesticdemand and growing consumer and investor confidence. The rapid economic growth in 2002–4 waslargely attributed to a surge in steel exports to China, and personal income levels have been rising.The macro-economy is stable, and high inflation level is gradually coming under control. Whileeconomic growth continues, Ukraine's long-term economic prospects depend on the acceleration ofmarket reforms. The economy remains burdened by excessive government regulation, corruption, andlack of law enforcement, and while the Yushchenko Government took steps against corruption andsmall and medium firms have been largely privatized, much remains to be done to restructure andprivatize key sectors such as energy and telecommunications. Score = B = (1).
Transfer Risk Indicators
Ukraine has been encouraging foreign trade and investment. The foreign investment law allows non-citizens to purchase businesses and property, to repatriate revenue and profits, and to receivecompensation in the event that their property is nationalized by a future government. On paper, thereis no legal distinction between domestic and foreign capital; in practice, large local firms—mostlystate-owned firms in the industrial sector—have considerable political and legal influence. However,complex laws and regulations, poor corporate governance, weak judicial enforcement of contractlaw, and corruption inhibit large-scale foreign direct investment in Ukraine. Contracts are difficult toenforce, and regulation is neither impartial nor clear. Although it is possible for foreign firms to wincourt cases, particularly at the higher levels, the judicial process remains slow and inefficient.Ukraine is dominated by powerful local players who have successfully prevented foreign investment.The risk that foreign investors' assets will be de facto expropriated is low, but recent examples exist.While there is a functioning stock market, the lack of protection for minority shareholders' rightsseverely restricts portfolio investment activities. Total FDI in Ukraine was approximately $7.72billion as of October 1, 2004, which, at $162 per capita, was still one of the lowest figures in theregion. Score = C = (2).
Exchange Rate Indicators
Ukraine's currency, the hryvnia, was introduced in September 1996 and has remained stable untilquite recently. There has been increasing volatility in the rate since 2000, and successivegovernments have stated their aim was to enact policies that increased outsiders' confidence towardsthe economy as well as its credit rating. These actions remain in flux. Score = C = (2).

Location Risk Indicators
The region surrounding Ukraine is mostly stable and appears to be entering a period of stableadjustment to the global economy. The only remaining location risk issue is inside the country, ascrime is a serious problem in Ukraine, and a higher than European average number of raciallymotivated assaults and incidents of harassment to individuals of African or Asian descent have beenreported in recent years. Score = C = (2).
Sovereign Risk Indicators
Ukraine has a recent history of defaults and therefore may have higher than average levels ofsovereign risk. There are still some trends on the horizon to suggest the retention of higher thanaverage levels of risk in this indicator. Score = D+ = (2.75).
Political Risk Indicators
A new democratic constitution was adopted on June 28, 1996, which mandates a pluralistic politicalsystem with protection of basic human rights and liberties. Recent elections have been challenged,and there remains some skepticism over the long term stability of the government. Score = C– (2.25).
Ukraine Country Risk Summary
Recommendation
Based on the calculations performed, it was clear to the analyst that at the end of 2005, Ukraine held afar higher degree of country risk in the short and medium term than Hungary. This raised a number of"yellow flags" that the analyst knew would require further analysis. When the results of the CRA
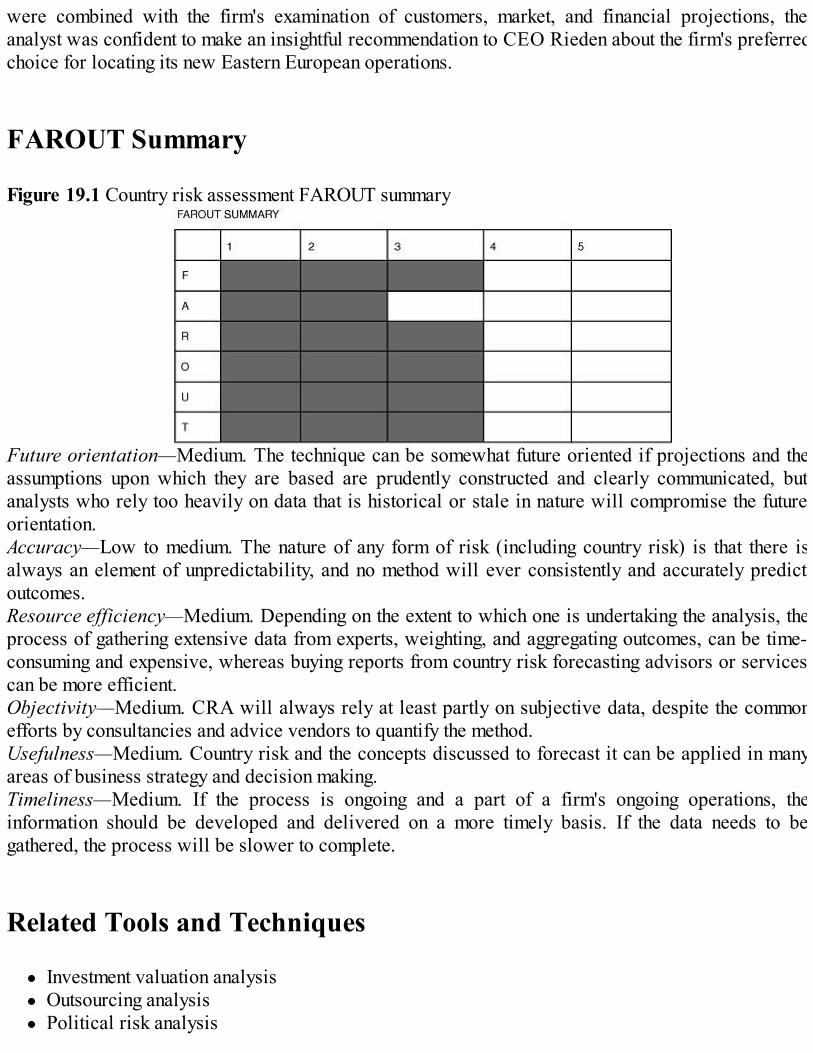
were combined with the firm's examination of customers, market, and financial projections, theanalyst was confident to make an insightful recommendation to CEO Rieden about the firm's preferredchoice for locating its new Eastern European operations.
FAROUT Summary
Figure 19.1 Country risk assessment FAROUT summary
Future orientation—Medium. The technique can be somewhat future oriented if projections and theassumptions upon which they are based are prudently constructed and clearly communicated, butanalysts who rely too heavily on data that is historical or stale in nature will compromise the futureorientation.Accuracy—Low to medium. The nature of any form of risk (including country risk) is that there isalways an element of unpredictability, and no method will ever consistently and accurately predictoutcomes.Resource efficiency—Medium. Depending on the extent to which one is undertaking the analysis, theprocess of gathering extensive data from experts, weighting, and aggregating outcomes, can be time-consuming and expensive, whereas buying reports from country risk forecasting advisors or servicescan be more efficient.Objectivity—Medium. CRA will always rely at least partly on subjective data, despite the commonefforts by consultancies and advice vendors to quantify the method.Usefulness—Medium. Country risk and the concepts discussed to forecast it can be applied in manyareas of business strategy and decision making.Timeliness—Medium. If the process is ongoing and a part of a firm's ongoing operations, theinformation should be developed and delivered on a more timely basis. If the data needs to begathered, the process will be slower to complete.
Related Tools and Techniques
Investment valuation analysisOutsourcing analysisPolitical risk analysis

Porter's Diamond of National AdvantageScenario analysisSTEEP/PEST and related macro-environmental analysisStrategic relationships analysisSWOT analysisValue chain analysis
References
Alon, I., and M. Martin (1998). "A normative model of macroeconomic political risk assessment,"Multinational Business Review, Fall.Bartlett, C.A., and S. Ghoshal (1998). Managing Across Borders: The Transnational Solution, 2nd
edition. Boston, MA: Harvard Business School Press.Bremmer, I. (2005). "Managing risk in an unstable world," Harvard Business Review, 83(6), June,pp. 51–62.CIA World Factbook (2005). U.S. Dept. of State Country Background Notes (Source Date: 08/05).Retrieved Oct. 10, 2005 from http://www.odci.gov/cia/publications/factbook.Coplin, W.D., and M.K. O'Leary (1994). The Handbook of Country and Political Risk Analysis.East Syracuse, NY: Political Risk Services, International Business Communications.Desta, A. (1993). International Political Risk Assessment for Foreign Direct Investment andInvestment Lending Decisions. Needham Heights, Massachusetts: Ginn Press.Ghose, T.K. (1988). "How to analyze country risk." Asian Finance, October 15, pp. 61–63.GlobalEDGE (2006). Country insights section, retrieved from the web on March 18, 2006, fromhttp://globaledge.msu.edu/ibrd/countryindex.asp.Meldrum, D.H. (2000). "Country risk and foreign direct investment." Business Economics, 35,January, pp. 33–40.Merill, J. (1982). "CRA." Columbia Journal of World Business, 17, pp. 88–91.OCC (Office of the Controller of the Currency) (2001). Country Risk Management. Administrator ofNational Banks. Washington, DC: U.S. Department of the Treasury.Perlitz, M. (1985). "Country-portfolio analysis-assessing country risk and opportunity," Long RangePlanning, 18, pp. 11–26.Porter, M.E. (1990). The Competitive Advantage of Nations. New York, NY: The Free Press.Robock, S.H. (1971). "Political risk: Identification and assessment," Columbia Journal of WorldBusiness, 6, pp. 6–20.Sethi, P.S., and K.A. Luther (1986). "Political risk analysis and direct foreign investment: Someproblems of definition and measurement," California Management Review, 28, pp. 57–68.Simon, J.D. (1982). "Political risk assessment: Past trends and future prospects," Columbia Journalof World Business, pp. 62–71.Thompson, A.A., Gamble, J., and A.J. Strickland (2006). Strategy: Winning in the Marketplace, 2ndedition. New York, NY: McGraw-Hill.Ting, W. (1988). Multinational Risk Assessment and Management. New York, NY: Quorum Books.Wells, R.K. (1997). "Country risk management: A practical guide," Business Credit, 99, Nov/Dec,

pp. 20–24.
Endnotes
1 Thompson, Gamble, and Strickland, 2006.2 Ting, 1988.3 Wells, 1997.4 Ghose, 1988.5 Meldrum, 2000.6 Bremmer, 2005.7 Alon and Martin, 1998; Sethi and Luther, 1986.8 Desta, 1993.9 Sources: GlobalEDGE, 2006; CIA World Factbook, 2005.10 Sources: GlobalEDGE, 2006; CIA World Factbook, 2005.
20Driving Forces Analysis
Short Description
Performing an industry analysis (see Chapter 6, "Industry Analysis (The Nine Forces)") can revealmuch about the current state of an industry and the potential for it to generate profitability for itsincumbents; nevertheless, change and uncertainty are ever present in the competitive environment.Driving forces analysis (DFA) is a way of understanding and accounting for change at the industrylevel. "Drivers" are clusters of trends that create influences on changes to an industry's structure and arival's competitive conduct.
Background
Change, particularly longer-term change, became a topic of interest to researchers, managers, andpolicy makers following the First and Second World Wars. DFA was developed in the 1950s as ameans for helping organizations and individuals deal with changes in the business environment.Techniques such as force field analysis (FFA), developed by Kurt Lewin in 1951, included theconcepts of driving and hindering forces. FFA was used to analyze the conditions that support orrestrain a given outcome and was seen to be an effective way both to analyze an existing set ofconditions and determine the most effective methods to achieve a desired outcome. This workcaptured the fancy of economists and set the stage for the further development of DFA within thecompetitive industrial context.So what are driving forces (DFs)? There are forces in every situation that cause things to remain asthey are or to change. Forces that push toward change are called "driving" or "helping" forces. Forcesthat resist change are called "restraining" or "hindering" forces. When these forces are balanced, nochange is likely to occur. When the net effect of these forces is altered and moves away from balance,change occurs in either a helpful or obstructive manner.Change is not the only factor associated with DFs that firms need to take into account; uncertainty isanother key element that a firm must confront as it makes decisions and develops strategies.The term "force" refers to the broad cluster of events, state of affairs, and/or trends that impact thefirm's future. DFs are those significant, underlying "currents" that define and drive events and trendsin certain directions. These forces are typically quite broad in scope, long-term in nature, andassociated with some degree of uncertainty as to their evolution. Examples of DFs include globalpopulation growth, advancing use of technology like the World Wide Web or portable phones, andchanges in the global climate.In order to plan appropriate strategies for change, the forces in the situation must be clearlyunderstood and identified. Understanding the DFs is the first step toward establishing a frameworkfor analyzing critical trends, particularly as they may impact the competitive environment facing an

industry. Taking this a step further, Tregoe and Zimmerman saw them as the primary determiners ofthe scope of future products and markets and a dominant factor that heavily influences majordecisions.
Strategic Rationale
Industry conditions change because forces are driving industry participants (competitors, customers,or suppliers) to alter their actions. Some DFs originate from within a firm's industry and competitiveenvironment and can create uncertainty for industry participants—this is always an element present ina competitive environment that a firm can exploit with a well-deployed strategy.The first task in understanding industry evolution is to look for the DFs of the macroenvironment thatinfluence industry structure and competitive behavior; for example, changing government regulationsand regulatory regimes. There are also less-obvious external factors. Identifying and assessing thesefundamental factors is both the starting point and one of the objectives of scenario analysis.1DFs may seem obvious to one person but be hidden to another; therefore, the identification of DFsshould be done in a team environment. It is helpful to run through this common list of categories ofDFs: social forces/demographic developments, technological developments, economic developmentsand events, political developments and events, and environmental developments. Normally, firmshave little control over DFs—their ability to deal with them comes from recognizing them andunderstanding their effects.DFA also plays a critical role in the larger strategy development process. DFs indicate the externalfactors likely to have greatest impact on a firm in the near future. The firm must proactively addressthese forces if it is to achieve success.
Strengths and Advantages
DFA is an essential component of several other analytical techniques, including environment andindustry analysis. The first task in building a scenario is to look for DFs of the macro-environmentthat influence the key industry or customer factors likely to impact the firm.2 For example, governmentregulations might influence future competition, but there are also many less-obvious external factors.Identifying and assessing these factors is both the starting point and one of the objectives of the DFAmethod. DFs are also a key part of doing any industry analysis, which cannot be performed effectivelyin their absence.DFs by nature imply change. Understanding them and their impacts requires managers to considerhow conditions will evolve in and around their industries and to consider these forces in theirdecisions and strategy.DFA tends to receive a higher than average degree of managerial agreement—particularly when themanagers are involved in the consensus process used for developing them. Senior managers oftenhave insights developed over time that can provide valuable perspectives in the DFA process. Theinclusion of managers and decision makers in the DF identification and prioritization process can bea valuable facet of getting everyone in the firm focused on the type of strategic thinking and
competitive learning that tends to serve firms well in the long run.3DFA can be done in a less data-intense fashion than many other techniques and doesn't necessarilyrequire the firm to gather data on a continual basis like many other analytical techniques do. The useof brainstorming, popular group consensus methods, and participative technology facilitates itsachievement, and it can be done on a less-frequent basis than required for many other tools while stillbeing effective.
Weaknesses and Limitations
DFA cannot drive strategy formulation alone and seldom specifically answers clients' strategyquestions. There are other steps that need to be performed before determining organizational actions(that is, strategies or tactics) even after gaining agreement on DFs. In other words, just recognizingand agreeing upon a critical driving force does not tell decision makers what they need to do, but itdoes tell them that this driving force will impact their future and that the decisions or strategies thatneed to be developed must take these impacts into account.DFs tend to be outside the control of any single firm to change. What can be done is to change how thefirm's strategy or tactics takes them into account. Firms do not manage the DFs, but instead mustmanage their own responses to them.The process used to perform DFA nearly always needs to be inclusive and participatory. This can bea problem in some firms where key personnel are not available to participate or lack the time to givethe necessary consideration to the DF development and prioritization process. Mostly due toorganizational structure reasons or internal politics, some firms have experienced great difficulties ingenerating agreements on the DFs or their prioritization.DF analysis can suffer from many of the common internal, organizational biases when they aregenerated using only internal personnel. This is because internal personnel tend to see the worldthrough the same (potentially distorted) organizational lens. As such, it is often useful to employexternal resources to reach consensus around the DFs.
Process for Applying the Technique
There are two essential steps involved in performing DFA, each of which includes a number of sub-elements that need to be performed before moving forward. The primary analytical task in performingDFA is to:
1. 1. Identify what the relevant DFs are—this requires separating the major causes of industrychange from less important ones.
2. 2. Assess the impact they will have on the industry—this involves identifying the small numberof DFs that are likely to have greatest impact on the industry and the firm over the next fewyears.

Step 1: Identifying an Industry's DFs
Some DFs are unique and specific to a particular industry's situation; nevertheless, most DFs cutacross broad swaths of the business environment. They are usually identified by the presence ofpatterns seen as events and trends, or combinations of trends that combine to create a force. Some ofthe more common DFs across various industries are shown next.4
Common Types of DFs
Changes in long-term industry growth rateChanges in who buys the product and how it is usedChanging societal concerns, attitudes, and lifestylesDiffusion of expertise across more firms and locationsElection trends, government decisions, and/or shifting regulatory influencesGrowing use of the Internet and its applicationsImportant firms that enter or exit the industryIncreasing globalization of the industryInnovation in communication and marketingInnovation in processes and productsChanges in the long-term industry growth rateMajor changes in customer needs and preferencesMajor changes in production costs and efficienciesProminent changes in uncertainty and business riskTechnological change and manufacturing process innovation
So how do you discover an industry's DFs? You should start by pruning the generated list of all thoseDFs that are not relevant to your industry. For example, if you are a wholesaler or B2B firm, you canprobably eliminate end-user type forces from the list. After eliminating the obvious ones, determine ifthere is another driving force that cannot be readily subsumed inside one of those remaining on thelist. If the answer is no, then the force should be included.Another way of trying to understand DFs is to understand how trends (that is, T1 . . . Tn) or events (E1. . . En) relate to one another and a potential driving force. This is diagrammed in Figure 20.1. Thisprocess helps you to understand the relationship between trends and events and to determine the trulyindependent driving forces as opposed to overlapping ones.Figure 20.1 Relating trends and events to a driving force
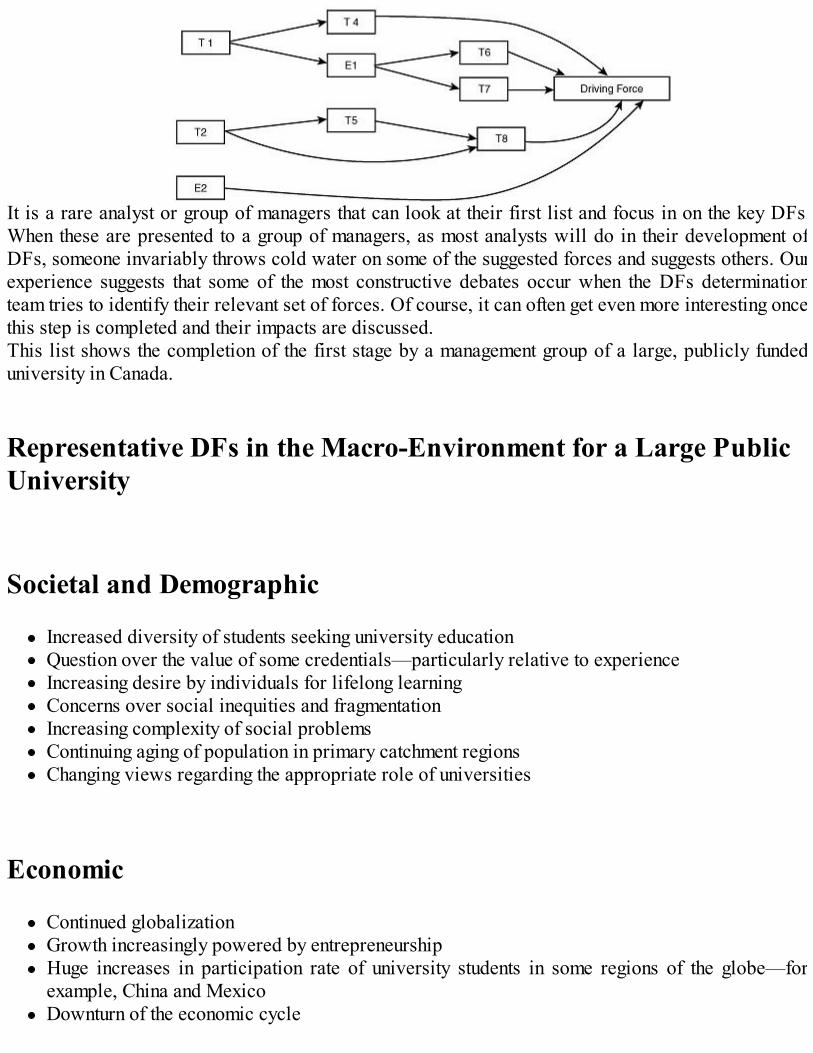
It is a rare analyst or group of managers that can look at their first list and focus in on the key DFs.When these are presented to a group of managers, as most analysts will do in their development ofDFs, someone invariably throws cold water on some of the suggested forces and suggests others. Ourexperience suggests that some of the most constructive debates occur when the DFs determinationteam tries to identify their relevant set of forces. Of course, it can often get even more interesting oncethis step is completed and their impacts are discussed.This list shows the completion of the first stage by a management group of a large, publicly fundeduniversity in Canada.
Representative DFs in the Macro-Environment for a Large PublicUniversity
Societal and Demographic
Increased diversity of students seeking university educationQuestion over the value of some credentials—particularly relative to experienceIncreasing desire by individuals for lifelong learningConcerns over social inequities and fragmentationIncreasing complexity of social problemsContinuing aging of population in primary catchment regionsChanging views regarding the appropriate role of universities
Economic
Continued globalizationGrowth increasingly powered by entrepreneurshipHuge increases in participation rate of university students in some regions of the globe—forexample, China and MexicoDownturn of the economic cycle
Rising interest rates and impact on student loans
Political
Uncertainties in direction of public support for universitiesDeclining public fundingIncreasing governmental demand for accountabilityIncreased student activism due to raised tuition fees
Technological
Increasing demand for distance learning availabilityOrigination of new pedagogical platformsExpanded use of information technology in and out of the classroomEscalating rates of innovationIncreasing value placed on knowledge
This list illustrates a typical array of factors to emerge from this step. We recommend that the analystcomplete at least one other iteration to reduce these even further, prior to assessing their relativeimpact in Step 2. At the end of this step, the analyst should have a manageable list of DFs to consider.Our experience suggests that the list should be in the range of five to 10 forces to facilitate the nextstep of this analysis process.
Step 2: Assessing the Impact of the DFs
Step 2 will require a more intense analytical effort than Step 1 because DFs that remain on the listfrom Step 1 are all deemed to be important to some degree to the success of your industry and firm.All firms need to offer customers in their target markets products or services that meet their needs in aprofitable manner, and the forces already identified impact all rivals in the industry. Now rank theseDFs in order of their importance in driving the attractiveness of the industry, the level of profitabilitythat may be achieved in the near future, and provide a context in which strategy changes can beconsidered and thoughtful decisions made.The analyst's objective in this second step is to understand the external factors that will shape changein the industry and the difference these factors will make to it. Once the DFs have been identifiedfrom Step 1, the analyst needs to ask the following questions:
Are they valid?How do we know?How significant are each of them?
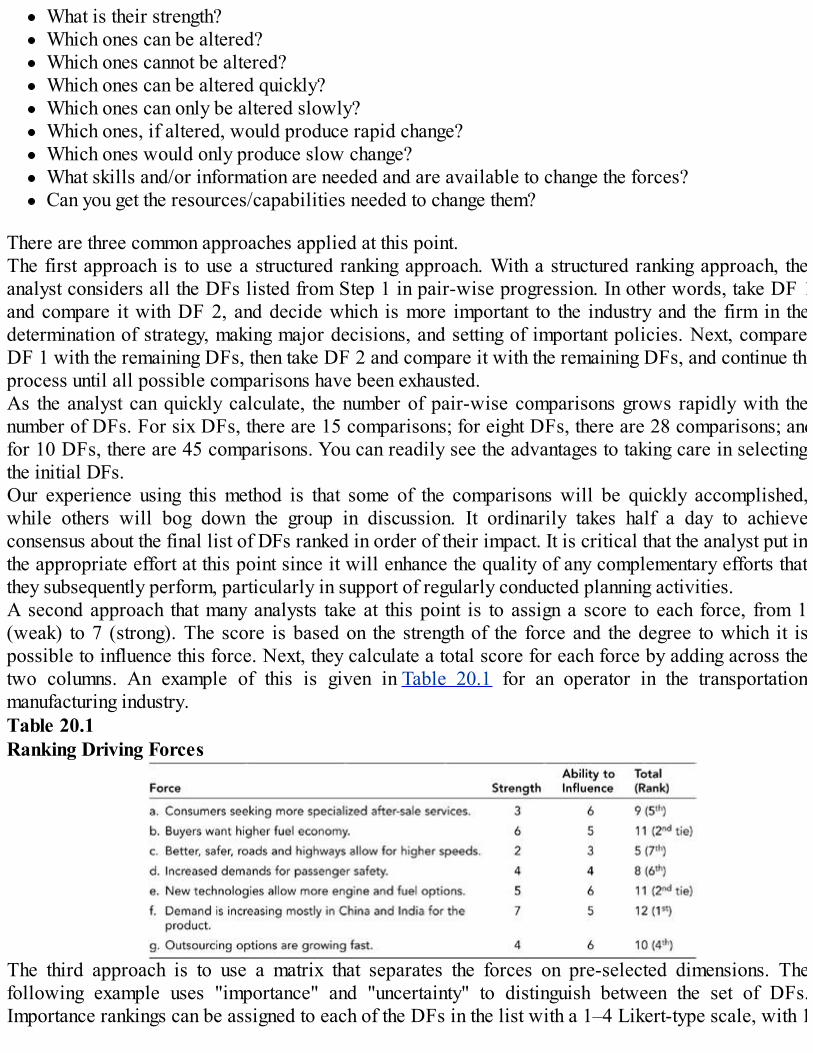
What is their strength?Which ones can be altered?Which ones cannot be altered?Which ones can be altered quickly?Which ones can only be altered slowly?Which ones, if altered, would produce rapid change?Which ones would only produce slow change?What skills and/or information are needed and are available to change the forces?Can you get the resources/capabilities needed to change them?
There are three common approaches applied at this point.The first approach is to use a structured ranking approach. With a structured ranking approach, theanalyst considers all the DFs listed from Step 1 in pair-wise progression. In other words, take DF 1and compare it with DF 2, and decide which is more important to the industry and the firm in thedetermination of strategy, making major decisions, and setting of important policies. Next, compareDF 1 with the remaining DFs, then take DF 2 and compare it with the remaining DFs, and continue theprocess until all possible comparisons have been exhausted.As the analyst can quickly calculate, the number of pair-wise comparisons grows rapidly with thenumber of DFs. For six DFs, there are 15 comparisons; for eight DFs, there are 28 comparisons; andfor 10 DFs, there are 45 comparisons. You can readily see the advantages to taking care in selectingthe initial DFs.Our experience using this method is that some of the comparisons will be quickly accomplished,while others will bog down the group in discussion. It ordinarily takes half a day to achieveconsensus about the final list of DFs ranked in order of their impact. It is critical that the analyst put inthe appropriate effort at this point since it will enhance the quality of any complementary efforts thatthey subsequently perform, particularly in support of regularly conducted planning activities.A second approach that many analysts take at this point is to assign a score to each force, from 1(weak) to 7 (strong). The score is based on the strength of the force and the degree to which it ispossible to influence this force. Next, they calculate a total score for each force by adding across thetwo columns. An example of this is given in Table 20.1 for an operator in the transportationmanufacturing industry.Table 20.1Ranking Driving Forces
The third approach is to use a matrix that separates the forces on pre-selected dimensions. Thefollowing example uses "importance" and "uncertainty" to distinguish between the set of DFs.Importance rankings can be assigned to each of the DFs in the list with a 1–4 Likert-type scale, with 1

being assigned to the DFs of "lowest importance" and 4 being assigned to the DFs of "highestimportance." The same process can be used for "uncertainty," whereas 1 is assigned to DFs with the"lowest uncertainty" and 4 is assigned to the DFs of "highest uncertainty" in terms of their depth,direction, impact. and/or evolution. Those with mean scores above 2.5 in the relevant range are rated"high" in Table 20.2, while those scoring below it are rated as "low."Table 20.2Importance Ranking of Driving Forces
Regardless of which of the three approaches is taken, another key facet of this stage is to determinewhether these DFs are acting to make the industry environment more or less attractive; as such, theyshould be combined with an industry analysis, possibly using the Porter's Five Forces model5 or theNine Forces/Industry Analysis (see Chapter 6) or something similar. Four questions related to theDF's impact on the industry environment that must be answered are as follows:
Are the DFs causing demand for the industry's product to increase or decrease?Are the DFs making the bargaining power of other industry participants higher or lower?Are the DFs acting to make competition more or less intense?Will the DFs lead to higher or lower industry profitability?
The case study provides an illustration of DFA as it is applied to the digital music player industry.This newly emergent industry is an interesting case study for DFA because in 2006, it was still in arelatively early stage of its life cycle relative to the use of players for MP3 digital file formats, aswell as being a spin-off of portable music players that used to play music formatted on CDs, whichare in a mature stage of their life cycle.Once the analysts have performed these steps, their next task is to decide whether (strategic ortactical) actions taken to change the firm's strategy to address the driving force are feasible or not. Ifso, their goal is to devise a manageable course of action that does the following:
Strengthens areas where DFs have positive impacts on the industry and firm.Creates organizational buffers for areas in which DFs have adverse impacts.Creates areas in which neutral DFs may eventually result in benefits.
At this point, it is usually helpful for the analyst to develop another set of tables, one for each of theDFs that has been identified as a priority. For each of these tables, outline in the first column therange of likely impacts that the DFs are expected to have on the industry. In the second column, begin

identifying potential solutions that the firm may bring to bear in constructively addressing (that is,minimizing the negative effects and maximizing the positive effects of) the impact. The tables shouldlook similar to what is shown in Table 20.3.Table 20.3Impact and Proposed Solutions for Driving Force 1
The next step would require the analysts to work through each of the proposed solutions. They wouldneed to compare these options in terms of costs/benefits, risks/benefits or via a pre-determined set ofcriteria used for assessing the relative attractiveness and value of the options. Comparing themagainst the current strategy of the firm is another key task to perform at this point in order to gauge thedegree of the change required should the firm adopt the proposed solution, as well as the likelihoodthat the firm could implement it effectively; and the final task is to analyze and identify the nature ofcompetitor responses that the action may engender.
Summary
Sound analysis of an industry's DFs is a prerequisite to good strategic decision making. What shouldbe noted is that DFs and competitive pressures do not affect all competitors in an industry in the samemanner. Profit prospects vary from rival to rival based on the relative attractiveness of their marketpositions and their strategies in addressing the DFs.
Case Study: The Digital Music Industry
This case study provides an example of DFA as applied to the digital music player industry in 2006.What are the major DFs affecting the digital music player industry? Are the forces indicating a moreor less attractive industry environment from a profitability standpoint?Growth in levels of demand. A side from being the most popularly given category of gifts during the2005 holiday season globally, figures released by the organizers of the Consumer Electronics Show(CES) in Las Vegas, Nevada, in January 2006, showed that sales of MP3 players soared by 200percent in 2005 to USD$3 billion or £1.73 billion.6 As these figures, plus related recent sales figuresand the media "buzz," will attest, both the digital music player market and the market for digital musicare expected to continue experiencing healthy growth. As technological advances spur theenhancement of the devices with more and more valuable features, sales both to new users as well asexisting device owners will continue to remain robust.Product innovation. Frequent product innovation is another characteristic of the industry.7 Thisproduct innovation is largely focused on new product designs; enhanced functionality; and aestheticsthat make the products more portable, pleasant to look at (that is, some of these items are viewed as"status symbols" when worn by their owners in some parts of the world), and easier to use. Firmscontinue to add useful features to MP3 players such as telephone capability, video-playing capacity,appointment schedulers, contact databases, and photographic capabilities. Many of the manufacturersare known for their product innovation capabilities, including Apple, Creative, Microsoft, Samsung,and Sony, among others.Format war and rights management. There are multiple formats of MP3 digital music files, someof which can only be played on the format owner's own devices. RealNetworks offers its ownformats, which also support Apple's basic format of choice, AAC, but does not support the extendedproprietary version of AAC, which integrates an Apple-developed digital rights management systemcalled FairPlay. Microsoft continues to promote its Windows Media Audio (WMA) standard that itwould like to see emerge as the industry standard. Sony music players only work with theirproprietary software. Fighting digital piracy and promoting fairness in using files, while making sureartists and music firms are properly compensated for their rights, remains at the heart of an ongoingglobal regulatory battle.Convergence. Coupled with product innovation, firms are increasingly working to make MP3 playersand other personal electronics more versatile. For example, Apple developed the iPod Photo thatallows users to transport and display photos; cell phone makers, such as Sony and Nokia, aredeveloping MP3-compatible sets; and personal digital assistant (PDA) makers, such as HP andPalmOne, have or are developing PDAs with phone, game, MP3 playing, and digital photographycapabilities. Most traditional home stereo manufacturers already offer stand-alone players that canplay MP3 formats. Finally, MP3 playing capabilities are being increasingly included in newautomotive stereo products, adding a different form of portability for playing music (at far higherspeeds than while walking).Growing use of the Internet. The increasing global adoption of broadband Internet service will helpdrive the market forward by increasing the source of supply and demand for the music to be played onthe industry's devices. This also creates a need for a portable method for maintaining one's MP3collection. This factor could especially benefit the manufacturers whose players are identified withpopular subscription services. The ability to download a large amount of music in a relatively shorttime is a success factor for that segment of the MP3 value chain. Growing use of the Internet will alsolead to better informed and more MP3-amenable customers.

Changes in who uses the product and how it is used. An increasingly diverse, global customerbase is using the industry's products in more varied ways. The industry's products are moving up theproduct life cycle from the early adopters to the mainstream; consequently, users are becoming lesstechnologically sophisticated and more demanding on functionality, style, and price. This alsochanges the nature of tactics and strategies that the major players in the industry will use in order tobe successful, particularly around areas like pricing, promotion, advertising, manufacturing, andbranding concerns.8The effect of DFs in this market can also be further analyzed by answering the following fourquestions:
1. 1. What is the effect of the DFs on demand?—Virtually all of these changes should increasethe level of demand for the industry's products. Increasing product innovation, especially in thearea of convergence with PDA or telephone functionality, should lead to higher demand,especially from existing device owners. Growing use of the Internet should also be a demanddriver, as it increases the volume of content available, as well as the population of individualswho can potentially use the product.
2. 2. Are the DFs making the bargaining power of other industry participants higher or lower?—The resolution of the digital rights issue will clearly empower some players, whether it willbe consumers who will have liberalized choice options for their digital music enjoyment, recordfirms, and/or artists. Also the eventual resolution of the format wars will also clearly empowersome industry participants while neutralizing the prospects of others. As such, there remains ahigh degree of uncertainty surrounding the resolution of this driving trend; however, it will havea significant impact on some firms, and industry participants will need to develop flexiblestrategies and contingency plans in case the trends go against their current strategy.
3. 3. Are the DFs increasing competition?—There is no doubt that the increased demand for andincreasing profitability of products like Apple's iPod will entice new and potentially powerfulelectronics manufacturers into the industry. The threat of new entrants is a key factor in therivalry among sellers in the market. The high threat will cause the current players to competeagainst both each other and possible new entrants, specifically in the area of product innovation.
4. 4. Will the DFs lead to higher profitability?—New entrants are expected to arise in the market,which will in turn increase supply. Demand will continue to be increased due to productinnovations, market growth, and the increased evolution and advancement in Internet usageglobally. It will be interesting to see whether demand or supply will be the stronger force in thecoming years. It is reasonable to conclude that profitability will likely be based more on volumethan margin in the future. This is a natural occurrence as a market matures. However, the rapidexpansion of the market should help to prevent price wars from cutting margins to too great adegree. Because of these factors, the market should still be profitable at least in the short term,especially for firms that can add innovative features to their products that appeal to the moremainstream users.
FAROUT Summary

Figure 20.2 Driving forces analysis FAROUT summary
Future orientation—High. The emphasis on continued monitoring and forward-orientedconceptualizations, with its natural links to strategic planning that underlies applications of this tool,infer a future orientation.Accuracy—Medium. Gaining consensus on the DFs impacting an industry tends to be fairly easy, butdetermining how to address them is where accuracy will suffer.Resource efficiency—Medium. Generating the broad and comprehensive range of data needed toidentify and gain group consensus of the DFs can be resource intensive, particularly where externalexperts (futurists, advisors, and custom industry data sets) need to be acquired and organized.Objectivity—Low to medium. The degree of objectivity will depend on which discovery methodshave been used. If an analyst has relied primarily on secondary data or less-experienced respondents,the objectivity will be lower.Usefulness—Medium to high. The notion of DFs links directly to industry analysis, performancemeasurement, and strategic planning. DFs emphasize the need to change strategy and resourceallocation decisions to reflect changing environmental conditions; as such, decision makers find itvery useful.Timeliness—Medium. The initial process of identifying and determining the importance of DFs canbe time consuming, particularly to the extent that broader participation in their determination issought. Once they are identified, they are quick and easy to use unless the industry environment isundergoing a dramatic change.
Related Tools and Techniques
Competitive positioningCritical success factor analysisEvent and timeline analysisIndustry analysisIssue managementLinchpin analysisPEST/STEEP analysisScenario analysisStrategic group analysisWar gaming

References
Albrecht, K. (2000). Corporate Radar: Tracking the Forces That Are Shaping Your Business. NewYork, NY: AMACOM.Fahey, L., and R.M. Randall (1998). Learning from the Future: Competitive Foresight Scenarios.New York, NY: John Wiley & Sons.Fleisher, C.S., and B.E. Bensoussan (2003). Strategic and Competitive Analysis: Methods andTechniques for Analyzing Business Competition. Upper Saddle River, NJ: Prentice Hall.Hermida, A. (2006). "Music players lead digital surge," January 4 on BBC's Web site, found athttp://news.bbc.co.uk/1/hi/technology/4580244.stm.Lewin, K. (1951). "Field theory in social science; selected theoretical papers." D. Cartwright (ed.).New York, NY: Harper & Row.Marino, L., and K.B. Jackson (2006). "Competition in the digital music industry," c88–109 inThompson, A.A., Gamble, J.E., and A.J. Strickland. Strategy: Winning in the Marketplace, 2nd
edition. New York, NY: McGraw-Hill.Thompson, A.A., Gamble, J.E., and A.J. Strickland (2006). Strategy: Winning in the Marketplace,2nd edition. New York, NY: McGraw-Hill.Tregoe, B.B., and J.W. Zimmerman (1980). Top Management Strategy: What It Is and How to MakeIt Work, New York, NY: Simon & Schuster.Tregoe, B.B., Zimmerman, J.W., Smith, R.A., and P.M. Tobia (1989). Vision in Action: Putting aWinning Strategy to Work. New York, NY: Simon & Schuster.Wack, P. (1985). "Scenarios: Shooting the rapids," Harvard Business Review, 63(6), pp. 139–150.Wilson, I. (1992). "Realizing the power of strategic vision," Long Range Planning, 25(5), pp. 18–28.Wilson, I. (1994). "Strategic planning isn't dead—It changed," Long Range Planning, 27(4), pp. 12–24.
Endnotes
1 See Fleisher and Bensoussan (2003), Chapter 18.2 Fahey and Randall, 1998; Wack, 1985; Wilson, 1992; 1994.3 Fahey and Randall, 1998.4 Thompson, Gamble, and Strickland, 2006; Tregoe, Zimmerman, Smith, and Tobia, 1989.5 See Fleisher and Bensoussan (2003), Chapter 6.6 Hermida, 2006.7 Marino and Jackson, 2006.8 See Fleisher and Bensoussan (2003), Chapter 23.

21Event and Timeline Analysis
Short Description
Event and timeline (E&T) analysis is a group of related techniques that display events sequentially ina visual manner. Event analysis isolates external events and highlights trends, commonalties, andaberrations in competitor or other-actor behavior. When done systematically, E&T analysis canuncover important trends about a firm's competitive environment and serve as an early-warningfunction by highlighting when a competitor or another market player is straying from its normal courseof behavior.
Background
Throughout history, different cultures have displayed diverse beliefs about the nature of time. It canalso have an important place in the nature of competition between rivals in the marketplace.Timelines of historical events (the linking particular units of time with specific events) are graphicrepresentations of how individuals in secular society characterize time. A timeline displays asequence that points to things that have already occurred, things that are occurring (the present), andthings that have not yet occurred (the future).The direction implied by the timeline says that time and history proceed forward in a line, not in acircle. Portrayed in a line in this fashion, specific events in history are always unique and are neverrepeated in the same manner. History invariably incorporates change, yet past patterns are oftenreplicated to some degree in the present and future.The study of events and time in organizations and in economics1 provides an explanation of the past,present, and future of industries and companies, how and when organizations respond toenvironmental factors, whether organizational decision makers are impacted adversely by inertia ormomentum, and other developmental phenomena. Other common uses for E&T analyses include thedeconstruction of criminal events by policing organizations, reasons why accidents have occurred, theways in which terrorists might attack a sovereign state, and other forms of intelligence applications.E&T analysis as presented in this chapter is a technique that most analysts probably already employ,though ordinarily not with the rigor and discipline that it requires. E&T analysis entails the systematiccharting of events related to the subject in question. The analysis can take the form of a graph, chart,table, or line, among other formats.E&T analysis is a way to chart the order of how companies perform certain activities, label theinformation spun off from these activities, and place that information into an analytical framework.Most business processes, including mergers and acquisitions, market entrances or exits, strategicrelationship developments, or major market movements, follow a known pattern. These patterns maydiffer from firm to firm, and even within the firm over time if the patterns are studied and improved;
nevertheless, most businesses attempt to document these patterns and improve major processes. Theydo this to promote learning over time. These efforts are commonly part of knowledge managementinitiatives and allow firms to seek greater efficiency in the performance of the process as opposed toconstantly "reinventing the wheel."
Strategic Rationale and Implications
Even the simplest of tools can help illuminate many competitive analytical issues. When the amount ofdata and information regarding a specific rival's activities or an event overwhelms an analyst's abilityto understand patterns and spot trends, it is beneficial to employ a clear chronology, such as thatcalled for E&T analysis.E&T analysis helps you to study data in a chronological and evolutionary context. Instead of justseeing "event 3, event 6, event 5, event 9, and so on," E&T assists in establishing a pattern—events1,2,3, . . . n, and so on. This is particularly helpful since most of the information is gathered in anasynchronous fashion, and much of it, particularly that which is gathered over the WWW, lacksspecificity in terms of dates (for example, year, month, season, quarter, or day) or times.The presence of specific sequences in a timeline, where some events happen before others, cansuggest the possibility of cause and effect—events exist in a relationship with one another; that is, in aparticular context. Timelines suggest turning points, linear trends, and also progressions. Thus,making a timeline allows one to plot events in a graphic way, to see potential relationships, to helpspur memory, and to grasp sequence. In the process, culling certain items from the many possibledates or events sharpens one's appreciation for the dates or events that are necessarily excluded.Simple chronologies of competitive activity within an industry, an isolated look at patterns evidentfrom recent acquisitions, or a geographical representation of competitor activity all make forexcellent E&T analysis applications.
Strengths and Advantages
E&T analysis is a basic technique that is most useful in answering "when is (X event) going tohappen?" It is nearly always taught to individuals at some point in any basic educational program and,as such, should not require as much training time to master as some of the more sophisticated tools itoften complements.There are a variety of software applications to support the analyst performing E&T analysis. Theseprograms are relatively inexpensive and can usually be mastered quickly. Many project managementsoftware applications can also be used by business and competitive analysts in performing thistechnique. Some applications of E&T analysis allow for a statistical examination of the collecteddata through time series analysis techniques that attempts to determine correlations between particularevents.E&T analysis is best used when dealing with a large number of discrete events that are spread over along period of time or are otherwise obscured. It allows you to visualize a sequence of events andmore easily see patterns than other more sophisticated forms of analysis. It is one of the best tools
available for sorting out and making sense of a large number of events.Often used as a planning aid, E&T analysis is highly supportive of, and is complementary to, otheranalysis techniques. When used in combination with other techniques, such as activity flow charts,event flow analysis, linchpin analysis, or the analysis of competing hypothesis process that are not asfocused on answering when some event will occur, it can add the evolutionary element that the othertechniques overlook.Used in combination with other techniques for supporting a client's strategic decision, E&T analysiscan help you achieve, among others, the following objectives:2
Spot relationships among multiple organizational actors.Identify trends and patterns over time.Spot discontinuities.Differentiate between the analysis of the facts and the resultant conclusions.Evaluate the factual basis of possible recommendations.Identify matters requiring further analysis and examination—significant event blocks with vagueor non-existent causal factors can alert the analyst to the need for additional fact finding andanalysis.Understand the relationships among primary and secondary forces impacting an event.Weigh discrete events.Anticipate likely future events.
Weaknesses and Limitations
E&T analysis requires determining which events should or should not be included in the timeline. Ifthis decision is made too narrowly (too exclusive), then important patterns in events may not berevealed. If you are too inclusive, you may be overwhelmed with data that makes it too complex toassess or will require additional time to perform the subsequent pattern deciphering task.Determining the event constituting the starting point of a timeline can be difficult. You don't want toset the starting event either too early and include extraneous events in your analysis or too late andmiss milestone events that should be considered. This difficulty is often addressed through thedevelopment of multiple starting points and trial and error.Non-events (events that did not occur) can often be the most important facets of a timeline and may beoverlooked in the process of gathering data. Decisions not made or action not taken can often be justas, if not more, important than those that escaped the analyst's notice in less-sophisticated datagathering or analysis efforts associated with the use of this technique. You must also properlydistinguish milestone events from less significant events in the population being studied.The determination to use E&T analysis tends to be after a key event has occurred so that an analystand decision maker can deconstruct the pattern of activities that occurred leading up to a criticalevent. This is done in order to help executives learn from the pattern and to help prevent itsreoccurrence. For it to serve a strategic purpose and be of predictive value, E&T analysis needs to bedone well in advance of key decisions or events.It can be difficult to project what will occur in the future, and you need to articulate assumptions
clearly when projecting. Conditions, driving forces, and trends are often not captured or not capturedaccurately in some E&T analyses. You must fight the temptation to extrapolate events along a similarpath when conditions or drivers are changing. You must also fight the temptation to be overlyoptimistic in anticipating that something will happen or to be too pessimistic in predicting thatsomething will occur later than reasonable probabilities would suggest. As in all forms of analysis,you must be careful to weigh the data, facts, and evidence carefully so as to avoid imputing causationwhere none or little exists, or lack of causation when it does actually manifest itself—that is,avoiding type 1 errors (false positives) and type 2 errors (false negatives).
Process for Applying the Technique
Organization of event data should begin with construction of a timeline. The timeline orders eventsprogressively. Transcribing onto paper what happened and when it happened can provide you with aclear picture for understanding a focal topic and how it evolved. The format of the timeline can be assimple as making a list of what happened and when it happened. Small "post-its" can be used to makea chain of events, with a sentence describing what happened and when it occurred on each post-it.This latter method is preferred since it is more easily expanded. Times and dates of events could alsobe entered into a computer database, spreadsheet, or word processor and sorted chronologically.This is commonly done in most E&T analysis applications, and the digitalization of this data canmake it more effective for future retrieval and sorting. Last, there are tailored programs that areexpressly designed for performing E&T analysis and allow for archiving information about the eventsand for producing visualizations of the eventual product.In the material immediately to follow, we present several E&T analysis techniques that are used bybusiness and competitive analysts. We begin with the simplest of them—the development of the basictimeline, and proceed to more complex applications like chronological tables, events matrices, andevents and causal factors analysis techniques. To finish this section, we provide a case study showinga competitive analysis application of E&T analysis.
Plot the Target Firm's History of Key Events on a Line
Based on our experience, we recommend using the following generic 10-step process for creating thetimeline in a graphic format. We also briefly describe how to develop it in a tabular format—otherwise known as a chronological table—at the end of this section. Most of these steps need to becarried out independently for each timeline, although some of these steps may be further consolidateddepending on the nature of the question you are examining.
1. 1. Decide what the timeline will show: major events, market expansions, product introductions,events related to a geographic area, randomly chosen events, and so on.
2. 2. Make a comprehensive list of events that you wish to put on the timeline. This will requireyou or others to gather the population of events that are associated with the subject matter beingfocused on.
3. 3. Consider how you will choose events to include and exclude from the final timeline. Not all

events will be of equal importance in developing an understanding of the evolution of a firm'sdecisions and/or actions. As such, it is important that you define the rules to use for excludingand including events for consideration. The ultimate criteria employed for this task is that theseshould be based on the client's critical intelligence needs or topics.
4. 4. Research and note the specific dates when the events that you wish to include occurred. It is agood idea to make a detailed note of your source(s) so that you can later verify the dates or thedetails of what transpired. As well, background documentation should be maintained in separatefiles for each event, should further examination or inquiries of the events be required.
5. 5. List the chosen events in a chronology. A chronology is a sequence that starts with the earliestitem and ends with the most recent one. Make a special note of the earliest and latest dates thatyou wish to include. This will also allow you to determine the period of time that their timelinewill cover.
6. 6. Decide what units of time you will use (days, months, quarters, years, decades, and so on) todivide the timeline into segments. These decisions may be a matter of trial and error. Calculatethe number of segments that your timeline will have.1992 to 2007 = 15 years total/1 segment/year = 15 segments
7. 7. Draw a line and divide it into the number of equal segments that you figure you will need.
8. 8. Put the dates on the appropriate segments, from left to right
9. 9. Using the chronology that you made of events and dates, figure out where they would fall onyour timeline. It is useful to devise a scheme for how you mark and label them. For instance, youcould write certain symbols (for example, $ for acquisitions and * for alliance formations) onthe timeline, attach different colored labels, or make a code that refers back to your chronology.
10. 10. If there is no room on your timeline to include all of your chronology, cull some of the datesor make a timeline with larger segments (for example, one timeline for events in the firm's homecountry and one for events that take place outside its primary market). If your dates can bedivided into two or three smaller categories or themes, try making parallel timelines withidentical segment sizes. You can then see how the theme develops, and you can also comparetwo or more themes at a time.
Develop a Chronological Table of Events
"Event flow analysis" is the compilation and analysis of data and information relating to events asthey have transpired over time. It allows you to draw conclusions and make recommendations basedon your analysis and is commonly used in relation to one specific action or event by a competitiverival, where the important events leading up to the event are noted.A popular way of performing E&T analysis is in tabular format, typically with three columns thatcontain the dates that events occurred, basic descriptions of the events, and data indicating the sourceof information concerning the event. These are often supported by digital files that are searchable onintranets designed for tracking particular competitors or other intelligence targets (see Table 21.1).

Table 21.1Illustration of a Chronological Table
Develop an Events Matrix
An events matrix is particularly useful for looking at multiple rivals, best exemplified by rivalswithin one's own industry. In this technique, you list the rivals in the first column of the matrix andarray the timeline segment across the top. Critical events pertaining to the industry rivals are then putin the cells. This method can be particularly helpful for identifying relationships between rivals andevents (see Table 21.2).Table 21.2Events Matrix
Event and Causal Factors Analysis
Experience has shown that major market events are rarely simple and almost never result from a
single cause; instead, they are typically multi-factorial and develop from clearly defined sequences ofevents. You need to identify and document not only the events themselves, but also the relevantconditions affecting each event in an event sequence.Event and causal factor (ECF) charting is a technique that displays the events sequentially in a visualmanner using squares, ovals, and arrows to show the relationship between events important to theproblem and potential causes of the problem. It displays the reason why each event occurred.To accomplish this, a simple straightforward approach can be used that breaks down the entiresequence into a logical flow of events from the beginning of the market event development. It isimportant to realize that the end point may be defined either as the event itself or as the end of thefirm's response phase. This flow of events will not necessarily lie in a single event chain, but mayinvolve confluent and branching chains. In fact, the analyst often has the choice of expressing theevent's sequence as a group of confluent event chains, which merge at a common key event, or as aprimary chain of sequential events into which causative factors feed as conditions that contribute toevent occurrence, or as a combination of the two.Construction of the ECF chart should begin as soon as the analyst or decision maker begins to gatherfactual evidence pertinent to the event in question. As already discussed, the events and causal factorswill usually not be discovered in the sequential order in which they occurred, so the initial ECF chartwill be only a skeleton of the final product and will need to be supplemented and upgraded asadditional facts are gathered. Although the initial ECF chart will be incomplete and contain manyinformation deficiencies, it should be started as close to the market event as possible because of itsinnate value in helping to:
Organize the event dataGuide the subsequent assessment processIdentify and validate factual findings, probable causes, and contributing factorsSimplify organization of the resultant reportValidate and confirm the actual event sequenceIllustrate the event sequence in the report provided to decisions makers
With all its virtues as an independent analytical technique, ECF analysis is most effective when usedwith other E&T analysis tools that provide supportive correlation or no confirmation. Further, ECFcan be the framework into which the results from other forms of analysis are integrated. Anappropriate combination of the major E&T analytic tools, including ECF analysis, provides the corefor a good, triangulated analysis process.Figure 21.1 illustrates the conventions of performing the ECF analysis charting technique.3Figure 21.1 Process for performing ECF analysis

Secondary event sequences, contributing factors, and systemic factors should be depicted onhorizontal lines at different levels above or below the primary sequence (see Figure 21.2).Figure 21.2 General ECF analysis chart format
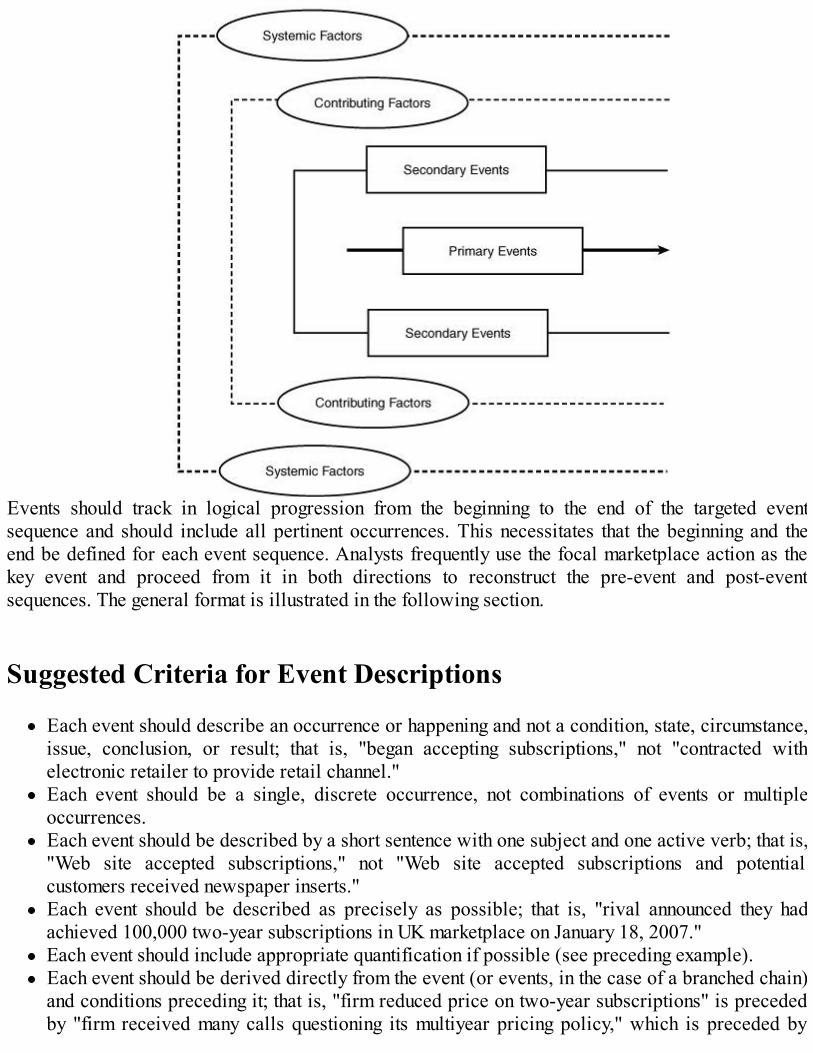
Events should track in logical progression from the beginning to the end of the targeted eventsequence and should include all pertinent occurrences. This necessitates that the beginning and theend be defined for each event sequence. Analysts frequently use the focal marketplace action as thekey event and proceed from it in both directions to reconstruct the pre-event and post-eventsequences. The general format is illustrated in the following section.
Suggested Criteria for Event Descriptions
Each event should describe an occurrence or happening and not a condition, state, circumstance,issue, conclusion, or result; that is, "began accepting subscriptions," not "contracted withelectronic retailer to provide retail channel."Each event should be a single, discrete occurrence, not combinations of events or multipleoccurrences.Each event should be described by a short sentence with one subject and one active verb; that is,"Web site accepted subscriptions," not "Web site accepted subscriptions and potentialcustomers received newspaper inserts."Each event should be described as precisely as possible; that is, "rival announced they hadachieved 100,000 two-year subscriptions in UK marketplace on January 18, 2007."Each event should include appropriate quantification if possible (see preceding example).Each event should be derived directly from the event (or events, in the case of a branched chain)and conditions preceding it; that is, "firm reduced price on two-year subscriptions" is precededby "firm received many calls questioning its multiyear pricing policy," which is preceded by
"firm tried to discourage one-year subscriptions by pricing this term at 10 percent less than two-year term for same options." The idea here is that each event is derived logically from the onepreceding it. When this is not the case, it usually indicates that one or more steps in the sequencehave been left out.Conditions differ from events insofar as they: (a) describe states or circumstances rather thanhappenings or occurrences; and (b) are passive rather than active. As far as is practical,conditions should be precisely described, quantified where possible, posted with time and datewhere possible, and derived directly from the conditions immediately preceding them.
E&T analysis is a tool that helps you bring logic and order to data, typically in the form of a timeline,chart, or table. The timeline subsequently becomes input and a complement to other analysistechniques. It is also an important part of the analyst's report on the focal firm or event, since itexplains what occurred and the sequence of occurrence. Thus, the final timeline must be writtenclearly and correctly so that the decision makers who use the analyst's report will understand it. Last,but importantly, E&T analysis methods truly are an essential element in any analyst's tool kit and canbe employed for a myriad of different analytical purposes.
Case Study
The following case study4 provides a detailed description of how E&T analysis can be used toanswer a question posed by a strategic decision maker. It describes how an analyst identified severalmonths in advance, when and in what quantities, a rival competitor would be releasing a competitivegeneric pharmaceutical product into the marketplace and how the decision makers used thisinformation in planning tactics to counter and lessen the adverse market impact of the pendingintroduction.
Timelines in Competitive Analysis
A pharmaceutical company had learned that a competitor received U.S. Federal Drug Administration(FDA) approval for the potential marketing of an over-the-counter (OTC) drug that directly competeswith one of its own OTC consumer products. This stage of FDA permission only permits the rivalfirm to prepare its manufacturing facilities for FDA production quality inspection, in advance ofgetting a potential final FDA approval for marketing the drug, which is expected within the next year.The focal firm wanted to know exactly the date of the launch time, as well as the quantity of productto be launched. This insight would give the client firm the time and ability to accurately develop apre-emptive marketing strike, using some responsive advertising and pricing tactics. The client firmstood to lose millions of dollars and market share if its decision makers failed to identify the natureand timing of this introductory window being opened by the rival.The nature of the problem usually indicates the nature of the analytical solution. In this instance, theclient's concern centered around "time." "How long," the client wanted to know, "will it take for thecompetitor to introduce its product?" FDA approval only signaled a warning, not the actual product

launch date. The analysts needed to find a way to link the element of time with the release ofinformation about the competitor. The method they chose to generate a solution was to timeline thesituation.
Development of the Timeline
1. Identify Each Process Taking Place
The analyst needed to understand each piece of equipment and how it worked, along with theexpertise and personnel required by the rival firm at each major stage of the process. The client tookthe analyst on a detailed tour of one of its plants. This allowed the analyst to learn about each majorpiece of equipment and its purpose. The client also introduced the analyst to key employees in itsengineering, marketing, and production units. They helped answer the analyst's technical questions.The manufacturing details received during these internal client interviews were what later helped theanalyst to project the competitor's production volume up to one year into the future, which wasparticularly helpful since the rival's plant had not opened yet.Because the FDA must certify all production equipment for quality control, it was important tounderstand the machinery being used. These process details were important for the analyst to probefor details on the timing of the expected product launch. Some of the process details and themachinery used are described next.Table 21.3Basic Steps in Producing Over-the-Counter Pills
2. Collect the Data
Data was gathered from a variety of sources, including news, interviews, and FDA documentation. Itcame in randomly as it was found. Some examples of what was found included the following:
An estimate from the client of the level of inventory a manufacturer must have in order toprepare for this kind of product roll-out.

The number of pills expected to be packaged per bottle.Three different bottle sizes of 24 pills, 50 pills, and 100 pills would be used as well as theestimated dosage.The first shift for the plant was already being recruited.A firm estimate of the expected production yield over the course of the start-up period beforeroll out.Equipment manufacturers and, through interviews, an identification of likely key equipment to beused.The granulator's capacity.The rival's chosen brand name for the product.
The analyst began developing the pattern of activities under the timeline during the data collectionphase. This was accomplished by combining the gathered information with the analyst's views and indialogue with the client.
3. Organizing the Data over Time; Develop the Timeline
The analyst next mapped the sequence of events involving the focal process, particularly which eventcame first, second, third, and so on. The following describes the timeline sequence for theprospective roll-out.Table 21.4Major Steps in the Sequence of a Drug Roll-Out
The analyst had to support the pieced-together timeline with more corroborating data before drawingconclusions. This required additional data gathering in the form of interviews of other industrycontacts, such as corrugated box manufacturers, graphic designers, packaging materials suppliers,retail buyers, and trucking/shipping companies, among others. The gathered information becameintelligence when the analyst assembled it using the timeline.

4. Draw Conclusions
The analyst was able to project how long it would take for the competitor to stockpile enough pills tolaunch the product by combining knowledge of the plant's actual FDA certification date and hiringinformation with the time it would take for the new employees to produce products at a certain yieldrate. The intelligence produced by the analyst was an estimated six- to seven-week product launchwindow, which helped the client to successfully plan a pre-emptive strategy by flooding the marketwith discount coupons, special institutional promotions, and related sales activity.5
FAROUT Summary
Figure 21.3 Event and timeline analysis FAROUT summary
Future orientation—Medium to high. E&T analyses array items over time. They are designed to helpanalysts better understand past events in order to predict the future.Accuracy—Medium to high. This method is typically more accurate than others because it relies onthe analyst using and organizing empirical events. To the extent that the analyst has accurate andverifiable data, the technique should result in higher than average accuracy.Resource efficiency—Medium to high. Much of the information needed to perform this technique canbe found in open, public sources. For more specific purposes, it may also require other forms of datacollection, particularly primary collection methods.Objectivity—Medium to high. This technique does not suffer from potential biases that most othertechniques do, in that the only real subjective choice comes from deciding which events to include orexclude from the timeline. The level of objectivity is also lowered when doing advanced applicationsrequiring identification of drivers, conditions, or primary and secondary causal factors.Usefulness—Medium. Although this technique is complementary to many others, it requires a lot ofanalytical manipulation to help clients use it "out of the analyst's box."Timeliness—Medium. The gathering of the data and organization of it underlying this technique, aswell as arraying it in a timeline and placing it in easy-to-communicate formats, can be timeconsuming.
Related Tools and Techniques

Activity flow chartingCompetitor profilingDriving forces analysisEvent flow analysisEvent matrix analysisForecastingHistoriographical analysisIndications and warning analysisIssue analysisStrategic relationships analysis
References
Buys, J.R., and J.L. Clark (1995). Events and Causal Factors Analysis. August. SCIE-DOE-01-TRAC-14-95. Idaho Falls, ID: Scientech Inc., Technical Research and Analysis Center.Fuld, L.M. (1995). The New Competitor Intelligence. New York, NY: John Wiley & Sons.Heuer Jr., J.R. (1999). The Psychology of Intelligence Analysis. Washington, DC: Center for theStudy of Intelligence.Kimberly, J.R. and H. Bouchikhi (1995). "The dynamics of organizational development and change:How the past shapes the present and constrains the future," Organization Science, 6(1), pp. 9–18.Krizan, L. (1999). Intelligence Essentials for Everyone. June, Washington, DC: Joint MilitaryIntelligence College.Miller, D., and P.H. Friesen (1980). "Momentum and revolution in organizational adaptation,"Academy of Management Journal, 23(4), pp. 591–614.Peterson, M. (1998). Applications in Criminal Analysis: A Sourcebook. Westport, CT: Praeger.Van de Ven, A.H., and M.S. Poole (1995). "Explaining development and change in organizations,"Academy of Management Review, 20(3), pp. 510–540.
Endnotes
1 Kimberly and Bouchiki, 1995; Miller and Friesen, 1980; Van de Ven and Poole, 1995.2 Buys and Clark, 1995; Heuer, 1999.3 Adapted from Buys and Clark, 1995.4 Adapted from Fuld, 19955 Adapted from Fuld, 1995, Chapter 12, Case 2.
22Technology Forecasting
Short Description
Technology forecasting aims to provide information about the direction and rate of technologychanges. It uses logical processes to generate explicit information to help industry and governmentanticipate practical, ecological, political, and social consequences of developments in technology. Ingovernment, this information is used to inform policy. In industry, the information can be used toinform strategic improvements to, or replacements of, products and processes and predict changes inmarkets.There are four elements in a technology forecast:1
A time horizon (either the time of the forecast or the estimation of time when the forecast shouldbe realized)A specific technologySome parameters to the technology (characteristics and capabilities gauging level ofperformance)A probability statement about the outcome or range of outcomes predicted
Technology forecasting is performed using a variety of techniques.
Background
Technology is defined in the Oxford Dictionary as "the application of scientific knowledge forpractical purposes." A forecast predicts or estimates a future event or trend.For millennia humans have been fascinated by the future and what it might hold. The interest ofbusiness in systematically attempting to predict the future is more recent.There are two broad perspectives that may be taken on what it is that prompts the development oftechnology. One is that technology will develop in response to scientific and technical opportunity (atechnology is discovered, and an application for it is then sought), the other is that technology willdevelop in response to the need or desire for change (an application is found, and technology isdeveloped for that purpose).As scientific knowledge changes, so does technology. Change in technology has implications formany aspects of modern business. While some technology change amounts to refinement of existingtechnology, other change can render existing technology obsolete and can have immediate effects onyour ability to compete.The development of technology experienced an explosion in growth after the Second World War. Thedefense and space industries were subject to heavy government investment, and research undertakenin these led to many developments that had significant impacts on other industries. For example, the

work in the space industry on miniaturizing electronics revolutionized the production of domesticappliances.Following on the heels of the radical growth in technology development came a major upheaval in thenature of commercial competition. For many decades, economies around the world grew at a fairlysteady rate. Change tended to be gradual and the marketplace fairly predictable. However, since the1970s, markets became much more volatile and unpredictable. Competition became fiercer, andchanges in marketplace dynamics occurred much faster than in the past.Together, these changes, the rate of change itself, and the intensifying of competition in the market,have made looking to the future in terms of technology crucially important to the competitiveness ofbusiness and of national economies that is to both the public and private sectors. A change intechnology may prompt modification of existing government policy or development of new policy,both of which may have flow on effects for industry; for example, by making tax concessionsavailable for specific areas of research and development or by supporting the setting up of a newindustry. Other considerations for industry include that a change in technology could mean a suddenloss of market share as products are superseded or to the loss of a market where a technology iscompletely replaced—for example, floppy disks and floppy disk readers.The modern practice of technology forecasting as used in business has, as previously mentioned, itsroots in the U.S. space and defense industries in the 1940s and 1950s. It was used by the U.S. as atool to keep its technology ahead of the Russians during the Cold War.There exist a variety of methods used to forecast changes in technology. The oldest is expert opinion,and while it is not all that widely used today, refinements of the method survive (for example, theDelphi method) and are discussed later in the chapter.Probably the earliest systematic technique for forecasting technology change to find its way intobusiness is morphological analysis. The process was developed by an astrophysicist, Fritz Zwicky, inthe 1940s as a way to systematically invent solutions to specific problems. The process was firstadopted and applied to future studies for use as a corporate learning tool in the 1980s.In the late 1950s, another important technology forecasting method was developed. The Delphimethod originated with and was refined by the RAND Corporation to enhance its ability to conductbusiness in the defense industry throughout the 1950s and 1960s. It uses the consensus opinion of apanel of experts to explore technology advances.Over time, technology forecasting techniques have been adopted more generally by business as a toolthat makes available information directly relevant to managing a firm's investments in technology.Concepts related to technology forecasting include technology road-mapping and foresight."Technology road-mapping" is a term invented by Motorola to describe its method for developingtechnical strategy. It is a process used by businesses to plan for the projected needs of themarketplace. It provides a plan of action for organizing research and development activities over acourse of years (usually no more than 10 years) in order to achieve the stated goal. By focusing on agoal in the future, road-mapping helps a firm to allocate its investment resources and technologycapabilities and focus its activities on strategically achieving its goal.Foresight studies are usually undertaken by a national government to identify and encourage thedevelopment of desirable technologies. Foresight studies may play a role in developing the nationaleconomy by luring international research and industry firms to set up for business in particularnations.
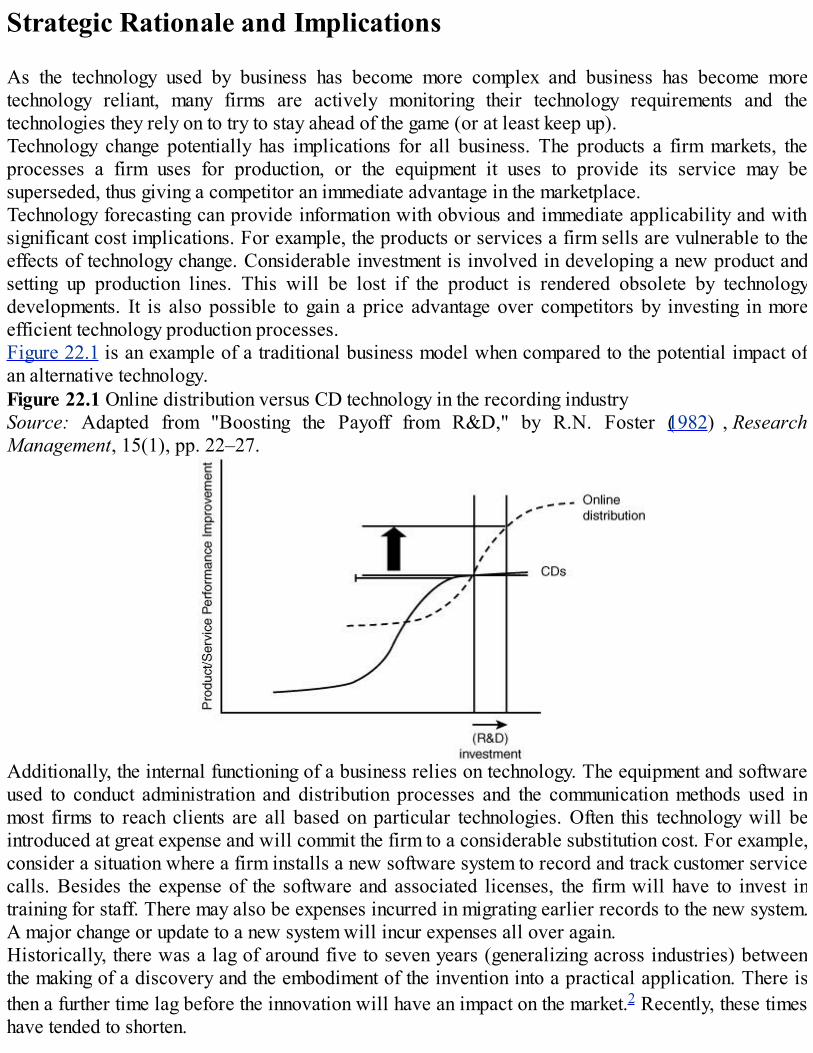
Strategic Rationale and Implications
As the technology used by business has become more complex and business has become moretechnology reliant, many firms are actively monitoring their technology requirements and thetechnologies they rely on to try to stay ahead of the game (or at least keep up).Technology change potentially has implications for all business. The products a firm markets, theprocesses a firm uses for production, or the equipment it uses to provide its service may besuperseded, thus giving a competitor an immediate advantage in the marketplace.Technology forecasting can provide information with obvious and immediate applicability and withsignificant cost implications. For example, the products or services a firm sells are vulnerable to theeffects of technology change. Considerable investment is involved in developing a new product andsetting up production lines. This will be lost if the product is rendered obsolete by technologydevelopments. It is also possible to gain a price advantage over competitors by investing in moreefficient technology production processes.Figure 22.1 is an example of a traditional business model when compared to the potential impact ofan alternative technology.Figure 22.1 Online distribution versus CD technology in the recording industrySource: Adapted from "Boosting the Payoff from R&D," by R.N. Foster (1982) , ResearchManagement, 15(1), pp. 22–27.
Additionally, the internal functioning of a business relies on technology. The equipment and softwareused to conduct administration and distribution processes and the communication methods used inmost firms to reach clients are all based on particular technologies. Often this technology will beintroduced at great expense and will commit the firm to a considerable substitution cost. For example,consider a situation where a firm installs a new software system to record and track customer servicecalls. Besides the expense of the software and associated licenses, the firm will have to invest intraining for staff. There may also be expenses incurred in migrating earlier records to the new system.A major change or update to a new system will incur expenses all over again.Historically, there was a lag of around five to seven years (generalizing across industries) betweenthe making of a discovery and the embodiment of the invention into a practical application. There isthen a further time lag before the innovation will have an impact on the market.2 Recently, these timeshave tended to shorten.
Technology forecasting aims to extend the time during which a firm may work on its response to anew technology by giving the firm insight into change before it happens or before it has a practicalimpact. This buys time for the research and development of new products and/or services. It will alsogive some insight into the likely longevity of investment returns a firm can expect from its investmentin a particular technology.There are a variety of methods used to generate technology forecasts:
Expert opinion may be sought about likely directions for change. Delphi is an example of aprocess using expert opinion to forecast likely change. It explores future technologydevelopments by drawing a consensus opinion from a panel of experts.Trend extrapolation and growth curves use information from the past to predict developmentslikely in the future.Morphological analysis uses information about current technology to try to find new applicationsfor existing inventions.Relevance trees systematically break down a problem as a method for finding a solution.Monitoring follows current research and finds links between inventions to predict what practicalinnovations may arise from them. An example of monitoring is patent analysis.3Historical analogy picks an analogous technology from the past and plots development in a newtechnology as following a similar growth trajectory. Historiographical analysis is discussed indetail in Chapter 25, "Historiographical Analysis."Scenarios can explore future technology by presenting a series of perspectives on possiblefutures each involving slightly differing conditions to arise.4
Technology forecasting predicts future developments by anticipating the probable characteristics andtiming of technology. It will focus on one specific technology outcome and explore the likelyattributes of that technology at some nominated time in the future—for example, in 10 years' time. Themost useful technology forecast will include some sort of estimate of how the likelihood of itspredictions materializing. It should always make explicit the assumptions on which it is based.While technology forecasting itself is not necessarily concerned with a firm's profits, it shouldprovide sufficient insight to allow a firm to make informed decisions about its investments intechnology, which will in turn have a direct bearing on future profitability.To not undertake any form of technology forecasting is to assume that either technology change is notrelevant to a firm or that the technology used is static.
Strengths and Advantages
The greatest strength of technology forecasting is its ability to inform current and future investmentdecisions throughout a business. Undertaken early in a project, it can provide valuable informationabout the likely longevity of a technology. It may even indicate the time period over which awidespread (even market standard) technology is probably going to be replaced.Technology forecasting is a flexible process and can be tailored to investigate the precise area orareas of possible change directly relevant to an individual business or industry. Its usefulness is notlimited to highly technical industries and its results are readily comprehensible.
The variety of methods available offers a range of sophistication and allows a firm to choose amethod appropriate to its budget. It can be integrated into a firm's regular planning processes orconducted as a one-off process for a particular project.The individual methods used for technology forecasting all have their own particular strengths.The Delphi method allows a firm to tap into the expertise of experts across a range of specializedfields while protecting the resulting forecast from the subjective biases or "blind spots" of eachindividual. The consensus opinion from the panel of experts gives each expert the opportunity toadvise on a situation and then to revisit and refine their advice in light of the opinion of their peers.Trend extrapolation can use available statistical data to assist in the development of indicators and/orinferences about the future rate of change. While this method is often used to predict change in oneaspect of a technology, it can be used to pull together information about a variety of aspects andpredict a plausible and possible future direction.Growth curves can also usefully predict when a technology has reached maturity and is likely to bereplaced by something new.Relevance trees are a powerful stimulus for thought. They provide a systematic process for finding asolution to a problem. A relevance tree would identify relationships between parts of a technology orprocess and its potential development.Morphological analysis gives detailed analysis of the current and future structure of an industry andshows existing and potential gaps. It leads to explicit consideration of solutions to fill gaps in themarket. The process, while exhaustive, is precise.Monitoring of patents and general research trends can give a firm advance warning of likely newinventions that may be significant for its business.As can be seen, technology forecasting is a flexible process, providing a range of methods that can beadapted to suit a firm's budget, resources, and timeframe.
Weaknesses and Limitations
As with any form of forecast, the usefulness of a technology forecast is heavily dependent on thequality of the information and the validity of the assumptions upon which it is based. The aspects oftechnology to be considered in a forecast must be carefully chosen so that important factors are notaccidentally missed. The ability to understand what are the important factors driving a particulartechnology's development may require expertise in that technology that is beyond a firm's own staff. Itmay be the case that there are shortcomings built into the process as a result of the culture of the firmitself.The reputation of the individual championing the project or outside consultants presenting theinformation may sway a firm's willingness to accept and use information and cloud its ability tointerpret the complexities of a forecast. For example, a forecast confirming the firm's ownpreconceptions and emanating from a highly reputable source may be given greater weight in decisionmaking, which is out of proportion with the parameters of the forecast.Technology forecasts do not provide hard conclusive results. The forecasts will give a prediction ofthe probable attributes or appearance of a technology at some inexact time in the future.Technology forecasts involve exercises in predicting probability, which is a notoriously difficult todo. There are several common errors we make when attempting to judge the probability of an event

occurring. For example, a memorable event may seem more likely to recur, even though it may bememorable for being unusual in the first place. Generally people tend to overestimate low-probabilityevents (for example, have you ever bought a lottery ticket?) and underestimate high-probability ones(for example, ignoring the very likely negative consequences of one's own pet vices). Human beingsare also highly likely to allow their own personal experience or anecdotal evidence to distort theirperceptions of reality. In fact, acting on a technology forecast ultimately requires a leap of faith.Additionally, the individual analytical methods used for compiling a technology forecast all havetheir own weaknesses.There are several points at which the Delphi method may fail. The appointment of properly qualifiedexperts is crucial to the integrity of the opinion that results. If the panel or a portion of the panel is notexperienced in the area you are investigating, the opinion will not truly be an expert one. Similarlyyou must be careful that the questions you are asking the experts will answer the specific questionsyou want answered about the future.The Delphi method is structured in a way to minimize the impact of idiosyncratic responses;however, there is no way to control the amount of time and care taken by any expert taking part. It ispossible that the time-consuming revisiting of questions during the Delphi process may even promptless time and less care be taken with each round. Whether or not this is the case, the quality of theresult depends on the quality of the responses and the range of knowledge of the experts used.For trend extrapolation and the use of growth curves, the biggest weaknesses are the assumptionsunderpinning them—that is, the future will follow the patterns of the past. There is also the implicitassumption that change is not sudden.The processes of trend extrapolation and growth curve plotting are profoundly dependent on the limitschosen for the analysis. Donnelly notes an example where limiting analysis to a particular technologywhen extrapolating a trend and ignoring other information from the marketplace resulted indisastrously inaccurate predictions. He cites the example of television manufacturers during the1950s and 1960s. The overall trend was for television sets manufactured in America to becomelarger and more like a piece of furniture, which led the American firms to concentrate productdevelopment in this area. However, at the same time, the Japanese manufacturers were starting tomake (and consumers were purchasing) compact sets. The real trend in the market was for greatervariety in the size of TV sets, and the American firms effectively locked themselves out of asignificant portion of the expanding market by relying on simple trend extrapolation.Typically, trend extrapolation will look at the future from the perspective of one factor of change at atime. This assumes minimal interaction between different technologies and different technologicaldevelopments. In fact, it is often the case that change is driven by interaction between aspects oftechnology.Relevance trees and morphological analysis are subject to human error and vulnerable to lack ofinsight on the part of those constructing them. Both can be very time consuming to construct.Morphological analysis does not take into account factors external to the particular problem ortechnology in question—for example, costs. It also requires knowledge of all possible solutions to aproblem in order to find new applications for the technology (to solve the specific problem youhave). Without knowing all alternatives, the analysis is compromised. As all possibilities must berepresented, time must be spent in listing many impossible alternative uses for technologies.Relevance trees are a very general approach for solving a specific problem. It can lead to pursuit of afundamentally flawed course of analysis, as the flaws may not be obvious until very late in theprocess.
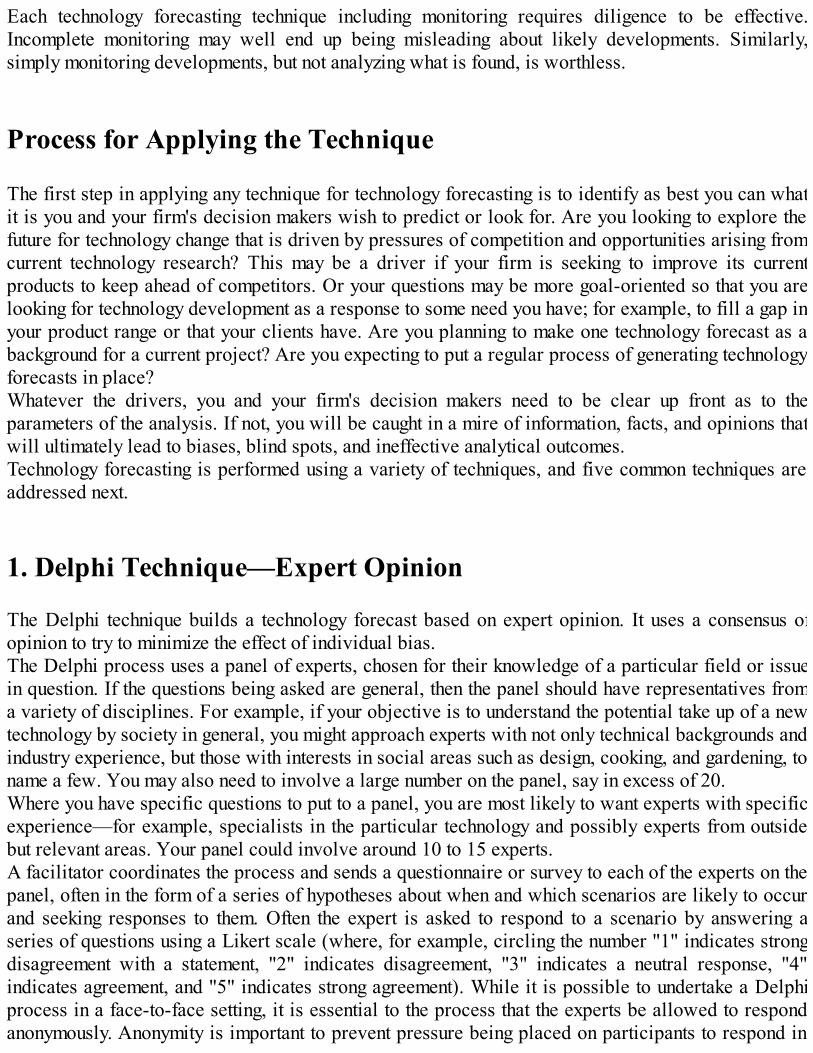
Each technology forecasting technique including monitoring requires diligence to be effective.Incomplete monitoring may well end up being misleading about likely developments. Similarly,simply monitoring developments, but not analyzing what is found, is worthless.
Process for Applying the Technique
The first step in applying any technique for technology forecasting is to identify as best you can whatit is you and your firm's decision makers wish to predict or look for. Are you looking to explore thefuture for technology change that is driven by pressures of competition and opportunities arising fromcurrent technology research? This may be a driver if your firm is seeking to improve its currentproducts to keep ahead of competitors. Or your questions may be more goal-oriented so that you arelooking for technology development as a response to some need you have; for example, to fill a gap inyour product range or that your clients have. Are you planning to make one technology forecast as abackground for a current project? Are you expecting to put a regular process of generating technologyforecasts in place?Whatever the drivers, you and your firm's decision makers need to be clear up front as to theparameters of the analysis. If not, you will be caught in a mire of information, facts, and opinions thatwill ultimately lead to biases, blind spots, and ineffective analytical outcomes.Technology forecasting is performed using a variety of techniques, and five common techniques areaddressed next.
1. Delphi Technique—Expert Opinion
The Delphi technique builds a technology forecast based on expert opinion. It uses a consensus ofopinion to try to minimize the effect of individual bias.The Delphi process uses a panel of experts, chosen for their knowledge of a particular field or issuein question. If the questions being asked are general, then the panel should have representatives froma variety of disciplines. For example, if your objective is to understand the potential take up of a newtechnology by society in general, you might approach experts with not only technical backgrounds andindustry experience, but those with interests in social areas such as design, cooking, and gardening, toname a few. You may also need to involve a large number on the panel, say in excess of 20.Where you have specific questions to put to a panel, you are most likely to want experts with specificexperience—for example, specialists in the particular technology and possibly experts from outsidebut relevant areas. Your panel could involve around 10 to 15 experts.A facilitator coordinates the process and sends a questionnaire or survey to each of the experts on thepanel, often in the form of a series of hypotheses about when and which scenarios are likely to occurand seeking responses to them. Often the expert is asked to respond to a scenario by answering aseries of questions using a Likert scale (where, for example, circling the number "1" indicates strongdisagreement with a statement, "2" indicates disagreement, "3" indicates a neutral response, "4"indicates agreement, and "5" indicates strong agreement). While it is possible to undertake a Delphiprocess in a face-to-face setting, it is essential to the process that the experts be allowed to respondanonymously. Anonymity is important to prevent pressure being placed on participants to respond in

any particular way.Once the expert opinions are all received, the responses are collated by the facilitator. The results arethen sent back to the experts, showing them statistics on points of agreement and conflicting opinion(anonymously) and seeking a further response. Sometimes written arguments may be submitted(anonymously) with a detailed opinion of why some judgment is right or why it is misguided. Theexperts are invited to respond again to the survey or questionnaire in light of the statistical feedback.The aim is to find consensus, meaning a majority agreement. Experts who find that their response to aparticular question is out of step with majority opinion may choose to revisit it if it was an opinionthey felt uncertain of the last time around.This back and forth procedure will continue for a given number of rounds (usually three, as studiessuggest that this gives the best balance between achieving reasonable consensus and not exhaustingthe goodwill of the panel) in an attempt to build a consensus of expert opinion. The opinion is usuallypresented at the end of the process as a proportion of experts agreeing to a particular response—say80% of respondents agreed strongly that such-and-such change is likely to occur in the next five years.However, the experts are not to be pressured to find consensus if it would compromise theirconsidered opinion. If consensus cannot be reached, final distribution of responses will appear in theforecast with a note that it does not represent a consensus of opinion.
2. Trend Extrapolation
Trend extrapolation requires a forecaster to consider change over a period of time, understand thefactors that have driven that change, and predict future change from this knowledge. It is used toforecast change in functional capabilities. This method relies on an assumption that past drivers ofchange will continue to influence the future and ignores short-term fluctuations in trends as it aims fora long-term forecast. It is useful in an environment where development tends to occur fairlyconstantly.Generally, statistics (numeric data about past developments) are plotted onto a graph against time. Aline is roughly fitted to the points plotted. It may be straight or curved (for example, showing anexponential growth). The mathematical formula that best explains the shape of the line is then used topredict the position of future points on the line (roughly); that is, over future points in time. See Figure22.2 as an example of trend extrapolation.Figure 22.2 Trend extrapolationSource: Adapted from Lawrence, S.R. (2002). "Technology Scanning & Forecasting," University ofColorado, http://leeds-faculty.colorado.edu/lawrence/mbat6450/docs/schedule.htm.

Limit analysis may then be used to check the utility of a trend extrapolation plot. Limit analysis isbased on the fact that all technologies have a limit at some point beyond which there can be no furtherimprovement. For example, improvements to the braking system on a motor vehicle will stop a carmore quickly; however, nothing can stop the car instantly (that is, without the elapsing of any time atall). The mathematical plot of the improvement will continue the line (as a theory) beyond the pointwhere any practical improvement is possible. Extrapolation will not yield any useful information ifapplied to a technology already close to the limit of its potential.Trend extrapolation may be used to forecast future developments in a technology that has a precursortechnology (or several precursors) with a known path of change. The shape of the curve for theprecursor (or precursors) is used as a guide for the shape of the technology in question. For example,plotting the efficiency gains in Formula-one car racing engines would give a shape that correlates toefficiency improvements in domestic motor vehicle engines. This process enables more complexpredictions to be made.Trend extrapolation may also examine past developments and predict future ones on the basis ofjudgment, rather than using statistics and graphs. This will give less precise results than a graph;however, the results may nevertheless be accurate as a forecast. This method is particularly suited tosituations where numeric data is too complex to plot into lines, such as where many different factorscontribute to the issue being forecast.
3. Growth Curves
The growth of development in technology change is thought to follow an s-curve, similar to thegrowth of biological life.5 This shape is regarded as universal and is used extensively in plottingproduct life cycles (see Figure 22.3).Figure 22.3 Generic s-curve

The s-curve illustrates the gradual process of research leading to a new invention, which is thenimproved upon (where the line goes most steeply upwards) until the limit of the technology isapproached (and the line levels out). See also Figure 22.4.Figure 22.4 S-curve modelSource: Adapted from Foster, R.N (1982). "Boosting the Payoff from R&D," Research Management,15(1), pp. 22–27.
The stages of Figure 22.4 are
1. 1. Embryonic—The first few years of R&D yield low returns as the focus is on a wide range ofresearch and knowledge acquisition.
2. 2. Growth—Critical Knowledge starts being applied and developed, causing the productivity ofR&D to skyrocket.
3. 3 . Maturity—The productivity of R&D begins to wane as the technology reaches its naturallimit.
Plotting the development of a technology over time as an s-curve should give you an indication ofwhether the technology is reaching the limits of its efficiency and is therefore ripe for replacement.
4. Historical Analogy

Using historical analogy is a very simple and commonly used method for predicting technologychange by comparing the path of development followed by an analogous technology—see Chapter 25,"Historiographical Analysis," for an in-depth treatment of this analytical tool.
5. Scenarios
Scenarios are not strictly predictive; however, they are generally considered a good method fortechnology forecasting—see Chapter 18 in our previous book, Strategic and Competitive Analysis,for a detailed approach to this technique.
6. Morphological Analysis
Morphological analysis is sometimes referred to as "organized invention." It starts with a goal youwish to achieve. For example, you may be looking to find the optimal method for packaging an object.It involves the systematic gathering of information about all possible technologies that may achieve aparticular purpose. For example, you may be looking at packaging technology, and so you would haveto consider any possible material that could be used for packaging—cardboard, paper, plastic, fabric,wood, etc. You also need to list the attributes you seek in packaging. For example, you might beconsidering attributes like durability, flexibility, being lightweight, protective, recyclable,waterproof, and so on.The information is then displayed in some sort of graphical form—for example, in a list or matrix—that highlights any gaps. The gaps may represent opportunities for developments. The display of theinformation gathered may also indicate areas with no potential for development at all.To make this process work for you, you must be prepared to consider all possibilities and not limityourself to current possibilities. It requires time and patience and may involve some research toensure you are aware of all the possible technologies relevant to the problem you wish to solve.
7. Relevance Trees
Relevance trees are detailed hierarchies of methods for achieving a particular outcome. This outcomeis the question you want answered by your forecast. It might be something like: How can we reduceenergy costs for consumers of our appliance?A relevance tree divides a broad subject/problem into increasingly smaller and more detailedsubtopics. Often, relevance trees are arranged to look very much like an organizational chart orfamily tree, though they may also be represented with more detailed items radiating out from thecentral subject.The items at each level of the tree should provide a complete description of the item to which they arejoined. Ideally, there should be no overlap between items in the tree; however, this is often difficultto achieve in practice.The idea behind a relevance tree is to break down a question or problem into issues small enough to

be addressed easily. See Figure 22.5 for a diagrammatical representation.Figure 22.5 Relevance tree model (for pollution control)Source: Adapted fromhttp://www.wiley.com/college/dec/meredith298298/resources/addtopics/addtopic_s_02m.html.
8. Monitoring
Monitoring is a method for forecasting technology change that does not require a specific question toanswer in order to give useful results. There are many forms of monitoring that can predict technologydevelopments. An important one is patent analysis, which is discussed in detail in Chapter 22 of ourprevious book, Strategic and Competitive Analysis.Monitoring is often based on careful observation of published research results. Published results willbe those emanating from research in public institutions and not competitor firms, so these will tend tobe results from very early on in the process of a development (before the research is taken up forcommercial pursuit). In some industries, this sort of research may not necessarily be availablepublicly.Other sources of information for monitoring include industry publications and trade shows. In someindustries, there are associations where individuals with an interest in an invention may publicizetheir work. Observing developing social phenomena may also give insight into areas wheretechnology development is likely to occur; for example, the wide uptake of cellular phones and the
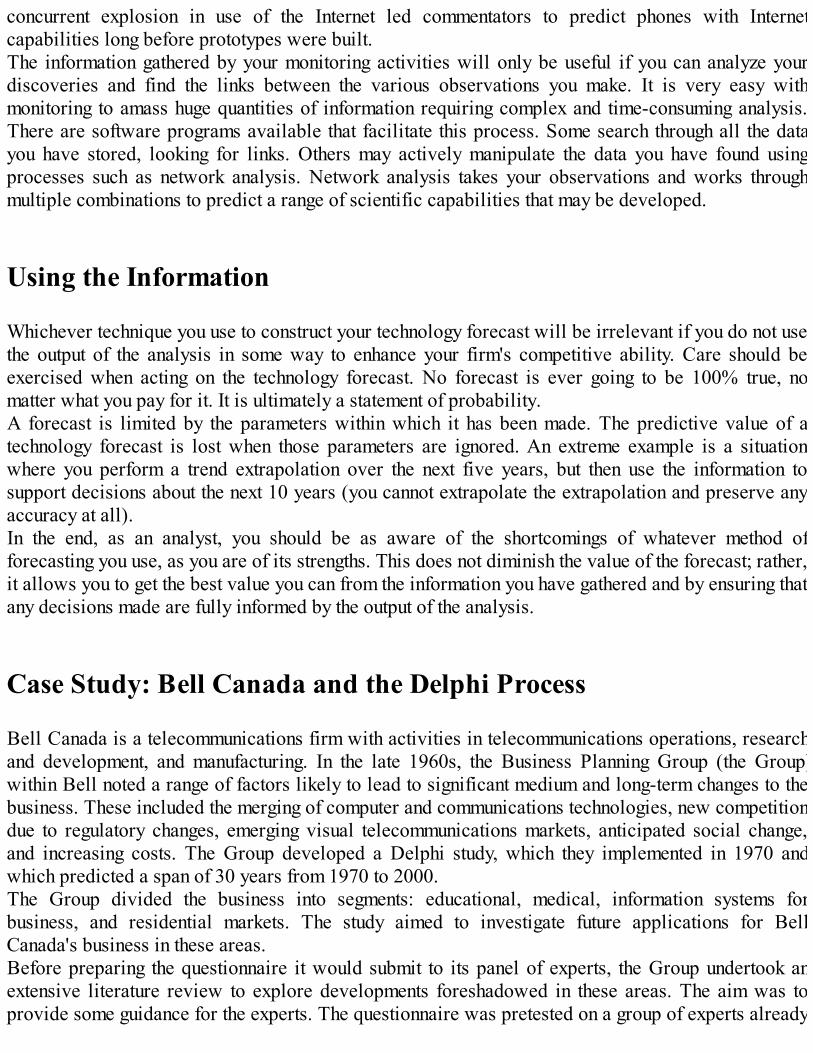
concurrent explosion in use of the Internet led commentators to predict phones with Internetcapabilities long before prototypes were built.The information gathered by your monitoring activities will only be useful if you can analyze yourdiscoveries and find the links between the various observations you make. It is very easy withmonitoring to amass huge quantities of information requiring complex and time-consuming analysis.There are software programs available that facilitate this process. Some search through all the datayou have stored, looking for links. Others may actively manipulate the data you have found usingprocesses such as network analysis. Network analysis takes your observations and works throughmultiple combinations to predict a range of scientific capabilities that may be developed.
Using the Information
Whichever technique you use to construct your technology forecast will be irrelevant if you do not usethe output of the analysis in some way to enhance your firm's competitive ability. Care should beexercised when acting on the technology forecast. No forecast is ever going to be 100% true, nomatter what you pay for it. It is ultimately a statement of probability.A forecast is limited by the parameters within which it has been made. The predictive value of atechnology forecast is lost when those parameters are ignored. An extreme example is a situationwhere you perform a trend extrapolation over the next five years, but then use the information tosupport decisions about the next 10 years (you cannot extrapolate the extrapolation and preserve anyaccuracy at all).In the end, as an analyst, you should be as aware of the shortcomings of whatever method offorecasting you use, as you are of its strengths. This does not diminish the value of the forecast; rather,it allows you to get the best value you can from the information you have gathered and by ensuring thatany decisions made are fully informed by the output of the analysis.
Case Study: Bell Canada and the Delphi Process
Bell Canada is a telecommunications firm with activities in telecommunications operations, researchand development, and manufacturing. In the late 1960s, the Business Planning Group (the Group)within Bell noted a range of factors likely to lead to significant medium and long-term changes to thebusiness. These included the merging of computer and communications technologies, new competitiondue to regulatory changes, emerging visual telecommunications markets, anticipated social change,and increasing costs. The Group developed a Delphi study, which they implemented in 1970 andwhich predicted a span of 30 years from 1970 to 2000.The Group divided the business into segments: educational, medical, information systems forbusiness, and residential markets. The study aimed to investigate future applications for BellCanada's business in these areas.Before preparing the questionnaire it would submit to its panel of experts, the Group undertook anextensive literature review to explore developments foreshadowed in these areas. The aim was toprovide some guidance for the experts. The questionnaire was pretested on a group of experts already

available. This allowed the Group to identify and reword some badly expressed questions andredesign the questionnaire to reduce confusion for panel members. Although this step delayed theprocess, it ensured that results would be clearer.The education, medicine, and business questionnaires all started by requesting that the panelists givetheir personal prediction of change to 10 basic values over the next 30 years in North America (forexample, would there be a "significant increase," "slight increase," "no change," "slight decrease," or"significant decrease" in "traditionalism," "authoritarianism," "materialism," etc.). This question wasto set the mood and put the experts into the right frame of mind for completing the rest of thequestionnaire. Other non-technical areas were also put to the panelists. For example, the educationstudy also addressed evolution in school design and the changing role of teachers over the same 30-year period.The studies then went on to technologies relevant to each area. For example, the education studyexamined likely time for introduction of computerized library systems, computer-aided instructionsystems, and visual display systems across primary, secondary, and post-secondary education levels.Further questions then broke down these hypothetical systems further and asked for a prediction ofwhen they were likely to be in use.Similar questions about likely timeframes for adoption of hypothetical technology developments wereasked in the medical and business studies. The results of these three studies provided clear and usefulinformation.The residential use study was different in that it focused on future services and not technologies. Anearly issue with this study was the problem of identifying which "experts" should make thepredictions about future adoption of technology for the residential market; for example, was ahousewife more qualified by her experience than an industry insider?The Group solved this problem by conducting two separate Delphi processes with the samequestionnaire: one using a panel of housewives and the other using a panel of industry experts. Theissues examined by each panel included their opinion of future acceptance of concepts like electronicshopping from home, remote banking, and electronic security for the home.The Delphi process ran for three years.The results of the process were then entered into a database where the forecasts from the experts hadbeen indexed for keywords, abstracted, and stored online. Results of other studies—for example,trend analyses—and from internal research were put into the same system.The information from the Delphi process has been used in combination with other information for avariety of purposes, including to prepare specific service and business proposals and to prepare"environmental outlook reports," which identify future trends that may affect Bell.6
FAROUT Summary
Figure 22.6 Technology forecasting FAROUT summary

Future orientation—High. Forecasting is by nature future-focused. The extent of the future focus of atechnology forecast will depend on the method used and the questions asked to prompt the forecast.Accuracy—Low to medium. Technology forecasting does not provide hard data. It can be accuratewithin the parameters of the forecast, but the information is not accurate in the sense that it does notprovide precision. Generally the most accurate information will be about the near future.Resource efficiency—Medium. Some methods for forecasting are very simple and inexpensive (forexample, a straightforward trend analysis); others can be very time-consuming (for example,morphological analysis) and/or quite expensive.Objectivity—Low to medium. The objectivity of a technology forecast will rest on the nature of thequestions asked (do they have assumptions built into them?) and on the people undertaking theprocess to generate the forecast (are they considering all alternatives necessary for the process towork efficiently?).Usefulness—Medium to high. Provided care is taken not to treat a technology forecast as a statementof inevitability, and the forecast is interpreted in light of the parameters within which it is made, atechnology forecast can be a source of very useful information and strategic opportunity.Timeliness—Low to medium. Most technology forecasting methods are too timeconsuming to conductand yield their most accurate information about the near future.
Related Tools and Techniques
Historiographical analysisPatent analysisScenario planningSWOT analysis
References
Ascher, W. (1979). Forecasting: An Appraisal for Policymakers and Planners (rev. ed.). Baltimore,MD: Johns Hopkins University Press.Ayers, R. (1969). Technological Forecasting and Long-Range Planning. New York, NY: McGraw-

Hill.Coates, J.F. (1989). "Forecasting and planning today plus or minus twenty years," TechnologicalForecasting and Social Change, Vol. 36, Nos. 1–2, August, pp. 15–20.Coates, V., Faroque, M., Klavans, R., Lapid, K., Linstone, H., Pistorius, C., and A.L. Porter (2001)."The future of technology forecasting," www.tpac.gatech.edu/papers/techforcast-abs.php.Day, L. (2002). "Delphi research in the corporate environment," in Linstone, H., and M. Turoff (eds.)."The Delphi method: techniques and applications," www.is.njit.edu/pubs/delphibook/ch3c1.html.Donnelly, Dr. D. (2006). "Forecasting methods: a selective literature review,"www.class.uh.edu/MediaFutures/forecasting.html. Accessed April 2006.Fleisher, C.S., and B.E. Bensoussan (2003). Strategic and Competitive Analysis: Methods andTechniques for Analyzing Business Competition. Upper Saddle River, NJ: Prentice Hall.Foster, R.N. (1982). "Boosting the payoff from R&D," Research Management, 15(1), pp. 22–27.Frick, Dr. R.K. (1974). "Operations research and technological forecasting," Air University Review,May–June.Lawrence, S.R. (2002). "Technology scanning & forecasting," University of Colorado, http://leeds-faculty.colorado.edu/lawrence/mbat6450/docs/schedule.htm.Lenz, R.C. (1962). "Technological forecasting," ASD-TDR-62-414, Aeronautical Systems Division,Air Force Systems Command.Mann, D. (1999). "Using S-Curves and trends of evolution in R&D strategy planning," www.triz-journal.com/archives/1999/07/g/index.htm.Martino, J. (1983). Technological Forecasting for Decision Making. New York, NY: ElsevierScience Publishing Company.Meredith, J., and S. Mantel (2000). Project Management: A Managerial Approach, 4th edition. NewYork, NY: John Wiley & Sons.Millett, S.M., and E.J. Honton (1991). A Manager's Guide to Technology Forecasting and StrategyAnalysis Methods. Columbus, OH: Batelle Press.Oxford Dictionary. www.askoxford.com/concise_oed.Schnaars, S. (1989). Megamistakes: Forecasting and the Myth of Rapid Ttechnological Change.New York, NY: The Free Press.Web sites:http://hops.wharton.upenn.edu/forecasthttp://www.wiley.com/college/dec/meredith298298/resources/addtopics/addtopic_s_02m.html
Endnotes
1 Martino (1983).2 Meredith and Mantel (2000).3 See Fleisher and Bensoussan (2003), Chapter 22.4 See Fleisher and Bensoussan (2003), Chapter 18.5 See Fleisher and Bensoussan (2003), Chapter 24.6 Adapted from Day, L. (2002).
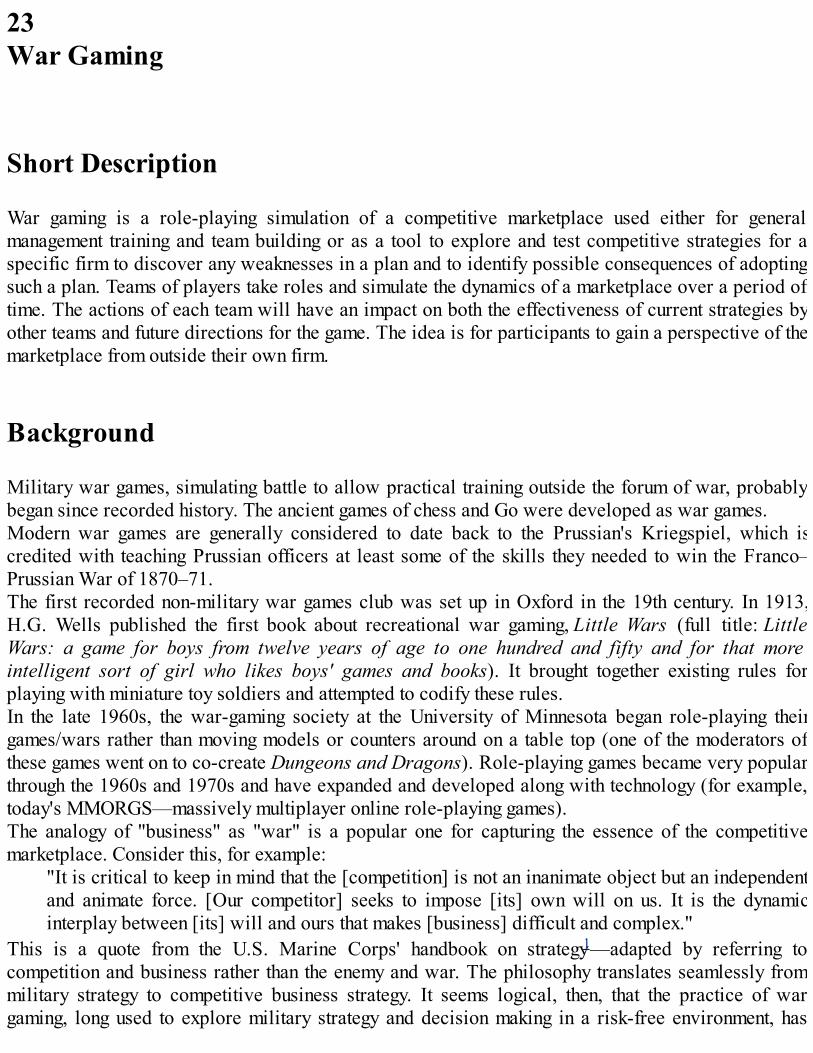
23War Gaming
Short Description
War gaming is a role-playing simulation of a competitive marketplace used either for generalmanagement training and team building or as a tool to explore and test competitive strategies for aspecific firm to discover any weaknesses in a plan and to identify possible consequences of adoptingsuch a plan. Teams of players take roles and simulate the dynamics of a marketplace over a period oftime. The actions of each team will have an impact on both the effectiveness of current strategies byother teams and future directions for the game. The idea is for participants to gain a perspective of themarketplace from outside their own firm.
Background
Military war games, simulating battle to allow practical training outside the forum of war, probablybegan since recorded history. The ancient games of chess and Go were developed as war games.Modern war games are generally considered to date back to the Prussian's Kriegspiel, which iscredited with teaching Prussian officers at least some of the skills they needed to win the Franco–Prussian War of 1870–71.The first recorded non-military war games club was set up in Oxford in the 19th century. In 1913,H.G. Wells published the first book about recreational war gaming, Little Wars (full title: LittleWars: a game for boys from twelve years of age to one hundred and fifty and for that moreintelligent sort of girl who likes boys' games and books). It brought together existing rules forplaying with miniature toy soldiers and attempted to codify these rules.In the late 1960s, the war-gaming society at the University of Minnesota began role-playing theirgames/wars rather than moving models or counters around on a table top (one of the moderators ofthese games went on to co-create Dungeons and Dragons). Role-playing games became very popularthrough the 1960s and 1970s and have expanded and developed along with technology (for example,today's MMORGS—massively multiplayer online role-playing games).The analogy of "business" as "war" is a popular one for capturing the essence of the competitivemarketplace. Consider this, for example:
"It is critical to keep in mind that the [competition] is not an inanimate object but an independentand animate force. [Our competitor] seeks to impose [its] own will on us. It is the dynamicinterplay between [its] will and ours that makes [business] difficult and complex."
This is a quote from the U.S. Marine Corps' handbook on strategy1—adapted by referring tocompetition and business rather than the enemy and war. The philosophy translates seamlessly frommilitary strategy to competitive business strategy. It seems logical, then, that the practice of wargaming, long used to explore military strategy and decision making in a risk-free environment, has
been appropriated and adapted for use in business.Since their development in the late 1980s, business war games have become an increasingly populartool for firms to experience strategic decision making, provide hands-on training to their staff, and seethe consequences flowing from the decisions made in a realistic simulation of a dynamic market.
Strategic Rationale and Implications
The basic aim of a war game is to turn information into actionable intelligence by increasing thequality of decision making. Chussil likens the function of war gaming in the context of strategicdecision making to that of research and development in the context of product development.War games today are complex role-playing simulations, which ideally capture the complexity ofcompetitive market dynamics. By running a business war game, a firm can have its participatingmanagers practice strategic decision making in a realistic context.In many firms, management decisions are guided by quite conservative thinking in which few risks aretaken in the hope that this course of action will minimize mistakes. However, taking a conservativeapproach may in fact end up costing more in the long run than a radical change in strategic direction,as opportunities for profit may be passed up.In the fast-changing environment of modern business, it is also important for a firm to avoid the trapof endlessly trying to relive its own past success by repeating history. As history unfolds, its course isshaped not just by our own plans and actions, but by many other factors outside our control, such asthe strategies of our competitors, new inventions and innovations, and even government policychanges. As new competitors join a market and new products and technologies develop, there can belittle wisdom in sticking with what you did yesterday while everyone else has moved on.A business war game allows experimentation with new strategic directions without incurring real-world costs and so widens the range of strategic planning options a firm may be willing to adopt. Iteffectively reduces the risk of making mistakes by illustrating the flow on effects of the decision ordecisions explored in the war game. It provides a simulation where some of the uncontrollablefactors influencing the market can be modeled and their likely affects explored in a risk-freeenvironment.The action in a war game will span a nominated time period, usually measured in years (though thegame itself will last for only a matter of days). This allows the consequences of a particular decisionto be tracked into the medium term to thoroughly investigate the reactions of the marketplace. Byfollowing the competitive dynamics of the market for a period of time, the war game will uncovereither longer-term negative consequences of a decision that may initially deliver profits or show thatwhile a strategy used may offer modest returns in the short term, it will yield much greater profits(than alternative strategies) with time.The war game situation also forces participants to change their perspective on strategic decisionmaking. Participants are divided into teams that assume roles in the game, simulating a wide varietyof players in the marketplace. Teams will usually include several teams representing competitors orcustomers as well as the host firm. The teams will work in isolation to develop their "move" in thegame but then will see the results, not in isolation, but in the context of all "moves" made by all otherteams. Managers are no longer making their planning decisions based on their view of the marketfrom their own firm (inside out), but are seeing the effect of their firm's decisions on the whole market

from a much wider perspective (outside in).There are two basic types of war games that can be run for a business. The first uses a genericbusiness scenario to educate managers generally in the process of strategic decision making. It willput the participants in a safe environment in which they can experiment with radical thinking and gainconfidence in their own decision-making capacity. The experience will also promote team buildingamong the participants.The second type of war game is tailored to the needs of a particular firm, mirroring its competitiveenvironment in the war game set up. This type of war game is used to facilitate the firm's strategicplanning process. It may be run early in the planning process to indicate strategic directions or,alternatively, it may be run after the strategic plan has been formulated to test it for weaknesses andcheck what affect it is likely to have on the marketplace. Participants in this type of war game willalso gain experience, which will build their confidence in decision making—same as with the genericwar game. Similarly, a firm-specific war game will act as a team-building exercise.
Strengths and Advantages
The general development of decision-making skills and team-building effects may be achieved with arelatively cheap generic "off-the-shelf" war game. A tailored war game, however, allows a firm toexplore new and different strategic plans for the market in which it competes without incurring real-world costs. The war game is designed around current market and financial conditions and oftenrequires the facilitation by third parties. Competitive intelligence necessary for input into the wargame will be provided by the firm. It will use this information, which may already be available,though often not centrally accessible, to create a realistic representation of a particular marketplace.By undertaking a war game, the firm will be gathering together information that may be "owned" byseparate parts of the business and integrating it all into a single model from which the firm will beobtaining valuable, low-risk practical intelligence.One or more strategic plans may then be tested in the game to explore short- and medium-term effectsof specific actions in the market. This testing may be carried out at the beginning of the planningprocess to allow the firm to investigate broad direction change. Or the game may be run after a planhas been developed when it will uncover any weaknesses and/or unintended or undesirable results inthe short to medium term.The successful testing of a strategic plan in a business war game will build support for theimplementation of the plan across the firm. Participants from throughout the firm will have had anopportunity to question the strategy and follow it through its rigorous testing. They will be able tocommunicate their enthusiasm for the successful strategy to non-participants in all areas of the firm.A tailored war game will give those participating an insight into the future reality of their businessenvironment that is not available to their competitors. It will anticipate future market directions ofcompetitors and their reactions to the host firm's actions. It will contemplate the affects of newproducts, new competitors, and/or new technology on the market.After a corporate merger, acquisition, or takeover, a generic war game may be useful to buildcohesion between staff who were probably once competitors, while a tailored war game may educatenewcomers in the specifics of the firm's situation.The "after action report" compiled after a war game has run provides an historical record of the

scenarios tested and the outcomes of the war game. It is a reference tool for those who took part in thewar game and others who did not, to use when formulating strategic plans for the firm.After a firm has run one war game, any future war games it wishes to undertake will be easier andcheaper to run.Those taking part in war games will gain confidence in their own strategic decision-making abilitiesas a result of the experience. They will also have an understanding of "thinking outside the box" andbe more willing to consider new and different strategies.Firms will also find strong cross-functional team building benefits resulting from war games. In manylarge firms, there is often internal competition between departments or simple lack of communicationthat hinders the development and/or implementation of firm-wide strategies. Geographic separation offunctions, units, or branches of a firm may also make cooperation difficult in practical terms. A wargame typically involves teams of players consisting of members from a variety of departments, units,or branches and a variety of management levels. The intense experience of war gaming buildsvaluable working relationships and open channels of communication between the areas of the firmrepresented by the members of each team. The feeling of camaraderie resulting from the intense wargame experience can also build bridges throughout the firm and increase the chances of successfulimplementation of future strategic plans.
Weaknesses and Limitations
The design of a war game must be done very carefully, or the game will not run properly, and little orno useful information will result. The major flaw in war gaming is that is requires significant skilland diligence from participants as well as facilitators. The running of a war game itself requiresskilled logistical and administrative support. Most firms as such may not have the ability to designand run its own war game.The design process has multiple points where a mistake or input error will compromise the utility ofthe war game. For example, choosing the wrong situation to war game may yield accurate but uselessinformation; starting out with an ill-defined scope for the war game may yield information with a bigpicture focus, but no specific strategic feedback; too narrow a design may rob the teams of anyflexibility in how they play the game and give skewed results.The outcomes of the war game may be easily distorted by having unbalanced teams involved, therebylimiting the actions of the teams. The make-up of the teams must be carefully considered to give a mixfrom across various functions within the firm and involve different levels of seniority.When running a war game, the umpires or referees responsible for allowing or not allowing specificactions by the teams may limit the scope of the action with their personal biases or assumptions aboutthe market being emulated. A computer-based umpire may also limit the scope of the game bygenerating its decisions based on narrow assumptions about market dynamics or finance.Another potential problem is having the players manipulate the game situation simply to "win." Thiscan happen where a human umpire/referee has well-known preferences for business behavior ornarrow views of finance or competition, and teams can use these biases to get approval for theiractions at the expense of other teams. Similarly, an unsophisticated computer umpire/referee mayallow teams to second guess which strategies will get them furthest in the game situation. When thisoccurs, no realistic insights will result from the war game.
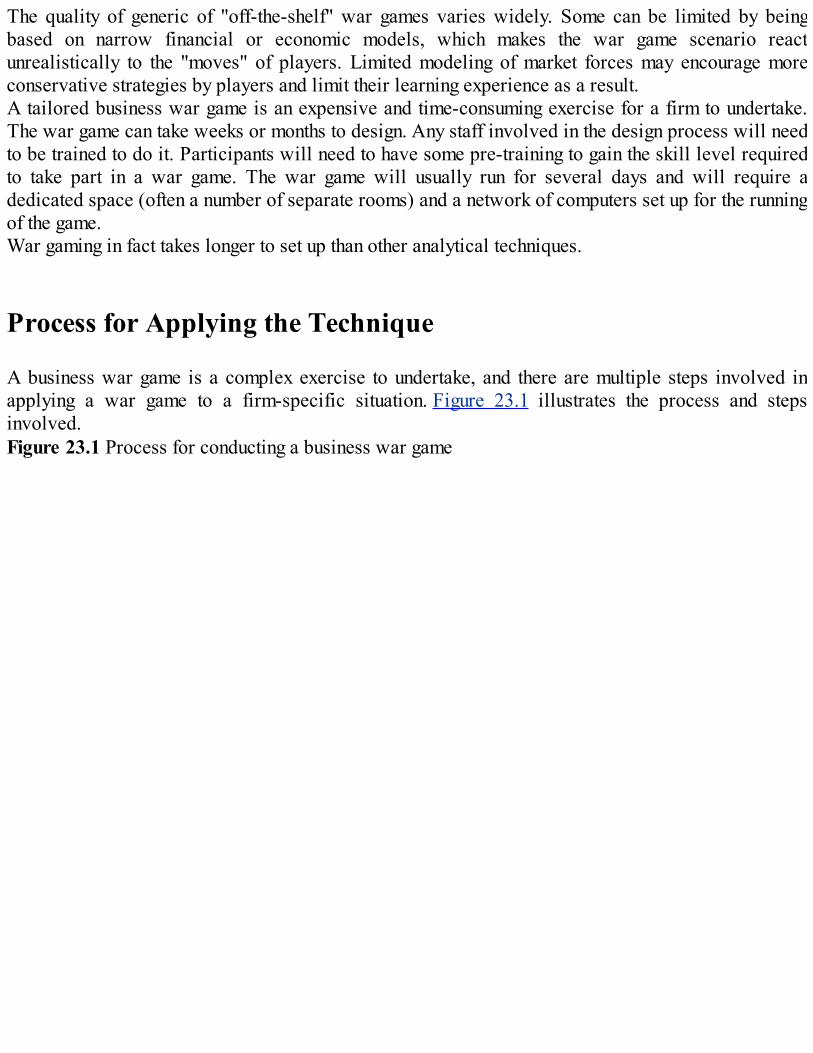
The quality of generic of "off-the-shelf" war games varies widely. Some can be limited by beingbased on narrow financial or economic models, which makes the war game scenario reactunrealistically to the "moves" of players. Limited modeling of market forces may encourage moreconservative strategies by players and limit their learning experience as a result.A tailored business war game is an expensive and time-consuming exercise for a firm to undertake.The war game can take weeks or months to design. Any staff involved in the design process will needto be trained to do it. Participants will need to have some pre-training to gain the skill level requiredto take part in a war game. The war game will usually run for several days and will require adedicated space (often a number of separate rooms) and a network of computers set up for the runningof the game.War gaming in fact takes longer to set up than other analytical techniques.
Process for Applying the Technique
A business war game is a complex exercise to undertake, and there are multiple steps involved inapplying a war game to a firm-specific situation. Figure 23.1 illustrates the process and stepsinvolved.Figure 23.1 Process for conducting a business war game
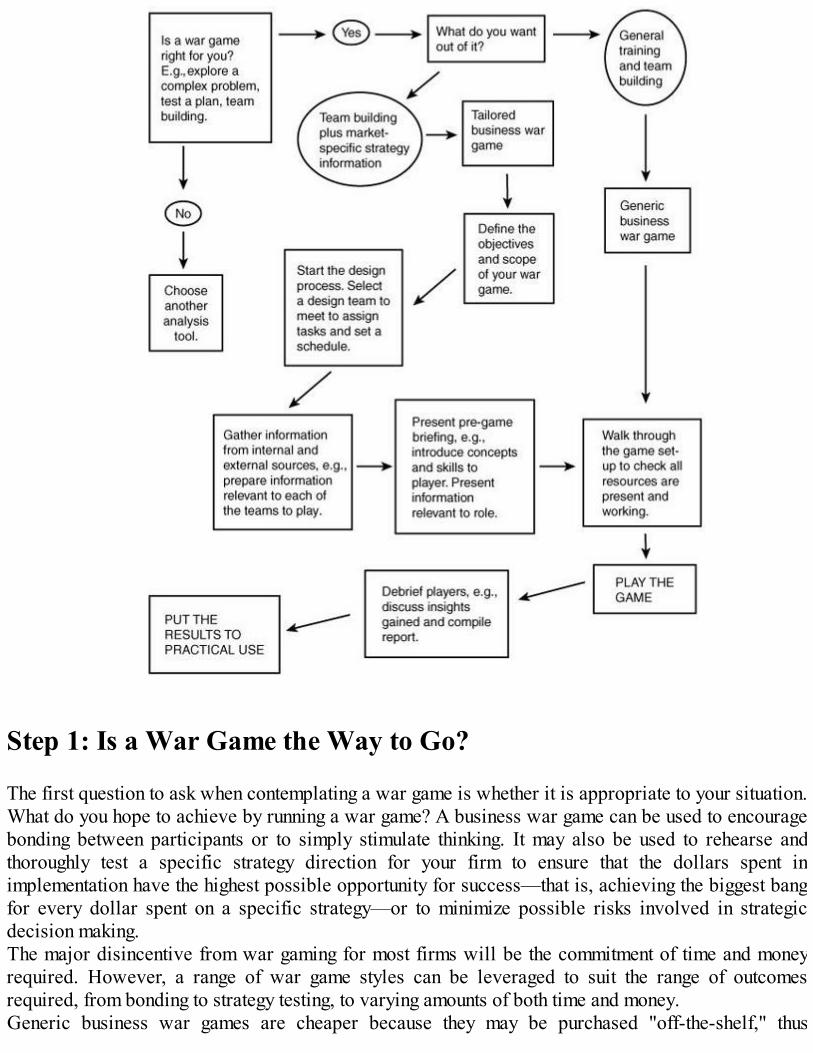
Step 1: Is a War Game the Way to Go?
The first question to ask when contemplating a war game is whether it is appropriate to your situation.What do you hope to achieve by running a war game? A business war game can be used to encouragebonding between participants or to simply stimulate thinking. It may also be used to rehearse andthoroughly test a specific strategy direction for your firm to ensure that the dollars spent inimplementation have the highest possible opportunity for success—that is, achieving the biggest bangfor every dollar spent on a specific strategy—or to minimize possible risks involved in strategicdecision making.The major disincentive from war gaming for most firms will be the commitment of time and moneyrequired. However, a range of war game styles can be leveraged to suit the range of outcomesrequired, from bonding to strategy testing, to varying amounts of both time and money.Generic business war games are cheaper because they may be purchased "off-the-shelf," thus
bypassing the long and involved design process required for a tailored war game. These are usefulwhere a firm wants to deliver staff training and experience in flexible strategic decision making in anintense and hands-on environment, and often last for only one half to one full day. These types of wargames may also give participants confidence to make decisions under pressure and serve as a firm-wide team-building exercise.On the other hand, there are various levels of complexity that may be incorporated into a tailoredbusiness war game. Some war games may last for only two days, while others may continue over fivedays.A shorter war game may be useful in delivering insights into a changing market and changingcompetitive factors, and this may be all that is required to kick start your firm's strategic planningprocess.Longer business war games tend to be used to comprehensively test new plans and strategies that willrequire a great deal of a firm's resources. The longer and more involved the war game, the morecomplex and expensive the design process will be. However, the returns may more than compensatefor the cost in that risks, unintended outcomes, and consequences can all be pre-managed formaximum benefit to the firm.A long tailored war game simulation will, however, be most beneficial for testing a complexsituation, where you face unfamiliar problems, and the cost of any mistake will be high.2Either way, whether you have a short or long game, a war game will give you creative insights intoyour situation and will help to build consensus within your strategy team for a particular futuredirection.3
Step 2: Getting a Business War Game Off the Ground
Once you decide that a business war game is the right thing for you to do, you will need to find apowerful and committed sponsor from high within your firm. Your sponsor will be particularlyimportant where you are contemplating a long and detailed war game, not only to get the go ahead forthe expenditure and hours it will require, but also to champion the outcomes. For a war game to besuccessful, you need to be sure that there is a commitment from senior management in the firm toactually make some practical use of the results.You will need to select a team to design your war game scenario. Once you have a team pulledtogether, the team will need to meet to get the basic war game design settled, including deciding whatthe objectives/scope will be. They will also need to develop a plan, schedule, and budget. All thedecisions and preparation work from this point on will be done by the design team.The design team now needs to buy and/or design the war game.While all generic war games are bought "off-the-shelf," not all are equal. Research into theunderpinnings of the war game (for example, what sort of modeling is used, what the processing ofinput based is on, and so on) is advisable. If a game is cheap because it uses unsophisticatedprocessing, then the strategic decision-making experience may be less than optimal, as decisions willnot result in realistic feedback. It may in fact encourage participants to make very conservativedecisions. Another consideration is how flexible the game is while being played. Players will not getany useful training in decision making unless they can explore the effects of a variety of actions ineach situation. This means you should look for a game that allows players to ask "what if" as they

play. Remember that when running a generic war game, the design process will only be relevant tothe extent that you need to decide who will be involved and who will be in each team.On the other hand, the software you use to process information while running a tailored war gameshould be sophisticated enough to realistically mimic complex marketplace dynamics as teams maketheir various "moves." It should also be difficult to predict so as to dissuade any rogue players fromtrying to manipulate the results of the game and allow players to explore "what if."The design process is crucially important to the success of a tailored war game; however, most firmscan obtain assistance for this aspect from a professional war game consultant or facilitator.By this stage, you will already have considered some of your objectives in deciding what sort of wargame you wish to run. Other objectives will be determined by what information do you expect to havein the "after action report" generated after the war game. The next consideration now is whatobjectives you have for the war game process itself. What sort of experience are you hoping theparticipants will gain from being involved? Who should be involved? How many teams will you needto play out the war game scenario, and who are they representing? There will always be a teamrepresenting the host firm, a facilitator team, and usually an umpire/referee team (or at least someonefeeding the information into some umpiring software and giving the results back to the players). Therewill be at least one competitor, but usually more, and a team representing a particular customer or allcustomers in the market. Often the war game will include a "wildcard" team representing a new, asyet unknown competitor in the market. Other teams may represent your distributors or retailers.To an extent, the objectives you choose will influence the scope and domain of your business wargame. For example, if you are testing a strategy to move your business offshore, then your war gamewill have to consider overseas market conditions—but will you need to consider just one or a varietyof geographical area and industries? This information is vitally important to the players while theyare playing the game as their time will be limited, and they must be guided in what to consider andwhat not to. It is an important guide for preparation of the briefing material you must supply to allplayers.
Step 3: Who Should Play?
Together the objectives and scope of the game will point to who should be involved in the war game.You should involve not only management from a variety of levels, but also from different departmentswithin your firm and from different branches as well. How many players should be involved? Howmany teams do you have, and how many people and what mix of people should be on each?The facilitator and umpire teams need not be large and may in fact be represented by only twopersons. However, those making up the umpire team have a critically important role in the progress ofthe war game. The umpire decides whether a team will be allowed to take the action it plans to—theumpire is effectively the gatekeeper of what information gets processed, and so any biases the umpiremay give in to in playing his or her role will have a direct effect on the integrity of the war game'soutcomes.The number of players in a team should be decided by considering how many people across the firmsenior management would like to involve, the number of teams being represented, and what will be areasonable number for each team to provide a range of input into the team's decision making withouthaving an unwieldy amount of input (from too many team members) to try to integrate.

Each team should be carefully chosen to include members from a variety of areas (departments andoffices) and from a range of seniority. Who should lead each team? Mark Chussil notes that somefirms have deliberately put more junior staff in charge of war game teams to enhance the sense thatteam members may speak freely. Some team members may feel intimidated by having to make radicalor wildly creative suggestions to a senior manager—and the aim of a war game is to explore exactlythese sort of ideas in a risk-lessened environment.
Step 4: Preparing for Your War Game
Players will need comprehensive background information to prepare for the war game and to refer towhile they play. Compiling this information from various internal and external sources and ensuringeach team gets the information it needs is critical. This is the most time-consuming part of the designprocess. What information will be needed to give each team the background it needs to realisticallyplay its role? For example, the host firm team will need financial, market share, product (includingR&D), and human resources information. Competitor teams will need much of the same sort ofinformation on their own firms, which your design team will need to provide as best as possible.However, the host firm team will only have information about its competitors that it already has.None of the teams will have all the detailed information supplied to each of the other teams. Someinformation may also be based on rumor in the marketplace. This will all go to reflect the incompleteinformation used for making real-world decisions.The design team will have to address the method to be used for teams to communicate their "moves"while playing the game. Often this means designing a template into which decisions can be entered.Information from a standard template should then be easy to transfer into the game-processingsoftware.Players will need some training before they participate in the war game. War gaming requires acertain level of skill to progress effectively. Players in longer games will generally be asked to attenda half-day or full day pre-war game briefing. Where the game is a generic or shorter tailored game, ashort introductory session before the war game and an opportunity to read their background materialmay be all that is required.The pre-war game briefing usually occurs a few weeks before the war game proper. Players will begiven their background information and be introduced to the processes and concepts of war gaming.They will be told what the objectives of the war game are and what is expected of them. Sometimesthe session will include a simple, short war game to give players some direct experience of playing.Other activities, such as short assignments, which may require further research, may be given to theplayers to help them get into their roles in the weeks leading up to the war game.The final important preparation for the running of the game is the physical set up of the space wherethe business war game will be played. The room or rooms to be used by the various teams and theadministrative and technical support staff involved must be furnished with all equipment necessary(for example, whiteboards, paper and pens, computers). It is advisable to have a test "walk through"of the game to double-check last-minute preparations—for example, are all the computers involvedrecognizing one another on the network?When you are planning a long war game, it may be necessary to build in some side activities forplayers to give them a break from the intensity of the war game.

Step 5: Playing the Game
The actual playing of the game can last between one and five days, depending on the game'scomplexity.A business war game will run as a series of "rounds," each representing the market after a particularpoint in time. For example, some war games nominate that each round occurs at three monthlyintervals; others may use half yearly (or longer intervals) or a mix of time periods.Teams go to the area or room assigned to them. Each team will have a set amount of time, usually anumber of hours, to prepare its plan for action in the current round based on the latest availableinformation. For the first round, each team will plan its "move" based on the information provided tothe players at their pre-game briefing (including any information gathered as a result of any additionalresearch they were asked to do for their specific team).At the end of the allotted time for the round, the teams will submit their plans to the umpire/referee,who will then decide whether the actions can be allowed in the game context. In some games, otherteams—for example, a consumer team—will assess competing strategies and directly reallocatemarket share. The allowable actions from each team will then be fed into the game-processingsoftware, which integrates plans from all teams and then generates new information about the market—for example, revised market share or profit figures. Each team receives limited feedback about theactions of the other teams mimicking the incomplete information on which business decisions must bebased in real life. The new information is used as a basis for making the team's new plan of action forthe next round.While the game is running, it is important to have both administrative and technical support available.The outcomes of the business war game should be recorded (and backed up) continuously to ensureno information or decisions made are lost over the course of the day.
Step 6: After the Game
After the players have finished all the allocated rounds of the game, they need to be debriefed aboutthe experience and reminded of the original objectives. This will give them a chance to reflect on thepersonal insights and confidence they have gained during the process.The value of the strategic analysis done during a war game will be lost without follow up after thegame has finished. The outcomes that have been recorded by administrative support staff need to becollected and organized into a meaningful "after game report." The tasks involved in putting the reporttogether should be assigned specifically and be subject to a deadline. You do not want theinformation to "go cold" and interest in the activity to leak away before the outcomes can be put touse.Once the report is complete, it must be followed up, and the insights gained during the business wargame should be acted upon. The learning curve for all the staff involved in a firm's business wargame is very steep. However, once there are knowledgeable people in-house, future war games thefirm chooses to run will be quicker and easier to prepare.

Case Study
A new CEO with an information technology firm (ITF) found the key division of his firm was facingdifficulties. He also discovered the following:
The marketplace was dominated by one very large competitor (holding nearly 60% of marketshare) and crowded with about 10 other minor players, including his firm (none of which hadmore than 8% market share). ITF adopted a strategy of taking market share from the marketleader, and this had not been working.The products ITF relied on were good, but unremarkable compared to those of competitors.Morale was very low.ITF had been divested from a larger IT firm some time before, and some of the managers stillretained a management style suited to a large firm and not the small one they now foundthemselves with. There was no consensus among senior staff as to how to turn the firm around.
The CEO decided to conduct a business war game to involve his whole management team and putthem in a situation where together they would explore and experiment with the dynamics of themarket. He hoped the war game would help raise morale and build agreement in management about acourse of action.Specific objectives were defined. The war game was to include five teams representing existingcompetitors, one being the market leader. A wild card team would represent a new and as yetunknown competitor with the potential to disrupt the market. Other teams would represent end usersand channels (the firms involved in getting the ITF products to the end users). There was also a teamfor the host firm, a facilitator team, and an umpire team. The war game would simulate the next threeyears, which would be covered by three rounds of play, each representing a calendar year. The focuswas to be on the national market.A half-day pre-war game briefing was conducted three weeks before the war game.The teams each worked in separate rooms, preparing for each round. Rounds 1 and 2 required theteams representing the host team and competitors to assess the overall market, anticipate likelycompetitor strategies, and determine where it would concentrate its efforts. Each team had limitedresources to implement their strategies.The channels and end-user teams had slightly different tasks. It was the role of these two teams toanalyze the decisions from each competitor (including the host team) and reallocate market shareaccording to the "success" or otherwise of their strategies.For round 3, every team took the perspective of ITF and wrote a list of events and trends it saw aslikely in the market (including an estimate of the probability that these would occur) at the three-yearpoint, based on the results of the preceding two rounds of play.A plenary group was chosen to meet and review all of the suggestions arising from the game anddeveloped a grid mapping the events and trends with probability to assess their importance.The war game indicated that ITF would have to shift its strategy from targeting the market share of thedominant firm to targeting smaller competitors to succeed. The other minor players were all focusedon the dominant competitor and not defending their market share from marketing assaults from asimilar-sized firm. Success was, however, seen as possible if this new strategy was adopted. Thewar game also identified strong and weak competitors in the marketplace. The information was takenand used to formulate a new strategic plan.

The war game also had a direct positive effect on team building and morale as contemplated at theoutset of the game.Within four years, the strategy developed through this war game had proved to be so successful thatITF found itself being considered as a major threat by the leader in the market.4
FAROUT Summary
Figure 23.2 War gaming FAROUT summary
Future orientation—High. A business war game is entirely future focused.Accuracy—Medium. The quality of the outcomes from the game will depend on a number of factors.Flaws in the design of the war game may result in information that is inaccurate for meeting thegame's objectives. Inaccurate information provided to players at the outset may skew results. Inabilityof players to properly understand the role they are assuming and play it realistically will have anegative impact on the accuracy of the outcomes.Resource efficiency—Medium. Although the investment required to conduct a business war game ishigh, the returns are also very high. Players will receive valuable training and build relationshipswithin their teams. When analysis of the firm's strategic planning is undertaken, the final plan/s willhave been rigorously tested by the war game, and practical advice about future plans will beavailable.Objectivity—Medium. The objectivity achieved will depend on the sophistication of software used,the game parameters, the impartiality of the umpire team, and the dedication of the players to the wargame process. It is possible to have both very low or very high objectivity—often a result of thequality of the facilitation.Usefulness—High. Forewarned is forearmed.Timeliness—Low. To improve the timeliness of the results, a business war game must be undertakenas early as possible in a planning process. The war game itself will require weeks or months todesign and prepare, depending on the depth of testing and learning required.
Related Tools and Techniques
Blindspot analysis
Competitor analysisFinancial ratio and statement analysisIndustry analysisScenario analysisSupply chain analysisSWOT analysisValue chain analysis
References
Center for the Study of Intelligence; CIA (1999). Psychology of Intelligence Analysis, Chapter 6.Chussil, M. (2005). "Business war games," scip.online, 1(19), June 23, 2005.Chussil, M. (2003a). "The seven deadly sins of business war games, part 1," scip.online, 1(31), May8, 2003.Chussil, M. (2003b). "The seven deadly sins of business war games, part 2," scip.online, 1(32), July10, 2005.Chussil, M.J., and D.J. Reibstein (1998). "Calculating, imagining and managing. Using war games toleverage intelligence and improve strategy decisions," The Journal of AGSI, March.Fuller, M. (1993). "Business as war," Fast Company, Issue 00.http://en.wikipedia.org/wiki/History_of_role-playing_gameshttp://en.wikipedia.org/wiki/WargameKurtz, J. (2002). "Introduction to business war gaming," Competitive Intelligence Magazine,November–December, 5(6), pp. 23–28.Kurtz, J. (2003). "Business war gaming: Simulations guide crucial strategy decisions," Strategy &Leadership, 31(6), pp. 12–21.Kurtz, J., (2005). "Lessons from business war gaming," Competia, March 1, 2005.Reibstein, D., and M. Chussil (1999). "Putting the lesson before the test: Using simulation to analyzeand develop competitive strategies," Competitive Intelligence Review, 10(1), pp. 34–48.Underwood, J. (1998). "Perspectives on war gaming," Competitive Intelligence Review, 9(2), pp.46–52.
Endnotes
1 Quoted by Fuller, 2001.2 Kurtz, 2002.3 Chussil, 2002.4 Adapted from Kurtz, J. (2003). "Business wargaming: simulations guide crucial strategy decisions,"Strategy & Leadership, 31(6), pp. 12–21.
24Indications and Warning Analysis
Short Description
Indications and warning (I&W) analysis is a premonitory technique for regularly and systematicallytracking key assumptions about the task environment and rivals into the future in order to alertdecision makers when the situation changes in a potentially significant and risky way. To anticipateand prevent potentially significant hostile marketplace movements or surprises, I&W analysts try toconnect clues gleaned from what could be massive quantities of complex and evolving data. Donewell, I&W analysis acts as an alarm to decision makers and reduces the incidence of surprise,uncertainty, and risk. I&W also alerts decision makers to developments that run counter to theirplanning assumptions and provides them with a critical understanding of the situation in time to takeneeded actions or precautions.
Background
Traditional I&W methodology has been used for decades by military organizations to determinewhether activities by a potential enemy require a heightened state of alert or readiness. Over time, themethodology evolved whereby events that precipitated aggressive behavior were recorded after anenemy had attacked. These events were then studied to develop models to help decision makersunderstand the specific conditions for a possible attack.1During the Cold War era, both sides of the conflict (NATO and the Warsaw Pact nations) designedsystems to alert them of impending aggression by their rivals. This indicator-based approach requiredintelligence agencies to perform careful and detailed analysis of all actions taken by their rivals andrequired a determination of the actions that needed to be taken or would likely be taken, in order forone side to move from their current position to an attack mode. The analysis also includedconstructing a list of a possible rival's actions, determining which actions could be effectivelyobserved or monitored, weighing and prioritizing the actions, and determining a course of action forone's own side based on the indicator being set.The lessons learned by decision makers during the Cold War have not been entirely lost on firms.Many firms today have systematic methods for monitoring their environment, including the macro-environment, as well as their competitive segments.2These "monitoring" systems are outgrowths of the environmental scanning and tracking systems thatbecame popular in the 1960s, as firms recognized that the broader environment was becoming a morecritical part of the business landscape and that it could make or break their fortunes. Whether theimportance came from pressures delivered by key stakeholders, unique events, or from seeminglyinexorable trends, firms knew that they required better systems to alert them about environmentaldevelopments and then integrate them into their strategy development processes.

A very important facet of the environmental monitoring, tracking, and subsequent analysis process isthe development and implementation of an indicator and warning analysis system. In developing I&Wanalysis processes or systems, many commercial firms relied on adapting systems that were standardearly warning and risk management practices applied by the intelligence communities at the nation-state level.3 The public sector I&W analysis practices essentially try to warn the appropriate andrelevant government decision makers of impending threats of various natures, whether it bebreakdowns in other countries socio-political changes, terrorist activity, pending military actions orcritical policy-related developments.Although I&W analysis initially had more of a premonitory focus, in recent years, its focus has beenmore on serving defensive purposes. In particular, countries are using the method to warn them ofterrorist activities and pending attacks, intrusions into critical digital networks, and how to counterthese activities. There are analogies to this more embryonic activity to firms, who can also apply itfor counter-intelligence and crisis-response activities.We believe that competitive firms—particularly those operating across dynamic markets that includeuniquely motivated and capable rivals (both current and potential) and a multi-national scope—require a similar system.However, when it comes to applying this military developed application to commerce, the key issuesare less easily defined and more ambiguous. In business and competitive analysis, we often talk aboutpersistent market-related problems rather than impending events, and it's often difficult to identify thespecific decision maker that has to be warned. Also there are many instances where a firm can'teliminate or stop a problem; consequently, the analyst must instead focus on dealing with theconsequences of a rival's activity. The question for business and competitive analysts is more focusedon how to develop a usable methodology in this area that can assist in the refinement of theirassessments and provide more robust forecasts. This is where I&W analysis becomes an essentialand beneficial technique for an analyst.
Strategic Rationale and Implications
Firms must be prepared to fight and win in the modern marketplace. This is characterized by largenumbers of highly capable competitors using a full range of conventional marketing tactics, as well asemploying advanced systems along their value chains. In an era of just-in-time processes, shorterproduct life cycles, fragmented and maturing global markets, thinner profit margins, and intensifiedcompetition, time becomes an increasingly important source of competitive advantage. Many firmswho recognize this employ time-based competitive strategies.4 Time-based competitive strategiesrequire firms to strategically use the time dimension related to customers and competitors to improvetheir relative performance in response time, cycle time, on-time delivery, time to market, just-in-timeinventory, and real-time decision making, among others.The nature (that is, intensity, density, speed, and sometimes even finality) of these marketplace battlesmakes "quick response" decision making even more difficult at a time when customer-facingemployees and managers require more effective direction in order to exploit fleeting marketopportunities as well as their rivals' vulnerabilities. Analysts and their systems must be able toprovide decision makers with information concerning their rivals, the nature of the threats, thebroader STEEP environment,5 and the effects of each on the accomplishment of the firm's mission.

I&W analysis is a method that ensures uniformity in the analysis of rivals and the environment, andthe evaluation of the effects of each on their degree of threat, as well as potential collaborativecourses of action.Firms need to shift their focus from the traditional, slow-moving, logical, mature competitive arenasto a new competitive worldview. Many firms lack an I&W capability focusing primarily on the newtypes of threats that are emerging in global markets. Rivals can still operate "below the radar" indifferent countries or markets before larger, higher market share competitors realize what ishappening. Executives remain concerned over the lack of warning capabilities on marketdestabilizing events, including new product introductions, major marketing changes, orannouncements of key strategic relationships.6 It is essential that a methodology for studying thesepreconditions and precipitants of the emerging threats be established.If a firm's business and competitive strategy must factor in change of a type and speed that has notbeen seen before, then an analyst's assessments that underpin the developed strategy have got to beequally dynamic. Firms therefore need to have business and competitive analysis systems that canscan and monitor the environment, continually updating the assessments that are put forward toclients. These systems should also help to identify emerging issues in areas that will be of concern tothe firm in the future, including those areas that may not be currently in its scope.A strategic view that includes I&W analysis helps decision makers to be proactive as opposed tosimply reactive. It is too easy for firms to be overwhelmed by the unrelenting pace or pressure ofevents; consequently, it's only while being proactive that firms will have opportunities to stay aheadof rivals. Astute analysts should be producing analytical outputs and assessments that can supportproactive marketplace strategies, as opposed to simply defensive or threat-reactive ones.7
Strengths and Advantages
I&W analysis forces analysts and decision makers to mutually set business and competitive analysispriorities. This helps firms to overcome the problem of having competitive intelligence staff seekingout "busy work" in the absence of direction or customers' demands and the situation where decisionmakers ask to "get me everything you can about somebody or something," which can waste the firm'sresources.I&W analysis can reduce the waste of intelligence resources—and save money and scarce time,particularly in the data collection side of the larger business and competitive intelligence process.Data collection, in supporting I&W analysis, is clearly focused on gathering reliable information thatcan provide a timely and cost-effective warning. The significance of information is predeterminedfrom discussions between analysts and decision makers, thus facilitating the recognition of significantchange. If the changes are such that they show that the firm and marketplace are moving in directionsnotified in an assessment, or that they are moving away from it, or at a different speed, thatinformation can either be used to update the assessment or a warning generated. Many of thesechanges occur in cycles, requiring analysts and information gatherers to continually feed data into theprocess, updating assessments, refining warnings, and continually adding to the value that they givedecision makers.Combined with other related environmental scanning or tracking systems, I&W analysis can constitutea powerful set of techniques that will assist strategic competitive analysis units to produce dynamic

assessments. I&W analysis should provide insight as a basis for action by strategic decision makers.It should also help analysts to avoid developing "interesting" yet mostly unimportant information fortheir own sake, but rather, intelligence that is of immediate and beneficial use to decision makers indetermining and managing business unit or firm strategies.I&W analysis also helps to establish a proactive mindset in both analysts and decision making. Itgives the firm a better understanding of the current and potential changes that are taking place in theenvironment and should challenge the "current" wisdom by bringing fresh viewpoints into thedecision-making mechanism.The ultimate value of I&W analysis lies in both the content of the analytical output, as well as theprocess used to generate it. At the "product level," the outputs of environmental analysis generallyconsist of descriptions of changes that are currently taking place, indicators of potential changes in thefuture, and alternative descriptions of future changes (the scenario type aspect). At the "processlevel," involving decision makers and analysts in determining data-gathering priorities helps toenhance the competitive and competitor learning atmosphere and mindset that many experts claim isincreasingly needed today.8
Weaknesses and Limitations
Despite the recognition that I&W can serve an important purpose, studies of I&W systems ingovernmental and military organizations through the years have displayed a disturbing theme. Thereare a number of recurring problems found in I&W analysis. These impediments include, but may notbe limited to, the following:9
Inadequate recognition by firms of emerging threats, particularly those of low probability butpotential great danger—examples of disruption in industries and the frequent inability of marketshare leaders to properly address them are plentiful.A consequent inadequate collection against such threats—many firms still lack the processes andsystems for maintaining 365 x 24 x 7 data and information gathering, and tracking capabilities,even for the critical areas of operations, customers, competitors, or global events.Breakdown of information and communication flows between the various parties assigned tasksin the intelligence and planning process—this can occur particularly among those individualsresponsible for gathering important data/information, analysts, and decision makers.Failure by analysts to fully understand rivals and their intentions from the rivals' viewpoints, andremoving the built-in biases affecting both analysts and data collectors that impede reachingtheir objective.Failure by decision makers to heed or give legitimacy to analysts or the minority views.Overwhelmed analysts, analytical systems, and an appreciable lack of proper resources and timeto address anomaly indicators in scenarios.Vulnerability to red herrings, deception, and other Trojan horses used by rivals.
It is a complicated task to interpret events or trends that will manifest themselves in some difficult-to-discern ways in the future. This uncertainty may help gain executive commitment to use and sustainI&W analysis, particularly if the predictions for a designated time horizon are not known.
Conservative mindsets of either the analyst or decision maker can also weaken the effectiveness ofI&W analysis.10 There is also the risk that decision makers might act too slowly on warnings or thatthe I&W analyst has provided poor judgments.I&W analysis is more important in some industries than others. I&W will be highly beneficial in fast-developing industries with high degrees of change. In industries that are mature, exhibit substantiallyless change, or grow very slowly, there will be less need for I&W analysis.The huge growth in data and information available on the Web and open sources has been bothbeneficial and problematic for I&W analysis. The additional data provided through the Web and opensources can potentially contain indicators of competitive rivals' activity or adverse events. Theproblem with this source of data is that the vast majority of the information captured will be noise asopposed to signals. Being able to distinguish between strong and weak signals, signals and noise, andknowing what thresholds should trigger warnings is difficult to build into automated systems(applications or solutions), and very few commercial firms have acquired the ability to perform thisvaluable filtering task with consistently high degrees of success.Effective I&W systems can take many years to develop and to become effective; they often requiretrial and error, and it helps to test I&W analysis and recommendations in simulations and scenarios tounderstand the likelihood that they can effectively predict future actions. The most effective I&Wanalyses are supported by communication and information systems designed to capture anddisseminate potential indicators, which most commercial firms have yet to install and institutionalize.In terms of implementing the technique, it is generally thought that it is more beneficial for analysts tohelp form a group of executives who have an ongoing interaction with I&W processes. This is,however, often not possible in smaller firms or those that are geographically distant. Unfortunately,experience suggests that most firms have not done a good job at connecting I&W participation withappropriate recognition/rewards, thereby rendering it less effective.
Process for Applying the Technique
There is a presumption of surprise as well as incomplete intelligence underlying I&W analysis thatneeds to be understood before a firm can initiate the process. These presumptions require you to beinvolved in what can be exhaustive research in order to build a defensible case underlying theissuance of a specific warning.11 You need to develop intimate understandings of your rivals,resources, structure, history, capabilities, motivations, culture, blind spots, and biases, among otherthings. Some of these are easier to understand than others, making the I&W analysis process a moredifficult task for analysts.We recommend following these four basic steps for performing I&W analysis. They includeestablishing the set of indicators, establishing meaning behind the indicators, validating and rankingthe indicators, and determining alternative courses of action.
Step 1: Establish the Set of Indicators
You should collaboratively work with all the decision makers to identify specific actions or events

that might potentially signal a strategic attack by a marketplace rival. This step assumes that thedecision maker can accurately identify their rivals. For this task, it is beneficial for you and decisionmakers to collaborate and achieve consensus on an appropriate definition of rivals. This definitionmust take into account the vision, mission, strategy, scope, and competitive goals of the firm.Indicators will consist of data or information pointing to those actions or events by rivals that arethought to potentially be a risk to the focal firm and its ability to successfully achieve its marketplacegoals. Indicators are signs or suggestions that certain key things may unfold. They are not guaranteesthat something will happen but are conceptually linked through examination of past significantmarketplace actions by rivals.12 Warnings, which are the eventual manifestations of relationshipsamong the indicators in I&W analysis, are similarly suggestions, hypotheses, or beliefs that someevents will transpire.More specifically, indicators are factors, events (or lack of events), or actions that present asignificant clue about the nature of present circumstances and suggests an eventual end result of aseries of events. They are measurable, observable, and collectible and signal progression toward asignificant competitive action by a rival. Observations of these actions, events, or factors aredescribed as "indications," and information systems should be established to capture them andcommunicate that a "trigger" has been pulled to analysts and decision makers. Some commonindicators that a business and competitive analyst might uncover include those displayed in thefollowing list:
Filing of shareholder lawsuitsWall Street analysts' expectations of a merger candidate's profitabilityPublic statements by public officials about a potential firm actionRumblings of union dissatisfaction shown in "'sick outs"' and potential strike actionIncrease in insider shareholding transactionsSudden and unexpected departures of key executivesSuddenly increasing "'help wanted"' ads in specific mission-critical activity areasUnusual investments in similarly positioned early stage venturesAggressive and unusual asset salesNoticeably stepped-up lobbying activity in state or national capitals
Because there is a difference between expectations (indications or warnings) and reality, it isimportant that you and decision makers come to a realistic shared understanding of the process, itslimitations, and its ability to deliver beneficial outcomes. You need to be able to share warningsabout actions that may not be popular or desirable to the decision maker, and it is important that youretain your objectivity even in light of the possibility of having to deliver either unpopular orinaccurate predictions.One of the best means for performing this identification process is to study the past actions ofcompetitors in the marketplace. These actions need to be classified, sequenced, and studied forunderstanding. The actions may not have all unfolded in linear or logical fashion, creating a need forthe analyst to employ different sets of tools to understand the patterns. These tools can include, amongother things, performing event and timeline analysis (see Chapter 21, "Event and Timeline Analysis"),decision and event trees, trend analyses, pattern mapping, weighted rankings, probability trees, andother problem-solving techniques.The historiographical analysis methods (see Chapter 25, "Historiographical Analysis") can also be
particularly useful in this task. For example, you can use historiographical analysis as one of themeans for answering I&W-related questions, such as the following:
Did the rival signal a major marketplace battle by first introducing a new product in a particulargeographic region?Did the rival start a prior battle by systematically lowering prices across a product line shortlybefore a new introduction?Did the rival begin the last set of aggressive actions after a particular event (for example, after abad quarter or having just replaced a key top executive)?Did the rival line up its distribution channel by creating excess capacity before quickly filling itwith product?
The key for you performing this step is to determine the pattern of activity that rivals use that signals amajor offensive by them in the marketplace and to capture the patterns in the form of indications. Atthe conclusion of this step, you should have determined a set of indications for the particular rival.Comprehensive I&W systems require the development of these indicators for all rivals, both currentand potential.
Step 2: Establish Meaning Behind Indicators
You must consider the following in order to generate insight about the indicators and what theyportend for the firm. This "player-oriented intelligence" is tailored for use within I&W analysis. Webuild upon a concept borrowed from a common formula in criminal analysis, which looks at howcriminals might choose and act upon targets. The five areas we suggest the analysis consider includeanalyzing the rival's motivation, opportunity, capabilities, method, and imminence. Each of theseareas is discussed in turn next.Motivation. It is important for you to try to determine what the rival is hoping to achieve oraccomplish by acting or not acting as the indicator portends. Does the rival see a temporary gap inmeeting customer's needs in the marketplace? Is it trying to shore up a weak business or product line?Is it trying to achieve some additional cash flow to finance a future expansion? Has it picked aparticular point in time to act because it recognizes seasonality or an anomaly in market demandtrends that it believes it can exploit?This is always a tricky facet of the process since predicting rival's intentions requires an intimateunderstanding of the rival. More often than not, you need to isolate your own biases as well as thoseof your firm so that you do not color your insights or understanding of the rival. Additionally, youcannot achieve this intimate understanding solely on the basis of collecting, organizing, andsynthesizing data. You must literally be able to put yourself in the shoes of the rival. Fortunately,several of the techniques described in other parts of this book can assist you in this task, particularlyshadowing (see Chapter 13, "Shadowing"), and war gaming (see Chapter 23, "War Gaming").Opportunity. In addition to understanding a rival's motivation, trying to gauge what opportunity it istruly aiming to achieve becomes important. It is beneficial for you to determine the actual size of theopportunity the rival seeks to achieve. If it is successful, what would be the increase in sales itexpects to achieve and the loss in sales the analyst's firm may experience? How will the "bottom-line" impact be to the rival and the focal firm? How will the rival's success in exploiting the
opportunity impact long-term customer perceptions of the marketplace and competitors? Does thisindicator suggest some cross-market (multi-point competitive) impacts that make it larger in scope orscale than it represents on the surface?There is usually a close positive correlation between the opportunity and the rival's likely course ofaction. The larger the opportunity represented by the indicator is to the rival, the more likely the rivalcan be expected to fiercely compete for it.Capabilities. You should try to determine whether the rival has the resources and capabilities toachieve its aims. Using business and competitive analysis tools like functional capabilities andresources analysis, competitor analysis, value chain analysis,13 and benchmarking (see Chapter 11,"Benchmarking") can help you get to the core of this question.Determining the rival's capability also means determining who the rival is allying with to accomplishits objectives. You should aim to determine, among other things, the following: Who else is involved?Is this being done only by one party (the rival), or is it being assisted by other collaborators? Doesthis indicate new strategic relationships that need to be monitored or actively addressed? If itindicates long-standing relationships, what might that indicate about how the action will roll out in themarketplace?14
Method. This requires you to understand the range and scope of the rival's action. It usually helps tofirst determine whether the action indicated is strategic, tactical, or operational in nature. You canalso determine which of the marketing levers are being pulled to achieve it—starting with aconsideration of the "4Ps" of pricing, place, promotion, and product. Consideration should also begiven to some of the generic forms of offensive movement, such as the following:15
Offering equally good or better products for a lower price.Leapfrogging all industry rivals to the next generation of product or technology.Attacking a competitive vulnerability or weakness of your firm.Purposefully attacking or destabilizing segments of the market in which your firm achieves a highproportion of its profits or its fastest growth prospects.Using hit and run tactics to quickly take market share or sales from your firm while it isdistracted by other events.Maneuvering around rivals and focusing on segments of the marketplace that have yet to becontested or have been overlooked.Learning from the tactics and successes of other firms and applying them to its offerings.Launching a preemptive strike to gain an advantageous position in the marketplace that willdiscourage or prevent your firm from moving toward.
Imminence. The last key concept for generating meaning is to determine how soon the indicatedevent might take place. This will require you to consider what other activities or events need to occurbefore the attack is launched, how much time is needed to launch the attack, how much time isrequired for the focal firm to prepare its response; and when the consequences of the rival's actionsand the focal firm's reactions be manifest in the marketplace and show up in the firm's strategic andfinancial performance. Obviously, the closer these answers are to the present time, the sooner youwill need to accelerate processes so as to give as much advance notice as possible to the decisionmakers in order that the decisions can be made quickly and actions taken to address the rivals.Additionally, most marketplace actions that have long-term competitive impacts tend to follow anormal progression, a dynamics of escalation that looks remarkably similar to the life-cycle concepts
we have discussed. This concept suggests that there are early, middle, and late stages of anymarketplace battles. The most valuable indicators appear early in the roll-out of a market attack, andit is during this stage that analysts must be most vigilant in order to provide their decision makers asmuch lead time as possible. By the time the rival has rolled out the actual action, the damage is mostlydone, and all the firm can do is to try and fire-fight or "crisis manage" the consequences. This resultusually means less maneuvering room or discretion for decision makers, a situation the analystsshould do their best to help their clients avoid.
Step 3: Validate and Rank Indicators Against Threshold Levels toDetermine When Warnings Need to Be Issued
For I&W analysis, it is desirable that, based on the information available, a prediction (the warning)be produced that: (1) indicates the possible causes of the observed information and ranks thosecauses in order of confidence that they could be a cause; (2) based on those indications, predictsother observable mechanisms and consequences associated with those causes; and (3) provides themeans to warn decision makers and other individuals in the firm who will be affected of the actionsand potential consequences prior to those consequences being manifested.It must be remembered that a significant number of indicators are ordinarily required to be presentbefore the I&W system produces a warning. A few events, such as small pricing changes, an increasein hiring, or increasing truck traffic at a distribution center, though possibly important once broughttogether in the bigger scheme of things, would not necessarily trigger a warning.As such, there are a number of questions that you must consider in validating the series of indicatorsyou have identified:
Can you trust the indicator?Is it a signal of a pending event or noise (that is, useless information, or even potentially worse,disinformation meant to confuse the analyst and competing organizations so as not to disclose arival's true intentions)?Who (that is, the source of the data or information underlying the indicator) observed theindicator or communicated of its existence? Are these people trustworthy sources?Did their observation of the indicators come under stressed or natural circumstances?
It is beneficial that you qualify the indication as being on a continuum ranging from high reliability tolow/no reliability. The indications also need to be scored in terms of their imminence, or how quicklythe ensuring events might result in significant actions by the competitor. If the pattern or series ofindicators are both reliable and imminent, then you may consider issuing a warning to decisionmakers. You should always remember that there needs to be a high-quality standard for warnings inorder to gain and keep the trust and confidence of the decision makers. As such, you need to avoid the"Chicken Little" situation in which warnings are issued for any and every rival action, therebydiminishing the decision maker's will to respond and act, and the firm's readiness to address trulysignificant concerns as opposed to minor or insignificant ones.Once a warning is issued, it is provided to decision makers as an estimate of a rival's ability to win amarketplace battle at the given time. This information, coupled with additional data, should allow the
decision maker to make informed decisions about the rival's intentions. If the decision maker agreesthat the warning of the rival's intentions is valid, they can then take the necessary steps to address thesituation before it unfolds in the ways you have suggested.
Step 4: Determine and Recommend Appropriate Firm Responses tothe Warning
You should not consider your tasks completed upon the issuance of the warning. Although this willmark the completion of a particular I&W analysis task, it does not end your responsibilities to helpthe decision makers understand what options are available for the firm so as to maximize the firm'sperformance in light of the warned-about situation.You can alert decision makers to the analyzed facts, to their competitive consequences, as well as apotential series of alternative actions, along with well thought-out scenarios of action and reaction,and cause and effect activities that give the decision maker a keener insight into what decisions andsubsequent actions might result in the most favorable outcome. You must make sure that yourrecommendations allow decision makers and relevant firm members the necessary maneuvering roomto make decisions and take actions. Even if this maneuvering room is apparently not available and thefirm cannot change the inevitable pattern of events about to take place, then at least the decisionmakers were forewarned of it and can begin the process of setting up the policies, procedures, andstructures necessary to deal with the consequences that are ultimately emerging. Additionally, thiswill reinforce the need for you and the firm to monitor the emerging issues, to gauge the speed,direction, and magnitude of the changes decision makers see as being important, and then tocontinually refine those forecasts and scenarios so the decision makers can have confidence in theintelligence that you deliver.
Summary
I&Ws are based on a competitive rival's likely preparations for an assault or attack in themarketplace. Conventional I&Ws include several identifiable events: purchasing of media; hiring ofspecialized employees; new product information being distributed through sales channels; andsignificant changes in communications patterns with any stakeholder along the value chain. Onceobserved, these events are then referred to as "indications." You determine how imminent the threat isby the totality of indications and issue warnings to your decision makers at various threshold levels.However, I&W is normally a methodology restricted to the strategic and operational levels ofcompetition. The new competitive environment requires the development of effective and efficientI&W systems that can separate signals from the noise out of the mass of incoming data. Additionally,they require analysts to work actively and regularly with decision makers in the development ofindicators, as well as acquiring the necessary communication, information, and management supportneeded to maintain this analytical process at effective levels over time. Finally, I&W analysis is notan exact science—predictions can never be issued by analysts without some uncertainty; it meansjudging the probability that certain events (indicators) precipitated by rivals will lead to significant

competitive impacts on the marketplace.
FAROUT Summary
Figure 24.1 Indications and warning analysis FAROUT summary
Future orientation—High. I&W analysis focuses expressly on "industry change drivers," pending orimminent competitor activity, and how developments pose potential surprises. This is one of the moreuseful tools for foreseeing (and hopefully forestalling or minimizing) future crisis situations.Accuracy—Medium. Constantly monitoring competitor activities, events, and established drivers willenhance the levels of accuracy achieved in the application of I&W. However, it is clearly moredifficult to gain a complete understanding and tracking of external factors that underlie indicationsinteract with one another.Resource efficiency—Medium. Developing appropriate indicators requires study of past data.Monitoring activities, events, and trend information can take significant resources. Public sectororganizations (like national military organizations or intelligence agencies) sometimes employ dozensor even hundreds of people to ensure proper utilization. In multinational corporations, I&W can befacilitated through astute usage of software-based solutions and grassroots, informal networksconnected through intranets, and related communication facilities.Objectivity—Low to medium. Dependability rests with I&W analysts and the process they use toarrive at their predictions of rival's future actions. As with many forms of analysis, biases andmindsets may distort true industry shifts in applications of this technique.Usefulness—Medium to high. In industries with high levels of change and uncertainty, I&W analysishas the potential to save the firm from disaster. Even in less-dynamic industries, this technique canreduce surprises, minimize disruptions, and lessen uncertainty in decision making.Timeliness—Medium. Gathering information and analyzing and interpreting can take time. Thenanother team must conjure the scenarios, adding to the timeframe. Once an I&W analysis system isfully operating, triggers in the system can facilitate the analyst's timely warning of activity to theirdecision makers.
Related Tools and Techniques

Blindspot analysisEarly warning analysisIndustry analysisIssue analysisS-curve analysisScenario analysisSTEEP analysisWar gaming
References
Albrecht, K. (2000). Corporate Radar: Tracking the Forces That Are Shaping Your Business. NewYork, NY: AMACOM.Campbell, W.A. (1999). "Traditional I&Ws for host-based intrusion detection," presented at the FirstAnnual Computer Emergency Response Team (CERT) Conference, Omaha, Nebraska. Presentationdocumentation available at http://www.certconf.org/presentations/1999/.Fahey, L. (1999). Outwitting, Outmaneuvering, and Outperforming Competitors. New York, NY:John Wiley & Sons, Inc.Fleisher, C.S., and B.E. Bensoussan (2003). Strategic and Competitive Analysis: Methods andTechniques for Analyzing Business Competition. Upper Saddle River, NJ: Prentice Hall.Fuld, L. (2003). "Be prepared," Harvard Business Review, November/December, pp. 20–21.Gilad, B. (2004). Early Warning: Using Competitive Intelligence to Anticipate Market Shifts,Control Risk, and Create Powerful Strategies. New York, NY: Amacom.Grabo, C. (2002). Anticipating Surprise: Analysis for Strategic Warning. Washington, DC: Centerfor Strategic Research—Joint Military Intelligence College.Herring, J. (2005). "Create an intelligence program for current and future business needs,"Competitive Intelligence Magazine, 8(5), pp. 20–27.Jones, M.D. (1998). The Thinker's Toolkit: 14 Powerful Techniques for Problem Solving. NewYork, NY: Three Rivers Press.Sawka, K. (2001). "Warning analysis: A risky business," Competitive Intelligence Review, 8(4), pp.83-84.Stalk, G., and T. Hout Jr. (1990). Competing Against Time: How Time-Based Competition isReshaping Global Markets. New York, NY: The Free Press.Swanson, S.K. (2005). "I&Ws analysis post 9/11: Analyzing enemy intent," The Vanguard, Journal ofthe Military Intelligence Corps Association, 4th quarter, pp. 11–13.Swanson, S.K. (undated). "I&Ws post 9/11: New strategies for intelligence," retrieved from the Webon March 18, 2006 from http://www.micorps.org/downloads/Swanson_I&W.pdf.Thompson, A.A., Gamble, J.E., and A.J. Strickland (2006). Strategy: Winning in the Marketplace,2nd edition. New York, NY: McGraw-Hill.
Endnotes
1 Campbell, 1999.2 Albrecht, 2000.3 Gilad, 2004.4 Stalk and Hout Jr., 1990.5 See Fleisher and Bensoussan, 2003, Chapter 17.6 Fuld, 2003.7 Gilad, 2004.8 Fahey, 1999.9 Grabo, 2002; Swanson, undated; Swanson, 2005.10 Swanson, 2005.11 Grabo, 2002.12 Swanson, undated.13 See Fleisher and Bensoussan, 2003, Chapters 9, 11, and 14.14 For help doing this, see Chapter 16, "Strategic Relationship Analysis."15 Thompson, Gamble, and Strickland, 2006.

25Historiographical Analysis
Short Description
Historiographical analysis applies a common research methodology used in history studies to strategyanalysis. It attempts to understand strategic issues relative to their origins and evolution in order tomore clearly understand the present. Historiography seeks to identify and interpret events that haveoccurred, as opposed to merely reporting them.1 By placing the present in an historical perspective,historiographical analysis may also beneficially frame future strategic considerations.
Background
Commonly described as "the history of history," historiography is almost as old as history itself.Since time immemorial, humankind has engaged in communicating and preserving their historicalrecords, first through oral tradition and later through written documentation. Initially, the recording ofhistory was done without any systematic consideration of the process of recording history. By thenineteenth century, however, the related field of historiographical analysis was fully articulated tospecifically address two issues related to the recording of history:2
The actual process of historical writingMethodological and theoretical issues related to this process
Historians inherently ask many questions about the past, and they try to answer these questionsthrough their research. To accomplish this, historians must learn how to read a wide variety ofhistorical records for argument (how to know what other writers are arguing; how to ask historicalquestions; and also how to uncover, gather, and assess the soundness of historical sources).Historiographers are ever conscious of the "four Cs" of context, causes, continuity, and change.3In the 1960s, Alfred duPont Chandler was one of the first economic historians and strategists topopularly apply historiography to the study of strategic management. Using this analytical approach,Chandler developed a theory of strategy and structure, as well as a theory explaining the rise ofmanagerialism and business enterprise in America.4Since these early developments, advances in the application of historiography to the field of strategicmanagement have been erratic—the majority of research has been directed toward the academic studyof management and policy. Nonetheless, historiographical analysis represents a promising analyticalprocess that offers many unique insights into competitive behavior and competition. It can be of goodvalue in developing insights that complement strategic decision making.
Strategic Rationale and Implications
Humans by nature are interested in making progress—they build their cultures with tales from the pastof how they have triumphed over adversity, enhanced their conditions and lifestyles, and madeadvances in technology. Society's focus on constant advancement means that we tend to dismiss orforget the historical perspective. The primary purpose for using historiographical methods forcompetitive or strategic analysis is to build business theories that revisit the past in order to explaincurrent strategic issues and competitive conditions. Although the technique is neither necessary norsufficient in the entire strategic analysis or planning process, it can greatly enhance the analyst'sunderstanding of context and activity and provide insights into one's firm or industry.An important fundamental premise underlies the application of historiography to strategic analysis.This premise is that understanding the origins of strategic issues and their evolution through timeprovides a foundation from which to guide today's strategic analysis.5 Historiographical analysis asksthe question: "Why have strategic issues and competitive conditions developed so as to arrive attheir current state?" The answer to this question is essential to properly frame strategic analysis andoften provides clues as to optimal courses for present or future action. Often, the underlying forcesdriving change are closely related to historical precedents. In this way, historiographical analysis canbe viewed as a tool that uses knowledge of the past to examine the present as well as to help projectthe future. For example, understanding the origins and evolution of a path-dependent source ofcompetitive advantage (that is, how the history of a competitive advantage can be explaineddisproportionately by particular events or actions that occurred in the past) can be greatly facilitatedthrough this type of analysis.R.S. Goodman and E.V. Kruger have identified several areas where historiographical analysisprovides for the rigorous development, critique, or defense of propositions or theories. Although theirapplication was designed for the larger field of academic management research, their work is equallyrelevant to generating competitive theories for circumstances facing individual firms; therefore,several areas where historiographical analysis can assist the analyst in generating descriptive orexplanatory theories at the firm level follow:
Research question development—Historiographical analysis starts with a hypothesis (that is,an in-progress or tentative explanation of some phenomena or problem that can subsequently besubject to investigation and testing) that guides the analysis of corroborating sources ofevidence. There is an inherent efficiency in this step that can help you avoid embarking upon a"fishing expedition" through the data and information because, ideally, this will enable you tostructure the parameters of the strategic issue before embarking on further research.Variable selection and evaluation—Analysts using historiographical analysis face similarlimitations to those individuals using other related qualitative techniques. This forces the analystto carefully validate (that is, establish the relative "soundness" of) the sources of informationunderlying their analysis. Historiographical analysis methodology is premised on the principleof objective skepticism, which suggests that skepticism is driven by external forces rather thaninternal bias. This is achieved in two ways. First, historiographical analysis removes bias thatoften afflicts conventional analysis by insisting on initially viewing all information as credibleand valid. This validity is then confirmed or dismissed externally by cross-referencing andtriangulation against other evidence generated by primary and secondary sources.
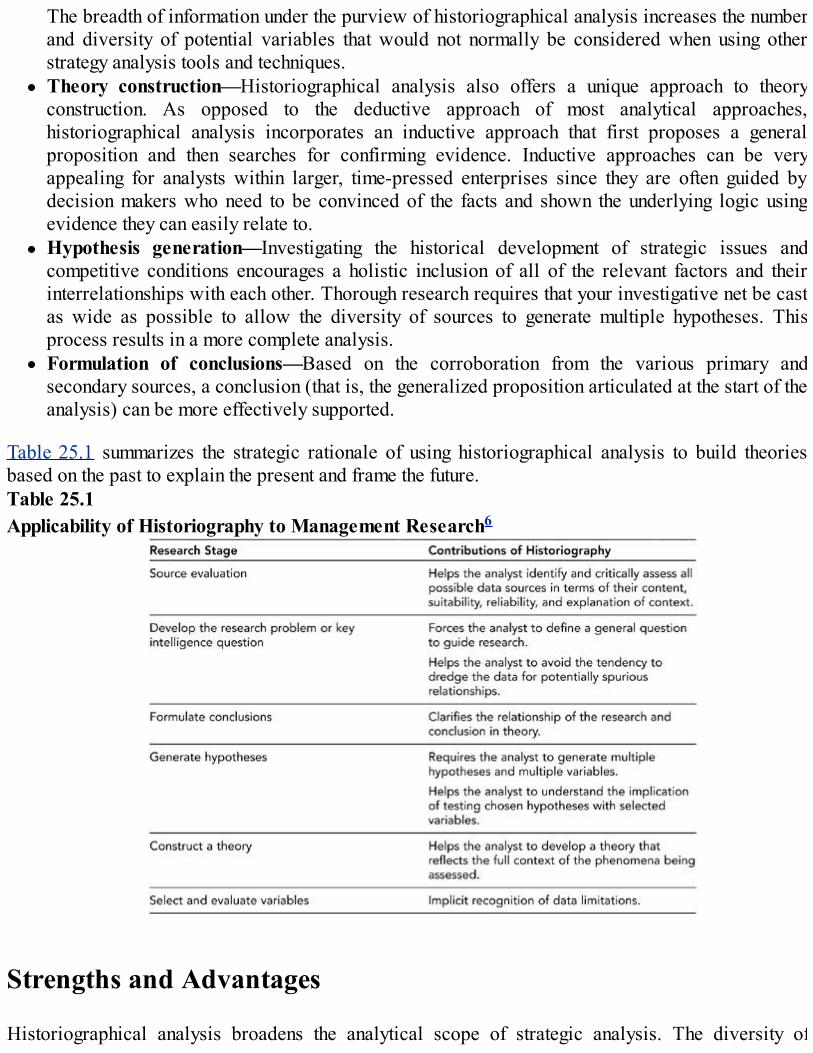
The breadth of information under the purview of historiographical analysis increases the numberand diversity of potential variables that would not normally be considered when using otherstrategy analysis tools and techniques.Theory construction—Historiographical analysis also offers a unique approach to theoryconstruction. As opposed to the deductive approach of most analytical approaches,historiographical analysis incorporates an inductive approach that first proposes a generalproposition and then searches for confirming evidence. Inductive approaches can be veryappealing for analysts within larger, time-pressed enterprises since they are often guided bydecision makers who need to be convinced of the facts and shown the underlying logic usingevidence they can easily relate to.Hypothesis generation—Investigating the historical development of strategic issues andcompetitive conditions encourages a holistic inclusion of all of the relevant factors and theirinterrelationships with each other. Thorough research requires that your investigative net be castas wide as possible to allow the diversity of sources to generate multiple hypotheses. Thisprocess results in a more complete analysis.Formulation of conclusions—Based on the corroboration from the various primary andsecondary sources, a conclusion (that is, the generalized proposition articulated at the start of theanalysis) can be more effectively supported.
Table 25.1 summarizes the strategic rationale of using historiographical analysis to build theoriesbased on the past to explain the present and frame the future.Table 25.1Applicability of Historiography to Management Research6
Strengths and Advantages
Historiographical analysis broadens the analytical scope of strategic analysis. The diversity of
information sources embraced by historiography often presents management with perspectives andinsights routinely ignored by other strategy analysis tools and techniques. In this respect,historiography extends the mental envelope of managers by asking new questions or approaching oldquestions in different ways.As a refined qualitative method of analysis, historiography provides a richer means for illuminatingthe relationship between contexts, causes, continuity, and changes. As such, it focuses on explainingimportant developments in the competitive marketplace by requiring you to study alternativeevolutionary patterns of activity and behavior, either topically or chronologically. This keeps youfrom automatically falling back on their pre-conceived notions or commonly held industry recipes thatcould limit the development of superior future options for enterprise action.The analytical development and subsequent managerial decision-making processes are also improvedby several positive principles inherent in the historiographical approach, particularly throughskepticism and strategic challenge:
Skepticism—Historians, the individuals who most commonly apply this technique, by natureand training accept that history can never be completely recaptured. Therefore, they exist withcompeting accounts and interpretations of facts, making them skeptical of the contents andobjectivity of different competing sources. Employing historiographical analysis encourages youto adopt the mindset of rigorous objective skepticism.Strategic challenge—Historiographical theories cannot be proven in the way we scientificallyassess mathematical proofs or related physical phenomena, and that is, ironically, one of thegreatest strengths of historiographical analysis. As such, established theories are under constantpressure from newer historiographical theories with greater explanatory power. This criticalperspective acts to constantly challenge peoples' assumptions underlying the firm's orcompetitor's strategy.
Weaknesses and Limitations
One of the primary criticisms of historiographical analysis is its perceived lack of objectivity. Muchof the process involves the individual's selection of facts designed to support subjective theories thatare not easily amenable to testing through rigorous statistical analysis. In fact, many observers objectto referring to the final product of historiographical analysis as theory and instead perceive it to be aclose cousin to narrative. However, before dismissing historiographical analysis on this basis, youshould consider the confidence that society places on scientific proof; perhaps the only differencebetween historiographical analysis and other perceptively more robust analyses is the quantificationof uncertainty and subjectivity rather than its elimination.Historiographical analysis is also viewed in many corners as suffering from "prior hypothesis bias."This bias refers to one's tendency to be lulled toward sources or data that support our hypotheses andignore or minimize data that doesn't. The tendency to act in this way needs to be actively combated,and good historiographers are taught to apply techniques that will lessen this potential problem.Another weakness of historiographical analysis relates to the dependence its validity has on one'sview of history. Several common philosophical views of history include the linear view, the circular

view, and/or the chaos perspective. The linear view posits that history is one long continuum ofprogress with very few points of commonality. Conversely, the circular view suggests that history is aseries of overlapping patterns resulting in many points of commonality—it is best described by thekarmic phrase "What goes around comes around." The chaos view asserts that history is totallyrandom with no points of commonality. Obviously, one's philosophical view of history will impacthis or her evaluation of the worth of historiographical analysis. The circular view would seem tooffer the strongest validation of the purpose of historiographical analysis to learn from the past.However, the common occurrence of discontinuities or "disruptions" challenges this view.Historiographical analysis is sometimes derided for its lack of structure. Indeed, the processapproach can appear very loose. Linear thinkers often reject this flexibility, suggesting that the broadscope of induction embraced by historiographical analysis leads to an inefficient and inconclusiveanalysis. This generalization is also seen as a major flaw of historiographical analysis; that is, theanalytical product cannot be used as a universal principle.A final caution regarding the use of historiographical analysis: Problems can arise if the analyst usesthe conclusions to predict the future rather than to better understand the current position. History hasdemonstrated a tendency to frequently repeat itself, although these repetitions are never perfect orexact to prior occurrences. Business analysts know this from their own experience with technology.Not only do advances in technology change how we do things, it changes what we do now and in thefuture. For Kodak and Fuji, a historiographical analysis highlighting the importance of film qualitycould lead these firms astray if it means they fail to recognize that digitization has been renderingtheir chemically based products obsolete. This weakness is overcome when analysts fully recognizethe purpose of historiographical analysis and use it in conjunction with other strategy buildingtechniques outlined in this book.
Process for Applying the Technique
Unlike other more scientific disciplines, historiographical analysis does not begin with a theory fromwhich testable hypotheses are developed. In contrast to the traditional scientific method,historiographical analysis begins with a general proposition and seeks corroborating support from adiverse array of sources using methodologies from many other disciplines. The far-reaching nature ofthe technique requires that the analyst should attempt to become both widely and well read. The CaseStudy, for example, provides a sample of historiographical analysis as applied to the retail industry.
Step 1—Develop a General Proposition
The first step, then, in the historiographical process is to develop a general proposition about astrategic issue or competitive condition. Some examples of such general propositions are thefollowing:
Underlying factors responsible for the prevalence of alliances in a particular industrySpecific reasons for the industry leader's success with a particular type of technologicalplatform
Determination of the dependency of certain strategic assets or capabilities that a competitorowns or controls
This short list underscores the broad scope of historiographical analysis. The competitive issuespotentially under its purview are very expansive and can incorporate influences from any number ofareas.
Step 2—Collect Primary Information
The next step is to seek out primary sources of information. Primary sources include eyewitnessaccounts and accounts from people who were close to the action along various points of the issue'sdevelopment. These sources are viewed as the "first draft of history" because of their firsthand nature(that is, they come "straight from the source," not from or through a second source, such as a reporter)and consistency with the oral tradition that started the historiograhical discipline. As such, they areoften the most valuable source of information because of the limited potential for distortions. Theseprimary sources may come directly to you from participants or observers, be captured in eyewitnessaccounts and surveys, be found in published speeches (in written or multimedia formats) byparticipants at or about the time that the event occurred, or come from experiments or possibly fromoriginal photographic records and the like.
Step 3—Collect Secondary Information
Next, you need to seek out secondary sources of information about the issue under analysis. Typicalsources of information include newspapers, the Internet, magazines, corporate publications, annualreports, analyst reports, trade publications, academic cases, and so on. These accounts can beconsidered as the "second draft" of history because they represent the attempt of various individualsto reconstruct the historical evolution of the various issues through their own interpretations andlenses.Both primary and secondary sources then undergo critical analysis in order to determine authenticity.It is important for you to remain as objective as an historian at the outset of the analysis. This meansyou must initially assume that all sources are neutral and valid; that is, all of the information gatheredfrom primary and secondary sources is expected at the outset to represent what it purports torepresent. This reduces the chances of introducing personal bias into the analysis.At this point, the distinction between primary and secondary sources can serve as a valuable externaland objective legitimacy filter in order to test the validity of the sources. Points of apparentinconsistency can be cross-referenced between primary accounts and secondary accounts. Similarly,different sources within each source category can be checked against each other for accuracy. Afterthis procedure has been completed, you will have answers to several pertinent questions. Is theinformation authentic? Is it legitimate and known to be true? Are the sources free from any perceived,known, or actual bias?

Step 4—Select the Best Sources for the Third Draft
Next, you select those sources that best address the general proposition developed at the start of thehistoriographical process. These sources then represent the raw material for the "third draft ofhistory," the analysis of the evolution of an issue developed as intelligence—not for publicconsumption but as an analytical input to the strategic decision-making process. This requires acritical analysis of all the sources in an attempt to find common threads or continuities in the often-messy web of data that has been culled from the valid primary and secondary sources. These threadsare then woven into a theoretical tapestry that sufficiently supports or explains the originalproposition.
Step 5—Reporting
Consider this process as the reverse of building a standard logical argument. Normally, arguments arefirst built on a set of assumptions or premises that support a conclusion. Logic assumes that ifpremises are valid, then the conclusion that they support is valid. Instead of this standard deductiveapproach, historiographical analysis employs an inductive methodology. It starts with a conclusionwith respect to the general proposition and attempts to secure facts from various sources thatsatisfactorily explain its origin and historical evolution. Through historiographical analysis, you willgain a much richer appreciation of the present conditions and characteristics of a strategic issue. As aresult, a much wider perspective of possible parameters strengthens the analysis of current and futurestrategy.Figure 25.1 The historiographical process
Thus, the process of historiographical analysis can be seen as securing, validating, and, mostimportantly, understanding facts. The interrelationships between the facts provide the foundation fromwhich to build business theories. This process should be continuous because history is continuous andevolving. After all, any theory is only as good as its explanatory power. A continuous process ensuresthat theories are revised as conditions change and issues evolve. New theories should be advanced,and old theories should be challenged. Much of this ongoing analysis should be done formally, but asignificant amount can also be done informally. Historiographical analysis embraces a wider range ofsubject areas and analytical disciplines than most strategic management tools.
Hence, you will be well served by reading from as many different sources as possible. Often the mostobscure source will provide the most colorful threads needed to weave the theoretical tapestry intothe firm's next business idea. In order to increase the possibility of this happening, you should try togather as many different sources of information, ideas, and perspectives as possible. The resultingmental percolation is often the instigation for unexpected flashes of insight that randomly occur, say,during sleep or while taking the daily shower!
Case Study—Australian Menswear Retailer
Gowing Brothers had been a prominent competitor in the Sydney menswear market since 1868. Itssuccess in the volatile menswear market led two researchers to employ historiographical analysis toanswer the question, "What leads to retail success over extended time periods?" After looking at 22case histories of longstanding North American retailers, three critical success factors (CSFs) (seeChapter 18, "Critical Success Factor Analysis," for more about this technique) were identified for theretail industry. These CSFs were as follows:
1. 1. Clear market positioning—This required the outlet to emphasize value, service, and qualityin a clearly identified retail segment.
2. 2 . Distinct periods of expansion or modernization—From 1850–1920, retail expansionfocused on larger facilities. From 1915–1935 and 1946–1960, modernization was pursuedthrough new store designs and structural layouts, new technology, improved merchandisemanagement processes, more sophisticated marketing, and improved human resourcemanagement.
3. 3 . Strong capabilities allowing excellent operational management of the retail mix—Thisincluded focusing attention on customer, staff, and vendor relationships; technology; finance;human resources management; and sales support.
The two researchers started by analyzing primary and secondary sources of information. The primarysources included interviews with the Director and the Marketing Manager. Some secondary sourcesincluded annual reports, ledger accounts, company archives, and newspaper and press clippings.After compiling their data, the researchers put together a detailed chronology highlighting thesignificant decisions that were made throughout the company's history. The following were identifiedas the critical decisions (see Figure 25.2).Figure 25.2 Critical decisions in Gowings' retail history

Each of these decisions were put into a historical context relative to what rivals were doing in thesame timeframe. They were then used to assess critical success factors 1 and 2, as shown previously.Part of this analysis included the strategic implications of the "road not taken"—that is, the decisionnot to expand into the Sydney suburbs, which were growing rapidly throughout the end of thetwentieth century, as several rivals had done at more than one juncture. When it came time to assessCSF number 3, the researchers took a close look at some specific capabilities that fell under the"operations" umbrella, including advertising and promotion, customers, staff and vendor relations,information systems, and financial capability.After evaluating the fit with the framework, the researchers came to the following conclusion:
Flexibility as opposed to constancy of market positioning was determined to be a moderate CSF(CSF 1).Expansion and modernization were determined to be a strong CSF (CSF 2).Operational management was determined to be a medium to strong CSF (CSF3).
As you can see, the framework was found to have a close but not perfect fit to Gowings' experience.This historiographical analysis also generated some important implications. The study highlighted thesignificance of a clearly defined market position and the ability to respond to dynamic marketconditions. Clearly, many retailers respond too slowly to market conditions. Organizationalcapabilities related to good relationships with customers, staff, and vendors were also identified,and, last but not least, CSFs specific to retail categories (for example, niche retailer versus budgetchain) were identified as several unique capabilities. Even after only one iteration, thishistoriographical model yielded several significant insights and a formal framework to criticallyanalyze the retail strategy of specific companies.7
FAROUT Summary
Figure 25.3 Historiographical analysis FAROUT summary

Future orientation—Low to medium. The focus of the analysis is on using knowledge of the past toexplain the present. Projecting this analysis to the future is less valid.Accuracy—Low to medium. Any violations of the critical assumption of recurring historical patternsreduces accuracy. Additionally, this model doesn't handle discontinuity or environmental turbulencevery well.Resource efficiency—Medium. Reliance on secondary sources will significantly increase resourceefficiency.Objectivity—Low. The analysis is heavily dependent on qualitative analysis and selective judgment.Usefulness—Medium to high. Offers unique insights not offered by other tools and techniques.Timeliness—Medium. Highly dependent on the complexity of the phenomena and length of time understudy. A historiographical analysis can be conducted in a relatively short period of time or can takesubstantial time when there are a large number of interacting actors and actions to consider.
Related Tools and Techniques
Analysis of competing hypothesisBlindspot analysisCritical success factor analysisIndustry analysisIssue analysisLinchpin analysisStakeholder analysisSTEEP analysisStrategic group analysis
References
Chandler, A.D. Jr. (1962). Strategy and Structure: Chapters in the History of the AmericanIndustrial Enterprise. Cambridge, MA: MIT Press.Chandler, A.D. Jr. (1977). The Visible Hand: The Managerial Revolution in American Business.

Cambridge, MA: Harvard University Press.Goodman, R.S., and E.V. Kruger (1988). "Data dredging or legitimate research method?Historiography and its potential for management research," Academy of Management Review, April,13(2), pp. 315–325.Iggers, G.C. (1987). Historiography: An Annotated Bibliography of Journals, Articles, Books, andDissertations. Santa Barbara, CA: ABC—Clio Inc.Lawrence, B.S. (1984)."Historical Perspective: Using the Past to Study the Present," Academy ofManagement Review, April, 9(2), pp. 307–312.Miller, D., and B. Merrilees (2000). ''Gone to Gowings—An analysis of success factors in retaillongevity: Gowings of Sydney," The Services Industries Journal, January, 20(1), pp. 61–85.Rampolla, M.L. (2001). A Pocket Guide to Writing in History, 3rd edition. Boston, MA: Bedford/St.Martins.Startt, J.D., and W.D. Sloan (2003). Historical Methods. Northport, AL: Vision Press.Wulf, W.A. (1997). "Look in the spaces for tomorrow's innovations," Association for ComputingMachinery. Communications of the ACM, February, 40(2), pp. 109–111.
Endnotes
1 Goodman and Kruger, 1988.2 Iggers, 1987.3 Rampolla, 2001.4 Chandler, 1962 and 1977.5 Startt and Sloan, 2003.6 Adapted from Goodman, R.S., and E.V. Kruger (1988).7 Adapted from Miller, D., and B. Merrilees (2000).

26Interpretation of Statistical Analysis
Short Description
Statistical analysis involves the manipulation of data using a variety of mathematical formulae anddescription of situations using mathematical concepts. It enables simple description of complexsituations and can give predictive insights.The interpretation of the statistical analysis is the vital link between the manipulation of data and thepractical application of the results to a real-life problem.
Background
Statistics involves summarizing, analyzing, and graphing data. It includes designing strategies for datacollection and information extraction, constructing models for describing and forecasting chancephenomena, and using these models for planning and decision making.1Statistical analysis aims to introduce an element of objectivity into the significance attached toinformation output. In scientific research, statistical analysis is specifically used to objectivelyevaluate the significance of a set of experimental results or of a series of systematic observations.Statistics can be thought of as a branch of mathematics involving the collection, organization, andinterpretation of data. However, statistical analyses are not purely mathematical exercises. Statisticsconcern both the analysis of data and the design of systems for extracting data (for example, surveys).Interpretation is crucial to the value of statistics. The value of the analysis is only as good as thequality of the interpretation. Statistics themselves are not useful and may even be dangerouslymisleading if not interpreted correctly.Statistical analysis in its various forms provides a system for reducing uncertainty in decision makingby inferring patterns, trends, or tendencies in data (and, by extension, in the real-world situationsfrom which the data comes) and distinguishing these from pure coincidences. It should supplement theexperience of decision makers by making available objective information and thereby improving thequality of decisions made.The design of the data collection strategy and the method of analysis are also crucial to theinterpretation of statistics. For example, are the survey questions ambiguous or incomplete? Are themethods being used to conduct the analysis appropriate for the nature of the data? How far can yougeneralize the results of the analysis?
Strategic Rationale and Implications
Statistics provide systematic analysis of data. Data alone does not help with decision-making in
business. Decisions are made on the basis of available information and prior knowledge andexperience. Data becomes information when it is relevant to your specific situation. Statisticalanalysis facilitates the transformation of data into information and so aims to inform the decision-making process.There is a vast amount of data available in modern business. A wide range of record keeping occursthroughout any firm, from financial records, to mailroom records, customer service, and sales results.Statistics allows for systematic analysis and interpretation of data to collate and organize it intomeaningful information.The ideal way to find inferences is to look at all the past data; however, in practice, you will rarelyhave access to "all the data" either because it is not available or because there would be too muchdata to handle. Statistics overcomes this by using a "sample" of data to make inferences about thewhole "population." A population in statistical terms is the entire set of a particular variable—forexample, every sale you have made. A sample is a subset of the population. To get an accuratereflection of the population from your analysis, the sample you use should be representative of theentire population and not biased in any way.A statistical analysis typically arises out of the need to make a decision or answer a question. Thefirst important task in any analysis is the careful formulating of the questions you wish to haveanswered. Once you have worked out what questions you need to answer, you can start collectingrelevant data. The answers you need and the data you collect will also point you in the direction ofwhich statistical method you should adopt to organize the data.Statistical methods encompass a wide range of activities, from some very simple processes you caneasily perform in-house, all the way up to extremely mathematically complex and technical analysesbest left to experts.For example, revenue and cost information is often subject to simple analysis in-house. It is kept andcompared with similar information from the previous quarter or year (or other recording period).Often the comparisons will be made in terms of percentage of increase/decrease.Other statistical analysis may be outsourced to specialist third parties. For example, market research(say, polling or survey research) to investigate opportunities for new products may be contracted out.When these specialists present their results, they will give the numbers and then an interpretation ofthem. You must be able to interpret the results yourself to be able to use them effectively for yourfirm.Interpretation is not only important in relation to complex statistical analyses. Even simple statisticslike percentage increases or decreases in revenue may require some interpretation to ensure theirusefulness. For example, some firms experience regular seasonal fluctuations in revenue, and so apercentage of increase or decrease at one particular time of year may indicate something quitedifferent from the same percentage change at another time of year.
Strengths and Advantages
Statistical analysis is an extremely valuable tool for a firm as it provides systematic and objectivemethods for examining data and extracting useful information from its operations.Statistical analysis can be used to simplify complex problems and provide methods for reviewing andunderstanding data that can be applied in the future.

The availability of computers makes complex and powerful statistical analysis of data attainable foreven small firms. Many widely used standard software packages, such as Excel, include statisticalfunctions that can be applied to databases without having to resort to specialist software.Statistics can provide insight into trends and tendencies in data that reflect trends and tendencies in afirm's business, both now and in the future.The inferences made by statistical analysis can also inform decision-making by supplementing theirknowledge and experience with objective information. In turn, this contributes to the furtherdevelopment of knowledge and experience.The results of a carefully designed statistical analysis can provide objective information about abusiness' performance, its customers, and the marketplace in general. The potential here is thedebunking of prejudices and preconceptions that could be limiting the success of a firm in itsmarketplace.The neutrality of the mathematical processes used in analysis can additionally remove politics fromthe results, and with careful interpretation and presentation, the results of statistical analysis can be avery powerful tool and motivator for change.
Weaknesses and Limitations
Statistical analysis is very easy to misuse and misinterpret. Any method of analysis used, wheneverapplied to data, will provide a result, and all statistical results look authoritative. Carefulinterpretation is essential both to evaluate the analysis and to apply it, in order to avoid being misledby meaningless results.Simplifying a problem or real-life situation by selecting limited data to represent it in order to find asolution using statistical analysis can remove the solution from reality, making it less effective (orineffective) in practice.The process of designing a statistical analysis is very important and complex. Errors at any pointalong the way will seriously compromise the value of the exercise. For example, bias in data is fatalto the usefulness of your results. Bias may occur where the design of the analysis is flawed and thedata considered is limited systematically.One of the biggest potential problems with statistical analysis is the quality of the interpretation of theresults. Many people see cause and effect relationships "evidenced" by statistics, which are inactuality simply describing data associations or correlation having little or nothing to do with casualfactors.The reputation of the individual championing the analysis or the outside consultants presenting theinformation may sway a firm's willingness to accept and use information and ultimately cloud itsability to interpret the realities of the analysis. For example, the neutrality of statistical results(largely being numeric) may make them vulnerable to being interpreted in a manner favorable to thepreservation of preconceptions. Similarly, a lack of understanding of the concepts behind the resultspresented may mean that the results are misunderstood and wrongly interpreted.Another key weakness is that statistics are necessarily backward facing. Analysis is undertaken ofexisting data, and some assumptions must be built into the process of analysis regarding thecontinuation (or changing) of business conditions.Many statistics require the predicting of probability, which is notoriously difficult to do. There are

several common errors made when attempting to judge the probability of an event occurring.Generally people tend to overestimate low-probability events (for example, being in an airlinedisaster) and underestimate high-probability ones (for example, ignoring the greater likelihood thatthey will crash their car close to home). Human beings are also highly likely to allow their ownpersonal experience or anecdotal evidence to distort their perceptions of statistical data.
Process for Applying the Technique
There is a wide range of techniques available for statistical analysis. Some of the concepts are verysimple and easily grasped. Some of the fundamental concepts important in the interpretation ofbusiness statistics are described here.
Percentage Changes
Percentages are probably some of the most basic statistics used, and percentage increases anddecreases are widely understood and used.p = (x – y)/y × 100where:p is the percentage change.x is the new value.y is the old value.Interpretation of percentage increases or decreases can be complicated by a couple of circumstances.The first arises when you are comparing percentage changes across groups. For example, you mightbe looking at the percentage change in sales for two branches of the firm over the period of a year. Intown A, sales increased from 50 to 65, and in town B, sales increased from 50 to 52. The percentageincrease for A is 30 percent, while for B it is 4 percent. Looking at percentage changes only, it is easyto see that the sales team in A deserves a bonus and the one in B needs a shake up.However, care must be taken when interpreting these sorts of statistics. Returning to the precedingexample, it could be interesting to consider population growth in town A and town B to see whetherthere is more to the story.What would happen, for example, if the population of town A had increased from 10,000 to 15,000over the year, and the closure of a major factory in town B led to population stagnation with nochange in the population of 8,000. Percentage changes in sales are not usefully comparable in thissituation. A more useful measure of the changes would be to compare per capita sales in the twotowns.Per capita rates are generally expressed as a figure per 100,000 and are calculated as follows:c = x/p × 100,000where:c is the per capita rate.x is the value of interest.p is the total population.Looking at the per capita sales in A and B, we see that in A, the per capita sales have gone from 500
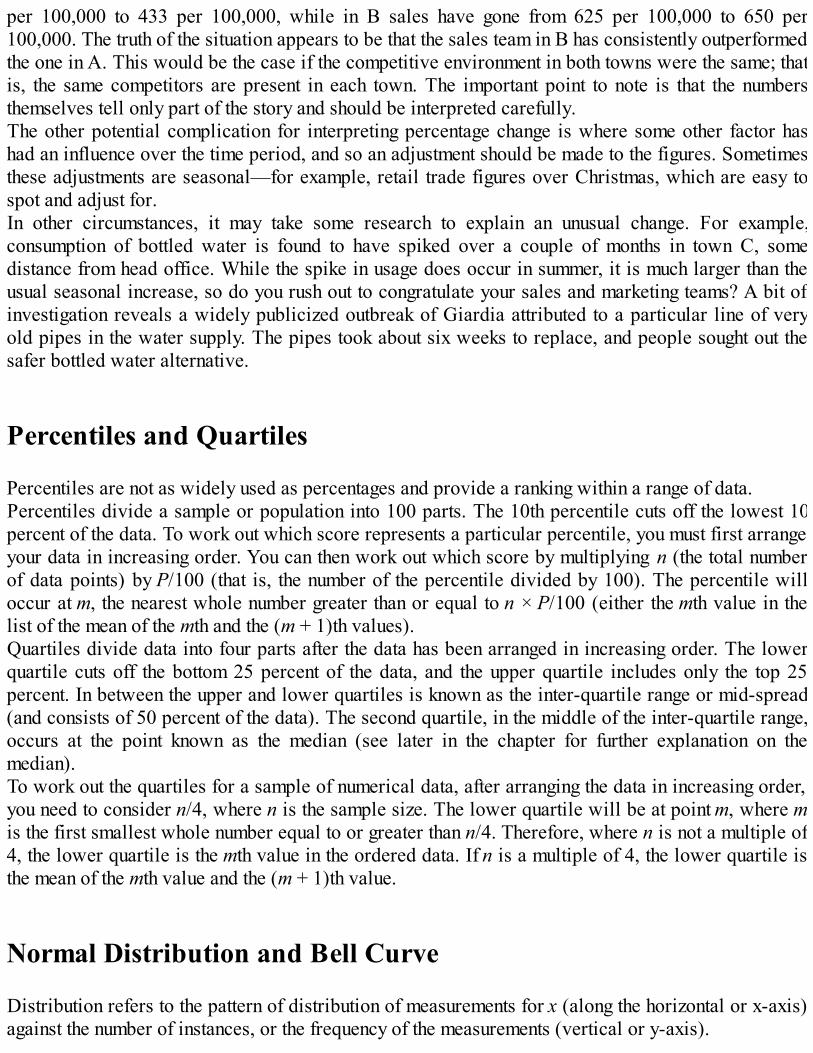
per 100,000 to 433 per 100,000, while in B sales have gone from 625 per 100,000 to 650 per100,000. The truth of the situation appears to be that the sales team in B has consistently outperformedthe one in A. This would be the case if the competitive environment in both towns were the same; thatis, the same competitors are present in each town. The important point to note is that the numbersthemselves tell only part of the story and should be interpreted carefully.The other potential complication for interpreting percentage change is where some other factor hashad an influence over the time period, and so an adjustment should be made to the figures. Sometimesthese adjustments are seasonal—for example, retail trade figures over Christmas, which are easy tospot and adjust for.In other circumstances, it may take some research to explain an unusual change. For example,consumption of bottled water is found to have spiked over a couple of months in town C, somedistance from head office. While the spike in usage does occur in summer, it is much larger than theusual seasonal increase, so do you rush out to congratulate your sales and marketing teams? A bit ofinvestigation reveals a widely publicized outbreak of Giardia attributed to a particular line of veryold pipes in the water supply. The pipes took about six weeks to replace, and people sought out thesafer bottled water alternative.
Percentiles and Quartiles
Percentiles are not as widely used as percentages and provide a ranking within a range of data.Percentiles divide a sample or population into 100 parts. The 10th percentile cuts off the lowest 10percent of the data. To work out which score represents a particular percentile, you must first arrangeyour data in increasing order. You can then work out which score by multiplying n (the total numberof data points) by P/100 (that is, the number of the percentile divided by 100). The percentile willoccur at m, the nearest whole number greater than or equal to n × P/100 (either the mth value in thelist of the mean of the mth and the (m + 1)th values).Quartiles divide data into four parts after the data has been arranged in increasing order. The lowerquartile cuts off the bottom 25 percent of the data, and the upper quartile includes only the top 25percent. In between the upper and lower quartiles is known as the inter-quartile range or mid-spread(and consists of 50 percent of the data). The second quartile, in the middle of the inter-quartile range,occurs at the point known as the median (see later in the chapter for further explanation on themedian).To work out the quartiles for a sample of numerical data, after arranging the data in increasing order,you need to consider n/4, where n is the sample size. The lower quartile will be at point m, where mis the first smallest whole number equal to or greater than n/4. Therefore, where n is not a multiple of4, the lower quartile is the mth value in the ordered data. If n is a multiple of 4, the lower quartile isthe mean of the mth value and the (m + 1)th value.
Normal Distribution and Bell Curve
Distribution refers to the pattern of distribution of measurements for x (along the horizontal or x-axis)against the number of instances, or the frequency of the measurements (vertical or y-axis).

A normal distribution has only one peak. The mean appears in the middle of the peak, and the tailsslope away symmetrically on either side. The curve is bell-shaped and commonly referred to as a"bell curve."Figure 26.1 Normal distribution or bell curve
Calculation of an accurate mean and standard deviation for data assumes that the data spreadapproximates a bell curve.
Summarizing Data with One Value—Central Tendency
There are three ways to characterize the "average" of data: mean, median, or mode. Each is useful ina different situation.Mean—The mean is a measure for the average value of a set of numeric data. To find the mean of avariable, you add each observation you have of that variable together and then divide the total by thenumber of observations you had. In reality, you would not use every single instance of a variable butwould choose a smaller sample to make your calculation.xmean = (x1 + x2 + x3 + . . . xn)/nwhere:xmean is the mean value of the sample.n is the total number of values you are looking at in your sample.x1 is the first data point, x2 is the second data point, and . . . xn is the last data point.For example, say you wanted to find the average delivery time for an order. You decide to use asample of 5 delivery times: 2 days; 4 days; 3 days; 3 days; 2 days. You add 2 + 4 + 3 + 3 + 2 to get atotal of 14. Divide 14 by 5 (the number of delivery times you added together to get the total of 14) tofind the average of 2.8. (Note that, in reality, your customer will not experience 2.8 days as theirdelivery time: They will experience this as 3 days.)A mean is useful because it can be used in a variety of other mathematical formulas—for example,standard deviation. However, the use of a mean to describe the "average" measure in a set of dataassumes a normal distribution of values. In fact the mean can be misleading where your data includesone or a few very high or very low values—that is, data falling outside a normal curve. These veryhigh or very low values are called "outliers."You could consider another example using delivery times. Say you were looking at much the samedelivery times as previously. The first four times were identical, but the last period you were lookingat was 13 days (say, being the time taken to deliver to an international customer). Your new deliverytimes are: 2 days; 4 days; 3 days; 3 days; 13 days. The mean delivery time is now (2 + 4 + 3 + 3 +

13)/5, which is 5. Five days is not a delivery time experienced by any of your customers—it is a lotlonger than most of the local deliveries and much shorter than the international delivery—and so themean is not a useful measure here.One method for overcoming the problem of an outlier (or several outliers) in your data is to calculatea mean that does not include them. When this is done, the exclusion of the outlier values must be notedwhen the mean is discussed.Returning to the second set of delivery times, you might work out your mean using the first four times((2 + 4 + 3 + 3)/4 = 3) and note that 3 days is the mean time for local delivery and that this wascalculated excluding an international delivery time of 13 days.Median—The median is not a calculated average. The observations you have made are arranged inorder of magnitude, and the median is the central point in the array. If the central point is between twodata points, the median is the mean of the two points.For example, when using the first set of delivery times mentioned previously, arranging theobservations would give: 2, 2, 3, 3, 4. The central value is 3 (there are 2 observations below and 2above the first 3 listed), which is the same value given by calculating the mean in this situation.The median is not a measure that can be used in further calculations. It can only be used to summarizeyour set of data.However, the median can be very useful where your data ranges over a wide set of values, some ofwhich are very large or very small compared with most—that is, the exact sort of data that makes amean misleading. In the second set of delivery times, when you arrange the new values in order (2, 3,3, 4, 13), the median is still 3 and so gives a better indication of "average" delivery time than themean and without having to exclude any values.Mode—The mode is the most frequently recorded value for an observation. You can have more thanone mode in a distribution. The mode is not generally used to summarize numeric data, but is veryuseful as a single value summary with categorical information.An example of this could also be taken from delivery data; however, looking at the destination for thegoods rather than the time taken. Say the five deliveries are being sent to New York, Washington,New York, Boston, and Los Angeles. The mode of this data set is New York, which tells you the"average" destination (or destination of the "average" order).
Standard Deviation
The standard deviation gives a measure for the distribution or spread of measures within your samplein relation to the mean. As is the case where you are using the mean to describe the "average" valueof your data, the standard deviation assumes a normal distribution of data.The standard deviation is measured in the same units as the mean. So, for example, where you areexamining order sizes coming into your business in terms of dollars, the standard deviation will beexpressed as a dollar amount.Standard deviation is calculated from the residuals, or differences, between each data point and themean. Each residual is squared before they are all added together. The total is then divided by thenumber of data points in the sample. The square root of that value is your standard deviation. Theformula can be written as:
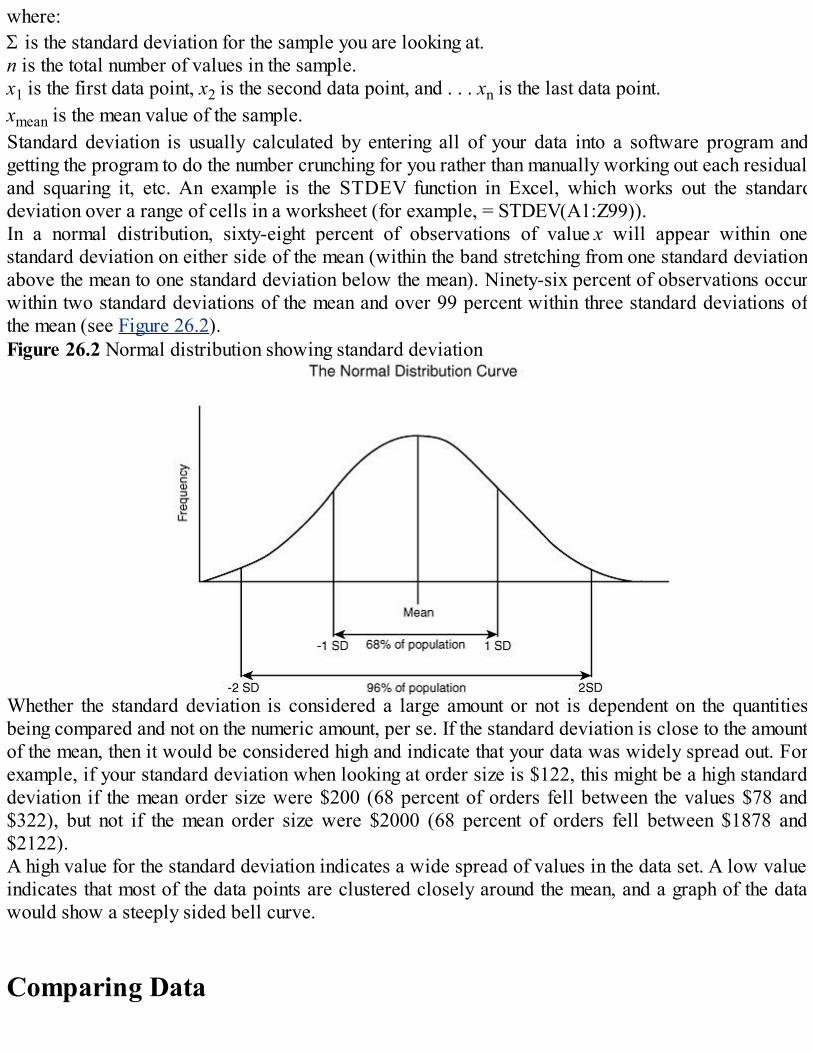
where:S is the standard deviation for the sample you are looking at.n is the total number of values in the sample.x1 is the first data point, x2 is the second data point, and . . . xn is the last data point.xmean is the mean value of the sample.Standard deviation is usually calculated by entering all of your data into a software program andgetting the program to do the number crunching for you rather than manually working out each residualand squaring it, etc. An example is the STDEV function in Excel, which works out the standarddeviation over a range of cells in a worksheet (for example, = STDEV(A1:Z99)).In a normal distribution, sixty-eight percent of observations of value x will appear within onestandard deviation on either side of the mean (within the band stretching from one standard deviationabove the mean to one standard deviation below the mean). Ninety-six percent of observations occurwithin two standard deviations of the mean and over 99 percent within three standard deviations ofthe mean (see Figure 26.2).Figure 26.2 Normal distribution showing standard deviation
Whether the standard deviation is considered a large amount or not is dependent on the quantitiesbeing compared and not on the numeric amount, per se. If the standard deviation is close to the amountof the mean, then it would be considered high and indicate that your data was widely spread out. Forexample, if your standard deviation when looking at order size is $122, this might be a high standarddeviation if the mean order size were $200 (68 percent of orders fell between the values $78 and$322), but not if the mean order size were $2000 (68 percent of orders fell between $1878 and$2122).A high value for the standard deviation indicates a wide spread of values in the data set. A low valueindicates that most of the data points are clustered closely around the mean, and a graph of the datawould show a steeply sided bell curve.
Comparing Data

Statistics are often used to test whether there is a real (significant) difference between two groups orcircumstances or conditions. This sort of test can be used to measure the effectiveness of some changemade to one of the groups prior to measurement. An example would be to test whether a marketingcampaign had successfully increased awareness of a new product. Another use for this sort of test isto investigate whether the same group or circumstance has changed over time (so the same thing ismeasured on two occasions). An example of this would be to test whether your attrition rate amongyour customers had changed over time or had not.These sorts of tests require a null hypothesis. A null hypothesis proposes that there is no differencebetween two groups or circumstances or that something has had no effect.The test used to compare means of two groups is called the t-test. It investigates whether two samplesare likely to have come from the same population (and are, therefore, not different from one anotherstatistically).t = (mean1 – mean2)/standard error of the difference between the meansCalculation of the standard error of the difference between the means uses the sample size (n) and thestandard deviations of each sample. It is a measure of the variability or dispersion of the two groups.The t-score resulting from the test is then compared with a table of t-scores, which will say whetherthe t-score obtained indicates a significant difference between the groups or that there was nosignificant difference. The significance of the difference is expressed using a p-value (see "P-Values"later in the chapter for further explanation).
Regression Analysis
Looking at two instances of the same value or factor can be useful for investigating changes in it overtime. Other comparisons can be used to investigate relationships between two different factors orproperties (measured at the same time).A simple example of two properties that might be related would be height and weight for a sample ofpeople. You could display the results as a scatter plot, showing each person on the plot representedby a point indicating their height (in centimeters on the y-axis in Figure 26.3) and their weight (inpounds on the x-axis in the figure). The convention is that the value or factor you want to predictappears on the y-axis, so Figure 26.3 would be used to predict approximate height of a person fromthe population the sample came from, given a specific weight.Figure 26.3 Scatter plot of weight against heightSource: Adapted from McNeil, D., Middledorp, J., Petersons, M., and P. Shaw (1994) . ModernStatistics: An Introduction, Macquarie University.

Relationships between the two properties or values plotted on a scatter plot are summarized by aline. This is called regression analysis of the data.There are several methods for investigating the strength of a linear relationship between properties.
Straight Lines
Where a scatter plot displays data with points approximating a straight line, you can draw in a lineapproximately fitting the data, as shown in Figure 26.4.Figure 26.4 Line fitted to scatter plot
The line gives you a rough method for predicting a value for y given a particular value for x.A point on a straight line is represented by the formula:

ypredicted = a + bxwhere:ypredicted is the value you are predicting.a is the intercept (where the line would cross the y-axis at y = zero).b is the slope of the line.x is the known value.The value of a and b for any line can be calculated using the coordinates of any two points on the line;the coordinates for the points are x1,y1 and x2,y2.a = (x2 × y1 – x1 × y2)/(x2 – x1)b = (y2 – y1)/(x2 – x1)Using the example in Figure 26.4, we can see that the value of y predicted by the line for the pointwhere x=160, is 50 (the point on the line is 160,50). Similarly, where x=170 we can see the linepredicts y=60 (the point on the line is 170,60). Substituting into the formula for a and b, we get thefollowing:a = (170 × 50 – 160 × 60)/(170 – 160) = –1100/10 = –110b = (60 – 50)/(170 – 160) = 10/10 = 1For predicting data along the line in Figure 26.4, the formula is: ypredicted = –110 + 1x
Goodness-of-Fit
When you draw a straight line through data, you are predicting a value for y for each value for x. Theactual measures you have for y values will differ from the predicted values for y by an amount calleda residual.The "goodness-of-fit" of your data to the line tests the accuracy of the formula for your line inpredicting new values for y by finding the standard deviation of the residuals, or more precisely fromthe sum of squares of the residuals:
There is also an actual standard deviation, which is calculated using the same formula as for sresidualsbut uses the mean of the y values rather than the y values, as predicted by the formula for the linearrelationship.The standard deviation of the residuals is then used to calculate r2:r2 = 1 – sactual residuals/sresiduals
The r2 value will be between 0 and 1, and the closer to 1, the better is the fit and the more accuratethe formula for the linear relationship is at predicting y values for a given x value.
Lines That Are Not Straight
Sometimes data distribution will approximate a line, but not a straight one. A common example of thisis an exponential curve (see Figure 26.5).
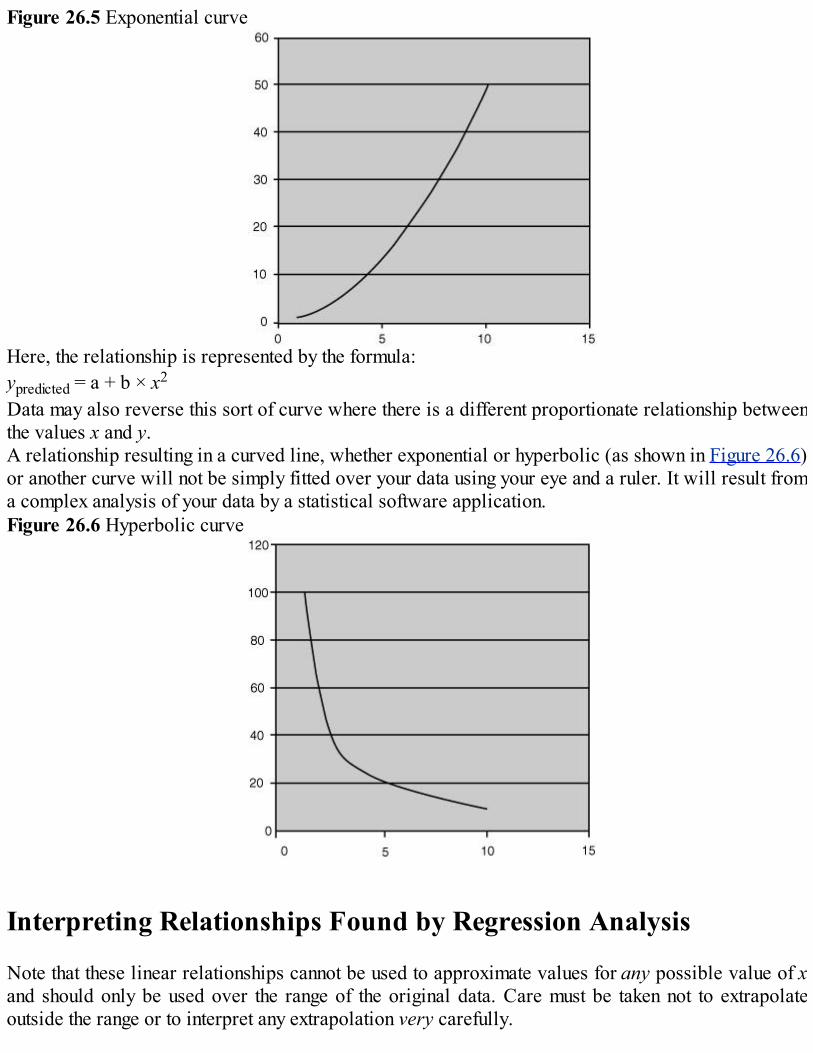
Figure 26.5 Exponential curve
Here, the relationship is represented by the formula:ypredicted = a + b × x2
Data may also reverse this sort of curve where there is a different proportionate relationship betweenthe values x and y.A relationship resulting in a curved line, whether exponential or hyperbolic (as shown in Figure 26.6)or another curve will not be simply fitted over your data using your eye and a ruler. It will result froma complex analysis of your data by a statistical software application.Figure 26.6 Hyperbolic curve
Interpreting Relationships Found by Regression Analysis
Note that these linear relationships cannot be used to approximate values for any possible value of xand should only be used over the range of the original data. Care must be taken not to extrapolateoutside the range or to interpret any extrapolation very carefully.

Data points outside the original range may be inaccurate or even absurd. For example, consider thepoint on the line in Figure 26.4 where x is zero: No one has a weight of zero any more than they mayhave a height of –110.Another important point is that a formula for a linear relationship does not imply that changes in xcause changes in y. The formula is simply a method for predicting new y values.
Correlation
Correlation is a form of regression analysis. It is mentioned separately because it is such a widelyused concept. As with all regression analysis, correlation gives an indication of the tendency for onething to occur in relation to the tendency for another to occur.The correlation coefficient calculated for the data indicates the strength of the association between thetwo properties. It will be a number between –1 and 1. The closer the absolute value of the correlationcoefficient is to 1, the stronger the association.Note that as was the case when discussing relationships previously, a high correlation coefficientdoes not prove the existence of a cause and effect relationship between two events.The correlation coefficient is the same r that was calculated when calculating the goodness-of-fit of aline to data (it is the square-root of the r2 value).
P-Values
P-values are used to describe the significance of a statistical finding. They relate in part to thenumber of observations used to reach the conclusion and the magnitude of the observations.A statistical test is often based on the idea of a null hypothesis. A null hypothesis proposes that thereis no difference between two groups or circumstances or that something has had no effect.For example, if you wished to investigate whether a marketing campaign was successful, you mightcompare responses to a survey from two groups of customers—one group who had been exposed tothe campaign and one who had not. The null hypothesis would be that there should be no difference inthe responses of the two groups.Where a p-value is given as 0.05, this means that if the null hypothesis is true (and there is nodifference between the two groups you are testing), you would only have a 5 percent chance of gettingthe results from a sample group that you in fact got. In other words, if you found a statisticaldifference between the groups, then saying the difference was significant at p=0.05 indicates that thechance that the difference arose purely by coincidence is only 5 percent.
FAROUT Summary
Figure 26.7 Interpretation of statistical analysis FAROUT summary
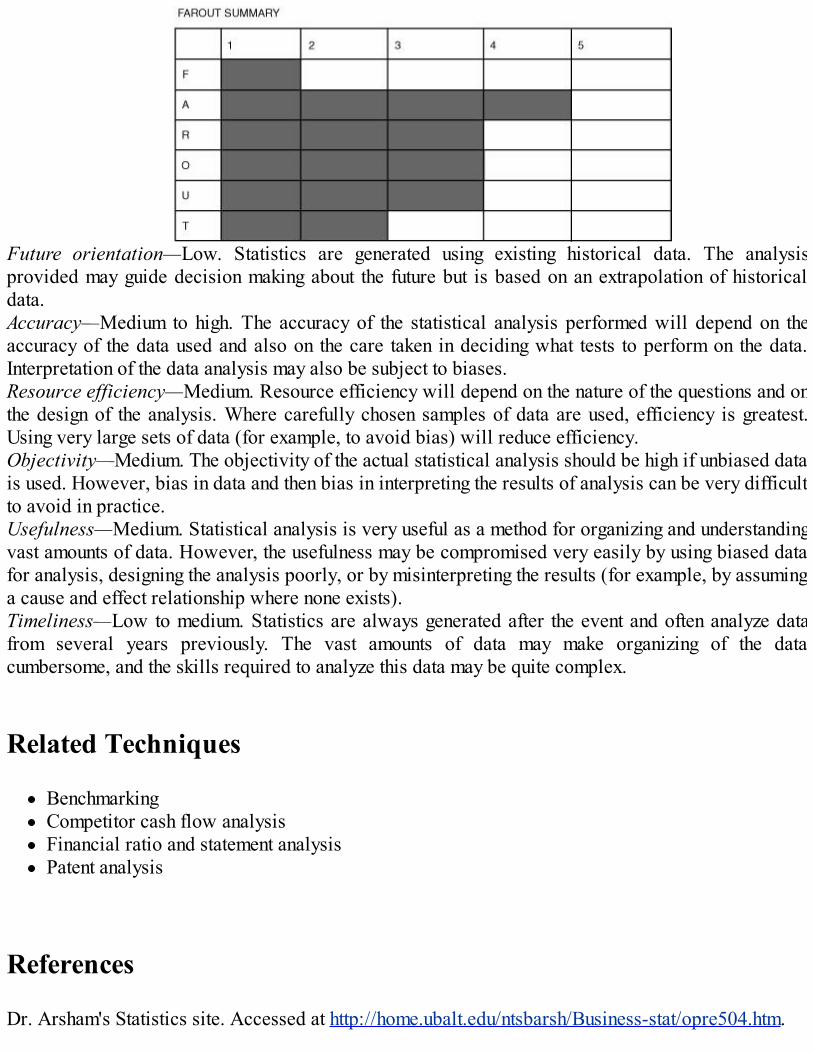
Future orientation—Low. Statistics are generated using existing historical data. The analysisprovided may guide decision making about the future but is based on an extrapolation of historicaldata.Accuracy—Medium to high. The accuracy of the statistical analysis performed will depend on theaccuracy of the data used and also on the care taken in deciding what tests to perform on the data.Interpretation of the data analysis may also be subject to biases.Resource efficiency—Medium. Resource efficiency will depend on the nature of the questions and onthe design of the analysis. Where carefully chosen samples of data are used, efficiency is greatest.Using very large sets of data (for example, to avoid bias) will reduce efficiency.Objectivity—Medium. The objectivity of the actual statistical analysis should be high if unbiased datais used. However, bias in data and then bias in interpreting the results of analysis can be very difficultto avoid in practice.Usefulness—Medium. Statistical analysis is very useful as a method for organizing and understandingvast amounts of data. However, the usefulness may be compromised very easily by using biased datafor analysis, designing the analysis poorly, or by misinterpreting the results (for example, by assuminga cause and effect relationship where none exists).Timeliness—Low to medium. Statistics are always generated after the event and often analyze datafrom several years previously. The vast amounts of data may make organizing of the datacumbersome, and the skills required to analyze this data may be quite complex.
Related Techniques
BenchmarkingCompetitor cash flow analysisFinancial ratio and statement analysisPatent analysis
References
Dr. Arsham's Statistics site. Accessed at http://home.ubalt.edu/ntsbarsh/Business-stat/opre504.htm.

Levin, R., Rubin, D., Stinson, J., and E. Gardner (1989). Quantitative Approaches to Management.Singapore: McGraw-Hill International Editions.McNeil, D., Middledorp, J., Petersons, M., and P. Shaw (1994). Modern Statistics: An Introduction,Macquarie University.
Endnotes
1 McNeil et al, 1994.

27Competitor Cash Flow Analysis
Short Description
Cash flow is often described as the "life blood" of a business. While profit is a reasonable measureof performance (due to the "matching concept" of accrual accounting), it is a very poor measure ofviability. Cash flow is the prime measure of viability and also is a major determinant of operatingflexibility—the ability to fund new initiatives and to defend against competitive attacks.This chapter considers both historic and future cash flow analysis. While historic cash flow analysisadds a little to our understanding of a business, its underlying strength, and the ability of managementto cope over the business cycle, it is future cash flow that is the most valid in determining viabilityand future flexibility. Naturally, any consideration of the future will be subject to the validity andreasonableness of the assumptions made. Hence, forecasting cash flows requires a current analysis ofa business and its environment, as shown in other analytical techniques throughout this book.Cash flow analysis is not sufficient in itself to understand a business or its competitors—it onlyprovides a partial view of the environment. However, it can significantly enhance the overall analysisand provides a useful cross-check on the reliability of other analytic techniques.This chapter discusses the various definitions of cash flow. It does not address the simplistic andcommonly used definitions of earnings before income tax (EBIT) and earnings before deductinginterest, tax, depreciation, and amortization (EBITDA). Rather, a proper analysis needs to considerthe cash effects of balance sheet items—changes in working capital and capital expenditure needs.
Background
Strangely, there has been little study of cash flow analysis, certainly in comparison to the wealth ofstudies on profit analysis.The "statement of cash flows" was the last of the major accounting statements to be added to firmannual reports in the early 1990s. This was largely in response to the spate of corporate disastersduring the global recession. Banks and other investors had been misled by reported profits to believethat companies were viable. To highlight the difference between profit and cash flow, the statement ofcash flows was added. It is the only information in the financial statements that is not based onaccrual accounting. It is divided into three sections—operations, investing, and financing.Early attempts at cash flow analysis were still largely based on accrual accounting statements. One ofthe first determinants of viability was deemed to be the current ratio—the ratio of current assets tocurrent liabilities. However, even as far back as 1919, Alexander Wall found that the current ratiocould be volatile and was not necessarily a good predictor of failure—its changes were driven byfactors other than failure.1Research carried out by Winaker and Smith found that the benchmarks for ratios were industry-

specific; that is, adjustments needed to be made for "good" or "bad" results depending on theindustry.2 So we begin to see that cash flow analysis cannot be done in isolation of a single firm; weneed to benchmark and understand the industry in order to make sense of cash flow analysis.Nonetheless, the current ratio remains one of a handful of favorite ratios used by bankers and appearsin loan document covenants for both large and small firms, and across industries.In 1966, William Beaver published a seminal paper that focused attention on cash flow, albeit stilllimited to accounting ratios. Beaver's preference was to use ratios that give some indication of cashflow: "Cash flow ratios offer much promise for providing ratio analysis with a unified framework."3
Following the corporate disasters of the 1991–1992 global recession, cash flow analysis gained moreprominence and "Cash is King" became a popular catch cry.Investors such as Warren Buffet (see the Berkshire-Hathaway annual reports) declared theirpreferences for cash flow:
"In the long run, managements stressing accounting appearance over economic substance usuallyachieve little of either.""Our acquisition preferences run toward businesses that generate cash, not those that consume it .. . However attractive the earnings numbers, we remain leery of businesses that never seem ableto convert such pretty numbers into no-strings-attached cash."
At the same time, cash flow analysis (specifically, discounted cash flow (DCF) analysis) became thedominant and theoretically preferred method of valuation, gradually supplanting simplisticcapitalization ratios, such as price/earnings multiples. The use of DCF analysis and "net presentvalue" has not been as dominant as could be expected, largely because of the complexity of theanalysis (and thus the scope for calculation errors) and the poor environmental analysis used to checkthe reasonableness of the assumptions.However, in 2001, McKinsey and Co. published a revised document on valuing dot.com companiesfollowing the spectacular collapse of the overvalued bubble companies. The opening line to thedocument is, "Investment values always revert to a fundamental level based on cash flows. Get usedto it."4
Most investment banks use DCF analysis as their major valuation technique for acquisitions and eventheoretical share values. Several investment analysts use "long-term cash flow" as the primedeterminant of a firm's value.Finally, banks are attempting to become "cash flow lenders"; that is, the prime decision is made onwhether the borrower can generate sufficient "free cash flow" to service the debt (pay the interest andmeet the loan repayments).Today, while the principles of cash flow are well recognized, the practice still has far to go. WhenBHP bought the Magma Copper assets in the U.S. in 1995, it paid A$3.2 billion. The value waslargely based on the amount of copper reserves and the price of copper. Due diligence apparentlyfailed to discover that Magma Copper had little in the way of copper reserves (as CRA had foundearlier, when it walked away from a Magma Copper purchase). Also the copper price used in themodel was at an all-time high, assisted by price manipulation by one rogue trader in SumitomoCopper. When the copper price collapsed shortly after and the lack of copper ore became apparent,BHP wrote off more than A$2.5 billion of its investment.
Strategic Rationale and Implications

Cash flow analysis is not just about firm viability.First, free cash flow is a major determinant of financial flexibility. Does the firm have the scope tomake new investments or to take new strategic directions? Free cash flow, or at least access to furthercash resources, also determines the firm's ability to undertake major investments that do not haveearly payback.The classic measure of the dot.com companies when determining if their strategic plans were viablewas their rate of "cash burn" and their level of cash reserves. Certainly, many of the dot.coms burnedcash at unsustainable levels.Second, free cash flow is a major strategic strength. Strong cash flow in some business units allows afirm to commit to implementing strategies in other business units.This was recognized in a simplistic fashion in the Boston Consulting Group (BCG) matrix of stars,cash cows, problem children, and dogs.5 The idea is to have enough cash cows to support the starsthrough their growth (but cash negative) phase and perhaps to move problem children across to starstatus. However, the BCG model is over simplistic in that there are many more factors involved indetermining cash flow than a reliance on market share.Cash flow analysis provides an additional financial viewpoint of a business.Despite the obvious link between cash flow and viability, surprisingly, historic cash flow does notshow a significant correlation to failure. The difficulty lies in the ability of companies to stave offfailure, at least in the short term, by falling back on sales of assets, tapping other sources of finance,and so on.Ward, for example, argues for a cash flow theory whereby firms need to maintain cash flow stability(between operations, investing, and financing) to achieve financial health and stability. An event suchas declining sales or rising costs can cause financial stress on the firm. How management responds iscritical to the restoration of equilibrium.Foster and Ward argue that an examination of the interactions between the operating, investing, andfinancing cash flows can indicate at what stage of financial stress the firm is in and providesinformation on management's actions for correction.Certainly, examples can be found to support this assertion (see the Burns Philp case study later in thischapter). However, many more examples can be found where a firm is not in distress but wheresimilar interactions are occurring in its cash flows.The findings in numerous studies—by Godbee, Casey, and Bartczak, and other researchers—showthat historical cash flow analysis by itself does not prove to be a good predictor of distress.Proponents also point out that cash flow analysis is less susceptible to the manipulations of creativeaccounting.Certainly, there is more scope with "creative accounting" to dress up both the "income statement" (theprofit and loss statement or statement of financial performance) and the balance sheet (the statementof financial position). Capitalizing expenses, deferring expense recognition, bringing forward revenuerecognition, and ignoring some accruals are just a few of the means to manipulate accrual accounts.Cash is cash, and it is less amenable to be manipulated on the timing issues. For example, in the sixmonths before Enron went bust, it reported an accrual profit of some US$800 million (much of whichwas recognition of revenue on long-term contracts that would not be realized for up to 20 years). Onthe other hand, operating cash flow was negative in the amount of US$1,300 million—the reality ofcash versus the window dressing of profits.This does not mean that cash flow is immune to manipulation. WorldCom demonstrated this byswitching cash flows between operating and investing categories. However, the scope for

manipulation is much more restricted.Cash flow also highlights the style and goals of management. An example was the Australian firm,David Jones, when controlled by the Adsteam Group. According to all the statements and publicannouncements, David Jones remained a conservative, high-end retailer. However, a check of thestatement of cash flows gave a very different picture. Over 70 percent of the cash flows for DavidJones had nothing to do with the conservative business of retailing. The cash flows showed that mostof the activity was high-risk share trading (apparently trading in shares of other members of theAdsteam Group).The breakdown of cash flow according to operations, investing, and financing provides further detailon the sustainability of a business and its strategies.Australian retailer Brash Holdings is an example. Founded in 1862, it floundered more than 130years later due to a flawed strategy and operating performance. Although the operating margins (forexample, sales margins) and gearing ratios were steadily deteriorating, the funds analysis stressedthat the strategy was not sustainable and could not wait for improvement. (Funds analysis was theforerunner to cash analysis until the more accurately timed cash flow statements became available.)From 1989 to 1991, the firm invested well over A$100 million in stock, equipment (shop fittings) andgoodwill on acquisitions as it pursued its strategy of 30 percent per annum growth—the solearticulation of its strategy was to become the fourth-largest retailer in Australia by 1996. But wherewas the money coming from? Only 16 percent was coming from operations—and more than half ofthat was leaking out again in the form of high dividend payments. Suppliers were funding over 42percent of the business, and debt was the other main source of funding. Such funding was onlysustainable until suppliers and banks ran out of patience.A refinement of this analysis is the "sustainable growth rate" calculation.6 Robert Higgins introducedand defined this concept in 1977. It is a measure of how fast a firm can grow its sales withoutblowing out its target gearing ratio. Stripped to its bare essentials, the rate is determined by fourfactors: the required asset level to support sales; the sales margin; how much profit is leaked out ofthe firm in the form of dividends; and the gearing level. To grow faster, the business must eitheradjust one of these parameters or inject more equity.In the example of Brash Holdings, its deteriorating performance and high dividend payments meantthe sustainable growth rate was less than 5 percent per annum. While there were some equityinjections, the plummeting share price eventually cut off this source of funds. Rather than face reality,the firm continued to blow out its gearing, particularly by stretching its creditors beyond reasonablelimits. Reality eventually hit.
Strengths and Advantages
Cash is cash, and cash flow analysis provides greater insight into the financial viability of a business.Further, cash flow analysis is less susceptible to the manipulations of creative accounting due to thetiming issues of cash in and out of the business.The breakdown of historic and future cash flows according to operations, investing, and financingprovides detail on the sustainability of a business and its strategies, and highlights the style and goalsof management.However, future cash flow analysis is the most valid tool for assessing a firm's viability. Thus, for

bankers, it is also the most valid decision-making tool for lending, especially to large corporationswhere security, typically, will be only 40 percent or less of the loan value.Cash flow modeling provides a virtual laboratory model of the business and its environment—thebusiness has a forecast of what cash surpluses or shortages will be available in future years. Someanalysts now refer to such surpluses as "strategic cash flow"—it is cash surplus that can be used fornew investments, returns to shareholders, or reducing liabilities.A well-crafted cash flow forecast model not only provides a forecast of the cash flows, it allows thebusiness situation to be tested. Typically, sensitivity analysis asks "what if" questions. What happensto cash flows if sales rise or fall by 10 percent, if collection of debt slows down, or if additionalcapacity is required, and so on? Several "what if" conditions combined form a scenario analysis. Forexample, if a new competitor enters the market or a price war breaks out, the model can calculate theeffect on sales, prices, and so on, and show the resulting effects on cash flow.As such, cash flow forecasting is one of the major tools for assessing the severity of risks.Calculation of the probability of an event occurring is a separate aspect that requires environmentaland competitive assessment.
Weaknesses and Limitations
Sadly, cash flow analysis is done rarely and poorly. The main reasons for this are not conceptual, butpractical. Complex future cash flow modeling is difficult, time-consuming, and prone to error.Modeling of a major project, such as opening a large coal mine or infrastructure project, may requiresix months or more to research the inputs and build the model. Large models also may have thousandsof lines of equations, and the scope for error is considerable, especially when running sensitivityanalysis. Some organizations attempt to use audited templates, but the "one size fits all" methodusually results in a behemoth of a model that mimics the human genome project—some 90 percent ofit is redundant and unused.Building a model from scratch provides much greater insight into a business, but this requires moreskill and usually more time.Finally, the validity of any model rests on the validity of the assumptions on which it is built. The oldcomputing saying of GIGO (garbage-in, garbage-out) applies. A seemingly small difference inassumptions can have enormous ramifications.As a consequence of the skills needed, the time and cost involved, and concerns over the scope forerror, cash flow forecasting for investment or strategic purposes is not done as widely as it deserves;this is despite the ready availability of computing power and software such as Excel. Instead, we seecompanies and banks falling back on simple (but invalid) measures such as EBIT and EBITDA.These measures can be calculated in a matter of seconds, but they are really quite some way from thereal free cash flow of a business. Even making adjustments, such as deducting capital expenditurefrom EBIT, does not provide much of a refinement.Cash flow forecasts are still done in detail for liquidity planning purposes. However, despite thedetail, such models are usually constructed using little more than a listing of revenues and expenses,and with limited calculation. When properly designed and used, the models can be powerful tools.For example, if there were only two major domestic airlines in a country, complex modeling of yourcompetitor's airline could provide simulation of the effects of price movements, route changes, and
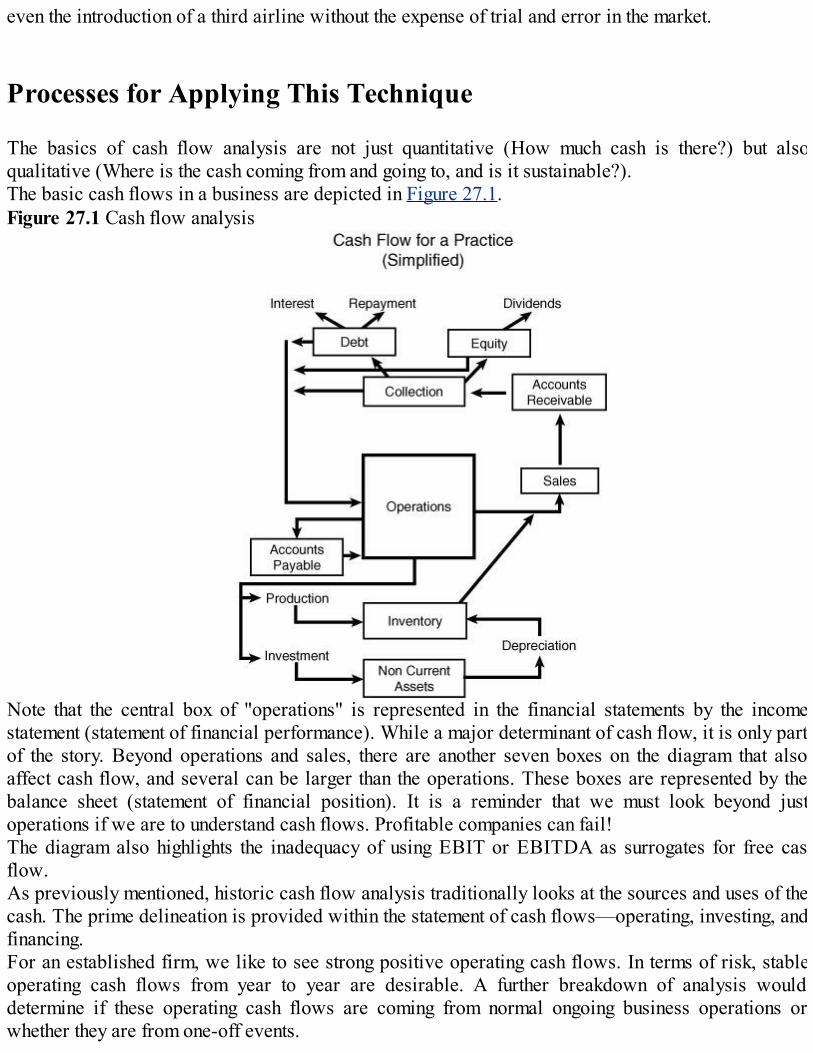
even the introduction of a third airline without the expense of trial and error in the market.
Processes for Applying This Technique
The basics of cash flow analysis are not just quantitative (How much cash is there?) but alsoqualitative (Where is the cash coming from and going to, and is it sustainable?).The basic cash flows in a business are depicted in Figure 27.1.Figure 27.1 Cash flow analysis
Note that the central box of "operations" is represented in the financial statements by the incomestatement (statement of financial performance). While a major determinant of cash flow, it is only partof the story. Beyond operations and sales, there are another seven boxes on the diagram that alsoaffect cash flow, and several can be larger than the operations. These boxes are represented by thebalance sheet (statement of financial position). It is a reminder that we must look beyond justoperations if we are to understand cash flows. Profitable companies can fail!The diagram also highlights the inadequacy of using EBIT or EBITDA as surrogates for free cashflow.As previously mentioned, historic cash flow analysis traditionally looks at the sources and uses of thecash. The prime delineation is provided within the statement of cash flows—operating, investing, andfinancing.For an established firm, we like to see strong positive operating cash flows. In terms of risk, stableoperating cash flows from year to year are desirable. A further breakdown of analysis woulddetermine if these operating cash flows are coming from normal ongoing business operations orwhether they are from one-off events.

In the case of the airline Qantas, it is in a risky industry, and its financial gearing is also high, withdebt usually matching equity to give a high debt-to-equity ratio of 1:1 or 100 percent. Yet Qantas isone of the few major airlines that has maintained an investment quality credit rating. This is largelyachieved by careful management of its operating cash flow. Despite issues with terrorism, wars,SARS, and other external events, Qantas can generally achieve an operating cash surplus of aroundA$1 billion each year.We understand that start-up companies may have negative operating cash flow during their start-upperiod. Ideally, such shortfalls would be funded mostly by equity investors. To determine theviability of the start-up's business plan, we need to know the rate of their cash burn and how muchcash they hold in reserve.We also understand that growing companies, both start-ups and established firms, will generally havenegative net investing cash flows. There are a few exceptions, such as Woolworths, which haslimited capital needs for expansion and can fund much of its expansion in sales from the positive networking capital management it achieves. We become concerned, though, if the investment cash flowsare hugely negative compared to the operating cash flows, especially if this continues for severalyears in a row.Finally, we like to see a balance of funding from financing activities. If the firm is growing and needsto raise capital, both equity and debt need to grow proportionately in order to maintain a stablegearing ratio.In the case of Qantas, it was in the middle of a major capital investment program, a number of yearsago, to refurbish its fleet of aircraft. Consequently, cash flow from investing activities have been (andshould continue for a few years) running negative by several billion dollars a year. Due to thedifficulty in raising the share price, most of this investment has been debt funded. By 2003, Qantas'already high debt-to-equity ratio had risen from its normal 100 percent to 121 percent. By that stage,ratings agencies would have been watching it. During the next few years, Qantas changed itsoperational tack, slowing reinvestment in its fleet and increasing its operating cash flow surplus tonearly A$2 billion a year. The excess cash was used to repay debt. Added to retained profits, the debtratio fell back to 100 percent in 2004 and to 86 percent in 2005. Qantas found it necessary to adjustits operating strategy to recover its financial strategy—that Qantas management was able to adjust tothese needs would have been favorably viewed by the investment community.The relevant ratios on Qantas are shown in Table 27.1.Table 27.1Financial Ratios for Qantas
Of course, analysis of a firm's historical cash flow is improved if it is compared, if not actuallybenchmarked, against its industry peers.
Future Cash Flow Analysis
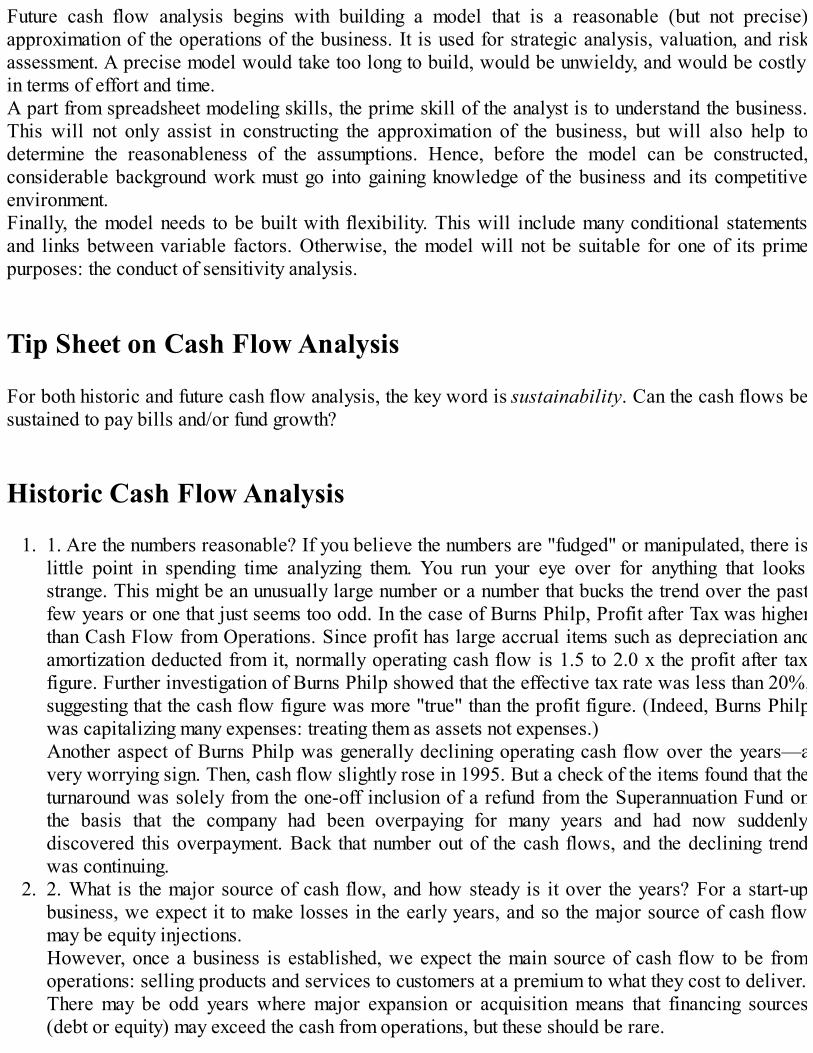
Future cash flow analysis begins with building a model that is a reasonable (but not precise)approximation of the operations of the business. It is used for strategic analysis, valuation, and riskassessment. A precise model would take too long to build, would be unwieldy, and would be costlyin terms of effort and time.A part from spreadsheet modeling skills, the prime skill of the analyst is to understand the business.This will not only assist in constructing the approximation of the business, but will also help todetermine the reasonableness of the assumptions. Hence, before the model can be constructed,considerable background work must go into gaining knowledge of the business and its competitiveenvironment.Finally, the model needs to be built with flexibility. This will include many conditional statementsand links between variable factors. Otherwise, the model will not be suitable for one of its primepurposes: the conduct of sensitivity analysis.
Tip Sheet on Cash Flow Analysis
For both historic and future cash flow analysis, the key word is sustainability. Can the cash flows besustained to pay bills and/or fund growth?
Historic Cash Flow Analysis
1. 1. Are the numbers reasonable? If you believe the numbers are "fudged" or manipulated, there islittle point in spending time analyzing them. You run your eye over for anything that looksstrange. This might be an unusually large number or a number that bucks the trend over the pastfew years or one that just seems too odd. In the case of Burns Philp, Profit after Tax was higherthan Cash Flow from Operations. Since profit has large accrual items such as depreciation andamortization deducted from it, normally operating cash flow is 1.5 to 2.0 x the profit after taxfigure. Further investigation of Burns Philp showed that the effective tax rate was less than 20%,suggesting that the cash flow figure was more "true" than the profit figure. (Indeed, Burns Philpwas capitalizing many expenses: treating them as assets not expenses.)Another aspect of Burns Philp was generally declining operating cash flow over the years—avery worrying sign. Then, cash flow slightly rose in 1995. But a check of the items found that theturnaround was solely from the one-off inclusion of a refund from the Superannuation Fund onthe basis that the company had been overpaying for many years and had now suddenlydiscovered this overpayment. Back that number out of the cash flows, and the declining trendwas continuing.
2. 2. What is the major source of cash flow, and how steady is it over the years? For a start-upbusiness, we expect it to make losses in the early years, and so the major source of cash flowmay be equity injections.However, once a business is established, we expect the main source of cash flow to be fromoperations: selling products and services to customers at a premium to what they cost to deliver.There may be odd years where major expansion or acquisition means that financing sources(debt or equity) may exceed the cash from operations, but these should be rare.

3. 3. We are concerned at the use of "risky" sources of funds. In the case of retailer BrashHoldings, the major source of funds was suppliers (trade creditors), which was more than fourtimes the cash from operations. A check of the days payable ratio showed that the creditors werebeing stretched out on their payment terms—a risky and short-lived strategy.
4. 4. We are also concerned if most of an expansion strategy is being debt financed. There shouldbe a balance between debt and equity (to maintain gearing ratios). Debt financing is even moredeadly if there is an overly generous dividend payout policy so that too much cash fromoperations is "leaked" out of the business to the shareholders. A debt-funded expansion strategy,particularly through aggressive acquisitions, is one of the highest correlating factors forcorporate distress.
Future Cash Flow Analysis
1. 1. Again, sustainability is the big issue. Have the cash flows come from ongoing, sustainableoperations or are they from one-off items that cannot be guaranteed? That is where Newscorpran into difficulties in the early 1990s. The business changed from a fairly stable newspaperpublisher in Australia, Britain, and America into a satellite broadcasting start-up in Britain aswell as purchasing Fox movie studios, to try to establish Fox as a new TV network in America.Cash flow became volatile while costs and debt-servicing commitments remained steady.
2. 2. If presented with a cash flow forecast especially in a spreadsheet form, again you need to testif the forecast is correctly calculated before going into detailed analysis. Look for strangenumbers that are unusually large or buck the trend when looking across time periods. Are thecalculations correct?
3. 3. Is everything included in the forecast? A common mistake is to leave out the effect of growthon working capital needs. When Power Brewing trebled its production capacity, the spreadsheetused by its bank did not include the extra stock and debtors required to service such anexpansion. This neglected some $10 million of funding needed to support the business.
4. 4. Next, with a cash flow forecast, are the assumptions reasonable? Projections always lookgood on paper—how many companies are going to show a declining business or cash flow? Butdo the assumptions tie up with the numbers today, and what can be expected going forward?Remember, you cannot reasonably have four suppliers in a market, with each claiming 60%market share.To assess the reasonableness of assumptions, the analyst had to understand the industry, thecompetitors, and the business. Cash flow forecasts should not be pulled "out of thin air" but arerather the embodiment of several pieces of background analysis.
5. 5. Finally, the real power of cash flow forecasts, especially in a computer spreadsheet, issensitivity and scenario analysis. The model can be used to assess the impact of risk events.What if a competitor starts up a price war; or if a major customer defaults; or if the equipmentsuffers a major breakdown; and so on? Combining several of these sensitivities will develop ascenario as with Power Brewing.
Cash flow analysis is not normally complete in itself but is rather a good tool to combine severalanalytic techniques and to be used as a cross reference to other techniques.

Case Studies
Because this chapter has considered both historic and future cash flow analysis, a short case study oneach aspect is provided next.
Historic Cash Flow Analysis: Burns Philp
Burns Philp was incorporated in 1883 and operated as a diverse group in shipping (one of the long-standing South Seas Traders), retailing, insurance, and trusteeship.Burns Philp became involved in yeast manufacture in the 1980s when it bought a long establishedAustralian producer, Mauri Bros. In the 1990s, Burns Philp made a series of expensive acquisitionsin the herb and spice business—mainly in America, but also in Germany, the Netherlands, andBritain.Burns Philp then encountered more severe competition than it had when it had expanded globally inyeast. There were entrenched competitors who would not (indeed, could not) yield market share toBurns Philp. McCormick Foods in particular proved to be an entrenched and determined competitor.For McCormick, defending its retail spice business was a matter of life or death.When Burns Philp's investment in the spice business was written down by the auditors by close toA$1 billion in 1997, it nearly wiped out its entire equity. The firm was in breach of its loancovenants, and its life was only maintained by the banks not foreclosing on it.The share price plunged from A$1.50 to just 6 cents in a matter of weeks. Most commentators focusedon the sudden fall of Burns Philp. Ian Horton of the Investment and Financial Services Associationwas quoted in February 1998 as saying that Burns Philp was a business "going from being a verysuccessful one to a basket case in a very short space of time." Certainly, most equity analysts andcorporate investors had not realized the desperate situation of Burns Philp when they made their stockrecommendations or large investments a few months earlier.How much of Burns Philp was a surprise? The benefit of hindsight unearths the clues, but were theyevident before the event? Most commentators focused on the profits and the grand internationalgrowth strategies. At least one analyst, Helen Cameron, had a different view (perhaps aided by a stintas strategy planning manager in Burns Philp). When asked well before the crash why she had leftBurns Philp, she simply commented: "Look at the cash flows."The financial statements (balance sheet, profit and loss statement, and statement of cash flows)reviewed are from 1992 to 1995. These statements cover a period of two to five years before thecrash.Objective analysis shows some issues of great concern in a supposedly strong firm. For a start, weare concerned about the reliability of the reported profit figures. The profit and tax figures for 1993 to1995 are tabled next.
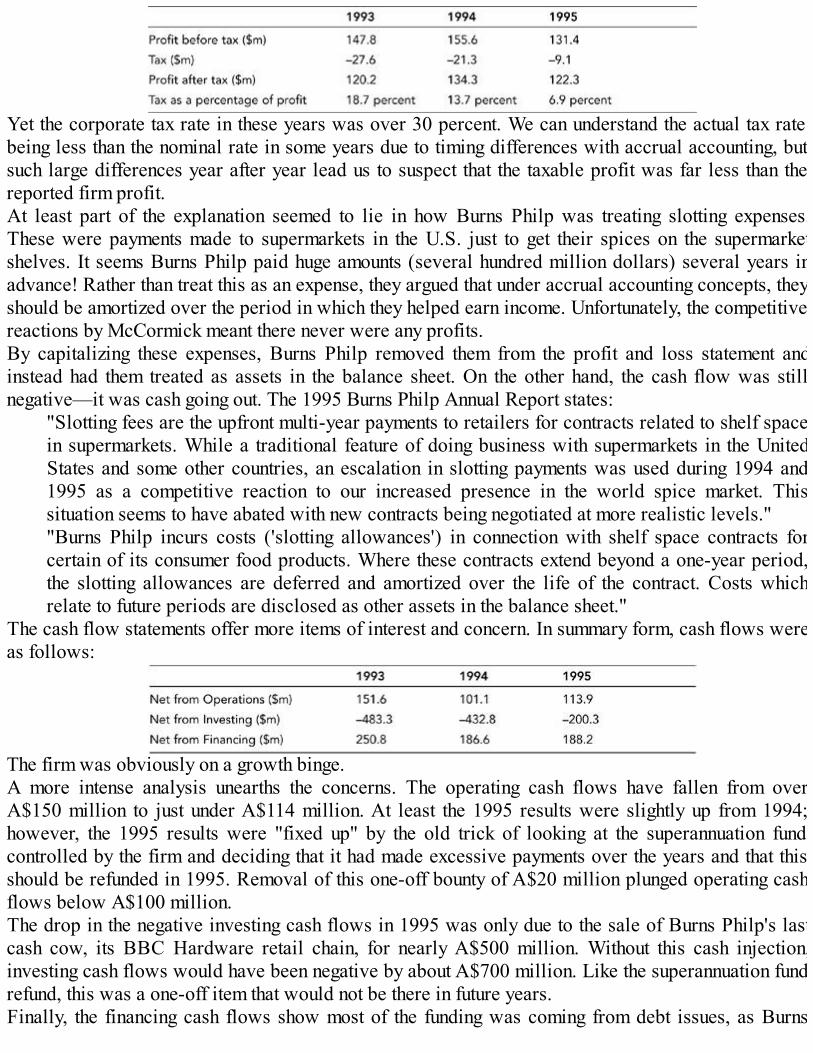
Yet the corporate tax rate in these years was over 30 percent. We can understand the actual tax ratebeing less than the nominal rate in some years due to timing differences with accrual accounting, butsuch large differences year after year lead us to suspect that the taxable profit was far less than thereported firm profit.At least part of the explanation seemed to lie in how Burns Philp was treating slotting expenses.These were payments made to supermarkets in the U.S. just to get their spices on the supermarketshelves. It seems Burns Philp paid huge amounts (several hundred million dollars) several years inadvance! Rather than treat this as an expense, they argued that under accrual accounting concepts, theyshould be amortized over the period in which they helped earn income. Unfortunately, the competitivereactions by McCormick meant there never were any profits.By capitalizing these expenses, Burns Philp removed them from the profit and loss statement andinstead had them treated as assets in the balance sheet. On the other hand, the cash flow was stillnegative—it was cash going out. The 1995 Burns Philp Annual Report states:
"Slotting fees are the upfront multi-year payments to retailers for contracts related to shelf spacein supermarkets. While a traditional feature of doing business with supermarkets in the UnitedStates and some other countries, an escalation in slotting payments was used during 1994 and1995 as a competitive reaction to our increased presence in the world spice market. Thissituation seems to have abated with new contracts being negotiated at more realistic levels.""Burns Philp incurs costs ('slotting allowances') in connection with shelf space contracts forcertain of its consumer food products. Where these contracts extend beyond a one-year period,the slotting allowances are deferred and amortized over the life of the contract. Costs whichrelate to future periods are disclosed as other assets in the balance sheet."
The cash flow statements offer more items of interest and concern. In summary form, cash flows wereas follows:
The firm was obviously on a growth binge.A more intense analysis unearths the concerns. The operating cash flows have fallen from overA$150 million to just under A$114 million. At least the 1995 results were slightly up from 1994;however, the 1995 results were "fixed up" by the old trick of looking at the superannuation fundcontrolled by the firm and deciding that it had made excessive payments over the years and that thisshould be refunded in 1995. Removal of this one-off bounty of A$20 million plunged operating cashflows below A$100 million.The drop in the negative investing cash flows in 1995 was only due to the sale of Burns Philp's lastcash cow, its BBC Hardware retail chain, for nearly A$500 million. Without this cash injection,investing cash flows would have been negative by about A$700 million. Like the superannuation fundrefund, this was a one-off item that would not be there in future years.Finally, the financing cash flows show most of the funding was coming from debt issues, as Burns

Philp increased its debt levels by over A$200 million each year.This showed a firm with declining operating cash flows despite a massive investment program thatwas debt funded. This was a recipe for disaster. Add some operating failures such as the spicebusiness (plus others), and Burns Philp came close to failure.In the end, it survived because the banks could see little value in a wind up, and the majorshareholder, Graeme Hart, and a few fellow investors tried to save their investment by puttinganother A$300 million into the firm to try to turn it around.Objective cash flow analysis shows the disaster in the making several years before the supposed"sudden collapse." Strategic competitor analysis would also have given some cause for alarm, but thehardest evidence was in the cash flow statements. As a leading financial commentator has said, BurnsPhilp's survival was dependent on the actions of Robert Lawless, CEO of McCormick Spices in theU.S. One would suspect that Lawless took one look at Burns Philp's operating cash flows, coststructures, and high gearing and decided to "put the shaft in so hard he just brought them right down."
Future Cash Flow Analysis: Power Brewing
In the early 1990s, banks were just starting to learn about becoming objective cash flow lenders.Computer-based cash flow modeling was in its infancy.Leading Australian businessman, Alan Bond, had taken over the State of Queensland's own beer: theCastlemaine Brewery. He did the same in New South Wales with Tooheys. This followed hisacquisition of the small Western Australian brewery, Swan.In no time, Alan Bond had alienated his distributors (the pub owners) and his consumers (thedrinkers). Trading terms were tightened, goodwill components in pub leases were ignored, and thepackaging was changed to read brewed by Swan Brewery, Perth (Capital of Western Australia).Bernie Power was one of the largest pub owners in Queensland and had been toying with the idea ofopening a brewery. Suddenly, Alan Bond had tapped the keg of his idea. Bernie Power launchedPower Brewing. It quickly claimed status as Queensland's real beer, and soon the brewery wasselling at capacity with a 20 percent price premium, so keen were drinkers to avoid the Alan Bondbeer brand. Power Brewing quickly achieved a 10 percent share of the Queensland market.If you are at full capacity, the next obvious step is to triple capacity.So, Power Brewing (by then a public company) borrowed some A$48 million from the bank to tripleits capacity.The bank developed a spreadsheet to look at future cash flows. The base case model showedgenerous future cash flows as tabled next. Year 1 was negative due to the capital investment in theexpansion. The cash flow shown is free cash flow after all operating items and capital expenditure.
Unfortunately, the spreadsheet had an error. Working capital movements were ignored. Since the firmwas tripling production and sales, working capital would also approximately treble, especially asBernie Power offered reasonably generous payment terms to his fellow publicans. The effect was anadditional negative A$10 million in the first year of expansion.Of even greater concern was that the assumptions were simplistic and not reasonable. Prices weredeemed to rise with inflation (which historically had not happened) and, even more illogically, the 20percent price premium was expected to be maintained despite now saturating the market. Other
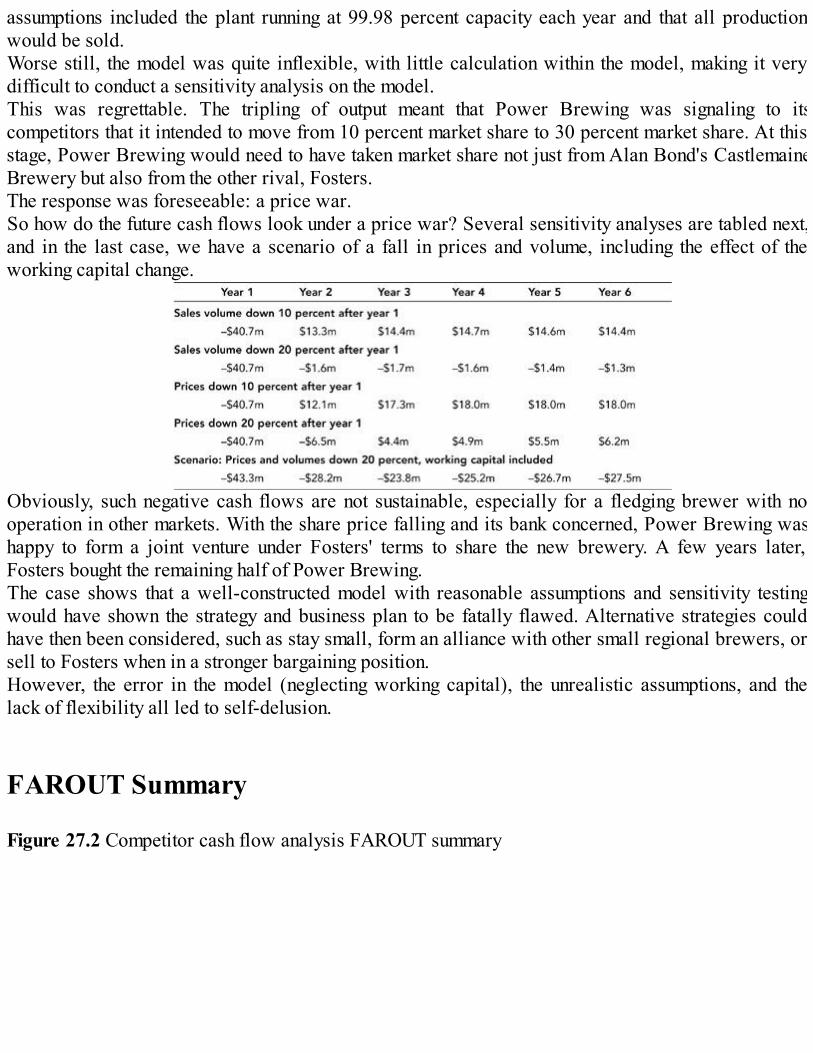
assumptions included the plant running at 99.98 percent capacity each year and that all productionwould be sold.Worse still, the model was quite inflexible, with little calculation within the model, making it verydifficult to conduct a sensitivity analysis on the model.This was regrettable. The tripling of output meant that Power Brewing was signaling to itscompetitors that it intended to move from 10 percent market share to 30 percent market share. At thisstage, Power Brewing would need to have taken market share not just from Alan Bond's CastlemaineBrewery but also from the other rival, Fosters.The response was foreseeable: a price war.So how do the future cash flows look under a price war? Several sensitivity analyses are tabled next,and in the last case, we have a scenario of a fall in prices and volume, including the effect of theworking capital change.
Obviously, such negative cash flows are not sustainable, especially for a fledging brewer with nooperation in other markets. With the share price falling and its bank concerned, Power Brewing washappy to form a joint venture under Fosters' terms to share the new brewery. A few years later,Fosters bought the remaining half of Power Brewing.The case shows that a well-constructed model with reasonable assumptions and sensitivity testingwould have shown the strategy and business plan to be fatally flawed. Alternative strategies couldhave then been considered, such as stay small, form an alliance with other small regional brewers, orsell to Fosters when in a stronger bargaining position.However, the error in the model (neglecting working capital), the unrealistic assumptions, and thelack of flexibility all led to self-delusion.
FAROUT Summary
Figure 27.2 Competitor cash flow analysis FAROUT summary

Future orientation—Medium to high. The future cash flow model is the synthesis of all techniques tolook at the future.Accuracy—Medium to high for the historic cash flow analysis. It is more accurate or at least morereliable than the other accounting statements. For future cash flow analysis, accuracy would bemedium. Models require a very good understanding of the business and its environment as they oftenrequire considerable modeling and business skill.Resource efficiency—Low.Some information can be gained from public documents, but much detailon operations requires internal analysis of the business and can require crossfunctional understandingof marketing, engineering, operations, and taxation.Objectivity—Medium.Historic analysis is quite high. The use of many assumptions in forecasting canbe influenced by political influence or "rose-colored glasses." There are tools for testing thereasonableness of assumptions, such as historic trends, engineering estimates, and break-evenanalysis.Usefulness—High.Well-crafted models have enormous usefulness for strategic and businessassessment and for the analysis of competitive situations and alternative strategies.Timeliness—Low to medium. Historic cash flow analysis can be done quickly with public domaininformation. Complex forecasting models can take considerable time to build and use.
Related Tools and Techniques
Competitor analysisCost/benefit analysisFinancial analysisHistoric trend analysisIndustry analysisMarket forecastingSustainable growth rate
References
Beaver, W.H. (1966). "Financial Ratios as Predictors of Failure," Empirical Research in Accounting:Selected Studies, Supplement to Journal of Accounting Research, 5, p. 80, pp. 71–111.Berkshire-Hathaway annual reports.Casey, C.J., and N.J. Bartczak (1985). "Using Operating Cash Flow Data to Predict FinancialDistress: Some Extensions," Journal of Accounting Research, 23(1), pp. 384–401.Fleisher, C.S., and B.E. Bensoussan (2003). Strategic and Competitive Analysis: Methods andTechniques for Analyzing Business Competition. Upper Saddle River, NJ: Prentice Hall.Foster, B.P., and T.J. Ward (1997). "Financial Health or Solvency? Watch the Trends andInteractions in Cash Flows," Academy of Accounting and Financial Studies Journal, Vol. 1, No. 1,pp. 33–37.Godbee, G.J. (2004). "The Leap to Failure: Distinguishing Between Corporate Distress and FailurePrediction," Unpublished Thesis, Macquarie University.Higgins, R.C. (1977). Financial Management: Theory and Applications. Chicago, IL: SRA.Horrigan, J.O. (1968). "A short history of financial ratio analysis," Accounting Review, 4, pp. 284–294.Koller. T.M. (2001). "Valuing dot-coms after the fall," The McKinsey Quarterly, March 22, 2001.McCaffrey, R.. "The Limits of EBITDA," retrieved from the Web on August 25, 2006 athttp://www.fool.com/news/indepth/telecom/content/ebitdalimits.htm.Wall, A. (1968). "Study of Credit Barometrics," reprinted in Horrigan, J.O. (ed), Financial RatioAnalysis: An Historical Perspective. New York, NY: Arno Press.Ward, T.J. (1995). "Using Information from the Statement of Cash Flows to Predict Insolvency," TheJournal of Commercial Lending, 77(7), March, pp. 29–36.Winaker, A., and R. Smith (1930). "A Test Analysis for Unsuccessful Industrial Companies," Bureauof Business Research, Bulletin No. 31, University of Illinois.
Endnotes
1 Horrigan (ed.), 1968.2 Winaker and Smith, 1930.3 Beaver, 1966.4 Koller, 2001.5 See Fleisher and Bensoussan (2003), Chapter 4.6 See Fleisher and Bensoussan (2003), Chapter 27.

28Analysis of Competing Hypotheses
Short Description
Analysis of competing hypotheses (ACH) is a multi-variable, qualitative technique that aids judgmenton important issues requiring careful weighing of alternative explanations or conclusions. ACHrequires an analyst to explicitly identify all the reasonable alternatives in a particular situation andhave them compete against each other for the analyst's favor, rather than evaluating their plausibilityone at a time. This can help an analyst to combat bias and cognitive distortions that often reduce thequality of the analysis process or the outputs generated by it.ACH is grounded in basic insights from cognitive psychology, decision analysis, and the scientificmethod. ACH provides an analytical philosophy that uses the scientific method to provide order andstructure to a mass of data and how the analyst addresses it.
Background
ACH was first revealed to competitive intelligence analysts in Richards Heuer's, The Psychology ofIntelligence Analysis, and as mentioned previously, ACH provides an analytical approach that usesthe scientific method in a unique way to provide order and structure to the mass of informationcollected and how an analyst should attend to this information (see Figure 28.1 for an illustration of ageneric ACH process).Figure 28.1 Illustration of a generic ACH process
But why would this approach be of importance? An example from the U.S. intelligence community,which arguably is far more professionalized in an institutional sense than business, and competitiveanalysis is in the private sector, may answer this question.Studies are carried out in a post-mortem fashion by various commissions following many well-publicized (and even some not well-publicized) failures of intelligence in the U.S. One of these wasperformed following the 9/11 attacks of 2001. The Report of the Commission on the Intelligence

Capabilities of the U.S. Regarding Weapons of Mass Destruction—WMD, 2005 (WMD Report),identified a number of weaknesses involving a lack of consideration of alternate hypothesesassociated with parts of intelligence analysis by analysts that resulted in the destruction of the TwinTowers in New York City. For example, the WMD Report stated that analysts "have a difficult timestating their assumptions up-front, explicitly explaining their logic, and, in the end, identifyingunambiguously for policy-makers what they do not know." It also stated that, "As much as they hate todo it, analysts must be comfortable facing up to uncertainty and being explicit about it in theirassessments." In order to address these issues, the WMD Report recommends that analysts in theintelligence community encourage "alternative hypothesis generation."Doing analysis to inform decision makers about the future is a demanding task. As we discussed inChapters 1 through 5 of this book, business and competitive analysts employ a variety of analyticalprocesses designed to objectively study data and information to enhance decision makers'understanding of events and issues. Whatever the process, the analyst must employ a systematic logicin coming to conclusions. Part of this systematic logic process will include making assumptions aboutwhy things are as they are and what is and isn't happening.Individuals make many assumptions about what they understand and assume to be true and valid.Sometimes, these assumptions are made explicit and communicated to decision makers; at othertimes, they remain implicit and are not communicated. Because these assumptions can greatlyinfluence the quality of an analysis, it is critical that they are given proper recognition in the analysisprocess. The ACH process described in this chapter is designed to serve this important role.
Strategic Rationale and Implications
What is so helpful about ACH for the business and competitive analyst is that it is a process forrefuting hypotheses. This is in contrast to the more commonly practiced process of gathering evidencethat confirms pre-existing beliefs. Analysts typically perform their tasks by choosing what theyintuitively suspect is the most likely answer to a client's question and then examine the gatheredinformation to see whether it supports this answer. Analysts typically stop their examination when theevidence appears supportive of their favored hypothesis. If the evidence is unsupportive of theirchosen answer, they can either reject the evidence as misleading or develop another hypothesis andrepeat the procedure. This is called a "satisficing strategy," which means choosing the first solutionthat seems satisfactory, rather than exhaustively considering all the possibilities to identify the best ormost ideal solution. The problem with this is that there may be several seemingly satisfactorysolutions, but there is only a single "best" solution.Analysts can be led astray with this common approach when they focus on confirming a hypothesisthey think is likely to be true and which is accompanied by a large amount of evidence supportingtheir view. In this situation, they will typically overlook the fact that most of this evidence is alsoconsistent with, and supportive of, alternative explanations. In these cases, these other alternativesare typically not properly refuted.The management of intelligence analysis should encourage the application of techniques that allowclear delineation of assumptions and chains of inference; the specification of the degree of uncertaintyabout the evidence and resultant conclusions; and the elaboration of alternative perspectives andconclusions.

People tend to avoid cognitive dissonance. Most people are also uncomfortable when their beliefsystems are challenged. The ACH technique allows for a procedural loosening of dominant thoughtprocesses just as a scientist has to loosen his expectations of whether or not a particular experimentwill verify or disconfirm his hypothesis.
Strengths and Advantages
ACH is an effective process that keeps individuals from falling prey to common analytic pitfalls.Because of its thoroughness, it is particularly appropriate for controversial issues when analysts wantto leave an audit trail to show what they considered and how they arrived at their judgment. In thesecases, the decision maker can quickly scan how conclusions were arrived at and the foundations forthe judgments. In the same way, it also serves as an effective logic double-check for the analyst.In the intelligence literature, ACH is promoted as an effective analysis aid for two reasons. First, it isseen as a helpful tool to assist an analyst's judgment on issues that require a careful evaluation ofalternative explanations or conclusions. It helps to guard against some of the common biases andperceptual distortions mentioned in Chapter 3, "Avoiding Analysis Pitfalls," by compelling theanalyst to account for all the alternatives.1 Second, ACH provides a convenient and visual means forindicating the specific area in which there may be dissenting views. If another analyst or the decisionmaker disagrees with the original analyst's judgment, a matrix (shown in Table 28.1) can be used tohighlight the precise area of disagreement. Subsequent discussion can then help the stakeholders tofocus on the ultimate source of the differences.Table 28.1Sample ACH Matrix
In addition, Sawka suggests that ACH has the following three key strengths:
1. 1. ACH compels a systematic examination of all hypotheses—Analysts tend to "satisfice" intheir day-to-day work and halt their evaluation process once a considerable amount of evidencesupports their favored hypothesis. For example, an analyst who concludes that her firsthypothesis has adequate evidentiary support will not be likely to bother evaluating the remaininghypotheses under consideration. The problem here is that the data may actually support one ormore of the unevaluated hypotheses as strongly as the chosen hypothesis.
2. 2 . ACH illuminates the analyst's logic to their customers—ACH helps decision makers tounderstand why a chosen course of action was superior to others. ACH also allows analysts toillustrate logically why their recommendations may even prove to be superior to those that thedecision makers might have held going into the analysis; as such, it provides added legitimacy to

analysts that otherwise might not be earned in the normal conduct of their work.3. 3 . ACH ensures that the analyst properly considers the data and information they have
gathered—Consider how each key piece of information supports, is against, or is unrelated to,all of the competing hypotheses. It will be impossible for a single piece of evidence to be insupport of competing hypotheses. The process helps focus on problems (contradictions,deficiencies, and discrepancies) in the analysis process and data sources used. In many cases, itcan help identify gaps in data that can lead the analyst to solicit further evidence gathering.
By generating the set of hypotheses in advance of collecting data and evaluating it, ACH becomes asystematic process that benefits the analyst personally in the form of a self-review, tightening logicand checking the rationale for arriving at judgments, and by providing additional legitimacy in theeyes of the decision makers. This can enhance the trust that decision makers have in their analysts andhopefully encourage them to give greater credence to the analyst's recommendations.
Weaknesses and Limitations
Getting analysts to regularly employ the ACH process is likely to be an uphill battle. The eight stepsassociated with the most common version of ACH are cognitively draining and difficult for manyanalysts to regularly perform. Also the entire process is time consuming compared to the prospect ofquickly delivering a response that answers their client's question.Stech and Elasser suggest that a problem with using ACH is that most people lack the capability toconsider the sheer volume of evidence that can go into developing and analyzing a set of competinghypotheses. These alternatives grow exponentially if the possibility of deception by a rival is alsoinvolved. They suggest that many individuals will overlook the possibility of deception because ofthe difficulty in managing all the details that are associated with this added complexity anduncertainty.Most analysts recognize that the possibility of deception occurs on a daily basis, but systematicmethods for recognizing it are lacking, at least in part because common reasoning aids the deceivers.Deception detection depends on two reasoning skills in which humans are particularly weak:reasoning about negative or absent evidence and false evidence. For these reasons, Stech and Elasserfocus their research on developing computerized tools to help analysts identify deception. Thedevelopment of automated applications for performing methods like ACH should eventually helpanalysts to employ the process more efficiently and effectively, but these applications remainembryonic in their current level of development and deployment in the business community.Another related possible limitation is that ACH can actually increase the likelihood that the analystwill be deceived. In particular, Heuer's "Draw Tentative Conclusions" step (see Step 5 in the section,"Process for Applying the Technique") recommends weighing hypotheses in light of evidence, aprocess that already promotes reasoning errors arising from "everyday irrationality." The problemwith the relative assessment of competing hypotheses, in light of evidence, is that it neglects theindividual base rates of both evidence and hypothesis in conventional analysis and fails to provide anevidentiary false-positive rate in counter-deception situations.

Process for Applying the Technique
The following eight-step process is adapted from the standard one recommended by Heuer. Hisapproach is the most commonly employed in intelligence agencies and has been demonstrated to beeffective in a variety of different contexts. It is easy to adapt for most applications in business andcompetitive analysis.
Step 1: Identify the Possible Hypotheses to Be Considered
Step one of ACH is to develop alternate hypotheses about the decision maker's key intelligencequestion. This step is intended to help the analyst consider alternate explanations and avoidprematurely making conclusions based on a few salient observations or preconceptions.At this early hypothesis-generation stage, it is very useful to bring together a group of analysts withdifferent backgrounds and perspectives. Conducting brainstorming in groups stimulates theimagination and can generate possibilities that individuals would not generate on their own. The keyis to generate as many hypotheses as possible, without performing any judgments of their credibilityor viability at this point. Heuer suggests that as a general rule, analysts should consider morealternatives when there is a higher level of uncertainty surrounding the question being examined or thepotential impact of the conclusions will be greater.Wait for all the possibilities to be identified before considering them. The goal in this stage ofassessment is to select the hypotheses to be examined in greater detail in a subsequent analysis. Try tokeep the number of hypotheses manageable; Heuer suggests that about seven will serve as a goodtarget because this shouldn't overwhelm the analyst.Designate the hypotheses not to be analyzed as unproven (that is, there is no evidence that suggeststhey are correct) hypotheses. Other hypotheses may indeed be disproved, whereby positive evidencedoes suggest they are incorrect. Also consider the possibility that a rival company is trying to deceiveyour firm from knowing what they are actually doing.
Step 2: List the Significant Evidence in Support of and AgainstEach Hypothesis
Begin this step by listing the general evidence that applies across all the listed hypotheses. Evidencein this step refers to all the factors that impact your judgments about the hypotheses. Evidence doesn'tneed to be firm at this point to be included.Be careful to note the absence, as well as the presence, of evidence. To encourage thinking aboutabsent evidence, ask, "If this hypothesis is true, what should I expect to see or not to see?" What ismissing and not seen may represent the need for additional data collection efforts. Recognize thateach hypothesis requires asking different questions and, therefore, seeking out other evidence.Assumptions about your competitors' intentions, goals, or standard procedures also need to beincluded. These assumptions can produce strong preconceptions as to how likely a hypothesis mayprovide the sought-after answer. They need to be included in the evidentiary list since these

assumptions may heavily impact the final judgment.Then consider each hypothesis individually, listing factors that tend to support or contradict each one.
Step 3: Prepare a Matrix with Hypotheses Across the Top andEvidence Down the Side
This step may be the most crucial one in this process and is the one that is likely to be doneincorrectly, thereby leading to the diminishment of the benefits that could otherwise be generated bythe ACH process. It is also the step that differs most from the natural, intuitive analysis approachtypically used in the absence of ACH.Combine the hypotheses (from Step 1) and the evidence and arguments (from Step 2). Thisinformation is then placed into a matrix format, with the hypotheses across the X-axis and evidenceand arguments down the Y-axis (that is, side). The matrix provides a visual perspective of all the keyfacets of the intelligence question (see Table 28.1).Next, consider how each item of evidence relates to the hypotheses. Differing from the typicalprocess, which is to examine one hypothesis at a time, this step requires the simultaneous/concurrentassessment of the relationship between evidence and hypotheses. Take one item of evidence at a timeand consider how consistent it is with each hypothesis. In Step 5, you will work down the columns ofthe matrix, examining one hypothesis at a time to see how consistent that hypothesis is with all theevidence.To fill in the cells of the matrix, take the first item of evidence and ask whether it is (a) consistentwith (+ or C for consistent), (b) inconsistent with (– or I for inconsistent), or (c) irrelevant (? or NAfor not applicable) to each hypothesis. A notation should be made in the appropriate cell under eachhypothesis in the matrix. The key point is to provide a shorthand representation of the complexreasoning behind how the evidence relates to each hypothesis.Using a matrix format helps you to weigh the diagnostic value of each evidentiary item. This is amajor distinction with traditional analyses. To use an automotive analogy, a high temperature light onthe dashboard may have great value in telling a driver that their vehicle has a problem but relativelylittle value in determining what the source of the temperature gain is. Because a high-runningtemperature is consistent with so many possible hypotheses about the car's problem, this evidence haslimited diagnostic value in determining which hypothesis is the more likely one.Evidence is diagnostic when it influences your judgment on the relative likelihood of the varioushypotheses identified in Step 1. If an evidentiary item appears consistent with every hypothesis, it islikely to have little to no diagnostic value. Analysts commonly realize that most of the evidencesupporting what they believe to be the most likely hypothesis is not very helpful; this is because thatsame evidence is also consistent with other hypotheses. By identifying the items that are highlydiagnostic, the analyst can have greater confidence in their eventual judgment. These items shouldalso be re-examined for accuracy and considered for alternative interpretations, as discussed in Step6.
Step 4: Refine the Matrix
The way the hypotheses are worded is crucial to drawing conclusions from the analysis. As such, itwill often be appropriate to reconsider and reword the various hypotheses. This may lead to theaddition of new hypotheses or the replacement of existing hypotheses with finer distinctions made tothem in order to consider all the significant alternatives. Two hypotheses may be better combined intoone when there is no evidence that distinguishes two separate hypotheses.Attempt to delete evidence and arguments that are unimportant and/or have no diagnostic value. Theseitems should be saved in a separate list or file as a record of information that was considered.Essentially, you are establishing an audit trail for your work. If others disagree with your assessment,they can be provided with this separate list.
Step 5: Draw Tentative Conclusions About the Relative Likelihoodof Each Hypothesis by Trying to Disprove It
This step is the adjunct to Step 3. In Step 3, you worked across the matrix, focusing on a single itemof evidence and examining its relationship to each hypothesis. In this step, you work down the matrix,looking at each hypothesis. The matrix format gives an overview of all the evidence supporting oropposing all the hypotheses. In this fashion, all the hypotheses can be examined together in order todetermine which one is most likely.Begin by looking for evidence that enables you to reject hypotheses or at least to determine whichones are unlikely. Proceed by rejecting or eliminating hypotheses, while tentatively accepting onlythose hypotheses that cannot be refuted. Although the scientific method cannot be entirely applied tointuitive judgments, it is useful to disprove hypotheses rather than confirm them.No matter how much information is consistent with a given hypothesis, one cannot prove a particularhypothesis is true because the same information may also be consistent with other hypotheses.Alternatively, a single evidentiary item inconsistent with a hypothesis may be sufficient to allow forrejection of that hypothesis.Humans have natural tendencies to focus on confirming hypotheses they already suspect to be true.They ordinarily give more weight to information that supports a hypothesis than to information thatweakens it. Because this distorts the results, it is preferred that you do just the opposite; consequently,this step means you will have to go against your natural tendencies.Closely observe the minuses in your matrix. Hypotheses with the most minuses are the ones to whichyou should give the most consideration. It is useful to spend more time on these least-likelyhypotheses. The one that is most likely is usually the one with the least evidence against it, not the onewith the most evidence for it.This initial ranking ordered by the number of minuses is only a rough ranking. This is because someevidentiary items will be more important than other evidence. Degrees of inconsistency cannot beadequately captured by a single notation. You can better judge how much weight to give it byreconsidering the full nature of the relationship between the evidence and the hypotheses.Steps 4 and 5 are where the ACH process is heavily susceptible to bias—of failing to weigh theimpact of evidence by its false positive rate and misestimating prior probabilities. It is also worthnoting at this point that the matrix should not dictate conclusions; instead, it should accurately reflectthe analyst's judgment of what is and is not important and how these important factors relate to theprobability of each hypothesis. The matrix is an aid to thinking and analysis, to ensure consideration
of all the possible interrelationships between evidence and hypotheses, and the identification of thosefew items that really swing the analyst's eventual judgment.
Step 6: Analyze How Sensitive Your Conclusion Is to a FewCritical Pieces of Evidence
This is the step in which you must question the few linchpin assumptions (see Chapter 29, "LinchpinAnalysis," for more about linchpin assumptions) or evidentiary items that really influence theanalytical outcome in one direction or the other. Analysts should ask the following kinds of questionsat this point:
Are there questionable assumptions underlying your interpretation?Are there alternative explanations?Could the evidence gathered and used be incomplete and/or misleading? This will especially beproblematic in cases where a market rival is purposefully trying to throw you off the true pathfor what they are doing.
You always need to determine which assumptions merit additional questioning. ACH is usefulbecause it helps you to identify what needs to be rechecked. It may be appropriate at this point toreassess original source materials as opposed to relying on others' interpretations. It is alwaysdesirable to identify in your report the critical assumptions that led to the interpretation andconclusions because they are dependent upon the validity of these assumptions.
Step 7: Report Conclusions
Because analytical judgments cannot be made with certainty, decision makers should know therelative likelihood of all the alternative possibilities. Decision makers need to make decisions on thebasis of a full set of alternative possibilities, not just the single most likely alternative. Analystsshould offer contingency plans in case one of the less-likely alternatives turns out to be true.It is helpful to quickly review what it means for a hypothesis to be likely. A hypothesis that isprobably true could mean anywhere from a 55 percent to an 85 percent chance that future events willprove it correct, leaving anywhere from a 15 percent to 45 percent possibility that decisions based onthis judgment will be based on faulty assumptions and turn out to be wrong. This is why it isimportant for analysts to communicate how confident they are in their recommendation and what itwould take for them to raise this confidence level.The report produced for decision makers should provide a comparative evaluation of competinghypotheses. Although this is not common practice because it adds length and is sometimes viewed tobe superfluous to the primary argument being made, it is still an important part of the analyticalproduct and should be included in one form or another.
Step 8: Identify Milestones for Future Observation That MayIndicate Events Are Taking a Different Course Than Expected
Any conclusion the analyst provides to the decision maker should always be regarded as tentative.This is because the situation may materially change or new data may come in to alter theinterpretation. Because of this, analysts should identify things in their report that would alter theirsituation appraisal. In other words, specify in advance what it would take for them to change theirminds. This is also helpful for the analyst because it will make it more difficult to rationalize suchdevelopments, if they occur, as not really requiring any judgmental modifications.
Summary
Heuer notes that three key elements distinguish ACH analyses from conventional intuitive analysis:
ACH begins with a full range of alternatives rather than with a most likely alternative that theanalyst seeks (and usually manages) to confirm. This step ensures that all alternative hypothesesreceive balanced consideration.Like many common statistical rules that require a researcher to be discriminatory in how theyconsider evidence, ACH helps the analyst to distinguish the precious few evidentiary items thathave the highest diagnostic value in assessing the relative likelihood of the alternativehypotheses. In conventional intuitive analysis, explicit consideration is rarely given that keyevidence may also be consistent with alternative hypotheses.ACH requires the analyst to identify evidence that refutes, as opposed to confirms, hypotheses.The most probable hypothesis is usually the one with the least evidence against it, unlikeconventional analysis where it would be the one with the most evidence in favor of it.
ACH is a powerful method for assisting and enhancing many of the other techniques detailed in thisbook. It is one of the approaches that every individual pursuing a career in business and competitiveanalysis should gain competence in applying.
FAROUT Summary
Figure 28.2 Analysis of competing hypotheses FAROUT summary

Future-orientation—Low. ACH is intended to help the analyst evaluate competing hypotheses, not togenerate better hypotheses about the future. There is nothing in the application of the technique thatcompels the analyst to be future focused in their generation of alternative hypotheses.Accuracy—Medium. The systematic application of the scientific method as indicated by ACH shouldcause analysts to tighten any gaps in their logic and to identify when evidence does and does notsupport competing hypotheses. Where accuracy suffers is in the generation of the competinghypotheses themselves, as well as the interpretation of how the evidence correlates to the hypothesesand in judging which hypotheses are the most likely.Resource efficiency—Low to medium. ACH usually requires the analyst to work with others ingenerating hypotheses or in serving as sounding boards to help evaluate their interpretation of thematrix. It can also require additional data gathering to fill in evidentiary holes.Objectivity—High. Based closely on the precepts of the scientific method, this process compelsanalysts to be rigorous in their analyses and leaves them much less open to challenge than most otheranalytical aids.Usefulness—Medium. ACH helps to provide additional support for the analyst's judgment and/orrecommendation, but is less helpful in delivering actionable outputs that can be quickly acted upon. Itis useful in supporting the outputs of other tools that provide more decision-ready analysis products.Timeliness—Low to medium. ACH requires time to compile and complete. Even the decision maker'sreview of the ACH evidence will take time and usually requires interpretation by the analyst.
Related Tools and Techniques
Assumptions analysisLinchpin analysisScientific research approachStatistical analysis
References
Dawes, R.M. (2001). Everyday Irrationality: How Pseudo Scientists, Lunatics, and the Rest of Us

Systematically Fail to Think Rationally. Boulder, CO: Westview Press.Fishbein, W., and G. Treverton (2004). "Making sense of transnational threats," Occasional Papers,3(1), October, Washington, DC: The Sherman Kent Center for Intelligence Analysis.Fleisher, C., and B. Bensoussan (2003). Strategic and Competitive Analysis: Methods andTechniques for Analyzing Business Competition. Upper Saddle River, NJ: Prentice Hall.George, R.Z. (2004). "Fixing the problem of analytical mind-sets: Alternative analysis,"International Journal of Intelligence and Counter-Intelligence, 17(3), Fall, pp. 385–405.Heuer Jr., J.R. (1999). The Psychology of Intelligence Analysis. Washington, DC: Center for theStudy of Intelligence.Sawka, K. (2003). "Competing hypotheses analysis (CHA)," Competitive Intelligence Magazine,6(2), pp. 53–54.Stech, F.J., and C. Elasser (2004). "Midway revisited: Deception by analysis of competinghypothesis," MITRE Corporation, Tech. Rep. Available online athttp://www.mitre.org/work/techpapers/tech papers 04/stech deception.Stern-Dunyak, A. (2004). "Fooled again: Developing counter deception decision support," TheMITRE Digest, May. Available online athttp://www.mitre.org/news/digest/advanced_research/05_04/ar_counter_decision.html.WMD (2005). Report of the Commission on the Intelligence Capabilities of the U.S. RegardingWeapons of Mass Destruction. Washington, DC. Full report available athttp://www.whitehouse.gov/wmd/.
Endnotes
1 Fishbein and Treverton, 2004.

29Linchpin Analysis
Short Description
Linchpin analysis is a highly adaptable, logic structuring technique that is intended to minimizemistakes and promote clarity even with complex arguments containing variables about which there isa high degree of uncertainty. It is driven from basic assumptions that an analyst would includeregarding the competition and a rival's proposed actions. To develop predictions with a high degreeof confidence, careful attention is required when selecting the factors deemed most likely to drive anddetermine the outcome of a situation on which there is a dearth of strong empirical evidence.
Background
Individuals are compelled by their circumstances to make dozens of assumptions on a daily basis.The rigorous and systematic testing of assumptions has long been an essential part of the intelligencetrade. It has also been a longstanding part of defense or military intelligence practice, particularly forassessing the consistency of forecasts or predictions under differing assumptions. J.R. Heuer, Jr.notes that analysts need to question their assumptions because failures occur when faulty assumptionsgo unchallenged. Experience also suggests that when analytical judgments are shown to be incorrect,it's usually because the data or information gathered was wrong.The problem is that analysts, or any other busy individuals, do not have the time to question every oneof their assumptions. This leaves them with the issue of where to focus their attention. They shouldfocus on the linchpins underlying their analysis. Linchpins are essential central pieces on which anargument balances. Linchpin analysis helps analysts to identify the key assumptions that could makeor break their view of a focal situation.U.S. Government intelligence officials use linchpin analysis when gauging the military capabilitiesand likely actions of opposing countries. But prior to the first war in the Persian Gulf in the early1990s, the U.S. Central Intelligence Agency (CIA) did not regularly use this technique—bothintelligence analysts and policy makers were caught off guard by Iraq's invasion of neighboringKuwait. At that time, many CIA strategists believed that Iraq was not in a position to attack anothercountry. They assumed this because Iraq was supposed to be recovering from its lengthy war duringthe 1980s with neighboring Iran. Many U.S. policy makers regarded this assumption very highly, andlittle effort was put into advancing alternative arguments or reasons for why it may not have beenaccurate.Until the early 1990s, the CIA had predominantly used "post-mortem" analysis to review eventsviewed as intelligence failures. These post-event reviews did not prove to be very effective inproviding intelligence or policy-making officials with much in the way of proactive measures theycould take in order to prevent similar incidences in the future.

Because of the shortcomings recognized to have occurred over the Iraqi invasion of Kuwait andsimilar events, the CIA and other intelligence organizations have since focused more actively ondeveloping an enhanced strategic warning capability. Part of this enhancement led to the inclusion oflinchpin analysis into the standard intelligence development process, both to identify a wider range ofalternatives and to prepare a wider range of alternatives and actions if and when linchpinassumptions are altered. Careful attention to selection and testing of key assumptions to deal withsubstantive uncertainty is now well established as the doctrinal standard for most intelligenceanalytic processes and is a key part of instruction for new analysts in the professional curriculum ofthe CIA's Sherman Kent School.1Most studies of analytical tools have not shown linchpin analysis being regularly used by businessand competitive analysts or in the development of strategic plans.2 By compelling analysts to considerthe linchpin assumptions underlying their views and results, linchpin analysis can improve the qualityof results produced, ensure greater consistency in analytical logic, and help decision makers to betterenvision a variety of possible futures associated with a competitive situation.
Strategic Rationale and Implications
The business and competitive analyst's generic role is to help decision makers make decisions todaythat can better position their enterprises for succeeding in a risky and uncertain future. Unfortunately,no person has perfect knowledge or full certainty about the future; consequently, analysts use an arrayof processes and techniques to help them to better understand and hopefully reduce the uncertainty orperceived risk about the future. That process is a key premise underlying this book and our priorbook.3Sometimes, an analyst tries to guess what might happen, and decision makers subsequently apply thatinformation as a basis for their planning or decision making. Such guesses are otherwise known asassumptions, and these are an important source of uncertainty and risk for businesses. Assumptionsare propositions or statements that the analyst treats as either true or false. An assumption is a way ofdealing with an uncertain future when there are a number of possible alternatives.For example, an analyst might assume that a firm's suppliers will deliver the right order on time, thata rival CEO will continue to compete through a wide range of outsourcing initiatives, or that a firmwill continue to support a new product with highly aggressive pricing tactics. But what happens if theanalyst has assumed incorrectly and the actions that ensue are dramatically different from the onesassumed? Assumptions come associated with risk. What makes things more difficult for the analyst isthat this risk is often taken unwittingly. In its simplest form, an assumption is a view about how toproceed on the basis that one alternative will turn out to be valid and the others will be incorrect.A competitor's or your decision maker's assumptions may be based on a number of factors, includingany of the following:
Beliefs about competitive positionPast experience with products, customers, suppliers, or rivalsGeographic factorsMarket and industry trendsHeuristics/rules of thumb

Any of the preceding items can be subject to the various forms of bias that were described inChapters 1 through 5 of this book. A thorough competitive analysis always includes the assumptionsthat a competitor makes about its own competitors and tries to make a determination as to whetherthat assessment is accurate.Most forms of business and competitive analysis require identifying the key drivers or linchpinassumptions regarding a rival that will eventually lead them to pursue a specific pattern of actionguided by their competitive strategy. Any assumption is debatable, and there is a degree of uncertaintyabout its validity. Analysts must validate their reasoning and logic by providing defensible evidenceof their assumptions.For our purposes, there are two key forms of assumptions—(1) explicit (stated, transparent, andsubject to challenges) or (2) implicit (made subconsciously and not open to challenge or scrutiny).Implicit assumptions are the riskier form and one reason why a technique like linchpin analysisdeserves a special place in the analyst's toolkit. Most analytical processes require the analyst toexplicitly identify his assumptions, not only for the purpose of ensuring that the analyst recognizeswhat they are, but also so that the decision maker understands them and their resultant impact on thesubsequent analytical reports.4In many incidences, a false assumption would lead to problems since people usually tend to assumethat things will go the way they expect and prefer. Additionally, not all assumptions will have equalweight in the analyst's considerations. Some assumptions may prove to be false without having anysignificant effects on the overall actions taken, but there are others that could have seriousconsequences.Business and competitive analysts may describe their firm's competitors as being fierce rivals,threatening, fast moving, and often more successful than they are. The assumptions that your firm andyour rival's managers hold about their firms and industry sector help to define the kinds ofcompetitive moves that will be considered or undertaken. For example, if in the past a majorcompetitor in your industry introduced a new type of product that failed, the firm's and rival firms'managers may assume that customers don't want or need the benefits offered by the product and thatthere is no market for it. These assumptions are not always accurate and may present lucrativeopportunities if they are empirically invalid.Such assumptions and perceptions can be helpful in quickly characterizing a competitor's behavior,since they make the analysis process quicker and more efficient; nevertheless, they can becomedangerous if allowed to persist unchallenged for too long. This occurs because an analyst's basicpremises about a competitor or the competitive environment inhibit the analyst from interpreting therival's actions differently and can cause the analyst to misread an adversary's true competitiveintentions.The inhibited analytical frame they apply raises the level of risk attached to the situation beinganalyzed, thereby creating further difficulty for decision makers and others in the firm that operateunder the inaccurate premises supplied by the analyst.Analysts' views are also commonly clouded by unchallenged assumptions when making judgmentsabout the competitor's behavior in the marketplace. For example, new entrants may have opportunitiesto introduce a product similar to a previously unsuccessful one without retaliation because incumbentcompanies may not view this as a serious threat. In the early 1960s Honda, at the time a successfulmaker of small engines used in lawnmowers and related products, was able to enter the U.S.motorcycle market with a small motorbike. This occurred at least in part because the past experienceof major U.S. manufacturers with smaller motorbikes had led them to assume that there was no market

for the seemingly underpowered and undersized Honda products.Linchpin analysis requires the analyst to evaluate the competitor's behavior, temporarily under theassumption that their product introduction plans are the opposite of what the analyst believes them tobe. Alternative explanations of these plans are then generated. These explanations and theassumptions underlying them become clear to the analyst, but they may have been missed if the analysthad remained stuck in their paradigm of the competitor.Analyses of potential developments are based on assessments of factors that together would logicallybring about a future without uncertainty. These factors are the drivers or linchpins of the analysis. Ifone or more of them should change, be reversed, removed, or turn out to have been wrong, the basisfor the forecast or prediction would no longer be supported. Identifying the role of these factors is afundamental requirement of sound analysis and forecasts. Policy makers need to know the potentialimpact of changes in these linchpins. It is also the professional obligation of analysts to inform theirdecision makers when the evidence is thin for any of these linchpins, there are high degrees ofuncertainty, or empirical evidence supporting them is absent. They must also make it clear when theassumptions are based primarily on past practice or on what appear to be logical extensions of whatis confidently known.How sensitive is the ultimate judgment to changes in any of the major variables or driving forces inthe analysis? The linchpin assumptions that drive the analysis are the ones that need to be questionedand scrutinized. Analysts should ask themselves what could happen to cause any of the assumptions tobe out of date and how they can know that this has not already happened. They should try to disprovetheir assumptions rather than confirm them. If an analyst cannot think of anything that would cause achange of mind, her mindset may be so deeply entrenched that she can no longer objectively see theconflicting evidence. One advantage of the competing hypotheses approach (discussed in Chapter 28,"Analysis of Competing Hypothesis (ACH)") is that it helps to identify the linchpin assumptions thatswing a conclusion in one direction or another.
Strengths and Advantages
The quality of analysts' logic and their systematic applications of analysis methods and techniqueswill be directly associated with the long-term consistent effectiveness of analysis performance. Manyanalytical techniques do not have built-in checks and balances to ensure the quality of analysis beingconducted. Linchpin analysis is a technique that essentially requires analysts to systematically thinkthrough and assess their assumptions, thereby ensuring that alternative possibilities are considered.Linchpin analysis is valuable in challenging conventional wisdom, staying away from stereotypes,and mitigating against groupthink and other bureaucratic practices that inhibit analysis. It is atechnique that constantly challenges the analyst to carefully consider all the competitive possibilitiesand explanations for competitor or other actor behavior, and prevents analysts—and their intelligenceconsumers—from being locked into single, narrow views of an industry actor.Linchpin analysis is highly beneficial when analysts observe that their executives are operating onfalse, out of date, or overly optimistic or pessimistic perceptions of rivals or a competitive situation.This can be tough for the analyst to discern and possibly made even more difficult if they need toconfront decision makers with their beliefs that the executives' views are inaccurate or otherwiseunhealthy. Internal clients will typically welcome the use of linchpin analysis if the analyst has
developed a good degree of trust and confidence in their relationships. A good sign is when theanalyst or a decision maker struggles to explain a series of rival's moves. Properly used, linchpinanalysis can provide a beneficial contrast to an out-of-date view and provide an objective realitycheck to competitive analysis.
Weaknesses and Limitations
Linchpin analysis requires the analyst and/or the decision maker to identify the key assumptions ordriving forces associated with their analytical logic. This is not easy for anybody to do, particularlyfor those not used to having their assumptions and logic challenged; as such, linchpin analysis can berendered ineffective if the linchpins themselves are not elicited.Linchpin analysis does not lend itself well to situations that require a very timely turnaround. Ideally,it requires the testing of the entire set of alternatives, hypotheses, and alternative hypotheses thatunderlie a description of the future, plan, or potential recommendation. To the extent that there aremany hypotheses to examine, linchpin analysis can require a substantial amount of time to conduct.Linchpin analysis does not generate forecasts or predictions. That requires other techniques (forexample, scenario analysis, war gaming, and forecasting). Once those techniques have beenemployed, linchpin analysis can be used to test their veracity. As such, it will not ordinarily providean answer to a decision maker's questions, but will help to increase analysts' confidence in therecommendations they provide using other methodologies.Finally, the technique requires analysts to have confidence in their own analytical capabilities. Manyanalysts do not conduct linchpin analysis, and many decision makers will not ask for it because theyare apprehensive of having their analysis shown to be deficient. As such, it is often good practice tohave the technique mandated within the organization, as was done in some public sector intelligenceagencies so that analysts understand its importance and are encouraged to perform it as a means forimproving their analytical outputs and results.
Process for Applying the Technique
The linchpin analysis process is fairly simple, although it requires a lot of experience and insight toperform effectively. The basic process for how the process works consists of the following fivesteps:
1. 1. List all the underlying assumptions that were accumulated about a competitor or competitivesituation. This can be done best by having the analyst and others who had been involved with theprocess "step back" from the focal process. One way of collecting these assumptions is to listthem via a worksheet similar to the one we provide in Table 29.1. In addition to being helpful ineliciting the assumptions themselves, the worksheet also requires the analyst to list the evidencethat was used in supporting the assumption, as well as some source data to provide for furtherassessment.Table 29.1Analyzing Assumptions Worksheet
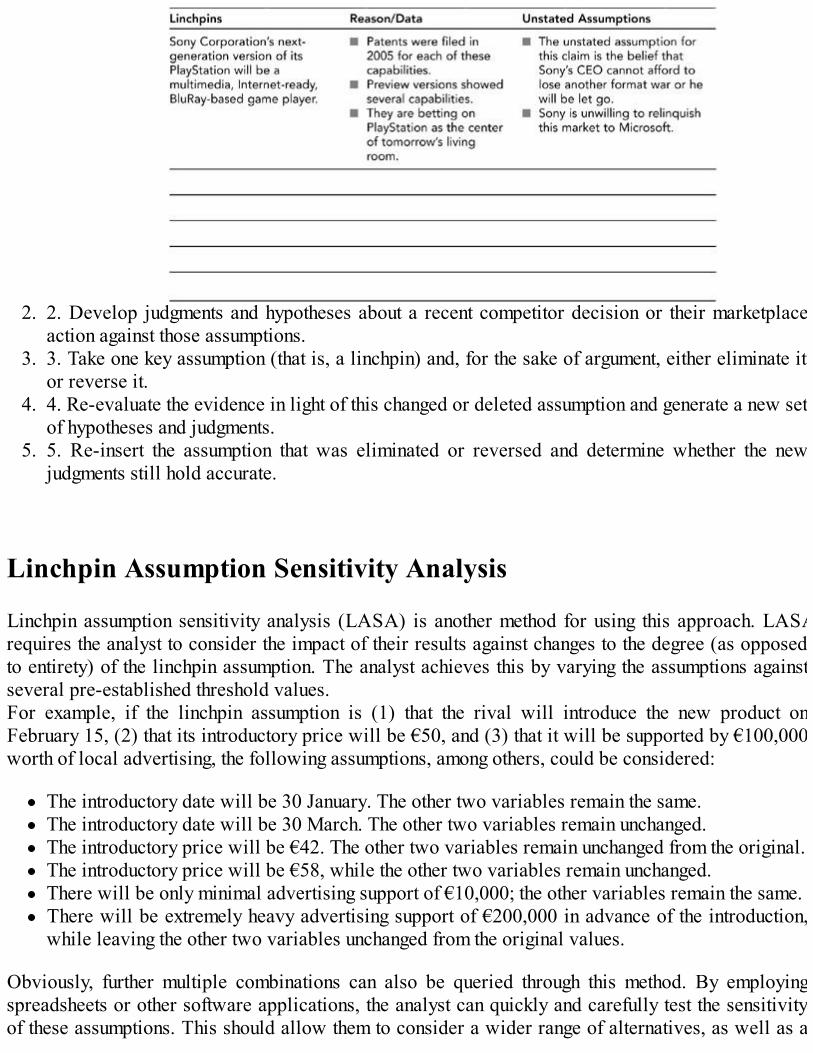
2. 2. Develop judgments and hypotheses about a recent competitor decision or their marketplaceaction against those assumptions.
3. 3. Take one key assumption (that is, a linchpin) and, for the sake of argument, either eliminate itor reverse it.
4. 4. Re-evaluate the evidence in light of this changed or deleted assumption and generate a new setof hypotheses and judgments.
5. 5. Re-insert the assumption that was eliminated or reversed and determine whether the newjudgments still hold accurate.
Linchpin Assumption Sensitivity Analysis
Linchpin assumption sensitivity analysis (LASA) is another method for using this approach. LASArequires the analyst to consider the impact of their results against changes to the degree (as opposedto entirety) of the linchpin assumption. The analyst achieves this by varying the assumptions againstseveral pre-established threshold values.For example, if the linchpin assumption is (1) that the rival will introduce the new product onFebruary 15, (2) that its introductory price will be €50, and (3) that it will be supported by €100,000worth of local advertising, the following assumptions, among others, could be considered:
The introductory date will be 30 January. The other two variables remain the same.The introductory date will be 30 March. The other two variables remain unchanged.The introductory price will be €42. The other two variables remain unchanged from the original.The introductory price will be €58, while the other two variables remain unchanged.There will be only minimal advertising support of €10,000; the other variables remain the same.There will be extremely heavy advertising support of €200,000 in advance of the introduction,while leaving the other two variables unchanged from the original values.
Obviously, further multiple combinations can also be queried through this method. By employingspreadsheets or other software applications, the analyst can quickly and carefully test the sensitivityof these assumptions. This should allow them to consider a wider range of alternatives, as well as a

larger number of contingency situations for planning purposes.
Process for Using Linchpin Analysis in Assessing Risk
All assumptions, and especially the linchpins, carry some degree of uncertainty and risk. There isanother simple process for assessing how risky assumptions might be and for including them in theanalyst's process when appropriate.5 This again requires the analyst to explicitly list the linchpinassumption or assumptions. A simple "if . . . then" statement can be written for each of the analyst'slinchpin assumptions in the following form:
"If this assumption is proved to be false, then the effect on the matter will be . . ."The "if'" side tests how likely the linchpin assumption is to be invalid, while the "then" side testswhether it actually matters. Another way of describing this is to see the if statement as reflectingprobability, whereas the then statement is about impact. Probability and impact are two essentialdimensions in most determinations of risk. This simple approach can be used to turn the analyst'sassumptions into risks. Where an assumption is assessed as likely to be false and/or it could have asignificant effect on one or more recommendations, that assumption should be considered a major riskthat will require the analyst to explicitly identify it and then provide alternatives or contingencies tothe decision maker.This type of linchpin analysis is a powerful way of exposing risks since it addresses the particularassumptions made about a given situation. There are, however, two dangers with this technique.First, this approach can only consider explicit assumptions that have been consciously made andopenly communicated. There are, however, many implicit or hidden assumptions that people makeevery day, some of which can turn out to be highly risky.Second, this approach tends only to identify so-called "downside" risks—threats that a particularassumption may prove false and become a problem for the project. This form of linchpin analysis isnot good at identifying opportunities because some analysts' assumptions tend to be optimistic bynature (that is, the "glass half full" versus "glass half empty" analyst).The first shortcoming can be overcome by a facilitated approach to identifying and recordingassumptions, using someone who is independent and external to the analysis to challenge establishedthinking. For the highest effectiveness, this analysis technique requires comprehensive disclosure.For opportunity identification, this method can be extended to address and challenge constraints—these are restrictions on what the rival can or cannot do and how it must or must not proceed. Butsome of these constraints may not be as fixed as they first appear; indeed, some of them might beassumed as constraints. In fact, it might be possible for a constraint to be relaxed or perhaps evenremoved completely. In the same way that assumptions can be tested to expose threats, a similar "if . .. then" test can be applied to constraints to identify possible opportunities—"If this constraint couldbe relaxed or removed, then the effect on the project would be . . ."Instead of making assumptions about the future or accepting that stated constraints are unchangeable,analysts can employ this method to be better prepared to challenge assumptions and exposeconstraints as either significant threats or opportunities through this analytical process.Linchpin analysis provides analysts with a means for testing the accuracy of their assumptions, thesensitivity of their logic, and the consistency of their arguments; as such, it is a widely applicable toolthat can be used in combination with many of the methods and techniques of business and competitive

analysis described in this book. It should be a routine part of the analyst's assessment process, andwith experience, it can be done more quickly and effectively.
FAROUT Summary
Figure 29.1 Linchpin analysis FAROUT summary
Future orientation—Medium. Linchpin analysis is used to test assumptions about events or actionsthat are expected to take place; it does not generate forecasts or predictions on its own behalf.Accuracy—Low to medium. Linchpin analysis relies heavily on properly identifying assumptions andtheir potential impacts on alternative hypotheses or scenarios. Accuracy is enhanced to the extent thatthe analyst accurately and comprehensively identifies all assumptions and can determine theirpotential impacts. It is impacted by state, effect, and response uncertainties.Resource efficiency—Medium. The application of linchpin analysis requires inputs from resultsgenerated by other techniques. It can require additional information to be gathered, particularly if ituncovers gaps in the logic of the original techniques it is being used to examine.Objectivity—Medium to high. Linchpin analysis is designed to enhance analytical objectivity byforcing analysts to consider the impact of various alternatives and assumptions on outcomes.Usefulness—High. Linchpin analysis can be applied across a broad/wide range of analyticalsituations, improve the quality of results produced, and ensure greater consistency in analytical logic.Timeliness—Low to medium. Analyzing a large number of assumptions, alternatives, hypotheses, andtheir impacts can be highly time-consuming.
Related Tools and Techniques
AbductionAlternative competing hypothesis (ACH) analysisAnalogyAssumptions analysisBlindspot analysisOpportunity analysisScenario analysis

Sensitivity analysis
References
Davis, J. (1992). "Linchpin analysis," Analytical Tradecraft, 7(4), pp. 8–9.Davis, J. (2002). "Improving CIA analytic performance—Strategic warning," CIA Sherman KentSchool for Intelligence Analysis, Tech. Rep. 1. Available online athttp//www.odci.gov/cia/publications/KentPapers/pdf/OPNo1.pdf.Fleisher, C.S., and B. Bensoussan (2003). Strategic and Competitive Analysis: Methods andTechniques for Analyzing Business Competition. Upper Saddle River, NJ: Prentice Hall.Gib, A., and R. Gooding (1998). "CI tool time—What's missing from your toolbag?," pp. 25–39 in theProceedings of the 1998 international conference of the Society of Competitive IntelligenceProfessionals, Chicago, IL.Heuer Jr., J.R. (1999). The Psychology of Intelligence Analysis. Washington, DC—Center for theStudy of Intelligence.Hilson, D., and R. Murray-Webster (2005). Understanding and Managing Risk Attitude. Hants,England: Gower Publishing.Marrin, S. (2003). "CIA's Kent School—Improving training for new analysts," International Journalof Intelligence and Counter-Intelligence, 16(4), pp. 609–637.Morgan, M.G., and M. Henrion (1990). Uncertainty—A Guide to Dealing with Uncertainty inQuantitative Risk and Policy Analysis. New York, NY: Cambridge University Press.Rigby, Darrell (2003). Management Tools 2003. White Paper. Boston, MA: Bain & Company, Inc.Sawka, K. (1997). "Linchpin analysis," Competitive Intelligence Review, 8(3), pp. 85–86.Sawka, K., and S. Marceau (1999). "Developing a world-class CI program in telecoms,"Competitive Intelligence Review, 10(4), pp. 30–40.
Endnotes
1 Davis, 2002; Marrin, 2003.2 Gib and Gooding, 1998; Rigby, 2003.3 Fleisher and Bensoussan, 2003.4 Morgan and Henrion, 1990.5 Hillson and Murray-Webster, 2005.

Index
A
Aaker, Davidaccuracy (in FAROUT rating system)ACH (analysis of competing hypotheses). See analysis of competing hypotheses (ACH)Afuah, Alanairline industry case study (Nine Forces model)airline privatization case study (McKinsey 7S analysis)Allgaier, C.alliances, groups. See also strategic relationship analysis (SRA)alternatives. See analysis of competing hypotheses (ACH)amiable communication styleanalysis. See also intelligence
assumptions incharacteristics ofcustomers of
problem definitionscope identification
in decision makingdefinedinfrastructure support
educationefficiencyexternal networksintelligence solutionsinternal networksproactivity
input evaluationintelligence analysis levels
operational intelligence analysis (OIA)strategic intelligence analysis (SIA)tactical intelligence analysis (TIA)
in intelligence cycleknowledge, elements of
assumptionsbeliefsfactsperceptionsprojections
organizational priorities and

science versus artsynthesizing knowledgeas value-added intelligence
analysis failureshierarchical model of
analysis task-level failuresexternal environment-level failuresindividual analyst-level failuresinternal organizational-level failures
overcominganalysis of competing hypotheses (ACH)
applyingdescribedFAROUT ratingshistory oflimitations ofstrategic rationale forstrengths of
analysis of failurelevels of failuresources of failure
analysis task-level failuresanalysis techniques. See techniquesanalysts
challenges facingindividual analyst-level failuresorganizational position oftools needed
analytical communication styleAnderson, Bradanomaly detectionart, science versusAshton, Bradassessmentsassets, attributes ofassumptions
in analysisdefinedin linchpin analysis
assessing riskquestioning in hypothesis
average data, in statistical analysis

B
Bartczak, N.J.BCA(business and competitive analysis). See analysisBeaver, Williambeliefs, definedBell Canada case study (technology forecasting)bell curve, in statistical analysisbenchmarking, steps inbenchmarking analysis
applyingcase studydescribedFAROUT ratingshistory oflimitations ofstrategic rationale forstrengths of
Bensoussan, B.Best Buy case study (supply chain management analysis)BI (business intelligence systems)biases, cognitiveBMA(business model analysis). See business model analysis (BMA)Bond, AlanBoston Consult Group (BCG) growthshare matrixbottom line, corporate reputation analysis (CRA) andBoynton, AnthonyBrash Holdings, cash flow analysis exampleBreeding, BretBrown, LindenBruno, AlbertBuffet, WarrenBullen, ChristineBurns Philp case study (historic cash flow analysis)business and competitive analysis (BCA). See analysisbusiness espionage, competitive intelligence (CI) versusbusiness failurebusiness intelligence systems (BI)business model analysis (BMA)
applyingbusiness model classificationbusiness model elementscase studydescribed

FAROUT ratingshistory oflimitations ofstrategic rationale forstrengths of
business war gaming. See war gaming
C
CA(competitor analysis)Cameron, Helencannibalization, in product line analysisCantrell, S.capability, interpreting indicatorscapability-related critical success factorsCarroll, Craigcase studies
benchmarking analysisbusiness model analysis (BMA)cash flow analysiscompetitive positioning analysiscorporate reputation analysis (CRA)country risk assessment (CRA)driving forces analysis (DFA)event and timeline (E&T) analysishistoriographical analysisMcKinsey 7S analysisproduct line analysisshadowingsupply chain management (SCM) analysistechnology forecastingwar gamingwin/loss analysis (WLA)
Casey, C.J.cash flow analysis
applyingcase studiesdescribedFAROUT ratingshistory oflimitations ofstrategic rationale forstrengths of
Central Intelligence Agency (CIA)Chandler, Alfredchaos view of historyChesborough, H.Christensen, C.M.chronological table of events, developing event and timeline (E&T) analysischronology, definedChussil, MarkCI (competitive intelligence), definedCIA(Central Intelligence Agency)CIPs (Competitive Intelligence Programs)circular view of historyclassification of business modelsclients. See customers of analysiscluster and pattern analysiscognitive biasesColes, C.comparative ratio analysiscomparing data, in statistical analysiscompetition
analyzingreasons for increase
competitive, definedcompetitive analysis timelines case study (event and timeline analysis)competitive benchmarkingcompetitive differentiation, in corporate reputation analysis (CRA)competitive factors, in analysis failurecompetitive intelligence (CI), definedCompetitive Intelligence Programs (CIPs)competitive positioning analysis
applyingcase studydescribedFAROUT ratingshistory oflimitations ofstrategic rationale forstrengths of
Competitive Technology Intelligence (CTI)competitor analysis (CA)competitor profilescompetitors
in analysis scopedetermining
complexity, in analysis failures

consistency, in reputation managementconsortia, definedconstellations, definedCooper, Robert G.corporate reputation analysis (CRA)
applyingcase studydescribedFAROUT ratingshistory oflimitations ofstrategic rationale forstrengths of
correlation, in statistical analysiscost focus strategy, in product line analysiscost leadership strategy, in product line analysiscountry risk assessment (CRA)
applyingcase studydescribedFAROUT ratingshistory oflimitations ofstrategic rationale forstrengths of
courses. See educationCRA(corporate reputation analysis). See corporate reputation analysis (CRA)CRA(country risk assessment). See country risk assessment (CRA)critical success factors (CSFs)
in historiographical analysis case studycritical success factors (CSF) analysis
applyingdescribedFAROUT ratingshistory oflimitations ofstrategic rationale forstrengths of
CTI (Competitive Technology Intelligence)culture, in win/loss analysiscurved lines, in regression analysiscustomer-related market segmentationcustomers of analysis
problem definitionscope identification
D
Daniel, J. Ronalddata comparison, in statistical analysisdata overload, in analysis failuresDCF (discounted cash flow) analysisdecision location/decision maker, in analysis scopedecision making
analysis infailuresovercoming analysis failures
decision support systems (DSS)delayed fit, in SERVO analysisDell Computer case study (business model analysis)Delphi method, technology forecasting
applyingcase studyhistory oflimitations ofstrengths of
Developing Business Strategies (Aaker)DFA(driving forces analysis). See driving forces analysis (DFA)DFs (driving forces). See driving forces (DFs)differentiation
of analysis typesin product line analysisstrategies
digital music industry case study (driving forces analysis)discounted cash flow (DCF) analysisdisproving hypothesesdistinctiveness, in reputation managementdistributed-related critical success factorsDonnelly, D.Dowling, Grahamedriver communication styledrivers, defineddriving forces (DFs)
assessing impact ofdefinedidentifying
driving forces analysis (DFA)applying

case studydescribedFAROUT ratingshistory oflimitations ofstrategic rationale forstrengths of
DSS (decision support systems)Dugal, M.
E
E&T (event and timeline) analysis. See event and timeline (E&T) analysise-mailearly fit, in SERVO analysiseBay case study (product line analysis)ECF (event and causal factor) charts, developing event and timeline (E&T) analysiseconomic risk, in country risk assessment (CRA)education, in analysis
list of courseseducational offerings, in analysis failuresefficiency, in analysisEIS (enterprise information systems)Eisenhardt, KathleenElasser, C.empowerment, analysis asenterprise information systems (EIS)enterprise resource planning systems (ERP)environment
in analysis scopein SERVO analysis
environment-level failuresERP (enterprise resource planning systems)escalating commitmentestimation biasevaluating. See selectingevaluation of input, in analysisevent and causal factor (ECF) charts, developing event and timeline (E&T) analysisevent and timeline (E&T) analysis
applyingcase studydescribedFAROUT ratings
history oflimitations ofstrategic rationale forstrengths of
events matrix, developing event and timeline (E&T) analysisevidence for hypotheses, analysis of competing hypotheses (ACH)exchange risk, in country risk assessment (CRA)executive information systems (ExIS)exercises (communication format)expert opinion. See Delphi methodexplicit assumptionsexponential curve, in regression analysisexpressive communication styleexternal benchmarkingexternal environment-level failuresexternal networksextrapolation. See trend extrapolation
F
face-to-face briefingsfacts, definedFahey, L.failure, analysis of
levels of failuresources of failure
failures of analysisanalysis task-level failuresexternal environment-level failureshierarchical model ofindividual analyst-level failuresinternal organizational-level failuresovercoming
FAROUT rating systemanalysis of competing hypotheses (ACH)benchmarking analysisbusiness model analysis (BMA)cash flow analysiscompetitive positioning analysiscorporate reputation analysis (CRA)country risk assessment (CRA)critical success factors (CSF) analysisdriving forces analysis (DFA)

event and timeline (E&T) analysisfive-point scalehistoriographical analysisindications and warning (I&W) analysislinchpin analysisMcKinsey 7S analysisproduct line analysisSERVO analysisshadowingstatistical analysisstrategic relationship analysis (SRA)supply chain management (SCM) analysistechnique ratings summarytechnology forecastingwar gamingwin/loss analysis (WLA)
Federal Express case study (benchmarking analysis)Feldman, M.S.The Fifth Discipline (Senge)financial resources, in SERVO analysisfinancial services case study (competitive positioning analysis)Fiora, B.fit, in SERVO analysisFlannagan, JohnFleisher, C.S.flexibility, in analysisfocus, in reputation managementfocused CRAFombrun, CharlesFord, Henryforeign investment. See country risk assessment (CRA)foresight studies, history of technology forecastingFoss, ChristopherFoster, B.P.Fuld, L.M.functional benchmarkingfunds analysisfuture cash flow analysis. See also cash flow analysis
case studyfuture-orientation (in FAROUT rating system)
G
Gamble, J.E.Gannon, JohnGardberg, NaomiGE/McKinsey attractiveness-competitive position matrixGhemawat, PankajGilad, Benjaminglobal best practice benchmarkingglobalization, in analysis failuresGodbee, G.J.Gomes-Casseres, BenjaminGoodman, R.S.goodness-of-fit, in regression analysisgovernmental risk, in country risk assessment (CRA)Gowing BrothersGreenspan, Alangroupthinkgrowth curves, technology forecasting
applyinglimitations ofstrengths of
H
Herring, Jan P.Heuer, J.R. Jr.Heuer, RichardHiggins, Roberthistoric cash flow analysis. See also cash flow analysis
case studyhistorical analogy, applying technology forecastinghistoriographical analysis
applyingcase studydescribedFAROUT ratingshistory oflimitations ofstrategic rationale forstrengths of
history ofanalysis of competing hypotheses (ACH)benchmarking analysisbusiness model analysis (BMA)

cash flow analysiscompetitive positioning analysiscorporate reputation analysis (CRA)country risk assessment (CRA)critical success factors (CSF) analysisdriving forces analysis (DFA)event and timeline (E&T) analysishistoriographical analysisindications and warning (I&W) analysislinchpin analysisMcKinsey 7S analysisproduct line analysisshadowingstrategic relationship analysis (SRA)supply chain management (SCM) analysistechnology forecastingwar gaming
Horton, IanHP case study (business model analysis)human resources, in SERVO analysisHungary, country risk assessment case studyhyperbolic curves, in regression analysishypotheses (analysis of competing hypotheses [ACH])
disprovingevidence supportingidentifyingmatrix ofquestioning assumptions in
I
I&W (indications and warning) analysis. See indications and warning (I&W) analysisidentity, in reputation managementillusion of controlimminence, interpreting indicatorsimpact assessmentsimplementation, in McKinsey 7S analysisimplicit assumptionsincreased competition, reasons forindications and warning (I&W) analysis
applyingdescribedFAROUT ratings
history oflimitations ofstrategic rationale forstrengths of
indicators (indications and warning [I&W] analysis)establishinginterpretingvalidating
individual analyst-level failuresinductive approach, in historiographical analysisindustry analysis, in competitive positioning analysis. See also Nine Forces modelindustry benchmarkingindustry experts, identifying critical success factorsindustry leader analysis, identifying critical success factorsinformation, analysis andinformation systemsinfrastructure support for analysis
educationefficiencyexternal networksintelligence solutionsinternal networksproactivity
input evaluation, in analysisinstant messagingintangible resources, in SERVO analysisintelligence. See also analysis; CI (competitive intelligence)
definedvalue-added intelligence, analysis as
intelligence analysis levelsoperational intelligence analysis (OIA)strategic intelligence analysis (SIA)tactical intelligence analysis (TIA)
intelligence briefingsintelligence cycle, analysis inintelligence failuresintelligence solutions
limitations ofintelligence systemsinter-firm relationships. See strategic relationship analysis (SRA)internal benchmarkinginternal networksinternal organizational-level failuresinterpretation of statistical analysis
applying
describedFAROUT ratingslimitations ofstrategic rationale forstrengths of
interviews, in win/loss analysis
J-K
Johnston, R.joint ventures (JVs), definedKalinowski, D.J.Kenya Airways case study (McKinsey 7S analysis)Key Intelligence Questions (KIQs)Key Intelligence Topics (KITs)KM (knowledge management systems)knowledge
analysis andelements of
assumptionsbeliefsfactsperceptionsprojections
synthesizingknowledge management systems (KM)Kruger, E.V.
L
LASA(linchpin assumption sensitivity analysis)Lasswell, HaroldLawless, Robertlearning curveLehmann, DonaldLeidecker, JoelLevitt, TheodoreLewin, Kurtlicensing agreements, definedlinchpin analysis
applying
describedFAROUT ratingshistory oflimitations ofstrategic rationale forstrengths of
linchpin assumption sensitivity analysis (LASA)Linder, J.linear view of historylocation risk, in country risk assessment (CRA)loose fit, in SERVO analysisLouden, T.L.low-cost provider strategies
M
M&As (mergers and acquisitions), definedmacro environmental analysis. See Nine Forces modelmanagement information systems (MIS)manufacturing-related critical success factorsmapping relationshipsMarch, J.G.market position
defendingdeveloping and building onmaintainingwithdrawing from market
market researchmarket segmentation
customer-related market segmentationproduct market segmentationtarget segment
marketing information systems (MkIS)marketing-related critical success factorsmatrix of hypothesesMcCombs, MaxwellMcGonagle, J.J. Jr.McKinsey 7S analysis
applyingcase studydescribedFAROUT ratingshistory of

limitations ofstrengths of
mean, in statistical analysismedia monitoring, in corporate reputation analysis (CRA)media rankings, in corporate reputation analysis (CRA)median, in statistical analysismedium fit, in SERVO analysisMeldrum, D.H.mergers and acquisitions (M&As), definedmethod, interpreting indicatorsMicrosoft Business Solutions case study (win/loss analysis)milestones, identifyingMiller, G.A.minority investments, definedMIS (management information systems)Mitchell, D.MkIS (marketing information systems)Mockus, D.S.mode, in statistical analysismonitoring, applying in technology forecastingMontgomery, Davidmorphological analysis, technology forecasting
applyinglimitations ofstrengths of
motivation, interpreting indicators
N
Naylor, Ellennetworks
definedexternal networksinternal networks
news bulletinsnewslettersNine Forces model
applyingcase studyFAROUT ratingslimitations ofstrategic rationale forstrengths of
normal distribution, in statistical analysisnormal fit, in SERVO analysisnull hypothesis
O
O&T (opportunity and threat) assessmentsobjective skepticism, in historiographical analysisobjectivity (in FAROUT rating system)Occam's Razor ruleOIA(operational intelligence analysis)operational benchmarkingoperational decisionsoperational intelligence analysis (OIA)opportunity, interpreting indicatorsopportunity and threat (O&T) assessmentsorganization, in SERVO analysisorganizational design and effectiveness, elements oforganizational priorities, analysis andorganizational-level failuresoutliers, in statistical analysisoutsourcing, defined
P
p-values, in statistical analysispackaged-food company case study (shadowing)partnerships, in analysispercentage changes, in statistical analysispercentiles, in statistical analysisperceptions, definedperceptual mapsperformance measurement, in analysisPEST analysis
identifying critical success factorspharmaceutical company case study (shadowing)pharmaceutical timelines case study (event and timeline analysis)physical resources, in SERVO analysisPIMS databaseplanning failuresplanning sessions
PLC (product life cycle)political risk, in country risk assessment (CRA)population, in statistical analysisPorter, MichaelPorter's Five Forces
identifying critical success factorsPorter's Generic Strategiespositioning
definedin product line analysis
postmortem analysis, biases inPowell, T.Power Brewing case study (future cash flow analysis)Power, Berniepractical usage, of corporate reputation analysis (CRA)preparations for war gamespresentations in meetings/seminars/workshopsprimary activitiesprimary sources of information, in historiographical analysisprior hypothesis bias
in historiographical analysisprioritizing. See also organizational priorities
critical success factorsdriving forces (DFs)
privatization case study (McKinsey 7S analysis)proactivity, in analysisproblem definition, in analysisproduct life cycle (PLC)product line analysis
applyingcase studydescribedFAROUT ratingshistory oflimitations ofstrategic rationale forstrengths of
product market segmentationprojections, definedpropositions, developing, in historiographical analysisThe Psychology of Intelligence Analysis (Heuer)
Q
Qantas cash flow analysis examplequalitative information, in corporate reputation analysis (CRA)quartiles, in statistical analysisquestion and answer sessionsquestionnaire, developing for win/loss analysis
R
ranking. See prioritizingRaynor, M.E.ready-to-eat food company case study (shadowing)real-time analysisreasoning by analogyregression analysis, in statistical analysisReid, Ednarelationship life cyclerelationships. See also strategic relationship analysis (SRA)
assessingidentifyingmapping
relevance trees, technology forecastingapplyinglimitations ofstrengths of
reliabilityof corporate reputation analysis (CRA)of information
report types (communication of results)representativenessreputation. See corporate reputation analysis (CRA)reputation managementReputation Quotientresearch question development, in historiographical analysisresidualresource allocation, in product line analysisresource efficiency (in FAROUT rating system)resource management, in analysisresources, in SERVO analysisretail market case study (supply chain management analysis)retail menswear case study (historiographical analysis)return on investment of corporate reputation analysis (CRA)revenue modelsRieden, Arthur
risk, assessing, in linchpin analysisrisks, in country risk assessment (CRA)
economic riskexchange risklocation riskpolitical risksovereign risktransfer risk
Ritchie, J.Rockart, John F.role-playing games. See also war gamingRosenbloom, R.Rosenkrans, WayneRothberg, H.N.Royal Dutch/Shell case study (corporate reputation analysis)
S
sales postmortemwin/loss analysis compared
sample, in statistical analysisSAs (strategic alliances), definedSawka, Kenscenarios, applying in technology forecastingSchoonhoven, ClaudiaSchulz, S.science, art versusscientific method analogySCM (supply chain management) analysis. See supply chain management (SCM) analysisscope identification, in analysisSCOR (Supply Chain Operations Reference) modelSears case study (supply chain management analysis)secondary activitiessecondary sources of information, in historiographical analysissector/competitor assessmentssegmentation. See market segmentationselecting
teams, for war gamingtechniques
FAROUT rating systemseminarsSenge, PeterSERVO analysis

applyingdescribedenvironment elementFAROUT ratingslimitations oforganization elementresources elementstrategy elementstrengths ofvalues element
Sever, Joyshadow market plansshadow teamsshadowing
applyingcase studydescribedFAROUT ratingshistory oflimitations ofstrategic rationale forstrengths of
Shannon, C.E.shared values, in McKinsey 7S analysisShell case study (corporate reputation analysis)Shumadine, JohnSIA (strategic intelligence analysis)situation analysisskepticismskills, in McKinsey 7S analysisskills-related critical success factorsSmith, R.societal risk, in country risk assessment (CRA)sovereign risk, in country risk assessment (CRA)special intelligence summariesSperger, M.SRA(strategic relationship analysis)
applyingdescribedFAROUT ratingshistory oflimitations ofstrategic rationale forstrengths of
Stacey, Gary
staff, in McKinsey 7S analysisstandard deviation, in statistical analysisstatistical analysis interpretation
applyingdescribedFAROUT ratingslimitations ofstrategic rationale forstrengths of
Stech, F.J.STEEP/PEST analysis
identifying critical success factorsstimulus-response analysisstraight lines, in regression analysisstrategic, definedstrategic alliances (SAs), definedstrategic benchmarkingstrategic decisionsstrategic impact worksheetsstrategic intelligence analysis (SIA)strategic networks, definedstrategic rationale
analysis of competing hypotheses (ACH)benchmarking analysisbusiness model analysis (BMA)cash flow analysiscompetitive positioning analysiscorporate reputation analysis (CRA)country risk assessment (CRA)critical success factors (CSF) analysisdriving forces analysis (DFA)event and timeline (E&T) analysishistoriographical analysisindications and warning (I&W) analysisinterpretation of statistical analysislinchpin analysisproduct line analysisshadowingstrategic relationship analysis (SRA)supply chain management (SCM) analysistechnology forecastingwar gamingwin/loss analysis (WLA)
strategic relationship analysis (SRA)applying

describedFAROUT ratingshistory oflimitations ofstrategic rationale forstrengths of
strategyin McKinsey 7S analysisin SERVO analysis
Strickland, A.J.structure, in McKinsey 7S analysisstyle, in McKinsey 7S analysissupply chain management (SCM) analysis
applyingcase studydescribedFAROUT ratingshistory oflimitations ofstrategic rationale forstrengths of
Supply Chain Operations Reference (SCOR) modelsustainability, in cash flow analysissynthesizing knowledgesystems, in McKinsey 7S analysis
T
t-testtactical decisionstactical intelligence analysis (TIA)target segment, in market segmentationtask-level failuresteams
selecting for war gamingshadow teams
techniquesanalysis of competing hypotheses (ACH)benchmarking analysisbenefits of using correctlybusiness model analysis (BMA)cash flow analysiscompetitive positioning analysis
corporate reputation analysis (CRA)country risk assessment (CRA)critical success factors (CSF) analysisdriving forces analysis (DFA)event and timeline (E&T) analysishistoriographical analysisindications and warning (I&W) analysisinterpretation of statistical analysislinchpin analysisMcKinsey 7S analysisproduct line analysisselecting
FAROUT rating systemSERVO analysisshadowingstrategic relationship analysis (SRA)supply chain management (SCM) analysistechnology forecastingwar gamingwin/loss analysis (WLA)
technology, in analysis scopetechnology forecasting
applyingcase studydescribedFAROUT ratingshistory oflimitations ofstrategic rationale forstrengths of
technology road-mapping, history of technology forecastingtechnology-related critical success factorstheory construction, in historiographical analysisthinking, analysis andThompson, A.A.TIA(tactical intelligence analysis)tight fit, in SERVO analysistime, importance oftimelines. See event and timeline (E&T) analysistimeliness (in FAROUT rating system)tools, needed for analysis. See also techniquestraining. See educationtransfer risk, in country risk assessment (CRA)transparency, in reputation managementTregoe, B.B.

trend extrapolation, technology forecastingapplyinglimitations ofstrengths of
trends analysesTrout, Jacktrust, in analysisturbulence, in analysis failuresTzu, Sun
U
U.S. Central Intelligence Agency (CIA)Ukraine, country risk assessment case studyuniversal nature of corporate reputation analysis (CRA)usefulness (in FAROUT rating system)utility company case study (shadowing)
V
validating indications and warning (I&W) analysisvalue chain analysisvalue constellation analysisvalue network analysisvalue of analysisvalue-added intelligence, analysis asvalues, in SERVO analysisVella, C.M.
W
Wall, Alexanderwar gaming
applyingcase studydescribedFAROUT ratingshistory oflimitations ofstrategic rationale for

strengths ofWard, T.J.warnings (indications and warning [I&W] analysis)
issuingresponses to
Weaver, W.Weinberg, CharlesWells, H.G.Whitman, Megwin/loss analysis (WLA)
applyingcase studydescribedFAROUT ratingslimitations ofstrategic rationale forstrengths of
Winaker, A.Winer, RussellWLA(win/loss analysis). See win/loss analysis (WLA)workshopswritten reports
Z
Zimmerman, J.W.Zmud, RobertZwicky, FritzZyboldt Metals Corporation (ZMC) case study (country risk assessment)