business analysis€¦ · · 2014-11-24e.g. cognos’ powerplay, brio ... dynamic objects that...
TRANSCRIPT
BUSINESS ANALYSIS
Reporting and Query tools and Applications
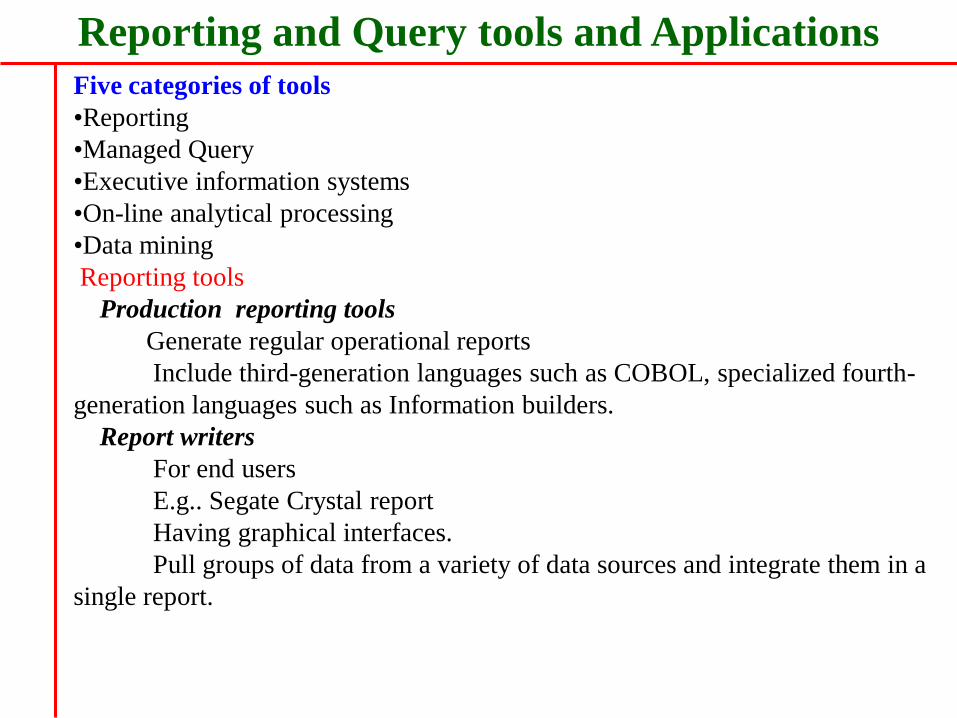
Five categories of tools
•Reporting
•Managed Query
•Executive information systems
•On-line analytical processing
•Data mining
Reporting tools
Production reporting tools
Generate regular operational reports
Include third-generation languages such as COBOL, specialized fourth-
generation languages such as Information builders.
Report writers
For end users
E.g.. Segate Crystal report
Having graphical interfaces.
Pull groups of data from a variety of data sources and integrate them in a
single report.
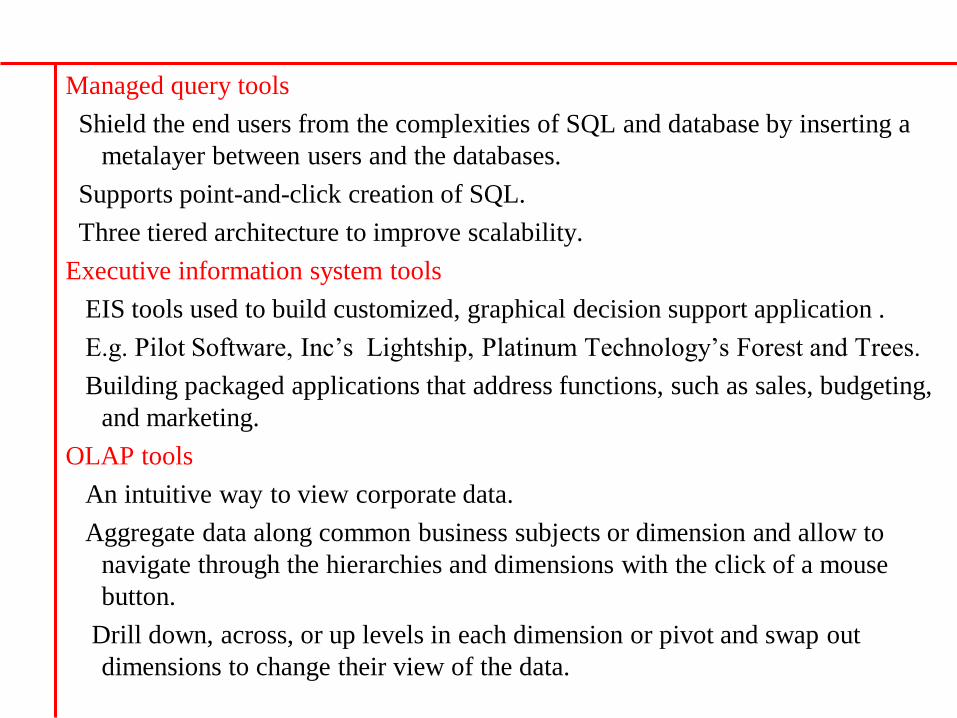
Managed query tools
Shield the end users from the complexities of SQL and database by inserting a
metalayer between users and the databases.
Supports point-and-click creation of SQL.
Three tiered architecture to improve scalability.
Executive information system tools
EIS tools used to build customized, graphical decision support application .
E.g. Pilot Software, Inc’s Lightship, Platinum Technology’s Forest and Trees.
Building packaged applications that address functions, such as sales, budgeting,
and marketing.
OLAP tools
An intuitive way to view corporate data.
Aggregate data along common business subjects or dimension and allow to
navigate through the hierarchies and dimensions with the click of a mouse
button.
Drill down, across, or up levels in each dimension or pivot and swap out
dimensions to change their view of the data.
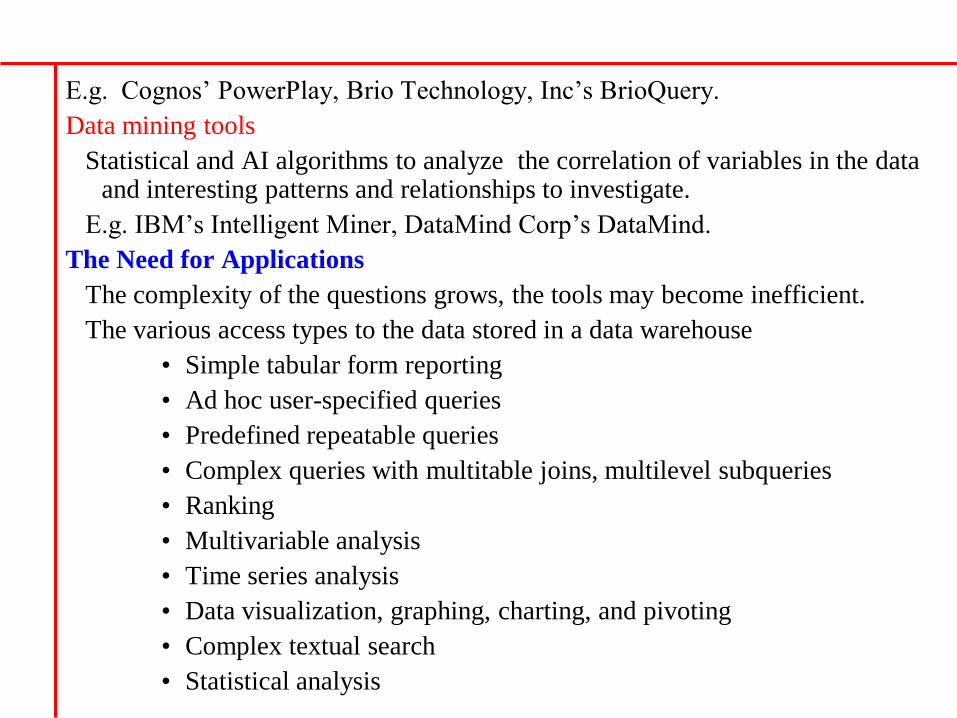
E.g. Cognos’ PowerPlay, Brio Technology, Inc’s BrioQuery.
Data mining tools
Statistical and AI algorithms to analyze the correlation of variables in the data and interesting patterns and relationships to investigate.
E.g. IBM’s Intelligent Miner, DataMind Corp’s DataMind.
The Need for Applications
The complexity of the questions grows, the tools may become inefficient.
The various access types to the data stored in a data warehouse
• Simple tabular form reporting
• Ad hoc user-specified queries
• Predefined repeatable queries
• Complex queries with multitable joins, multilevel subqueries
• Ranking
• Multivariable analysis
• Time series analysis
• Data visualization, graphing, charting, and pivoting
• Complex textual search
• Statistical analysis
• AI techniques for testing of hypothesis, trends discovery
• Information mapping
• Interactive drill-down reporting and analysis
Three distinct type of reporting
1. Creation and viewing of standard reports – Routine delivery of report
2. Definition and creation of ad hoc reports – managers and business users to
quickly create their own reports and get quick answers
3. Data exploration – Users can easily “surf” through data without a preset
path.
The above said reasons may require applications often take the form of
custom-developed screens and reports that retrieve frequently used data and
format it in a predefined standardized way.
Cognos Impromptu
Overview
Product from Cognos Corporation.
An enterprise solution for interactive database reporting.
Object oriented architecture, control and administrative consistency
across all users and reports
Graphical user interface
Ease of deployment
Low cost
Support both single user and multiusers
The Impromptu Information Catalog.
A LAN based repository of business knowledge and data access rules.
Protects the database from repeated queries and unnecessary processing.
Presents the database in a way that reflects how the business is organized,
And uses the terminology of the business.
Enables business-relevant reporting through business rules
Object-oriented architecture
Inheritance-based administration and distributed catalogs.
Changes to business rules, permission sets, and query activities cascade
automatically throughout the enterprise.
Management functionality through the use of governers
Governor can control
• Query activity
• Processing location
• Database connections
• Reporting permissions
• User profiles
• Client/server balancing
• Database transactions
• Security by value
• Field and table security
Reporting
Easy build and run their own reports
Contains predefined templates for mailing, labels, invoices, sales reports,
and custom automation.
Provides special reporting options
Picklists and prompts
creating report for which users can select from lists of values called
picklist.
Reports containing too many values for a single variable, Impromptu
offers prompt.
It allows to supply value at run time
Custom templates
Users can apply their data to the placeholders contained in the template
Templates standard logic, calculations, and layout complete the report
automatically in the user’s choice of format
Exception reporting
Ability to report high light values that lie outside accepted ranges.
Three types of exception report
Conditional filters. Only those values that are outside defined threshold,
or define ranges to organize data for quick evaluation. E.g. Sales under
Rs.10000.

Conditional highlighting. Formatting data on the basis of data values.
E.g. Sales over Rs. 10000 always appear blue.
Conditional display. Display report object under certain conditions.
E.g. Sales graph only if the sales are below a predefined value.
Interactive reporting
Unifying query and reporting in a single interface.
Frames.
Frames are building blocks that may be used to produce reports.
Frames formatted with fonts, border, colors, shading, etc.,
Frames combined to create complex reports
Templates can be created with multiframes.
List frames
Form frames
Cross-tab frames
Chart frames
Text frames
Picture frames
OLE frames
Impromptu’s design is tightly integrated with the Microsoft Windows environment.

Impromptu Request Server.
sending query process to the server.
Request server will execute the request, generating the result on the
server.
After the producing the result it notifies the client, so that client to do
other things.
supports data maintained in ORACLE 7.x and SYBASE
Supported database
Support ORACLE, SQL server, SYBASE SQL server, MDI DB2
Gateway, Informix, dBase, Paradox.
Applications
Organizations build applications for several reasons
• A legacy DSS is still being used, and the reporting facilities appear adequate
• An organization has made a large investment in a particular application
• A new tool may require an additional investment, software, and the
infrastructure
• A particular reporting requirement may be too complicated for an available
reporting tools to handle
PowerBuilder
• Object-oriented applications, including encapsulation, polymorphism, inheritance and GUI objects.
• Once object created and tested and it can be reused by other applications
• Ability to interface with a wide variety of DBMS.
Object orientation
Supports many object-oriented features
• Inheritance
• Data abstraction
• Encapsulation
• Polymorphism
Windows facilities
PowerBuilder supports Windows facilities
• DDE
• OLE
• MDI
Features
PowerBuilder windows and controls can contain program scripts that
execute in response to different events that can be detected by PowerBuilder
PowerBuilder controls are buttons, radio buttons, bush buttons, list box,
check boxes, combo boxes, text fields menus, edit fields, and pictures
Supports events such as clicked, double clicked
Client/server application can be constructed using PowerBuilder painters
• Application Painter.
First identifies basic details and components of new or existing
applications
Application icon displays a hierarchical view of the application structure
All levels can be expanded or contracted with a click of the right mouse
button.
Creating and naming new applications, selection of an application icon,
setting of the library search path, and defining of default text characteristics.
Supports all events
It also used to run or debug the application
• Window Painter
Used to create and maintain PowerBuilder window objects.
Supports creation main application window, pop-up, dialog, and MDI.
Operations are performed by drag and drop and click operations.
PowerScript Painter – allows to select from a list of events and global
and local variables.
Object browser – displays attributes of any object, data type and
structures.
• DataWindows Painter
Dynamic objects that provide access to databases and other data sources
such as ASCII files.
Applications use this to connect to multiple databases and files, as well
as import and export data in a variety of formats such as dBase, Excel, Lotus.
It also supports stored procedure.
It allows developers to select a number of presentation styles from the
list of tabular, grid, label, and free form.
It also allows a user-specified number of rows to be displayed.
QueryPainter – used to generate of SQL statements that can be stored in
PowerBuilder libraries.
Thus, using Application Painter, Window Painter, and DataWindows
Painter facilites, a simple client/server application can be constructed literally
in minutes.
A rich set of SQL functions is supported, including
CONNECT/DISCONNECT, DECLARE, OPEN, and CLOSE cursor, FETCH,
and COMMIT/ROLLBACK.
PowerBuilder supplies server other painter.
• Database Painter – used to pick table from the list box and examine
and edit join conditions and predicates, key fields, extended attribute,
display formats and other database attributes.
• Structure Painter – Creation and modification of data structures and
groups of related data elements
• Preference Painter – Configuration tool that is used to examine and
modify configuration parameters. For the PowerBuilder environment
• Menu Painter – Creates menus
• Function Painter – Assists developers in creating functions calls and parameters using combo boxes.
• Library Painter - Manages the library in which the application components reside.
• User object Painter – Allows Developers to create custom controls.
• Help Painter – Built-in help system
Forté
It is three tiered architecture – Client, Application business logic, and Data server.
Rapid development, testing, and deployment of distributed client/server applications across any enterprise.
Application partitioning.
Forté allows to build logical application that is independent of the underlying environment.
Developers build an application as if it were to run entirely on a single machine.
Forté automatically splits apart the application to run across the clients and servers that constitute the deployment environment.
Support tunable application partitioning
Shared-application services
With Forté , developers build collection of application components
The components can include client functionality such as data presentation and other desktop processing.
Shared-application services form the basis for a three-tiered application architecture
Business events
Automate the notification of significant business occurrences so that appropriate actions can be taken immediately by users.
Forté detects the event, and sends notification to all the application components that have expressed interest in that event.
It supports three functional components
• Application Development Facility (ADF)
Distributed object computing framework
To define user interfaces and application logic
Includes GUI designer and Transactional object-oriented language (TOOL)

• System Generation Facility (SGF)
Assists developers in partitioning the application, generating executables
for distribution.
• Distributed Execution Facility (DEF)
Tools for managing applications at runtime, including system
administration support, a distributed object manager to handle
communications between applications partitions, and a performance monitor.
Web and Java integration
Integration with Java
ActiveX and ActiveX server support
Forté servers can be called from OLE
Support for the ability to call Forté Application servers from C++
modules
An option to generate and compile C++ code
Portability and supported platforms
Forté provides transparent portability across the most common
client/server platforms for both development and depolyment.
Data General AViiON, Digital Alpha, Open VMS, UNIX, HP 9000, IBM RS/6000, Sun SPARC, and Window NT. Desktop GUI support includes Macintosh, Motif, and Windows.
Information Builder
The products from Information builder
Catcus and FOCUS
Cactus
Client/server environment
create, test and deploy business applications spanning the Internet
Three-tired environment and application of any size and scope.
It builds highly reusable components
Object-based visual programming environment
Access to ActiveX , VX, and OLE controls.
Web-enabled access
Application development for the Web with no prior knowledge of HTML.
The developer can focus on the business problem rather than the underlying technology.

Components and features
• Cactus Workbench – the front-end interface that provides access to the
tool suite via iconic toolbars, push buttons, and menus.
• Application Manager – in integrated application repository that
manages the application development
• Partition Manager
• Object browser
• Maintain – the proprietary language of cactus
• File painter – used to build the database access objects
• Application packager – used at deployment
• EDA/Client – “message layer” for tier-to-tier communications.
• Cactus Servers
• Cactus OCX
Focus Fusion
For multidimensional database technology for OLAP and data
warehousing.

FOCUS Fusion provides
• Fast query and reporting
• Its advanced indexing, parallel queryn and rollup facilities
• Comprehensive, graphics-based administration facilities
• Database applications easy to build
• Integrated copy management facilities
• Automatic data refresh from any source into Fusion
• Open access via industry-standard protocols
• Through ANSI SQL, ODBC, and HTTP
On-Line Analytical Processing (OLAP)
Need for OLAP
• Market analysis and financial forecasting requires a multidimensional schema
• Required to process large numbers of records from very large data sets.
• The multidimensional nature is the key driver for OLAP
• Relational database and SQL have some limitations
E.g.. Full table scan, multiple join, aggregations and sorting and computing this require the resources may not available all the time
• RDBMS weakness in analyzing Time Series and complex mathematical functions
• RDBMS suffer response time and SQL funcitionality
• OLAP is a contiuous, iterative, and interactive process.
– E.g. Sales person performance affect monthly revenue numbers
All these reasons make the need for OLAP

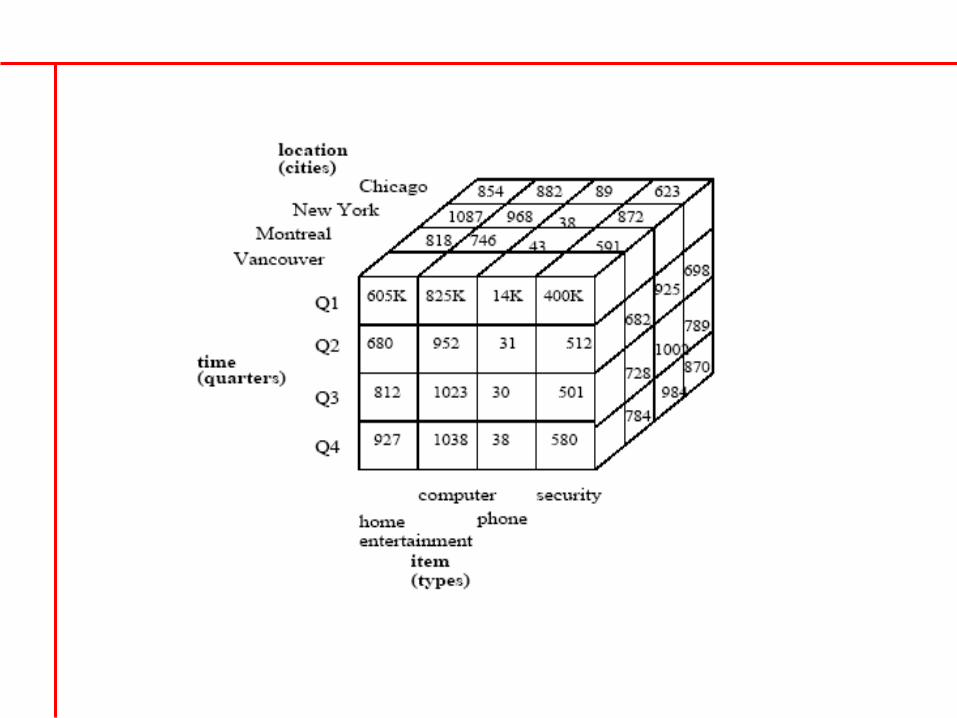
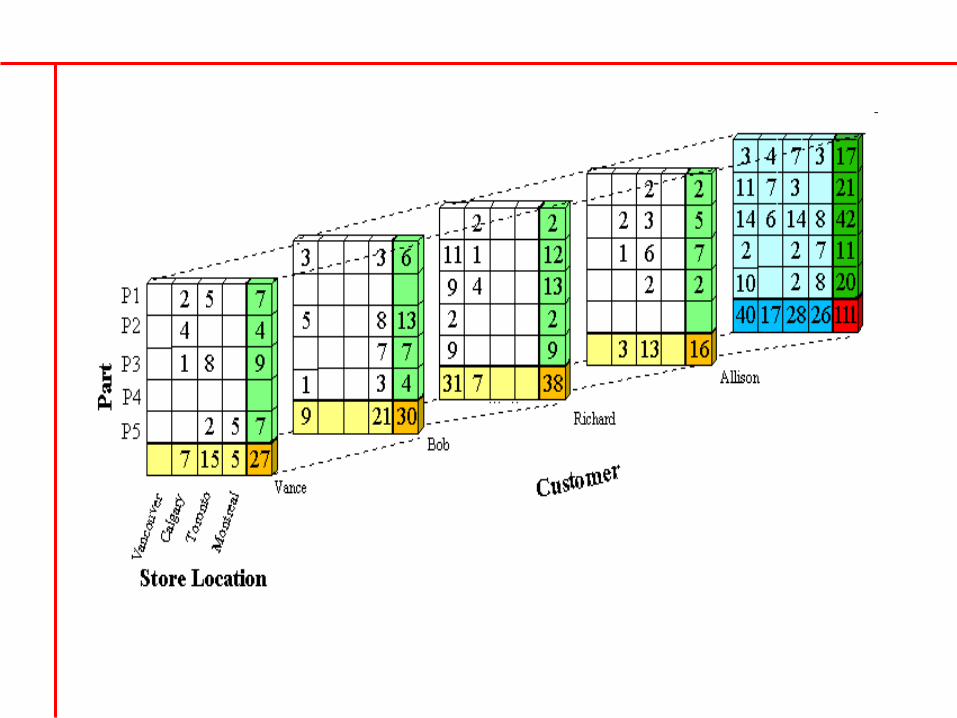
Multidimensional Data Model
• Business problems are multidimensional nature
E.g.
How much revenue did the new product generate?
How much revenue did the new product generate by month, in north division,
by sales office, relative to the previous version – a five dimensional query
• Hence Multidimensional data model viewed as cube
• The cube can be converted into table by dimensions with other values like
sales numbers, unit price
• The response time of the multidimensional query depends on how many cells
have to be added on the fly
• The number of dimensions increases, the number of cells in the table increases
exponentially.
• The solution is to Build an efficient multidimensional database is to
preaggregate all logical subtotals and totals along all dimensions
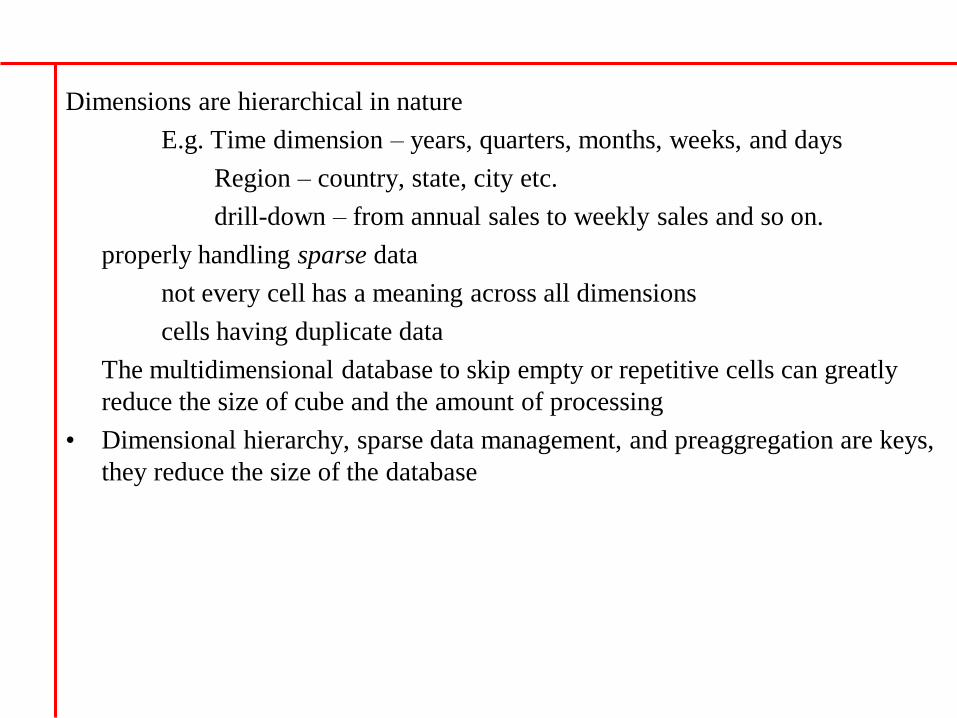
Dimensions are hierarchical in nature
E.g. Time dimension – years, quarters, months, weeks, and days
Region – country, state, city etc.
drill-down – from annual sales to weekly sales and so on.
properly handling sparse data
not every cell has a meaning across all dimensions
cells having duplicate data
The multidimensional database to skip empty or repetitive cells can greatly
reduce the size of cube and the amount of processing
• Dimensional hierarchy, sparse data management, and preaggregation are keys,
they reduce the size of the database
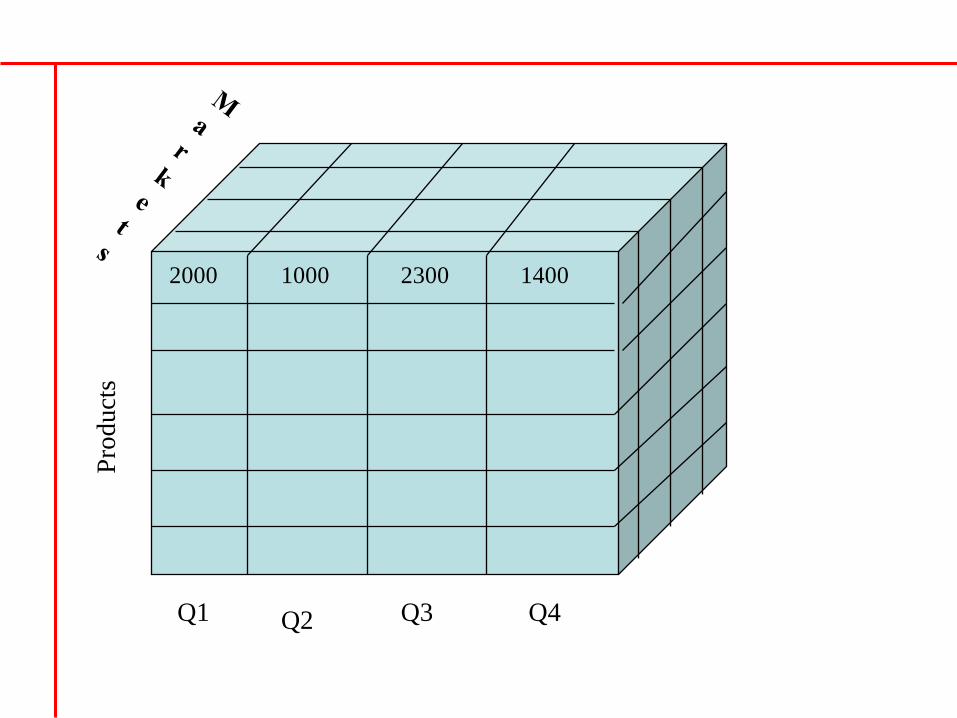
Pro
duct
s
Q1 Q2 Q3 Q4
2000 1000 2300 1400


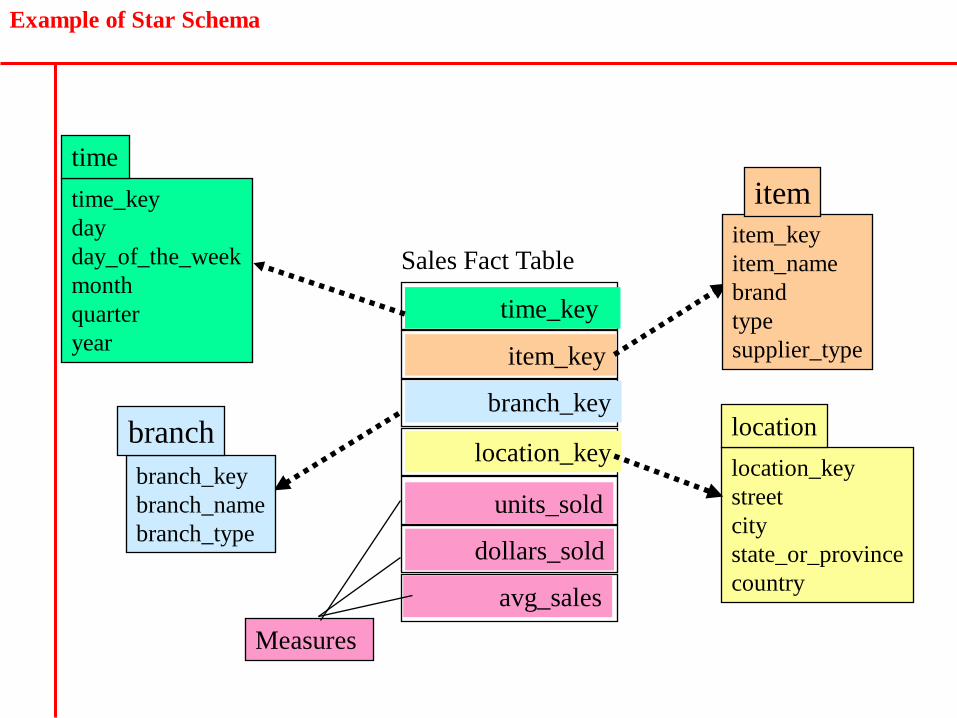
Example of Star Schema
time_key
day
day_of_the_week
month
quarter
year
time
location_key
street
city
state_or_province
country
location
Sales Fact Table
time_key
item_key
branch_key
location_key
units_sold
dollars_sold
avg_sales
Measures
item_key
item_name
brand
type
supplier_type
item
branch_key
branch_name
branch_type
branch

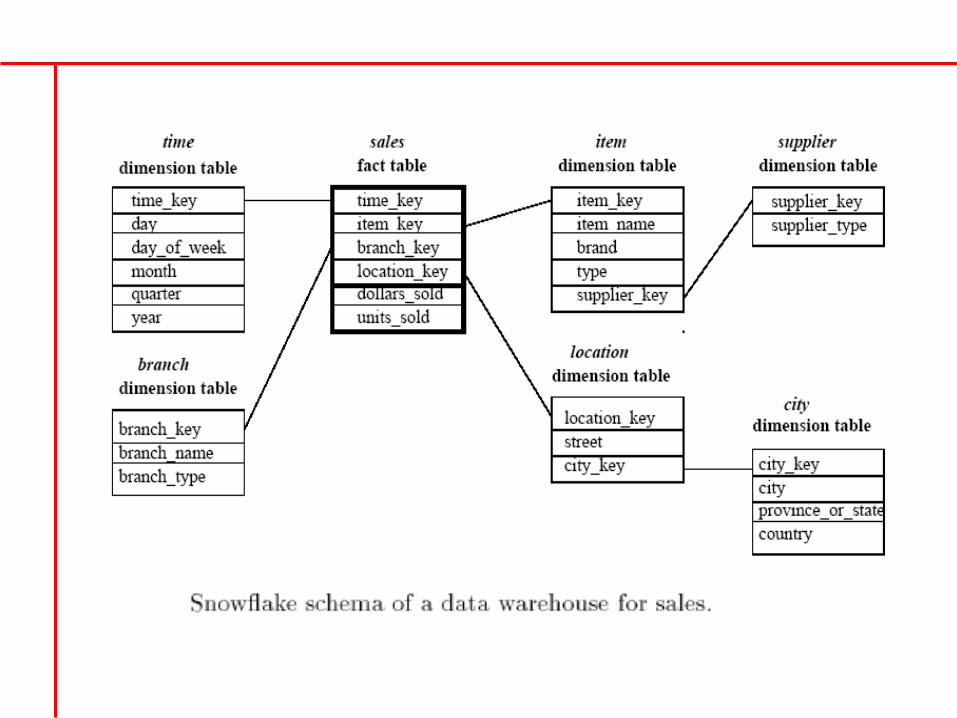
Example of Snowflake Schema
time_key
day
day_of_the_week
month
quarter
year
time
location_key
street
city_key
location
Sales Fact Table
time_key
item_key
branch_key
location_key
units_sold
dollars_sold
avg_sales
Measures
item_key
item_name
brand
type
supplier_key
item
branch_key
branch_name
branch_type
branch
supplier_key
supplier_type
supplier
city_key
city
state_or_province
country
city
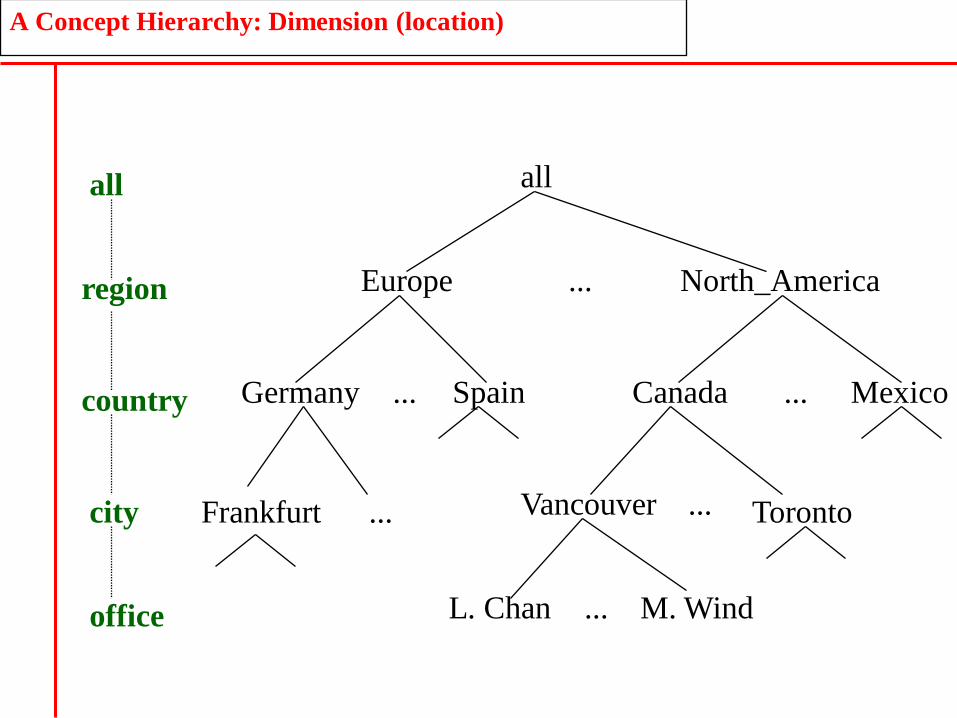
A Concept Hierarchy: Dimension (location)
all
Europe North_America
MexicoCanadaSpainGermany
Vancouver
M. WindL. Chan
...
......
... ...
...
all
region
office
country
TorontoFrankfurtcity
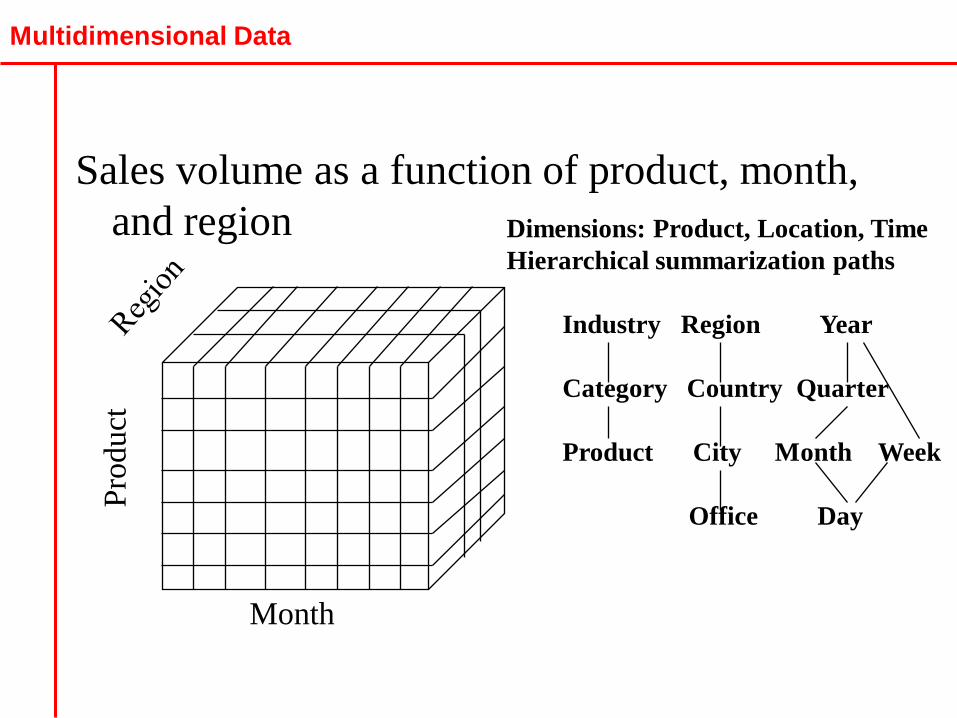
Multidimensional Data
Sales volume as a function of product, month,
and region
Pro
duct
Month
Dimensions: Product, Location, Time
Hierarchical summarization paths
Industry Region Year
Category Country Quarter
Product City Month Week
Office Day
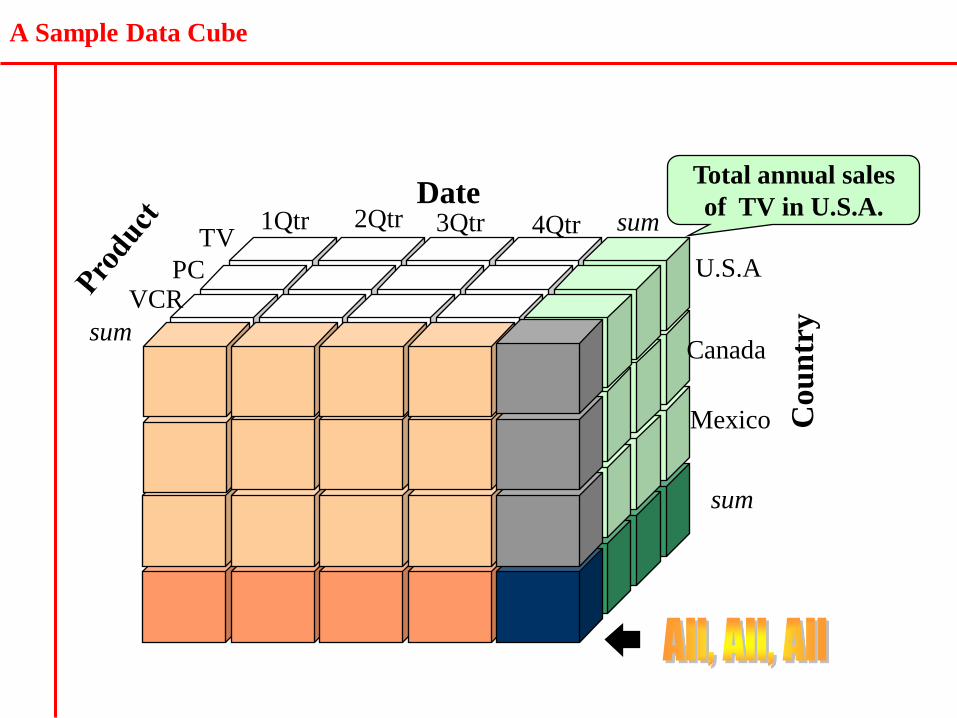
A Sample Data Cube
Total annual sales
of TV in U.S.A.Date
Cou
ntr
ysum
sumTV
VCRPC
1Qtr 2Qtr 3Qtr 4Qtr
U.S.A
Canada
Mexico
sum
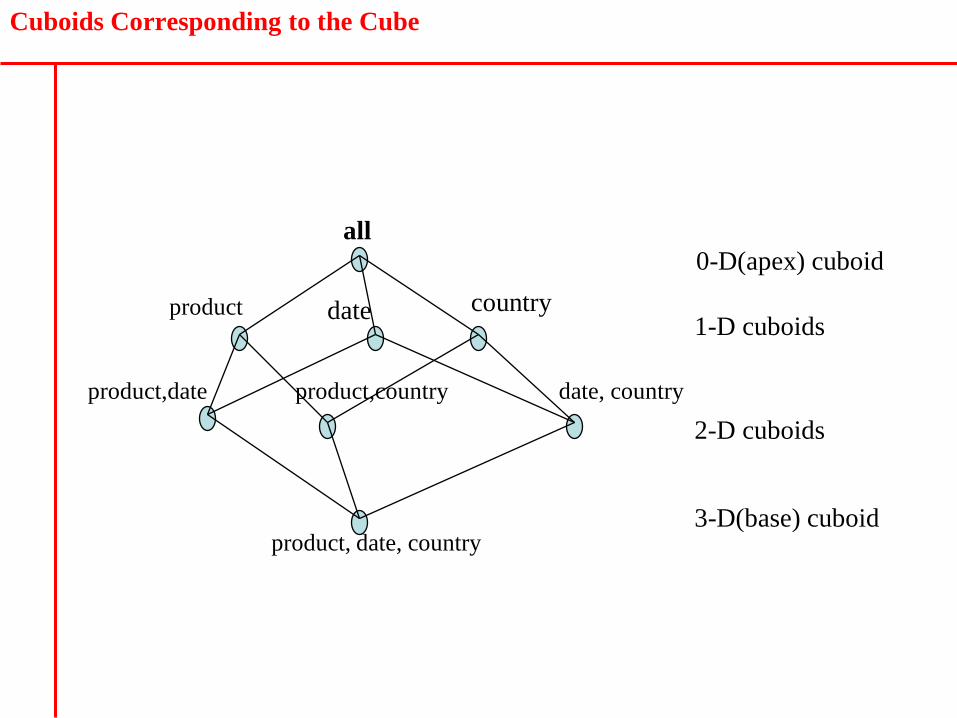
Cuboids Corresponding to the Cube
all
product date country
product,date product,country date, country
product, date, country
0-D(apex) cuboid
1-D cuboids
2-D cuboids
3-D(base) cuboid

Categorization of OLAP tools
MLOP
• Specialized data structures used for organize, navigate, and analyze data in an
aggregated form
• Tight coupling with the application layer and presentation layer.
• Recently MLOP vendors provide APIs for OLAP operations.
• Data structures use array technology and, improved storage techniques to
minimize the disk space requirements through sparse data management.
• Excellent performance when the data is utilized as designed.
• Some products treat time as a special dimension for time series analysis and
other products provide strong analytical capabilities
• Applications requiring iterative and comprehensive time series analysis.
• Several challenges face users considering the implementation of applications
with MLOP products.
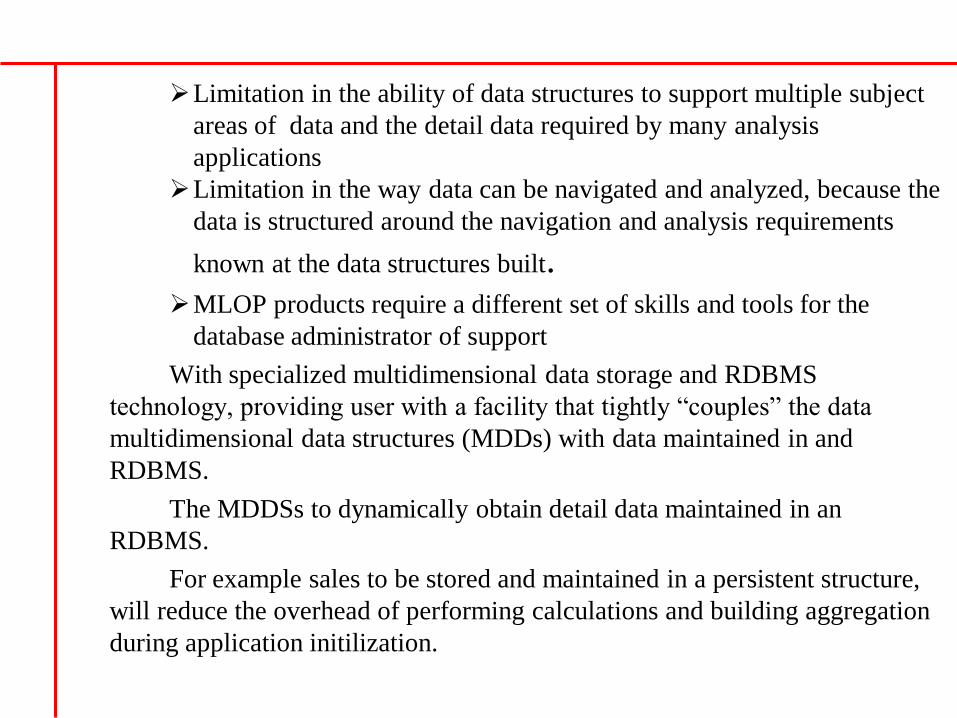
Limitation in the ability of data structures to support multiple subject
areas of data and the detail data required by many analysis
applications
Limitation in the way data can be navigated and analyzed, because the
data is structured around the navigation and analysis requirements
known at the data structures built.MLOP products require a different set of skills and tools for the
database administrator of support
With specialized multidimensional data storage and RDBMS
technology, providing user with a facility that tightly “couples” the data
multidimensional data structures (MDDs) with data maintained in and
RDBMS.
The MDDSs to dynamically obtain detail data maintained in an
RDBMS.
For example sales to be stored and maintained in a persistent structure,
will reduce the overhead of performing calculations and building aggregation
during application initilization.
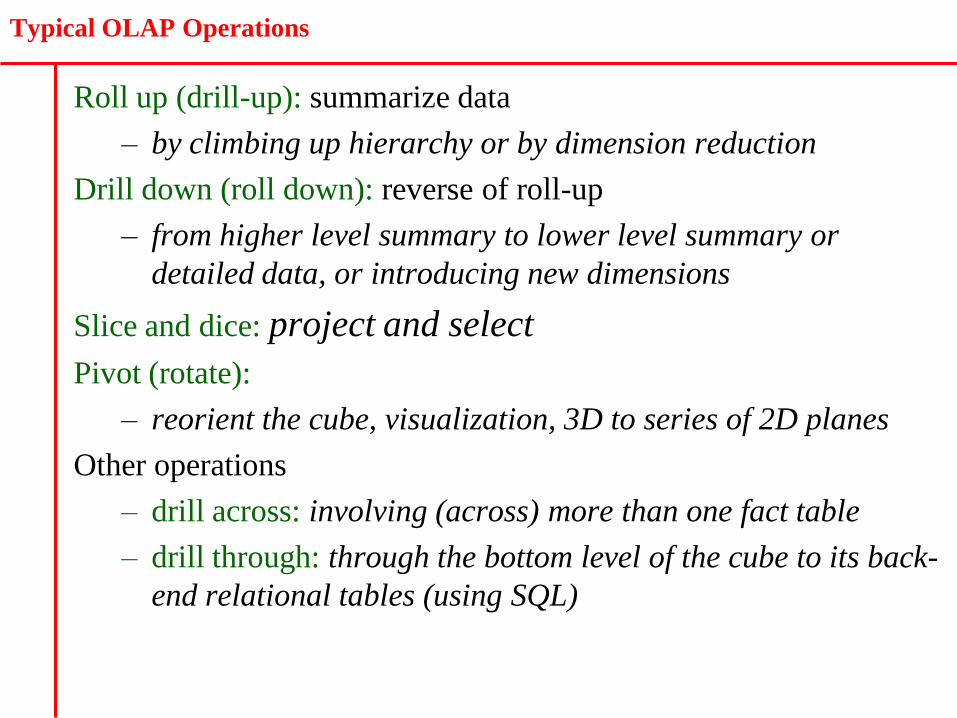
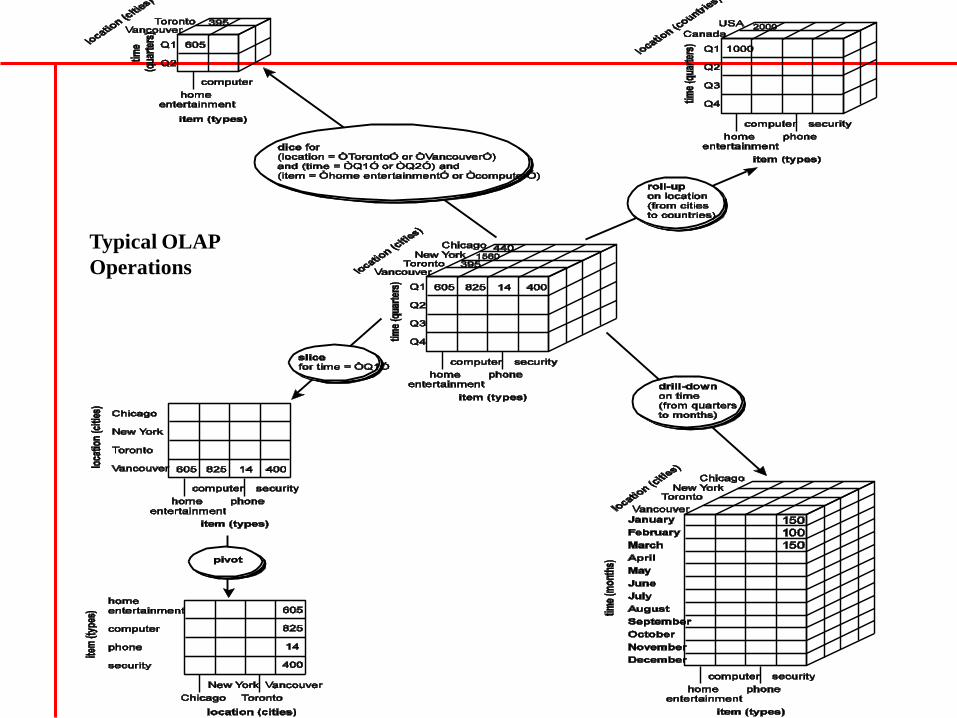
Typical OLAP Operations
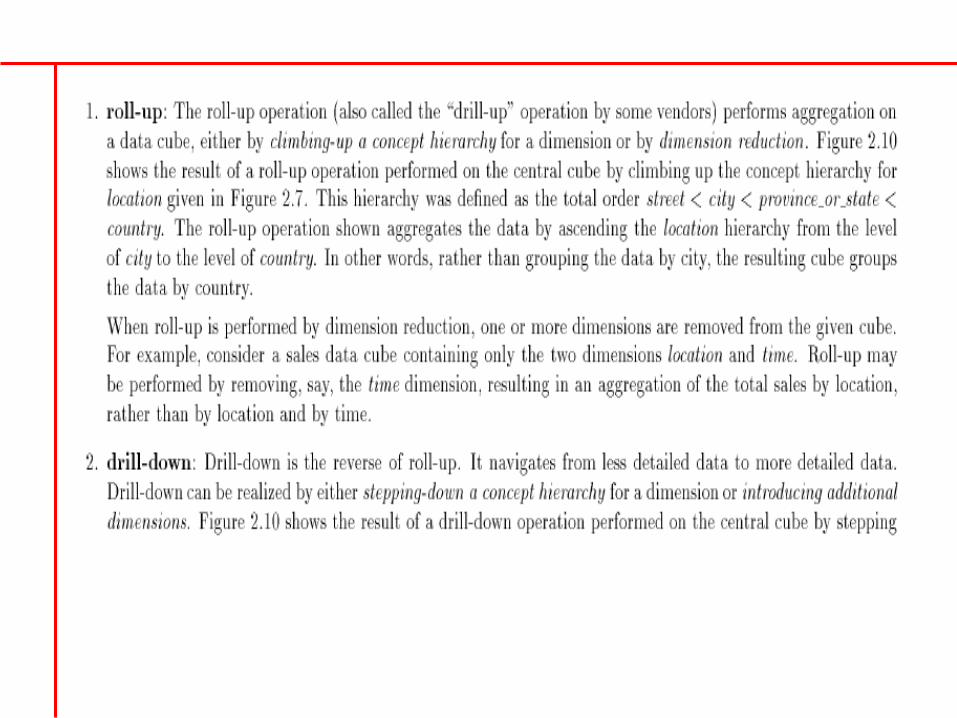
Roll up (drill-up): summarize data
– by climbing up hierarchy or by dimension reduction
Drill down (roll down): reverse of roll-up
– from higher level summary to lower level summary or
detailed data, or introducing new dimensions
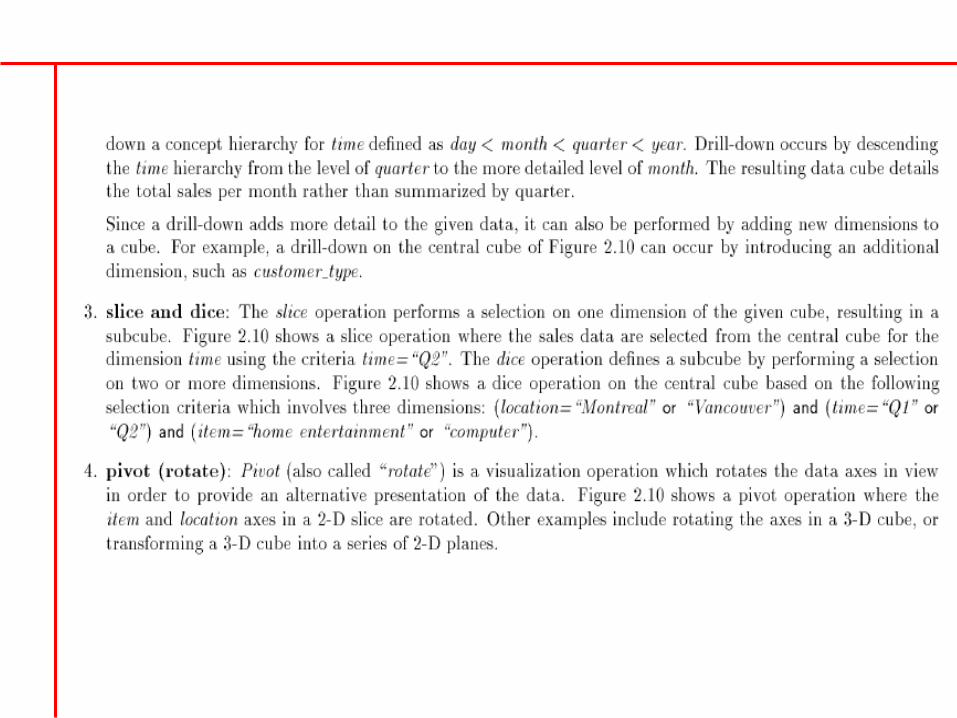
Slice and dice: project and select
Pivot (rotate):
– reorient the cube, visualization, 3D to series of 2D planes
Other operations
– drill across: involving (across) more than one fact table
– drill through: through the bottom level of the cube to its back-
end relational tables (using SQL)
Typical OLAP
Operations
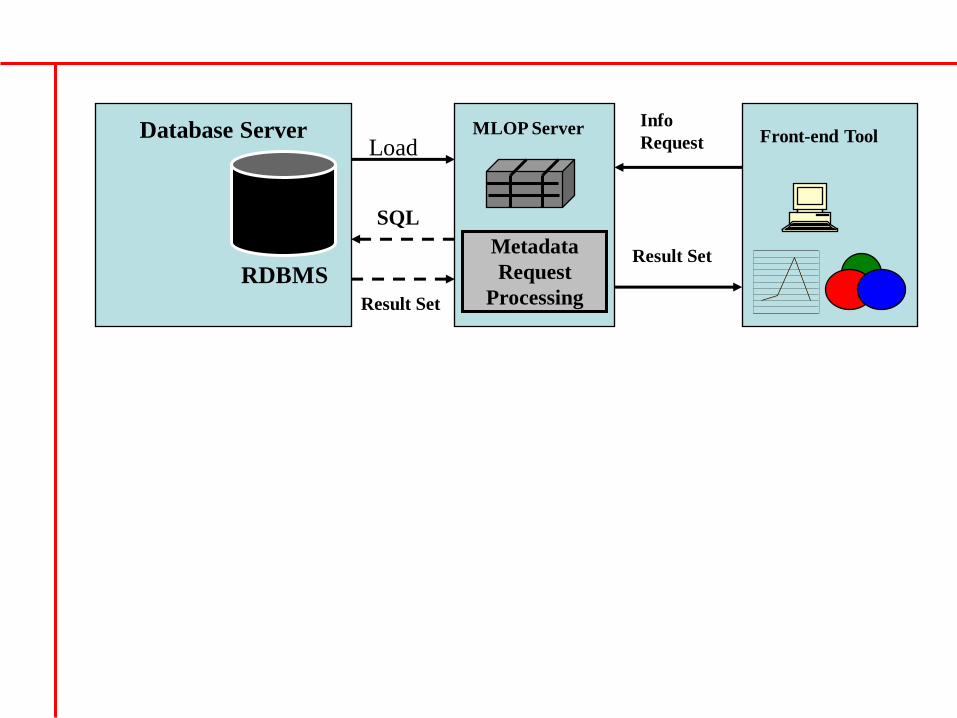
Database Server
RDBMS
SQL
Result Set
Metadata
Request
Processing
MLOP Server
Result Set
Info
Request Front-end ToolLoad

RLOP
• Support RDBMS products directly through a dictionary layer of metadata,
bypassing any requirement for creating a static multidimensional data
structure.
• Multidimensional views of the two-dimensional relational table to be created
without the need to structure the data around the desired view.
• Creation of multiple SQL statements to handle user request
It is undergoing some technological development
Movement toward pure middleware technology that provides facilities to
simplify development of multidimensional applications
Further blurring of the lines that delineate RLOAP and hybrid-OLAP
products.

Database Server
RDBMS
SQL
Result Set
Metadata
Request
Processing
RLOP Server
Result Set
Info
Request Front-end Tool
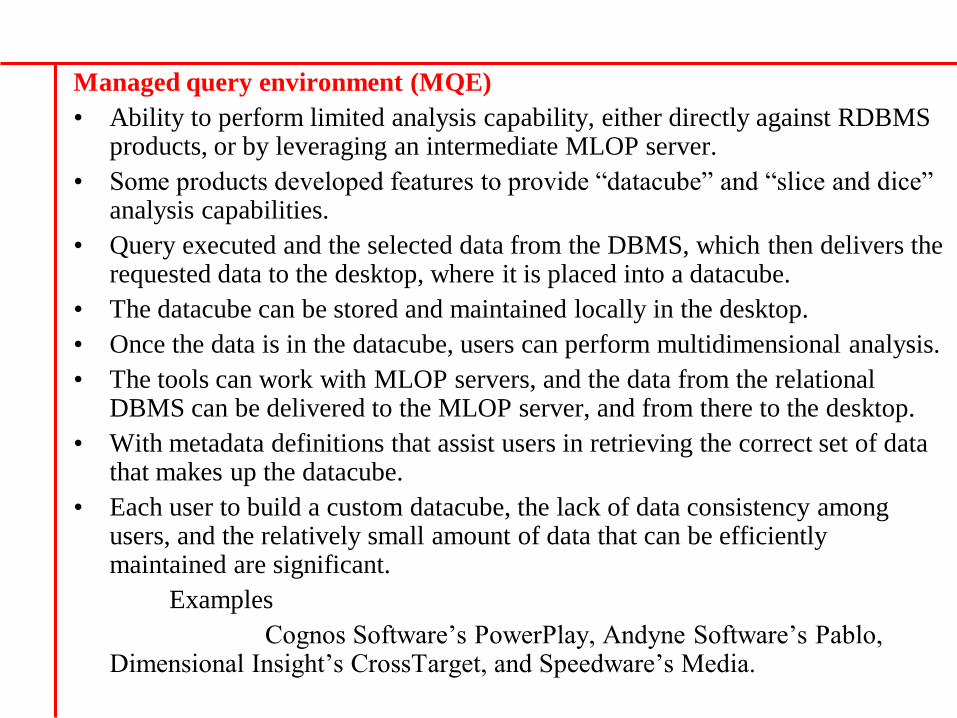
Managed query environment (MQE)
• Ability to perform limited analysis capability, either directly against RDBMS products, or by leveraging an intermediate MLOP server.
• Some products developed features to provide “datacube” and “slice and dice” analysis capabilities.
• Query executed and the selected data from the DBMS, which then delivers the requested data to the desktop, where it is placed into a datacube.
• The datacube can be stored and maintained locally in the desktop.
• Once the data is in the datacube, users can perform multidimensional analysis.
• The tools can work with MLOP servers, and the data from the relational DBMS can be delivered to the MLOP server, and from there to the desktop.
• With metadata definitions that assist users in retrieving the correct set of data that makes up the datacube.
• Each user to build a custom datacube, the lack of data consistency among users, and the relatively small amount of data that can be efficiently maintained are significant.
Examples
Cognos Software’s PowerPlay, Andyne Software’s Pablo, Dimensional Insight’s CrossTarget, and Speedware’s Media.
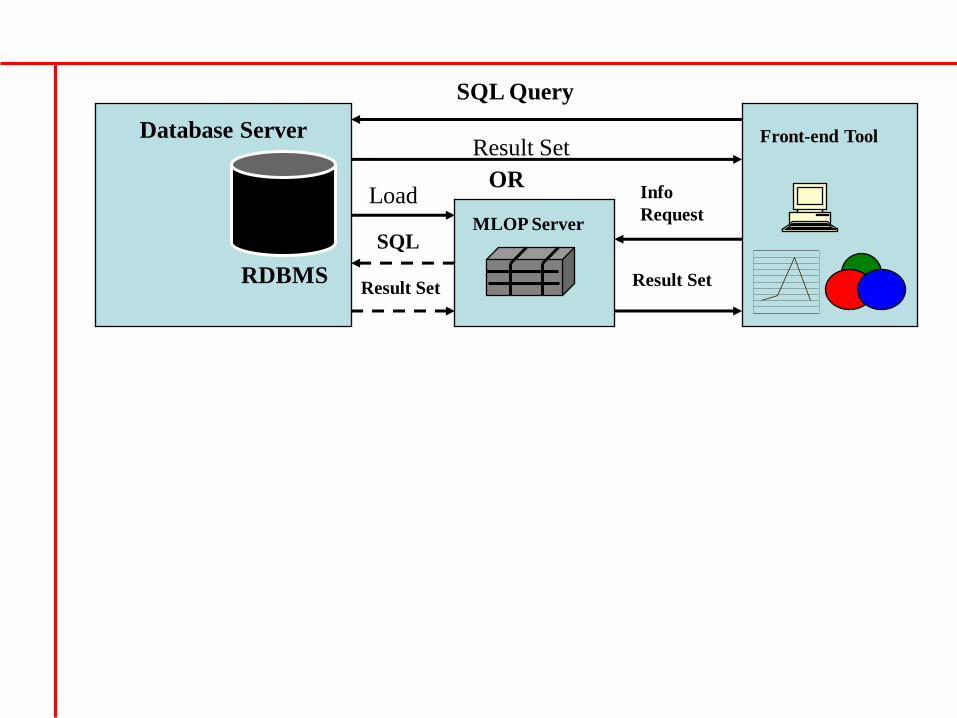
Database Server
RDBMS
SQL
Result Set
MLOP Server
Result Set
Info
Request
Front-end Tool
Load
SQL Query
Result Set
OR
State of the Market• OLAP tools provide way to view the corporate data
• The tools aggregate data along common business subjects or dimensions and
then let the users navigate through the hierarchies and dimensions.
• Some tools preaggregate data in special multidimensional database.
• Some other tools work directly against relational data and aggregate data on the
fly.
• Some tools process OLAP data on the desktop instead of server.
• Leading database vendors incorporate OLAP functionality in their database
kernels.
Cognos PowerPlay
IBI FOCUS Fusion
Pilot Software
OLAP Tools and the Internet
The Internet/WWW and data warehouse are tightly bound together
• The Internet si a virtually free resource which provides a universal connectivity within and between companies
• The Web eases complex administrative tasks of managing distributed environments
• The Web allows companies to store and manage both data and applications on server that can be centrally managed, maintained and updated
First-generation Web sites – The client can access the decision support report through static HTML pages via web browsers.
Second-generation Web sites – Interactive and CGI (HTML gateway)
Third-generation Web sites – Java Applets, and Web based application servers
Vendors approaches for deploying tools on the Web include
HTML publishing
Helper applications
Plug-ins
Server-centric components
Java and ActiveX applications
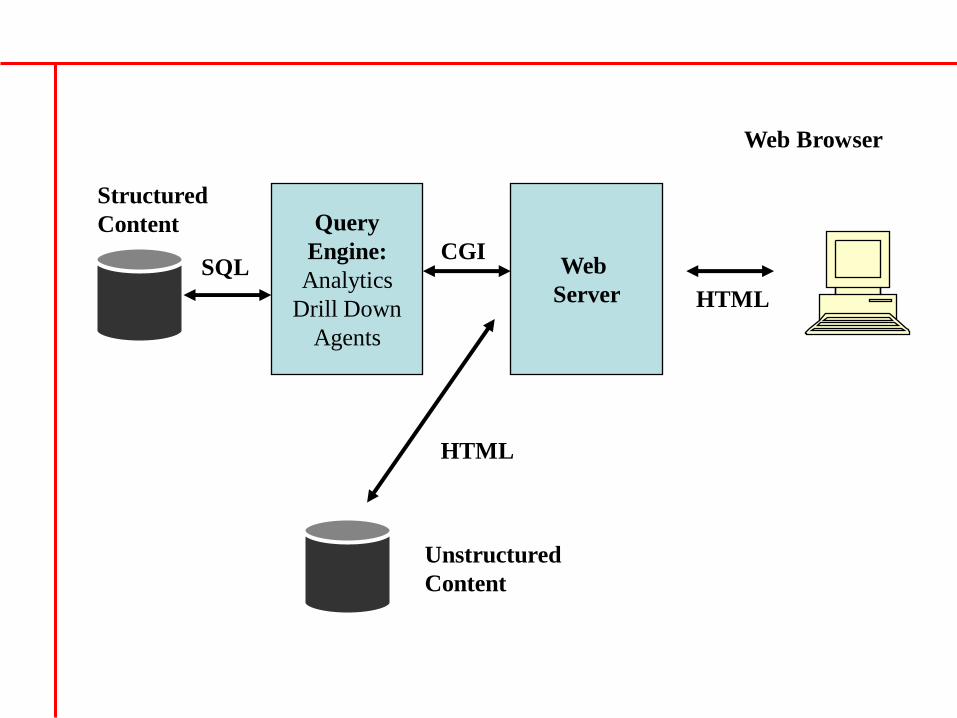
Query
Engine:
Analytics
Drill Down
Agents
Web
Server HTML
Web Browser
CGI
Structured
Content
SQL
HTML
Unstructured
Content
Tools from Internet/Web implementations
Arbor Essbase Web
It includes OLAP manipulations
Drill up, down, and across
pivot, slice and dice
Fixed and dynamic reporting also data entry
It doesn't have client package.
Information Advantage WebOLAP
Server-centric
Powerful analytical engine that generates SQL to pull data from
relational database
Provide client based package
Data store and the analytical engine are separate
MicroStrategy DSS Web
DSS server
relational OLAP server
DSS Architect data modeling tool
Dss Executive design tool for building executive information system
Brio technology
Support OLAP applications on the Web
Its own server brio.query.server