business accountability for better nutrition
TRANSCRIPT
January 2021
BUSINESS ACCOUNTABILITY FOR BETTER NUTRITION


BUSINESS ACCOUNTABILITY FOR BETTER NUTRITION

2
Business Accountability for Better Nutrition
Table of ContentsAbbreviations 4
Executive Summary 5
Background 7
Methodology 8
Box 1: Definitions 8
Interviews 9
Desk research 10
Current Accountability Landscape 12
Main challenges and opportunities 12
2021, a year of opportunity for business accountability in nutrition 12
The reporting burden 12
Food affordability, a contentious area for impact assessment 13
Comprehensive business accountability, some gaps remaining 14
Added value of accountability mechanisms for business impact on nutrition 14
Complementarity of the accountability landscape 15
Accessibility of information and methodology 16
Aligning business reporting 17
Product (Re)formulation 17
The Health Star Rating system (HSR) 17
Design process and geographical scope 17
Current use of HSR by companies and reporting burden 17
Marketing to Children 19
The Children’s Food and Beverage Advertising Initiative’s Core Principles 19
The EU Pledge 19
Industry support 19
Credibility of reporting on marketing to children 20
Food Labelling 21
Codex Alimentarius Standards on Food Labelling 21
Consensus and opportunities 21
3
Business Accountability for Better Nutrition
Workforce nutrition 22
Workforce Nutrition Alliance Scorecard 22
Momentum 22
Scope 23
Visibility 23
Food Safety 24
Global Food Safety Initiative (GFSI) 24
Food Loss and Waste 25
Food Loss and Waste Accounting and Reporting Standard (FLW Standard) 25
Champions 12.3 25
A trending topic 25
Conclusion and next steps 27
Next Steps 27
Make business reporting on nutrition a priority 27
Aligning reporting beyond nutrition 28
Assessing the entire food value chain 28
Organise multi-stakeholder consultations for missing impact areas 28
Increase collaboration among accountability mechanisms 28
Annexes 29
Annex 1 – Key survey results from GAIN August 2020 report on Aligning Business Reporting in Nutrition 29
Annex 2 – Feedback from companies’ interviews conducted by GAIN/Carnstone Ltd in 2018 34

4
Business Accountability for Better Nutrition
AbbreviationsATSI Access to Seeds Index
ATNI Access to Nutrition Index
Access to Nutrition Initiative
BBFAW Business Benchmark on Farm Animal Welfare
BIA Obesity tool Business Impact Assessment on Obesity and Population-level Nutrition tool
BMS Breast-milk Substitutes
CFBAI Children’s Food and Beverage Advertising Initiative
CGF Consumer Goods Forum
COH4B Culture of Health for Business framework
DJSI Dow Jones Sustainability Index
ESG Environmental, Social and Governance
FAO The Food and Agriculture Organization of the United Nations
FAIRR Farm Animal Investment Risk and Return
FFI Fair Finance International
FLW Food Loss and Waste
FLW Standard Food Loss and Waste Accounting and Reporting Standard
FOP Front of Pack
GAIN Global Alliance for Improved Nutrition
GFSI Global Food safety Initiative
GNR Global Nutrition Report
GRI Global Reporting Initiative
HSR Health Star Rating System
IFBA International Food and Beverage Alliance
INFORMAS International Network for Food and Obesity / Non-communicable Diseases Research, Monitoring and Action Support
IIRC International Integrated Reporting Council
MSCI Morgan Stanley Capital International
NCD Non-Communicable Disease
NGO Non-Governmental Organization
SASB Sustainability Accounting Standards Board
SBN Scaling Up Nutrition Business Network
SDG United Nations Sustainable Development Goals
SUN Scaling Up Nutrition
SSI Seafood Stewardship Index
WBA World Benchmarking Alliance
WHO World Health Organization

5
Business Accountability for Better Nutrition
Executive Summary
1 Nutrition for Growth website, https://nutritionforgrowth.org/ Retrieved 14 December 2020
2 UN Food Systems Summit 2021 website https://www.un.org/en/food-systems-summit Retrieved 14 December 2020
3 The Consumers Goods Forum is a CEO-led organisation that brings consumer goods retailers and manufacturers together glob-ally. Consumer Goods Forum website, https://www.theconsumergoodsforum.com/ Retrieved 18 January 2021.
4 SBN aims to increase the availability and affordability of safe, nutritious foods to consumers, especially low-income consum-ers through activities at global and national levels. The SBN is the private sector branch of the Scaling Up Nutrition Movement, a multi-stakeholder movement to address malnutrition worldwide. It is co-hosted by the Global Alliance for Improved Nutrition and the UN World Food Programme. SUN Business Network website, https://sunbusinessnetwork.org/ Retrieved 18 January 2021.
With the Nutrition for Growth1 and United Nations Food Systems2 Summits scheduled in 2021, ambitious new multi-stakeholder commitments and actions are expected for better access to safe nutritious food. In 2019 the world was already off-track to achieve SDG2 - Zero Hunger - and the impact of the Covid-19 pandemic is expected to exacerbate this gap requiring stronger financing and actions for nutrition. However, new commitments are difficult to identify without a better understanding of the current impact the actions of all stakeholder groups are having on nutrition. Acknowledging the critical role of private sector in nutrition - as the almost entire supplier of food worldwide – the Global Alliance for Improved Nutrition (GAIN) has reviewed the current landscape of business accountability in nutrition and launched a consultative process to identify practical solutions to improve this landscape - focusing on better alignment of business reporting in nutrition.
This report summarises the discussions and solutions identified around this topic between 2018 and 2020, including outcomes of the workshops co-organised with the Consumer Goods Forum (CGF)3 and with the Scaling Up Nutrition Business Network (SBN)4. The report highlights the complementarity and synergies of the current business accountability landscape in nutrition. The main recommendations of the report are to align business reporting around a limited set of existing reporting tools to increase efficiency and transparency around business impact in nutrition as described below:
� Product (re)formulation: the Health Star Rating System - to be complemented by qualitative information or regional recognised methodologies such as Nutri-Score.
� Marketing to children: the Core Principles of the Children’s Food and Beverage Advertising Initiatives and the EU Pledge – while ensuring marketing reporting is not limited to the business activities in the EU and the US.
� Food labelling: relevant Codex Alimentarius Standards on Labelling.
� Employee health and wellbeing/Workforce Nutrition: the Workforce Nutrition Alliance Scorecard.
� Food safety: the Global Food Safety Initiative benchmarking requirements.
� Food loss and waste: the Food Loss and Waste Accounting and Reporting Standard – to be complemented by specific, measurable, achievable, realistic, time specific global targets building on SDG 12.3 (halve food loss and waste between 2015 and 2030).
Additionally, the report points out suggestions for future improvements to address some of the remaining gaps regarding business accountability in nutrition:
� Companies’ top management should make reporting on their nutrition impact a priority, looking at disclosing more information they collect for their internal reporting and using external reporting tools to increase the credibility of their reporting.
� Acknowledging the increasing expectations towards sustainable food systems, more collaboration between reporting on both nutrition and environmental impact of companies should be considered by accountability mechanisms.
� Efficient accountability of businesses in nutrition requires to assess the impact of the entire food value chain, retailers, small and medium enterprises, and business-to-business companies need to be further incentivised to report on their nutrition impact.
6
Business Accountability for Better Nutrition
� GAIN looked at a limited set of key areas relevant for overall business impact in nutrition and identified food affordability as an area where more research and consultations are needed to develop a global pragmatic indicator.
� Alignment of business reporting in nutrition can be supported by individual companies, but most of the businesses/business associations expect accountability mechanisms to drive alignment of business reporting in nutrition.
The Global Alliance for Improved Nutrition (GAIN) GAIN was launched in 2002, it mobilizes public-private partnerships and provides financial and technical support to deliver nutritious foods to people at risk of malnutrition. Working with partners, GAIN aims to support and advise governments, businesses, and development partners as they build and mobilize food and nutrition plans to advance nutrition outcomes. GAIN programmes enable better diets via large-scale food fortification, multi-nutrient supplements, nutritious foods for mothers and children, and enhancement of the nutritional content of agriculture products. GAIN is delivering improved nutrition to an estimated 800 million people in more than 40 countries. Looking ahead, GAIN aims to improve the consumption of safe and nutritious foods for at least 1 billion people by 2022 and targets major improvements to food systems, resulting in more diverse and healthier diets for vulnerable people in countries where GAIN works.

7
Business Accountability for Better Nutrition
Background
5 A Review of Business Accountability Mechanisms in Nutrition, Global Alliance for Improved Nutrition, March 2019. https://www.gainhealth.org/sites/default/files/publications/documents/review-of-business-accountability-mechanisms-in-nutri-tion-report-2019.pdf Retrieved 15 November 2020.
In March 2019, the Global Alliance for Improved Nutrition (GAIN) published a review of the current landscape of business accountability in nutrition.5 The report supported by Carnstone Partners Ltd is based on desk research and interviews with representatives of different mechanisms and with companies that commonly engage with these mechanisms. The report identified the following key findings:
� The space of business accountability in nutrition appears crowded and continues to attract new entrants.
� There is some overlap in the nutrition related data collected by different accountability mechanisms.
� The most scrutinized segments of the value chain are the manufacturers and processors.
� Current accountability mechanisms do not sufficiently address the impact of their findings on actual food consumption.
� Company feedback is to concentrate on assessing the outcomes of their action vs their adherence to processes.
� More analysis is needed on the credibility and value of independent mechanisms vs the ones funded by the private sector.
During and following this initial review, GAIN co-hosted with the Consumer Goods Forum (CGF) two meetings (November 2018 and February 2020) to discuss the challenges and opportunities of the current accountability landscape of business in nutrition and to identify practical solutions to increase its efficiency and potential impact. The workshops and interviews conducted throughout this project involved accountability mechanisms as well as private sector representatives. Overall, the respondents recognized the importance of holding business accountable for their impact on nutrition through an efficient and aligned accountability landscape.
This report summarizes the discussions and findings on increasing the efficiency of business accountability in nutrition by using a limited set of existing reporting tools on key nutrition related categories:
� Product (re)formulation
� Marketing to children
� Food labelling
� Workforce nutrition
� Food safety
� Food loss and waste
The objective being to better understand business impact by relying on external frameworks which combine some global credibility and interest from the private sector to be used for their reporting.
This report also reviews the complementary of current accountability mechanisms for business in nutrition.
8
Business Accountability for Better Nutrition
Methodology
6 A Review of Business Accountability Mechanisms in Nutrition, Global Alliance for Improved Nutrition, March 2019. https://www.gainhealth.org/sites/default/files/publications/documents/review-of-business-accountability-mechanisms-in-nutri-tion-report-2019.pdf Retrieved 15 November 2020.
7 Aligning Business Reporting in Nutrition, 2020 Survey Results, Global Alliance for Improved Nutrition, August 2020 https://www.gainhealth.org/sites/default/files/publications/documents/aligning-business-reporting-in-nutrition-2020-survey-re-sults.pdf Retrieved 17 December 2020
8 WHO website, https://www.who.int/health-laws/topics/governance-accountability/en/. Retrieved 6 August 2020
9 Summary and recommendations of the high-level panel of experts (HLPE) report on food losses and waste in the context of sustainable food systems, Committee on World Food Security, October 2014, http://www.fao.org/3/a-ml099e.pdf Retrieved 1 December 2020.
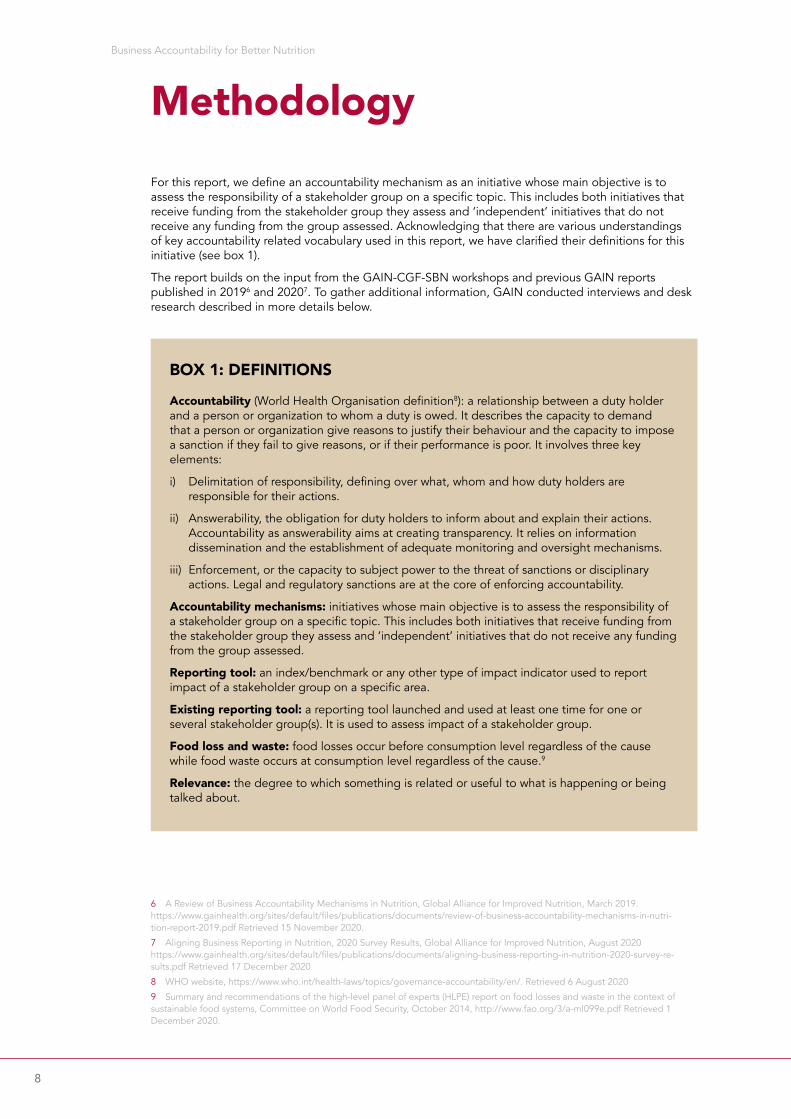
For this report, we define an accountability mechanism as an initiative whose main objective is to assess the responsibility of a stakeholder group on a specific topic. This includes both initiatives that receive funding from the stakeholder group they assess and ‘independent’ initiatives that do not receive any funding from the group assessed. Acknowledging that there are various understandings of key accountability related vocabulary used in this report, we have clarified their definitions for this initiative (see box 1).
The report builds on the input from the GAIN-CGF-SBN workshops and previous GAIN reports published in 20196 and 20207. To gather additional information, GAIN conducted interviews and desk research described in more details below.
BOX 1: DEFINITIONS
Accountability (World Health Organisation definition8): a relationship between a duty holder and a person or organization to whom a duty is owed. It describes the capacity to demand that a person or organization give reasons to justify their behaviour and the capacity to impose a sanction if they fail to give reasons, or if their performance is poor. It involves three key elements:
i) Delimitation of responsibility, defining over what, whom and how duty holders are responsible for their actions.
ii) Answerability, the obligation for duty holders to inform about and explain their actions. Accountability as answerability aims at creating transparency. It relies on information dissemination and the establishment of adequate monitoring and oversight mechanisms.
iii) Enforcement, or the capacity to subject power to the threat of sanctions or disciplinary actions. Legal and regulatory sanctions are at the core of enforcing accountability.
Accountability mechanisms: initiatives whose main objective is to assess the responsibility of a stakeholder group on a specific topic. This includes both initiatives that receive funding from the stakeholder group they assess and ‘independent’ initiatives that do not receive any funding from the group assessed.
Reporting tool: an index/benchmark or any other type of impact indicator used to report impact of a stakeholder group on a specific area.
Existing reporting tool: a reporting tool launched and used at least one time for one or several stakeholder group(s). It is used to assess impact of a stakeholder group.
Food loss and waste: food losses occur before consumption level regardless of the cause while food waste occurs at consumption level regardless of the cause.9
Relevance: the degree to which something is related or useful to what is happening or being talked about.

9
Business Accountability for Better Nutrition
INTERVIEWS
GAIN invited feedback from companies by reaching out to business associations rather than to individual companies, companies’ participation at the November 2018 and February 2020 workshops was managed by the co-organiser CGF. Members of the International Food and Beverage Alliance, Food Industry Asia, SUN Business Network, United States Council on Sustainable Development and World Business Council on Sustainable Development were invited to share their feedback either in a consolidated or individual manner.
The following stakeholders provided their feedback on the GAIN report ‘Aligning Business Reporting in Nutrition, 2020 Survey Results” between September and November 2020:
� Danone
� DSM
� Food Foundation
� Food Industry Asia
� Global Reporting Initiative/ The Robert Wood Johnson Foundation
� Golden Agri-Resources
� Indofood
� International Food and Beverage Alliance
� Kuwait Dairy Company
� Kellogg
� Nestle
� S&P Global
� Sainsbury’s
� Savencia
� Unilever
� United Nations Food and Agricultural Organisation
� United Nations Sustainable Development Solutions Network
� World Benchmarking Alliance
� World Business Council on Sustainable Development

10
Business Accountability for Better Nutrition
DESK RESEARCH
Desk research was conducted to review the reporting tools scored the highest by the respondents of the GAIN 2020 survey and additional reporting tools that emerged from the interviews for this report.
Desk research also looked at the added value of 12 accountability mechanisms focused on business potential impact on nutrition:
� Access to Nutrition Index10 from the Access to Nutrition Initiative (ATNI)
� Access to Seed Index11 from the World Benchmarking Alliance (WBA)
� Business Impact Assessment on Obesity and Population-level Nutrition tool (BIA Obesity tool)12
� Business Benchmark on Farm Animal Welfare (BBFAW)13 from the International Network for Food and Obesity / Non-Communicable Diseases (NCDs) Research, Monitoring and Action Support (INFORMAS)
� Dow Jones Sustainability Index (DJSI)14 from S&P Global
� The Coller Protein Producer Index from the Farm Animal Investment Risk and Return (FAIRR)15
� Standards from the Global Reporting Initiative16
� SDG Alignment Tool from Morgan Stanley Capital International (MSCI)17
� Global Nutrition Report18
� SDG Assessment from Vigeo Eiris19
� Food and Agriculture Benchmark from WBA20
� Seafood Stewardship Index from WBA21
The mechanisms were compared based on the following criteria:
� Status (NGO, academia, private sector, etc).
� Funding
� Partners
� Objectives
� Activities
� Targeted Sustainable Development Goal(s)
� Targeted business sector
10 Access to Nutrition Initiative website, The indexes https://accesstonutrition.org/the-indexes/ Retrieved 16 December 2020.
11 Access to Seeds Index website, https://www.accesstoseeds.org/ Retrieved 16 December 2020.
12 INFORMAS website, BIA-Obesity https://www.informas.org/bia-obesity/ Retrieved 16 December 2020.
13 BBFAW website, https://www.bbfaw.com/ Retrieved 16 December 2020
14 S&P Global website, DJSI Index Family, https://www.spglobal.com/esg/csa/indices/djsi-index-family Retrieved 16 December 2020
15 FAIRR website, Coller FAIRR Protein Producer Index https://www.fairr.org/index/ Retrieved 16 December 2020
16 GRI website, GRI Standards https://www.globalreporting.org/how-to-use-the-gri-standards/gri-standards-english-language/ Retrieved 16 December 2020
17 MSCI website, Impact solutions https://www.msci.com/our-solutions/esg-investing/impact-solutions Retrieved 16 December 2020
18 GNR website https://globalnutritionreport.org/ Retrieved 16 December 2020
19 Vigeo Eiris, Solutions for investors https://vigeo-eiris.com/solutions-for-investors/sdg_assessment/ Retrieved 16 December 2020
20 WBA website, Food and Agriculture Benchmark https://www.worldbenchmarkingalliance.org/food-and-agriculture-benchmark/ Retrieved 16 December 2020
21 WBA website, Seafood Stewardship index https://www.worldbenchmarkingalliance.org/seafood-stewardship-index/ Retrieved 16 December 2020
11
Business Accountability for Better Nutrition
� Targeted business size
� Number of business assessed
� Geographical scope
� Value chain position of business assessed
� Food groups covered by business assessed
� Assessment Focus Area/s (Topics)
� Dimensions assessed
� Date of creation
� Data Source
� Data Type
� Outputs
� Reports developed
� Reporting frequency
� Data visualization option
� Policy Focus
� Gender Focus
� Target audience

12
Business Accountability for Better Nutrition
Current Accountability Landscape
22 Nutrition for Growth website, https://nutritionforgrowth.org/ Retrieved 14 December 2020
23 UN Food Systems Summit 2021 website https://www.un.org/en/food-systems-summit Retrieved 14 December 2020
24 United Nations website, UN Decade of Action on Nutrition, https://www.un.org/nutrition/ Retrieved 15 December 2020
25 Nourishing the SDGs, Global Nutrition Report, 2017 https://globalnutritionreport.org/reports/2017-global-nutrition-report/ Retrieved 8 December 2020.
26 A Review of Business Accountability Mechanisms in Nutrition, Global Alliance for Improved Nutrition, March 2019. https://www.gainhealth.org/sites/default/files/publications/documents/review-of-business-accountability-mechanisms-in-nutri-tion-report-2019.pdf Retrieved 15 November 2020.
27 A Review of Business Accountability Mechanisms in Nutrition, Global Alliance for Improved Nutrition, March 2019, p.19 https://www.gainhealth.org/sites/default/files/publications/documents/review-of-business-accountability-mechanisms-in-nutri-tion-report-2019.pdf Retrieved 15 November 2020.
28 IIRC and SASB announce intent to merge in major step towards simplifying the corporate reporting system, press release, 25 November 2020 https://www.sasb.org/wp-content/uploads/2020/11/IIRC-SASB-Press-Release-Web-Final.pdf 22 December 2020.
29 S&P Global website, S&P Global to Acquire the ESG Ratings Business from RobecoSAM, 21 November 2019 http://press.spglobal.com/2019-11-21-S-P-Global-to-Acquire-the-ESG-Ratings-Business-from-RobecoSAM 22 December 2020.
MAIN CHALLENGES AND OPPORTUNITIES
2021, a year of opportunity for business accountability in nutritionWith the Nutrition for Growth Summit (N4G)22 and the United Nations (UN) Food Systems Summit23 scheduled in 2021, there is a strong focus on businesses’ roles and responsibilities regarding nutrition. The two Summits are milestones to foster multi-stakeholder commitments towards better nutrition and better food systems and to support the achievement of the 2016-2025 UN Decade of Action24 and the 2030 Sustainable Development Goals Agenda. At a time where new pledges and more engagement from the private sector are expected, it is critical to review how business accountability in nutrition is currently operating. Additionally, there is an opportunity to design pledges around existing and recognised frameworks that can support the credibility of business pledges and the alignment of business accountability.
The reporting burdenThroughout the consultations led by GAIN, the issue of ‘reporting burden’ was regularly raised by companies. In 2017, the Global Nutrition Report shared non-response rates of 66% for N4G business workforce commitments and 70% for other business commitments.25 These were the highest non-response rates for all the N4G commitments that year. The 2019 GAIN Accountability report26 also assessed that low reporting rates of businesses were the result of a multiplicity of accountability mechanisms and a difficulty in understanding their values: “Companies feel the need to prioritise their engagements and commonly report difficulty in deciding which initiatives to join and/or respond to. Some feel they base their decisions on proximity or personal contacts, being fully aware that these are not the best criteria. Others report disengagement among their peers, reflected in the falling response rates.” To address this issue, this report includes a section on the added value of key accountability mechanisms of business in nutrition. Additionally, by using a limited set of existing reporting tools to assess business impact in nutrition, the reporting burden would diminish as the same tools could be consistently used by a multiplicity of accountability mechanisms. Finally, while the 2019 GAIN Accountability report assessed that the business accountability landscape in nutrition is crowded with new mechanisms being launched between 2008 and 2019 at an average rate of more than one per year27 the overall Environmental, Social and Governance (ESG) accountability landscape is also seeing significant mergers such as the International Integrated Reporting Council (IIRC) and the Sustainability Accounting Standards Board (SASB) merging to create the Value Reporting Foundation28 or S&P Global acquiring the ESG Ratings Business from RobecoSAM29 (which includes DJSI).

13
Business Accountability for Better Nutrition
The interviews conducted by GAIN between September and November 2020 tempered to a certain extent this issue of the reporting burden, as several large companies mentioned the use of existing reporting tools and frameworks for their internal reporting. The decisions to keep this data internal seem to result mostly from an absence of internal discussions on the value of sharing this data publicly (e.g. no consultation of the top management on the disclosure of the results, no perceived interest from public stakeholders/investors for this data) or the perceived risks in sharing data as such. This is often the case for tools related to product reformulation or for tools perceived a very ‘stringent’ by businesses e.g. the WHO regional nutrient profile models on marketing to children.
Food affordability, a contentious area for impact assessmentBy suggesting business reporting on food affordability through a sale weighted price index for nutritious food in its 2020 survey, GAIN/SBN sought to assess interest and challenges around food affordability reporting. However, alignment at this stage behind a single methodology for reporting on food affordability is not possible as there are no regional or global reporting indicators being used by businesses to track their impact on food affordability.
While almost all survey respondents and interviewees recognised the link between nutritious food affordability and the overall consumption of nutritious food, they raised many challenges in designing and implementing a global reporting tool on this issue and in using a sale weighted price index to report business impact on food affordability. The challenges noted were:
� Prices are sensitive information for companies and sale prices to consumers are often not known by the manufacturers of these products and even less so by ingredient providers as indicated by BASF. Additionally, the prices set by retailers are influenced by local/national loyalty programmes, discounts, etc.
� Prices are impacted by volumes which are led by consumer demand.
� Inflation is also to be taken into consideration.
� As indicated by UNSDSN, such indicator would not reflect the issue of accessing a diverse diet.
� The Food Foundation suggests that an indicator on food affordability should make sure that nutrition is promoted in a way that also takes into account environmental impacts. A range of indicators can be used to measure food affordability alongside those that measure environmental impact.
It was suggested to consider food affordability only for some food categories rather than for the overall food portfolio of companies and to weight price indexes not only against the products nutritional content but also against average local salaries and/or assess food affordability by looking at the penetration rates across socioeconomic segments for certain food categories.
While business associations have supported business reporting around key categories through collective pledges and engagement with their members, they are unlikely to be able to do that around food affordability. Food Industry Asia highlighted that pricing competition laws prevent them to discuss price related matters.
The way companies can address food insecurity by improving the affordability of healthy foods can vary depending on the business model. Indicators to measure corporate action to improve food affordability have to accommodate such differences. WBA is aiming to look beyond philanthropic donations and to assess strategic commercial activities designed to improve accessibility and affordability, such as pricing strategies for vulnerable groups.
Kellogg considers that there is an opportunity to create a standardized reporting tool on food affordability. Danone suggests that to address the complex issue of business impact on food affordability, cross-companies discussions could be organized with a focus on pre-competitive work and Nestle suggests that the development of an indicator on this issue should consult the private sector during its development. With retailers being a major influencer of food affordability, a consultative approach is likely to work more efficiently if it involves businesses across the overall value chain. This will also result in a better understanding of the complementary roles of all business types on food affordability. With some retailers stating that transparency is increasingly important to them, there is an opportunity to structure a comprehensive private sector consultation on this issue.
14
Business Accountability for Better Nutrition
Nestle already reports internally on its impact regarding food affordability in terms of a turnover target in a specific timeframe for fortified products. Unilever suggested to look at affordability and accessibility together, as in some regions the last mile to provide the products will be a more important factor than the price.
While there is an overall consensus around the complexity of creating and implementing a global reporting tool on food affordability, some interviewees such as IFBA questioned the benefit of such a tool. With financial performance remaining the main driver of investors’ decisions and markets dynamics remaining the main influencing factor for pricing, the value of such a complex reporting tool might be limited. It could be more impactful to link financial performance and company efforts on health and nutrition, as already measured by ATNI, to drive responsible investment than to create a new complex reporting tool unlikely to further shift investors’ decisions according to IFBA.
Comprehensive business accountability, some gaps remainingThe GAIN March 2019 report on business accountability mechanisms in nutrition30 stated that the current accountability landscape was not uniformly looking at the entire food value chain. Retailers for example were less engaged in the 13 ‘core’ mechanisms reviewed.31 This issue might result from the lack of global initiatives for retailers’ engagement with a predominance of national and local ones. Therefore reporting through global frameworks would become relevant if done by other national competitors and/or required by external stakeholders. Consequently, the integration of the full value chain in global accountability mechanisms is likely to require advocacy towards national public and private stakeholders that currently make their decisions through national indicators only.
ADDED VALUE OF ACCOUNTABILITY MECHANISMS FOR BUSINESS IMPACT ON NUTRITION
To map the complementarity of the current landscape of business accountability in nutrition, GAIN reviewed the objectives and structures of the following multi-country accountability mechanisms which focus on business impact on nutrition or include indicators on nutrition impact:
� Access to Nutrition Index32 from the Access to Nutrition Initiative (ATNI)
� Access to Seed Index33 from the World Benchmarking Alliance (WBA)
� Business Impact Assessment on Obesity and Population-level Nutrition tool (BIA Obesity tool)34 from the International Network for Food and Obesity / Non-Communicable Diseases Research, Monitoring and Action Support (INFORMAS)
� Business Benchmark on Farm Animal Welfare (BBFAW)35 supported by Compassion in World Farming and World Animal Protection
� Dow Jones Sustainability Index (DJSI)36 from S&P Global
30 A Review of Business Accountability Mechanisms in Nutrition, Global Alliance for Improved Nutrition, March 2019. https://www.gainhealth.org/sites/default/files/publications/documents/review-of-business-accountability-mechanisms-in-nutri-tion-report-2019.pdf Retrieved 15 November 2020.
31 Access to Nutrition Index, Access to Seeds Index, The Consumer Goods Forum, RobecoSam, Food Climate Research Network, International Food and Beverage Alliance, INFORMAS, New Alliance for Food Security and Nutrition, SUN Business Network, Glob-al Nutrition Report, World Benchmarking Alliance, FReSH.
32 Access to Nutrition Initiative website, The indexes https://accesstonutrition.org/the-indexes/ Retrieved 16 December 2020.
33 Access to Seeds Index website, https://www.accesstoseeds.org/ Retrieved 16 December 2020.
34 INFORMAS website, BIA-Obesity https://www.informas.org/bia-obesity/ Retrieved 16 December 2020.
35 BBFAW website, https://www.bbfaw.com/ Retrieved 16 December 2020
36 S&P Global website, DJSI Index Family, https://www.spglobal.com/esg/csa/indices/djsi-index-family Retrieved 16 December 2020

15
Business Accountability for Better Nutrition
� The Coller Protein Producer Index from the Farm Animal Investment Risk and Return (FAIRR)37 supported by the Coller Foundation
� Standards from the Global Reporting Initiative (GRI)38
� SDG Alignment Tool from Morgan Stanley Capital International (MSCI)39
� Global Nutrition Report (GNR)40 hosted by Development Initiatives (2018-2021)
� SDG Assessment from Vigeo Eiris41
� Food and Agriculture Benchmark from WBA42
� Seafood Stewardship Index from WBA43
Complementarity of the accountability landscapeThe current accountability mechanisms including nutrition indicators can be divided into two categories: focus on a ‘niche’ category among the SDGs such as nutrition, animal welfare, obesity, or have a broader focus on the SDG agenda. The mechanisms with a narrower focus provide detailed data on a category that is of interest to some investors, companies, or public stakeholders. Some alignment is possible and already exists, with for example the Access to Seeds Index which became part of the World Benchmarking Alliance. With alignment of these two groups, ‘niche’ and broader SDG mechanisms – the accountability landscape can provide a set of coherent impact assessments with various level of granularity matching competing stakeholder’s expectations.
37 FAIRR website, Coller FAIRR Protein Producer Index https://www.fairr.org/index/ Retrieved 16 December 2020
38 GRI website, GRI Standards https://www.globalreporting.org/how-to-use-the-gri-standards/gri-standards-english-language/ Retrieved 16 December 2020
39 MSCI website, Impact solutions https://www.msci.com/our-solutions/esg-investing/impact-solutions Retrieved 16 December 2020
40 GNR website https://globalnutritionreport.org/ Retrieved 16 December 2020
41 Vigeo Eiris, Solutions for investors https://vigeo-eiris.com/solutions-for-investors/sdg_assessment/ Retrieved 16 December 2020
42 WBA website, Food and Agriculture Benchmark https://www.worldbenchmarkingalliance.org/food-and-agriculture-benchmark/ Retrieved 16 December 2020
43 WBA website, Seafood Stewardship index https://www.worldbenchmarkingalliance.org/seafood-stewardship-index/ Retrieved 16 December 2020
Table 1: Objectives of the accountability mechanisms for business impact on nutrition.
Mechanism Key objective
Access to Nutrition Index Drive private sector’s performance on healthy, affordable diets by monitoring food industry contribution to nutrition.
INFORMAS Business Impact Assessment on Obesity and Population-level Nutrition tool
Monitor, benchmark and support public and private sector actions to increase healthy food environments and reduce obesity and NCDs and their related inequalities.
Business Benchmark on Farm Animal Welfare
Measure a company’s performance on farm animal welfare i.e. measure of farm animal welfare management, policy commitment, performance and disclosure in food companies
Dow Jones Sustainability Index
Track the stock performance of the world’s leading companies in terms of economic, environmental, and social criteria.

16
Business Accountability for Better Nutrition
FAIRR Coller Protein Producer Index
Assess the largest animal protein producers on critical environmental, social and governance issues.
GRI Standards Provide information about an organization’s positive or negative contributions to sustainable development.
MSCI SDG Alignment Tool
Provide a holistic view of companies’ net contribution (operations, products and services, policies, and practices) towards addressing each of the 17 UN SDGs.
Global Nutrition Report
Assess the state of global nutrition to inspire governments, civil society and private stakeholders to act to end malnutrition in all its forms.
Vigeo Eiris’ SDG Assessment
Analyse companies’ products and services, measure companies’ involvement in the different themes and classify companies’ performance against 9 themes aligned with the SDGs.
WBA Access to Seed Index
Encourage seed companies to increase their contribution to improving smallholder farmer productivity. Monitor and compare seed companies to improve access to quality seeds for smallholder farmers.
WBA Food and Agriculture Benchmark
Measure and rank 350 keystone companies on key issues underpinning the food systems transformation agenda.
WBA Seafood Stewardship Index
Measure how the world’s leading seafood companies contribute to the sustainable management of oceans and coastal ecosystems and ensure the implementation of responsible social practices.
44 Nasdaq website, SPGI financials https://www.nasdaq.com/market-activity/stocks/spgi/financials Retrieved 16 December 2020
45 Nasdaq website, MSCI financials https://www.nasdaq.com/market-activity/stocks/msci/financials Retrieved 16 December 2020
46 Nasdaq website, MCO financials https://www.nasdaq.com/market-activity/stocks/mco/financials Retrieved 16 December 2020
Accessibility of information and methodologyAccountability mechanisms are divided across two main business models: they are for profit or non-for-profit/independent entities. In 2019, S&P Global made a profit of around USD 6.7 billion,44 MSCI’s profit was above USD 1.2 billion45 and Moody’s corporation the parent company of Vigeo Eiris made a profit of 3.4 billion.46 While the Access to Nutrition Initiative, INFORMAS, the World Benchmarking Alliance, Development Initiatives, the Coller Foundation, the Global Reporting Initiative, Compassion in World Farming and World Animal Protection are not-for-profit organisations. The coexistence of these two models results into different access to data on business impact, the fees associated with data access for the for-profit accountability mechanisms make the full alignment behind common methodologies possible only to a certain extent as the for-profit mechanisms need to differentiate themselves from the not-for-profit ones to justify their data access fee.

17
Business Accountability for Better Nutrition
Aligning business reporting
47 Health Star Rating System website, FAQ http://www.healthstarrating.gov.au/internet/healthstarrating/publishing.nsf/Content/frequently-asked-questions-consumers Retrieved 23 November 2020
PRODUCT (RE)FORMULATION
The Health Star Rating system (HSR)The HSR was launched in 2014 to rate the overall nutritional profile of packaged food. It is a joint initiative by the governments of Australia and New Zealand. HSR provides a rating from 0.5 to 5 stars (5 stars being the healthier rating) using a calculator designed to assess the nutrient content of food, taking into account nutrients and ingredients of limited nutritional value. The HSR was launched to support consumers choose the healthier options available between similar products which are typically displayed together or used interchangeably.47 The calculator for this tool is regularly updated by the governments of Australia and New Zealand, recent recommendations include for example the automatic rating of 5 to be given to fresh, frozen or canned fruits and vegetables (with no additions of sugar, salt or fat).
Design process and geographical scopeThe HSR received the highest score in the GAIN 2020 survey and the subsequent interviews conducted for this report highlighted that this framework is considered by a large number of interviewees as the most suitable for global reporting on reformulation. The interviews and research underlined the importance of multi-stakeholder engagement around the development of this tool as well as the value of its public sector ownership for its credibility and subsequently of companies reporting with this methodology. The Food Foundation sees some value in using systems like the HSR for tracking how the nutritional content of packaged products has been improved as it not only takes into account the need to limit the content of unhealthy nutrients in food products but also to increase content of healthy nutrients. Food Industry Asia indicated that HSR could have relevance for product reformulation reporting in Australia and New Zealand, however other markets in Asia do not currently use HSR. Therefore, according to Food Industry Asia, HSR may not be suitable for global reporting of companies operating in other countries without additional contextualization. Similarly, most companies with their headquarters in Europe interviewed or respondents to the GAIN 2020 survey ranked the Nutri-score quite high due to its increasing use in the region. This voluntary labelling system also assesses content of nutrients for limited consumption (energy, sugars, saturated fats and salt) and healthier nutritional components (fibre, protein, fruit, vegetables and nuts, rapeseed oil, walnut oil and olive oil).
Current use of HSR by companies and reporting burdenHSR against volumes of products is already used by Danone for internal evaluations, therefore Danone’s leadership could decide to share this publicly without a significant resource increase. Nestle is using the HSR as a reference to assess the product portfolio and will continue to use it to inform reformulation, in the future. Kellogg is using the HSR to report impact on product reformulation, but this is currently limited to Australia and could potentially be used for global reporting.
Danone suggested that HSR reporting could be complementary to ATNI methodology which uses HSR but also includes additional criteria and focuses on a limited set of countries for each company while HSR reporting could be used for all countries in which companies operate. Similarly, Nestle values the external recognition of this assessment scheme but also acknowledges that it was designed around national nutrition guidelines and should be supplemented by other recognized frameworks. Savencia considers front-of-pack nutrition labels that take into account the food categories and their major nutrients intakes contribution (e.g. HSR with the consideration of calcium content in cheese) as more relevant for companies’ reporting on product reformulation. However, the company suggested a complementary reporting on business overall strategies to promote consumption of nutritious foods
18
Business Accountability for Better Nutrition
(ex. Nudge)48 beyond sole impact on product reformulation. Savencia is promoting a global vision on balanced and diversified diet by associating different food categories and right portions, promoting consumption of raw and low processed foods (reduced additives) and taking into account local and cultural food habits.49 This issue is also highlighted by Unilever which states that the HSR methodology does not reflect companies’ effort around portion size reduction as the scoring is based on per 100g calculation. The company also states that the HSR methodology may work for complete products but does not reflect the impact of products intending to help consumers to consume more vegetables, such as meal kits that provide vegetable rich recipes on pack.
According to IFBA, using HSR for company reporting on product (re)formulation across the board would require an enormous amount of work and would need to go to a fraction of stars in order to reflect progress over limited timeframes, e.g. for annual reporting. Additionally, while interviewees generally acknowledged the need to update the HSR methodology over time, they indicated that it has an impact on the reporting burden for companies as well as a potential reputational risk.
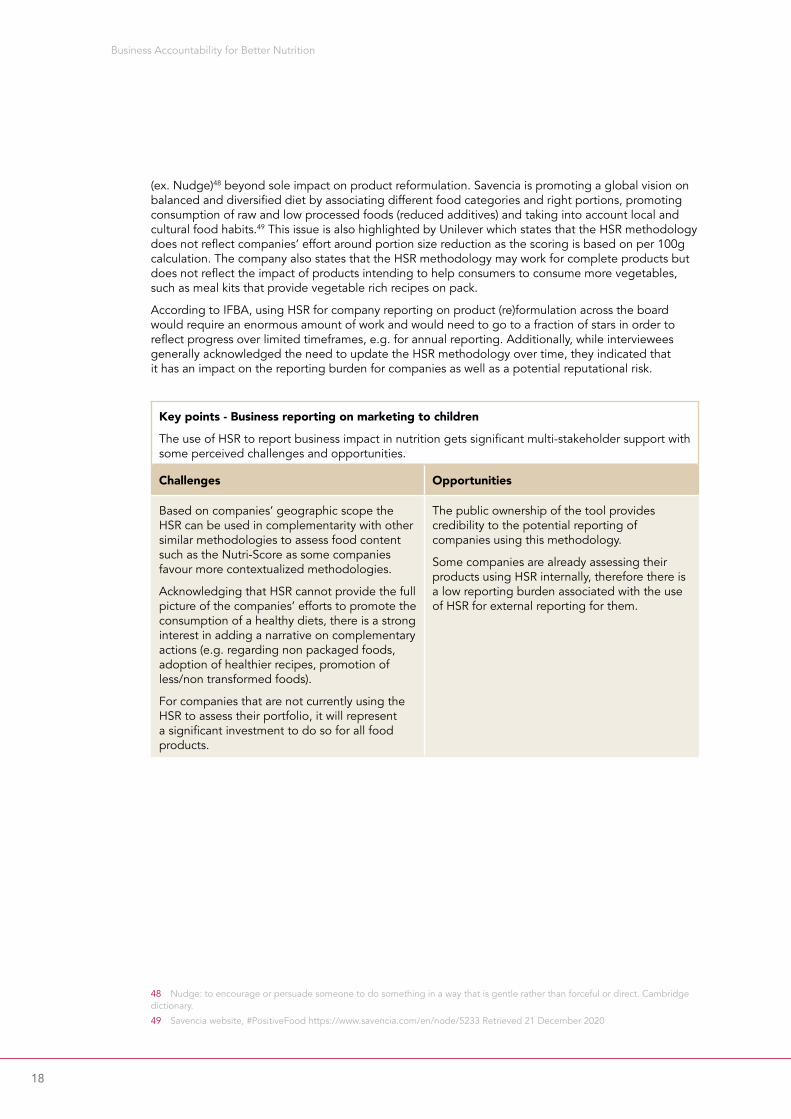
Key points - Business reporting on marketing to children
The use of HSR to report business impact in nutrition gets significant multi-stakeholder support with some perceived challenges and opportunities.
Challenges Opportunities
Based on companies’ geographic scope the HSR can be used in complementarity with other similar methodologies to assess food content such as the Nutri-Score as some companies favour more contextualized methodologies.
Acknowledging that HSR cannot provide the full picture of the companies’ efforts to promote the consumption of a healthy diets, there is a strong interest in adding a narrative on complementary actions (e.g. regarding non packaged foods, adoption of healthier recipes, promotion of less/non transformed foods).
For companies that are not currently using the HSR to assess their portfolio, it will represent a significant investment to do so for all food products.
The public ownership of the tool provides credibility to the potential reporting of companies using this methodology.
Some companies are already assessing their products using HSR internally, therefore there is a low reporting burden associated with the use of HSR for external reporting for them.
48 Nudge: to encourage or persuade someone to do something in a way that is gentle rather than forceful or direct. Cambridge dictionary.
49 Savencia website, #PositiveFood https://www.savencia.com/en/node/5233 Retrieved 21 December 2020

19
Business Accountability for Better Nutrition
MARKETING TO CHILDREN
The Children’s Food and Beverage Advertising Initiative’s Core Principles50 The Children’s Food and Beverage Advertising Initiative (CFBAI) gathers companies located in the United States who voluntarily commit either not to advertise foods or beverages to children (under twelve years old) at all or advertise only products that meet CFBAI’s strict uniform nutrition criteria. Additionally, CFBAI participants commit to not advertise their foods to children in elementary schools. CFBAI defines some “core principles” which set requirements regarding media coverage and nutrition criteria for food advertising to children.
The EU Pledge51 The EU Pledge is an industry initiative on marketing to children led by 23 food companies representing 80% of food spent in the EU. The EU Pledge members either commit to only advertise products that meet certain agreed nutrition criteria52 to children under 12 or to not advertise any products at all to children under 12. The EU Pledge addresses marketing to children through TV, radio, cinema, print, outdoor marketing, internet, mobile apps, social networking websites, influencer marketing, interactive games and commercial communications in primary schools. The mechanism is monitored by a third party and includes a complaint mechanism.
Industry supportWhile the GAIN 2020 survey and the interviewees largely recognised the relevance of CFBAI’s core principles and of the EU Pledge (a mechanism not included in the initial survey but widely mentioned by survey respondents and interviewees) to report on their marketing practices at least in the US and Europe, several interviewees highlighted the need for reporting tools fostering ‘positive marketing’, i.e. not only tools that focus on banning or limiting marketing of unhealthy foods but also promote marketing of healthy foods. The interviewees also broadly acknowledged the evolving nature of marketing platforms and the need for credible reporting tools to consider these changes. For example, the Food Foundation suggests that, because reporting on the marketing of food products to children is complex, reporting frameworks should factor in emerging marketing approaches, such as online marketing, which can often be tailored to specific demographics.
Unilever considers that the EU pledge nutrition criteria are more universal than CFBAI’s, having been developed for the EU but being the basis for other pledges such as in Singapore, India, Thailand. Danone views the EU pledge nutrition criteria as more easily applicable and more demanding than CFBAI’s therefore the company thinks that these criteria could be used globally except for the US and Canada markets where CFBAI should apply. The framework selected on marketing to children should make it possible for companies to achieve high enough rate of compliance (potentially thanks to reformulation efforts). However, for companies to allocate resources to report globally using a regional mechanism, Danone believes that companies will need to be incentivized, e.g. part of the requirements from a recognized accountability mechanism such as ATNI. According to IFBA, the EU Pledge nutrition criteria should be included alongside CFBAI’s Core principles, as they are used not only in Europe, but also underpin several other regional and national responsible marketing initiatives, and moreover, have been adopted as a global voluntary standard by some leading companies. According to some companies (e.g. Kellogg), business associations can support alignment on marketing to children’s reporting and external commitments on this topic.
CFBAI’s core principles are used for marketing reporting by Nestle in the US only, the company also reports on this aspect through the EU Pledge criteria, considered more stringent in some respects.
50 BBB national programmes, CFBAI Core Principles https://bbbprograms.org/programs/all-programs/cfbai/core_principles Retrieved 16 November 2020.
51 The EU Pledge website, The EU Pledge at a glance, https://eu-pledge.eu/the-eu-pledge-at-a-glance/ Retrieved 30 November 2020
52 EU Pledge Nutrition White Paper, Updated October 2018 https://eu-pledge.eu/wp-content/uploads/EU_Pledge_Nutrition_White_Paper.pdf Retrieved 30 November 2020.
20
Business Accountability for Better Nutrition
Companies tend to use WHO nutrient profile models not as overall frameworks for marketing to children’s reporting but as guidance for their marketing related actions (e.g. exclusion of some products in Nestle’s marketing to children policy).
Some companies that do not target children in their marketing communication would like to see this reflected in marketing reporting. Similarly, Google indicates in its Google Ad Policies that “products related to consumable food and drinks” are prohibited for advertising intended to children, regardless of nutrition content.53
Credibility of reporting on marketing to childrenThe Culture of Health for Business (COH4B) framework is a reporting framework developed by the Global Reporting Initiative (GRI) and the Robert Wood Johnson “on the role of companies in impacting the health and wellbeing of their employees and stakeholders”.54 It is referring to CFBAI’s criteria to assess companies’ impact on marketing to children. The tool mainly focuses on US based companies but is indicated as “freely available to be used by companies around the world”55, illustrating the recognition of this reporting framework beyond the private sector. The 2020 GAIN survey showed a divide between the tools favoured by the private sector versus the ones favoured by the public sector. The ones ranked the highest by the private sector were those developed by the private sector (CFBAI’s Core Principles and the International Chamber of Commerce Advertising and Marketing Communications Code) while the public sector respondents favoured the frameworks developed by WHO (the World Health Organization Regional Office for Europe Nutrient Profile Model and the World Health Organization Regional Office for Western Pacific Nutrient Profile Model). Public sector organisations shared that due to the importance of responsible marketing to children, guidelines on this topic should be restrictive and companies should adopt global strategies to protect children in all markets.
Due to the majority of respondents being companies and business associations, CFBAI’s core principles were ranked as the most relevant existing framework however the consensus around its usage is limited to the US market. Companies are generally willing to align their reporting on marketing using recognised regional frameworks however they favour using them for regional impacts rather than globally. Therefore, realistic alignment of business reporting on marketing should focus on using CFBAI’s core principles and the EU Pledge with more work needed on using their criteria for business reporting beyond the US and the EU.
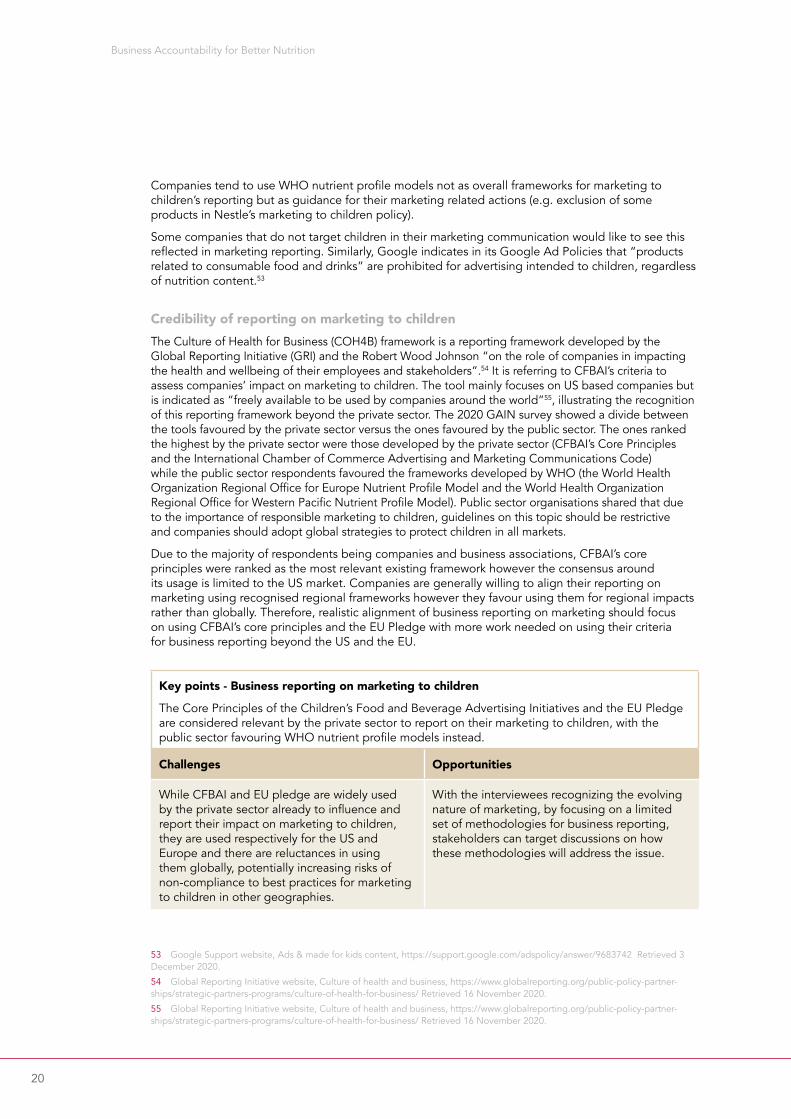
Key points - Business reporting on marketing to children
The Core Principles of the Children’s Food and Beverage Advertising Initiatives and the EU Pledge are considered relevant by the private sector to report on their marketing to children, with the public sector favouring WHO nutrient profile models instead.
Challenges Opportunities
While CFBAI and EU pledge are widely used by the private sector already to influence and report their impact on marketing to children, they are used respectively for the US and Europe and there are reluctances in using them globally, potentially increasing risks of non-compliance to best practices for marketing to children in other geographies.
With the interviewees recognizing the evolving nature of marketing, by focusing on a limited set of methodologies for business reporting, stakeholders can target discussions on how these methodologies will address the issue.
53 Google Support website, Ads & made for kids content, https://support.google.com/adspolicy/answer/9683742 Retrieved 3 December 2020.
54 Global Reporting Initiative website, Culture of health and business, https://www.globalreporting.org/public-policy-partner-ships/strategic-partners-programs/culture-of-health-for-business/ Retrieved 16 November 2020.
55 Global Reporting Initiative website, Culture of health and business, https://www.globalreporting.org/public-policy-partner-ships/strategic-partners-programs/culture-of-health-for-business/ Retrieved 16 November 2020.

21
Business Accountability for Better Nutrition
FOOD LABELLING
Labelling is defined by the Codex Alimentarius as including “any written, printed or graphic matter that is present on the label, accompanies the food, or is displayed near the food, including that for the purpose of promoting its sale or disposal.”56 Acknowledging that food labelling is driven by national regulations, GAIN/SBN pre-selected the Codex Alimentarius Standards on Labelling whose requirements are included in most national regulations and set minimum standards for countries with no or weak regulations on food labelling.
Codex Alimentarius Standards on Food Labelling57 The Codex Alimentarius is a collection of internationally adopted food standards and texts regarding the protection of consumers’ health and fair practices in the food trade. The Standards have been developed by the Codex Alimentarius Commission which was established by the UN Food and Agriculture Organisation and the World Health Organisation to protect consumer health and promote fair practices in food trade.58 The Standards are designed to support consumers make informed decisions about the food they purchase.
Consensus and opportunities Companies interviewed by GAIN/SBN indicated the existing overall compliance of global food companies to Codex Alimentarius Standards on Food Labelling. Both the survey and follow up interviews highlighted a consensus on using these Standards for companies’ reporting on food labelling recognising that it promotes compliance in countries with no or weak regulations.
Several companies such as Nestle, Kellogg, and Unilever already report on compliance to Codex Alimentarius Standards on Labelling. Some companies already complying with Codex Alimentarius Standards on Labelling have not been disclosing their effort in this area and need further internal consultations to do so.
To report on compliance to Codex Alimentarius Standards on Labelling, Danone would need to include an additional check in its current reporting processes. Danone considers that Codex Alimentarius Standards on Labelling can be a starting point to align business reporting on labelling with the possibility to add more ambitious criteria for global food labelling practices over time. UNSDSN similarly thinks that more stringent criteria should be used for business reporting on food labelling due to the importance of the topic. FAO specifically pointed out the need for international guidance on front of pack labelling, noting that Codex Alimentarius discussions are currently underway to advance international guidelines on the front-of-pack labelling. FAO also recognized the need to provide food information to consumers in the future in restaurants or similar food establishments. Also acknowledging the high level of compliance of global companies to Codex Standards on labelling, Unilever suggested that small and medium enterprises might not have similar level of compliance and therefore these Standards might be used to ensure best practices on food labelling by all businesses. The need to build capacity and knowledge of SMEs around food labelling was also mentioned by the FAO.
56 Codex general standard for the labelling of prepackaged foods, Codex Stan 1-1985. http://www.fao.org/3/Y2770E/y2770e02.htm Retrieved 30 November 2020.
57 Codex Alimentarius website, Nutrition and Labelling, http://www.fao.org/fao-who-codexalimentarius/thematic-areas/nutri-tion-labelling/en/ Retrieved 30 November 2020.
58 Codex Alimentarius website, http://www.fao.org/fao-who-codexalimentarius/en/ Retrieved 30 November 2020.

22
Business Accountability for Better Nutrition
Key points - Business reporting on food labelling
There is a strong consensus on using Codex Alimentarius Standards on Labelling for business reporting on food labelling.
Challenges Opportunities
Issues of compliance to these Standards might emerge across emerging markets especially for small and medium enterprises.
These Standards are widely used by the private sector and are considered independent and credible by both the public and private sector.
WORKFORCE NUTRITION
The Workforce Nutrition Alliance defines workforce nutrition as “a set of interventions that work through the existing structures of the workplace to address fundamental aspects of health amongst employees and/or supply chain workers.”59 Companies currently tend to report on a set of criteria related to employees’ health and wellbeing. Acknowledging the opportunity that represents workforce nutrition criteria programmes for better nutrition60, GAIN/SBN included the Workforce Nutrition Alliance Scorecard as a reporting tool on this issue in its 2020 survey.
Workforce Nutrition Alliance Scorecard GAIN, CGF and NewForesight designed a reporting tool to support companies self-assess their workforce nutrition programmes around four categories: healthy food at work (access to nutritious and safe food in the workplace), nutrition education (nutrition education and/or behaviour change communication programme), nutrition-focused health checks (regular health checks and follow up counselling) and breastfeeding support (workplace modifications to support employee breast feed). Each of these categories is assessed according to three criteria’s (strategy, quantity, and quality) and six sub-criteria: monitoring and evaluation, resources, availability, accessibility, quality and worker engagement.
Momentum The scorecard addresses a current gap in global reporting on workforce nutrition, therefore most interviewees and survey respondents saw its value in the current reporting landscape. It was also perceived by some respondents such as Food Industry Asia as being a tool for workforce nutrition pledging at the upcoming N4G Summit. Nestle, BASF, Nutrifood Indonesia, Kalbe Farma, Panasonic Manufacturing Indonesia and Indofood are considering using the workforce nutrition alliance scorecard to report impact on workforce nutrition. Kellogg is also considering using the workforce nutrition alliance scorecard in 2021 to report on the company’s impact on workforce nutrition.
59 Consumer Goods Forum website, Workforce Nutrition Alliance page, https://www.theconsumergoodsforum.com/health-well-ness/healthier-lives/key-projects/employee-health-andwellbeing/workforce-nutrition-alliance/ Retrieved 25 August 2020.
60 “Given that 58% of the world’s population spends one third of their time at work during their adult life, the workplace presents an opportunity in the fight against malnutrition.”, Nutrition Connect website, the Workforce Nutrition Alliance, https://nutritioncon-nect.org/workforce-nutrition-alliance Retrieved 30 November 2020.

23
Business Accountability for Better Nutrition
ScopeThe Workforce Nutrition Scorecard offers a comprehensive set of criteria welcome by some of the interviewees but also raising concerns about the resources required to report on all the Scorecard criteria at global level for companies with employees spread across multiple locations and work settings. For example, Danone considers reporting on its workforce nutrition actions through the Workforce Nutrition Alliance Scorecard possible but with significant efforts to collect data from local offices/factories on the four categories. Similarly, another company raised some concerns regarding the resources needed to report globally on all of the four Scorecard categories as well as regarding the sensitivities on data issues, especially for reporting on health checks programmes. The issue of the resources required for the reporting through the Scorecard was considered especially problematic by companies with employees spread across multiple sites in one country. Some respondents such as WBA highlighted that among the four programmes put forward in the Workforce Nutrition Scorecard, ‘healthy food at work’ should be given more weight than the other three categories. The focus of the Scorecard on workforce nutrition only will also require potential adjustments to companies’ employee’s health and wellbeing reporting as indicated by WBCSD. While the Scorecard offers a comprehensive set of nutrition indicators to report on, some companies are looking at sustainability issues such as the reduction of animal proteins or promoting circular food economy, therefore future versions of the Scorecard might need to take into consideration the environmental impact of workforce nutrition programmes to remain relevant for businesses.
VisibilityThe Scorecard being a new reporting tool expected to be launched as a digital reporting tool in early 2021, several respondents indicated that strong communications and integration in existing accountability mechanisms would support buy-in from companies. For example, Danone suggested that the Scorecard usage would benefit from being integrated in ATNI methodology.
Key points - Business reporting on workforce nutrition
Business reporting on workforce nutrition had not benefitted until then from a global methodology to assess impact, this will be available in February 2021 with the workforce alliance nutrition Scorecard. There is strong consensus regarding the relevance of this tool and interest to use it.
Challenges Opportunities
The tool being recent it has not yet been endorsed by existing accountability mechanisms, representing an additional reporting burden for companies deciding to use it.
The Scorecard is a self-assessment tool therefore involving potential credibility issues regarding the results if no third-party verification system is added.
With a credible new tool being developed by both the public and private sector, there is an opportunity to build a strong aligned reporting on workforce nutrition, a topic that has not been very visible in current business reporting.

24
Business Accountability for Better Nutrition
FOOD SAFETY
According to WHO, “unsafe food creates a vicious cycle of disease and malnutrition, particularly affecting infants, young children, elderly and the sick.”61 The organisation also estimated that “almost 1 in 10 people in the world fall ill after eating contaminated food and 420 000 die every year”.62 Global companies have high rate of compliance with national food safety standards and one tool developed by CGF has been designed for global reporting on this issue. The GAIN 2020 survey and interviews confirmed the existing consensus around the Global Food Safety Initiative benchmarking requirements to assess business impact on food safety.
Global Food Safety Initiative (GFSI)63 GFSI has designed benchmarking requirements which are widely used for food safety certification programmes across borders and for the full supply chain. The requirements are designed to harmonize, build capability, develop strategic partnerships and drive thought leadership, while driving continuous improvement around food safety. The current version of the GFSI’s benchmarking requirements is aligned with the Codex Alimentarius guidelines on food hygiene. Food operators worldwide can streamline their processes through certification with GFSI recognized certification programme owners. Over 150,000 certificates from GFSI-recognized certification programme owners have been issued in 162 countries.
The global scope of the GFSI benchmarking requirements and their credibility was welcomed in the survey conducted by GAIN/SBN in May 20203 and in the follow up interviews. Overall GFSI’s Benchmarking Requirements are considered relevant for the reporting of business impact on food safety (Danone, IFBA, Nestle, Kellogg, some Food Industry Asia members) and already used for reporting quite broadly:
� Danone currently shares its rates of food safety certified factories following GFSI recognized standards.
� Nestle already reports on the number of Nestle factories and raw material suppliers that hold GFSI benchmarked certifications.
� All Kellogg sites are audited and approved against GFSI’s Benchmarking Requirements or equivalent.
BASF while not currently reporting on food safety against the GFSI’s benchmarking requirements is considering doing so in the future.
Key points - Business reporting on food safety
Food safety has been an area where business practices have been heavily monitored for decades and where a global reporting tool is already available: the GFSI benchmarking requirements.
Challenges Opportunities
As compliance to food safety standards is considered a given by most large companies, they do not necessarily share publicly their impact. By making this information available, the global community will be better equipped to streamline the requirements in all markets and for companies of all sizes.
There is a strong consensus on what best practices regarding food safety are compared to other areas in nutrition, and the GFSI benchmarking requirements are therefore largely supported for business reporting.
61 WHO website, Food Safety, https://www.who.int/news-room/fact-sheets/detail/food-safety Retrieved 30 November 2020.
62 WHO website, Food Safety, https://www.who.int/news-room/fact-sheets/detail/food-safety Retrieved 30 November 2020.
63 CGF website, the Global Food Safety Initiative, https://mygfsi.com Retrieved 23 December 2020.

25
Business Accountability for Better Nutrition
FOOD LOSS AND WASTE
Each year around one-third of the food produced for human consumption is lost or wasted, equivalent to USD 940 billion.64 Food loss and waste’s reductions positively impact food availability, it also results in financial gains for farmers, companies, and households and finally it alleviates pressure of food production on climate, water, and land resources.65
Food Loss and Waste Accounting and Reporting Standard (FLW Standard)The FLW Standard has been developed by a multi-stakeholder partnership composed of CGF, the Food and Agriculture Organization of the United Nations, the EU-funded FUSIONS project, the United Nations Environment Programme, the World Business Council for Sustainable Development, the Waste and Resources Action Programme, and the World Resources Institute. The FLW Standard is a global voluntary standard that provides requirements and guidance for quantifying and reporting on the weight of food loss and waste. It aims to facilitate the quantification of food loss and waste and to encourage consistency and transparency of the reported data. The tool is strictly designed for reporting and does not set any targets on food loss and waste.
Champions 12.3In the GAIN 2020 survey and follow up interviews, several respondents indicated that a relevant reporting tool for food loss and waste should also include set targets. Champions 12.3 was the key initiative mentioned by several companies (Danone, Unilever) to inspire global action and set targets on food loss and waste. This public private partnership supports the achievement - by 2030 - of the SDG 12.3: “By 2030, halve per capita global food waste at the retail and consumer levels and reduce food losses along production and supply chains, including post-harvest losses.”66 The SDGs having been launched in 2015, companies can use their 2015 baseline to halve their food waste and losses to comply with this target. Using the SDG 12.3 target for the WBA benchmarks demonstrates the strong relevance and current alignment behind this target to assess business impact on food loss and waste. The 12.3 target is also the key target of the Coalition of Action on Food Waste launched by CGF in August 2020 which aims as having all its members reporting publicly on food loss and waste by December 2021 using the FLW Standard. The coalition which currently gathers 16 global food manufacturers and retailers67 will collaborate with Champions 12.3.
A trending topicBoth the GAIN 2020 survey and interviews reflected the growing engagement and interest of companies around commitments and reporting on food loss and waste. The credibility of the tool is also strong among public sector representatives. Some companies are already using the FLW Standard to report on their food loss and waste, e.g. Kellogg using the FLW standard to report on food loss and waste across its factories as well as Unilever or Nestle doing so since 2016. And some companies planning to do so in the upcoming months. For example, Danone is using FLW Standard for their public reporting on this issue. In addition to the growing interest of companies around food loss and waste, one interviewee suggested mandatory reporting on food loss and waste for businesses to increase business reporting on this issue. It is also important to incentivize reporting on this issue for business-to-business companies as stated by BASF.
64 https://champions123.org/target-123
65 Champions 12.3 website, Target 12.3 https://champions123.org/target-123 Retrieved 1 December 2020.
66 Champions 12.3 website, Target 12.3 https://champions123.org/target-123 Retrieved 1 December 2020.
67 Ahold Delhaize, Barilla, Bel Group, General Mills, Grupo Bimbo, Kellogg, Magnit, Majid al Futtaim, Mc Cain, Metro, Migros Ticaret A.S., Nestle, Sainsbury’s, Tesco, Unilever, Walmart. The Consumer Goods Forum website, Governance, https://www.thecon-sumergoodsforum.com/environmental-sustainability/food-solid-waste/about/governance/ Retrieved 2 December 2020.
26
Business Accountability for Better Nutrition
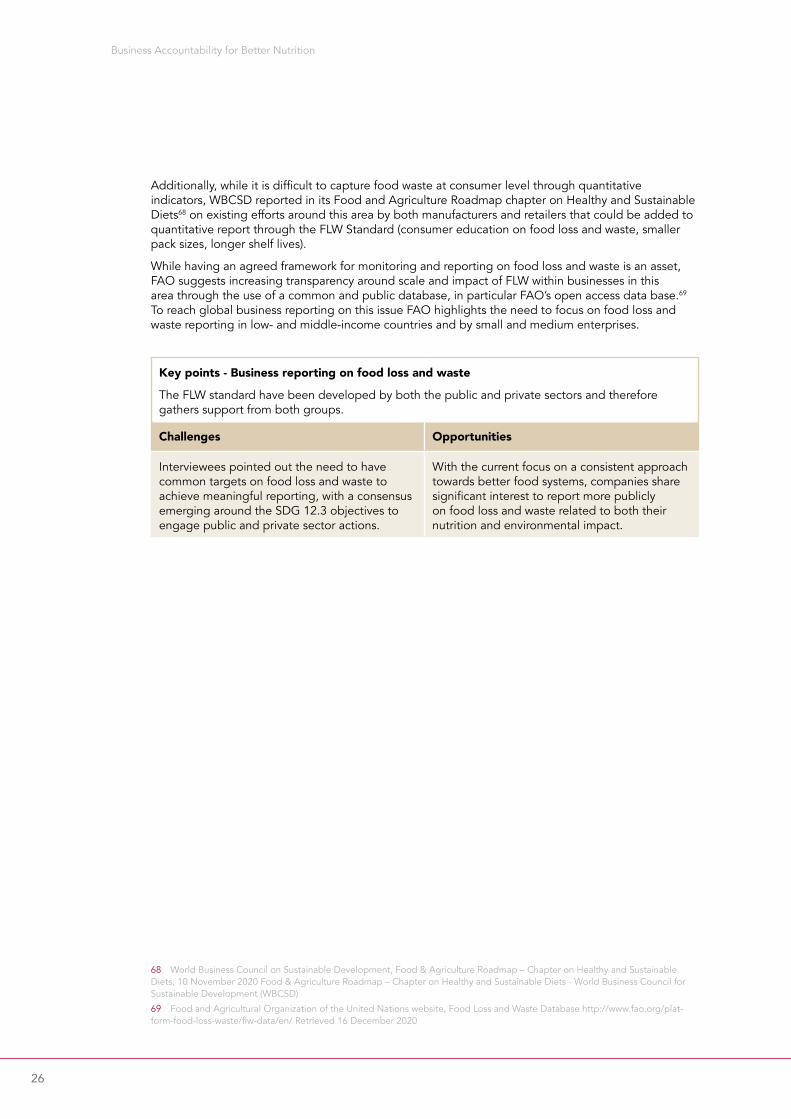
Additionally, while it is difficult to capture food waste at consumer level through quantitative indicators, WBCSD reported in its Food and Agriculture Roadmap chapter on Healthy and Sustainable Diets68 on existing efforts around this area by both manufacturers and retailers that could be added to quantitative report through the FLW Standard (consumer education on food loss and waste, smaller pack sizes, longer shelf lives).
While having an agreed framework for monitoring and reporting on food loss and waste is an asset, FAO suggests increasing transparency around scale and impact of FLW within businesses in this area through the use of a common and public database, in particular FAO’s open access data base.69 To reach global business reporting on this issue FAO highlights the need to focus on food loss and waste reporting in low- and middle-income countries and by small and medium enterprises.
Key points - Business reporting on food loss and waste
The FLW standard have been developed by both the public and private sectors and therefore gathers support from both groups.
Challenges Opportunities
Interviewees pointed out the need to have common targets on food loss and waste to achieve meaningful reporting, with a consensus emerging around the SDG 12.3 objectives to engage public and private sector actions.
With the current focus on a consistent approach towards better food systems, companies share significant interest to report more publicly on food loss and waste related to both their nutrition and environmental impact.
68 World Business Council on Sustainable Development, Food & Agriculture Roadmap – Chapter on Healthy and Sustainable Diets, 10 November 2020 Food & Agriculture Roadmap – Chapter on Healthy and Sustainable Diets - World Business Council for Sustainable Development (WBCSD)
69 Food and Agricultural Organization of the United Nations website, Food Loss and Waste Database http://www.fao.org/plat-form-food-loss-waste/flw-data/en/ Retrieved 16 December 2020
27
Business Accountability for Better Nutrition
Conclusion and next stepsBetter business accountability in nutrition is possible through the use of existing tools and resources. The feedback provided on the survey results for the alignment of business reporting highlighted the need for companies to be incentivized in aligning their reporting through a limited set of methodologies. IFBA considers that it is important for credibility that external third parties assessing the private sector should be the ones deciding which methodologies to use to assess private sector impact. These decisions should however be informed by evidence of which methodologies are best suited to offer sufficiently granular and comparable insights.
The WBA is currently developing its methodology for the Food and Agriculture Benchmark - to be published by the end of 2021 - and is looking at the results of the GAIN 2020 survey on aligning business reporting for nutrition related indicators, supporting the idea of a better alignment across business reporting in nutrition.
One of the companies interviewed suggested that consumer associations can play a role in educating consumers on companies’ impact reporting against existing methodologies, this could be a strong incentive to increase and align public reporting by companies against methodologies.
Feedback provided by B2B companies such as Royal DSM as well as by retailers highlighted the need to incentivise integrated impact reporting along the full value chain and ensure that reporting frameworks for key categories are relevant for all. Following the publication of this report, it is therefore critical to support alignment of business reporting impact on nutrition led by business to consumer food manufacturers while mobilising retailers and business to business companies.
While identifying a set of next steps to address some of the issues highlighted by businesses, business associations and accountability mechanisms, this report concludes that overall alignment of business reporting using the following indicators will provide a better and more coordinated understanding of business impact on nutrition while enabling a more efficient resource allocation for business reporting on nutrition:
� Product (re)formulation: the Health Star Rating System – to be complemented by qualitative information or regional recognised methodologies such as Nutri-Score.
� Marketing to children: the Core Principles of the Children’s Food and Beverage Advertising Initiatives and the EU Pledge – while ensuring marketing reporting is not limited to the business activities in the EU and the US.
� Food labelling: relevant Codex Alimentarius Standards on Labelling.
� Employee health and wellbeing/Workforce Nutrition: the Workforce Nutrition Alliance Scorecard.
� Food safety: the Global Food Safety Initiative benchmarking requirements.
� Food loss and waste: the Food Loss and Waste Accounting and Reporting Standard – to be complemented by specific, measurable, achievable, realistic, time specific global targets building on SDG 12.3 (halve food loss and waste between 2015 and 2030).
NEXT STEPS
Make business reporting on nutrition a priorityThe interviews and workshops conducted throughout the past two years by GAIN, with CGF support, highlighted the interest, knowledge, and widespread internal reporting on nutrition through existing reporting tools. However, to achieve better visibility of business impact in nutrition, companies’ top management should foster the publication of companies’ impact via these reporting tools. Companies can partner with public sector stakeholders to highlight their positive impact against credible external reporting tools to increase the added value of external reporting on nutrition for businesses (linked to positive impact).
28
Business Accountability for Better Nutrition
Aligning reporting beyond nutritionSimilar initiatives to align business reporting exist in the environmental sustainability sector and interviews pointed out the need for further collaboration between initiatives looking at business reporting in nutrition and in environmental sustainability.
Assessing the entire food value chainWhile it is logical and efficient to focus on the impact of the largest companies on nutrition, there is a risk in leaving smaller companies and some parts of the value chain such as retailers outside the scope of accountability systems. While this initiative focused on using existing frameworks and efforts around business accountability in nutrition and therefore looked mostly at larger food and beverage companies that engage with several accountability mechanisms, it is critical to continue effort and discussions to see how these existing reporting tools and accountability mechanisms can progressively reach small and medium enterprises70, national companies from low- and middle-income countries. retailers, ingredients and raw food suppliers.
Organise multi-stakeholder consultations for missing impact areasMeasuring companies’ impact on nutritious food affordability and accessibility was looked at through GAIN 2020 survey and follow up interviews. While the importance of the issue was widely acknowledged, there is a strong need for more discussions to potentially achieve an assessment methodology that will be considered relevant by both the public and private sector.
Increase collaboration among accountability mechanismsBy aligning business reporting in nutrition around a limited set of reporting tools, we could not only have a better understanding of business impact but also address the issue of the reporting burden. If accountability mechanisms use a similar set of existing reporting tools and align their reporting timeline, companies would be able to engage with a wider range of accountability mechanisms while allocating similar or less resources that they currently do for reporting on their nutrition impact. The alignment of the reporting timeline should consider the annual business reporting cycle. The WBA reflects the increased understanding that collaboration is needed for efficient business impact assessment, in the draft methodology of their Food and Agriculture Benchmark71 the WBA lists all the existing sources for each suggested indicator and refers to existing reporting tools including the FLW Standard, Codex Alimentarius Standards on food labelling, HSR, Workforce Nutrition Alliance Scorecard or the GFSI’s Benchmarking Requirements.
70 For example, over the long term, Food Industry Asia shared the importance of having not only multinationals but also small and medium enterprises report against these tools to assess and improve impact of business on nutrition
71 World Benchmarking Alliance, Food and Agriculture Benchmark Draft methodology Report for public consultation, December 2020 WBA_FoodandAgricultureBenchmark-DraftMethodology.pdf (worldbenchmarkingalliance.org) Retrieved 22 December 2020

29
Business Accountability for Better Nutrition
Annexes
72 Aligning Business Reporting in Nutrition, 2020 Survey Results, Global Alliance for Improved Nutrition, August 2020 https://www.gainhealth.org/sites/default/files/publications/documents/aligning-business-reporting-in-nutrition-2020-survey-results.pdf Retrieved 17 December 2020
ANNEX 1 – KEY SURVEY RESULTS FROM GAIN AUGUST 2020 REPORT ON ALIGNING BUSINESS REPORTING IN NUTRITION.72
Building on the results of bilateral and multilateral consultations, in May 2020 GAIN/SBN launched an online survey to identify relevant reporting tools for business impact in seven categories. The survey was shared with businesses, business associations, civil society organizations, UN agencies and accountability mechanisms. The seven categories included in the survey were: (Re)Formulation; Marketing to children; Food Labelling; Employee health and wellbeing (with a focus on workforce nutrition); Food safety; Food loss and waste; Food affordability. The results and interviews on food affordability indicated that this category requires further discussions and that there is currently no consensus among both public and private stakeholders around existing frameworks to assess business impact on this issue. Twenty-nine responses were received. The majority of responses came from businesses and business associations (twenty-one responses). Eight responses were received from NGO, international organisation, academia, and accountability mechanism representatives. The results are summarized below and detailed in the GAIN August 2020 report.
Product re(formulation)
(Re)Formulation
Tota
l sco
re
Health Star Rating Nutri-Score
Total scores of all respondents on the relevance of reporting tools for product (re)formulation.
Guiding Stars
29 27
19
(Re)Formulation – Business-Business Association
Tota
l sco
re
Health Star Rating Nutri-Score Guiding Stars
17 15,5
11,5
Responses from businesses and business association on the relevance of reporting tools for product (re)formulation.
(Re)Formulation – IO-NGO-Academia-Accountability mechanism
Tota
l sco
re
Health Star Rating Nutri-Score Guiding Stars
12 11,5
7,5
Responses from international organisations, NGOs, academia and accountability mechanisms on the relevance of reporting tools for product (re)formulation.

30
Business Accountability for Better Nutrition
Responsible marketing to children
Marketing
Tota
l sco
re
WHO Regional Officefor Europe Nutrient
Profile Model
WHO Regional Officefor Western Pacific Nutrient
Profile Model
ICC advertising and marketing
communications code
CFBAI Core Principles
Total scores of all respondents on the relevance of reporting tools for marketing to children.
2623,5
31,525,5
Marketing – IO-NGO-Academia-Accountability mechanism
Tota
l sco
re
WHO Regional Officefor Europe Nutrient
Profile Model
WHO Regional Officefor Western Pacific Nutrient
Profile Model
ICC advertising and marketing
communications code
CFBAI Core Principles
Responses from international organisations, NGOs, academia and accountability mechanisms on the relevance of reporting tools for marketing to children practices.
1210
8 7
Marketing – Business-Business Association
Tota
l sco
re
WHO Regional Officefor Europe Nutrient
Profile Model
WHO Regional Officefor Western Pacific Nutrient
Profile Model
ICC advertising and marketing
communications code
CFBAI Core Principles
Responses from businesses and business association on the relevance of reporting tools for marketing to children practices.
14 13,5
23,518,5

31
Business Accountability for Better Nutrition
Food Labelling
Labelling
Tota
l sco
re
Relevant Codex Alimentarius Standardson Labelling
National Regulations on Labelling
Total scores of all respondents on the relevance of reporting tools for labelling.
35,5 33,5
Labelling – Business-Business Association
Tota
l sco
re
Responses from businesses and business association on the relevance of reporting tools for labelling.
Relevant Codex Alimentarius Standardson Labelling
National Regulations on Labelling
22,5 23,5
Labelling – IO-NGO-Academia-Accountability mechanism
Tota
l sco
re
Responses from international organisations, NGOs, academia and accountability mechanisms on the relevance of reporting tools for labelling.
Relevant Codex Alimentarius Standardson Labelling
National Regulations on Labelling
1310

32
Business Accountability for Better Nutrition
Employee health and wellbeing, focus on workforce nutrition
Employee Health and Wellbeing
Tota
l sco
re
CDC Worksite Health Scorecard
Workforce Nutrition Alliance Scorecard
Total scores of all respondents on the relevance of reporting tools for employee health and wellbeing.
Health Metrics Scorecard
18,5
30,5
15,5
Employee Health and Wellbeing – Business-Business Association
Tota
l sco
re
10,5
20,5
10,5
Responses from businesses and business association on the relevance of reporting tools for employee health and wellbeing.
CDC Worksite Health Scorecard
Workforce Nutrition Alliance Scorecard
Health Metrics Scorecard
Employee Health and Wellbeing – IO-NGO-Academia-Accountability mechanism
Tota
l sco
re
810
5
Responses from international organisations, NGOs, academia and accountability mechanisms on the relevance of reporting tools for employee health and wellbeing.
CDC Worksite Health Scorecard
Workforce Nutrition Alliance Scorecard
Health Metrics Scorecard

33
Business Accountability for Better Nutrition
Food safety
Food loss and waste
Responses on the relevance of the Food Loss and Waste accounting and reporting
standard for business reporting
Businesses and business associations responses on the relevance of the
Food Loss and Waste Accounting and Reporting Standards for business
reporting.
International organisations, NGOs, academia and
accountability mechanisms responses on the relevance of the Food Loss and Waste Accounting
and Reporting Standards for business reporting.
Food Loss and Waste Accounting and Reporting
Standard
Food Loss and Waste Accounting and Reporting
StandardBusiness-Business
Association
Food Loss and Waste Accounting and Reporting
StandardIO-NGO-Academia-Accountability
mechanism
48%43%
9%
Very Relevant Not Relevant Relevant
33%
54%
13% 75%
25%
Global Food Safety InitiativeBenchmarking Requirements
Global Food Safety InitiativeBenchmarking Requirements
Business-Business Association
Global Food Safety Initiative Benchmarking Requirements
IO-NGO-Academia-Accountability mechanism
50%
42%
8%
50%
39%
11%
50%50%
Responses on the relevance of the Global Food Safety Initiative benchmarking requirements for
business reporting.
Businesses and business associations responses on the relevance of the
Global Food Safety Initiative benchmarking requirements for
business reporting.
International organisations, NGOs, academia and accountability
mechanisms responses on the relevance of the Global Food Safety Initiative benchmarking
requirements for business reporting.
Very Relevant Not Relevant Relevant
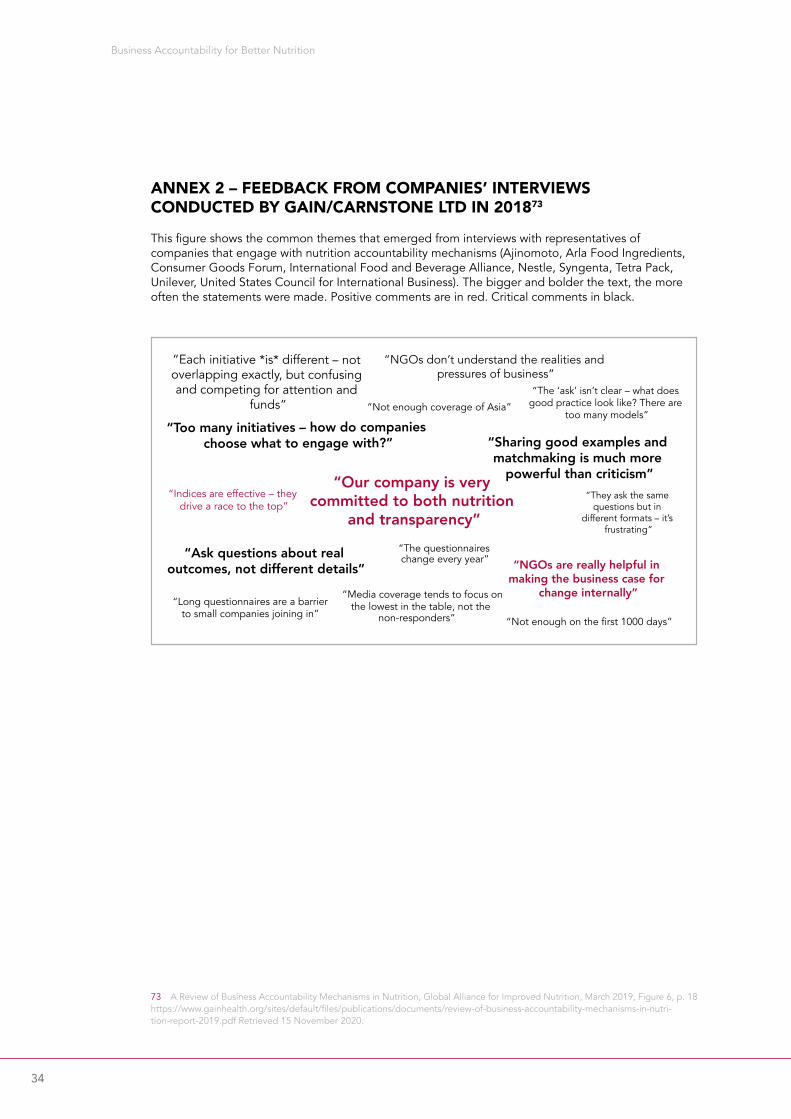
34
Business Accountability for Better Nutrition
ANNEX 2 – FEEDBACK FROM COMPANIES’ INTERVIEWS CONDUCTED BY GAIN/CARNSTONE LTD IN 201873
This figure shows the common themes that emerged from interviews with representatives of companies that engage with nutrition accountability mechanisms (Ajinomoto, Arla Food Ingredients, Consumer Goods Forum, International Food and Beverage Alliance, Nestle, Syngenta, Tetra Pack, Unilever, United States Council for International Business). The bigger and bolder the text, the more often the statements were made. Positive comments are in red. Critical comments in black.
73 A Review of Business Accountability Mechanisms in Nutrition, Global Alliance for Improved Nutrition, March 2019, Figure 6, p. 18https://www.gainhealth.org/sites/default/files/publications/documents/review-of-business-accountability-mechanisms-in-nutri-tion-report-2019.pdf Retrieved 15 November 2020.
“Each initiative *is* different – not overlapping exactly, but confusing and competing for attention and
funds”
“Too many initiatives – how do companies choose what to engage with?”
“NGOs don’t understand the realities and pressures of business”
“The ‘ask’ isn’t clear – what does good practice look like? There are
too many models”
“Sharing good examples and matchmaking is much more
powerful than criticism”
“Not enough coverage of Asia”
“Indices are effective – they drive a race to the top”
“Our company is very committed to both nutrition
and transparency”“They ask the same
questions but in different formats – it’s
frustrating”
“Ask questions about real outcomes, not different details”
“Long questionnaires are a barrier to small companies joining in”
“The questionnaires change every year” “NGOs are really helpful in
making the business case for change internally”“Media coverage tends to focus on
the lowest in the table, not the non-responders” “Not enough on the first 1000 days”

35
Business Accountability for Better Nutrition


ContactGlobal Alliance for Improved Nutrition (GAIN)
Rue de Varembé 7
1002 Geneva, Switzerland
T: +41 22 749 18 50
www.gainhealth.org