bus 332 scientific research techniques lectured by prof. dr. lütfihak alpkan gebze institute of...
TRANSCRIPT

BUS 332Scientific Research Techniques
Lectured by
Prof. Dr. Lütfihak Alpkan
Gebze Institute of Technology
Main Textbook: William G. Zikmund’s
Business Research Methods

WEEK DATE TEACHING PLAN
1 20. 02 Introduction
2 27. 02 Ch. 9: Survey Research: An Overview
3 05.03 Ch. 10: Survey Research: Communication with Respondents
4 12.03 Ch. 11: Observation Methods
5 19.03 Ch. 12: Experimental Research
6 26.03 General overview
7 02.04 MIDTERM EXAM 1
8 09.04 Ch. 13: Measurement and Scaling
9 16.04 Ch. 14: Attitute Measurement
11 30.04 Ch. 15: Questionnaire Design 1
12 07.05 Ch. 15: Questionnaire Design 2
13 14. 05 General overview
14 21.05 MIDTERM EXAM 2

Business Research Methods
William G. Zikmund
Chapter 9:
Survey Research

Chapter 9: Survey Research
1. Basic Definitions for surveys
2. Errors in Surveys
3. Classification of Survey Methods
1. Basic Definitions for surveys
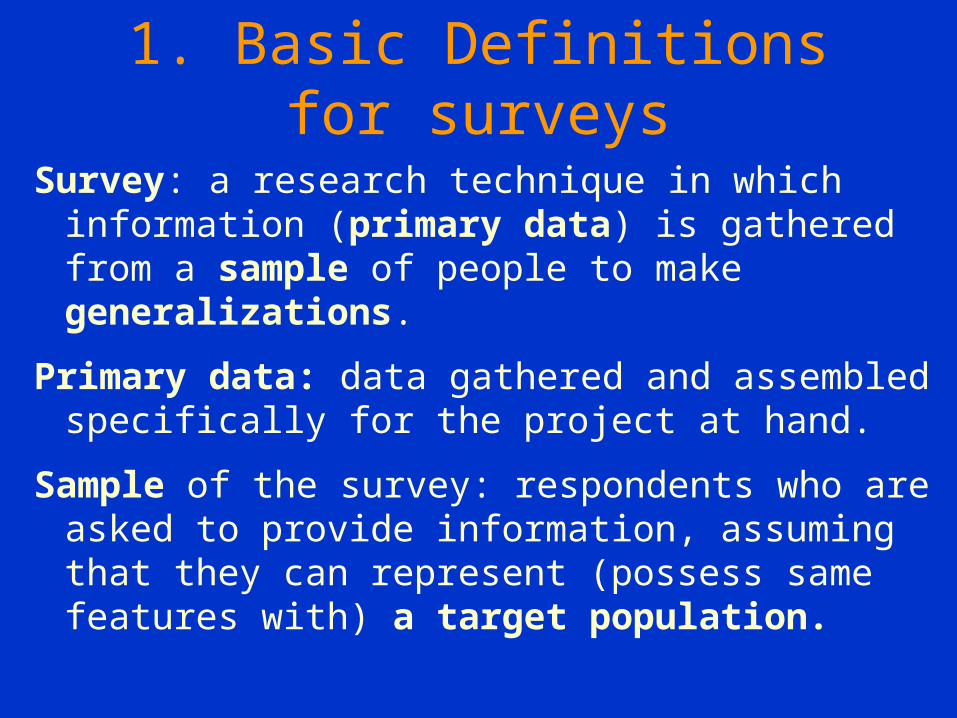
Survey: a research technique in which information (primary data) is gathered from a sample of people to make generalizations.
Primary data: data gathered and assembled specifically for the project at hand.
Sample of the survey: respondents who are asked to provide information, assuming that they can represent (possess same features with) a target population.

POPULATIONPOPULATION
SAMPLESAMPLESample: Subset of a larger population
Selecting a Sample
Sampling:
• Who is to be sampled?
• How large a sample?
• How will sample units be selected?
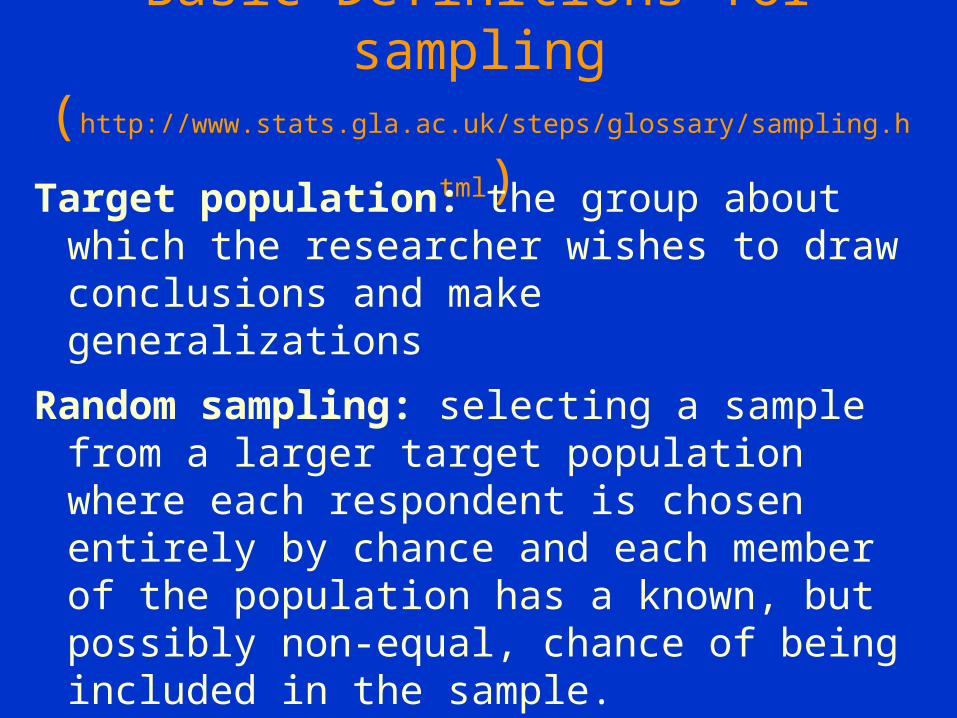
Basic Definitions for sampling (http://www.stats.gla.ac.uk/steps/glossary/sampling.html)
Target population: the group about which the researcher wishes to draw conclusions and make generalizations
Random sampling: selecting a sample from a larger target population where each respondent is chosen entirely by chance and each member of the population has a known, but possibly non-equal, chance of being included in the sample.

Basic Definitions for data collection
Surveys ask respondents (who are the subjects of the research) questions by use of a questionnaire.
Respondent: The person who provides information (primary data) by answering a questionnaire or an interviewer’s questions.
Questionnaire: a list of structured questions designed by the researchers for the purpose of codifying and analyzing the respondents’ answers scientifically.
Advantages of Surveys: Quick, Inexpensive, Efficient, Accurate, Flexible way of gathering information.
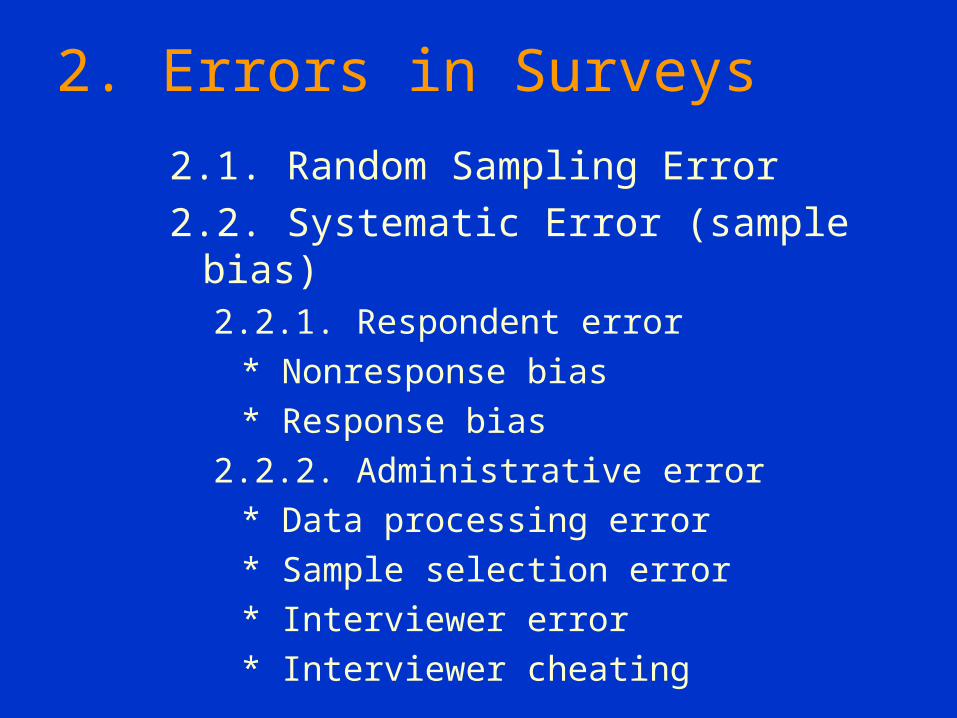
2. Errors in Surveys
2.1. Random Sampling Error
2.2. Systematic Error (sample bias)2.2.1. Respondent error
* Nonresponse bias
* Response bias
2.2.2. Administrative error
* Data processing error
* Sample selection error
* Interviewer error
* Interviewer cheating

2.1. Random Sampling Error
• Even if randomly selected, samples may possess different characteristics than the target population (the likelihood of bias is reduced but still exists)
• This is a statistical fluctuation due to chance variation.
• Then, an important difference occurs between the findings obtained from this sample and the findings obtained from a possible census of the whole target population.

• Consider the hypothetic case in which a study sample could be increased until it was infinitely large; chance variation of the mean, or random error, would be reduced toward zero. These are random errors.
• Systematic errors would not be diminished by increasing sample size.
(Bias in Research Studies, http://radiology.rsna.org/content/238/3/780.full)

2.2. Systematic Error
• Systematic error results from some mistake(s) done in the design and/or execution of the research.
• All types of error -except random sampling error, are included in this definition,
• Sample bias: a persistent tendency for the results of a sample to deviate in one direction from the true value of the population parameter.
• Sample bias can arise when the intended sample does not adequately reflect the spectrum of characteristics in the target population.

2.2.1. Respondent Bias
• A classification of sample bias resulting from some respondent action or inaction
• Nonresponse bias
• Response bias

Nonresponse Error
• Nonrespondents: in almost every survey information from a small or large portion of the sample cannot be collected. These are those people who refuse to respond, or who can not be contacted (not-at-homes)
• Self-selection bias: only those people who are interested strongly with topic of the survey may respond while those who are still within the same sample but indeferent or afraid avoid participating.
• This leads to the over-representation of some extreme positions, but under-representation of others.

Response Bias
• A bias that occurs when respondents tend to answer questions with a certain inclination or viewpoint that consciously (deliberate falsification) or unconsciously (unconscious misinterpretation) misrepresents the truth.
Reasons of response bias
• Knowingly or unknowingly people who answer questions of the interviewer may feel unconfortable about the truth that they share with others, and change it in their responses.
• They may desire to show themselves as more intelligent, wealthy, sensitive, etc. than they really are.

Acquiescence bias (positive answers)
Extremity bias (exaggerated answers)
Interviewer bias (answers acceptable by the interviewer)
Auspices bias (answers acceptable by the organization)
Social desirability bias (answers creating a favorable impression)
Types of Response Bias
Deliberate falsification (consciously false answers)

2.2.2. Administrative Error
• Unadvertently or carelessly improper administration and execution of the research task
• Blunders are:• Confusion• Neglect• Omission

Types of Administrative ErrorsData processing error: incorrect data entry, computer
programming, or other procedural errors during the analysis stage.
Sample selection error: improper sample design (e.g. based on incomplete databases) or sampling procedure execution (e.g. executed in daytime while most of the target population are working)
Interviewer error: mistakes done by the interviewer (e.g. taking wrong or incomplete notes about the answers of the respondents.
Interviewer cheating: filling in fake or false answers indeed not given by the respondents.

3. Classification of Survey Methods
3.1. Structure of the questionnaire:
* whether standardized questions with a limited number of allowable answer -multiple choices
* or unstandardized open ended questions with the possibility of being answered in numerious ways.
3.2. Level of Directness of the questions:
* whether direct/undisguised questions
* or indirect/disguised questions to hide the real purpose of the survey

Classification of Survey Methods
3.3. Time basis of the Survey:Cross-Sectional Study: data on various segments of a target
population are collected at a single moment in time to make comparisons among segments.
Longitudinal Study: data are collected at different times from the similar respondents to compare trends and identify changes.
Panel Study: A longitudinal survey of exactly the same respondents to record (in a diary) their attitudes, behaviors, or purchasing habits over time.

Business Research Methods
William G. Zikmund
Chapter 10:
Survey Research: Basic Communication Methods
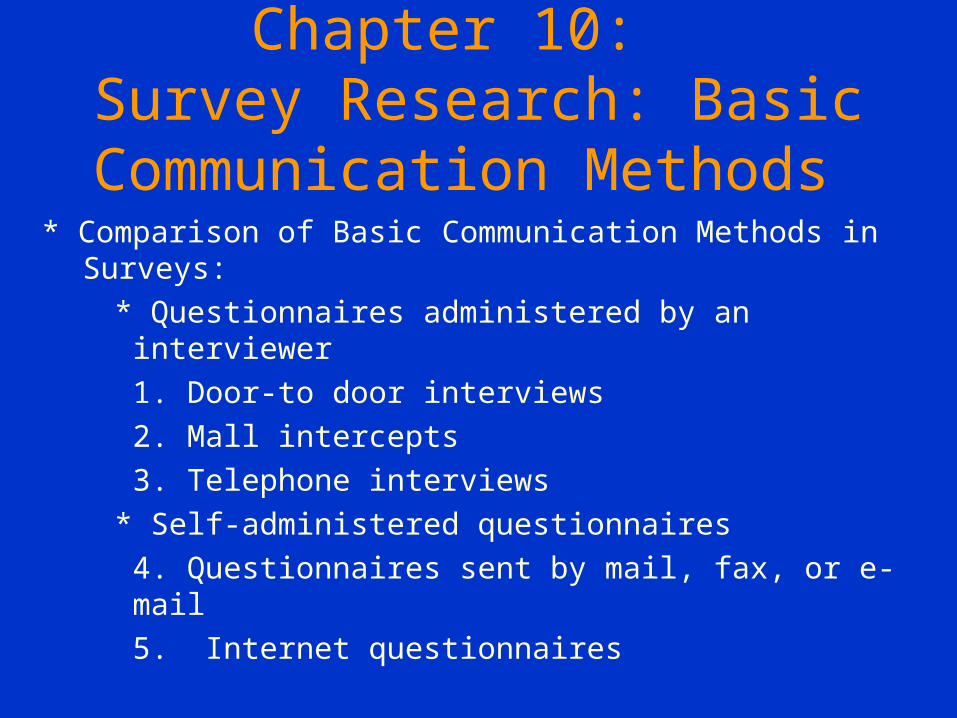
Chapter 10: Survey Research: Basic
Communication Methods * Comparison of Basic Communication Methods in
Surveys:
* Questionnaires administered by an interviewer
1. Door-to door interviews
2. Mall intercepts
3. Telephone interviews
* Self-administered questionnaires
4. Questionnaires sent by mail, fax, or e-mail
5. Internet questionnaires

1. Door-to-Door Personal Interview
• Speed of data collection– Moderate to fast
• Geographical flexibility– Limited to moderate
• Respondent cooperation– Excellent
• Versatility of questioning– Quite versatile
• Questionnaire length– Long
• Item non-response– Low
• Possibility of respondent misunderstanding– Lowest
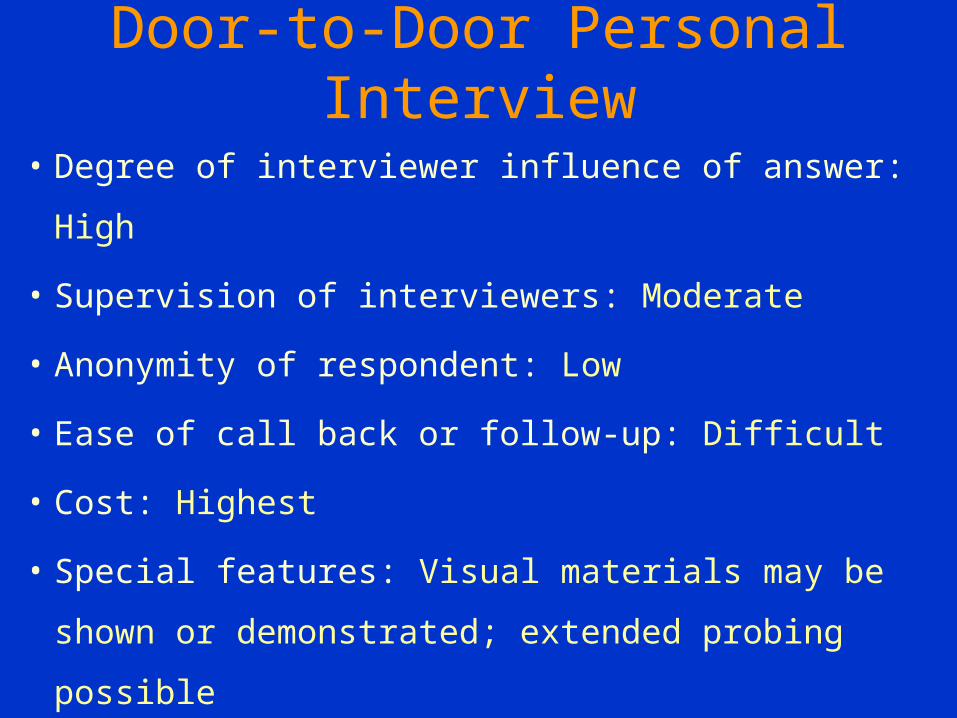
Door-to-Door Personal Interview
• Degree of interviewer influence of answer: High
• Supervision of interviewers: Moderate
• Anonymity of respondent: Low
• Ease of call back or follow-up: Difficult
• Cost: Highest
• Special features: Visual materials may be shown
or demonstrated; extended probing possible
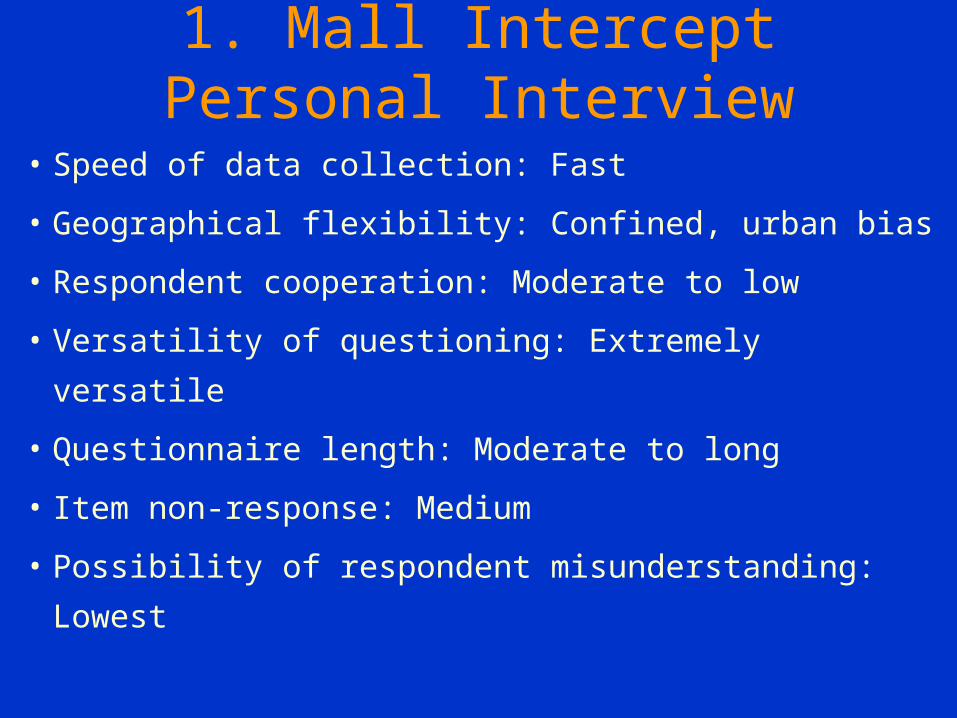
1. Mall Intercept Personal Interview
• Speed of data collection: Fast
• Geographical flexibility: Confined, urban bias
• Respondent cooperation: Moderate to low
• Versatility of questioning: Extremely versatile
• Questionnaire length: Moderate to long
• Item non-response: Medium
• Possibility of respondent misunderstanding: Lowest

Mall Intercept Personal Interview
• Degree of interviewer influence of answers: Highest
• Supervision of interviewers: Moderate to high
• Anonymity of respondent: Low
• Ease of call back or follow-up: Difficult
• Cost: Moderate to high
• Special features: Taste test, viewing of TV
commercials possible

3. Telephone Surveys
• Speed of Data Collection: Very fast
• Geographical Flexibility: High
• Respondent Cooperation: Good
• Versatility of Questioning: Moderate
• Questionnaire Length: Moderate
• Item Non-response: Medium
• Possibility of Respondent Misunderstanding: Average
• Degree of Interviewer Influence of Answer: Moderate
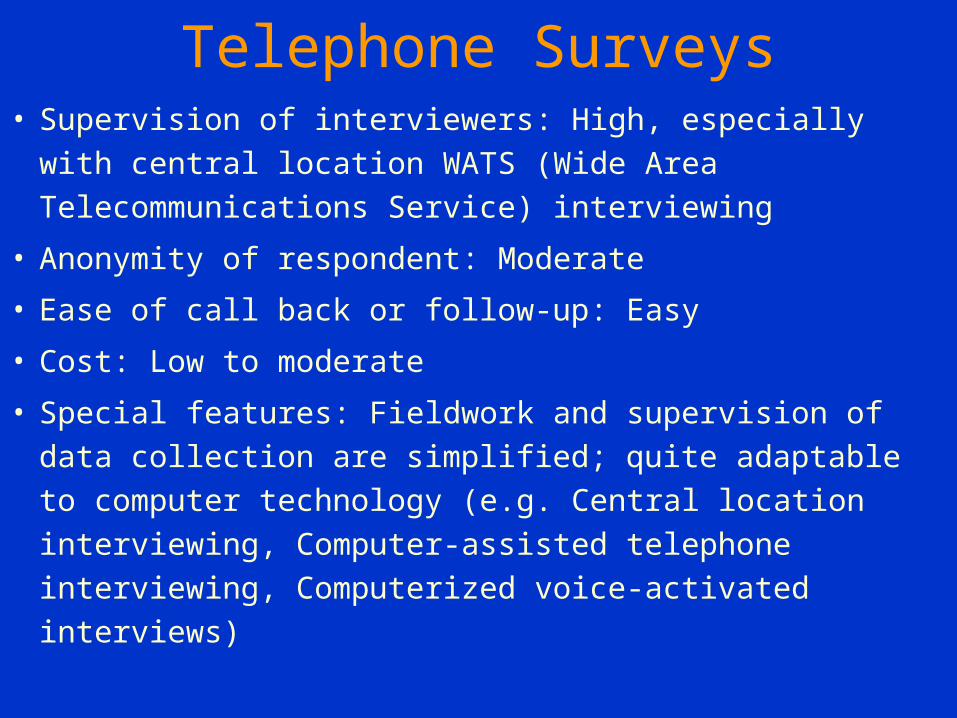
Telephone Surveys• Supervision of interviewers: High, especially with central
location WATS (Wide Area Telecommunications Service)
interviewing
• Anonymity of respondent: Moderate
• Ease of call back or follow-up: Easy
• Cost: Low to moderate
• Special features: Fieldwork and supervision of data collection
are simplified; quite adaptable to computer technology (e.g.
Central location interviewing, Computer-assisted telephone
interviewing, Computerized voice-activated interviews)
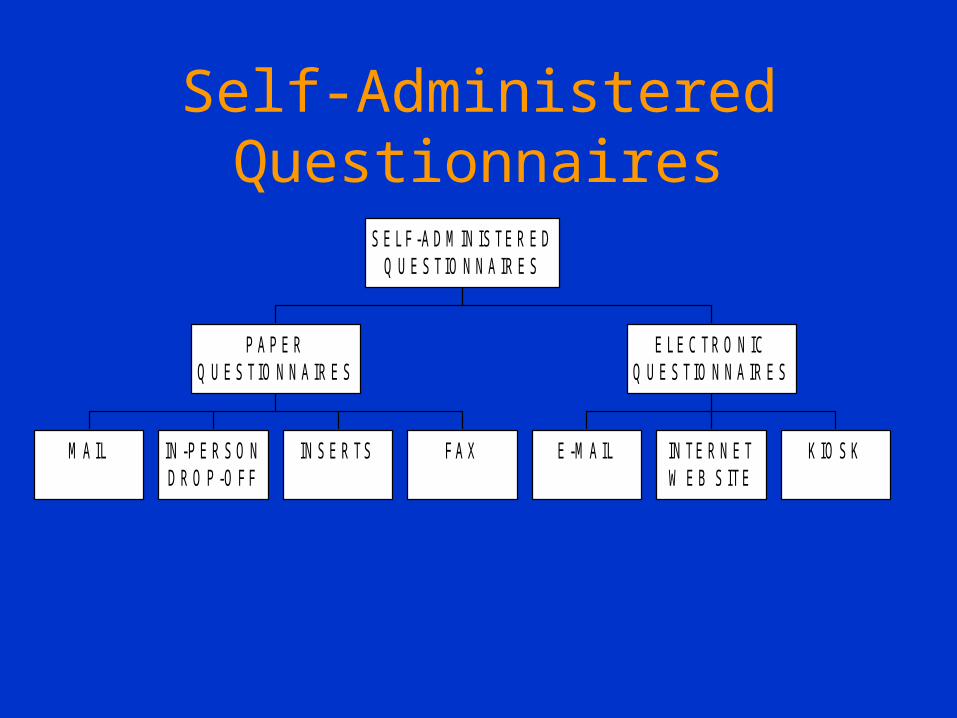
M A IL IN -P E R S O ND R O P -O F F
IN S E R TS F A X
P A P E RQ U E S TIO N N A IR E S
E -M A IL IN TE R N E TW E B S ITE
K IO S K
E L E C TR O N ICQ U E S TIO N N A IR E S
S E L F -A D M IN IS TE R E DQ U E S TIO N N A IR E S
Self-Administered Questionnaires
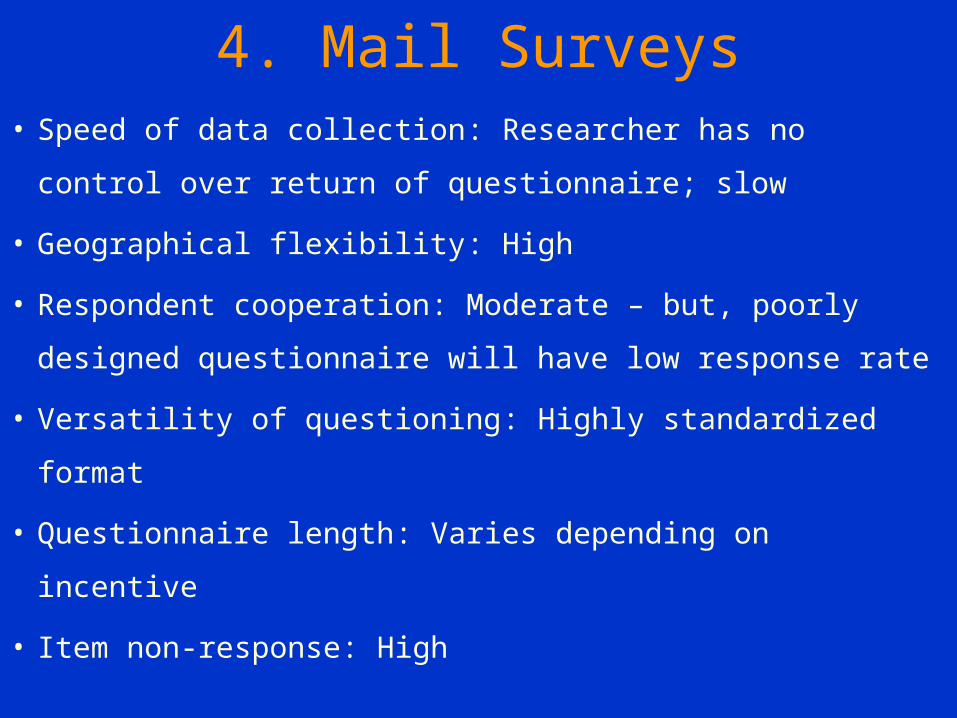
4. Mail Surveys
• Speed of data collection: Researcher has no control over
return of questionnaire; slow
• Geographical flexibility: High
• Respondent cooperation: Moderate – but, poorly
designed questionnaire will have low response rate
• Versatility of questioning: Highly standardized format
• Questionnaire length: Varies depending on incentive
• Item non-response: High
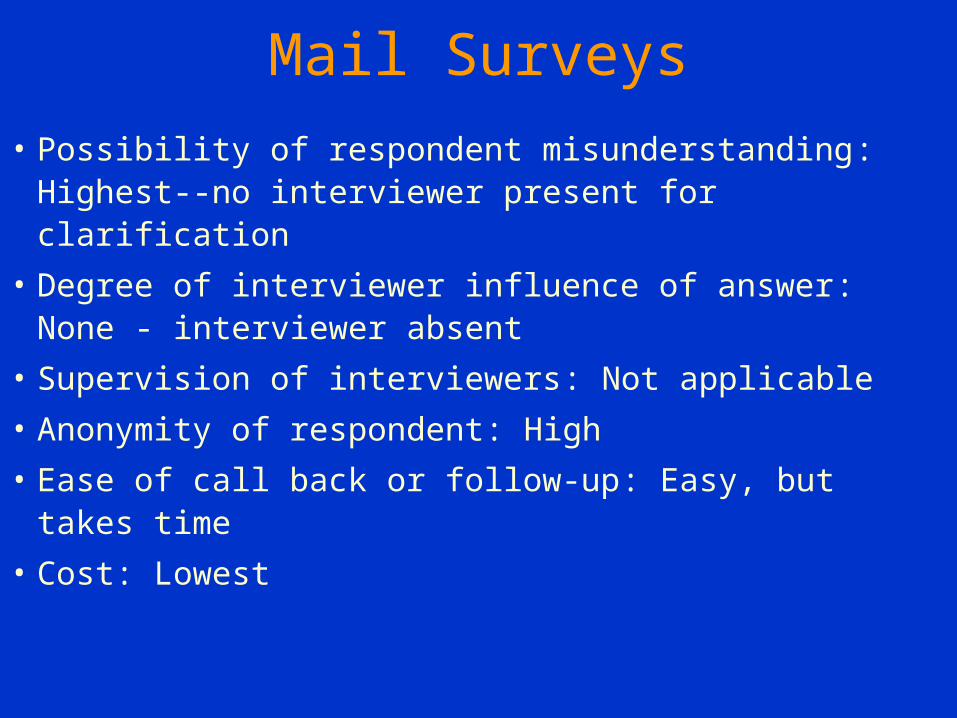
Mail Surveys
• Possibility of respondent misunderstanding: Highest--no interviewer present for clarification
• Degree of interviewer influence of answer: None - interviewer absent
• Supervision of interviewers: Not applicable
• Anonymity of respondent: High
• Ease of call back or follow-up: Easy, but takes time
• Cost: Lowest

5. E-Mail Questionnaire Surveys• Speed of data collection: Instantaneous
• Geographic flexibility: worldwide
• Cheaper distribution and processing costs
• Flexible, but– Extensive differences in the capabilities of
respondents’ computers and e-mail software limit the types of questions and the layout
• E-mails are not secure and “eavesdropping” can possibly occur
• Respondent cooperation– Varies depending if e-mail is seen as “spam”

6. Internet Surveys
• A self-administered questionnaire posted on a Web site. • Respondents provide answers to questions displayed
online by highlighting a phrase, clicking an icon, or keying in an answer.
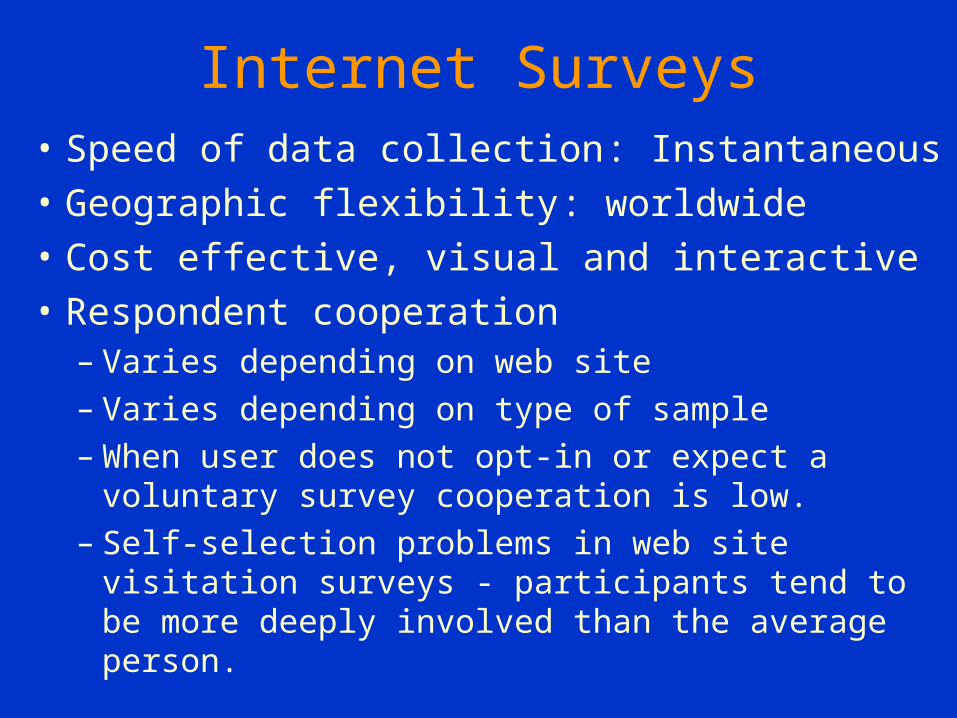
Internet Surveys• Speed of data collection: Instantaneous
• Geographic flexibility: worldwide
• Cost effective, visual and interactive
• Respondent cooperation– Varies depending on web site– Varies depending on type of sample– When user does not opt-in or expect a voluntary survey
cooperation is low. – Self-selection problems in web site visitation surveys -
participants tend to be more deeply involved than the average person.
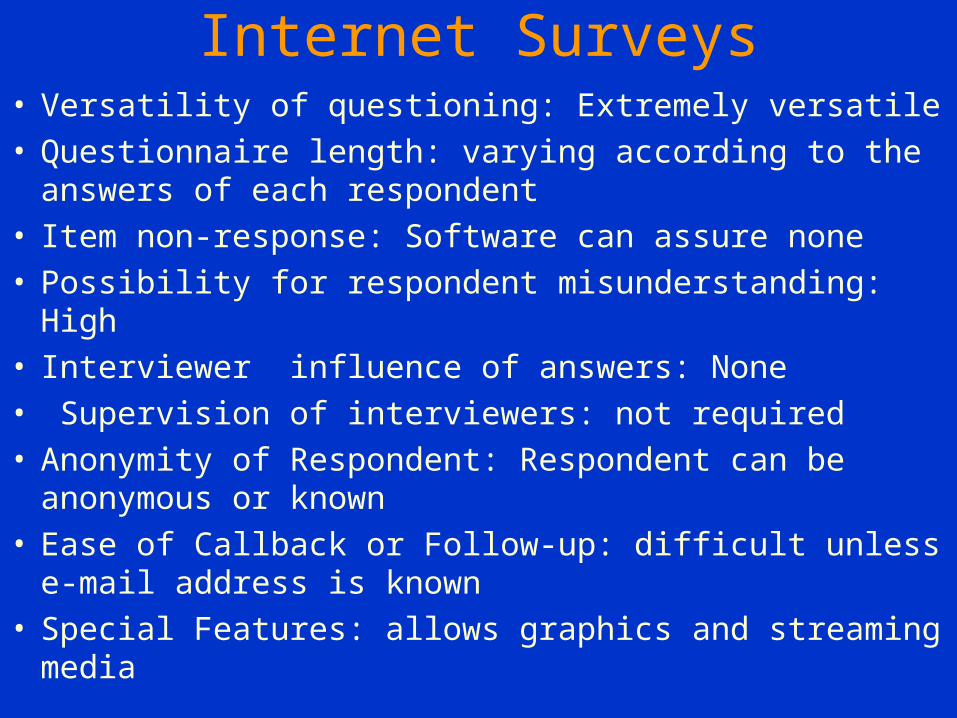
Internet Surveys• Versatility of questioning: Extremely versatile• Questionnaire length: varying according to the answers of
each respondent• Item non-response: Software can assure none• Possibility for respondent misunderstanding: High• Interviewer influence of answers: None• Supervision of interviewers: not required• Anonymity of Respondent: Respondent can be anonymous
or known• Ease of Callback or Follow-up: difficult unless e-mail
address is known• Special Features: allows graphics and streaming media
Business Research Methods
William G. Zikmund
Chapter 11:
Observation Methods
Chapter 11: Observation Methods
1. Types of Observed Phenomena
2. Advantages and Disadvantages of Observation
3. Types of Observation Techniques
1. Types of Observed Phenomena
• Physical actions
• Verbal behavior
• Expressive behavior
• Spatial relations and locations
• Temporal patterns
• Verbal and pictorial records

Phenomena Example
Human behavior or physical Shoppers (buyers) movementaction pattern in a store
Verbal behavior Statements made byairline travelers who waitin line
Expressive behavior Facial expressions, tone of voice, and other form of body language
Examples for Observed Phenomena
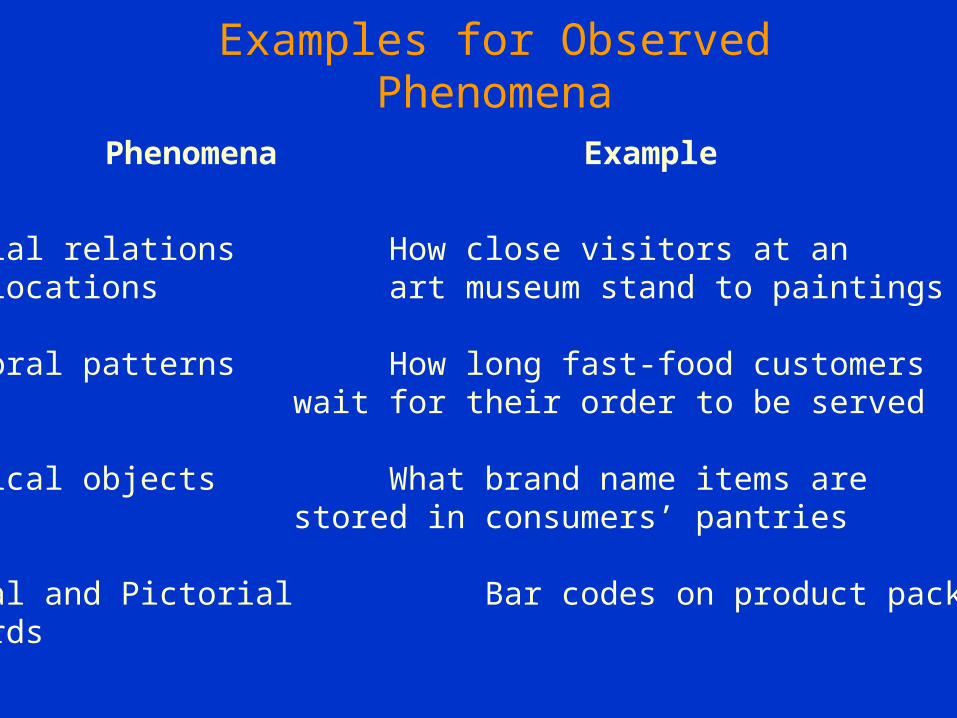
Phenomena Example
Spatial relations How close visitors at anand locations art museum stand to paintings
Temporal patterns How long fast-food customerswait for their order to be served
Physical objects What brand name items are stored in consumers’ pantries
Verbal and Pictorial Bar codes on product packagesRecords
Examples for Observed Phenomena
“YOU SEE, BUT YOU DO NOT OBSERVE.”
Sherlock Holmes
2. Advantages and Disadvantages of Observation

2.1. Benefits of Observing Human Behavior
• Communication with respondent is not necessary
• Data without distortions due to self-report (e.g.: without social desirability) Bias
• No need to rely on respondents memory
• Nonverbal behavior data may be obtained
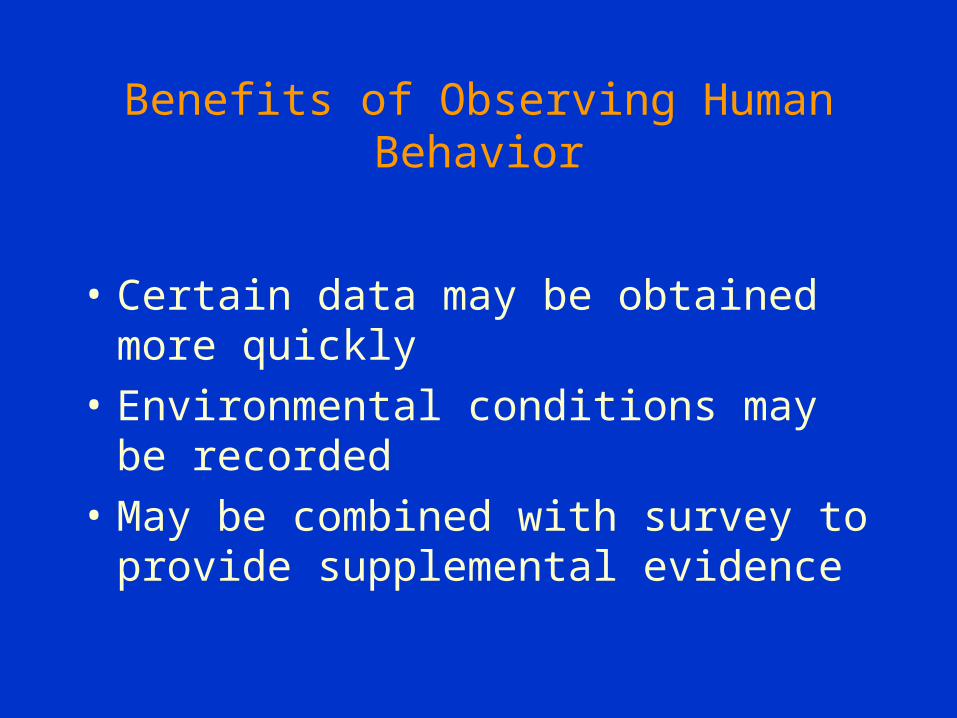
Benefits of Observing Human Behavior
• Certain data may be obtained more quickly
• Environmental conditions may be recorded
• May be combined with survey to provide supplemental evidence

2.2. Limitations of Observing Human Behavior
• Cognitive phenomena cannot be observed
• Interpretation of data may be a problem (e.g. misinterpretation)
• Not all activity can be recorded
• Only short periods can be observed
• Observer bias possible (e.g. selective perception)
• Possible invasion of privacy

sele
ctiv
e pe
rcep
tion

sele
ctiv
e pe
rcep
tion

mis
inte
rpre
tati
on
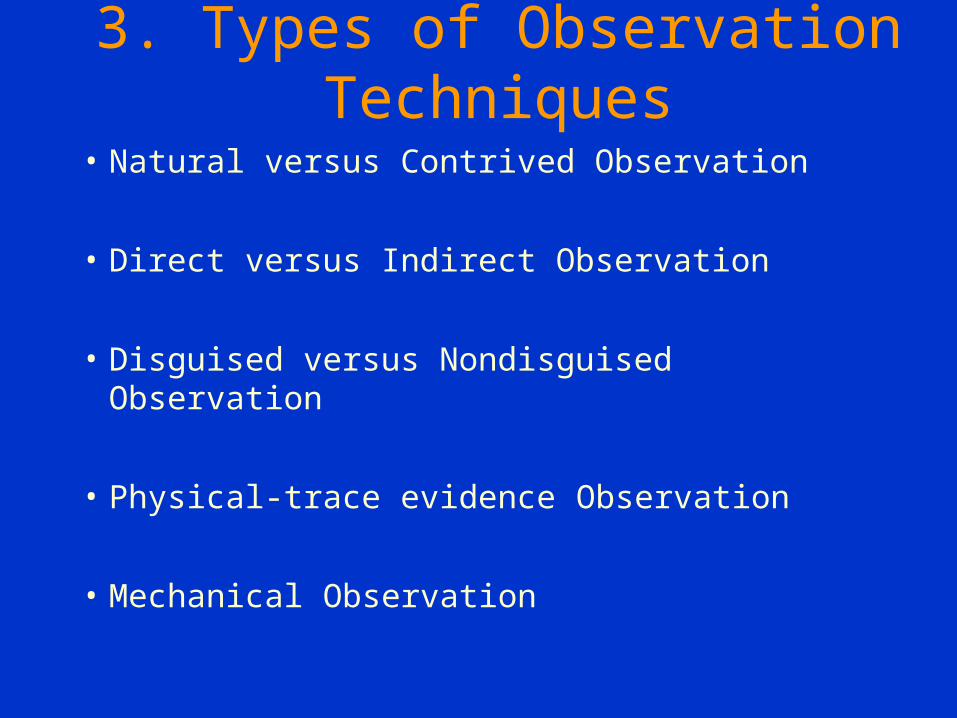
3. Types of Observation Techniques
• Natural versus Contrived Observation
• Direct versus Indirect Observation
• Disguised versus Nondisguised Observation
• Physical-trace evidence Observation
• Mechanical Observation
3.1.Natural versus Contrived Observation
Natural Observation:
• Reactions and behavior observed as they occur naturally in real-life situations
• A wide variety of companies are sending researchers to the field to observe consumers in their natural environment.
• Natural observation is also suited for ethnographic research on foreign cultures.

Contrived Observation:
• Environment artificially set up by the researcher.
• Researchers are increasingly relying on computers to conduct simulated market testing.
• Offers a greater degree of control – Speedy – Efficient – Less expensive
• However, it may be questionable as to whether or not the data collected does truly reflect a "real life" situation.

3.2. Direct versus Indirect Observation
Direct observation captures actual behavior or phenomenon of interest
Indirect observation consists of examining the results of the phenomenon.
• can give only relatively crude or imprecise indications of a phenomenon
• More efficient use of research time
• More efficient use of research budget
• May be the only way to get data from situations impractical to observe directly.
3.3. Disguised versus Nondisguised Observation
Nondisguised observation:
• Respondents are aware that they are being observed
• Data may be contaminated by respondent-induced errors.
• Data gathered through using disguised observation might not be as rich as those from nondisguised observation.

Disguised Observation
• Respondents are unaware they are being observed
• Allows for monitoring of the true reactions of individuals.
• Unethical if disguised observation monitors – Normally private behaviors – Behaviors that may not be voluntarily revealed to
researchers.
• Mystery shopping
– popular disguised observational technique
– Mystery shopper
• Unknown to the retail establishment
• Visits the store
• Uses a structured script
• Observes and records the shopping experience.

3.4. Physical-trace evidence Observation
• Wear and tear of a book indicates
how often it has been read
• garbology - looking for traces of purchase patterns in garbage
• detecting store traffic patterns by observing the wear in the floor (long term) or the dirt on the floor (short term)

3.5. Types of Mechanical Observation
• Eye-Tracking
• Response Latency
• Voice Pitch Analysis
• People Meter
• Psychogalvanometer
• Monitoring Web Site Traffic

Eye Tracking
Measures unconscious eye movements
Records how the subject actually reads or views an advertisement, product packaging, promotional displays, websites, etc.
Measures which sections attract customers' attention and how much time they spend looking at those sections
• Oculometers - what the subject is looking at • Pupilometers - how interested is the viewer (This
device observes and records changes in the diameter of the subject’s pupils)

Voice Pitch Analysis
• Measures emotional reactions through physiological changes in a person’s voice
• Used to determine – how strongly a respondent feels about an answer – how much emotional commitment is attached to an answer.
• Variations from normal voice pitch is considered a measure of emotional commitment to the question's answer.
Response Latency
• It measures the speed with which a respondent gives a decision about a choice between alternatives
• It records the decision time necessary to make this choice.
• For instance: it can measure the effectiveness of an advertisement on brand preferences.
• It assumes that a quick expression of brand preference indicates a stronger preference.

People Meter
• Electronic device to monitor television viewing behavior – who is watching – what shows are being watched.
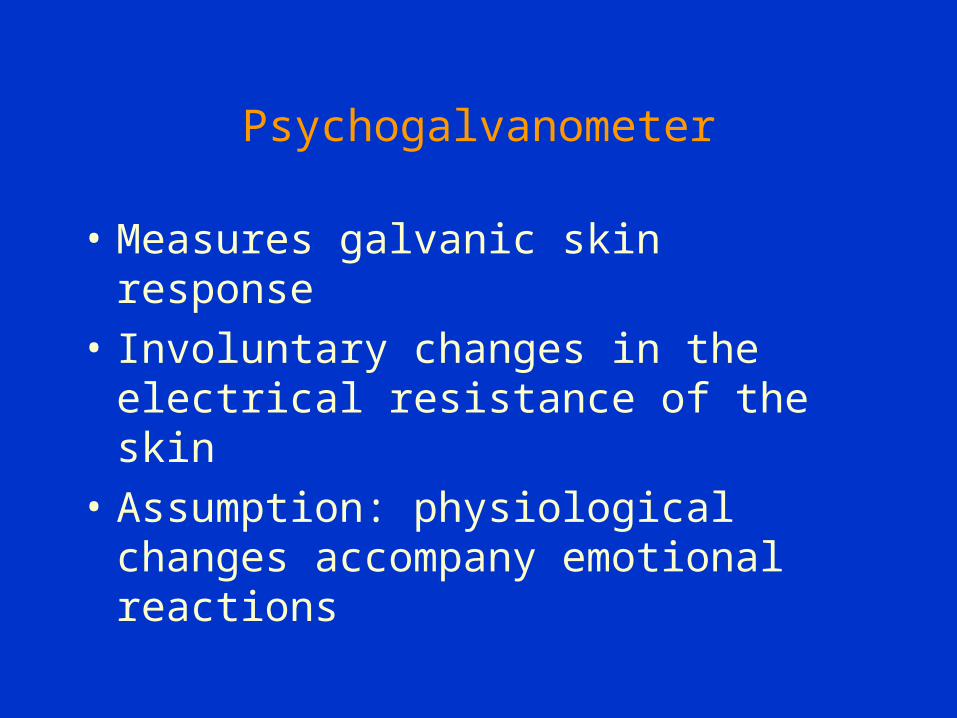
Psychogalvanometer
• Measures galvanic skin response
• Involuntary changes in the electrical resistance of the skin
• Assumption: physiological changes accompany emotional reactions

Business Research Methods
Donald R. Cooper and Pamela S. Schindler
Chapter 12.1.:
Basics of Experimental Research
Chapter 12.1.: Experimental Research
1. Basics of Experiment & Causality
2. Advantages and disadvantages of the experimental method
3. Steps of a well-planned experiment
4. Validity in experiments
1.Basics of Experiment & Causality
1.1. Definition of Experiment: An experiment is a study involving intervention by the researcher beyond that required for measurement.
The usual intervention is to manipulate some variable in a setting and observe how it affects the participants or subjects being studied.
There is at least one independent variable and one dependent variable in a causal relationship.

1.2. Causal Evidence
There are three types of evidence necessary to support causality.
Agreement between Independent and Dependent Variables
Time order of occurrence
Extraneous variables did not influence Dependent Variables

1.2.1. Agreement between Independent and Dependent Variables
First, there must be an agreement between independent and dependent variables.
The presence or absence of one is associated with the presence or absence of the other.

1.2.2. Time order of occurrence
Second, beyond the correlation of independent and dependent variables, we consider the time order of the occurrence of the variables.
The effect on the dependent variable should not precede the manipulation of the independent variable.
The effect and manipulation may occur simultaneously or the manipulation may occur before the effect.

1.2.3. Extraneous variables did not influence Dependent Variables
The third source of support comes when researchers are confident that other extraneous variables did not influence the dependent variable.
To ensure that these other variables are not the source of influence, researchers control their ability to confound the planned comparison.
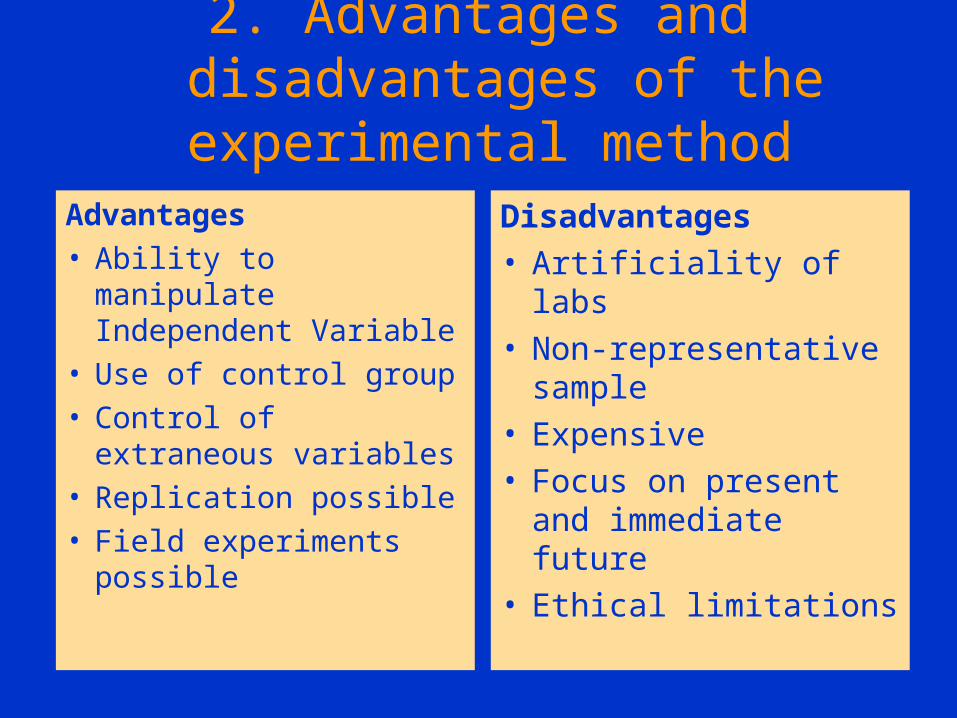
2. Advantages and disadvantages of the experimental method
Advantages• Ability to manipulate
Independent Variable• Use of control group• Control of extraneous
variables• Replication possible• Field experiments
possible
Disadvantages• Artificiality of labs• Non-representative
sample• Expensive• Focus on present and
immediate future• Ethical limitations

• Replication: is the process of repeating an experiment with different participant groups and conditions to determine the average effect of the Independent Variables across people, situations, and times.
• A field experiment: is a study of the dependent variable in actual environmental conditions.
2.1.Explanation of Some Advantages of Experiments

• The artificiality of a lab is possibly the greatest disadvantage of experiments.
• Also, experiments typically use small convenience samples which cannot be generalized to a larger population.
• Compared to surveys, they are expensive. • They also cannot deal with past events or predict
events in the far-off future. • Finally, marketing research is often concerned with
the study of people and there are limits to the types of manipulation and controls that are ethical.
2.2.Explanation of Some Disadvantages of Experiments

Specify treatment levels
Control environment
Choose experimental design
Select and assign participants
Pilot-test, revise, and test
Collect data
Analyze data
Specify treatment variables
3. Steps of a well-planned experiment


Steps of a well-planned experiment
The activities the researcher must accomplish to make an experiment a success:
3.1. Specify treatment variables:a) select variables that are the best operational definitions of the original concepts, b) determine how many variables to test, c) select or design appropriate measures for the chosen variables.
The selection of measures for testing requires a thorough review of the available literature and instruments.

3.2. Specify treatment levels:In an experiment, participants experience a manipulation of the independent variable, called the experimental treatment.
The treatment levels are the arbitrary or natural groups the researcher makes within the independent variable.
A control group is a group of participants that is measured but not exposed the independent variable being studied.
A control group can provide a base level for comparison.

3.3. Control environment:
Environmental control means holding the physical environment of the experiment constant. When participants do not know if they are receiving the experimental treatment, they are said to be blind.
When neither the participant nor the researcher knows, the experiment is said to be double-blind.
3.4. Choose experimental design:
The design is then selected. Several designs are discussed on the next several slides.

3.5. Select and assign participants:
The participants selected for the experiment should be representative of the population to which the researcher wishes to generalize the study’s results.
Random assignment is required to make the groups as comparable as possible.
Random assignment uses a randomized sample frame for assigning participants to experimental and control groups.
Matching is an equalizing process for assigning participants to experimental and control groups.
• 3.5.1. Random assignment :
• The sampling frame is often small for experiments and the participants may be self-selected.
• However, if randomization is used, those assigned to the experimental group are likely to be similar to those assigned to the control group.
• Random assignment allows one to make the groups as comparable as possible.
• It means that participants have an equal and known chance of being assigned to any of the groups in the experiment.

3.5.2. Matching :Matching is a control procedure to ensure that experimental and control groups are equated on one or more variables before the experiment.
The object of matching is to have each experimental and control participant matched on every characteristic used in the research. Matching employs a nonprobability quota sampling approach.
Quota matrix is a means of visualizing the matching process. If matching does not alleviate assignment problems, a combination of matching, randomization, and increasing the sample size may be useful.

Quota Matrix Example
Exhibit 10-3 presents an example of a quota matrix.
One-third of the participants from each cell of the matrix would be assigned to each of the tree groups.

4. Validity in Experimentation
Internal validity exists when the conclusions drawn about a demonstrated experimental relationship truly implies cause.
External validity exists when an observed causal relationship can be generalized across persons, settings, and times.

4.1.Threats to Internal Validity
There are twelve possible threats to internal validity:•History •Maturation •Testing •Instrumentation •Selection •Statistical regression •Experimental mortality •Diffusion or imitation of treatment •Compensatory equalization •Compensatory rivalry •Resentful Demoralization of the disadvantaged •Local history
http://cde.annauniv.edu/CourseMat/mba/sem2/dba1657/val.html

Threats to internal validity
•History: In the experimental designs a control measurement (O1) of dependent variable is taken before introducing the manipulation (X).
After the manipulation an after measurement (O2) of the dependent variable is taken. Then the difference between O1 and O2 is attributed to the manipulation. (See also One Group Pretest-Posttest Design)
However some events may occur during the course of the experimental study, which will affect the relationship between the variables under the study.

Threats to internal validity
•Maturation: Changes may also occur within the participant that are a function of the passage of time and are not specific to any particular event. •A participant may become hungry, bored, or tired and these conditions can affect response results.
•Testing: The process of taking a test can affect the scores of a second test. For instance, repeatedly taking (the same or similar) intelligence tests usually leads to score gains.

•Instrumentation: This threat to internal validity results from changes between observations in either the measuring instrument or the observer.
•Selection: Differential selection of subjects for experimental and control groups affects the validity. Validity considerations require the groups to be equivalent in every aspect.
The problem can be overcome by randomly assigning the subjects to experimental and control groups. In addition matching can be done. Matching the members of the groups on key factors also enhances the equivalence of the groups.
Threats to internal validity
•Statistical regression: This factor operates especially when groups have been selected by their extreme scores. •For example, when children with the worst reading scores are selected to participate in a reading course, improvements at the end of the course might not be due to the course's effectiveness.
•Experimental mortality: This occurs when the composition of the study groups changes during the test. Some participants may drop out the experiment.
Threats to internal validity

•Diffusion or imitation of treatment: If people in the experimental and control groups talk, then those in the control group may learn of the treatment. This eliminates the difference between the groups.
•Compensatory equalization: Where the experimental treatment is much more desirable for the experimental group, there may be an administrative reluctance to deprive the control group members. Actions to compensate the control group may confound the experiment.
Threats to internal validity

•Compensatory rivalry: This may occur when members of the control group know they are in the control group. This may generate competitive pressures, causing the control group members to try harder. (e.g. Hawthorne effect )
•Resentful demoralization of the disadvantaged: When the treatment is desirable and the experiment is conspicuous, control group members may become resentful that they are deprived and lower their cooperation and output.
Threats to internal validity

•Local history: The regular history effect already mentioned impacts both experimental and control groups alike.
When one assigns all experimental persons to one group session and all control group people to another, there is a chance for some peculiar event to confound results.
Threats to internal validity
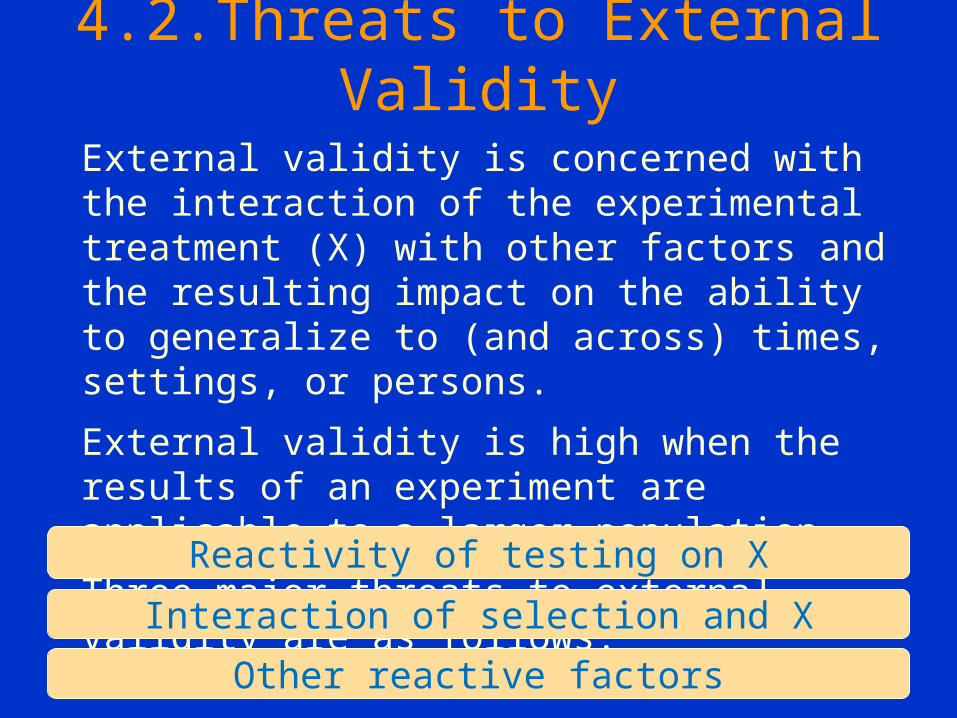
4.2.Threats to External Validity
External validity is concerned with the interaction of the experimental treatment (X) with other factors and the resulting impact on the ability to generalize to (and across) times, settings, or persons.
External validity is high when the results of an experiment are applicable to a larger population.
Three major threats to external validity are as follows:
Reactivity of testing on X
Interaction of selection and X
Other reactive factors

Reactivity of testing on X
• The reactive effect refers to sensitizing participants via a pretest so that they respond to the experimental stimulus (X) in a different way.
•For instance, people who participate in a web survey may then be sensitized to store displays and organization.

Interaction of selection and X
The process by which test participants are selected for an experiment may be a threat to external validity.
The population from which one selects participants may not be the same as the population to which one wishes to generalize the results.
It limits the generalizability of the findings.

Other reactive factors
•The experimental settings themselves may have a biasing effect on a participant’s response to X.
•An artificial setting can produce results that are not representative of larger populations.
•If participants know they are participating in an experiment, there may be a tendency to role-play in a way that distorts the effects of X.
•Another reactive effect is the possible interaction between X and participant characteristics.

Business Research Methods
Donald R. Cooper and Pamela S. Schindler
Chapter 12.2.:
Types of Experimental Research Designs

Chapter 12.2.: Types of Experimental
Research Designs
1. Pre-experiments
2. True experiments
3. Field experiments
•X refers to the treatment or manipulation of the independent variable (more than one X refers to a different level of treatment).
•O refers to the observation or measurement of the dependent variable.
•Experimental designs vary widely in their power to control contamination of the relationship between the independent and dependent variables.
•Experiments can be categorized as pre-experiments, true experiments, and field experiments based on the characteristic of control.

1. Pre-experiment
Pre-experimental research designs are research designs that are characterized by a lack of random selection and assignment.
Types of Pre-experiments:•After-Only Case Study•One Group Pretest-Posttest Design•Static Group Comparison

1.1. After-Only Case Study
X O
• In this type of experimental design only one treatment (X) or manipulation is done on the independent variable.
• Then, the dependent variable is measured.

An example is a media campaign about a product’s features without a prior measurement of consumer knowledge.
Results would reveal only how much target consumers know after the media campaign, but there is no way to judge the effectiveness of the campaign.
The lack of a pretest and control group makes this design inadequate for establishing causality.
X O
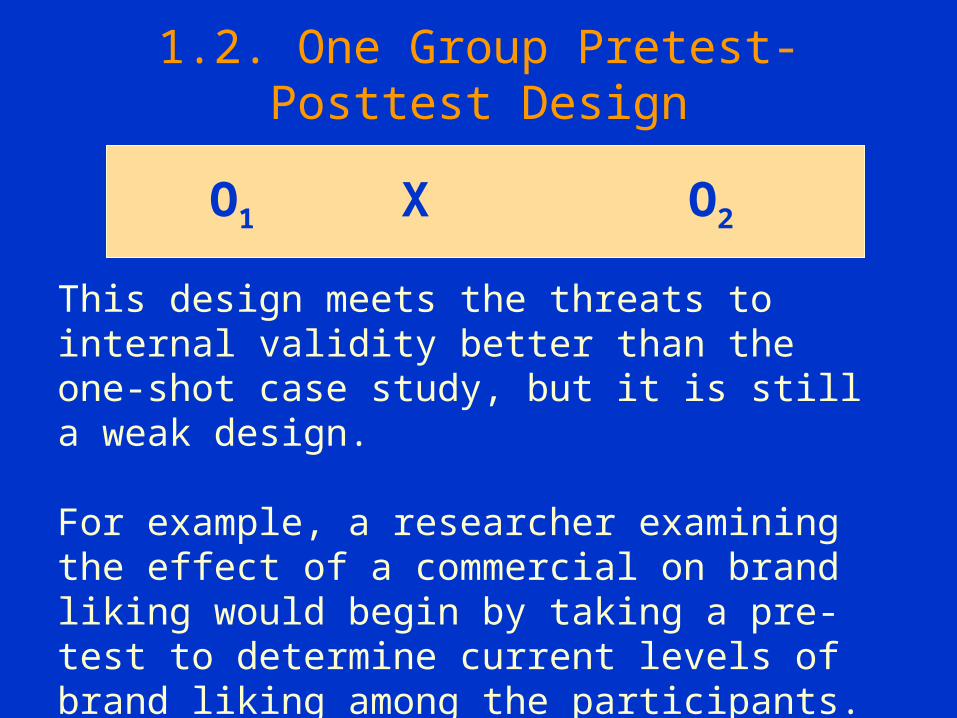
1.2. One Group Pretest-Posttest Design
O1 X O2
This design meets the threats to internal validity better than the one-shot case study, but it is still a weak design.
For example, a researcher examining the effect of a commercial on brand liking would begin by taking a pre-test to determine current levels of brand liking among the participants.

The commercial would be shown.
Then a post-test would measure brand liking after the commercial.
A comparison between the post-test and the pre-test shows the change in liking.
However, any changes in liking are not necessarily due to the commercial.
The act of giving a pre-test could have influenced liking (testing effect).
O1 X O2
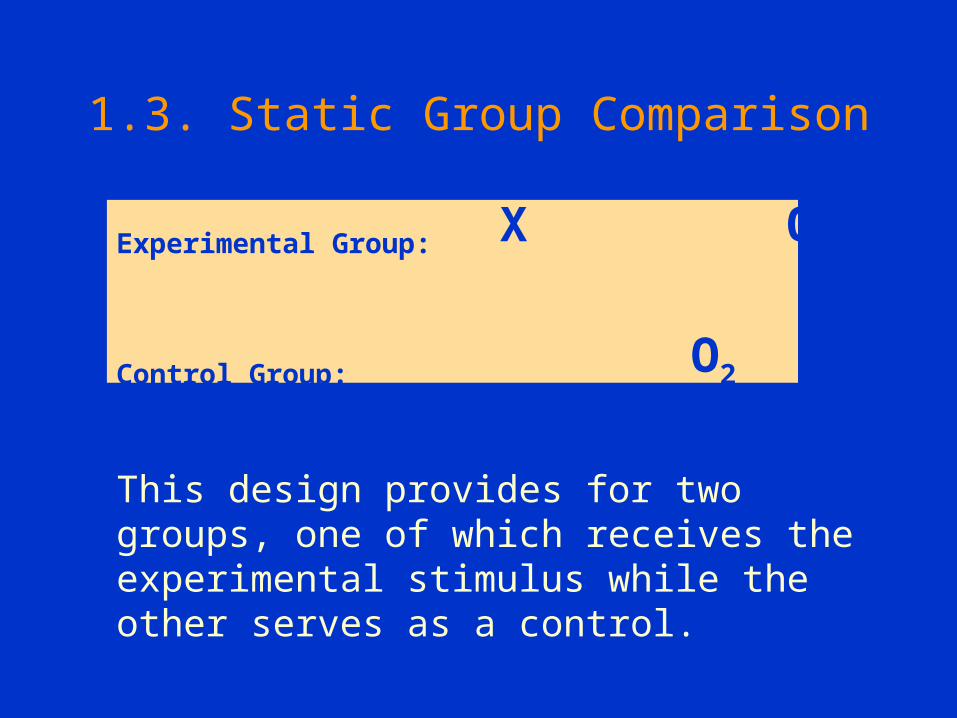
1.3. Static Group Comparison
Experimental Group: X O1
Control Group: O2
This design provides for two groups, one of which receives the experimental stimulus while the other serves as a control.

For example, imagine that a new type of cheeseburger is being introduced, and an advertisement campaign is run.
After the ad airs, those who remember seeing it would be in the experimental group (X). Those who have no recall of the ad would be in the control group.
The intent of each group to purchase the cheeseburger would be measured.
The main weakness of this design is that there is no way to be certain that the two groups are equivalent or that the individuals are representative.

2. True experiment• A true experiment is a method of social research in
which there are two kinds of variables. The independent variable is manipulated by the experimenter, and the dependent variable is measured.
• The signifying characteristic of a true experiment is that it randomly allocates the subjects in order to neutralize the potential to ensure equivalence.
• There is also a control group for comparison.
Types of True experiments: • Pretest-Posttest Control Group Design• Posttest-Only Control Group Design
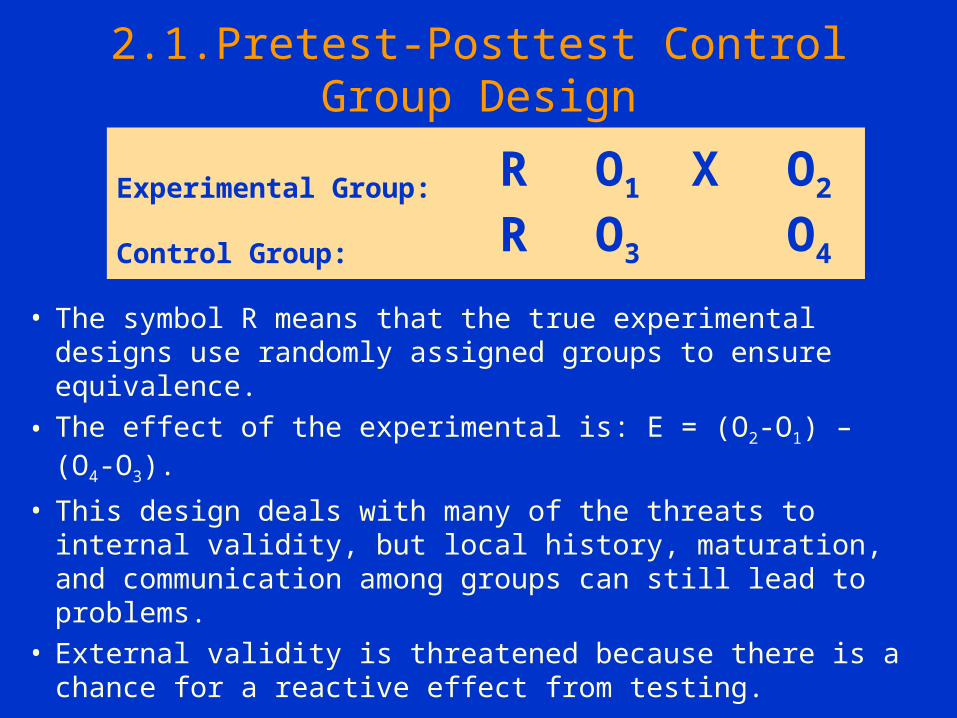
2.1.Pretest-Posttest Control Group Design
• The symbol R means that the true experimental designs use randomly assigned groups to ensure equivalence.
• The effect of the experimental is: E = (O2-O1) – (O4-O3).
• This design deals with many of the threats to internal validity, but local history, maturation, and communication among groups can still lead to problems.
• External validity is threatened because there is a chance for a reactive effect from testing.
Experimental Group: R O1 X O2
Control Group: R O3 O4
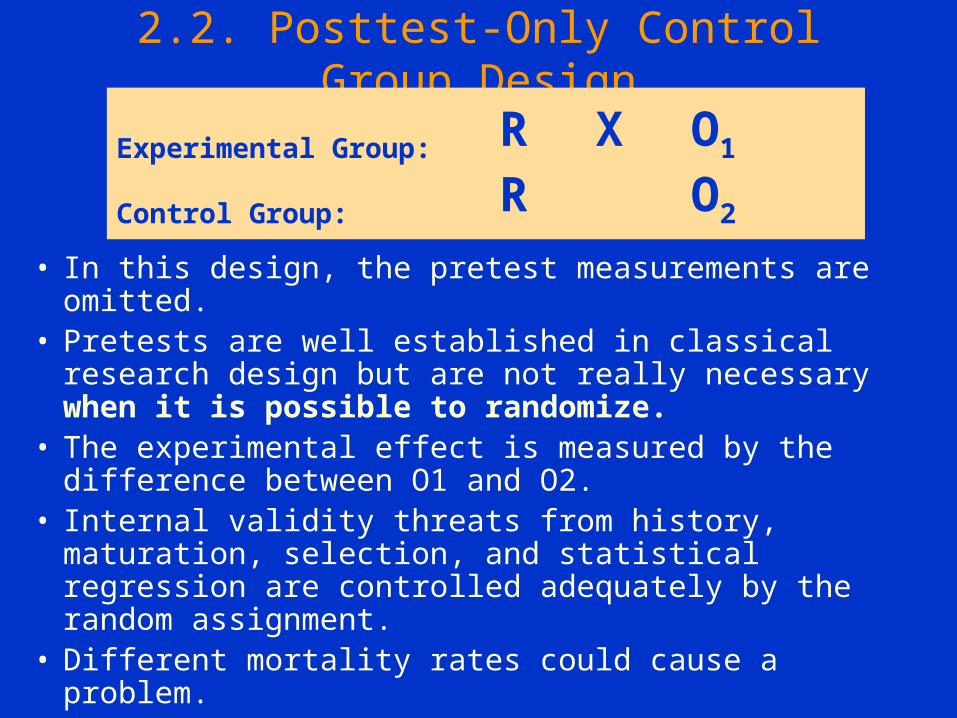
2.2. Posttest-Only Control Group Design
• In this design, the pretest measurements are omitted. • Pretests are well established in classical research design
but are not really necessary when it is possible to randomize.
• The experimental effect is measured by the difference between O1 and O2.
• Internal validity threats from history, maturation, selection, and statistical regression are controlled adequately by the random assignment.
• Different mortality rates could cause a problem.
Experimental Group: R X O1
Control Group: R O2

• Buick dealerships wish to determine the effectiveness of a special “test-drive” incentive.
• Buick dealerships nationwide are randomly assigned to either the control group or the experimental group.
• Those in the experimental group use a promotion to encourage test drives.
• The control group does not use any such promotions. • The number of test drives throughout are measured
and compared to determine if the promotion resulted in significantly more test drives.
Example for Posttest-Only Control Group Design

3. Field experiment
• Experiment conducted in a natural setting (e.g. on a sports field during play). The conditions of field experiments are usually very difficult to replicate.
Types of Field experiments:
• Nonequivalent Control Group Design
• Separate Sample Pretest-Posttest Design
• Group Time Series Design

3.1. Nonequivalent Control Group Design
• This is a strong and widely used quasi-experimental design.
• It differs from the pretest and posttest control group design because the test and control groups are not randomly assigned.
• There are two varieties: intact equivalent design and self-selected experimental group design.
Experimental Group: O1 X O2
Control Group: O3 O4

Nonequivalent Control Group Design
• In the intact equivalent design, the membership of the experimental and control groups is naturally assembled.
• The self-selected experimental group design is weaker because volunteers are recruited to form the experimental group, while non-volunteer participants are used for control.
• A comparison of the pretest results for each group is one indicator of the degree of equivalence between test and control groups.

Example for Nonequivalent Control Group Design
• For example, children from two different classes in school may be asked to test a toy.
• Participants are pre-tested on their interest in the toy. • The experimental group spends time playing with the
toy while the control group is not exposed to the toy. • A post-test then measures interest in the toy.

3.2.Separate Sample Pretest-Posttest Design
• This design is most applicable when we cannot know when and to whom to introduce the treatment but we can decide when and whom to measure.
• The parenthesized treatment (X) means that the experimenter cannot control exposure to the treatment.
• This is not a strong design because several threats to internal validity are not handled adequately.
• History can confound the results.
Experimental Group: R O1 (X)
Control Group: R X O2
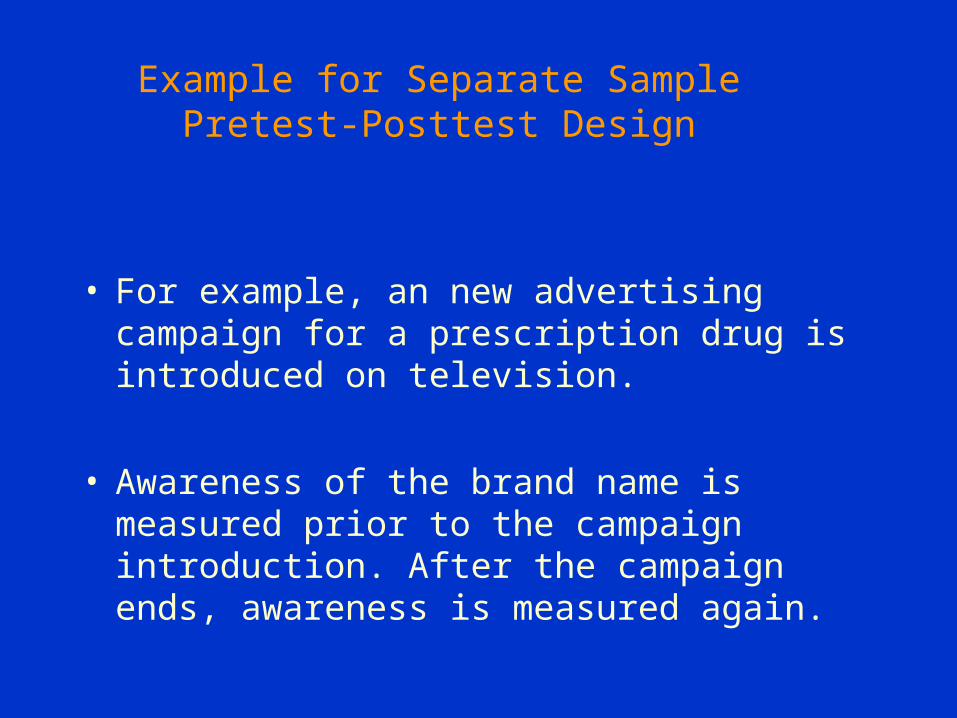
Example for Separate Sample Pretest-Posttest Design
• For example, an new advertising campaign for a prescription drug is introduced on television.
• Awareness of the brand name is measured prior to the campaign introduction. After the campaign ends, awareness is measured again.
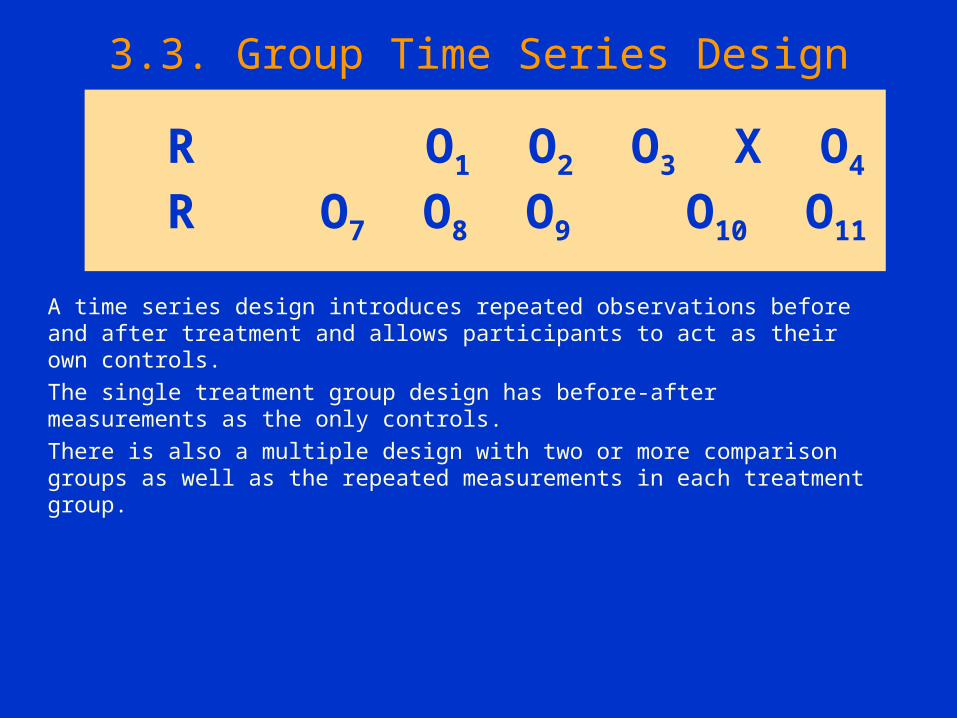
3.3. Group Time Series Design
A time series design introduces repeated observations before and after treatment and allows participants to act as their own controls.
The single treatment group design has before-after measurements as the only controls.
There is also a multiple design with two or more comparison groups as well as the repeated measurements in each treatment group.
R O1 O2 O3 X O4 O5 O6
R O7 O8 O9 O10 O11 O12

• This format is especially useful where regularly kept records are a natural part of the environment and are unlikely to be reactive.
• The time series approach is also good way to study unplanned events in an ex post facto manner.
• The internal validity problem for this design is history. To reduce this risk, we keep a record of possible extraneous factors and attempt to adjust the result to reflect their influence.
• For example, if the government were to begin price controls, we could still study the effects of this action on gasoline prices later if we had regularly collected records for the period before and after the advent of price control.