burpengary meadows state school (5553) … department of education, training and employment...
TRANSCRIPT

T
DEPARTMENT OF EDUCATION, TRAINING AND EMPLOYMENT
Burpengary Meadows State School (5553)
Queensland State School Reporting
2012 School Annual Report
YPEOVER TO INSERT SCHOOL NAME
Postal address 153 Rowley Road Burpengary 4505
Phone (07) 3491 4333
Fax (07) 3491 4300
Email [email protected]
Webpages Additional reporting information pertaining to Queensland state schools is located on the My School website and the Queensland Government data website.
Contact Person Elizabeth Mackie
Introduction
Burpengary Meadows State School is situated in a semi-rural, acreage, on the catchment of Burpengary Creek and overlooks the CREEC Environmental Education Centre. The school opened in 2007 with a student enrolment of 280. Art and Music featured heavily in our very busy year with the Choir, Gleeks and Strings Ensembles performing at many school functions throughout the year. School Concert, Senior Leader Fair Day, Instrumental Concert, Easter Hat Parade and Art Auction were also great fun ways to celebrate student‟s artistic and creative excellence. Students attended interschool sport and represented the school ethos admirably at various levels across a range of team and individual sports.
A number of enhancements were made in areas of teaching and learning to implement the new Australian Curriculum in English, Maths and Science and to continue student access to consistency, comparability and accountability. Inclusivity and diversity were also areas considered in relation to strategy and program development.
Our dedicated staff continued to work very hard to establish and maintain school customs and cultures, develop routines and practices whilst ensuring that the curriculum and assessment practices responded to the needs of our students. Annual events and special or celebratory days provided visual demonstration that the kind and caring supportive school environment established through our school ethos; Respect, Believe, Strive, continued to prosper.
Student council and leaders developed leadership skills, mentoring and providing exemplary example by taking carriage of parade and many school functions in addition to fund raising ventures for those in need. Our school ethos and behaviours are now well established and students and parents value the calm, respectful teaching and learning environment which has been established at “The Meadows”.
School progress towards its goals in 2012
Overview
Aligned with the school‟s four year Strategic Plan developed in 2009, and in response to the Teaching and Learning Audit conducted in late 2010, the 2012 school year continued our focus on improving student outcomes through the BMSS Improvement Agenda. Focus areas in 2012 were:
Improvement of student performance in Mathematics and Grammar and Punctuation
Consolidate reading and spelling programs
Skilling staff in line with strategic priorities
Embed school programs that support C2C as the vehicle to implement National Curriculum - English, Maths and Science
Realign teacher aide resources prioritising hours for literacy to early years reading and spelling.
Significant Strategies, Enhancements and Achievements in 2012
1. The development of „Non-Negotiable‟ classroom practices for the teaching of Reading and Spelling.
2. Professional development for teachers that included:
First Steps Maths training for all teaching staff
Grammar and Punctuation PD and expert modelling in classrooms to standardise programs and de-privatise practice
Implement school-wide consistent timetable for reading, spelling and maths
Embedded into class routine - school-wide Spelling Program (Words Their Way)
DEPARTMENT OF EDUCATION, TRAINING AND EMPLOYMENT
Queensland State School Reporting
2012 School Annual Report
Staff sharing best practice. 3. Continuation of school-funded, collaborative planning meetings each term. In alignment with Roadmap and ACARA, significant
changes to the planning process included:
Increased focus on discrete subject areas (and allocated times) particularly in English, Maths and Science
Full implementation of C2C Units (Australian Curriculum) in English and Maths and Science
Prepare for implementation of ACARA History
Reduced focus on „Integrated Studies‟
Increased requirements for consistency of planning and adjustments by all teaching staff for all students.
4. Assessment Schedule to explicitly define:
Additional school-based tracking tools and data collections for all Year levels – particularly in English, Maths and Science (e.g. PAT-R, TORC etc)
Systemic data collections (NAPLAN, QCATs etc)
What, how and when to moderate.
5. Review and update school‟s Curriculum Plan to comply with ACARA (C2C), QCARF and Roadmap 6. Improvement Agenda Meetings - in Terms One and Four, the Principal and Deputy met with individual classroom teachers using
school-based and systemic data to:
Identify student needs and develop strategies to „add value‟ to every student‟s performance, 2012 focus on Maths and Grammar and Punctuation while continuing 2011 Reading and Spelling
Plan for improvement in NAPLAN performance
Review classroom practices to ensure data analysis impacts are reflected in classroom practice.
7. The school leadership team continue commitment to being involved in classrooms to establish expectations regarding effective teaching practices (English, Maths & Science), communicate them to staff and monitor implementation.
8. Continued development and implementation of the „Plugging The Gaps‟ Strategy (ST L&N) to identify and target support for students requiring support, monitor their level of need and track their progress (and program effectiveness).
9. Centralisation of Learning Support by allocating the design and implementation of all funded Intervention strategies to the ST L&N
(in consultation with the Principal). 10. Speech and Language Pathology (SLP) screening of Prep students to ensure early identification of developmental needs that
impact on learning. Apply resources to support interventions for those identified. 11. Effectiveness evaluated and reported to staff and parents. 12. Enhancement of the BMSS Gifted and Talented Education Program to articulate consistent expectations for classroom-based
differentiated curriculum and teaching practice.
DEPARTMENT OF EDUCATION, TRAINING AND EMPLOYMENT
Queensland State School Reporting
2012 School Annual Report
Future outlook
Overview
Continued Improvement Agenda in 2013. Focus points include:
Full implementation of the Australian Curriculum in English, Maths, Science and History
Continue expansion of further targeting of intervention programmes and deliver on differentiation for high achieving students
Celebrate success
One Laptop per Child for year 2 – literacy, numeracy and science through ICT
Focus on the teaching of Numeracy, Grammar/Punctuation and Science while reviewing reading, and spelling
Implementation The Art and Science of Teaching as pedagogical framework
Staff improvement – PD – DPF - Professional Learning Communities
LOTE for years 5, 6 & 7.
Significant Strategies and Enhancements planned for 2013
1. Continue ACARA through C2C units to suit the context of the classroom, the whole-school commitment to two units each term and the common assessment pieces.
2. Review „Non-Negotiable‟ classroom practices for the teaching of Reading, Spelling and develop them for Numeracy, Grammar/Punctuation and Science.
3. Continue focus on events that enable school calendar to continue major focus on Reading, Spelling, Writing, Grammar &
Punctuation, Maths, Science and History. 4. Professional development for teachers to include:
Working with the District Advisory Teacher for Reading and spelling and writing while consolidating One Step Maths
Working with the District Advisory Teacher for Science, Maths, English and History and participate in strategy to enhance classroom practice (including modelled lessons or co-teaching);
Participation in seminars and viewing modelled lessons to enhance the teaching of Grammar and Punctuation aligned with the new school program.
5. Continue to develop quality literature collection in school library and student home reading program (P-3+).
6. School-wide library lessons with a C2C focus on creativity, literature, research and general library knowledge as determined. 7. Continue „Early Intervention‟ Processes with additional early years program and consolidation of intense and explicit literacy
strategies to “Plug the Gaps”. 8. Identify Gifted and Talented students. 9. Identify opportunities for extending high achieving and „gifted and talented‟ students.

Our school at a glance
School Profile
Coeducational or single sex: Coeducational
Year levels offered in 2012: Prep - Year 7
Total student enrolments for this school:
Total Girls Boys
Enrolment Continuity
(Feb – Nov)
2010 525 254 271 95%
2011 532 264 268 97%
2012 533 276 257 96%
Student counts are based on the Census (August) enrolment collection.
Characteristics of the student body:
The catchment area for students from Burpengary Meadows State School consists of a mixture of urban and acreage. Families are aspirational and contribute much thought and time to assist children in understanding their environment and positioning them as young aspirant adults with social conscience.
Average Class sizes
Phase
Average Class Size
2010 2011 2012
Prep – Year 3 23 23 20
Year 4 – Year 10 25 25 25
Year 11 – Year 12
School Disciplinary Absences
Disciplinary Absences
Count of Incidents
2010 2011 2012
Short Suspensions - 1 to 5 days 1 4 3
Long Suspensions - 6 to 20 days 0 0 0
Exclusions 0 0 0
Cancellations of Enrolment 0 0 0

Our school at a glance
Curriculum offerings
Our distinctive curriculum offerings:
Literacy and Numeracy „Blocks‟ for English and Mathematics
Intervention Programs - Learning Support and Special Needs
Instrumental Music – Strings, Brass, Woodwind and Percussion
Japanese (LOTE) in Years 6 & 7
High School Transition Program – Narangba Valley SHS
Camps for Years 4 to 7 (Every two years).
Extra curricula activities
School Choir
„Gleeks‟ (Singing Group)
Strings Ensemble
Concert Band
School Cluster Speaking Competition
Opti-Minds
„The Friendlies‟ Interschool Sports Program for Years 6 & 7
„Student Leadership Development Program‟ for students in Years 6 & 7
Netiquette – Cyber safety and appropriate use of social media
Participation in international competitions for Writing, Spelling, English, Mathematics, Computer Skills and Science (ICAS).
How Information and Communication Technologies are used to assist learning
Information Communication Technologies are an integrated part of everyday teaching and learning at BMSS. Smart Boards are utilised in every classroom to enhance learning, integrating the latest technologies in all aspects of curriculum. Along with the integrated use of interactive whiteboard technologies, each middle-phase classroom has access to an adjoining computer lab equipped with web-enabled computers and printer access.
This access enables all students to utilise ICTs to research and produce published work using digital technologies.
Social climate
The social climate of Burpengary Meadows State School is identified in staff, parent and student surveys as supportive and encouraging. Important contributing factors include:
1. Positive behaviour program that celebrates and rewards responsible, self-managing behaviour 2. Strong anti-bullying program and annual anti-bullying audit 3. Chaplaincy Program that supports students with pastoral care and events, building personal resilience and accountability,
relationships, social skills and responsibility 4. P&C Room within the school 5. Parent participation and involvement 6. Chaplaincy morning tea and play for parents of P-5 year old children once a term 7. Breakfast Club for all students two times per term 8. Functions such as: Chaplaincy Disco, Under 8‟s Day, Mateship Day, Shave for a Cure 9. The Learning Enhancement Committee that identifies and supports student needs via referral to appropriate agencies and
resources 10. Indigenous Community Advisor – working to enhance understands for all students tolerance, inclusivity 11. Lunchtime games room, outdoor chess area, play facilities 12. Social skilling programs 13. The Student Leadership Roles and Responsibilities – supporting and nurturing younger students 14. Priority and focus – student centred and focused on understanding, nurture and support.

Our school at a glance
Parent, student and staff satisfaction with the school
In the 2012 School Opinion Survey, parents, students and staff expressed satisfaction that is at least equal to, and frequently beyond the state average in all areas (at Summary Level).
This is also true when considering the five performance measures of the School Planning, Reporting and Reviewing Framework listed below.
Performance measure (Nationally agreed items shown*)
Percentage of parents/caregivers who agree that: 2012#
their child is getting a good education at school 96.4%
this is a good school 96.6%
their child likes being at this school* 100.0%
their child feels safe at this school* 96.6%
their child's learning needs are being met at this school* 86.2%
their child is making good progress at this school* 93.1%
teachers at this school expect their child to do his or her best* 100.0%
teachers at this school provide their child with useful feedback about his or her school work* 96.4%
teachers at this school motivate their child to learn* 100.0%
teachers at this school treat students fairly* 100.0%
they can talk to their child's teachers about their concerns* 96.4%
this school works with them to support their child's learning* 96.6%
this school takes parents' opinions seriously* 92.9%
student behaviour is well managed at this school* 96.6%
this school looks for ways to improve* 100.0%
this school is well maintained* 100.0%
Performance measure (Nationally agreed items shown*)
Percentage of students who agree that: 2012#
they are getting a good education at school 90.5%
they like being at their school* 89.5%
they feel safe at their school* 91.4%
their teachers motivate them to learn* 97.1%
their teachers expect them to do their best* 97.1%
Our school at a glance
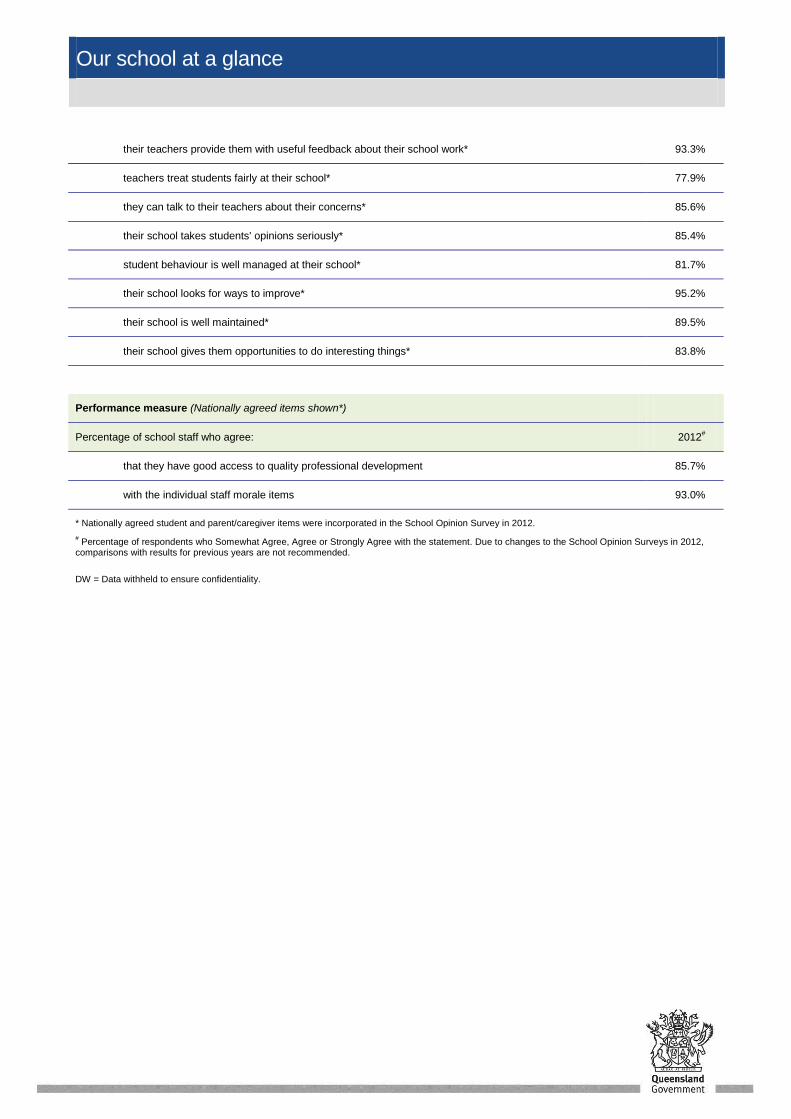
their teachers provide them with useful feedback about their school work* 93.3%
teachers treat students fairly at their school* 77.9%
they can talk to their teachers about their concerns* 85.6%
their school takes students' opinions seriously* 85.4%
student behaviour is well managed at their school* 81.7%
their school looks for ways to improve* 95.2%
their school is well maintained* 89.5%
their school gives them opportunities to do interesting things* 83.8%
Performance measure (Nationally agreed items shown*)
Percentage of school staff who agree: 2012#
that they have good access to quality professional development 85.7%
with the individual staff morale items 93.0%
* Nationally agreed student and parent/caregiver items were incorporated in the School Opinion Survey in 2012.
# Percentage of respondents who Somewhat Agree, Agree or Strongly Agree with the statement. Due to changes to the School Opinion Surveys in 2012,
comparisons with results for previous years are not recommended.
DW = Data withheld to ensure confidentiality.

Our school at a glance
Involving parents in their child’s education
Our school community is highly committed to their children‟s education and strives to provide assistance for the school to provide experiences that will develop students to their potential as capable and responsible young adults who independently contribute to society.
Our “Respect, Believe, Strive” ethos underpins an amazing school culture where students, teachers and families work together believing in what is possible and striving for excellence. During the 2012 school year significant examples included:
1. Parents continued to be involved in assisting in classrooms on a roster system
2. Teachers ran workshops to train parents in “Sounds to Letters”, “Support-a-Reader” and “Support-a-Talker” 3. Parents attended celebration parades each term to celebrate student achievements 4. Parent Chaplaincy coffee and chat 5. School provides Positive Parenting Program 6. Open transparent communication – formal and informal communication 7. Parents and Citizens Association support strategic direction and strategies that focus on student improvement 8. There were a number of functions across the year, including Parent Information Sessions, Parent Teacher Interviews, Under 8‟s
Day, Class Learning Celebrations, Sports Days, the School Concert and the Art Auction that enabled parents and carers to share in the child‟s education
9. Parents volunteered to support school banking, home readers, tuckshop, uniform shop, stalls, fundraisers and various activities
around the school to assist both students and teachers 10. A fantastic celebration morning tea, hosted by the Parents and Citizens Association, was held in term 4 to thank parent helpers.
Reducing the school’s environmental footprint
Data is sourced from school's annual utilities return and is reliant on the accuracy of these returns.
The school continues to minimise its environmental footprint through:
1. Passive thermal cooling of well-planned buildings 2. Utilising treated sewage for underground irrigation for the oval 3. Rainwater tanks to irrigate our landscaped gardens 4. The installation of solar panels to offset the use of air-conditioning in temporary buildings 5. Installation of small rainwater tanks to assist Prep and Middle School with growing vegetables 6. The installation of a large pump to move waste and (spring) ground water from the hall to the sewage plant, with heavy rainfall, is
heavy on electricity.
Environmental footprint indicators
Electricity kWh
Water kL
2009-2010 5,770 0
2010-2011 116,782 865
2011-2012 214,996 1,358

Our staff profile
Staff composition, including Indigenous staff
2012 Workforce Composition
Teaching Staff
Non-teaching Staff
Indigenous Staff
Headcounts 35 23 <5
Full-time equivalents 30.6 14.6 <5
Qualifications of all teachers
Highest level of
attainment
Number of
classroom
teachers and
school leaders
at the school
Doctorate 0
Masters 2
Bachelor degree 31
Diploma 3
Certificate
05
101520253035
0 2
31
30
Doctorate Masters
Bachelor degree Diploma
Certificate
Expenditure on and teacher participation in professional development
The total funds expended on teacher professional development in 2012 were $21,056.49. The major professional development initiatives are as follows:
Mentoring, Sharing Best Practice, First Step Maths, Grammar and Punctuation, Embedding Indigenous Perspectives, Code of Conduct, Student Protection, Cleaning, Business Services Manager, Team Planning, Schools Officer, Special Needs, ASD, First Aide, Science Spark, Asbestos. The proportion of the teaching staff involved in professional development activities during 2012 was 100%.
Average staff attendance 2010 2011 2012
Staff attendance for permanent and temporary staff and school leaders. 95.9% 96.4% 95.6%

Our staff profile
Proportion of staff retained from the previous school year
From the end of the previous school year, 93.5% of staff was retained by the school for the entire 2012 school year.
School income broken down by funding source
School income broken down by funding source is available via the My School website at http://www.myschool.edu.au/.
To access our income details, click on the My School link above. You will then be taken to the My School website with the following „Find a school’ text box.
Where it says ‘Search by school name’, type in the name of the school you wish to view, and select <GO>. Read and follow the instructions on the next screen; you will be asked to accept the Terms of Use and Privacy Policy before being given access to the school‟s My School entry web page.
School financial information is available by selecting ‘School finances’ in the menu box in the top left corner of the school‟s entry web page. If you are unable to access the internet, please contact the school for a paper copy of income by funding source.
Performance of our students
Key student outcomes
e
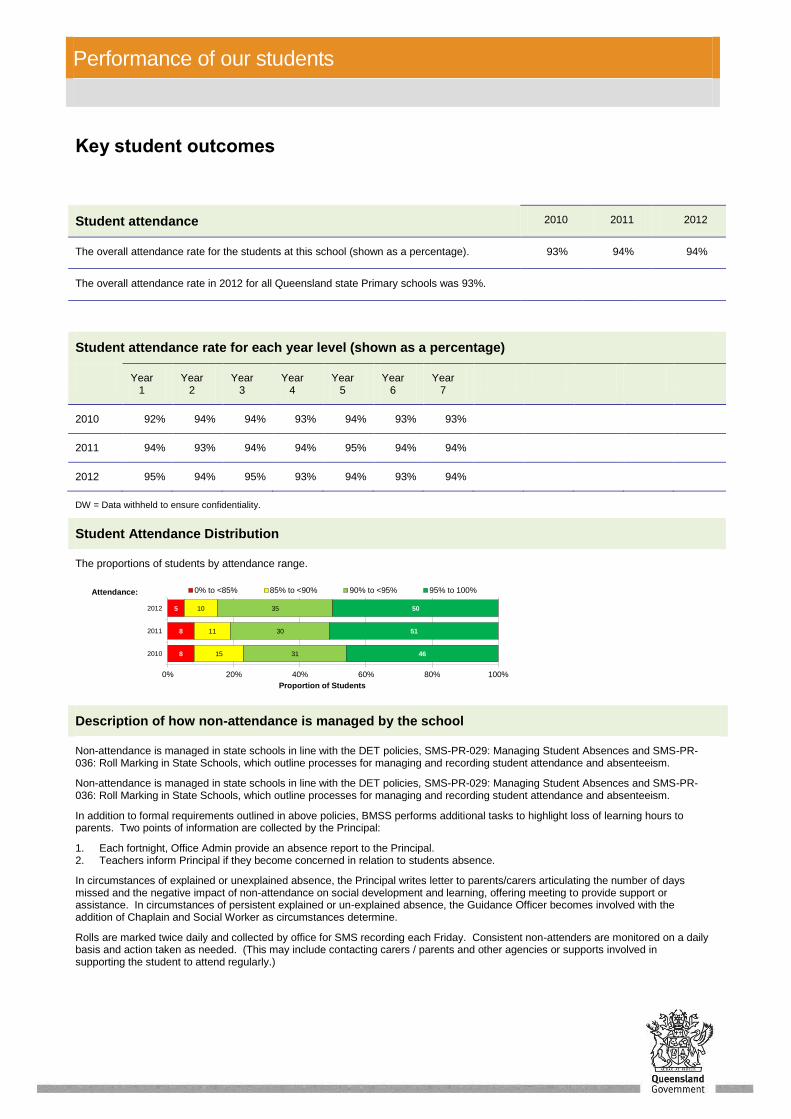
Student attendance 2010 2011 2012
The overall attendance rate for the students at this school (shown as a percentage). 93% 94% 94%
The overall attendance rate in 2012 for all Queensland state Primary schools was 93%.
Student attendance rate for each year level (shown as a percentage)
Year 1
Year 2
Year 3
Year 4
Year 5
Year 6
Year 7
2010 92% 94% 94% 93% 94% 93% 93%
2011 94% 93% 94% 94% 95% 94% 94%
2012 95% 94% 95% 93% 94% 93% 94%
DW = Data withheld to ensure confidentiality.
Student Attendance Distribution
The proportions of students by attendance range.
8
8
5
15
11
10
31
30
35
46
51
50
0% 20% 40% 60% 80% 100%
2010
2011
2012
Proportion of Students
0% to <85% 85% to <90% 90% to <95% 95% to 100%Attendance:
Description of how non-attendance is managed by the school
Non-attendance is managed in state schools in line with the DET policies, SMS-PR-029: Managing Student Absences and SMS-PR-036: Roll Marking in State Schools, which outline processes for managing and recording student attendance and absenteeism.
Non-attendance is managed in state schools in line with the DET policies, SMS-PR-029: Managing Student Absences and SMS-PR-036: Roll Marking in State Schools, which outline processes for managing and recording student attendance and absenteeism.
In addition to formal requirements outlined in above policies, BMSS performs additional tasks to highlight loss of learning hours to parents. Two points of information are collected by the Principal:
1. Each fortnight, Office Admin provide an absence report to the Principal. 2. Teachers inform Principal if they become concerned in relation to students absence.
In circumstances of explained or unexplained absence, the Principal writes letter to parents/carers articulating the number of days missed and the negative impact of non-attendance on social development and learning, offering meeting to provide support or assistance. In circumstances of persistent explained or un-explained absence, the Guidance Officer becomes involved with the addition of Chaplain and Social Worker as circumstances determine.
Rolls are marked twice daily and collected by office for SMS recording each Friday. Consistent non-attenders are monitored on a daily basis and action taken as needed. (This may include contacting carers / parents and other agencies or supports involved in supporting the student to attend regularly.)

Performance of our students
National Assessment Program – Literacy and Numeracy (NAPLAN) results – our reading, writing, spelling, grammar and punctuation, and numeracy results for the Years 3, 5, 7 and 9.
Our reading, writing, spelling, grammar and punctuation, and numeracy results for the Years 3, 5, 7 and 9 are available via the My School website at http://www.myschool.edu.au/.
To access our NAPLAN results, click on the My School link above. You will then be taken to the My School website with the following „Find a school’ text box.
Where it says ‘Search by school name’, type in the name of the school whose NAPLAN results you wish to view, and select <GO>.
Read and follow the instructions on the next screen; you will be asked to accept the Terms of Use and Privacy Policy before being able to access NAPLAN data.
If you are unable to access the internet, please contact the school for a paper copy of our school‟s NAPLAN results.
Achievement – Closing the Gap
The Aboriginal and Torres Strait Islander students at Burpengary Meadows State School when compared against the state and national data, performed well. In many cases, they out-performed their non-indigenous peers at a school level. Attendance and attainment were excellent. There is no gap between attainment levels of Indigenous students and non-Indigenous peers.