burkholderia cenocepacia outer membrane vesicles (omvs) · outer membrane vesicles (omvs), secreted...
TRANSCRIPT

Development of new strategies for the purification of
Burkholderia cenocepacia outer membrane vesicles
(OMVs)
Margarida Correia Teles de Malafaia Novais
Thesis to obtain the Master of Science Degree in
Biological Engineering
Supervisors: Doctor Ana Margarida Nunes da Mata Pires de Azevedo
Doctor Dalila Madeira Nascimento Mil-Homens
Examination Committee
Chairperson: Professor Gabriel António Amaro Monteiro
Supervisor: Doctor Dalila Madeira Nascimento Mil-Homens
Member of the committee: Doctor Ana Gabriela Gonçalves Neves Gomes
December, 2015

―Nothing in life is to be feared, it is only to be understood. Now is the time to understand more, so that
we may fear less. ―
Marie Curie

I
Acknowledgments
I would like to take this opportunity to thank all the people who have made this thesis possible
and my time at IBB an unforgettable experience.
I would like to express my sincerest gratitude to my supervisors Doctor Ana Margarida
Azevedo and Doctor Dalila Mil-Homens, for their support, guidance encouragement, dedication,
friendship, availability to help me with my doubts and for the knowledge given during all this work.
A word of thanks goes to Doctor António Pedro Alves de Matos from Egas Moniz University
for his availability and assistance in transmission electron microscopy.
To all my lab colleagues Isabel Campos Pinto, Joana Bicudo, Sónia Alves, Inês Pinto, Sara
Rosa, Luca Lizzi, Emanuel Capela, Maria João Jacinto. Not only for your fellowship but also for
providing me with a highly supportive environment to carry out my research, for teaching and helping
me with lot of things and for making every day in the lab enjoyable!
To my wonderful friends Ana, João, Milita, Inês, Maria who have supported me over the past
years in my pursuit of completing my Master's degree.
I am especially grateful to my dear family for their constant support and encouragement all
these years. My parents and sister, thank you for your patience and unconditional love. Thank you to
my cousin Filipa for always giving me motivation and strength to face the problems and to achieve my
goals. A special thanks to my grandfather for all the wisdom and inspiration.

II
Resumo
As vesículas da membrana externa (OMVs), segregadas por bactérias Gram-negativas, são
estruturas esféricas de duas camadas, com um diâmetro variável entre 20-250 nm, ricas em
lipopolissacarídeos (LPS), fosfolípidos e proteínas da membrana externa. As OMVs de Burkholderia
cenocepacia purificadas têm mostrado potencial para aplicação em vacinas e na terapia antibiótica
para a Fibrose Quística (FQ). Actualmente, os processos de downstream são baseados em métodos
de centrifugação diferencial. Estes métodos apresentam baixos rendimentos, custos elevados e difícil
aumento de escala. Este estudo focou-se no desenvolvimento de novas estratégias para a separação
de OMVs das principais impurezas: o pili e os flagelos. Foram produzidas OMVs de uma estirpe de
Burkholderia cenocepacia de baixo rendimento, sendo concentradas no sobrenadante através de
uma ultrafiltração e sedimentadas por ultracentrifugação. Com vista a sua purificação, foram testadas
várias alternativas começando com a triagem de sistemas de duas fases aquosas (ATPS) com PEG-
Dextran, seguido do uso de PEG e um sal (sulfato de amónio/fosfato de potássio). A possibilidade de
separar as OMVs através da sua carga negativa foi investigada como método alternativo, utilizando-
se uma plataforma monolítica de aminas quaternárias. Foram também realizados testes usando a
cromatografia de exclusão molecular (SEC) com diferentes resinas comercialmente disponíveis,
tendo-se revelado um método eficaz. O uso de uma matrix de dextrano-poliacrilamida (Sephacryl)
permitiu atingir os melhores resultados de purificação.
Palavras-chave: vesículas da membrana externa, processos de purificação, sistemas de duas fases
aquosas, cromatografia de exclusão molecular, cromatografia monolítica.

III
Abstract
Outer membrane vesicles (OMVs), secreted by Gram-negative bacteria, are spherical
bilayered structures that range between 20-250 nm in diameter enriched with lipopolysaccharides
(LPS), phospholipids and outer membrane proteins. The purified OMVs of Burkholderia cenocepacia
have shown potential applications in vaccines and in antibiotic therapy in Cystic Fibrosis (CF).
Currently, the downstream processing is based on differential centrifugation methods. These methods
have low yields, high costs and they are difficult to scale-up. This study focused on the development of
new strategies to separate OMVs from the main impurities: cable pili and flagella. OMVs from a low-
yield strain of Burkholderia cenocepacia were produced, concentrated in the supernatant by
ultrafiltration and pelleted by ultracentrifugation. In order to purify them, were tested several
alternatives, starting from the screening of aqueous two-phase systems (ATPS) with PEG-Dextran,
followed by the using of PEG and a salt (ammonium sulfate/potassium phosphate). The possibility of
separate OMVs by their negative charge was investigated as an alternative method using a monolithic
platform with quaternary amines. Tests were also performed using size exclusion chromatography
(SEC) with different commercially available which revealed to be an effective method. The use of a
matrix of dextran-polyacrylamide (Sephacryl) achieved the best purification results.
Keywords: outer membrane vesicles, downstream processing, aqueous two-phase systems, size
exclusion chromatography, monolithic chromatography.

IV
Table of Contents
Acknowledgments .................................................................................................................................... I
Resumo ................................................................................................................................................... II
Abstract................................................................................................................................................... III
Table of Contents ................................................................................................................................... IV
List of Tables .......................................................................................................................................... VI
List of Figures ........................................................................................................................................ VII
List of Abbreviations ............................................................................................................................... IX
1. Introduction ....................................................................................................................................... 1
1.1 Burkholderia cepacia complex and Cystic Fibrosis ....................................................................... 1
1.2 Outer membrane vesicles (OMVs): an overview ..................................................................... 3
1.3 Multifaceted roles of OMVs ........................................................................................................... 4
1.4 OMVs as Vaccine Carriers ............................................................................................................ 5
1.5 Production of OMVs ...................................................................................................................... 6
1.5.1 Mechanism and regulation ...................................................................................................... 6
1.5.2 Optimization of growth conditions and strains ........................................................................ 6
1.5.3 Detergent extraction process .................................................................................................. 7
1.6 Downstream processing of OMVs ........................................................................................... 8
1.6.1 Density gradient centrifugation ................................................................................................ 9
1.6.2 Ultrafiltration .......................................................................................................................... 10
1.7 Aqueous two-phase systems ...................................................................................................... 11
1.7.1 Two-phase formation ............................................................................................................ 11
1.7.2 Factors Influencing Partitioning ............................................................................................. 12
1.8 High-performance liquid chromatography (HPLC) ...................................................................... 13
1.8.1 Size-Exclusion chromatography (SEC) ................................................................................. 14
1.8.2 Ion-Exchange chromatography (IEX) .................................................................................... 19
1.9 Aqueous two-phase systems vs chromatography ....................................................................... 23
1.10 Background and aim of study .................................................................................................... 25
2. Materials and Methods ................................................................................................................... 26
2.1 Materials ...................................................................................................................................... 26

V
2.2 Bacterial strains and growth conditions ....................................................................................... 26
2.3 OMVs Isolation Steps .................................................................................................................. 27
2.3.1 OMVs Centrifugation ............................................................................................................. 27
2.3.2 Supernatant Ultrafiltration/Diafiltration .................................................................................. 27
2.3.3 Ultracentrifugation ................................................................................................................. 27
2.4 OMVs Purification Strategies ...................................................................................................... 28
2.4.1 Aqueous two-phase Systems ................................................................................................ 28
2.4.2 Aqueous Two-Phase Extraction ............................................................................................ 29
2.4.3 Size Exclusion Chromatography (SEC) ................................................................................ 29
2.4.4. Ion-Exchange Chromatography (IEX) .................................................................................. 30
2.5 OMVs Analysis ...................................................................................................................... 30
2.5.1 Particle size distribution and measurement of potential zeta ............................................ 30
2.5.2 Protein gel electrophoresis ................................................................................................ 30
2.5.3 Total Protein Quantification - BCA Assay .......................................................................... 32
2.5.4 Purity evaluation- Transmission electron microscopy (TEM) ................................................ 32
2.6 Evaluative parameters ........................................................................................................... 32
3. Results and Discussion .................................................................................................................. 33
3.1 Bacterial Growth Curve ............................................................................................................... 33
3.2 OMVs Primary Isolation Steps .................................................................................................... 33
3.2.1 Performance of the Ultrafiltration/Diafiltration Columns ........................................................ 34
3.2.2 Total Protein Quantification ................................................................................................... 35
3.2.3 Particle size distribution and potential zeta ........................................................................... 36
3.2.4 Feed characterization ............................................................................................................ 38
3.3 OMVs Purification ........................................................................................................................ 40
3.3.1 Development of aqueous two-phase systems ...................................................................... 40
3.3.2 Size Exclusion Chromatography ........................................................................................... 45
3.3.3 Chromatography with QA monolithic disk ............................................................................. 49
4. Conclusions and Future Work ........................................................................................................ 55
5. Bibliography .................................................................................................................................... 56

VI
List of Tables
Table 1- Natural membrane vesicles yield . ............................................................................................ 7
Table 2- Steps of the silver staining procedure. .................................................................................... 31
Table 3- Total protein in µg/mL present after each operation method. ................................................. 35
Table 4- Size distribution of OMVs particles analyses in triplicate in a Zetasizer. ................................ 36

VII
List of Figures
Figure 1- Burkholderia cepacia complex (Bcc) phylogenetic tree (Adapted from [8]). ............................ 2
Figure 2-Negatively stained B. cenocepacia cells showing the cable pili and flagellum structures [12]. 2
Figure 3- Model of outer membrane vesicles biogenesis. [17]............................................................... 3
Figure 4- Schematic representation of an outer membrane vesicle [25]. ............................................... 5
Figure 5-Schematic representation of OMVs production [31] ................................................................. 6
Figure 6-Schematic representation of the OMV detergent extraction process [36]. ............................... 8
Figure 7-Downstream processing of extracellular vesicles at industrial and laboratory scale [39]. ........ 9
Figure 8-Separation scheme of biological particles using a density gradient. ...................................... 10
Figure 9-Schematic of an ultrafiltration process using a hollow fiber membrane module. Several sizes
of membranes are shown on the right. .................................................................................................. 10
Figure 10-Binodal curve of a polymer/salt system. ............................................................................... 12
Figure 11-High-Performance Liquid Chromatography [HPLC] System. ............................................... 14
Figure 12-Size Exclusion HPLC Column from GE Healthcare [55]....................................................... 15
Figure 13- Schematic representation of a size exclusion chromatography. ......................................... 16
Figure 14-Common terms used in gel filtration ..................................................................................... 17
Figure 15- Gel filtration media according particle molecular weight ranges [58]. ................................. 19
Figure 16- Schematic representation of an ion-exchange chromatography. ........................................ 20
Figure 17- Packed (a) and monolithic (b) chromatographic columns [65]. ........................................... 22
Figure 18- CIM® Disk Monolithic Columns from BIA Separations. ........................................................ 22
Figure 19- Representative curve of Burkholderia cenocepacia k56-2 growth. ..................................... 33
Figure 20- Performance of the ultrafiltration/diafiltration column........................................................... 34
Figure 21- Representation of the flowrate of permeate curve during UF/DF. ....................................... 35
Figure 22- Size distribution by number (A), intensity (B) and volume (C) of the feedstock solution
analyzed by the Zetasizer software corresponding to the second run. ................................................. 37
Figure 23- Zeta (ζ ) potential distribution at pH7. .................................................................................. 38
Figure 24- Silver-stained SDS-PAGE illustrating the proteins in the feedstock from different production
batches. ................................................................................................................................................. 39
Figure 25- Feedstock imaged with a Transmission Electron Microscope (TEM). ................................. 40
Figure 26- Qualitative analysis of the purity of both phases from PEG-dextran ATPS through SDS-
PAGE electroforese. Top phases are illustrated in (A) and bottom phases in (B) composed by the
following systems: 6% PEG 3350-6.14% dextran (2), 6.5% PEG 3350- 6.5% dextran (3), 7% PEG
3350- 7% dextran (4), 8% PEG 3350- 8% dextran (5), 3.8% PEG 8000- 5.2% dextran (6), 4.4% PEG
8000- 6.2% dextran (7), 5% PEG 8000- 7% dextran (8), 5.8% PEG 8000- 8.4% dextran (9) at pH 7.. 42
Figure 27- Qualitative analysis of the purity of both phases from PEG-ammonium sulfate and PEG-
potassium phosphate ATPS. Top phases are illustrated in (A) and bottom phases in (B) composed by
the following systems: 15% PEG 1000- 14% (NH₄)₂SO₄ (2), 13% PEG 3350- 15% (NH₄)₂SO₄ (3), 10%
PEG 3350- 10% KH2PO4 (4), 13% PEG 1000- 15% KH2PO4 at pH 7. ................................................. 43

VIII
Figure 28- Quantitative analysis of the total protein concentration in µg/mL of both phases from PEG-
dextran ATPS through Pierce BCA protein assay.. ............................................................................... 44
Figure 29- Representation of the partition coefficients values of the previously studied aqueous two-
phase systems composed by: 6% PEG 3350-6,14% dextran (1), 6,50% PEG 3350- 6,50% dextran (2),
7% PEG 3350- 7% dextran (3), 8% PEG 3350- 8% dextran (4), 3,80% PEG 8000- 5,20% dextran (5),
4,40% PEG 8000- 6,20% dextran (6), 5% PEG 8000- 7% dextran (7), 5,80% PEG 8000- 8,40%
dextran (8) at pH 7. ................................................................................................................................ 45
Figure 30- SEC run with a Superose 6 column for the separation of OMVs from a 2,5 mL sample of
the OMVs feedstock and 10 mM HEPES at pH 7 of preparation buffer. .............................................. 46
Figure 31- Silver stained reducing SDS-PAGE analysis of each chromatography fraction. Lane 1:
Feed; Lane 2,3,4: first elution peak fractions; Lane 5,6,7: fractions of second elution peak; Lane 8,9:
last fractions of SEC .............................................................................................................................. 47
Figure 32- SEC run with a Sephacryl-S1000 Superfine column for the separation of OMVs from a 1,5
mL sample of the OMVs feedstock and 10 mM HEPES at pH 7 of preparation buffer. ........................ 48
Figure 33- Silver stained reducing SDS-PAGE analysis of chromatography fractions. Lane 1:
Feedstock loaded; Lane 2: first elution peak; Lane 3: second elution peak. ........................................ 48
Figure 34- First elution peak fractions imaged by Transmission Electron Microscope (TEM). ............. 49
Figure 35- CIM QA® chromatography profiles of 1,5 mL OMVs feedstock from two different batches
(A) and (B), using as adsorption buffer 10 mM HEPES at pH 7 and elution buffer 10 mM HEPES with1
M NaCl at pH 7. ..................................................................................................................................... 50
Figure 36- Silver stained reducing SDS-PAGE analysis of chromatography fractions. Lane 1: Feed;
Lane 2,3: flow-through fractions; Lane 4,5,6: first elution peak fractions .............................................. 51
Figure 37- First (A) and second (B) elution peaks fractions imaged by Transmission Electron
Microscope (TEM). ................................................................................................................................ 52
Figure 38- CIM QA® chromatography profiles of 1,5 mL OMVs feedstock using as adsorption buffer
10 mM HEPES with the following pH: 6 (A); 5 (B); 4 (C) and elution buffer 10 mM HEPES with 1 M
NaCl at pH 7. ......................................................................................................................................... 53
Figure 39- Silver stained reducing SDS-PAGE analysis of the chromatograms A, B, and C illustrated
on figure 38. Lane 1: Feed; Lane 2,3,4: flow-through fractions from A,B, and C; Lane 5,6,7: first elution
peak fractions from A,B and C. ............................................................................................................. 54

IX
List of Abbreviations
ATPS - Aqueous two-phase system
Bcc - Burkholderia cepacia complex
BSA - Bovine serum albumin
CF - Cystic fibrosis
CFTR – Cystic fibrosis transmembrane conductance regulator
CIM - Convective interaction media
DTT - Dithiothreitol
EDTA - Ethylenediamine tetraacetic acid
GE - General electric
GMP - Good manufacturing practice
GPC - Gel permeation chromatography
HEPES - 4-(2-hydroxyethyl)-1-piperazineethanesulfonic acid
HPLC - High pressure liquid chromatography
IEX - Ion exchange chromatography
Kd - Distribution coefficient
Kp - Partition coefficient
Lc- Liquid chromatography
Lpp – Lipoprotein
LPS – Lipopolysaccharides
MV - Membrane vesicle
OM – Outer membrane
OMVs - Outer membrane Vesicles
PdI - Polydispersity indexes
PEG - Polyethylene glycol
PG - Peptidoglycan
pI - Isoelectric point
QA - Quaternary amine
SDS-PAGE - Sodium dodecyl sulfate polyacrylamide gel electrophoresis

X
SEC - Size exclusion chromatography
TEM - Transmission electron miscroscopy
TEMED - Tetramethylethylediamine
TFF - Tangential-flow filtration

1
1. Introduction
1.1 Burkholderia cepacia complex and Cystic Fibrosis
Cystic Fibrosis (CF) is the most frequent autosomal recessive genetic disease in populations
of Caucasian origin and it affects close to 70.000 people in the whole world, with a life expectancy
midd-30s due to chronic lung infections that are associated with high mortality [1]. This disease is
caused by mutations in a gene encoding the cystic fibrosis transmembrane conductance regulator
(CFTR). The CFTR protein is present on epithelial cells throughout the body and it is a chloride ion
channel involved in maintaining the water and ion homeostasis on cell surfaces. As it is
ubiquitously expressed, multiple organs are affected including the lungs, sinuses, pancreas,
gastrointestinal tract, sweat glands and reproductive tract [2]. Despite the various complications
linked to the disease, the main cause of morbidity and mortality in CF is lung disease which results
of an exaggerated pro-inflammatory response following bacterial infection. Ultimately, 80 to 95%
of patients with CF succumb to respiratory failure brought on by chronic bacterial infection
simultaneously with airway inflammation [3].
The bacterial species most commonly associated with respiratory tract infection in CF include
common human pathogens such as Staphylococcus aureus, Haemophilus influenza, species from
Burkholderia cepacia complex (Bcc) and Pseudomonas aeruginosa [4].
Despite not being the most common, Bcc bacteria have emerged as highly problematic
pathogens in CF patients and immunocompromised individuals. In fact, Bcc infections outcome
ranges from asymptomatic to rapid deterioration being unpredictable, and in some cases can lead
to a fatal septicemia, called ―cepacia syndrome‖ [4]. Moreover some Bcc bacterial infections are
inherently difficult to treat due to the resistance of these bacteria to multiple antibiotics, the ability
to form biofilms, and the establishment of intracellular and chronic infection stages in the host.
Bacteria belonging to Bcc have been isolated from both environmental reservoirs, such as soil,
fresh water and plant rhizopheres, and clinical sources. Nowadays, Bcc comprises a group 18
closely related species of human opportunistic pathogens, capable of causing chronic and severe
infection especially in CF patients [5], [6]. In Fig. 1 are represented 17 species of the Bcc however
a novel one was recently introduced: the Burkholderia pseudomultivoran [7]. Studies from several
countries reiterate that two species, Burkholderia cenocepacia and Burkholderia multivorans,
account for most Bcc infection in CF patients across the world [6]. Indeed, B. cenocepacia is the
most well studied species among all Bcc species. Intensive research have been made not only in
the epidemiology field, but also in the elucidation of the mechanisms underlying infections, host-
pathogen interactions and virulence factors involved in B. cenocepacia colonization.

2
Figure 1- Burkholderia cepacia complex (Bcc) phylogenetic tree (Adapted from [8]).
B. cenocepacia colonization, as well as patient-to-patient transmission of the organism, has
been associated with the expression of filamentous adherence organelles known as cable pili (Fig 2)
[9]. These structures are expressed on the bacterial cell surface [10].The cells have also flagellum (Fig
2), important virulence determinant since the motility phenotype imparted by these organelles often
correlates with the ability of an organism to cause disease [11].
Figure 2-Negatively stained B. cenocepacia cells showing the cable pili and flagellum structures [12].
3
Several other virulence factors and mechanisms have been described for B. cenocepacia,
such as lipopolysaccharide, exopolysaccharide, siderophores, quorum sensing, resistance to
antibiotics and metalloproteases [6]. Despite the growing knowledge about B. cenocepacia
infection mechanisms strategies to combat this organism, alternative to antibiotic therapies, are
still very limited. In fact, at present, no vaccines against Bcc bacteria are available. Prevention of
infection with a prophylactic vaccine may represent a desirable alternative to prevent infection and
to increase life expectancy and/or quality of CF patients.
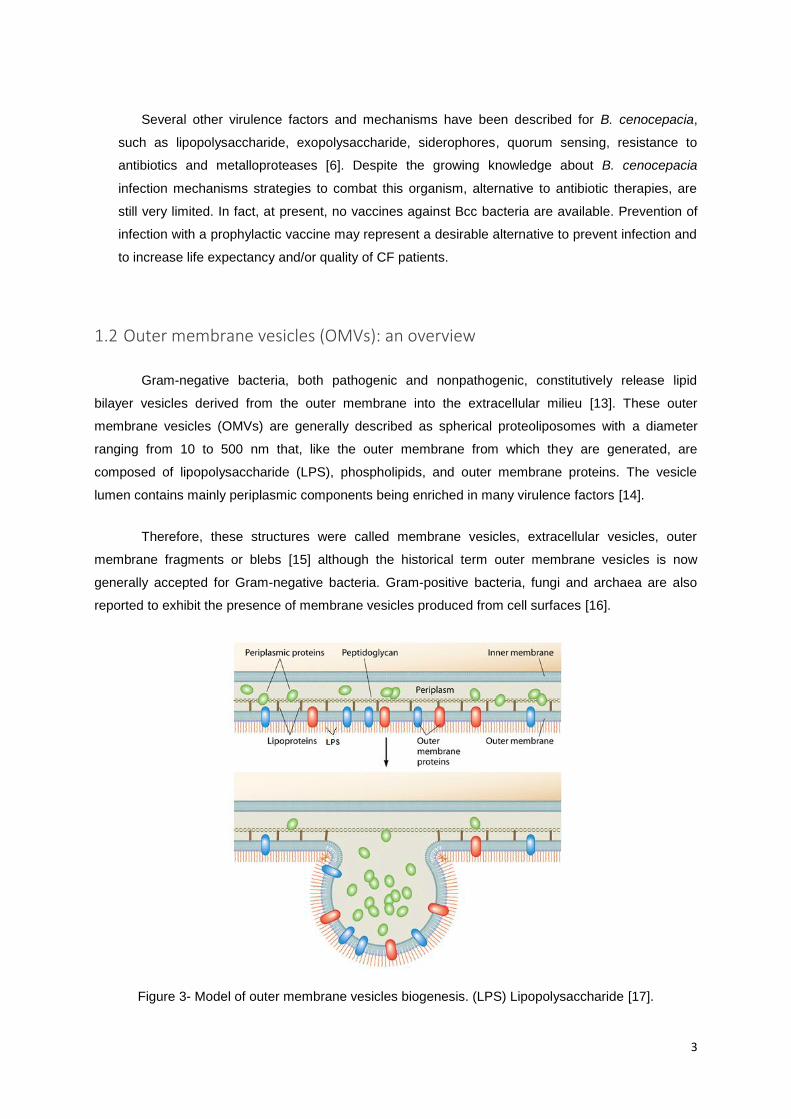
1.2 Outer membrane vesicles (OMVs): an overview
Gram-negative bacteria, both pathogenic and nonpathogenic, constitutively release lipid
bilayer vesicles derived from the outer membrane into the extracellular milieu [13]. These outer
membrane vesicles (OMVs) are generally described as spherical proteoliposomes with a diameter
ranging from 10 to 500 nm that, like the outer membrane from which they are generated, are
composed of lipopolysaccharide (LPS), phospholipids, and outer membrane proteins. The vesicle
lumen contains mainly periplasmic components being enriched in many virulence factors [14].
Therefore, these structures were called membrane vesicles, extracellular vesicles, outer
membrane fragments or blebs [15] although the historical term outer membrane vesicles is now
generally accepted for Gram-negative bacteria. Gram-positive bacteria, fungi and archaea are also
reported to exhibit the presence of membrane vesicles produced from cell surfaces [16].
Figure 3- Model of outer membrane vesicles biogenesis. (LPS) Lipopolysaccharide [17].

4
The production of OMVs was first reported more than 40 years ago but their full biological
significance was first recognized recently, particularly in Gram-negative bacteria [18]. These
nanoparticles are formed when parts of the outer membrane of the bacteria start bulging out, creating
a small sphere that pinches off from the membrane. The composition of OMV reflects the surface of
the parent bacteria, containing luminal periplasmatic content such as phospholipids, LPS, proteins,
peptidoglycan and specific virulence factors. The proteins inside the vesicles are mainly derived from
the outer membrane and periplasm, although DNA, cytosolic and inner membrane proteins have also
been identified in OMV [19].
OMVs are secreted by bacteria both in liquid and on solid media, as well as in vivo. OMVs
have been observed in laboratory grown cultures and in natural environments such as freshwater, soil
and biofilms [13], [15]. OMVs were found to be released in all growth phases of the bacterial culture
[16] although their amount and composition may be dependent upon the growth conditions and the
size distribution is characteristic from the strain [20].
1.3 Multifaceted roles of OMVs
Since the production of OMVs is a common phenomenon, since they represent a significant
metabolic expense to cells and since they are produced by a multitude of Gram-negative bacteria [21],
they must serve a significant purpose.
Nowadays, we know that OMVs are part of a secretion-delivery system used by many Gram-
negative bacteria, which allows the long-distance dissemination of bacterial products into the
environment and promotes interaction with other cells, thus eliminating the need for bacterial contact.
They are particularly involved in cell-cell signaling communication, nutrient acquisition, maintenance of
the biofilm structure, predation and horizontal gene transfer [22]. Furthermore, OMVs from pathogenic
bacteria are secreted to deliver toxic compounds directly into the host cells, enhance bacterial survival
in a hostile environment and modulate host immune response. OMVs are enriched in virulence factors
such as LPS, invasins, adhesins, immunomodulatory compounds and lytic enzymes [23], [24] and
they play a role in effectively delivering compounds to organisms including both prokaryotic and
eukaryotic cells [25]. Most bacteria package antimicrobial factors into OMVs, such as peptidoglycan
hydrolases that cause the lysis of Gram-negative and Gram-positive bacteria, consequently killing
competitors [26].
Furthermore, OMVs serve as an envelope stress response, protecting the secreting bacteria
from internal protein misfolding stress, as well as external envelope stressors [17].
OMVs have a number of advantages over simple secretion systems in bacteria because the
cargo is protected inside the lumen of the vesicle from the environmental stress which can be targeted
to specific destinations through receptors [27].

5
Figure 4- Schematic representation of an outer membrane vesicle [25].
1.4 OMVs as Vaccine Carriers
OMVs have become a promising target for vaccine development, as they carry many
immunogenic components as the pathogen but are acellular. OMVs contain immune stimulators (e.g.
LPS, proteins, and DNA) and antigenic molecules that can be delivered to immune competent cells of
the immune system to trigger maturation as well as activation signals [24]. Therefore, they have an
intrinsic adjuvant effect, but also multiple antigens in native conformation that are combined in a single
vaccine formulation. Beside that they are stable after long-term storage at 5°C, which is an essential
aspect for commercial viability [28].
At the time only meningococcal OMVs vaccines are commercially available and have shown
particular utility in countering epidemics of Neisseria meningitidis serogroup B (MenB) [29]. However
several reports have demonstrated that vaccination with OMVs is sufficient to induce an immune
response and protect vaccinated mice from subsequent pathogen challenge, such as vesicles derived
from Acinetobacter baumannii, Pseudomonas aeruginosa, Francisella novicida, non-typeable
Haemophilus influenzae, Salmonella enterica serovar Typhimurium, Vibrio cholera and Burkholderia
pseudomallei [28].
Unfortunately, the extensive use of OMVs as a safe vaccine platform hide some obstacles
such as: scale production, versatility, and toxicity. Given that many steps of vesicles biogenesis are
susceptible of manipulation, several progress were performed toward enhancing bacterial vesiculation
through host strain engineering, expanding the functionality of OMVs through protein decoration, and
adjusting the immunogenicity and toxicity of OMVs via LPS modifications [28].
Sometimes some antigens important for immunogenicity vary widely between strains, meaning
that isolated OMVs induce strain-specific immunity. Therefore, wild-type OMVs could be re-
engineered at the genetic and molecular level leading to multi-antigen vaccines against several strains
and/or species [30].

6
1.5 Production of OMVs
1.5.1 Mechanism and regulation
The regulation and mechanism of outer membrane vesicles production is a complex process
that has remained unclear until very recently. Based on the envelope architecture and prior
characterization of the hypervesiculation phenotypes for mutants lacking the lipoprotein, Lpp, which is
involved in the covalent OM-peptidoglycan (PG) crosslinks, Schwechheimer and co-authors have
found that OMVs production is modulate by subtle modifications of peptidoglycan remodeling and
crosslinking, inversely correlating with bound Lpp levels (Fig 5). They also shown that OMV production
relieves stress caused by the accumulation of diverse, potentially harmful products in the envelope like
PG fragments and LPS [17].
Figure 5-Schematic representation of OMVs production. A) Vesicles are likely to bud at sites
where the links between the peptidoglycan and the OM (Lpp-PG crosslinks) are infrequent, absent, or
broken. B) In areas where misfolded proteins or envelope components (such as lipopolysaccharide
(LPS) or PG fragments) accumulate, crosslinks are either displaced or locally depleted, leading to
increased OMV production. [31]
1.5.2 Optimization of growth conditions and strains
Regarding the rates of OMVs production, the yields are not uniform, and even for a particular
strain, the production has long been seen to be influenced by environmental factors and by sources of
cellular stress. In studies of both nonpathogenic and pathogenic species, vesiculation was found to be
upregulated by conditions that activate the envelope stress response, like oxidative stress. In fact,
vesiculation is crucial to surviving stress. A study has shown that when vesiculation mutants of E. coli

7
were challenged with lethal envelope stressors, the vesicle-underproducing mutant succumbed, but
the overproducing mutants survived better than the wild type [32]. Considering the harsh antimicrobial
environments encountered in a host during infection, the capacity to modulate vesicle production is
likely critical for pathogens. Electron microscopy evidence has also shown that vesiculation can be
induced by exposure to host components and tissue [32]. Other studies about antibiotic treatment had
been demonstrated to influence several aspects of vesiculation. For example, gentamicin treatment
also increased the vesiculation of P. aeruginosa, however, when the composition of these vesicles
was inspected, they were not identical to native OM vesicles, as they also contained inner membrane
and cytoplasmic material [33].
Table 1 shows the outer membrane vesicles yields for some strains of Burkholderia and
Pseudomona aeruginosa.
Table 1- Natural membrane vesicles yield [34].
Strain
Yield (ng Kdo*/g total protein)
Burkholderia cenocepacia 877.0 ± 68.2
C5424
C5632 41.8 ± 1.4
CEP0248 220.0 ± 57.3
Burkholderia vietnamiensis 81.1 ± 11.8
CEP0192
Pseudomonas aeruginosa 2850.0 ±185.0
PAO1
*Kdo, 3-deoxy-D-manno-octulosonic acid.
1.5.3 Detergent extraction process
A Good Manufacturing Practice (GMP) process was developed at the Finlay Institute to
produce OMV from N. meningitidis serogroup B using detergent extraction. Detergent extraction of
OMVs is the traditional method used to lower LPS content and improve vesicle yields. More recently,
the extraction process has also been applied effectively for obtaining OMV on a research scale from
Vibrio cholerae, Bordetella pertussis, and Mycobacterium smegmatis [36]. Another work about a
production process for OMVs vaccine against Neisseria meningitidi mentioned the use of a
concentrated EDTA solution for 30 min at ambient temperature with continuous stirring to stimulate
OMVs release [35].
Selection of the detergent can be a critical step for extracting immunogenic OMV. LPS is the
main antigen of enteric pathogens, but it is also a potent toxin with differing potency in Gram-negative

8
pathogens [37]. Detoxification of these liposomal particles, i.e., the removal of the fatty acid portions of
lipid A (Fig. 6), is required for the use of OMVs in humans; therefore, detergent and purification steps,
may differ according to the antigen that needs to be expressed or removed from the vesicles.
However, detergent is laborious, cost intensive and reduces the adjuvant activity of these vesicles,
which are all serious problems for vaccine development [30]. Recently, the production of OMV
obtained by detergent-free protocols has gained interest, because the generation of mutant strains,
hyper expressing important protein antigens, and detoxified molecules may improve the yield,
immunogenicity, and safety profile of the OMV [35]. Classical OMV vaccines have a reduced LPS
content as a result of detergent extraction, mostly with deoxycholate acid. An alternative method is the
use of strains with genetically detoxified LPS, attenuating the endotoxic activity. This allows the use of
native OMVs without any need for LPS removal by detergent extraction, making it a much easier to
produce and more versatile vaccine platform. Several groups have now started the development of
native OMV vaccines based on non-toxic LPS mutants [38].
Figure 6-Schematic representation of the OMV detergent extraction process [36].
1.6 Downstream processing of OMVs
Bacterial cells constitutively secrete OMVs into their media, making conditioned media the
starting material for outer membrane vesicles isolation. Presently, no standardized method exists for
isolation and preparation of OMVs from conditioned media, which is a challenge in moving the field
forward. Harvesting OMVs from the media most likely will be required to ensure pure, safe, and
regulatory-compliant products. Assuming that an appropriate methodology is established, one can
choose from three principal methods of OMVs isolation (Fig.7): ultracentrifugation, size-exclusion
chromatography (SEC), and tangential-flow filtration (TFF). Each method has its own operational
shortcomings and limitations on scales of production.

9
Figure 7-Downstream processing of extracellular vesicles at industrial and laboratory scale
[39].
Cell harvesting and OMVs purification are essential steps in the downstream processing of
biopharmaceutical products. OMVs possess different biochemical properties and therefore purification
conditions must be established. Preparative methods used to purify OMVs are based mostly on
density gradient centrifugation techniques. However, techniques based on ultrafiltration present some
disadvantages due to their difficult scale-up at both laboratory and industrial scales. On the other
hand, some alternative scalable methods, such as chromatographic techniques including ion-
exchange chromatography (IEX), size exclusion chromatography (SEC) can be explored.
1.6.1 Density gradient centrifugation
Ultracentrifugation can be used to separate particles on the basis of their buoyant density,
independently of their size or shape. The sample is usually either layered on top of, or dispersed
within, a steep density gradient. Depending on the biological application a wide variety of gradient
materials are available. Each component will move up or down when its density matches its
surroundings and then will move no further, forming different bands. The materials used for the
gradient should have good solubility in water, electrical neutrality and transparency to UV-light [40].

10
Figure 8-Separation scheme of biological particles using a density gradient. The sample is
distributed throughout the density gradient prior to centrifugation. At equilibrium, components have
migrated to a region in the gradient that matches their own density.
Wildaliz Nieves et al. in their study using Burkholderia pseudomallei and Marika Renelli et al.
in their work about membrane vesicles of Pseudomonas aeruginosa [41] describe a purification step of
OMVs using a isopycnic sucrose density gradient [42]. This purification step can also be performed
with Optiprep solution instead of sucrose as described in the production of outer membrane vesicles
by Francisella novicida [43]. In addition, size exclusion chromatography can be used as alternative
method to purify OMVs instead of the sucrose density gradient.
1.6.2 Ultrafiltration
Ultrafiltration (UF) is a tangential flow filtration technique which uses membranes with pore
sizes in the range of 0.1 to 0.001 µm. Typically, ultrafiltration will remove high molecular-weight
substances, such as virus [44], colloidal materials, and organic and inorganic polymeric molecules
[45]. In this process, the fluid is introduced tangentially along the surface of the membrane. There is
an applied pressure which forces the fluid to pass through the membrane to the filtrate side. The fluid
that flows out of the feed channels of the membrane modules is recycled back into the retentate or
concentrate tank. UF using a hollow fiber membrane is accomplished by pumping the fluid into the
inner diameter of a tubular fiber (Fig. 9).
Figure 9-Schematic of an ultrafiltration process using a hollow fiber membrane module.
Several sizes of membranes are shown on the right.

11
One application of UF is the solvent-exchange of proteins solutions, which is called
Diafiltration (DF). In processes where the product is in the retentate, diafiltration washes components
out of the product pool into the filtrate, thereby exchanging buffers and reducing the concentration of
undesirable species. When the product is in the filtrate, diafiltration washes it through the membrane
into a collection vessel. A diafiltration volume (DV) is a measure of the extent of washing that has
been performed during a diafiltration step. If the volume of permeate collected equals the starting
concentrate volume, it means that 1 DV has been processed [46].
1.7 Aqueous two-phase systems
In 1896, Martinus Beijerinck discovered that aqueous solutions of agar were immiscible with
other aqueous solutions of starch or gelatin This phenomenon was the first report in literature about
biphasic systems mainly composed by water, the aqueous two-phase systems [47].
However, it was in 1958, through the work of Per-Ake Albertsson, that ATPS gained
importance as a bioseparation technique. Albertsson realize that polyethylene glycol (PEG),
potassium phosphate and water also formed two phases and he understood the importance of this
discovery for the separation of cell particles and biomolecules and for downstream processing [48].
Since the research of Albertsson, aqueous two-phase systems (ATPS) have proven to be a
useful tool for analysis of biomolecular and cellular surfaces and their interactions, fractionation of cell
populations; product recovery in biotechnology such as proteins, cells, virus, amino acids, nucleic
acids [49].
1.7.1 Two-phase formation
An aqueous two-phase system (ATPS) is formed when two aqueous solutions that are
enriched with different polymers or a polymer and a salt are mixed at sufficiently high concentrations.
When the limiting concentrations are exceeded, two immiscible aqueous phases are formed. In
general, the two major types of ATPS available are polymer/polymer (e.g. polyethylene glycol (PEG)/
Dextran) and polymer/ salt (e.g. polyethylene glycol (PEG)/ phosphate) system.
The resulting output of these systems is a binodal curve, which delineates the concentrations
of each polymer and/or salt in solution that lead to the formation of a single or two-phase system. If the
components have concentrations above the binodal curve, a two-phase system will be formed: if the
concentrations are below the binodal curve no phase formation will occur. Another important concept
is the tie line length. Moving along the tie-line, coordinates denote systems with differing total
compositions and volume ratios, but with the same final concentration of phase components in the top
and bottom phases [50].

12
Figure 10-Binodal curve of a polymer/salt system. In the figure, TCB = Binodal curve, C =
critical point, TB = Tie line, T = composition of the top phase, B = composition of the bottom phase,
and X, Y and Z = total composition of ATPS.
Bottom phase salt (% w/w) is plotted on the abscissa and top phase polymer (% w/w) is
plotted on the ordinate. X, Y, Z represent the total compositions of three systems lying on the same
tie-line with different volume ratios. The final composition of the top and bottom phase is represented
by nodes T and B, respectively.
1.7.2 Factors Influencing Partitioning
The partition coefficient (1) is often used to characterize the aqueous two phase separation
and is given by the ratio of the top and bottom phase’s concentrations in a given solute [50].
(1)
There are several factors that contribute to the partition coefficient and we can manipulate
them to improve the selective partitioning, such as (i) Hydrophobicity, where the hydrophobic
properties of a phase system are used for separation according to the hydrophobicity of proteins; (ii)
Electrochemical, where the electrical potential between the phases is used to separate molecules or
particle according to the their charge; (iii) Size, where molecular size or surface area of the proteins is
the dominating factor; (iv) Biospecific affinity, where the affinity between sites on the proteins and

13
ligands attached to one of the phase polymers is exploited for separation; and (v) Conformation,
where the conformation of the proteins is the determining factor [51].
The contributions of each one of these factors are expressed in equation (2) in terms of the
individual partition coefficients according to Albertsson where hidrof, elect, biosp, size and conf stand
for hydrophobic, electrochemical, biospecific, size and conformational contributions to the partition
coefficient and K0 includes other factors.
(2)
In aqueous two-phase systems, the partitioning of a protein is influenced by the average
molecular weight/size of the polymers, concentration of the polymer, pH of the system, temperature,
ionic strength of the salt phase, adding an additional salt, such as NaCl, that increases the
hydrophobic resolution of the system [51].
1.8 High-performance liquid chromatography (HPLC)
High-performance liquid chromatography is a technique used to separate, identify, and
quantify each component in a mixture. A high-pressure pump (solvent delivery system) is used to
generate and meter a specified flow rate of mobile phase (liquid solvent), typically milliliters per
minute. An injector (manual or automatic- autosampler) is able to inject the sample into the
continuously flowing mobile phase stream that carries the sample mixture into the HPLC column. The
column contains the chromatographic packing material needed to effect the separation. Each
component in the sample interacts slightly differently with the adsorbent packing material, causing
different rates for the different components and leading to the separation of the components as they
flow out the column. A schematic representation of HPLC is shown in figure 11.

14
Figure 11-High-Performance Liquid Chromatography [HPLC] System.
HPLC has been used for research in order to separate the components of a biological sample,
and for manufacturing during the production process of pharmaceutical and biological products [52].
1.8.1 Size-Exclusion chromatography (SEC)
Size-exclusion chromatography (SEC) separates molecules according to their size or, more
accurately, according to their hydrodynamic diameter.
The technique was described in 1955, by Grant Lathe and Colin Ruthven, in London. While
these researchers used starch gels as the matrix, Jerker Porath and Per Flodin later introduced
dextran gels [53] and other gels with size fractionation properties include agarose and polyacrylamide.
A rapid increase of research activity of size-exclusion chromatography began when J. C.
Moore published his work on the preparation of size-exclusion columns based on cross-linked
polystyrene with controlled pore size. It was recognized that with proper calibration, SEC was capable
to provide molar mass distribution information for synthetic polymers [54].
In this particular case, molecules will not bind to the chromatography medium, so buffer
composition does not directly affect resolution (the degree of separation between peaks). The
conditions of SEC can be varied to suit the type of sample or the requirements for further purification,
analysis or storage without altering the separation. SEC is suitable for separate monomers from
aggregates (difficult to achieve by any other technique) and for biomolecules that may be sensitive to
changes in pH, concentration of metal ions or co-factors and harsh environmental conditions.
Separations can be performed in the presence of essential ions or cofactors, detergents, urea,

15
guanidine hydrochloride, at high or low ionic strength, at 37 °C or at room temperature and the purified
proteins can be collected in any chosen buffer. An example of SEC column from GE Healthcare is
shown in figure 12.
Figure 12-Size Exclusion HPLC Column from GE Healthcare [55].
To perform a separation, a size-exclusion medium is packed into a column to form a packed
bed. The medium is a porous matrix in the form of spherical particles chosen accordingly their
chemical and physical stability, and inertness (lack of reactivity and adsorptive properties).
The packed bed is equilibrated with buffer, which fills the pores of the matrix and the space in
between the particles. The liquid inside the pores is sometimes referred to as the stationary phase and
this liquid is in equilibrium with the liquid outside the particles, referred to as the mobile phase. The
elution is isocratic, i.e. there is no need to use different buffers during the separation. However, a
wash step with running buffer is usually included at the end of a separation to facilitate the removal of
any molecules that may have been retained on the column and to prepare the column for a new run
[55].
After equilibrate the column with a suitable buffer, the sample is applied at the top of the
column. Buffer (mobile phase) and sample move through the column. Molecules diffuse in and out of
the pores of the matrix (also described as partitioning of the sample between the mobile phase and
the stationary phase). Smaller molecules move further into the matrix and so stay longer on the

16
column. As buffer passes continuously through the column, molecules that are larger than the pores of
the matrix are unable to diffuse into the pores and pass through the column. The average residence
time in the pores depends upon the effective size of the particles, so smaller molecules diffuse into the
pores and are delayed in their passage down the column. Large molecules leave the column first
followed by smaller molecules in order of their size as illustrated in figure 13. The entire separation
process takes place as one total column volume of buffer passes through the size-exclusion medium.
Figure 13- Schematic representation of a size exclusion chromatography.
1.8.1.1 Chromatography Parameters
In gel filtration, distribution of a particular component between the inner and outer mobile
phase depends on its molecular size, which is represented by distribution coefficient (Kd). The larger
molecules which are usually excluded from the gel beads, have a Kd value of zero. Certain molecules
smaller than the pore size of the gel beads enters the pores in the gel matrix and their Kd value is one.
For molecules of intermediate size, Kd value is between zero and one. A Kd> 1.0 indicates a
adsorption or ionic interactions between solute and the resin [56]. This type of variation in the Kd
values makes it possible to separate molecules in the narrow molecular size range. Figure 14 shows
the most common terms used to describe the separation.
The three parameters Ve, V0, and Vi are used to describe the behavior of a molecule on a gel
filtration column and these must be determined experimentally.
The elution volume (Ve) is the volume of eluent collected from the start of loading the sample
to the point of its maximal elution.

17
Figure 14-Common terms used in gel filtration. V0 - Void Volume: volume of interstitial liquid;
Vt : Total Volume (equivalent to the volume of the packed bed); Vt - Vo : Volume inside the porous
matrix (Vi); Ve: elution volume.
Molecules that do not enter the matrix are eluted in the void volume, Vo as they pass directly
through the column at the same speed as the flow of buffer. Molecules with partial access to the pores
of the matrix elute from the column in order of decreasing size. Small molecules such as salts that
have full access to the pores move down the column, but do not separate from each other. These
molecules usually elute just before one total column volume, Vt, of buffer has passed through the
column.
The distribution coefficient Kd value is represented by the following equation:
(3)
1.8.1.2 Factors Affecting Gel Filtration
In real-life situations, particles in solution do not have a fixed size, resulting in the probability
that a particle that would otherwise be hampered by a pore passing right by it. Also, the stationary-
phase particles are not ideally defined; both particles and pores may vary in size. Elution curves,
therefore, resemble Gaussian distributions. The stationary phase may also interact in undesirable
ways with a particle and influence retention times, though great care is taken by column
manufacturers to use stationary phases that are inert and minimize this issue.
Like other forms of chromatography, increasing the column length will enhance the resolution,
and increasing the column diameter increases the capacity of the column. Proper column packing is

18
important to maximize resolution: An overpacked column can collapse the pores in the beads,
resulting in a loss of resolution. An underpacked column can reduce the relative surface area of the
stationary phase accessible to smaller species, resulting in those species spending less time trapped
in pores. For a well packed column the void volume is equivalent to approximately 30% of the total
column volume (packed bed). Unlike affinity chromatography techniques, a solvent head at the top of
the column can drastically diminish resolution as the sample diffuses prior to loading, broadening the
downstream elution.
The best results for high resolution fractionation will be achieved with samples that originally
contain few components or with samples that have been partially purified by other chromatography
techniques in order to eliminate proteins of similar size that are not of interest.
SEC columns can be divided into preparative and analytical columns in respect to their load
capacity and to their resolving power (which take form in their physical size). Preparative columns are
larger in size\volume (length and width) so they can accommodate larger protein load (tens of mg/run)
on the account of a relatively larger particles size (~30 micron) and lower length/width ratio.
Analytical columns are usually smaller in size/volume and can accommodate small amounts of
proteins (up to 10 mg/run) without risking overload. Usually analytical column has a relative smaller
particle size (~10-15 micron) which affects both the flow rate and the back pressure. The particles size
has a key effect on the resolving power of the column and has a direct effect on the developing back
pressure. Efficiency can be improved by using a smaller particle size. However, using a smaller
particle size may create an increase in back pressure so that flow rate must be
decreased and run time lengthened [57].
Thus, preparative column can be run at higher flow rate but achieve separation qualities which
are usually inferior to the analytical columns. Notice that you should verify your FPLC’s pump can
handle the specified working pressure. Even though the purpose of analytical column is for
characterization rather for purification, they can be used for the latter purpose as their resolving power
is bigger even though they require much more injections.
1.8.1.3 Alternative Size-exclusion Media
The porous beads of a size-exclusion medium can be made of an insoluble but highly hydrated
polymer such as dextran or agarose (which are carbohydrates) or polyacrylamide. Sephadex,
Sepharose, Sephacryl and Superdex are commonly used commercial preparations of these beads
[58]. In the following figure are represented several gel filtration media according the molecular weight
of the particles.

19
Figure 15- Gel filtration media according particle molecular weight ranges [58].
1.8.2 Ion-Exchange chromatography (IEX)
Ion-exchange chromatography (IEX) was designed in 1940s specifically for the separation of
differentially charged or ionizable molecules. Both chemists and biochemists have used this technique
for the purification of proteins, enzymes, antibodies, peptides, amino acids and nucleic acids [59],[60].
IEX uses an ion exchange mechanism to separate analytes based on their respective
charges. It is usually performed in columns but can also be useful in planar mode. The basis of IEX is
that charged ions can freely exchange with ions of the same type. In this context, the mass of the ion
is irrelevant. Therefore, it is possible for a bulky anion like a negatively charged protein to exchange
with ions of the same charge. This process can later be reversed by washing with chloride ions in the
form of NaCl or KCl solution to remove weakly bound proteins first, followed by more strongly bound
proteins with a greater net negative charge [60].
The surface of a protein has a net charge that depends on pH, i.e. is determined by the
difference between its isoelectric point and the pH of the solution. At pH values higher than a protein's
isoelectric point (pI), the protein will develop an overall negative charge. This will allow the protein to

20
be separated and retained by the positively charged stationary phase particles (cation exchange
chromatography).
In a particular condition, the molecule carries no net surface and interactions with the charged
medium do not occur; in this case, the pH corresponds to its isoelectric point. Additionally, other minor
types of interactions may occur, due to Van der Waals forces or non-polar interactions.
As other column chromatography techniques, IEX requires a stationary phase which is usually
a ion exchange resin composed of insoluble, hydrated polymers, such as cellulose, dextran
(Sephadex) [60].
Ion exchange matrices can be further categorized as either strong or weak. Strong ion
exchange matrices are charged (ionized) across a wide range of pH levels. Weak ion exchange
matrices are ionized within a narrower pH range. The classification does not refer to the absorbent
ability to bind proteins; it refers only to pKa value of their functional groups [61]. The stages of an
anionic exchange chromatography are exemplified in figure 16.
Figure 16- Schematic representation of an ion-exchange chromatography.
In the initial phase, equilibrium is reached when negatively charged particles of chloride are
bound to the stationary phase particles (equilibration). The second step is the sample application and
adsorption, in which solute molecules carrying the appropriate charge displace counter-ions and bind
reversibly to the medium. Unbound substances are washed out from the column. The bounded
proteins are then eluted by changing the composition of the buffer. Typically, the ionic strength of the
buffer is changed by the addition of a neutral salt such as potassium chloride or sodium chloride. As a
high salt concentration is imposed, the retained negatively charged proteins will be eluted in order of
their respective negative charge and replaced by chloride ions once again, with the ones with weaker
negative charges being replaced first (elution). The last stages are the removal of substances not
eluted from the column under the previous experimental conditions (regeneration) and reequilibration
at the starting conditions for the next purification.

21
1.8.2.1 A Particular Architecture of IEX Media: Monolithic Chromatography
Monolith columns are a new class of chromatographic stationary phase, based on a highly
cross-linked porous monolithic polymer. Unlike conventional chromatography columns packed with
porous particles, the monolithic column is a single piece of porous structure of uninterrupted and
interconnected channels. The sample is transported through the column via convection leading to very
fast mass transfer between the mobile and stationary phase even for large biomolecules [62]. The
absence of packed bed of beads leads to low back pressures allowing high flow rates to be achieved,
leading to rapid separations even for very large biomolecules such as protein complexes,
immunoglobulins and viruses [63].
Although the first experiments with monoliths were dated in the late 1960s and early 1970s,
the use of the monolith as a stationary phase in capillary was greatly expanded in the last few years.
The reason for that is the easy preparation, possibility of attachment to the glass surface, good mass
transfer, absence of the packing procedure, and excellent performance.
Monolithic resin was developed in late 1980s led by Belenkii, Hjertén, Švec, Tennikova who
have studied macroporous polymeric membranes based on methacrylates in order to separate
proteins. The polymeric membranes were originally prepared by mixing a methacrylate monomer, a
dimethacrylate cross-linker, a free radical initiator and a porogenic solvent. Polymerization was carried
out in a tubular mold that yielded a sheet or cylinder. The resulting porous polymer was then removed
from the mold and sliced to create small disks, which were then placed in a cartridge. It was
successful synthesized disks called macroporous polymer membranes made by poly(glycidyl
methacrylate ethylene dimethacrylate) polymers.
In the 1990s, Fields, Tanaka and co-workers produced inorganic monolithic columns supports.
The important difference to organic polymers monoliths, which have been shown to be very suitable
for the separation of large analytes like proteins, nucleic acids and synthetic polymers, is that silica-
based continuous beds are well known for efficient and high-speed separations of compounds of low
molecular weight. The differences in chromatography performance of the organic and inorganic
monolithic supports can be attributed to differences in porosity.
In monoliths, the predominant transport mechanism is convection rather than diffusion which
leads to a flow-unaffected resolution. Monoliths are homogenous, and flow is uniform throughout the
bed unlike packed particle columns, where its structure is discontinuous, comprising zones with
dramatically different flow properties [64] as shown in figure 17.

22
Figure 17- Packed (a) and monolithic (b) chromatographic columns [65].
One of the most famous companies producing monolithic supports is BIA Separations which
started to commercialize them under the trade name of Convection Interaction Media (CIM). Figure 18
shows a disk monolithic column from BIA Separations.
Figure 18- CIM® Disk Monolithic Columns from BIA Separations.

23
1.9 Aqueous two-phase systems vs Chromatography
The purification of biomolecules typically accounts for up more than 70% of the total
downstream processing costs. The conventional methods of purification of biomolecules involve
several steps of unit operations and hence are usually expensive. In each step, some quantity of
target molecule is lost resulting in a generally in a large overall loss [48].
Aqueous two-phase system (ATPS) is an alternative method for separation of biomolecules
which reduces number of steps and thus reduces the overall cost. The simple process and low cost of
phase forming materials allow this method for large-scale purification also. It has many advantages
like rapid separation, rapid mass transfer (low interfacial tension), do not harm or denature unstable
biomolecules, selective separation (affinity partition) and easy scale up. The polymer layer stabilizes
the extracted protein molecules, favoring a higher concentration of the desired protein in one of the
layers, resulting in an effective extraction. They may be employed in continuous protein-extraction
processes.
Therefore, ATPS has been applied in several fields of biotechnology such as recovery of
proteins, enzymes, biopharmaceuticals and extractive fermentation. The selection of ATPS depends
on the type of biomolecule and economic considerations. Because of the high cost and high viscosity
of the polymer/polymer system, namely with high-purity dextrans, the aqueous two phase polymer/salt
systems are preferred over the polymer/polymer systems. Moreover, polymer/salt systems have larger
differences in density, greater selectivity, lower viscosity, lower cost and the larger relative size of the
drops. Phosphates and sulfates are the commonly used salts in polymer/salt ATPS. But this leads to
high phosphate and sulfate concentration in the effluent streams and hence an environmental
concern. However, other low-cost alternatives such as less refined dextrans are also available [66].
Nowadays, use of citrate salts as a phase forming component with PEG is preferred since citrate
salts are biodegradable and nontoxic [67].
High-performance liquid chromatography has become the predominant global technology over
the past four decades. The major reason for the rapid growth of this technique has been the evolution
of packing materials used to affect the separations. The traditional packing materials have been
particulates. However, the recent development of an alternative column packing material – a one-
piece porous solid known as a ―monolith‖ – has transformed the field [68].
QA- CIM® monolithic columns stand for elaborate design providing high efficiency, high speed,
and high yield in downstream processing of large proteins. Large flow-through channels and high
surface accessibility of binding sites entail binding capacities exceeding those of resin-based columns
and rapid mass transfer based on convection. CIM® monolithic columns are distinguished for their
flow independent performance, resulting in fast separation, concentration, purification, removal, and
analytics of biopharmaceuticals. CIM® monolithic columns are available in different product lines to
suit different needs [69].

24
Ion-exchange chromatography has a large sample-handling capacity, wide applicability,
reasonable cost, powerful resolving ability, and easy to scale-up and automation, making this
technique as one of the most versatile and widely used of all liquid chromatography (LC) techniques
[60].
Size exclusion chromatography media allow fast and reproducible purification of proteins,
polysaccharides, and other macromolecules by size-exclusion at laboratory and industrial scales. It is
also an excellent purification over a wide molecular weight range and high reproducibility due to high
stability [55].

25
1.10 Background and aim of study
OMVs were found to be released in all growth phases of the bacterial culture [16] although
their amount and composition may be dependent upon the growth conditions. As the OMVs are known
to induce the immune system, they have been recognized as promising agents to be used as
vaccines. Many efforts in this direction are being carried out, one successful example being a vaccine
for meningitidis caused by Neisseria meningitidis [35]. Efforts to prepare a vaccine for other infectious
diseases continue, and OMVs hold great promise to combat these diseases. Burkholderia cepacia
complex (Bcc) bacteria have gained notoriety as pathogens in cystic fibrosis (CF) because they are
difficult to identify and treat, and also have the ability to spread between CF individuals.
With the increasing progress in technology and demand for new therapeutics, it is necessary
to create new tools to improve the human condition with the discovery and development of better
healthcare products and treatments. In the area of biotechnology, there has been an increase in the
number of biopharmaceuticals industries and, as a consequence, an increase in research and
development in this area.
This study aims were to produce vesicles from Burkholderia cenocepacia K56-2 strain and to
purify them from main impurities (pili, flagella).
For this purpose, it was chosen to attain these goals through aqueous two-phase partitioning
using different polymers (Dextran, PEG) and salts (ammonium sulfate and potassium phosphate). The
choice of ATPS is based on the fact that it can overcome several drawbacks by being a fast,
biocompatible, high capacity and low cost technique. In order to attain higher purities, it was tested
new strategies for downstream processing of OMVs. Two alternatives of chromatographic techniques
were also analyzed: size exclusion and ion exchange chromatography, expecting that it could improve
the separation of the pili and flagella from the vesicles. These techniques represent a less costly and
scalable alternative to purify OMVs.
Until now, there are no mention in studies about the purification of outer membrane vesicles
through aqueous two-phase systems. There is a need to develop alternative purification techniques
and optimize the existent ones, meeting the patient needs and improving their quality of life.

26
2. Materials and Methods
2.1 Materials
In the present work, PEGs with different molecular weight were used: the one with molecular
weight of 3350 Da was purchased by Sigma-Aldrich (St. Louis, MO, USA), the ones with 1000 and
8000 Da molecular weight were provided from Fluka (Buchs, Switzerland). Dextran 500 kDa, 100 kDa
and 40 kDa were purchased from Fluka (Buchs, Switzerland). Polymers were used without further
purification. Dipotassium hydrogen phosphate (K2HPO4), potassium dihydrogen phosphate (KH2PO4)
and ammonium sulfate were provided from Panreac (Darmstadt Germany). Sodium chloride (NaCl)
and hydrochloric acid (HCl) at 37% were bought to Fluka, acetic acid (CH3COOH) 100%, sodium
hydroxide (NaOH) and isopropyl alcohol was purchased from Fisher Scientific (Hampton, New
Hampshire, USA) and sodium acetate (CH3COONa) came from Merck (Darmstadt, Germany). For gel
electrophoresis the acrylamide/bisacrylamide, the Coomassie blue and the silver staining kit came
from Bio-Rad (Hercules, CA, USA). DL-dithiothreitol (DTT) 1M solution in water, ammonium persulfate
(APS), 2-methyl-2-butanol and N,N,N′,N′-Tetramethylethylenediamine were purchased from Sigma.
Bovine serum albumin (BSA) standards (2 mg/mL) and BCA Protein Assay reagents were purchased
from Thermo Scientific Pierce (Rockford, IL, USA). The reagent 4-(2-hydroxyethyl) piperazine-1-
ethanesulfonic acid (HEPES) used in the buffer was bought from SIGMA-Aldrich. All other chemicals
were of analytical grade. Milli-Q water was obtained from a Milli-Q purification system (Millipore,
Bedford, MA, USA).
2.2 Bacterial strains and growth conditions
The bacterial strain of Burkholderia cenocepacia K56-2, kindly provided by Professor John
Lipuma from the University of Michigan, was initially grown on a petri plate supplemented with Luria-
Bertani broth (LB) agar at 37ºC before experiment. The strain was pre-inoculated over-night in a flask
with LB medium, at 37ºC and 250 rpm orbital agitation.
Two liters of LB liquid medium were inoculated with Burkholderia cenocepacia, initially with an
OD640 nm of 0,1, and were grown to an OD640 nm of 1,5, in about 5/6 hours of incubation at 37 ºC and
250 rpm. This protocol was based on several experiments procedures previously described [34].

27
2.3 OMVs Isolation Steps
2.3.1 OMVs Centrifugation
The bacterial culture was centrifuged to remove cells at 9500 rpm, at 4ºC for 10 minutes in a
Beckman J2-MC centrifuge using 6 sterilized Beckman centrifuge bottles. OMVs were gathered from
the supernatant after removing residual cells by filtration through a 0.22µm membrane
(Stericup&Steritop, Vacuum-driven filtration systems, Millipore Corporation, Billerica, USA) in order to
maintain sterility. To the vacuum sterile filtration, it was used a vacuum pump from KIF Laboport. The
2 L filtered solution containing OMVs was storaged at 4ºC in Schott flasks. A portion of filtrate was
plated on LB agar and incubated at 37ºC overnight to verify that the suspensions were free of bacteria.
2.3.2 Supernatant Ultrafiltration/Diafiltration
Two liters of supernatant containing OMVs were concentrated to 70 mL approximately by ultrafiltration
with a 100 kDa nominal molecular weight cut off (NMWC) hollow fibers cartridge with a membrane
area of 110 cm2. (QuixStand Benchtop System, GE Healthcare). After that, the supernatant was di-
filtered with a buffer of 4-(2-hydroxyethyl)-1-piperazineethanesulfonic acid (HEPES) at pH 7 and 10
mM [70]. The diafiltration/ultrafiltration was carried out in a tangential flow filtration system with a
Masterflex® L/S® pump, containing an Easy-Load® II pump head (model 7720050) (Vernon Hills, IL,
USA) and two pressure gauges connected (Anderson Instrument Company Inc., NY, USA). Last
experiments were concentrated with a 500 kDa hollow fibers cartridge with 650 cm2 of membrane
area, decreasing the operation time.
The operating conditions were established by selecting the pump’s speed (200 rpm) and adjusting the
valve’s closure at the concentrate outlet with a transmembrane working pressure of 10 psi. The
supernatants were diafiltrated with an equal volume of 10 mM, HEPES buffer, pH 7. The buffer and
the OMVs solution were at the same temperature to avoid thermal shocks. The permeate flow rate
was measured in each 200 mL processed, and an equal volume of buffer was added in the repository
at the same time. The retentate containing OMVs, proteins and cable pili with more of 100 kDa were
collected (approximately 75 ml) and the permeate was discarded. Afterwards, the hollow-fiber
membranes were cleaned with a pressure of 5 psi using 10% isopropanol and 0.1 M sodium hydroxide
after whole neutralization of the alkaline solution with water and stored in a 10% isopropanol solution.
2.3.3 Ultracentrifugation
The concentrate was ultracentrifuged at 30000 rpm for 3 h at 4°C in a Beckman XL-90
ultracentrifuge in 6 plastic tubes suitable for the machine. At the end, the supernatant was removed
and the OMVs pellet is re-suspended to obtain an enriched-OMVs pellet in a 10 mM HEPES buffer at
pH 7. The OMVs solution obtained (approximately 1,5 ml for batch) was storage at 4ºC.

28
2.4 OMVs Purification Strategies
2.4.1 Aqueous two-phase Systems
To prepare the biphasic systems, each compound of the system understudy was weighted
from stock solutions using an analytical balance (Metter Toledo XS105).
Stock solutions of 50 % (w/w) PEG; 25 % (w/w) Dextran; 40% ammonium sulfate and 40 %
potassium phosphate were prepared by dissolving the appropriate amounts of the polymers/salt in
milli-Q water in graduated falcon tubes of 15 ml.
PEG-Dextran Systems
To prepare the aqueous two-phase systems with a final weight of 2,5 g, it was weighing out
the correct amount of components from stock solutions of 50% (w/w) PEG 3350 and 8000 with 25%
(w/w) Dextran 500 kDa. Several system combinations with concentrations of PEG and Dextran
ranging from 6 to 8% were prepared by weighting the appropriate amounts of each component. The
mass of OMVs feedstock solution used in all the systems was 40%. Finally, mili-Q water is added in
order to achieve the desired final system composition.
PEG - Ammonium Sulfate Systems
The PEG-Ammonium sulfate systems used for ATPS had a total weight of 3 g with loads of 14
and 15% of ammonium sulfate with PEG 1000 and 3350 in concentrations of 15 and 13% (w/w),
respectively. The systems were prepared by weighting the correct amount of each component, adding
34% of OMVs solution and reaching the final weight by adding milli-Q water. The experiments were
conducted with pH 7.
PEG- Potassium Phosphate Systems
Two 3g systems with different combinations of PEG and potassium phosphate were tested
including i) 10% of PEG 3350, 10% phosphate at pH 7 and 34% of OMVs solution, and ii) 10% PEG
3350, 13% of phosphate buffer at pH 7 and 34% of OMVs solution. The systems were prepared by
weighting the appropriate amounts of each component, adding 1g of OMVs solution and reaching the
final weight of 3 g by adding milli-Q water.

29
2.4.2 Aqueous Two-Phase Extraction
Aqueous two-phase systems were prepared in graduated falcon tubes of 15 ml to be able to
read the volume of the phases after the separation. It was also prepared a blank for each system
previously mentioned, with the same phase forming components compositions, but containing water
instead of OMVs. The phase components were properly mixed on a vortex agitator (Ika, Staufen,
Germany) and afterwards the tubes were left to rest at room temperature (20-25°C). To ensure total
phase separation, the tubes are further centrifuge for 3 minutes, at 4000 rpm and 22ºC in a fixed-angle
rotor centrifuge (Eppendorf, Hamburg, Germany). Finally, top and bottom phases were carefully
separated first with a pipette for the removal of the top phase and then with a syringe for the bottom
phase.
2.4.3 Size Exclusion Chromatography (SEC)
In this work, several runs using two different gel filtration media were performed. The OMVs
feedstock solution obtaining in the diafiltration step was loaded either onto a column pre-packed with
Superose 6 (10/300 GL, GE Healthcare Life Sciences) or in a Tricorn 5/100 column packed with
Sephacryl S-1000 Superfine (GE Healthcare Life Sciences).
Superose 6 10/300 GL has a fractionation range of 5 to 5000 kDa. and a bed volume of 24 ml.
The matrix is composed by cross-linked agarose and has a particle size distribution of 11 –15 µm.
Sephacryl S-1000 Superfine is a gel filtration media with a high exclusion limit used as a
packing column material with a fractionation of 500 to 500000 kDa. The packed column had a bed
volume of 15 ml approximately. The inert and highly stable matrix is prepared by covalently cross-
linking allyl dextran with N,N’-methylenebisacrylamide and has an average particle size of 40-105 µm.
All chromatographic experiments will be carried out on an ÄKTA™ Purifier 10 system (GE
Healthcare, Uppsala, Sweden). The data collection and processing was accomplished using
UNICORN control software Chromatographic parameters such as conductivity and UV absorbance at
280 nm of the outlet sample were continuously measured.
In the case of Sephacryl S-1000 gel filtration, the column was equilibrated with 2 column
volumes (CV) of 10 mM HEPES buffer pH 7, prior to injection at 1 mL/min. A load of 1.5 mL of OMVs
sample without any pre-conditioning step was injected at 0.5 mL/min using a 1 mL sample loop. The
chromatographic runs performed using the Superose 6 column, followed the same protocol but 2 mL
of OMVs sample was injected with a 2 ml loop at 0.5 ml/min. All buffers were filtered prior to the
chromatography procedure through a 0.45 μm filter (Millipore, Bedford, MA, USA). An isocratic elution
was performed with 2 CV of the equilibration buffer on the both columns and the flow-through and the
elute were continuously collected as 0.5 mL fractions in a FRAC 950 fraction collector (GE
Healthcare).

30
2.4.4. Ion-Exchange Chromatography (IEX)
Anion-exchange chromatography was also evaluated for the purification of OMVs using a
CIM® disk monolithic column (BIA Separations, Ljubljana, Slovenia) containing quaternary amines
(QA). The CIM® monolithic column is a 3 mm×12 mm disk-shaped highly porous polyglycidyl
methacrylate-co-ethylene dimethacrylate matrix with a bed volume and porosity of 0.34 mL and 62%,
respectively. The channels within the column have a diameter of 1500 nm. The monolithic disk is stuck
in a polyetheretherketon housing (BIA Separations).
These experiments were also performed in an ÄKTA™ Purifier 10 system (GE Healthcare). During
the procedure, the UV absorbance was measured at 280 nm at a flow rate of 0.5 ml/min. The volume
of OMVs sample applied to the monolithic column was 2.5 mL with a 2 mL sample loop. Equilibration
of the disk monolithic column was carried out with 2 CVs of the adsorption buffer, 10 mM HEPES, at
different pH values of 7, 6, 5 and 4 (depending on the runs). All buffers were filtered prior to the
chromatography procedure through a 0.45 μm filter (Millipore, Bedford, MA, USA). Unbound
substances were washed out using 5 CV of adsorption buffer at a flow rate of 0.5 mL/min. Linear
gradient elution was undertaken with 5 CV using 10 mM HEPES at pH7 with 1 M NaCl. After loading,
washing and elution, an aliquot of each fraction or fraction pools was analyzed. Samples were stored
at 4ºC until further analysis. The disk monolithic column was cleaning by washing with Milli-Q water in
order to remove precipitated proteins. Additionally, the column was further cleaned with 20% (v/v)
ethanol to remove some bound hydrophobic proteins or lipids.
2.5 OMVs Analysis
2.5.1 Particle size distribution and measurement of potential zeta
The size and zeta-potential parameters were evaluated in the samples, before and after
purification using chromatography, in an electrophoretic light scattering apparatus (Zetasizer Nano ZS,
Malvern Instruments, United Kingdom). The data was analyzed with a versatile software in order to
obtain the average hydrodynamic diameter of the particles in solution. The measurements were
conducted at 22ºC with three replicated runs of 5 min each, for each sample, and the average intensity
weighted diameter was calculated. To measure these parameters, the samples were diluted with
10mM HEPES buffer, pH 7, with a refractive index of 1.59 and a viscosity of 0.89 [70].
2.5.2 Protein gel electrophoresis
To evaluate qualitatively the ATPS phases and the SEC and IEX fractions a sodium dodecyl
sulfate–polyacrylamide gel electrophoresis (SDS-Page) was performed. In the case of ATPS, since
PEG and dextran are very viscous and produce distorted lanes on the gel, samples were first diluted
in milli-Q water to decrease the load of polymer. Samples were then diluted in a loading buffer

31
containing 62.5 mM Tris-HCl, pH 6.2, 2% SDS, 0.01% bromophenol blue and 10% glycerol, and
denatured in reducing conditions (0.1 M dithiothreitol (DTT)), at 100 °C for 10 minutes. For a final
volume of 50 µL, 25 µL of loading buffer, 20 µL of sample, and 5 µL of 1 M DTT were used. A volume
of 20 µL of these samples was applied in a 12% acrylamide gel, prepared from a 40%
acrylamide/bisacrylamide stock solution (29:1), and ran at 90-120 mV using a running buffer
containing 25 mM Tris-HCl, 192 mM glycine and 0.1% (w/v) SDS at pH 8.3. The molecular marker
used in all gels was the Precision Plus Protein™ Dual Color Standards, from Bio-Rad.
Gels were stained in an aqueous solution containing 0.1% Coomassie Brilliant Blue R-250 in
30% ethanol and 10% acetic acid for 1 hour. Distaining was achieved by successively washing the
gels with 30% (v/v) ethanol and 10% (v/v) acetic acid, until background color disappeared. Gels were
stored in Milli-Q water at room temperature. The SDS-PAGE gels were scanned using a GS-800
calibrated densitometer from Bio-Rad.
When the intensity of the bands was too low, the silver staining has a higher sensitivity (in the
very low ng range) than the Coomassie staining. In this type of staining proteins bind silver ions, which
can be reduced under appropriate conditions to build gels were further stained with silver nitrate up a
visible image made of finely divided silver metal. The methods involves several steps that are
described in Table 2.
Table 2- Steps of the silver staining procedure.
Step
Description
1. Fixation Incubation in an oxidizer solution, composed of
0.8 mM sodium thiosulphate for 10 min
2. Rinse Washing with Milli-Q water for 3 times of 5 min
each
3. Impregnation Incubation with a fresh silver nitrate solution
(11.8 mM silver nitrate, 0.02% formaldehyde) for 30 min
4. Rinse Washing with Milli-Q water for 3 times of 1 min
each
5. Development Incubation with a developer solution, composed of 0.566 M sodium carbonate, 0.02 mM sodium
thiosulphate and 0.02% formaldehyde
6. Stop Incubation in a stop solution, composed of 50% ethanol, 12% acetic acid in Milli-Q water for 15
min

32
2.5.3 Total Protein Quantification - BCA Assay
Total protein concentration was determined by the BCA method using a reagent kit from
Pierce (Rockford, IL, USA). The Pierce BCA Protein Assay is a detergent-compatible formulation
based on bicinchoninic acid (BCA) for the colorimetric detection and quantitation of total protein. This
method combines the well-known reduction of Cu+2
to Cu+1
by protein in an alkaline medium (the
biuret reaction) with the highly sensitive and selective colorimetric detection of the cuprous cation
(Cu+1
) using a unique reagent containing bicinchoninic acid. The purple-colored reaction product of
this assay is formed by the chelation of two molecules of BCA with one cuprous ion [71].
Bovine serum albumin (BSA) was used as a standard for protein calibration, and the
calibration curves were prepared using a set standard with concentrations between 5 to 400 mg/L.
The assays were set up in 96well polystyrene microplates and 200 μL of the reagent were added to 25
μL of samples, blanks and standard solutions. The plate was mixed on a plate shaker for 30 seconds,
and incubated for 30 min at 37ºC. Absorbance was read at 562 nm in a Spectramax 384 Plus
microplate reader from Molecular Devices (Sunnyvale, CA, USA). To avoid interference from HEPES
and polymers, all samples from top and bottom phases were analyzed against blanks systems
containing the same phase composition.
2.5.4 Purity evaluation- Transmission electron microscopy (TEM)
The chromatography fractions will be recovered and evaluated by transmission electron
microscopy to access the purity. Ten microliters of the fractions were negatively stained with freshly
prepared uranyl acetate 2% on carbon-coated copper grids. The pool of fractions obtained in the
chromatography had to be ultracentrifugated in order to increase the concentration. TEM analysis was
performed in collaboration with Dr. António Pedro Alves de Matos, head of Electron Microscopy
Laboratory of the Egas Moniz – Cooperativa de Ensino Superior.
2.6 Evaluative parameters
To evaluate the effectiveness of the separation through aqueous two-phase systems, the partition
coefficient, KP, was calculated and used to measure the degree of separation of the components in
solution between the two phases of the ATPS. This parameter was calculated by the quotient of the
total protein in the bottom and at the top phase.
(4)

33
3. Results and Discussion
3.1 Bacterial Growth Curve During this work, the growth of Burkholderia cenocepacia K56-2 was studied by measuring
the optical density at 640 nm along the time at 37 ºC and 250 rpm in LB media. The culture conditions
were equal in all produced batches. The batch had an initial OD640nm of 0.1 and the lag phase, during
which bacteria adapt themselves to growth conditions, occurred very fast (about 15 minutes). The
exponential phase came next and last 5.5 hours reaching a OD640 nm of 1.5. The fermentation was stop
at this point because the maximum production of outer membrane vesicles and other components is
achieved at this stage, just before the stationary phase start due to depletion of essential nutrients
(Figure 19).
Figure 19- Representative curve of Burkholderia cenocepacia k56-2 growth.
3.2 OMVs Primary Isolation Steps
In order to isolate the outer membrane vesicles from the initial culture, some steps were
performed involving centrifugation, concentration, ultrafiltration, diafiltration and ultracentrifugation.
Each step tends to lower the yield of the purification.
0
0,2
0,4
0,6
0,8
1
1,2
1,4
1,6
1,8
2
0 1 2 3 4 5 6 7
OD
64
0 n
m
Time (h)

34
3.2.1 Performance of the Ultrafiltration/Diafiltration Columns
For most of the batches, a 100 kDa hollow fibers cartridge with a membrane area of 110 cm2
was used to perform the ultrafiltration. For this cartridge, the decrease in the permeate flow rate,
during the ultrafiltration, is shown in Figure 20.
Figure 20- Performance of the ultrafiltration/diafiltration column.
The permeate flow rates obtained during the tangential flow filtration of 2 liters of
supernatant shows a decrease as the volume filtrated increases. The ultrafiltration was first performed
in a concentration mode until a volumetric concentration factor of around 4 was reached in the
retentate. Then, the ultrafiltration was performed in a diafiltration mode with HEPES buffer pH 7 being
in added in order to keep the concentrate volume constant. A total of 2 L of HEPES buffer was added,
which represents an operation using 4 diafiltrations volumes. The graphic exhibits 3 fixed flow rate
zones with the lower value being reached at the diafiltration stage with 12 mL/min. The decrease and
stabilization of the flowrate is due to clogging of the membrane which makes the process time-
consuming.
Some batches were performed in a different ultrafiltration module. This new hollow fiber
cartridge has a larger cutoff of 500 kDa and a higher membrane area of 650 cm2, about six times
more. The higher cutoff allows the separation of larger proteins and can also remove some pili with
less than 500 kDa, which is advantageous for the OMVs isolation. The performance of the
ultrafiltration obtained is shown in the graph below (Fig. 21).
11
12
13
14
15
16
0 500 1000 1500 2000 2500 3000 3500 4000
Flo
w r
ate
of
per
mea
te (
mL/
min
)
Filtrated (mL)

35
Figure 21- Representation of the flowrate of permeate curve during UF/DF.
In this case, it can be seen the influence of a larger pore and a higher area, which allowed
significant higher flow rates of permeate to be obtained. The flow rates varied from 80 mL/min in the
beginning of the run to 66 mL/min, in the end of the filtration. The concentrate obtained after the
UF/DF step was further processed by ultracentrifugation.
3.2.2 Total Protein Quantification
In order to assess the total protein concentration during the isolation steps, it was used the
BCA quantification method to measure the samples collected after each operation (Table 3).
Table 3- Total protein in µg/mL present after each operation method.
Operation
Total Protein µg/mL
Step 1. Centrifugation 500-700
Step 2. Ultrafiltration / Diafiltration 50-100
Step 3. Ultracentrifugation 70-300
60
70
80
90
0 500 1000 1500 2000 2500 3000 3500 4000
Flo
wra
te o
f p
erm
eate
(m
L/m
in)
Filtrated (mL)

36
After fermentation, the clarified supernatant had a protein content of around 600 µg/mL which
was considerably reduced to 50-100 µg/mL, despite the concentration of the initial feedstock in the
UF/DF step. The concentration ranges obtained in the last primary isolation step of OMVs isolation
(ultracentrifugation) comprises the values between 70 and 300 µg/mL, which reveals a low production
of outer membrane vesicles by the Burkholderia cenocepacia K56-2.
3.2.3 Particle size distribution and potential zeta
To analyze particle size distributions in a sample, there are three types of distributions
available: a number distribution, a volume distribution or an intensity distribution which give the
number of particles, the total volume of particles or the intensity of the light scattered by the particles,
respectively, in the different size bins. The number, intensity and volume size distribution of the
particles present in the feedstock solution after the ultracentrifugation step is shown in figure 22. The
volume distribution assumes that the particles are spherical and consequently the particle volume is
proportional to the third power of the particle size while the intensity distribution is proportional to the
sixth power of the particle size.
The table 4 with the results obtained for three runs on Zetasizer and the graphics of the
second run (Fig. 22) are shown above.
Table 4- Size distribution of OMVs particles analyses in triplicate in a Zetasizer.
Run PdI
Z-
average
(nm)
1st
Peak 2nd
Peak 3rd
Peak
d (nm) Area (%) d (nm) Area (%) d (nm) Area (%)
1 0.620 238.5 131.5 38.8 501.2 50.2 4518 11
2 0.620 235.3 117.0 39.1 514.8 53.9 4985 7
3 0.663 230.1 27.71 1 518.3 88.2 4037 10.8

37
Figure 22- Size distribution by number (A), intensity (B) and volume (C) of the feedstock
solution analyzed by the Zetasizer software corresponding to the second run.
After inject the sample, an average size (Z-average) was estimated by the system. In this
case, it was obtained a particles size about 200-250 nm, which was expected for this type of vesicles.
Besides this type of average size determination based on cumulants method, i.e, a method that takes
into account all the populations in solution, even the smallest, there is a second type that considers
only the relevant populations and only these are showed on the graphic (Fig. 22 B,C). In this case,
there were observed three types of relevant population, represented by the first, second and third
peak. The third peak had a huge deviation comparing to others, which indicates the presence of
particle aggregates in solution. However, observing the figure 22 A is possible to conclude that the
most abundant population has about 20 and 100 nm. Populations with less of 1 % in the solution are
never considered by the system. The result quality was considered good by the Zetasizer software
according correlation coefficients.
Another measure given by Zetasizer is the polydispersity indexes (PdI), a parameter with
values between 0 and 1, related with the homogeneity of the sample. In this case, it was obtained a
PdI of 0.62, which reveals the low homogeneity of the solution, which corroborates with the volume
and intensity graphics.

38
The Zetasizer equipment also allowed measuring the zeta potential (ζ), i.e. the electric
potential difference between the dispersion medium and the stationary layer of fluid attached to the
dispersed particle (Fig. 23).
Figure 23- Zeta (ζ ) potential distribution at pH7.
The results of zeta potential shown that for three runs using the same sample, the average
potential estimative varied between -25 and -30 mV at neutral pH, and they were also good results.
The magnitude of the zeta potential indicates the degree of electrostatic repulsion between adjacent,
similarly charged particles in a dispersion and the values obtained show that the particles have
negative charge, which is an important feature to separate them by their charge with a
chromatography.
3.2.4 Feed characterization
Before starting the final purification studies, the characterization of the medium that contains
the OMVs was performed. The outer membrane vesicles are produced by bacteria in different sizes
and their protein composition also varies.
The protein gel electrophoresis (SDS-PAGE) technique was selected since allows a visual
evaluation of the purity of the sample. Furthermore, it is a cost-effective technique with an easy
protocol. Figure 24 illustrates the protein profile of feedstock samples from different batches to be
used in the partitioning and chromatographic studies.

39
Figure 24- Silver-stained SDS-PAGE illustrating the proteins in the feedstock from different
production batches (Lane 1, 2, 3) containing OMVs through SDS-PAGE electrophoresis. M: Protein
molecular weight marker.
As previously reported in published research studies about natural membrane vesicles from
Burkholderia cenocepacia when analyzed by SDS-PAGE, OMVs contain proteins from the outer
membrane of the cells [34]. In lane 1,2 and 3 is possible to confirm the common presence of one band
with high molecular weight between 250 and 150 kDa and one intensive band between 50 and 37
kDa. There are other two bands between 50 and 75 kDa that are also present in the three different
batches. It is however difficult to know if they are impurities in the gel or not. Other outer membrane
proteins are also present in the gel with different sizes, mainly between 37 and 25 kDa. As referred in
other works about Burkholderia cenocepacia, the intensive band at 31 and the band at 21 kDa are
present in both outer membrane and OMVs but are clearly enriched in the outer membrane fraction
[34]. Among so many proteins in solution, there are two important ones: the adhesin with 22 kDa and
the 16 kDa basic protein from cable pili [34]. It is difficult to observe in lane 1 and 2 the cable pili 15-
kDa protein due to its low concentration in the solution. However the lanes containing all the outer
membrane proteins, there are unique proteins only present in OMVs [34]. In general, it can be found a
similar protein pattern in the various samples from different batches. By observing the feedstock with a
transmission electron microscope (Fig. 25), it is possible to see the various filaments corresponding to
flagella and cable pili. There are also present the spherical vesicles in different sizes.

40
Figure 25- Feedstock imaged with a Transmission Electron Microscope (TEM). Arrows point to outer
membrane vesicles (OMV), cable pili (cb), flagella (f).
After this brief characterization, ATPS partition and clarification studies were performed.
Different types of ATPS were evaluated, namely, PEG-dextran, PEG-ammonium sulfate and PEG-
potassium phosphate and the results obtained are described in the following sections.
3.3 OMVs Purification 3.3.1 Development of aqueous two-phase systems
The use of aqueous two-phase partition techniques for separation or purification of biological
solutes is based on the observation that the components of an initial multicomponent mixture of the
solutes (peptides, proteins, etc.) distribute between the two phases independently of each other,
provided the components do not interact with each other.
The main goal with ATPS consisted in finding possible systems to be used for purification of
Burkholderia cenocepacia K56-2 OMVs, i.e. to separate the cable pili (the main contaminant) or the
OMVs from many other proteins in solution. Without any reference based in this technique, it was
initially tested the aqueous two phase systems of the type polymer-polymer by the combination of
PEG and dextran. Polyethylene glycol (PEG) has a relatively low viscosity when compared to other
polymers, like dextran, it is harmless, easily handled and relatively inexpensive. The top phase is
enriched in the more hydrophobic polyethylene glycol (PEG) and the bottom phase consists mainly of
the hydrophilic and denser dextran solution. Although PEG is inherently denser than water, it occupies
the upper layer. This is believed to be due to its solvent ordering properties, which excludes excess
f
OMV
cp

41
water, creating a low density water environment. The degree of polymerization of PEG also affects the
phase separation and the partitioning of molecules during extraction.
Several PEGs with different molecular weights and dextran were combined in order to verify if
ATPS could be formed at reasonable concentrations. The composition of this systems was based on
phase diagrams for PEG-dextran depending on the polymers molecular weight and temperature [66].
Since systems with polymers with higher molecular weight typically require lower concentrations of
phase forming compounds for phase formation, dextran 500 000, 100 000 and 40 000, and PEG 3 350
and 8 000 were then tested at compositions of PEG and dextran relatively low (3% to 10% PEG, 6%
to 10% dextran), viable at industrial level.
The possibility of using polymer-salt systems was also investigated for PEG 1000 and 3350,
using two types of salts: ammonium sulfate and potassium phosphate, also at low concentrations
(10% to 15%). Phosphate is a non flammable and non-toxic salt and is the most used salt in aqueous
two phase systems because it has a strong salting out effect. This type of systems had been used in
previous works for purification of proteins. Ammonium sulfate is less commonly used but it has also a
strong salting-out effect. So considering the salting-out effect of both sulfate and phosphate salts,
PEG-ammonium sulfate and PEG- potassium phosphate were also selected as possible candidates
for two-phase partitioning, since they are widely used and well known, with phase diagrams available
for system creation [66].
3.3.1.1 Polymer-polymer systems
The results of the multicomponent protein mixture partitioning with PEG-dextran showed a
higher affinity for the PEG-rich top phase for all the 8 systems performed. The increase in the
molecular weight of PEG from 3350 to 8000 Da did not seem to have interfered with the partition
profile. In figure 26 (A) is possible to see that most of the bands present in the lane 1 (feed) are also
present in the other lanes. On the other hand, the protein gel electrophoresis of the dextran-rich
bottom phase (Fig. 26 B), demonstrated the presence of only two bands between 25 and 37 kDa,
except on systems 2, 3 and 4 with PEG 3350 where no bands are shown, probably due to an
extremely low protein concentration. All the systems were studied at pH 7, the feedstock pH.

42
A
B
Figure 26- Qualitative analysis of the purity of both phases from PEG-dextran ATPS through
SDS-PAGE electroforese. Top phases are illustrated in (A) and bottom phases in (B) composed by
the following systems: 6% PEG 3350-6.14% dextran (2), 6.5% PEG 3350- 6.5% dextran (3), 7% PEG
3350- 7% dextran (4), 8% PEG 3350- 8% dextran (5), 3.8% PEG 8000- 5.2% dextran (6), 4.4% PEG
8000- 6.2% dextran (7), 5% PEG 8000- 7% dextran (8), 5.8% PEG 8000- 8.4% dextran (9) at pH 7.
Protein molecular weight marker (M). Feed (1). It was used a dextran with a molecular weight of 500
kDa. Proteins were separated by 12% SDS-PAGE and visualized by silver staining.
The fact that the proteins present on top have only affinity for that phase and vice versa is
advantageous to perform an efficient separation.
However, it cannot be affirmed that these systems allowed the separation of the outer
membrane proteins from the pili without performing a Western blotting.

43
3.3.1.2 Polymer-Salt systems
Polymer-salt systems can induce salting out effects on proteins and typically allow a fast
formation of the two phases. Compared with polymer-polymer systems such as PEG-dextran,
polymer-salt systems are typically formed at slightly higher concentrations, nevertheless the
concentrations of salts used were kept relatively low to avoid proteins precipitation. Two different salts
were investigated: ammonium sulfate and potassium phosphate.
PEG 1000-salt systems were first elaborated with 14% ammonium sulfate- 15% PEG 1000
and 15% potassium phosphate- 13% PEG 1000, both at pH 7. Afterwards, a polymer with a high
molecular weight (PEG 3350) was also tested. The results obtained can be observed in the figure 27.
Accordingly, there are not many differences in the profile obtained for the four systems. Both in the top
and in the bottom phases is possible to observe the same two bands with molecular weights between
50 and 75 kDa, which means that these proteins have no preferential affinity for any of the phases.
Regarding the bands with lower molecular weight present in the feed (lane 1), they are not detected in
the top or in the bottom phase showing that they could have partitioned towards the interface
(probably precipitated).
A B
Figure 27- Qualitative analysis of the purity of both phases from PEG-ammonium sulfate and
PEG-potassium phosphate ATPS. Top phases are illustrated in (A) and bottom phases in (B)
composed by the following systems: 15% PEG 1000- 14% (NH₄)₂SO₄ (2), 13% PEG 3350- 15%
(NH₄)₂SO₄ (3), 10% PEG 3350- 10% KH2PO4 (4), 13% PEG 1000- 15% KH2PO4 at pH 7. Protein
molecular weight marker (M). Feed (1). Proteins were separated by 12% SDS-PAGE electrophorese
and visualized by silver staining.
Aqueous two-phase systems are thus not efficient for the purification of the OMVs. This is
mainly due to the fact that the systems cause a dilution of the already very diluted feedstock, and
consequentely this method would not be appellative at an industrial scale.

44
3.3.1.3 Total protein concentration of ATPS
After phase separation, the total protein concentration in both phases was measured using
the Pierce BCA protein assay. The results of this quantitative analysis (Fig. 28) showed that the
concentration of proteins was higher in the top phase, as it would be expected according the
electrophoresis gels. Furthermore, the bottom phase of the PEG-Dextran systems revealed the
presence of protein, although not visible in the gel.
Figure 28- Quantitative analysis of the total protein concentration in µg/mL of both phases
from PEG-dextran ATPS through Pierce BCA protein assay. Top phases are illustrated by a (t) and
bottom phases by a (b) composed by the following systems: 6% PEG 3350-6,14% dextran (1), 6,50%
PEG 3350- 6,50% dextran (2), 7% PEG 3350- 7% dextran (3), 8% PEG 3350- 8% dextran (4), 3,80%
PEG 8000- 5,20% dextran (5), 4,40% PEG 8000- 6,20% dextran (6), 5% PEG 8000- 7% dextran (7),
5,80% PEG 8000- 8,40% dextran (8) at pH 7.
In order to classify PEG- dextran systems, partition coefficients were calculated by the ratio
between the concentration of total protein on the top and the bottom and the results obtained are
presented in figure 29.
0
50
100
150
200
250
Co
nce
ntr
atio
n µ
g/m
L

45
Figure 29- Representation of the partition coefficients values of the previously studied
aqueous two-phase systems composed by: 6% PEG 3350-6,14% dextran (1), 6,50% PEG 3350-
6,50% dextran (2), 7% PEG 3350- 7% dextran (3), 8% PEG 3350- 8% dextran (4), 3,80% PEG 8000-
5,20% dextran (5), 4,40% PEG 8000- 6,20% dextran (6), 5% PEG 8000- 7% dextran (7), 5,80% PEG
8000- 8,40% dextran (8) at pH 7.
The Kp values for each system showed that the highest partitioning of proteins to the top
phase occurred mainly in systems 1, 7 and 8, with a Kp of 4.25; 4.36 and 4.30, respectively, where the
concentration on top phase was higher. Moreover, the other systems showed a coefficient with
approximate values.
However, it is important to refer that this parameter can suggest the partition behavior of a
multicomponent protein mixture and may be viewed as a general quantitative characteristic of the total
protein mix.
3.3.2 Size Exclusion Chromatography
3.3.2.1 Chromatograhy on Superose 6
Agarose gel matrix is often used for protein purification in size-exclusion chromatography.
These agarose-based beads are generally soft and easily crushed, so they should be used under
gravity-flow, low-speed centrifugation, or low-pressure procedures. Agarose is a useful material for
chromatography because it does not absorb biomolecules to any significant extent, has good flow
properties, and can tolerate extremes of pH and ionic strength as well as high concentration of
denaturants [71]. One of the most used agarose-based matrix for size-exclusion chromatography is
Superose (highly cross-linked beaded agarose).
0
0,5
1
1,5
2
2,5
3
3,5
4
4,5
5
1 2 3 4 5 6 7 8
Kp

46
The Superose 6 column was initially run with the OMVs feedstock in HEPES buffer at pH 7
from the last isolation step (ultracentrifugation). The column was equilibrated with the same buffer 10
mM HEPES and pH 7. The chromatogram obtained for the feed is presented in figure 30.
Figure 30- SEC run with a Superose 6 column for the separation of OMVs from a 2,5 mL
sample of the OMVs feedstock and 10 mM HEPES at pH 7 of preparation buffer.
Large particles cannot enter the gel and pass more freely, appearing in the earlier fractions,
while small particles enter the gel and have more volume to transverse, eluting later.
The two first peaks in the chromatogram (one with around 90 mAU and another with 270
mAU) represent the components recovered with high molecular weight. An SDS-PAGE was run to see
what proteins were presented in each peak and the results obtained are in the figure 31.
0,00
0,05
0,10
0,15
0,20
0,25
0,30
-50,00
0,00
50,00
100,00
150,00
200,00
250,00
300,00
0,00 10,00 20,00 30,00 40,00
Co
nd
uct
ivit
y (m
S/cm
)
Volume (mL)
UV
ab
sorp
tio
n (
mA
U)
UV absorption Conductivity
1
2

47
Figure 31- Silver stained reducing SDS-PAGE analysis of each chromatography fraction. Lane
1: Feed; Lane 2,3,4: first elution peak fractions; Lane 5,6,7: fractions of second elution peak; Lane 8,9:
last fractions of SEC; M: protein molecular weight marker in kDa. Proteins were separated by 12%
SDS-PAGE electrophorese.
Observing the SDS-PAGE analysis (Fig. 31), it is possible to conclude that the most intensive
band on lane 1 between 50 and 37 kDa is eluted on the first peak as shown on lane 2,3 and 4.
However, it is possible to see other bands from different proteins that also appear in the next fractions
with 25 kDa approximately. This peak is very low comparing to the second one because the quantity
of proteins in it is also low. Observing lane 5, 6 and 7, corresponding to the second peak, is possible
to notice more intensive bands between 75 and 50 kDa.
3.3.2.2 Chromatography on Sephacryl-S1000 Superfine
Sephacryl S-1000 gel filtration media allow fast and reproducible purification of large
biomolecules including DNA and large polysaccharides, proteoglycans and small particles (e.g.,
membrane-bound vesicles and viruses).
The superfine feature of the gel filtration medium confers a high exclusion limit to the process.
The inert and highly stable matrix, specially treated to provide high recoveries of biopolymers, is
prepared by covalently cross-linking allyl dextran with N,N’-methylenebisacrylamide. The high
mechanical strength of the resulting beads allows high flow rates and fast separations to be achieved
[55].
The Sephacryl-S1000 column was initially run with the OMVs feedstock in HEPES buffer at pH
7. The column was also equilibrated with 10 mM HEPES buffer at pH 7. The chromatogram obtained
is presented in figure 32.

48
Figure 32- SEC run with a Sephacryl-S1000 Superfine column for the separation of OMVs
from a 1,5 mL sample of the OMVs feedstock and 10 mM HEPES at pH 7 of preparation buffer.
Two types of populations were considered to be present in the sample, the first eluting with a
retention volume between 5 and 14 mL, and the second eluting with a retention volume between 14
and 25 mL. The absorption levels of the peaks in this run were similar to the ones obtained for the
Superose 6 column but the elution profile was different. Indeed, the Sephacryl column is better suited
for the separation of large molecular weight species such as OMVs allowing a better resolution
between high molecular weight species than Superose. By SDS-PAGE analysis is possible to observe
in the figure 33, which proteins were presented in each peak.
Figure 33- Silver stained reducing SDS-PAGE analysis of chromatography fractions. Lane 1:
Feedstock loaded; Lane 2: first elution peak; Lane 3: second elution peak; M: protein molecular weight
marker in kDa. Proteins were separated by 12% SDS-PAGE electrophorese.
0,00
0,05
0,10
0,15
0,20
0,25
0,30
-50,00
0,00
50,00
100,00
150,00
200,00
250,00
300,00
350,00
0,00 5,00 10,00 15,00 20,00 25,00 30,00 35,00
Co
nd
uct
ivit
y (m
S/cm
)
UV
ab
sorp
tio
n (
mA
U)
Volume (mL)
Abs 280 nm Conductivity
2
1

49
Due to the low amount of OMVs in only one batch, corresponding to 2 liters of production, and
due to the fact that there is dilution of the sample during chromatography, it was necessary to produce
two batches, to perform two runs and join the collected fractions in order to increase the mass of
OMVs present. The profile shown in figure 33 represents the profile of two consecutive separations.
3.3.2.3 Transmission electron microscopy
The main goal of this purification is to separate the pili and flagella from the vesicles, which
can be subsequently confirmed by visualization of the chromatographic fractions by transmission
electron microscopy (TEM). According to TEM analysis, the first peak from the size exclusion
chromatography with Sephacryl-S1000 contained no pili or flagella, only OMVs in a low amount and
some aggregates relative to one single separation (Fig. 34).
Figure 34- First elution peak fractions imaged by Transmission Electron Microscope (TEM).
Arrows point to outer membrane vesicles (OMVs).
3.3.3 Chromatography with QA monolithic disk
Ion exchange chromatography (IEX) is a versatile and extensively used tool in downstream
processing, based on electrostatic interaction between a charged molecule and an oppositely charged
stationary phase. The molecule binds at low salt concentration, while desorption is effected by
increasing salt concentration. Ion exchange ligands are classified as either strong or weak, depending
on their charge as a function of pH.
QA (quaternary amine) is a strong anion exchange group, fully charged between pH 2-13. It
selectively binds molecules with a predominant negative charge over a working pH range of 2-13. QA
200 nm

50
0
20
40
60
80
100
-500
0
500
1000
1500
2000
2500
0 5 10 15 20 25
Co
nd
uct
ivit
y (m
S/cm
)
A
UV
ab
sorp
tio
n (
mA
U)
Volume (mL)
Abs 280 nm Conductivity
is a versatile chemistry for various applications in capture, intermediate, or polishing steps of
downstream processing. Due to the difference in the chemistry of QA (strong anion exchanger) and
DEAE (weak anion exchanger), selectivities for a certain molecules can be different.
To start the chromatographic studies, a strong anion exchange group was used, the
quaternary amine (QA), fully charged between pH 2-13. Its high binding capacity for proteins can
make QA an adequate tool for the recovery of OMVs. In particular, monolithic QA has proven of value
for purification and concentration of viruses, VLPs, and large proteins due toiIts high binding capacity
for large molecules.
The conditions tested in the several runs were relative to pH on the 10 mM HEPES adsorption
buffer. In all the runs, the elution buffer was maintained with 10 Mm HEPES at pH 7 and 1 M of NaCl,
in this case, a buffer with higher ionic strength. The pH of the feedstock to load, containing OMVs, was
initially adjusted according to the pH of the adsorption buffer.
The feedstock without a preconditioning step was loaded into the CIM (Convective Interaction
Media) QA monolithic disk with a bed volume of 0.34 mL, with a working pH of 7, as illustrated in
Figure 35.
Figure 35- CIM QA® chromatography profiles of 1,5 mL OMVs feedstock from two different
batches (A) and (B), using as adsorption buffer 10 mM HEPES at pH 7 and elution buffer 10 mM
HEPES with1 M NaCl at pH 7.
When observing the chromatograms one can verify the presence of the characteristic flow-
through and elution peaks corresponding to the unbound proteins and the proteins that were bound to
the column and then recovered in the elution.
In each production (A) and (B), the chromatography profile has shown to be almost identic
which revealed uniformity on the sample containing OMVs. The results displayed by the
chromatogram in figure 35 show that in the flow-through there is no representable peak which
indicates the biding of almost all the charged species to the positive monolith. During the linear
0
20
40
60
80
100
-1000
0
1000
2000
3000
0 5 10 15 20 25
Co
nd
uct
ivit
y (m
S/cm
)
B
UV
ab
sorp
tio
n (
mA
U)
Volume (mL)
Abs 280 nm Conductivity

51
gradient elution, two peaks were obtained. In the best scenario, one of these peaks would only have
the outer membrane vesicles, separated from pili and flagella.
The SDS-PAGE gel below reveals that the first species to elute, the ones with low ion
interaction with the monolith, had low molecular weights comparing to the ones of the second peak.
Although, the gel was not conclusive and did not allow a prevision of the purification of the vesicles. In
sum, the purity assessment seemed to be very difficult when studying OMVs purification, being
necessary a visualization by transmission electron microscopy.
Figure 36- Silver stained reducing SDS-PAGE analysis of chromatography fractions. Lane 1:
Feed; Lane 2,3: flow-through fractions; Lane 4,5,6: first elution peak fractions; Lane 7,8,9: second
elution peak fractions; M: protein molecular weight marker in kDa. Proteins were separated by 12%
SDS-PAGE electrophorese.

52
3.3.3.1 Transmission electron microscopy
By observing the fractions with a transmission electron miscroscope (Fig. 37), it was possible
to analyze that in the first peak, flagella and pili are presented along with OMVs in aggregate form and
in the second peak, the filaments of flagella are notable along OMVs, cable pili and protein
aggregates.
Figure 37- First (A) and second (B) elution peaks fractions imaged by Transmission Electron
Microscope (TEM). Arrows point to outer membrane vesicles (OMV) and flagella (f).
Altogether, monolithic chromatography seemed to be not suitable for OMVs purification since
no effective separation of vesicles from the pili and flagella was achieved.
A
OMV
f
B
200 nm
200 nm

53
0
20
40
60
80
100
-500
0
500
1000
1500
0 5 10 15 20 25
Co
nd
uct
ivit
y (m
S/cm
)
B
UV
ab
sorp
tio
n (
mA
U)
Volume (mL)
Abs 280 nm Conductivity
3.3.3.2 The effect of the working pH
It was studied the effect of working pH in QA monolithic disk chromatography and it were
tested low pH values of 6.5 and 4 on the feed to load and on the adsorption buffer to prepare the
column. The obtained results are shown in the figures below:
Figure 38- CIM QA® chromatography profiles of 1,5 mL OMVs feedstock using as adsorption
buffer 10 mM HEPES with the following pH: 6 (A); 5 (B); 4 (C) and elution buffer 10 mM HEPES with
1 M NaCl at pH 7.
The chromatograms showed that the profiles with pH values of 6 and 5 in the adsorption buffer
are similar to the ones with neutral pH, with the same residence times. However, when the pH is
decreased to 4, it was observed a different elution profile. The flow-through peak was larger indicating
a higher number of proteins with the same charge of the matrix and the elution peaks were lower and
wider due to the use of a large gradient time. During the run, the pressure reached high values in the
adsorption phase, higher than the maximum pressure admitted in the column, making difficult to
perform this chromatographic run. This high column pressure suggests an aggregation of
biomolecules when the pH is too low, being difficult to pass in the porous of the disk.
0
20
40
60
80
100
-500
0
500
1000
1500
2000
0 10 20 30
Co
nd
uct
ivit
y (m
S/cm
)
A
UV
ab
sorp
tio
n (
mA
U)
Volume (mL)
Abs 280 nm Conductivity
0
20
40
60
80
-100
0
100
200
300
400
500
0 20 40 60
Co
nd
uct
ivit
y (m
S/cm
)
C
UV
ab
sorp
tio
n (
mA
U)
Volume (mL)
Abs 280 nm Conductivity

54
The SDS-PAGE gel in figure 39 relative to the chromatograms illustrated in figure 38 shows
the similarity in the chromatography with pH of 7 previously analyzed in figure 36. Although the
difficulty of the gel analysis, it is shown that the intensive band on the feed (1) between 50 and 37
kDa, is eluted only on the first elution peak. The effects of working with different adsorption pH values
did not impact on the chromatography profile.
Figure 39- Silver stained reducing SDS-PAGE analysis of the chromatograms A, B, and C
illustrated on figure 38. Lane 1: Feed; Lane 2,3,4: flow-through fractions from A,B, and C; Lane 5,6,7:
first elution peak fractions from A,B and C; Lane 8,9,10: second elution peak fractions from A, B and
C; M: protein molecular weight marker in kDa. Proteins were separated by 12% SDS-PAGE
electrophorese.

55
4. Conclusions and Future Work
The main goal of the work was to develop new alternative methods for OMVs purification that
could cover the problems of the current purification methods, namely regarding its rentability,
efficiency and scale-up capacity.
The work developed in this thesis demonstrated that the analyzed ATPS systems polymer-
polymer and polymer-salt could not perform the desired one step purification due to the difficulty of
detect the OMVs with different sizes and composition among all the other proteins in the sample.
Relatively to IEX with a monolithic platform, the results of this study showed that the separation of
the pili and flagella from the OMVs was not achieved.
On the other hand, the objective was successful obtained using a size exclusion chromatography
with a matrix of dextran-polyacrylamide (Sephacryl). This valid alternative is desirable for large-scale,
and represents a cost-effective purification method. However, as with any purification procedure,
vesicle yield decreases as their purity increases. One disadvantage in the production of OMVs comes
from strains or species with low yields. To solve this problem, OMVs production procedures should be
modified to ensure sufficient vesicle yields or more batches should be produced at once since high-
yield OMVs with consistent composition is a key factor in developing OMV-based vaccines. During the
chromatography the feedstock solution has to be diluted in the buffer, decreasing the OMVs
concentration and making difficult the observation by TEM.
As future work, it might be interesting explore the hydrophobic interaction chromatography as a
purification process.
Posteriorly it will be also necessary evaluate the safety and immunogenicity of the purified OMVs
in mice in order to advance the OMV vaccine against Burkholderia cenocepacia, as well as other
related species, increasing life expectancy and quality of CF patients.

56
5. Bibliography
[1] W. Is and C. Fibrosis, ―Cystic Fibrosis, Facts About,‖ Natl. Hear. Lung Blood Inst., no. 93–3650,
1995.
[2] T. Bjarnsholt, X. C. Nielsen, U. Johansen, L. Nørgaard, and N. Høiby, ―Cystic Fibrosis,‖ vol.
742, pp. 1217–1251, 2011.
[3] M. D. Parkins and J. S. Elborn, ―Infection in Cystic Fibrosis,‖ Expert Rev. Respir. Med., vol. 5,
no. 5, pp. 609–622, 2011.
[4] J. J. LiPuma, ―The Changing Microbial Epidemiology in Cystic Fibrosis,‖ Clin. Microbiol. Rev.,
vol. 23, no. 2, pp. 299–323, 2010.
[5] T. Coenye, P. Vandamme, J. J. Lipuma, and R. W. John, ―Updated Version of the Burkholderia
cepacia Complex Experimental Strain Panel Updated Version of the Burkholderia cepacia
Complex Experimental Strain Panel,‖ J. Clin. Microbiol., vol. 41, no. 6, pp. 2797–2799, 2003.
[6] P. Drevinek and E. Mahenthiralingam, ―Burkholderia cenocepacia in cystic fibrosis:
epidemiology and molecular mechanisms of virulence.,‖ Clin. Microbiol. Infect., vol. 16, no. 7,
pp. 8218–8230, 2010.
[7] V. P. P. Charlotte, E.A. James, Zlosnikb, S.Theodore, J. Hirdb, J. LiPumac, ―Burkholderia
pseudomultivorans sp. nov., a novel Burkholderia cepacia complex species from human
respiratory samples and the rhizosphere,‖ vol. 36, no. 7, pp. 483–489, 2013.
[8] S. I. Devi, B. Somkuwar, M. Potshangbam, and N. C. Talukdar, ―Genetic characterization of
Burkholderia cepacia strain from Northeast India : A potential bio-control agent,‖ vol. 2012, no.
December 2012, pp. 1179–1188, 2012.
[9] F. E. Clode, M. E. Kaufmann, H. Malnick, and T. L. Pitt, ―Distribution of genes encoding
putative transmissibility factors among epidemic and nonepidemic strains of Burkholderia
cepacia from cystic fibrosis patients in the United Kingdom,‖ J. Clin. Microbiol., vol. 38, no. 5,
pp. 1763–1766, 2000.
[10] U. S. Sajjan, L. Sun, R. Goldstein, and J. F. Forstner, ―Cable (cbl) type II pili of cystic fibrosis-
associated Burkholderia (Pseudomonas) cepacia: nucleotide sequence of the cblA major
subunit pilin gene and novel morphology of the assembled appendage fibers.,‖ J. Bacteriol.,
vol. 177, no. 4, pp. 1030–8, 1995.
[11] K. L. Chua, Y. Y. Chan, and Y. H. Gan, ―Flagella Are Virulence Determinants of,‖ Society, vol.
71, no. 4, pp. 1622–1629, 2003.

57
[12] ―La célula bacteriana,‖ Proyecto Biosfera. [Online]. Available:
http://agrega.educacion.es/repositorio/24112009/9c/es_20070518_2_0030813/contenido/conte
nidos4.htm.
[13] T. J. Beveridge, ―Structures of gram-negative cell walls and their derived membrane vesicles.,‖
J. Bacteriol., vol. 181, no. 16, pp. 4725–33, 1999.
[14] S. B. Lindmark, P. Rompikuntal, K. Vaitkevicius, T. Song, B. Uhlin, P. Guerry and Wai, ―Outer
membrane vesicle-mediated release of cytolethal distending toxin (CDT) from Campylobacter
jejuni,‖ BMC Microbiol., pp. 9–220, 2009.
[15] D. G. D. Mayrand, ―Biological activities of outer membrane vesicles,‖ Can. J. Microbiol., vol. 6,
no. 35, pp. 607–13, 1989.
[16] J. K. C. Halima, I. Manning, M. Andrew, ―Quantitative and qualitative preparations of bacterial
outer membrane vesicles,‖ Natl. Inst. Heal., no. 966, pp. 259–272, 2013.
[17] C. Schwechheimer, A. Kulp, and M. J. Kuehn, ―Modulation of bacterial outer membrane vesicle
production by envelope structure and content,‖ BMC Microbiol., vol. 14, no. 1, p. 324, 2014.
[18] A. Amano, H. Takeuchi, and N. Furuta, ―Outer membrane vesicles function as offensive
weapons in host-parasite interactions,‖ Microbes Infect., vol. 12, no. 11, pp. 791–798, 2010.
[19] Y. G. E. Lee, JY Bang, GW Park, DS Choi, JS Kang, HJ Kim, KS Park, JO Lee, KH Kwon, KP
Kim, ―Global proteomic profiling of native outer membrane vesicles derived from Escherichia
coli,‖ US Natl. Libr. Med., no. 3821, pp. 7–20, 2007.
[20] H. M. Kulkarni and M. V. Jagannadham, ―Biogenesis and multifaceted roles of outer membrane
vesicles from Gram-negative bacteria,‖ Microbiology, vol. 160, no. Pt_10, pp. 2109–2121,
2014.
[21] Z. Li, a J. Clarke, and T. J. Beveridge, ―Gram-negative bacteria produce membrane vesicles
which are capable of killing other bacteria,‖ J. Bacteriol., vol. 180, no. 20, pp. 5478–5483, 1998.
[22] J. K. K. Adam, ―Biological Functions and Biogenesis of Secreted Bacterial Outer Membrane
Vesicles,‖ Annu. Rev. Microbiol., vol. 64, no. 10, pp. 163–184, 2010.
[23] M. J. Kuehn and N. C. Kesty, ―Bacterial outer membrane vesicles and the host – pathogen
interaction,‖ Genes Dev., no. Beveridge 1999, pp. 2645–2655, 2005.
[24] T. N. Ellis and M. J. Kuehn, ―Virulence and Immunomodulatory Roles of Bacterial Outer
Membrane Vesicles,‖ Microbiol. Mol. Biol. Rev., vol. 74, no. 1, pp. 81–94, 2010.

58
[25] Y. Hasegawa, H. Futamata, and Y. Tashiro, ―Complexities of cell-to-cell communication
through membrane vesicles : implications for selective interaction of membrane vesicles with
microbial cells,‖ vol. 6, no. July, pp. 1–5, 2015.
[26] M. L. W. Marvin, ―Special delivery: vesicle trafficking in prokaryotes,‖ Mol. Microbiol., vol. 61,
no. 4, pp. 839–846, 2006.
[27] M. W. JW Schertzer, ―Bacterial outer membrane vesicles in trafficking, communication and the
host-pathogen interaction.,‖ US Natl. Libr. Med., vol. 23, pp. 118–30, 2013.
[28] P. D. A. Joseph, Rosenthal, C. Linxiao, B. Jenny, ―Pathogen-like particles: biomimetic vaccine
carriers engineered at the nanoscale,‖ vol. 28, pp. 51–58, 2014.
[29] A. Ali, R. Z. Jafri, N. Messonnier, C. Tevi-Benissan, D. Durrheim, J. Eskola, F. Fermon, K. P.
Klugman, M. Ramsay, S. Sow, S. Zhujun, Z. Bhutta, and J. Abramson, ―Global practices of
meningococcal vaccine use and impact on invasive disease,‖ Pathog. Glob. Health, vol. 108,
no. 1, pp. 11–20, 2014.
[30] J. L. Baker, L. Chen, J. a Rosenthal, D. Putnam, and M. P. DeLisa, ―Microbial biosynthesis of
designer outer membrane vesicles.,‖ Curr. Opin. Biotechnol., vol. 29, pp. 76–84, 2014.
[31] J. K. C. Schwechheimer, ―Outer-membrane vesicles from Gram-negative bacteria: biogenesis
and functions,‖ Nat. Rev. Microbiol., vol. 13, pp. 605–619, 2015.
[32] N. Katsui, T. Tsuchido, R. Hiramatsu, S. Fujikawa, M. Takano, and I. Shibasaki, ―Heat-induced
blebbing and vesiculation of the outer membrane of Escherichia coli.,‖ J. Bacteriol., vol. 151,
no. 3, pp. 1523–31, 1982.
[33] J. L. Kadurugamuwa and T. J. Beveridge, ―Virulence factors are released from Pseudomonas
aeruginosa in association with membrane vesicles during normal growth and exposure to
gentamicin: a novel mechanism of enzyme secretion.,‖ J. Bacteriol., vol. 177, no. 14, pp. 3998–
4008, 1995.
[34] N. D. Allan, C. Kooi, P. a Sokol, and T. J. Beveridge, ―Putative virulence factors are released in
association with membrane vesicles from Burkholderia cepacia.,‖ Can. J. Microbiol., vol. 49,
no. 10, pp. 613–624, 2003.
[35] B. van de Waterbeemd, G. Zomer, P. Kaaijk, N. Ruiterkamp, R. H. Wijffels, G. P. J. M. van den
Dobbelsteen, and L. a. van der Pol, ―Improved Production Process for Native Outer Membrane
Vesicle Vaccine against Neisseria meningitidis,‖ PLoS One, vol. 8, no. 5, pp. 1–11, 2013.

59
[36] R. Acevedo, S. Fernández, C. Zayas, A. Acosta, M. E. Sarmiento, V. a. Ferro, E. Rosenqvist,
C. Campa, D. Cardoso, L. Garcia, and J. L. Perez, ―Bacterial Outer Membrane Vesicles and
Vaccine Applications,‖ Front. Immunol., vol. 5, no. March, pp. 1–6, 2014.
[37] A. Manuscript and L. Endotoxins, ―NIH Public Access,‖ October, pp. 1–57, 2008.
[38] V. den L. Van der, Dobbelsteen, ―Next-generation outer membrane vesicle vaccines against
Neisseria meningitidis based on nontoxic LPS mutants.,‖ no. 7, pp. (8):886–90, 2011.
[39] B. K. S. James, D. Sue, Reeve Brock, Edwards James, Wood Matthew, Andrew J. Carr,
―Extracellular Vesicles Commercial Potential As Byproducts of Cell Manufacturing for Research
and Therapeutic Use,‖ Bioprocess Int., 2014.
[40] W. J. Walker K, Principles and Techniques of Biochemistry and Molecular Biology, Seventh.
2010.
[41] M. Renelli, V. Matias, R. Y. Lo, and T. J. Beveridge, ―DNA-containing membrane vesicles of
Pseudomonas aeruginosa PAO1 and their genetic transformation potential,‖ Microbiology, vol.
150, no. 7, pp. 2161–2169, 2004.
[42] W. Nieves, H. Petersen, B. M. Judy, C. a. Blumentritt, K. Russell-Lodrigue, C. J. Roy, A. G.
Torres, and L. a. Morici, ―A Burkholderia pseudomallei outer membrane vesicle vaccine
provides protection against lethal sepsis,‖ Clin. Vaccine Immunol., vol. 21, no. 5, pp. 747–754,
2014.
[43] W. D. McCaig, a. Koller, and D. G. Thanassi, ―Production of Outer Membrane Vesicles and
Outer Membrane Tubes by Francisella novicida,‖ J. Bacteriol., vol. 195, no. 6, pp. 1120–1132,
2013.
[44] D. S. Bellara, S. R., Cui, Z., MacDonald, S. L. & Pepper, ―Virus removal from bioproducts using
ultrafiltration membranes modified with latex particle pretreatment,‖ Bioseparation, pp. 79–88,
1998.
[45] R. Spatz, D., Friedlander, ―Ultrafiltration — The Membranes, the Process and Its Application to
Organic Molecule Fractionation. Ultrafiltration Membranes and Applications,‖ p. 603, 1980.
[46] I. et al. Schwartz Corni, ―Bluetongue virus: virology, pathogenesis and immunity,‖ Vet. Res, pp.
39–46, 2008.
[47] A. M. Azevedo, P. a. J. Rosa, I. F. Ferreira, and M. R. Aires-Barros, ―Optimisation of aqueous
two-phase extraction of human antibodies,‖ J. Biotechnol., vol. 132, no. 2, pp. 209–217, 2007.
[48] P. A. Albertsson, Partition of Cellular Particles and Macromolecules, 3rd ed. 1986.

60
[49] M. R. Azevedo, A.M., Rosa, P.A.J., Ferreira, I.F. & Aires-Barros, ―Chromatography-free
recovery of biopharmaceuticals through aqueous two-phase processing,‖ Trends Biotechnol.,
no. 27(4), pp. 240–7, 2009.
[50] R. Hatti-kaul, ―Aqueous Two-Phase Systems,‖ vol. 19, 2001.
[51] B. A. Asenjo, J. a & Andrews, ―Aqueous two-phase systems for protein separation: phase
separation and applications,‖ J. Chromatogr. A, vol. 1238, pp. 1–10, 2012.
[52] T. Kupiec, ―Quality-Control Analytical Methods: High-Performance Liquid Chromatography.,‖
Int. J. Pharm. Compd., vol. 8, no. 3, pp. 223–227, 2004.
[53] F. P. PORATH J, ―Gel filtration: a method for desalting and group separation,‖ Nature, no.
183(4676), pp. 1657–9, 1958.
[54] J. C. Moore, ―Gel Permeation Chromatography, I. A New Method for Molecular Weight
Distribution of High Polymers,‖ Texas J. Polym. Sci. Part A Gen. Pap., no. 2(2), pp. 835–843,
1964.
[55] GE Healthcare, ―Size exclusion chromatography: Principles and Methods,‖ GE Heal.
Handbooks, p. 139, 2012.
[56] W. I. S.Tayyab., W. Qamar, ―Interdisciplinary Biotechnology Unit Aligarh Muslim University
Aligarh 202002, UP India,‖ Biochem. Educ., vol. 19, no. 3, pp. 149–152, 1991.
[57] GE Healthcare, ―Gel Filtration,‖ p. 4, 2006.
[58] G. Healthcare, ―Size exclusion chromatography columns and media.‖
[59] P. M. Cummins, O. Dowling, and B. F. O’Connor, ―Ion-exchange chromatography: basic
principles and application to the partial purification of soluble mammalian prolyl
oligopeptidase.,‖ Methods Mol. Biol., vol. 681, pp. 215–228, 2011.
[60] K. UM, ―Purification of antibodies using ion-exchange chromatography.,‖ Nat. Rev. Microbiol.,
vol. 115, pp. 19–22, 1999.
[61] H. Walton, ―Ion-exchange chromatography,‖ Anal. Chem., p. 187, 2015.
[62] C. J. Josic D., ―Use of monolithic supports in proteomics technology,‖ Nat. Rev. Microbiol., vol.
1144(1), pp. 2–13, 2007.

61
[63] P. M. Brne P, Podgornik A., Strancar A., ―Fast and efficient separation of immunoglobulin M
from immunoglobulin G using short monolithic columns,‖ Nat. Rev. Microbiol., vol. 1144(1), pp.
120–5, 2007.
[64] P. Gagnon, ―Vaccine Purification with Monoliths,‖ pp. 1–43, 2009.
[65] G. I. , Mattiasson, B., K. Ashok, Macroporous Polymers: Production Properties and
Biotechnological/Biomedical Applications, CRC Press. 2009.
[66] B. Y. Zaslavlsky, Aqueous Two-Phase Partitioning - Physical Chemistry and Bioanalytical
Applications, Marcel Dek. 1995.
[67] S. Raja, V. R. Murty, V. Thivaharan, V. Rajasekar, and V. Ramesh, ―Aqueous Two Phase
Systems for the Recovery of Biomolecules – A Review,‖ Sci. Technol., vol. 1, no. 1, pp. 7–16,
2012.
[68] W. Perry, Monolithic Chromatography and Its Modern Applications, The Chromo. 2010.
[69] L. Urbas, ―BIA Separations CIM Monolithic Columns for Purification and Analytics of
Biomolecules.‖
[70] S. Fulsundar, K. Harms, G. E. Flaten, P. J. Johnsen, B. a. Chopade, and K. M. Nielsen, ―Gene
Transfer Potential of Outer Membrane Vesicles of Acinetobacter baylyi and Effects of Stress on
Vesiculation,‖ Appl. Environ. Microbiol., vol. 80, no. 11, pp. 3469–3483, 2014.
[71] Pierce, ―Protein Purification Technical Handbook,‖ Brochure, vol. 2, pp. 1–84, 2010.