burger king holdings inc. -...
TRANSCRIPT

Burger King Holdings Inc. Q4 FY2008 and FY2008
Earnings Call Presentation
August 21, 2008

1
Safe Harbor statementForward Looking Statements:Certain statements made in this report that reflect management's expectations regarding future events and economic performance are forward-looking in nature and, accordingly, are subject to risks and uncertainties. These forward looking statements include statements regarding our expectations regarding the strength and momentum of our worldwide business; our expectations regarding worldwide net restaurant growth, our global development pipeline and our ability to execute on our development strategy; our expectations regarding the ability of our business model to drive development by potential and existing franchisees; our ability to use our ongoing portfolio management strategy to drive growth in new and existing markets; our continued focus on progressive improvement across strategic global growth pillars, our reimaging initiative and our portfolio management initiative; our expectations regarding the success of our promotional calendar for the first quarter of fiscal 2009; our expectations regarding the ability of our reimaging program to increase sales; our ability to continue to capture a larger market of the fastest growing dayparts -- breakfast and late night; our beliefs and expectations regarding fiscal 2009, including our reimaging program in fiscal 2009; our ability to continue to deliver top of industry financial performance, including our earnings per share guidance for fiscal 2009, and other expectations regarding our future financial and operational results. These forward-looking statements are only predictions based on our current expectations and projections about future events. Important factors could cause our actual results, level of activity, performance or achievements to differ materially from those expressed or implied by these forward-looking statements. These factors include those risk factors set forth in filings with the Securities and Exchange Commission, including our annual and quarterly reports, and the following: our ability to compete domestically and internationally in an intensely competitive industry; our ability to successfully implement our international growth strategy; our ability to manage increases in our operating costs, including costs of food and paper products, rent expense, energy costs and labor costs, which can adversely affect our operating margins and financial results, particularly in an environment of declining sales or challenging macroeconomic conditions, if we choose not to pass, or cannot pass, these increased costs to our guests; risks related to our international operations; economic or other business conditions that may affect the desire or ability of our customers to purchase our products such as inflationary pressures, higher unemployment rates, unprecedented increases in gas prices, declines in median income growth, consumer confidence and consumer discretionary spending and changes in consumer preferences; our continued good relationship with, and the success of, our franchisees; our continued ability, and the ability of our franchisees, to obtain suitable locations and financing for new restaurant development; the effectiveness of our marketing and advertising programs and franchisee support of these programs; risks related to the loss of any of our major distributors, particularly in those international markets where we have a single distributor and interruptions in the supply of necessary products to us; our ability to execute on our reimaging program in the U.S. and Canada to increase sales and profitability, and the short term impact of our reimaging program on revenues and operating margins due to temporary restaurant closures and accelerated depreciation of the assets to be disposed of through their disposal date; risks related to franchisee financial distress which could result in, among other things, restaurant closures, delayed or reduced payments to us of royalties and rents and increased exposure to third parties such as landlords; risks related to the renewal of franchise agreements by our franchisees; the ability of franchisees who are experiencing losses from their other businesses to continue to make payments to us and invest in our brand; our ability to identify and consummate successfully acquisition and development opportunities in new and existing markets; our ability to continue to extend our hours of operations, at least in the U.S. and Canada, to capture a larger market of both the breakfast and late night dayparts; changes in consumer perceptions of dietary health and food safety and negative publicity relating to our products; our ability to retain or replace executive officers and key members of management with qualified personnel; fluctuations in international currency exchange and interest rates, and their impact on both pretax income and the income tax provision; our ability to refinance or modify our bank debt on favorable terms given the current lending environment; our ability to utilize foreign tax credits to offset our U.S. income taxes due to continuing losses in the U.K. and other factors and risks related to the impact of changes in statutory tax rates in foreign jurisdictions on our deferred taxes and effective tax rate; our ability to realize our expected tax benefits from the realignment of our European and Asian businesses; changes in demographic patterns of current restaurant locations; our ability to adequately protect our intellectual property; risks related to market conditions, including the market price and trading volume of our common stock, that would affect the volume of purchases, if any, made under our Share Repurchase Program; our ability to manage changing labor conditions and difficulties in staffing our international operations; risks related to disruptions and catastrophic events, including war, terrorism and other international conflicts, public health issues and natural disasters;adverse legal judgments, settlements or pressure tactics; and adverse legislation or regulation.
These risks are not exhaustive and may not include factors which could adversely impact our business and financial performance. Moreover, we operate in a very competitive and rapidly changing environment. New risk factors emerge from time to time and it is not possible for our management to predict all risk factors, nor can we assess the impact of all factors on our business or the extent to which any factor, or combination of factors, may cause actual results to differ materially from those contained in any forward-looking statements.
Although we believe the expectations reflected in the forward-looking statements are reasonable, we cannot guarantee future results, level of activity, performance or achievements. Moreover, neither we nor any other person assumes responsibility for the accuracy or completeness of any of these forward-looking statements. You should not rely upon forward-looking statements as predictions of future events. We do not undertake any responsibility to update any of these forward-looking statements to conform our prior statements to actual results or revised expectations.
This presentation also includes non-GAAP financial measures as defined in Regulation G. The reconciliations of these non-GAAP financial measures to their most comparable GAAP financial measures and other information required by Regulation G are included in the appendix to this presentation (see slides 24-30) posted on our website at www.bk.com.
2
Content
Q4 FY2008 and FY2008 OVERVIEW AND SCORECARD
FY2008 wrap-up and FY2009 outlook
Q & A
3
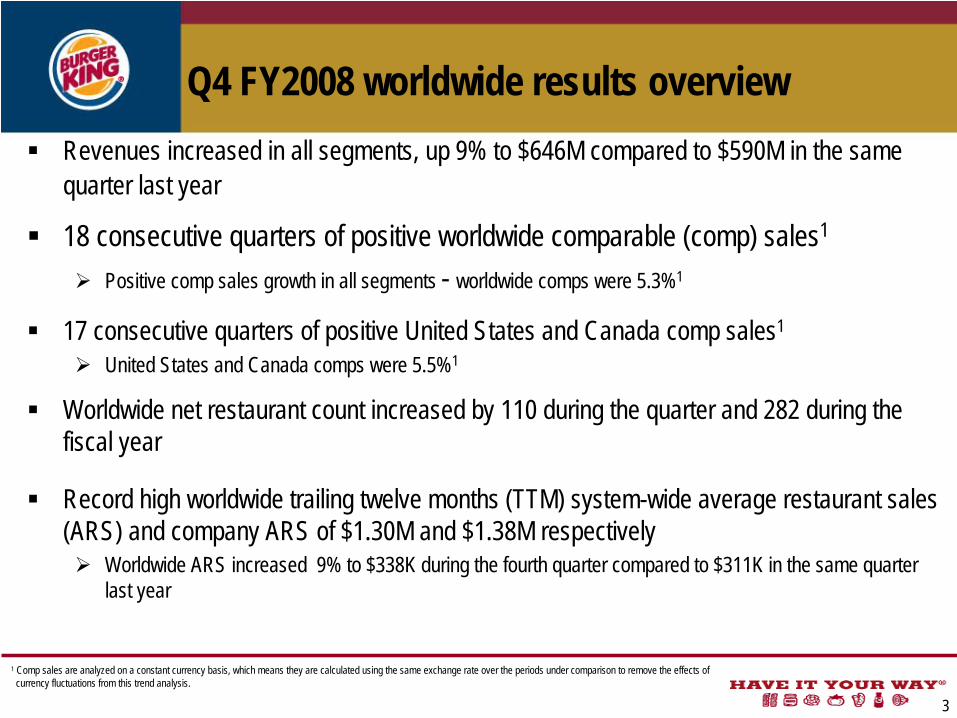
Q4 FY2008 worldwide results overviewRevenues increased in all segments, up 9% to $646M compared to $590M in the same quarter last year
18 consecutive quarters of positive worldwide comparable (comp) sales1
Positive comp sales growth in all segments - worldwide comps were 5.3%1
17 consecutive quarters of positive United States and Canada comp sales1
United States and Canada comps were 5.5%1
Worldwide net restaurant count increased by 110 during the quarter and 282 during the fiscal year
Record high worldwide trailing twelve months (TTM) system-wide average restaurant sales (ARS) and company ARS of $1.30M and $1.38M respectively
Worldwide ARS increased 9% to $338K during the fourth quarter compared to $311K in the same quarter last year
1 Comp sales are analyzed on a constant currency basis, which means they are calculated using the same exchange rate over the periods under comparison to remove the effects of currency fluctuations from this trend analysis.
Q4 FY2008 worldwide results overview (cont’d)
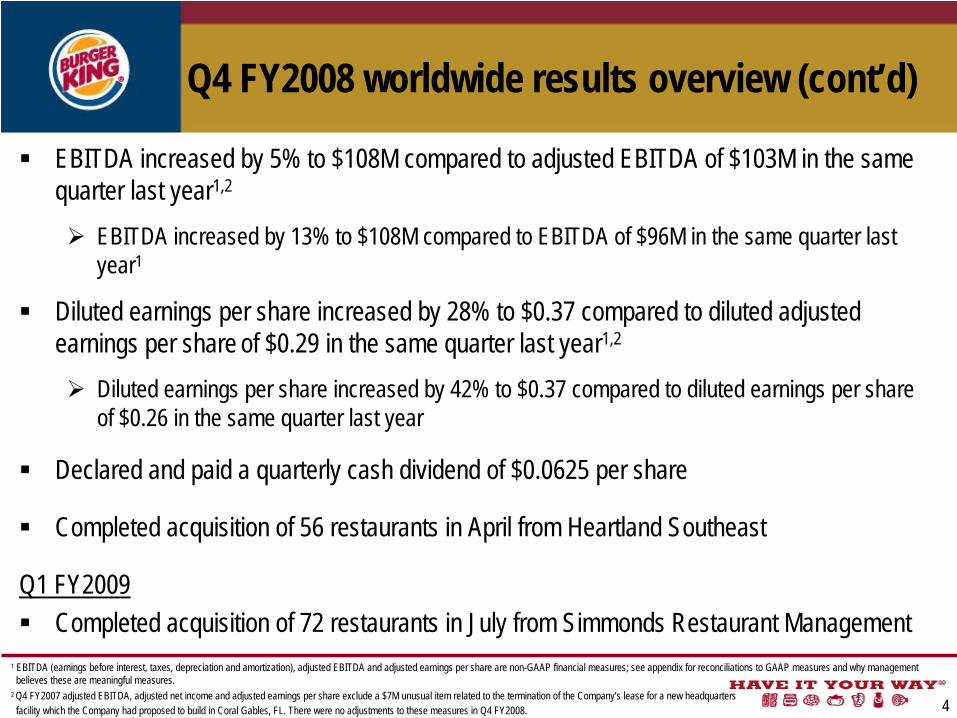
EBITDA increased by 5% to $108M compared to adjusted EBITDA of $103M in the same quarter last year1,2
EBITDA increased by 13% to $108M compared to EBITDA of $96M in the same quarter last year1
Diluted earnings per share increased by 28% to $0.37 compared to diluted adjusted earnings per share of $0.29 in the same quarter last year1,2
Diluted earnings per share increased by 42% to $0.37 compared to diluted earnings per shareof $0.26 in the same quarter last year
Declared and paid a quarterly cash dividend of $0.0625 per share
Completed acquisition of 56 restaurants in April from Heartland Southeast
Q1 FY2009Completed acquisition of 72 restaurants in July from Simmonds Restaurant Management
1 EBITDA (earnings before interest, taxes, depreciation and amortization), adjusted EBITDA and adjusted earnings per share are non-GAAP financial measures; see appendix for reconciliations to GAAP measures and why management believes these are meaningful measures.
2 Q4 FY2007 adjusted EBITDA, adjusted net income and adjusted earnings per share exclude a $7M unusual item related to the termination of the Company’s lease for a new headquarters facility which the Company had proposed to build in Coral Gables, FL. There were no adjustments to these measures in Q4 FY2008. 4

Worldwide financial highlights: Q4 FY2008
5
Q4 FY2008 financial highlights overview:
Significant top-line and bottom-line expansion across all segments
Delivered solid results on all key metrics:Comps increased 90 basis points (bps) Strong revenue growth; up 9%ARS increased by 9%Worldwide blended royalty rate increased to
4.0%Benefit of reduced effective tax rate Adjusted diluted earnings per share increased
by 28%1,2
In $ millions, except share and per share amounts
1 EBITDA, adjusted EBITDA, adjusted income from operations, adjusted net income and adjusted earnings per share are non-GAAP financial measures; see appendix for reconciliations to GAAP measures and why management believes these are meaningful measures.
2 Q4 FY2007 adjusted EBITDA, adjusted net income and adjusted earnings per share exclude a $7M pre-tax unusual item related to the termination of the Company’s lease for a new headquarters facility which the Company had proposed to build in Coral Gables, FL. There were no adjustments to these measures in Q4 FY2008.
3 Earnings per share is calculated using whole dollars and shares.4 Worldwide franchise sales are sales at all franchise restaurants and are revenues to our franchisees. Although the Company does not record franchise sales as revenues,
royalty revenues are based on a percentage of franchise sales and are reported as franchise revenues by the Company.
Top line growth yielded solid results
2008 2007 B/(W) %
Revenues: Company restaurant revenues 471$ 433$ 9% Franchise revenues 143 126 13% Property revenues 32 31 3% Total revenues 646 590 9%
EBITDA1 108 96 13%Adjusted EBITDA1,2 108 103 5%
Income from operations 82 72 14%Adjusted income from operations1,2 82 79 4%
Net income 51 36 42%Adjusted net income1,2 51 40 28%
Earnings per share - diluted3 0.37$ 0.26$ 42%Adjusted earnings per share - diluted1,2, 3 0.37$ 0.29$ 28%
Weighted shares outstanding - diluted 137.3 137.6 0%
Memo:Worldwide restaurant count 11,565 11,283 282 Worldwide comp sales growth 5.3% 4.4% 90 bpsWorldwide franchise sales4 3,389 3,033 12%Worldwide ARS 338$ 311$ 9%
Effective tax rate 26.1% 35.7% nm
Quarters ended June 30

Worldwide financial highlights: FY2008
6
FY2008 financial highlights overview:
Significant top-line and bottom-line expansion across all segments
Delivered solid results on all key metrics:Comps increased 200 bps Strong revenue growth; up 10%ARS increased by 9%Worldwide blended royalty rate increased to
3.98%Adjusted diluted earnings per share increased by
24%1,2
Posted best in class annual results
In $ millions, except share and per share amounts
1 EBITDA, adjusted EBITDA, adjusted income from operations, adjusted net income and adjusted earnings per share are non-GAAP financial measures; see appendix for reconciliations to GAAP measures and why management believes these are meaningful measures.
2 FY2007 adjusted EBITDA, adjusted net income and adjusted earnings per share exclude a $7M pre-tax unusual item related to the termination of the Company’s lease for a new headquarters facility which the Company hadproposed to build in Coral Gables, FL. There were no adjustments to these measures in FY2008.
3 Earnings per share is calculated using whole dollars and shares.4 Worldwide franchise sales are sales at all franchise restaurants and are revenues to our franchisees. Although the Company does not record franchise sales as revenues,
royalty revenues are based on a percentage of franchise sales and are reported as franchise revenues by the Company.
Fiscal years ended June 30FY2008 FY2007 B/(W) %
Revenues: Company restaurant revenues 1,796$ 1,658$ 8% Franchise revenues 537 460 17% Property revenues 122 116 5% Total revenues 2,455 2,234 10%
EBITDA1 450 380 18%Adjusted EBITDA1,2 450 387 16%
Income from operations 354 291 22%Adjusted income from operations1,2 354 298 19%
Net income 190 148 28%Adjusted net income1,2 190 152 25%
Earnings per share - diluted3 1.38$ 1.08$ 28%Adjusted earnings per share - diluted1,2,3 1.38$ 1.11$ 24%
Weighted shares outstanding - diluted 137.6 136.8 -1%
Memo:Worldwide comp sales growth 5.4% 3.4% 200 bpsWorldwide franchise sales4 12,892 11,574 11%Worldwide ARS 1,301$ 1,193$ 9%
Effective tax rate 35.2% 33.6% nm

Financial highlights by segment: Q4 FY2008
7
Profitability led by strong comp sales growth and restaurant openings
In $ millions
1 EMEA / APAC segment includes restaurants in Europe, the Middle East, Africa, Asia, Australia and Guam. Latin America segment includes restaurants in Mexico, Central and South America, the Caribbean and Puerto Rico.² Adjustments to Q4 FY2007 segment income from operations includes a $7M pre-tax unusual item related to the termination of the Company’s lease for a new headquarters facility which the
Company had proposed to build in Coral Gables, FL included in the United States and Canada segment. There were no adjustments to these measures in Q4 FY2008. 3 Adjusted income from operations and adjusted segment income from operations are non-GAAP financial measures; see appendix for reconciliations to GAAP measures
and why management believes these are meaningful measures.
Segment revenues: 1 2008 2007 B/(W) % United States and Canada 422$ 381$ 11% EMEA / APAC 193 182 6% Latin America 31 27 15% Total revenues 646 590 9% Memo: Adjusted segment income from operations 2,3
Segment income from operations:1 2008 2007 B/(W) % United States and Canada 84 87 -3% 84 94 -11% EMEA / APAC 19 11 73% 19 11 73% Latin America 12 9 33% 12 9 33% Total segment income from operations 115 107 7% 115 114 1%
Unallocated (33) (35) 6% (33) (35) 6% Total income from operations 82 72 14% 82 79 4%
Interest expense, net 13 16 19%Income before income taxes 69 56 23%
Income tax expense 18 20 10%
Net income 51$ 36$ 42%Net income as a % of total revenues 8% 6% 200 bps
Quarters ended June 30
Quarters ended June 30

Financial highlights by segment: FY2008
8
Top-line expansion and cost management generated solid results
In $ millions
1 EMEA / APAC segment includes restaurants in Europe, the Middle East, Africa, Asia, Australia and Guam. Latin America segment includes restaurants in Mexico, Central and South America, the Caribbean and Puerto Rico.² Adjustments to FY2007 segment income from operations includes a $7M pre-tax unusual item, related to the termination of the Company’s lease for a new headquarters facility which the
Company had proposed to build in Coral Gables, FL included in the United States and Canada segment. There were no adjustments to these measures in FY2008. ³ Adjusted income from operations and adjusted segment income from operations are non-GAAP financial measures; see appendix for reconciliations to GAAP measures
and why management believes these are meaningful measures.
Segment revenues: 1 FY2008 FY2007 B/(W) % United States and Canada 1,579$ 1,451$ 9% EMEA / APAC 761 681 12% Latin America 115 102 13% Total revenues 2,455 2,234 10% Memo: Adjusted segment income from operations 2,3
Segment income from operations:1 FY2008 FY2007 B/(W) % United States and Canada 348 336 4% 348 343 1% EMEA / APAC 92 54 70% 92 54 70% Latin America 41 35 17% 41 35 17% Total segment income from operations 481 425 13% 481 432 11%
Unallocated (127) (134) 5% (127) (134) 5% Total income from operations 354 291 22% 354 298 19%
Interest expense, net 61 67 9%Loss on early extinguishment of debt - 1 100%Income before income taxes 293 223 31%
Income tax expense 103 75 -37%
Net income 190$ 148$ 28%Net income as a % of total revenues 8% 7% 100 bps
Fiscal years ended June 30
Fiscal years ended June 30
FY2008 BKC’s scorecard
9
Multi-faceted growth opportunities:
FY2008 revised financial targets:
FY2008 results:
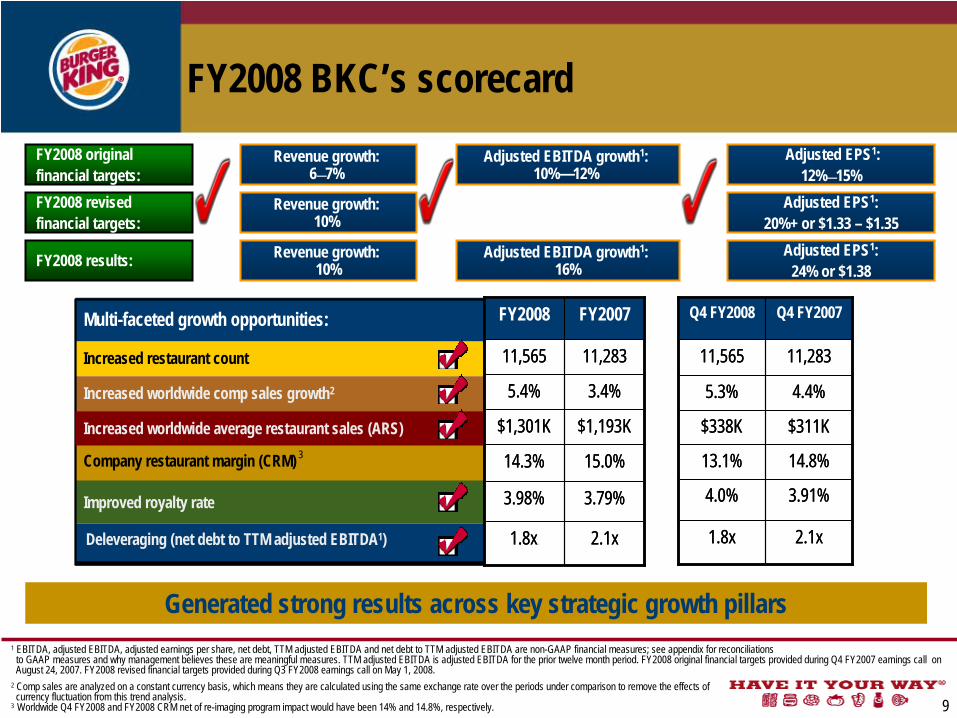
Revenue growth: 10%
Revenue growth: 10%
Adjusted EBITDA growth1: 16%
Adjusted EPS1:20%+ or $1.33 – $1.35
Adjusted EPS1:24% or $1.38
Generated strong results across key strategic growth pillars 1 EBITDA, adjusted EBITDA, adjusted earnings per share, net debt, TTM adjusted EBITDA and net debt to TTM adjusted EBITDA are non-GAAP financial measures; see appendix for reconciliations
to GAAP measures and why management believes these are meaningful measures. TTM adjusted EBITDA is adjusted EBITDA for the prior twelve month period. FY2008 original financial targets provided during Q4 FY2007 earnings call on August 24, 2007. FY2008 revised financial targets provided during Q3 FY2008 earnings call on May 1, 2008.
2 Comp sales are analyzed on a constant currency basis, which means they are calculated using the same exchange rate over the periods under comparison to remove the effects of currency fluctuation from this trend analysis.
3 Worldwide Q4 FY2008 and FY2008 CRM net of re-imaging program impact would have been 14% and 14.8%, respectively.
FY2008 original financial targets:
Revenue growth: 6—7%
Adjusted EBITDA growth1: 10%—12%
Adjusted EPS1:12%—15%
Multi-faceted growth opportunities:
Increased worldwide comp sales growth2
Increased restaurant count
Company restaurant margin (CRM)
Improved royalty rate
Deleveraging (net debt to TTM adjusted EBITDA1)
Increased worldwide average restaurant sales (ARS)
2.1x
3.79%
15.0%
$1,193K
3.4%
11,283
FY2007
1.8x1.9
3.98%
14.3%
$1,301K
5.4%
11,565
FY2008
2.1x
3.79%
15.0%
$1,193K
3.4%
11,283
FY2007
1.8x1.9
3.98%
14.3%
$1,301K
5.4%
11,565
FY2008
2.1x
3.91%
14.8%
$311K
4.4%
11,283
Q4 FY2007
1.8x
4.0%
13.1%
$338K
5.3%
11,565
Q4 FY2008
2.1x
3.91%
14.8%
$311K
4.4%
11,283
Q4 FY2007
1.8x
4.0%
13.1%
$338K
5.3%
11,565
Q4 FY2008
3

The results – comp sales growth
10
Comps drove strong top line expansion….our strong momentum continues
1 Comp sales are analyzed on a constant currency basis, which means they are calculated using the same exchange rate over the periods under comparison to remove the effects of currency fluctuations from this trend analysis.
18 consecutive quarters of positive worldwide comp sales growth1
17 consecutive quarters of positive U.S. system comp sales growth1
4Q05 1Q06 2Q06 3Q06 4Q06 1Q07 2Q07 3Q07 4Q07 1Q08 2Q08 3Q08 4Q08 4Q05 1Q06 2Q06 3Q06 4Q06 1Q07 2Q07 3Q07 4Q07 1Q08 2Q08 3Q08 4Q08
2.0%
3.3%
1.7%
2.4%
3.7%3.2%
4.4%
5.9%
4.5%
5.8%5.3%
0.7%
1.6%
2.3%
4.9%
2.0%2.6%
4.5%
2.7%
4.8%
6.8%
4.5%
5.6% 5.6%
1.2%1.5%

The results – CRM and royalty rate
11
Delivered solid performance in spite of challenging macro-economic conditions
U.S. Company restaurant ARS and CRM1,2 Worldwide royalty rate growth
26.1%
21.4%
14.8%
6.8%
19.1%
Less than$1.0M
$1.0M -$1.29M
$1.3M -$1.49M
$1.5M -$1.89M
$1.9M+
14.6%
¹ Excludes U.S. Company restaurants operated for less than 12 months.² Based on TTM ended June 30, 2008.3 The royalty rate for approximately 630 restaurants increased effective April 1, 2007. These restaurants were at a lower royalty rate as part of an early remodel incentive program.
0%
5%
10%
15%
20%
25%
30%
35%
40%
FY2004 FY2005 FY2006 FY2007³ Q4 FY20083.40%
3.50%
3.60%
3.70%
3.80%
3.90%
4.00%
% of U.S. restaurants above 4.0% royalty rateBlended worldwide royalty rate
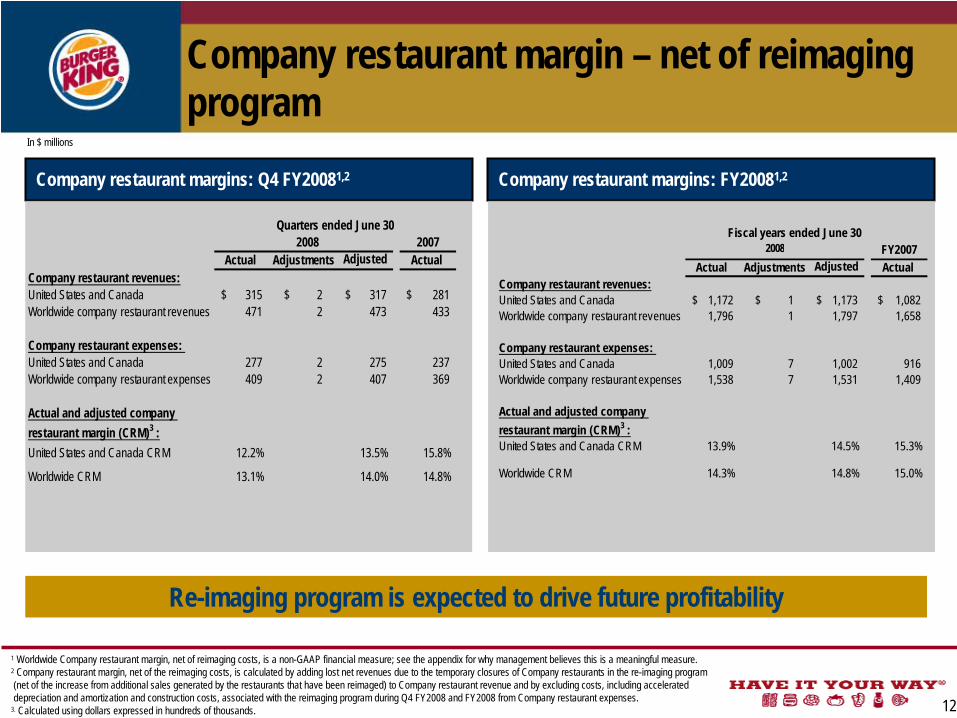
Company restaurant margin – net of reimaging program
12
Re-imaging program is expected to drive future profitability
In $ millions
Company restaurant margins: Q4 FY20081,2 Company restaurant margins: FY20081,2
Quarters ended June 302008 2007
Actual Adjustments Adjusted Actual Company restaurant revenues:United States and Canada 315$ 2$ 317$ 281$ Worldwide company restaurant revenues 471 2 473 433
Company restaurant expenses: United States and Canada 277 2 275 237 Worldwide company restaurant expenses 409 2 407 369
Actual and adjusted company restaurant margin (CRM)3 :United States and Canada CRM 12.2% 13.5% 15.8%
Worldwide CRM 13.1% 14.0% 14.8%
2008 FY2007Actual Adjustments Adjusted Actual
Company restaurant revenues:United States and Canada 1,172$ 1$ 1,173$ 1,082$ Worldwide company restaurant revenues 1,796 1 1,797 1,658
Company restaurant expenses: United States and Canada 1,009 7 1,002 916 Worldwide company restaurant expenses 1,538 7 1,531 1,409
Actual and adjusted company restaurant margin (CRM)3 :United States and Canada CRM 13.9% 14.5% 15.3%
Worldwide CRM 14.3% 14.8% 15.0%
Fiscal years ended June 30
1 Worldwide Company restaurant margin, net of reimaging costs, is a non-GAAP financial measure; see the appendix for why management believes this is a meaningful measure. 2 Company restaurant margin, net of the reimaging costs, is calculated by adding lost net revenues due to the temporary closures of Company restaurants in the re-imaging program (net of the increase from additional sales generated by the restaurants that have been reimaged) to Company restaurant revenue and by excluding costs, including accelerated depreciation and amortization and construction costs, associated with the reimaging program during Q4 FY2008 and FY2008 from Company restaurant expenses.
3. Calculated using dollars expressed in hundreds of thousands.
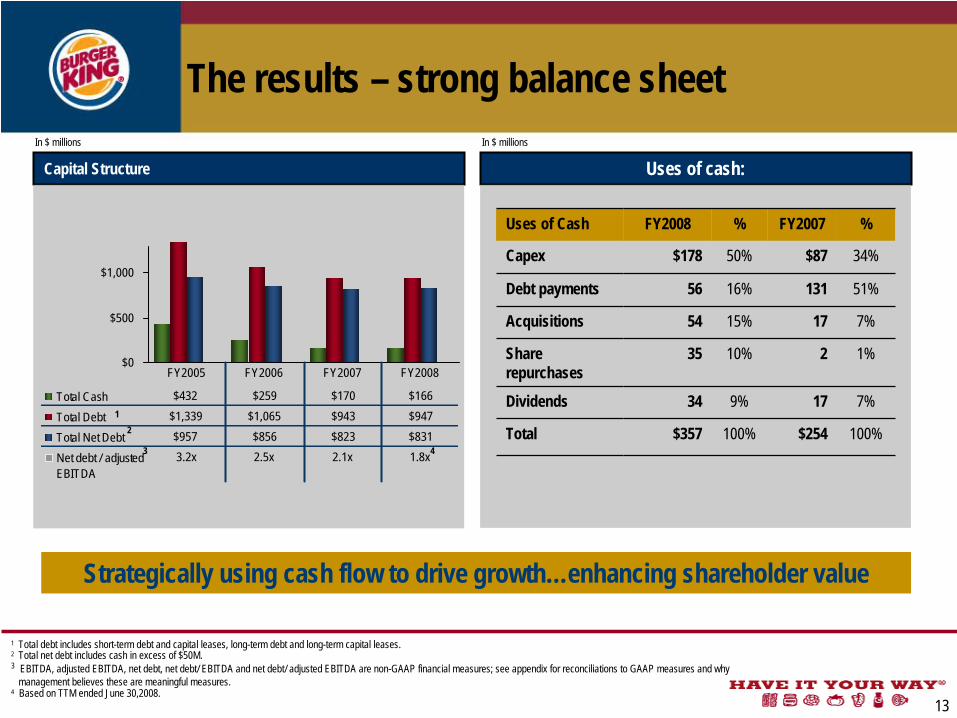
The results – strong balance sheet
13
Strategically using cash flow to drive growth…enhancing shareholder value
Capital Structure Uses of cash:
$0
$500
$1,000
Total Cash $432 $259 $170 $166
Total Debt $1,339 $1,065 $943 $947
Total Net Debt $957 $856 $823 $831
Net debt / adjustedEBITDA
3.2x 2.5x 2.1x 1.8x
FY2005 FY2006 FY2007 FY2008
12
In $ millions
1 Total debt includes short-term debt and capital leases, long-term debt and long-term capital leases. 2 Total net debt includes cash in excess of $50M.3 EBITDA, adjusted EBITDA, net debt, net debt/ EBITDA and net debt/ adjusted EBITDA are non-GAAP financial measures; see appendix for reconciliations to GAAP measures and why
management believes these are meaningful measures.4 Based on TTM ended June 30,2008.
Uses of Cash FY2008 % FY2007 %
Capex $178 50% $87 34%
Debt payments 56 16% 131 51%
Acquisitions 54 15% 17 7%
Share repurchases
35 10% 2 1%
Dividends 34 9% 17 7%
Total $357 100% $254 100%
In $ millions
43
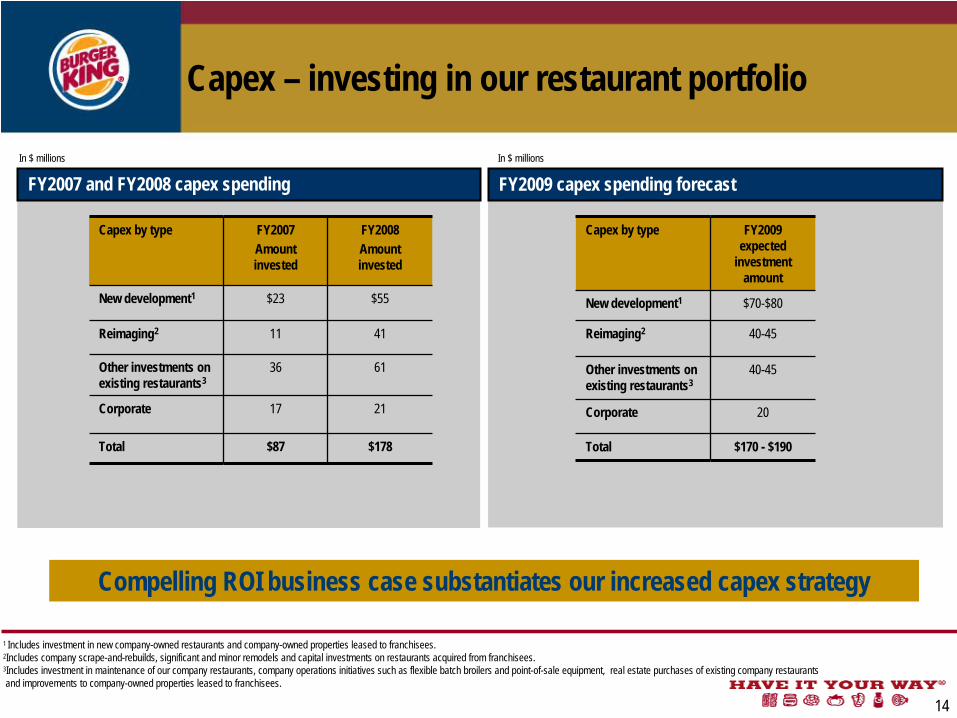
Capex – investing in our restaurant portfolio
14
Compelling ROI business case substantiates our increased capex strategy
FY2007 and FY2008 capex spending FY2009 capex spending forecast In $ millionsIn $ millions
Capex by type FY2007Amount invested
FY2008Amount invested
New development1 $23 $55
Reimaging2 11 41
Other investments on existing restaurants3
36 61
Corporate 17 21
Total $87 $178
Capex by type FY2009 expected
investment amount
New development1 $70-$80
Reimaging2 40-45
Other investments on existing restaurants3
40-45
Corporate 20
Total $170 - $190
1 Includes investment in new company-owned restaurants and company-owned properties leased to franchisees.2Includes company scrape-and-rebuilds, significant and minor remodels and capital investments on restaurants acquired from franchisees.3Includes investment in maintenance of our company restaurants, company operations initiatives such as flexible batch broilers and point-of-sale equipment, real estate purchases of existing company restaurants and improvements to company-owned properties leased to franchisees.

15
Content
Q4 FY2008 and FY2008 overview and scorecard
FY2008 WRAP-UP AND FY2009 OUTLOOK
Q & A

16
FY2008 wrap-up
Revenue growth: 10%
Adjusted earnings per sharegrowth3: 24%
Our laser focus drove best in class annual results
1 Comp sales are analyzed on a constant currency basis, which means they are calculated using the same exchange rate over the periods under comparison to remove the effects of currency fluctuation from this trend analysis.
2 Worldwide FY2008 CRM net of re-imaging program impact would have been 14.8%. 3 EBITDA, net debt, TTM adjusted EBITDA, net debt to TTM adjusted EBITDA, adjusted EBITDA and adjusted earnings per share are non-GAAP financial measures; see appendix for reconciliations to GAAP measures and
why management believes these are meaningful measures. TTM adjusted EBITDA is adjusted EBITDA for the prior twelve month period.
Multi-faceted growth opportunities:
Increased worldwide comp sales growth1
Increased restaurant count
Company restaurant margin (CRM)2
Improved royalty rate
Deleveraging (net debt to TTM adjusted EBITDA3)
Increased worldwide average restaurant sales (ARS)
2.1x
3.79%
15.0%
$1,193K
3.4%
11,283
FY2007
1.8x1.9
3.98%
14.3%
$1,301K
5.4%
11,565
FY2008
2.1x
3.79%
15.0%
$1,193K
3.4%
11,283
FY2007
1.8x1.9
3.98%
14.3%
$1,301K
5.4%
11,565
FY2008

17
FY2009 outlook
3 – 4% comparable sales growth1
Net restaurant count to increase 350 – 400
Increase in worldwide blended royalty rate
G&A increase at rate of inflation
Effective tax rate of 36.5% is expected
Capex of $170M - $190M
FY2009 EPS forecast: $1.54 - $1.59
Key assumptions
Committed to carry our strong positive momentum into FY2009…
1 Comp sales are analyzed on a constant currency basis, which means they are calculated using the same exchange rate over the periods under comparison to remove the effects of currency fluctuations from this trend analysis.
18
Content
Q4 FY2008 and FY2008 overview and scorecard
FY2009 outlook
Q & A

19
Appendix
Data Page
Key revenue performance measures - comp sales, sales growth, ARS and restaurant count 20
21
Share count - Q4 FY2008 and Q4 FY2007 22
Featured products and promotions - Q4 FY2008 and Q4 FY2007 23
Income statement - Q4 FY2008 and FY2008
20
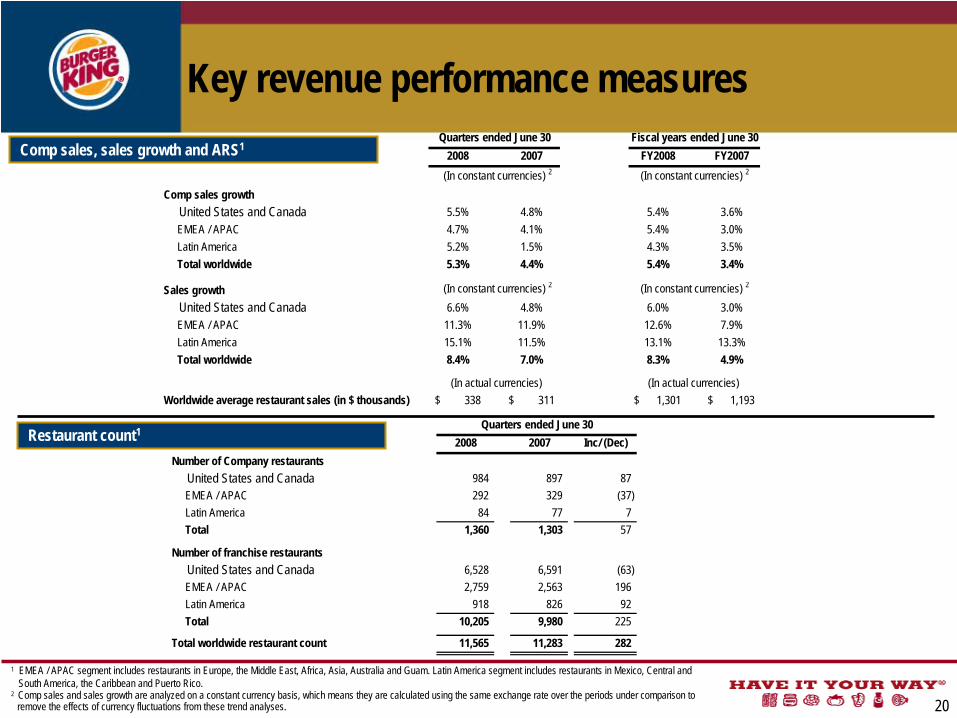
Key revenue performance measuresComp sales, sales growth and ARS1
Restaurant count1
1 EMEA / APAC segment includes restaurants in Europe, the Middle East, Africa, Asia, Australia and Guam. Latin America segment includes restaurants in Mexico, Central and South America, the Caribbean and Puerto Rico.
2 Comp sales and sales growth are analyzed on a constant currency basis, which means they are calculated using the same exchange rate over the periods under comparison to remove the effects of currency fluctuations from these trend analyses.
2008 2007 FY2008 FY2007(In constant currencies) 2 (In constant currencies) 2
Comp sales growth United States and Canada 5.5% 4.8% 5.4% 3.6% EMEA / APAC 4.7% 4.1% 5.4% 3.0% Latin America 5.2% 1.5% 4.3% 3.5% Total worldwide 5.3% 4.4% 5.4% 3.4%
Sales growth (In constant currencies) 2 (In constant currencies) 2
United States and Canada 6.6% 4.8% 6.0% 3.0% EMEA / APAC 11.3% 11.9% 12.6% 7.9% Latin America 15.1% 11.5% 13.1% 13.3% Total worldwide 8.4% 7.0% 8.3% 4.9%
(In actual currencies) (In actual currencies) Worldwide average restaurant sales (in $ thousands) 338$ 311$ 1,301$ 1,193$
Quarters ended June 30 Fiscal years ended June 30
2008 2007 Inc/ (Dec)Number of Company restaurants United States and Canada 984 897 87 EMEA / APAC 292 329 (37) Latin America 84 77 7 Total 1,360 1,303 57
Number of franchise restaurants United States and Canada 6,528 6,591 (63) EMEA / APAC 2,759 2,563 196 Latin America 918 826 92 Total 10,205 9,980 225
Total worldwide restaurant count 11,565 11,283 282
Quarters ended June 30

21
Income statement – Q4 FY2008 and FY2008
1 Earnings per share is calculated using whole dollars and shares.
In $ millions, except share and per share amounts
2008 2007 B/(W) % FY2008 FY2007 B/(W) %Revenues: Company restaurant revenues 471$ 433$ 9% 1,796$ 1,658$ 8% Franchise revenues 143 126 13% 537 460 17% Property revenues 32 31 3% 122 116 5% Total revenues 646 590 9% 2,455 2,234 10%
Company restaurant expenses 409 369 -11% 1,538 1,409 -9%Selling expenses 24 20 20% 91 83 10%General and administrative expenses 106 108 2% 409 391 -5%Property expenses 17 16 -6% 62 61 -2%Other operating (income) expense, net 8 5 -60% 1 (1) nmTotal operating costs and expenses 564 518 -9% 2,101 1,943 -8% Income from operations 82 72 14% 354 291 22%Interest expense, net 13 16 19% 61 67 9%Loss on early extinguishment of debt - - nm - 1 nm
Income before income taxes 69 56 23% 293 223 31% Income tax expense 18 20 10% 103 75 -37%Net income 51$ 36$ 42% 190$ 148$ 28% Earnings per share - diluted1 0.37$ 0.26$ 42% 1.38$ 1.08$ 28% Weighted average shares - diluted 137.3 137.6 0% 137.6 136.8 -1%
Memo: Company restaurant margin (CRM) United States and Canada 12.2% 15.8% 13.9% 15.3% EMEA / APAC 13.0% 11.6% 13.9% 13.0% Latin America 28.6% 25.9% 25.4% 25.9% Total 13.1% 14.8% 14.3% 15.0%
Quarters ended June 30 Fiscal years ended June 30

22
Share countShare count
Quarter ended June 30, Year ended June 30,2008 2007 2008 2007
Weighted average shares outstanding - Basic EPS 134,891 134,970 135,139 133,913
Shares assumed issued on exercise of stock options and settlement of RSU's, PBRS and Deferred shares 5,984 6,537 6,382 6,506Shares assumed repurchased with proceeds from stock options, RSU's, PBRS and Deferred shares (3,563) (3,862) (3,906) (3,665)Dilutive stock options, RSU's, PBRS and Deferred shares 2,421 2,675 2,476 2,841
Weighted average shares outstanding - Diluted EPS 137,311 137,645 137,614 136,754

23
Featured products and promotionsQ4 FY2008
Prod
ucts
Ki
ds p
rom
otio
nsCo
upon
s
Q4 FY2007
Note: the abovementioned featured products and promotions highlight the marketing efforts in the United States and Canada; many of the featured products and promotions were leveraged across global markets.
SPONGEBOB® Pest of the West Iron Man™ Indiana
Jones™The Incredible
Hulk™ SpongeBob SquarePantsTM Spider-ManTM 3 Fantastic Four
None None
APRIL MAY JUNECheesy Bacon
BK WRAPPER™ & Steakhouse Burger
Indy DOUBLE WHOPPER®
Indy DOUBLE WHOPPER® &
Steakhouse BurgerSpongeBob SquarePants ™
The Incredible Hulk ™Late Night
Indiana Jones ™Iron Man™
APRIL MAY JUNE BK™ Chicken Fries Whopper® Western Whopper®
SpongeBob Spider-Man 3 BKTM RacingLate Night
24
Performance indicators and use of non- GAAP financial measures
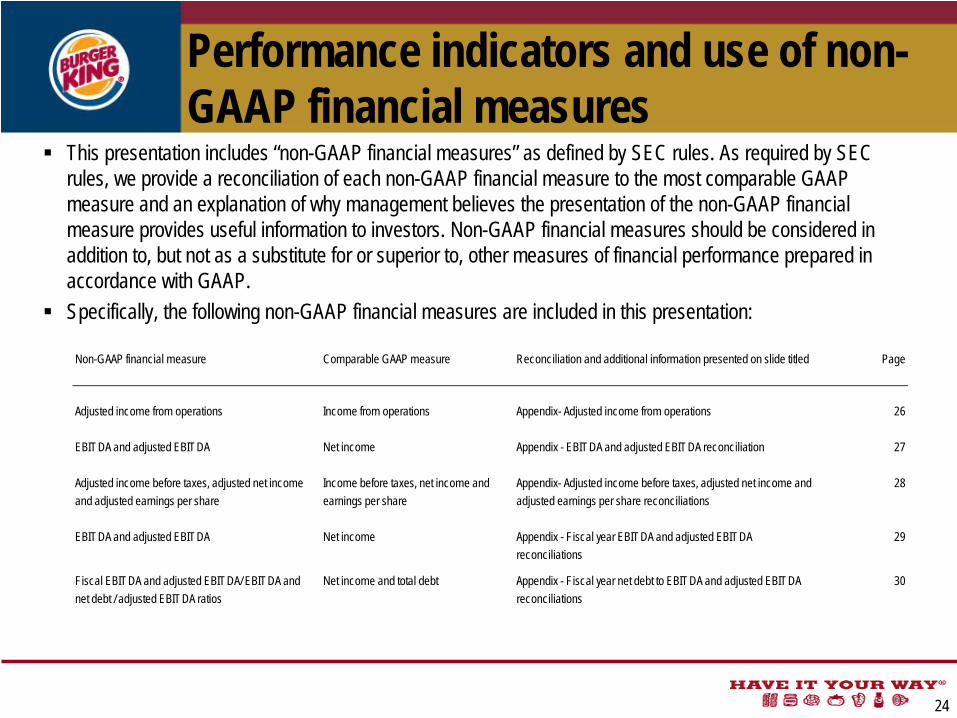
This presentation includes “non-GAAP financial measures” as defined by SEC rules. As required by SEC rules, we provide a reconciliation of each non-GAAP financial measure to the most comparable GAAP measure and an explanation of why management believes the presentation of the non-GAAP financial measure provides useful information to investors. Non-GAAP financial measures should be considered in addition to, but not as a substitute for or superior to, other measures of financial performance prepared in accordance with GAAP.Specifically, the following non-GAAP financial measures are included in this presentation:
Non-GAAP financial measure Comparable GAAP measure Reconciliation and additional information presented on slide titled Page
Adjusted income from operations Income from operations Appendix- Adjusted income from operations 26
EBITDA and adjusted EBITDA Net income Appendix - EBITDA and adjusted EBITDA reconciliation 27
Adjusted income before taxes, adjusted net income and adjusted earnings per share
Income before taxes, net income and earnings per share
Appendix- Adjusted income before taxes, adjusted net income and adjusted earnings per share reconciliations
28
EBITDA and adjusted EBITDA Net income Appendix - Fiscal year EBITDA and adjusted EBITDA reconciliations
29
Fiscal EBITDA and adjusted EBITDA/ EBITDA and net debt / adjusted EBITDA ratios
Net income and total debt Appendix - Fiscal year net debt to EBITDA and adjusted EBITDA reconciliations
30
25
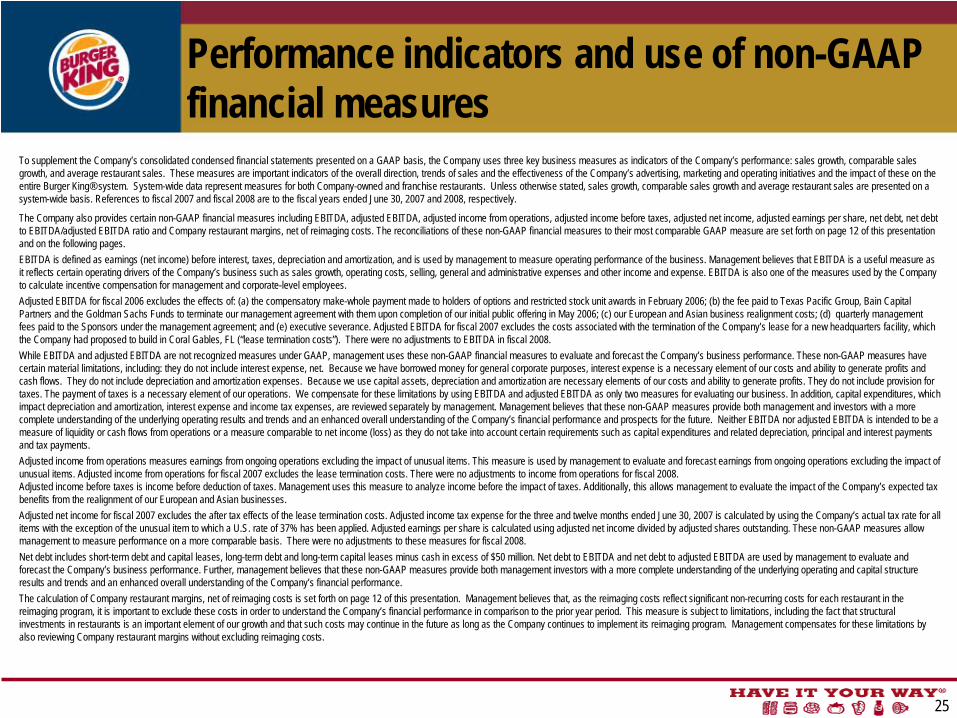
Performance indicators and use of non-GAAP financial measures
To supplement the Company’s consolidated condensed financial statements presented on a GAAP basis, the Company uses three key business measures as indicators of the Company’s performance: sales growth, comparable sales growth, and average restaurant sales. These measures are important indicators of the overall direction, trends of sales and the effectiveness of the Company’s advertising, marketing and operating initiatives and the impact of these on the entire Burger King® system. System-wide data represent measures for both Company-owned and franchise restaurants. Unless otherwise stated, sales growth, comparable sales growth and average restaurant sales are presented on a system-wide basis. References to fiscal 2007 and fiscal 2008 are to the fiscal years ended June 30, 2007 and 2008, respectively.
The Company also provides certain non-GAAP financial measures including EBITDA, adjusted EBITDA, adjusted income from operations, adjusted income before taxes, adjusted net income, adjusted earnings per share, net debt, net debt to EBITDA/adjusted EBITDA ratio and Company restaurant margins, net of reimaging costs. The reconciliations of these non-GAAP financial measures to their most comparable GAAP measure are set forth on page 12 of this presentation and on the following pages.EBITDA is defined as earnings (net income) before interest, taxes, depreciation and amortization, and is used by management to measure operating performance of the business. Management believes that EBITDA is a useful measure as it reflects certain operating drivers of the Company’s business such as sales growth, operating costs, selling, general and administrative expenses and other income and expense. EBITDA is also one of the measures used by the Company to calculate incentive compensation for management and corporate-level employees.Adjusted EBITDA for fiscal 2006 excludes the effects of: (a) the compensatory make-whole payment made to holders of options and restricted stock unit awards in February 2006; (b) the fee paid to Texas Pacific Group, Bain Capital Partners and the Goldman Sachs Funds to terminate our management agreement with them upon completion of our initial public offering in May 2006; (c) our European and Asian business realignment costs; (d) quarterly management fees paid to the Sponsors under the management agreement; and (e) executive severance. Adjusted EBITDA for fiscal 2007 excludes the costs associated with the termination of the Company’s lease for a new headquarters facility, which the Company had proposed to build in Coral Gables, FL (“lease termination costs”). There were no adjustments to EBITDA in fiscal 2008. While EBITDA and adjusted EBITDA are not recognized measures under GAAP, management uses these non-GAAP financial measures to evaluate and forecast the Company’s business performance. These non-GAAP measures have certain material limitations, including: they do not include interest expense, net. Because we have borrowed money for general corporate purposes, interest expense is a necessary element of our costs and ability to generate profits and cash flows. They do not include depreciation and amortization expenses. Because we use capital assets, depreciation and amortization are necessary elements of our costs and ability to generate profits. They do not include provision for taxes. The payment of taxes is a necessary element of our operations. We compensate for these limitations by using EBITDA and adjusted EBITDA as only two measures for evaluating our business. In addition, capital expenditures, which impact depreciation and amortization, interest expense and income tax expenses, are reviewed separately by management. Management believes that these non-GAAP measures provide both management and investors with a more complete understanding of the underlying operating results and trends and an enhanced overall understanding of the Company’s financial performance and prospects for the future. Neither EBITDA nor adjusted EBITDA is intended to be a measure of liquidity or cash flows from operations or a measure comparable to net income (loss) as they do not take into account certain requirements such as capital expenditures and related depreciation, principal and interest payments and tax payments.Adjusted income from operations measures earnings from ongoing operations excluding the impact of unusual items. This measure is used by management to evaluate and forecast earnings from ongoing operations excluding the impact of unusual items. Adjusted income from operations for fiscal 2007 excludes the lease termination costs. There were no adjustments to income from operations for fiscal 2008. Adjusted income before taxes is income before deduction of taxes. Management uses this measure to analyze income before the impact of taxes. Additionally, this allows management to evaluate the impact of the Company’s expected tax benefits from the realignment of our European and Asian businesses. Adjusted net income for fiscal 2007 excludes the after tax effects of the lease termination costs. Adjusted income tax expense for the three and twelve months ended June 30, 2007 is calculated by using the Company’s actual tax rate for all items with the exception of the unusual item to which a U.S. rate of 37% has been applied. Adjusted earnings per share is calculated using adjusted net income divided by adjusted shares outstanding. These non-GAAP measures allow management to measure performance on a more comparable basis. There were no adjustments to these measures for fiscal 2008. Net debt includes short-term debt and capital leases, long-term debt and long-term capital leases minus cash in excess of $50 million. Net debt to EBITDA and net debt to adjusted EBITDA are used by management to evaluate and forecast the Company’s business performance. Further, management believes that these non-GAAP measures provide both management investors with a more complete understanding of the underlying operating and capital structure results and trends and an enhanced overall understanding of the Company’s financial performance. The calculation of Company restaurant margins, net of reimaging costs is set forth on page 12 of this presentation. Management believes that, as the reimaging costs reflect significant non-recurring costs for each restaurant in the reimaging program, it is important to exclude these costs in order to understand the Company’s financial performance in comparison to the prior year period. This measure is subject to limitations, including the fact that structural investments in restaurants is an important element of our growth and that such costs may continue in the future as long as the Company continues to implement its reimaging program. Management compensates for these limitations by also reviewing Company restaurant margins without excluding reimaging costs.
26
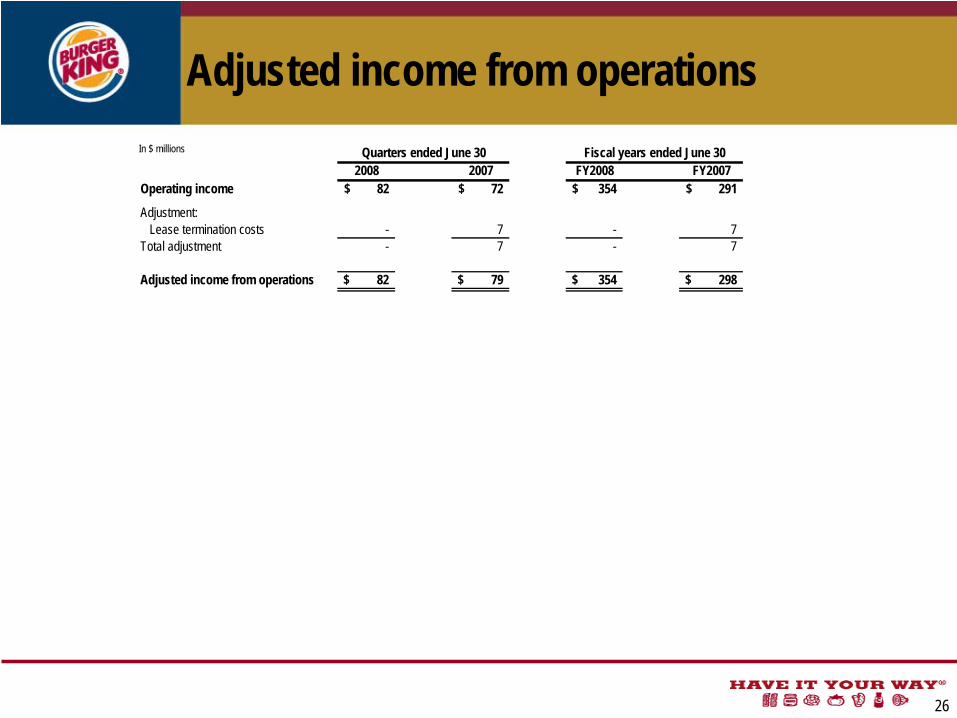
Adjusted income from operationsIn $ millions Quarters ended June 30 Fiscal years ended June 30
2008 2007 FY2008 FY2007Operating income 82$ 72$ 354$ 291$
Adjustment: Lease termination costs - 7 - 7 Total adjustment - 7 - 7
Adjusted income from operations 82$ 79$ 354$ 298$
27
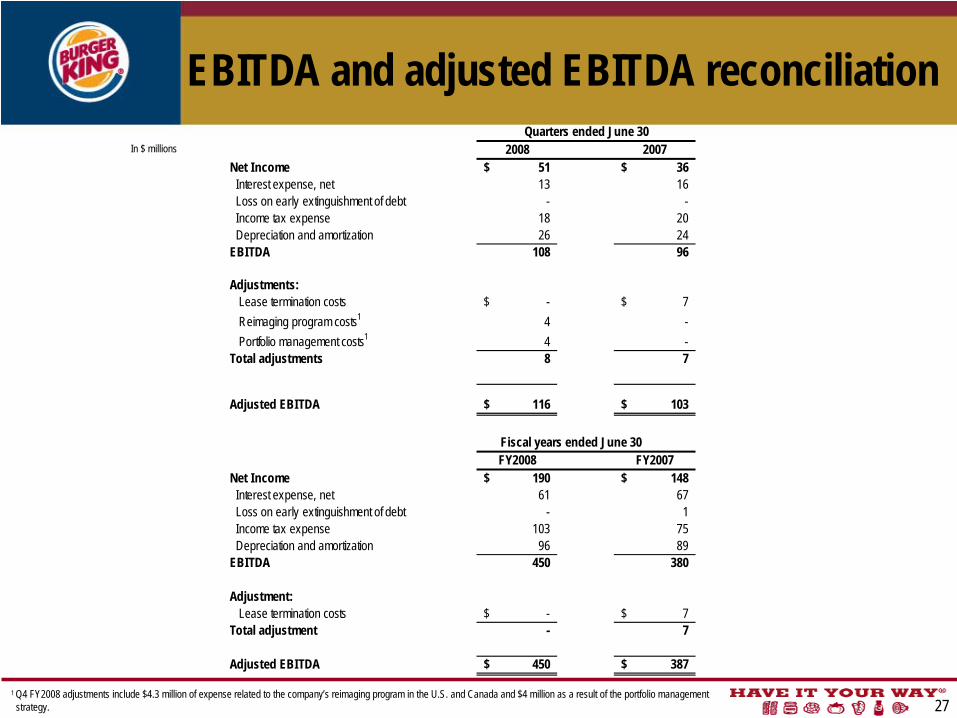
EBITDA and adjusted EBITDA reconciliationIn $ millions
Quarters ended June 302008 2007
Net Income 51$ 36$ Interest expense, net 13 16 Loss on early extinguishment of debt - - Income tax expense 18 20 Depreciation and amortization 26 24 EBITDA 108 96
Adjustments: Lease termination costs -$ 7$ Reimaging program costs1 4 - Portfolio management costs1 4 - Total adjustments 8 7
Adjusted EBITDA 116$ 103$
Fiscal years ended June 30FY2008 FY2007
Net Income 190$ 148$ Interest expense, net 61 67 Loss on early extinguishment of debt - 1 Income tax expense 103 75 Depreciation and amortization 96 89 EBITDA 450 380
Adjustment: Lease termination costs -$ 7$ Total adjustment - 7
Adjusted EBITDA 450$ 387$
1 Q4 FY2008 adjustments include $4.3 million of expense related to the company’s reimaging program in the U.S. and Canada and $4 million as a result of the portfolio management strategy.

28
Adjusted income before taxes, adjusted net income and adjusted earnings per share reconciliations
In $ millions
1 Earnings per share is calculated using whole dollars and shares.
Quarters ended June 302008 2007 FY2008 FY2007
Net income 51$ 36$ 190$ 148$ Income tax expense 18 20 103 75 Income before taxes 69 56 293 223 Adjustment: Lease termination costs - 7 - 7 Total adjustment - 7 - 7
Adjusted income before taxes 69 63 293 230
Adjusted tax expense 18 23 103 78
Adjusted net income 51$ 40$ 190$ 152$
Weighted shares outstanding - diluted 137.3 137.6 137.6 136.8
Earnings per share - diluted1 0.37$ 0.26$ 1.38$ 1.08$ Adjusted earnings per share - diluted1 0.37$ 0.29$ 1.38$ 1.11$
Fiscal years ended June 30

29
Fiscal year EBITDA and adjusted EBITDA reconciliationsIn $ millions
FY2008 FY2007 FY2006 FY2005Net income 190$ 148$ 27$ 47$
Reconciling items:Interest expense, net 61 67 72 73Loss on early extinguishment of debt - 1 18 - Income tax expense 103 75 53 31Depreciation and amortization 96 89 88 74
EBITDA 450 380 258 225
Adjustments: Lease termination costs - 7 - - Compensatory make-whole payment - - 34 - Management agreement termination fee - - 30 - European and Asian business realignment costs - - 10 17 Management fees - - 9 9 Executive severance - - 5 - Franchise system distress (FFRP) - - - 33 Loss on asset disposals and asset impairment - - - 18 Total adjustments - 7 88 77
Adjusted EBITDA 450$ 387$ 346$ 302$
Fiscal years ended June 30

30
Fiscal year net debt to EBITDA and adjusted EBITDA reconciliations
In $ millions
FY2008 FY2007 FY2006 FY2005Term debt, net of current portion 869$ 871$ 997$ 1,282$ Capital leases, net of current portion 71 67 63 53 Current portion of long term debt and capital leases 7 5 5 4 Total debt 947 943 1,065 1,339
Cash and cash equivalents 166 170 259 432
Net debt excluding cash in excess of $50M 831 823 856 957
EBITDA 450 380 258 225 Adjusted EBITDA 450 387 346 302
Net debt excluding cash in excess of $50M / EBITDA 1.8x 2.2x 3.3x 4.3xNet debt excluding cash in excess of $50M / adjusted EBITDA 1.8x 2.1x 2.5x 3.2x
Fiscal years ended