bureau of mineral resources, geology and geophysics · compactus (lending section) department of...
TRANSCRIPT

COMPACTUS (LENDING SECTION)
DEPARTMENT OF NATIONAL RESOURCES.
055514
BUREAU OF MINERAL RESOURCES, GEOLOGY AND GEOPHYSICS
Record 1976/85
VEMA CRUISE 33 LEG 2, IN THE SOUTHEAST INDIAN OCEAN , 21 DECEMBER , 1 9 75 TO 17 JANUARY,. 1976: OBSERVER' S EPORT
by
D. Jongsma
The information contained in this report has been obtained by the Department of National Resources as part of the policy of the Australian Government to assist in the exploration and development of mineral resources. It may not be published in any form or used in a company prospectus or statement without the permissiot:1 in writing of the Director. Bureau of Mineral Hes·ources. Geology and Geophysics.

Record 1976/85
VEMA CRUISE 33 LEG 2, IN THE SOUTHEAST INDIAN OCEAN,21 DECEMBER, 1975 TO 17 JANUARY, 1976: OBSERVER'S REPORT
by
D. Jongsma

1
1
1
1
CONTENTS
Page
INTRODUCTION 1
CRUISE SUMMARY 1
SEISMIC RECORDING 2BMR continuous seismic profile recording 2Sonobuoy recording 3BMR Aquatronics sonobuoys 3
DATA OBTAINED FROM THE LEG 4
MEASUREMENT OF HEAT FLOW 4
Equipment 5Procedure before station 5Procedure on station 5Procedure after station 6Calculation and correction of the heat flow
measurement at a station 6DREDGING OPERATIONS 7
Equipment 7Procedure 7
DISCUSSION AND RECOMMENDATIONS 8
REFERENCES 10
FIGURES
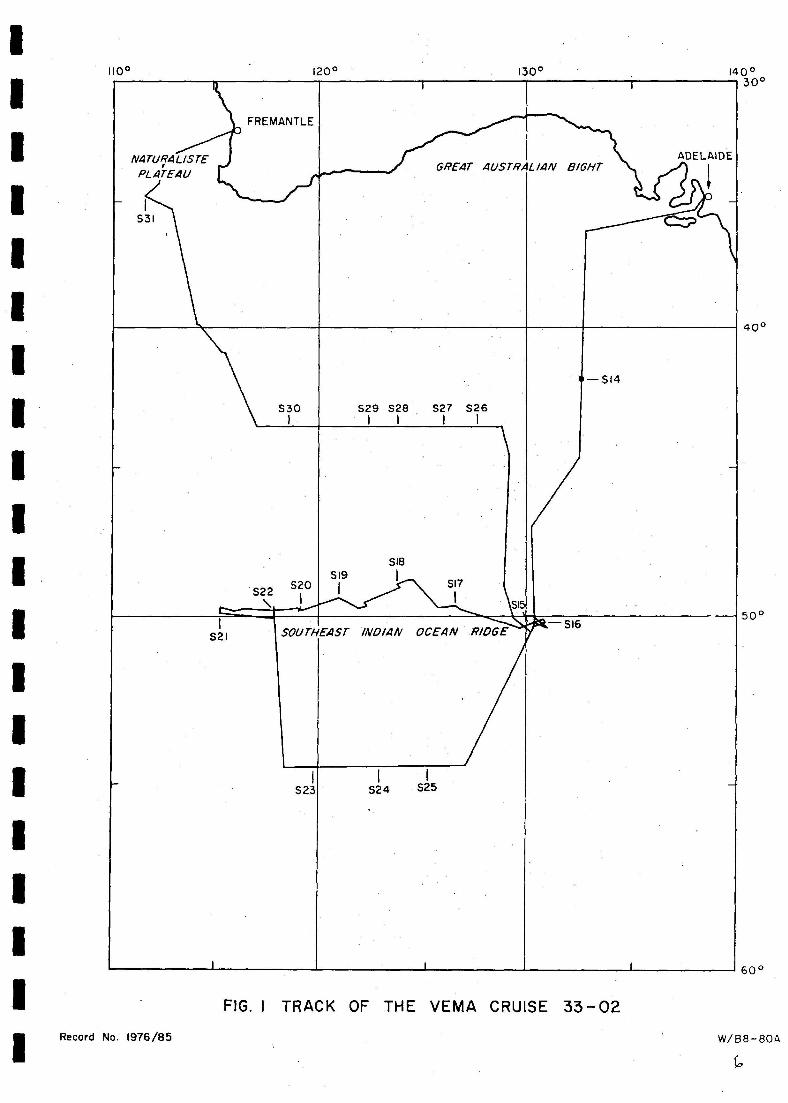
1. Track of the Vema cruise 33-02
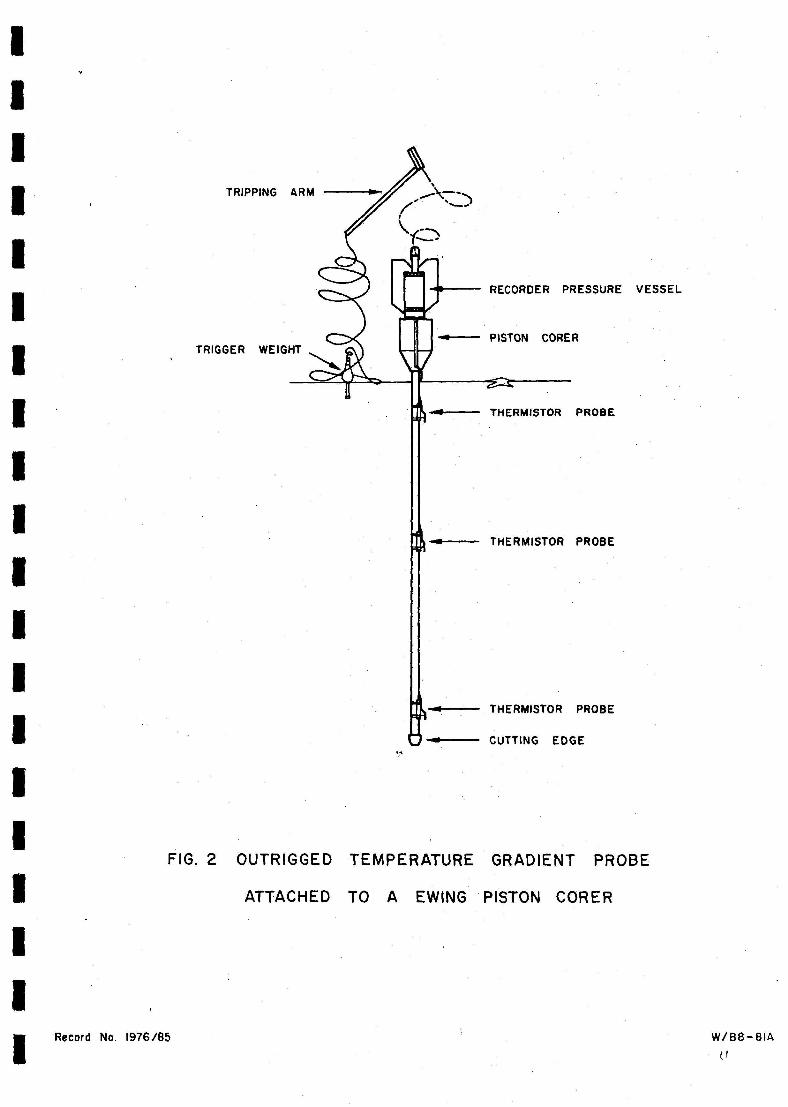
2. Outrigged temperature gradient probe attached to a Ewingpiston corer
3. (A)^Schematic diagram of thermograd(B) Typical record of apparatus
(C) Temperature versus depth in the bottom sediments
F. a ATKINSON, Commonwealth Government Printer
SUMMARY
1.
2.
3.
4.
5.
6.
7.
8.
'L--
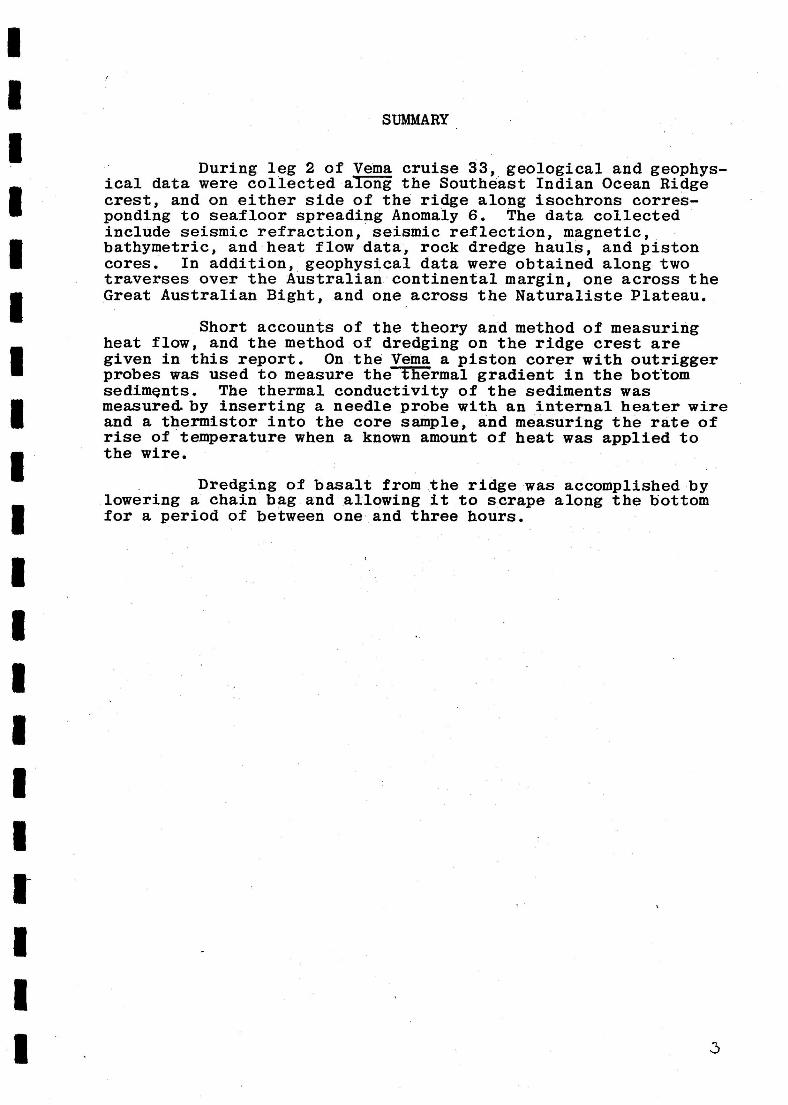
SUMMARY
During leg 2 of Vema cruise 33, geological and geophys-ical data were collected aTOTIE the Southeast Indian Ocean Ridgecrest, and on either side of the ridge along isochrons corres-ponding to seafloor spreading Anomaly 6. The data collectedinclude seismic refraction, seismic reflection, magnetic,bathymetric, and heat flow data, rock dredge hauls, and pistoncores. In addition, geophysical data were obtained along twotraverses over the Australian continental margin, one across theGreat Australian Bight, and one across the Naturaliste Plateau.
Short accounts of the theory and method of measuringheat flow, and the method of dredging on the ridge crest aregiven in this report. On the Vema a piston corer with outriggerprobes was used to measure the thermal gradient in the bottomsediments. The thermal conductivity of the sediments wasmeasured- by inserting a needle probe with an internal heater wireand a thermistor into the core sample, and measuring the rate ofrise of temperature when a known amount of heat was applied tothe wire.
Dredging of basalt from the ridge was accomplished bylowering a chain bag and allowing it to scrape along the bottomfor a period of between one and three hours.
3
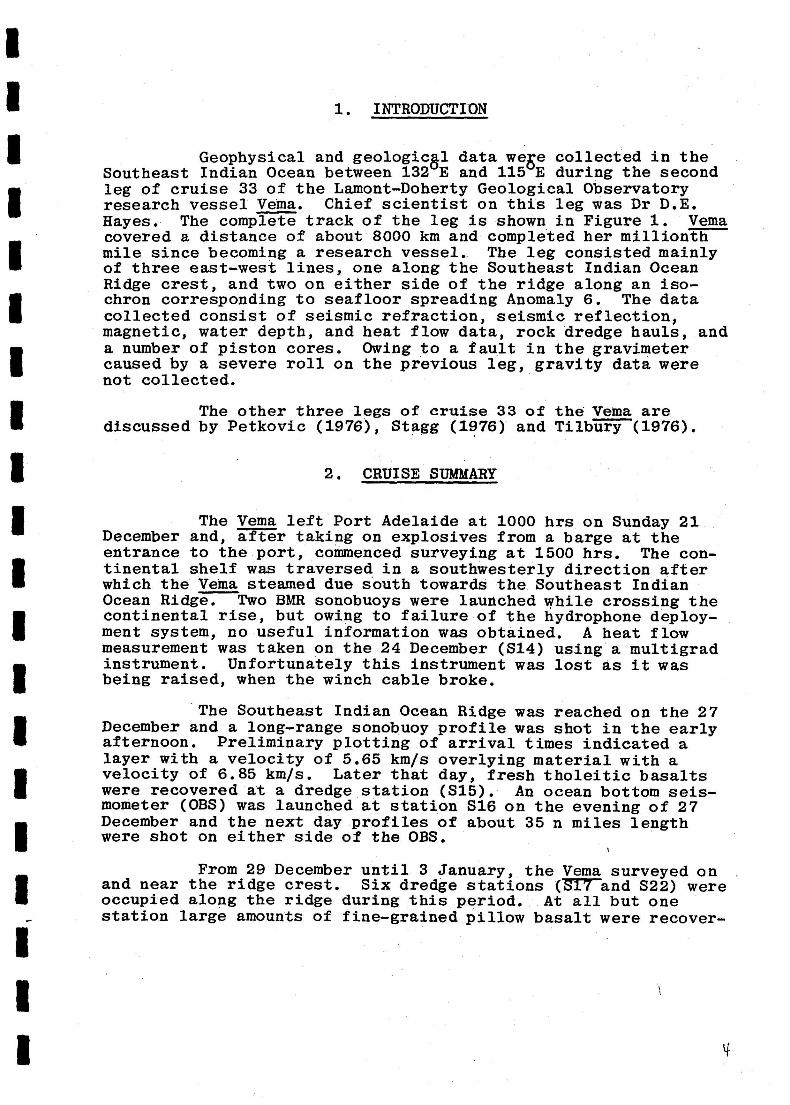
1. INTRODUCTION
Geophysical and geological data wee collected in theSoutheast Indian Ocean between 132E and 115` 1E during the secondleg of cruise 33 of the Lamont-Doherty Geological Observatoryresearch vessel Verna. Chief scientist on this leg was Dr D.E.Hayes. The complete track of the leg is shown in Figure 1. Vemacovered a distance of about 8000 km and completed her millionthmile since becoming a research vessel. The leg consisted mainlyof three east-west lines, one along the Southeast Indian OceanRidge crest, and two on either side of the ridge along an iso-chron corresponding to seafloor spreading Anomaly 6. The datacollected consist of seismic refraction, seismic reflection,magnetic, water depth, and heat flow data, rock dredge hauls, anda number of piston cores. Owing to a fault in the gravimetercaused by a severe roll on the previous leg, gravity data werenot collected.
The other three legs of cruise 33 of the Vema arediscussed by Petkovic (1976), Stagg (1976) and Tilbury (1976).
2. CRUISE SUMMARY
The Vema left Port Adelaide at 1000 hrs on Sunday 21December and, after taking on explosives from a barge at theentrance to the port, commenced surveying at 1500 hrs. The con-tinental shelf was traversed in a southwesterly direction afterwhich the Vema steamed due south towards the Southeast IndianOcean Ridge. Two BMR sonobuoys were launched while crossing thecontinental rise, but owing to failure of the hydrophone deploy-ment system, no useful information was obtained. A heat flowmeasurement was taken on the 24 December (S14) using a multigradinstrument. Unfortunately this instrument was lost as it wasbeing raised, when the winch cable broke.
The Southeast Indian Ocean Ridge was reached on the 27December and a long-range sonobuoy profile was shot in the earlyafternoon. Preliminary plotting of arrival times indicated alayer with a velocity of 5.65 km/s overlying material with avelocity of 6.85 km/s. Later that day, fresh tholeitic basaltswere recovered at a dredge station (S15). An ocean bottom seis-mometer (OBS) was launched at station S16 on the evening of 27December and the next day profiles of about 35 n miles lengthwere shot on either side of the OBS.
From 29 December until 3 January, the Vema surveyed onand near the ridge crest. Six dredge stations (S17 and S22) wereoccupied along the ridge during this period. At all but onestation large amounts of fine-grained pillow basalt were recover-

-2-
ed. After working west along the ridge crest the vessel steamedsouth to latitude 54 °30'S and from 4 January worked its way east-ward along an isochron corresponding to Anomaly 6 (21 m.y. B.P.)south of the spreading centre. A long-range sonobuoy probe wasshot at the beginning of this line and three heat flow and pistoncore stations (S23 to 525) were occupied. The preliminaryresults indicate heat flow values of 0.3 to 0.4 HFU (S23), 1.1 to1.2 HFU (S24), and 0.8 HFU (S25) which are lower than the averagevalue of 1.45 HFU for oceanic crust. Short-range sonobuoy probeswere made between the stations. The end of the line was reachedon 5 January, and the Vema headed north towards the site wherethe OBS had been launched. The OBS was recovered on the night of7 January after it had been on the sea-bottom for 11 days.
The ship then steamed north to survey a line along anisochron corresponding to Anomaly 6 north of the spreadingcentre. From 13 January, five heat flow and piston core stationswere occupied along this east-west line. Preliminary heat flowvalues of 0.9, 0.8, 0.8, 0.8, and 0.9 HFU were measured atstations S26-S30 respectively. Two long-range sonobuoys andfour short-range sonobuoys were deployed along this line. Thewesternmost probe, near S30, indicated a layer with velocity 3.5km/s over one with a velocity of 7 km/s.
Upon completion of the line the ship steamed towardsthe Naturaliste Plateau. Sonobuoy probes were made along linesintersecting Deep Sea Drilling Sites 264 and 258. A heat flowmeasurement at station S31 on the plateau gave a preliminaryresult of 1.4 HFU. The track across the Naturaliste Plateau tiesto several lines from the BMR continental margins survey. TheVema arrived at Fremantle at 1200 hrs on Saturday 17 January.
3. SEISMIC RECORDING
BMR continuous seismic profile recording
The BMR seismic recording system, consisting essen-tially of a 14-channel Ampex tape recorder and an E.P.C. monitorrecorder, had been installed in the Vema for the first leg ofcruise 33. In Adelaide, before the second leg commenced y a pre-amplifier was added to the system. Recording commenced at thestart of the leg on 21 December and continued until 4 January.Several gaps in the data are due to failure of the power supplyand the lack of a trigger pulse. Recording was discontinuedbetween 4 January and the morning of the 17th, because oceanbottom sediments were too thin to make recording worthwhile.
1110°^
120°^
130°^
140 °
NATURALISTEPLATEAU
IS31
•FRE MANTLE
GREAT AUSTRAL/AN B/GHTADELAIDE
• _
S30I
S29 S28I^I
S27I
S26I
S15
• — S14
_
"
^
S22^S20
^
\^I
S191
S18I S17
I
IS21
1
SOUTHEAST /ND/AN OCEAN RIDGE gr e-' — S16
—
1
IS23
IS24
IS25
•
1
FIG. I TRACK OF THE VEMA CRUISE 33-02
Record No. 1976/85^
W/88-80A
1
1
3 0°
40°
50 °
60 °

-3-
Difficulties experienced with the system were mainlydue to interference of the BMR recording gear with the Lamontinstruments. For instance, when the trigger signal was takendirect from the trip eel, the Lamont profiling recordersfunctioned erratically. The trigger was eventually taken fromthe logic circuit of one of the Lamont profilers but this gaverise to noise in the signals recorded by the BMR tape recorder.This noise was later identified as being caused by too large aD.C. voltage level on the trigger signal.
The E.P.C. recorder triggered on spurious noise andsince there are no delay facilities built into the recorder ithad to run on a very long sweep of 8 seconds. It was of littlehelp in monitoring the signal going onto tape. For this reasonthe E.P.C. recorder was switched off and instead the signal wasmonitored using an oscilloscope. Filter settings on the Kroh-nite filter were kept at 50 and 500 Hz for the low and the highcut-off frequencies.
Sonobuoy recording
Signals from six short-range sonobuoys were recorded ona spare channel of the 14-track tape during the leg. Recordingof reflection and trigger signals on two tracks continued whilethe refraction signals were being recorded. The Ampex taperecorder was also 'used to record the results of seismic refrac-tion experiments with four long-range sonobuoys. Three signalswere recorded on separate channels during these experiments: a1-s pulse, a shot-break signal, and a seismic signal. Both theshot-break and the seismic signal were amplified to 1 volt peak-to-peak before recording on tape.
BMR Aquatronics sonobuoys
During this leg, ten Aquatronics short-range sonobuoysowned by BMR were used. Of these, four gave good results afterseveral problems with the buoys, the receiver, and the ship'shigh frequency antenna were overcome. The major findings con-cerning the state of the buoys, which probably apply to the otherAquatronic sonobuoys held by BMR, are as follows:
(i) The batteries inside the buoys and the audio electronicswere still working.
(ii) The hydrophones did not generally deploy automaticallywhen the buoy was launched probably because of a fail-ure in the firing circuit.

-4-^ 1
Because of the failure of many of the sonobuoys torelease their hydrophone automatically, it was necessary torelease the hydrophone before launching a sonobuoy. This wasdone as follows. The middle shroud of the buoy was removed andthe two wires to the firing pin were cut and a U-shaped platecovering the firing pin was removed by unscrewing the bolt whichfastens it. Another U-shaped plate which holds the firing pin
11was then removed allowing the hydrophone to drop out of the sono-buoy's bottom section. In launching the buoy, care was taken toensure that the hydrophone was let go a few seconds before thebuoys.
4. DATA OBTAINED FROM THE LEG
I obtained the following data records at the end of theleg: four tapes of seismic reflection data, one tape of long-range sonobuoy refraction data, one box of satellite navigationcomputer output, one set of copies of the chief scientist's log,one set of copies of the ship's track maps showing fixes and
11depth values at six-minute intervals (total of 14 maps), one copyof the track map with station positions. The rest of the data,
11including magnetic and bathymetric data at 6-minute intervals andcopies of the seismic profiler records, will be sent to BMR byLamont when the data records have been digitized and copied.
5. MEASUREMENT OF HEAT FLOW
This section briefly describes how heat flow ismeasured from the RV Vema. The basic equation in determining theheat flow towards the Earth's surface is relatively simple andconsists of:
q = K ( T/a )
where q is the geothermal flux, K is the thermal condzqtivity, Tis the temperature and Z is the depth. The quantity °IlaZ isreferred to as the geothermal gradient (g) and is the rate ofincrease of temperature with depth. K is related to the specificheat c, the density/2, and the diffusivity, in the followingway:
= P
a

-5-
In practice the main object of heat flow measurements at sea isto determine the geothermal gradient g, since the thermal con-ductivity K does not vary by large amounts. Fof most ideep iseasediments K varies between 1.8 and 2.5 )..cal cm - sec- °C- .Equipment
To measure the thermal gradient in the ocean, the methoddevised by Bullard (1954) is used. This method requires a probeor corer with two or more temperature sensing devices spacedalong the instrument, together with a recorder (Fig. 2). OnboardVema, a Ewing piston corer with a length of about 10 m is employ-ed. Attached to the corer are five outrigger probes spaced 2 mapart which contain thermistors. The recorder is housed in apressure vessel which sits in the core weights. A schematiccircuit diagram of the recorder is shown in Figure 3A. Therecorder is of the 'Ewing thermograd' type. The thermistors inthe temperature sensing probes are sequentially placed in one armof a simple Wheatstone bridge by an automatic 16-positionrotating selector switch. Any imbalance in the bridge isdetected by a sensitive 30-cps galvanometer. Deflections of themirror are recorded photographically on a 70-mm film placed about23 cm from the galvanometer. The bridge and the galvanometer arerepeatedly calibrated by placing a standard resistor in thebridge instead of the thermistor on every half-minute cycle ofthe rotary switch. The standard resistors are selected to coverthe range of expected thermistor resistance in the Ocean bottomsediments. A typical film record is shown in Figure 3B.
Procedure before station
Before the Vema came on a station the piston corer wasrigged with the probes. The recorder was loaded with new filmand the batteries were renewed. During the approach to a heatflow station, a 3.5 kHz echosounder was watched to ensure thatsufficient sediment was present on the bottom to allow fullpenetration of the corer. Seismic profiles and sonobuoy probeswere made along the approach track to the heat flow station, andwhere possible the station was situated on the intersection oftwo seismic profiling lines. This seismic profiler and sonobuoydata are later used to obtain several corrections to the measuredheat flow.
Procedure on station
Once the Vema came on station, the corer with the heatflow equipment attached to it was lowered over the side. Thetripping arm on the triggering device (Fig. 1) was set in thecocked position and the corer was lowered to the sea-bottom. Inseveral instances a pinger was attached to the wire above the
o.

-6-
corer so that its distance from the bottom could be read from theprecision depth recorder. Wire was paid out until the triggerweight had reached the bottom and the corer had been released.The corer was then left in the sediment for about ten minutes toallow the effect of frictional heating of the probes to die downand for the temperature of the probes to come to equilibrium withthat of the bottom sediments. Because of the small mass of theoutrigger probes, the effect of friction on them caused by pene-tration died out within a few minutes. During the period ofmeasurement, wire was paid out spasmodically to prevent pull outof the corer. After the required time for a reliable temperaturemeasurement had expired, the corer was hauled onboard.
Procedure after station
When the corer had been hoisted aboard, the recorderwas disconnected and taken into the laboratory and the film wasdeveloped. The piston core was extracted and described andmeasurements of thermal conductivity were made at 10-cm intervalsalong its entire length. Cores of up to 9.5 m were taken duringthis leg.
The conductivity measurements done onboard Vema use theneedle probe technique. This consists of inserting a very thincylinder containing an internal heater wire into the core, andapplying a known amount of heat to the wire. A small thermistorwhich is inside the needle and midway along its length measuresthe rate of rise of temperature. The value of the conductivity(K) is obtained from the following formula:
T = (Qp1UK) in (t) + C
where Q is the heat applied per unit length per unit time, T isthe temperature at the thermistor is a function of time t, and Cis a constant. Readings of T for each conductivity measurementwere usually taken over a four-minute period.
Calculation and correction of the heat flow measurement at astation
The heat flow value obtained from the measured thermalgradient and conductivity requires several corrections before itis close to the true thermal flow through the ocean floor. Tomake these corrections, it is necessary to know the sedimentationrate, the thickness of the sediment, and the topography of boththe sea-floor and the basement. The corrections are applied tothe thermal gradient data and are known as environmental correc-tions. They correct for:
THERMISTOR PROBE
CUTTING EDGE
TRIGGER WEIGHT
■■■
FIG. 2 OUTRIGGED TEMPERATURE GRADIENT PROBE
ATTACHED TO A EWING PISTON CORER
Record No. 1976/85^
W/B8-81Af

WATERPROSE LOWER MIDDLE UPPER
RECORDERTHERMISTORPROBES
A TNERMOGRAD VI9-1119TEMPERATURE DIM °C
0^0-4^0-1^12^II^II
FIG.3
A SCHEMATIC DIAGRAM OF SENSOR AND DETECTING CIRCUIT OF THE EWING THERMOGRAD.
B TYPICAL RECORD OF THE OUTRIGGED PROBE APPA RATUS.
TEMPERATURE VERSUS DEPTH IN THE BOTTOM SEDIMENT RELATIVE TO THE BOTTOM
WATER TEMPERATURE DERIVED FROM THE RECORD SHOWN IN B.
1
1
Record No. 1976/85 W/B8-82A
1
I .
1
SEDIMENT PROBES
^11^
15I 4 ^le^';')%
I ft lz SELECTOR
I. ii SWITCH
s 5
• -• K
LOWER PROBE '11b.
MIDDLE PROBC.W.— — —
UPPER PROBE*..^.^.^. .
PENETRATION
01s
ZERO REFERENCE
WATER PROBE NI.^ z 10
A It0
PRESSURE TRACE
16
ID
20
•
, ,PULL OUT

-7-
a) the effects of deposition and erosion. Freshly depositedsediments tend to have a lower thermal gradient thansediments which are being eroded.
b) local topography and irregular sediment cover. These effectscan be estimated using the results of calculationsperformed by Von Herzen & Uyeda (1963) and Sclater etal. (1970).
c) bottom water temperature variations. These appear to benegligible in the deep oceans.
d) biogenic activity or water movement within the sediment. Ifeither of these have taken place, the effects will beevident in the core sample taken at the heat flowstation.
The theory of the method used to estimate these environmentalcorrections is treated in a volume edited by Lee (1965). Oncethe corrections are applied to the measured thermal gradient, theheat flow through the ocean floor can be calculated from theexpression given in the introduction.
6. DREDGING OPERATIONS
The Vema occupied seven dredge stations on or near thecrest of the Southeast Indian Ocean Ridge during leg 2. At sixof these stations, large amounts of fine-grained pillow basaltswere recovered. The following is a general description of theequipment used and the procedure adopted.
Equipment
The dredging equipment on the Vema consists of a winchdriven by a converted tractor engine, and an A-frame. The winchis situated on the deck slightly aft of midships and the A-frameis on the starboard side of midships. The wire from the winch'sdrum goes over the side via blocks mounted on the top of the A-frame and on the deck immediately below the A-frame. The amountof tension on the wire is indicated on an arbitrarily graduatedscale situated near the side of the drum. The dredge consists ofa conventional rectangular frame to which a chain net is attached.
Procedure
Dredging on the Vema was a hard task in the rough coldweather experienced at the latitude of the Southeast Indian OceanRidge. The winch and its controls are exposed and a larke amountof discomfort for the operator was caused by bad weather or sea-state. However the arrangement does allow the winch operator toobserve the operation at all times.
15
-8-
Dredging on the ridge crest proved to be a relativelysimple operation. The Vema would come on station with the star-board side to windward and thedredge was lowered over the side.A length , of wire, in excess of the water depth by about 1000 m,was paid out and the dredge was then left on the bottom. Afterseveral solid pulls on the dredge had been observed on the tensionmeasuring device, the dredge would be hauled in again. Theperiod for which the dredge was left to drag along the bottomvaried from 1 to 3 hours. While the dredge was being hauled inthe Vema would be manoeuvred clear of any snags.
The amount of rock recovered at different stationsvaried from 100 to 1500 lb; some boulders were as large as 0.15e". In the water-depths of about 2 km over the ridge crest, thetime taken for a dredging was between 3 and 5 hours.
7. DISCUSSION AND RECOMMENDATIONS
At present there is no organization or institution inAustralia engaged in making heat flow measurements at sea. Thisis largely because of the high cost and the specialized nature ofheat flow surveying. It is worth reflecting on the possibility.of BMR becoming involved in making heat flow measurements at sea.Heat flow measurements have been made in all the world's majoroceans since the 1950s and they have contributed greatly toknowledge of the evolution of the ocean basins. One of theearlier discoveries was that the mean heat flow at sea was equalto that on land. Later work has shown that the amount of heatflow and the depth of the sea-floor are related to the age of theoceanic crust. Of particular importance was the discovery ofhigh heat flow in the marginal basins of the northwest Pacificsuch as the Sea of Japan.
If BMR were to do heat flow work, it should concentrateits efforts on the marginal plateaux and ridges around Australiawhere the small amount of work done hitherto indicates thepresence of anomalous heat flow regimes. For instance, theNaturaliste Plateau and the Lord Howe Rise both have higher thannormal heat flows judging from the one measurement taken on eachof the structures. Such information is necessary in determiningwhether the temperature of the sub-bottom is conducive to theformation of hydrocarbons in an area.
The equipment onboard the Vema described in thissection is by no means the most sophisticated. There was aninstrument called a multigrad on board at the start of the cruisebut this was unfortunately lost during the first attempt atusing it. This instrument is much smaller and can be lowered on

-9-
hydrographic wire. It also has an advantage in that it takesseveral measurements of the thermal gradient during the onelowering. This type of instrument would be the sort that BMRshould consider using if it is going to start a heat flow program.Oceanic heat flow recorders are not 'off-the-shelf' items andthey are usually built by the organization which uses them. Itis therefore difficult to estimate the cost which BMR would incurin acquiring heat flow measuring apparatus.
Whether a heat flow program could be conveniently fittedinto the BMR normal multi-sensor type geophysical surveys remainsto be seen. The time for a measurement to be made is of theorder of an hour, and while the ship is on station there could bea certain amount of drift from the line. In addition a consider-able amount of time is lost in pulling in and letting out thegeophysical gear used to do the underway measurements.
-10--
8. REFERENCES
BULLARD, E.C., 1954 - The flow of heat through the floor of theAtlantic Ocean. Proc. Roy. Soc. London, A, 222, 408-29.
LEE, W.H., 1965 - Terrestrial heat flow. Geophys. Monogr. 8, Am. geophys. Union, Washington, D.C.
PETKOVIC, P., 1976 - Vema cruise 33 leg 4 over the NaturalisteFracture Zone, 23 February to 15 March, 1976: Observer'sreport. Bur. Miner. Resour. Aust. Rec. 1976/86 (unpubl.).
SCLATER, J.G., JONES, E.J.W., & MILLER, S.P., 1970- The relation-ship of heat flow, bottom topography and basement relief inPeake and Freen deeps, Northeast Atlantic. Tectonophys., 10,283.
STAGG, H.M.J 1976 - Vema cruise 33 leg 3 over the MagneticQuiet Zone south of Australia, 20 January to 19 February,1976: Observer's report. Bur. Miner. Resour. Aust .. Rec.(in prep.).
TILBURY, L.A., 1976 - Vema cruise 33 leg 1 over the SoutheastIndian Ridge, 17 November to 17 December, 1976: Observer'sreport. Bur. Miner. Resour. Aust. Rec. 1976/84 (unpubl.).
VON HERZEN, R.P., & UYEDA, S., 1963 - Heat flow through the east-ern Pacific ocean floor. J. geophys. Res., 68, 4219.
0,6