bureau of meteorology - a history of stormy weather
TRANSCRIPT

Attachment 3 – Ausgrid’s pass through application Bureau of Meteorology: A history of stormy weather August 2015


The Australian Bureau of Meteorology celebrated its centenary as a CommonwealthGovernment Agency in 2008. It was established by the Meteorology Act 1906 andcommenced operation as a national organisation on 1 January 1908 through the consoli-dation of the separate Colonial/State Meteorological Services.The Bureau is an integrated scientific monitoring, research and service organisation
responsible for observing, understanding and predicting the behaviour of Australia’sweather and climate and for providing a wide range of meteorological, hydrological andoceanographic information, forecasting and warning services.The century-long history of the Bureau and of Australian meteorology is the history of
the nation – from the Federation Drought to the great floods of 1955, the Black Friday andAshWednesday bushfires, the 1974 devastation of Darwin by cyclone Tracy and Australia’scostliest natural disaster, the Sydney hailstorm of April 1999. It is a story of round-the-clockdata collection by tens of thousands of dedicated volunteers in far-flung observing sites,of the acclaimed weather support of the RAAF Meteorological Service for southwestPacific operations throughWorldWar II and of the vital role of the post-war civilian Bureauin the remarkable safety record of Australian civil aviation. And it is a story of outstandingscientific and technological innovation and international leadership in one of the mostinherently international of all fields of science and human endeavour.Although headquartered in Melbourne, the Bureau has epitomised the successful
working of the Commonwealth with a strong operational presence in every State capital anda strong sense of identity with both its State and its national functions and responsibilities.The Bureau has played an especially active role in support of agriculture, the environment,water resource management and natural disaster mitigation.
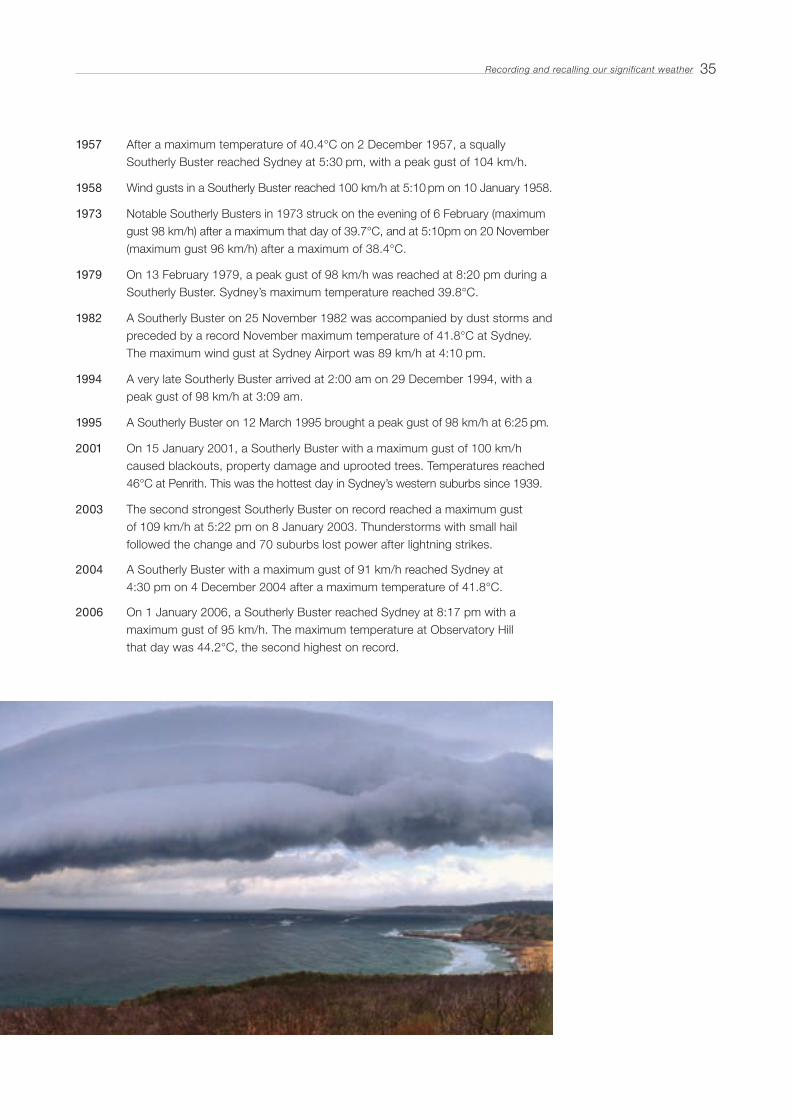
Front cover image: Storm approachingTreachery Beach, south of Seal Rocks, New SouthWales.Photograph courtesy of [email protected]

Aboriginal storytellers had passedweather lore down some 1600 gen-erations before the First Fleet cameto Sydney Cove on 26 January 1788.
The European newcomers appliedtheir science and technology tomeasure and analyse the weatherand climate on a continent whereseasons were reversed and thedramatic variability of the climatewas far beyond their experience.
We have a few general weatherobservations from the first day ofEuropean settlement. For instance,First Lt William Bradley of the Siriusnoted ‘at day light, Fine weather witha moderate breeze at SE’. But notuntil Lt William Dawes built his smallobservatory where a south pylon ofthe Sydney Harbour Bridge nowstands did we have detailedobservations. His records from 14September 1788 to 6 December 1791launched the collection of weatherand climate data critical to helpingthe newcomers survive, and eventuallythrive, in what they finally acceptedas a notoriously variable climate.
Decades later records revealedthat the most diverse environmentsand climates on the continent, fromtropical to temperate, from arid toalpine, are found in New South Wales.
From the Bureau’s birth in 1908as the national successor to Stateweather services, meteorologists
laboured for decades with modestresources to improve scientificunderstanding of the atmosphere,and to monitor it adequately. Theirprospects of success increasedimmeasurably from the 1960s withever-more-productive weathercomputers, weather satellites andradars, and more recently the creationof the New South Wales network ofmore than 100 automatic weatherstations.
In this welter of automation, it’sheartening to find that non-urgentrainfall and storm information stillfinds its way to the Bureau onhandwritten forms – and is, ironically,perhaps more valuable than ever toscientists monitoring climatechange. All of us indirectly profitfrom the tireless efforts of around1500 rainfall and 1500 storm
spotter volunteers in New SouthWales.
This booklet commemorates theBureau’s century of service to thecommunity and also highlightssignificant New South Wales weatherand climate events. Here are snap-shots of particularly damagingSoutherly Busters, East Coast Lowsand tropical cyclones; the creepingcatastrophe of drought; the briefviolence of a tornado; massive fires;the Hunter floods of 1955, whichresulted in the Bureau being givenflood forecasting responsibilities;and the devastating Sydneyhailstorm of 1999.
We should look back to remind uswhy, and how, we must preparecommunities for weather extremeslike flooding, fire and storm; we mustalso look forward to prepare for evengreater extremes projected underclimate change. This may prove to beas big an adaptation challenge to ourcommunity as that faced by GovernorPhillip confronting, in the words of anold English ballad, ‘the world turnedupside down’.
Barry HanstrumRegional Director forNew South WalesAustralian Bureau of Meteorology
Speared kangaroo: Aboriginal rockcarving, Sydney
A century of storms, fire, flood and drought in New South Wales
Stormy weather

A century of storms, fires, flood and drought in New South Wales
Lt William Dawes of the Royal Marinesearned a place in Australia’s scientificpantheon with his astronomical measure-ments and observations of the wind,weather, temperature and barometricpressure five or six times daily from 1788to 1791, when he returned to England.
For the next 70 years, weatherobservations were fragmentary, and oflittle value to today’s climatologists. Somerecords were kept at Government Housebut unfortunately most of these have beenlost or destroyed. Measurements weremostly taken by interested individuals atdifferent sites for only a few years, andcome largely from private journals andexpedition reports. Some valuablecontributors were:
Sir Thomas Brisbane, Governorbetween 1821 and 1825, set up a privateobservatory in Parramatta where regularobservations were taken for some years.
Reverend William Braithwaite Clarke,another keen amateur who was primarilya geologist, left numerous weatherrecords, articles and theories aboutweather phenomena.
George Peacock, a Yorkshire solicitortransported to Australia in 1837 forforgery, was trained as a weatherobserver at the Parramatta Observatory.At South Head he compiled New SouthWales’ longest early record, from 1840 toabout 1855. While climatologists regardhis measurement of 20.41 inches of rain(518 mm) on 16 October 1844 as thehighest recorded 24-hour total in the
Sydney metropolitan area, his communityfame rests primarily with his sought-afterromantic paintings of the harbour, itsimportant homes and prominent buildings—a valuable record of early Sydney.
William Jevons, an English polymath,who took readings near Sydney from1855 to 1858, published the first thoroughstudy of Australian climate in 1859.
Sydney ObservatoryThe building of the AstronomicalObservatory in 1858 on a slight headlandoverlooking Miller's Point— with SydneyHarbour (Port Jackson) to the north,Darling Harbour to the west andsouthwest, and Circular Quay (SydneyCove) to the east—brought the first full-scale official meteorological observationsat the beginning of 1859, under thedirection of the newly appointedAstronomer for New South Wales,Reverend William Scott. The only otherstation within the region to submit reports,Parramatta, was soon joined by Windsor,Liverpool and Botany. The observationsmade daily at 9 am, 3 pm, and 9 pm werefairly comprehensive, even at this earlystage: pressure, wind, cloudiness, dryand wet-bulb temperatures, maximumand minimum temperatures both in theshade and in the sun, humidity, vapourpressure and rainfall. At Observatory Hill,ground minimum temperatures,evaporation and ozone measurementswere also made and later, soiltemperature and adjacent harbour water
Lt William Dawes
Before the Bureau
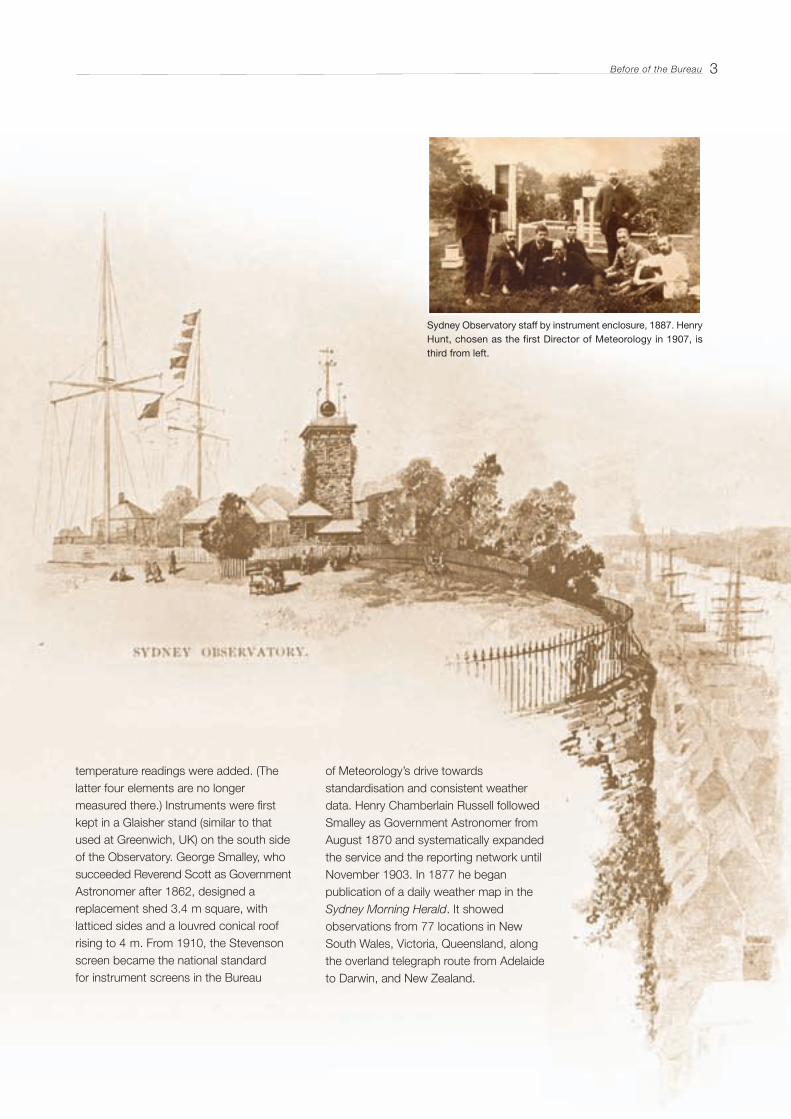
temperature readings were added. (Thelatter four elements are no longermeasured there.) Instruments were firstkept in a Glaisher stand (similar to thatused at Greenwich, UK) on the south sideof the Observatory. George Smalley, whosucceeded Reverend Scott as GovernmentAstronomer after 1862, designed areplacement shed 3.4 m square, withlatticed sides and a louvred conical roofrising to 4 m. From 1910, the Stevensonscreen became the national standardfor instrument screens in the Bureau
of Meteorology’s drive towardsstandardisation and consistent weatherdata. Henry Chamberlain Russell followedSmalley as Government Astronomer fromAugust 1870 and systematically expandedthe service and the reporting network untilNovember 1903. In 1877 he beganpublication of a daily weather map in theSydney Morning Herald. It showedobservations from 77 locations in NewSouth Wales, Victoria, Queensland, alongthe overland telegraph route from Adelaideto Darwin, and New Zealand.
Sydney Observatory staff by instrument enclosure, 1887. HenryHunt, chosen as the first Director of Meteorology in 1907, isthird from left.
Before of the Bureau 3

Birth of the Bureau
In 1903, Henry Hunt was appointed NewSouth Wales State Meteorologist; in 1907 hewas chosen as the first CommonwealthMeteorologist, based at the Bureau’s Mel-bourne headquarters. Observations contin-ued in the Observatory grounds for a whilebut as the instrument shed fell into disrepair,from about 1910 a duplicate set of instru-ments was set up nearby in a large Steven-son Screen. In 1917 this screen was moved135 m downhill to where a new WeatherBureau building was to be built. Observa-tions have been taken there ever since.
The 1917 change affected readings ofvarious elements, especially temperature.Since then the surrounding area has alteredmarkedly. The Weather Bureau buildingwas built nearby in 1922 and the new FortStreet Primary School was built in 1946
immediately opposite the Bureau. Manynearby houses were demolished in 1932to make way for the Harbour Bridgeapproaches, both elevated and open cut,which now surround the old Bureaubuilding and instrument enclosure. Themushrooming of high-rise office blocks tothe east and south also significantlychanged the exposure of the site. Forecast-ers left Observatory Hill in 1963 to workfrom the central city. While the many ‘dis-continuities’ meant the Observatory site just500 m from Lt William Dawes’ 18th centuryobservatory site has no value as a high-quality long-term climate station, the auto-matic weather station installed in 1990(eventually replacing human observations)provides real-time weather observations forthe forecasters.
Under Hunt’s leadership, New SouthWales shared in the Bureau’s slow growthin its first three decades. Richmond FieldOffice opened in 1928. Several aviation dis-asters in the 1930s persuaded the govern-ment to greatly expand the Bureau’s aviationservices and infrastructure. Canberra andLord Howe field offices opened in 1939.
WWII saw the Bureau ‘put into uniform’as the RAAF Meteorological Service. TheWagga Wagga office opened in 1941,continuing observations taken at the air-port since 1924. Routine surface observa-tion at Williamtown began in 1942. CoffsHarbour started as a USAF Observer Me-teorological Office in 1942 and was takenover by the RAAF in 1943. During WWIIthe RNZAF took upper air observations at
Experiment to measuretemperature at high altitudes,Sydney, 1915.Photograph courtesy of theSydney Morning Herald.
A century of storms, fires, flood and drought in New South Wales
Norfolk Island. Upper air observations usingweather balloons began at Williamtownin 1950.
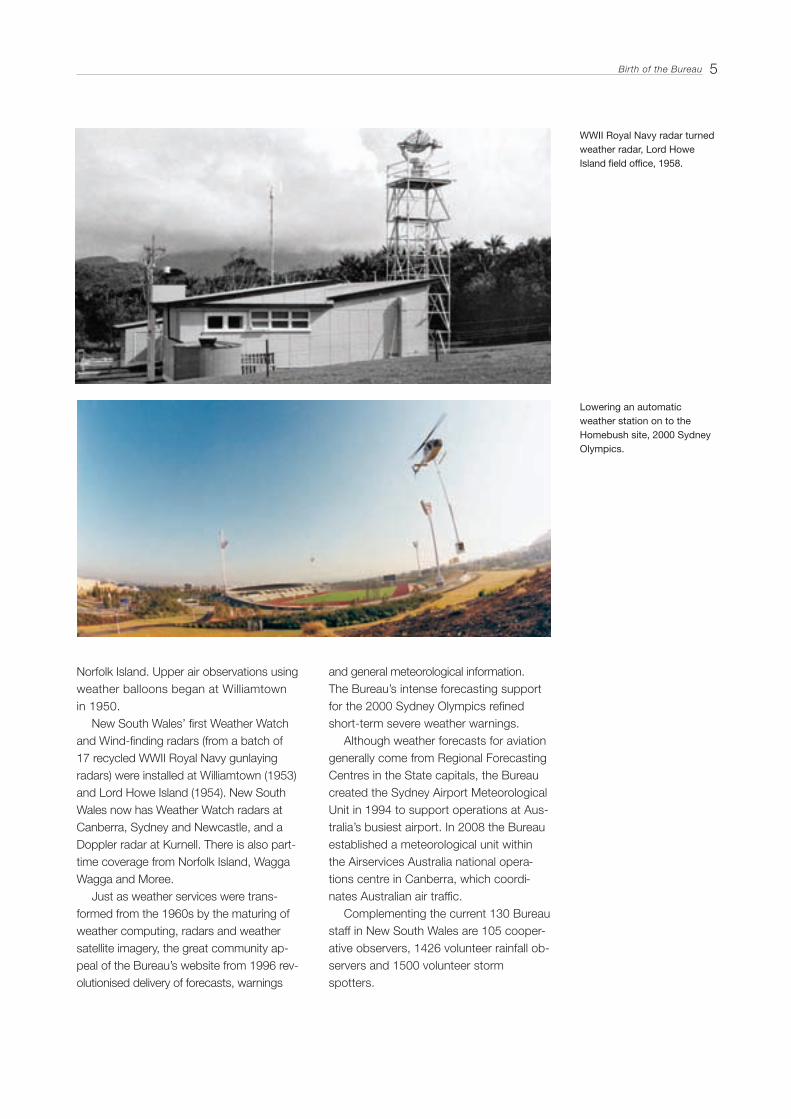
New South Wales’ first Weather Watchand Wind-finding radars (from a batch of17 recycled WWII Royal Navy gunlayingradars) were installed at Williamtown (1953)and Lord Howe Island (1954). New SouthWales now has Weather Watch radars atCanberra, Sydney and Newcastle, and aDoppler radar at Kurnell. There is also part-time coverage from Norfolk Island, WaggaWagga and Moree.
Just as weather services were trans-formed from the 1960s by the maturing ofweather computing, radars and weathersatellite imagery, the great community ap-peal of the Bureau’s website from 1996 rev-olutionised delivery of forecasts, warnings
and general meteorological information.The Bureau’s intense forecasting supportfor the 2000 Sydney Olympics refinedshort-term severe weather warnings.
Although weather forecasts for aviationgenerally come from Regional ForecastingCentres in the State capitals, the Bureaucreated the Sydney Airport MeteorologicalUnit in 1994 to support operations at Aus-tralia’s busiest airport. In 2008 the Bureauestablished a meteorological unit withinthe Airservices Australia national opera-tions centre in Canberra, which coordi-nates Australian air traffic.
Complementing the current 130 Bureaustaff in New South Wales are 105 cooper-ative observers, 1426 volunteer rainfall ob-servers and 1500 volunteer stormspotters.
WWII Royal Navy radar turnedweather radar, Lord HoweIsland field office, 1958.
Lowering an automaticweather station on to theHomebush site, 2000 SydneyOlympics.
Birth of the Bureau 5

The climate of New South Wales
Lightning over the SydneyHarbour Bridge, 1996.Photograph courtesy of SisterVeronica Rahill.
The considerable climatic variationacross New South Wales ranges fromthe hot, dry, continental conditions inthe west, to the subtropical, wet condi-tions in the northeast, to the alpine coldof the southeast.
The warmest town is Tibooburra,with a mean annual temperature of20.6°C. The coldest place is CharlottePass, the highest village in Australia, witha mean annual temperature of 4.5°C.The State record temperature extremesrange from a high of 50°C at Wilcanniaon 10 January 1939 to a low of -23°C atCharlotte Pass on 29 June 1994. TheWilcannia record was set during thelongest-running heatwave for the Statein January 1939. Places such as Bourke,Walgett and Dubbo experienced higherthan 40°C for at least 10 days in a row.
The average annual rainfall is alsohighly variable with more than five timesas much rain falling along the coast asin the west. Byron Bay, the most east-erly part of Australia, has an annual av-erage rainfall of just over 1716 mm. Onthe western border, the average annualrainfall is only about 200 mm. The
highest daily total on record is 809.2mm at Dorrigo on 21 February 1954.The highest monthly total was 1620.6mm at Upper Crystal Creek (Mid NorthCoast) in January 1974.
The Great Dividing Range runs ap-proximately north to south in the east,parallel to the coast. Its large impacton the State’s climate – particularilydistribution of rainfall – results in fourdistinct climate zones:
The Coast
The coastal strip has a generally mildclimate, ranging from subtropical nearthe Queensland border, with a warmhumid summer and mild winter, to thecool temperate climate of the south,with a warm summer and cold winter.The climate of the coastal strip isstrongly influenced by the warm watersof the Tasman Sea and the East Aus-tralian Current, which in general keepthe region free from extremes of tem-perature and provide moisture to in-crease rainfall. Average annual rainfallvaries from more than 2000 mm in thenorth to 800 mm in the south. EastCoast Lows typically associated withheavy, often flooding, rain and damag-ing winds are also a feature of the cli-mate of the coastal strip.
The Ranges andTablelands of theGreat Dividing Range
Much of this area is above 1000 m inelevation. The highest peak of the GreatDividing Range is Mt Kosciuszko
A century of storms, fires, flood and drought in New South Wales

The Climate of New South Wales
(2228 m) in the south and there are severalpeaks above 1500 m. The climate rangesfrom temperate in the north, with a warmsummer and cool winter, to cool temperatein the south, with a mild to warm summerand cold winter. Areas above 1200 m, par-ticularly in the south, have an Alpine cli-mate. Snowfalls occur regularly on theSouthern Alps mainly in winter and occa-sionally a cold outbreak causes snowfalls tospread further north to the elevated regionsof the Central and Northern Tablelands. An-nual rainfall averages from more than 1000mm in the north and in alpine areas in thesouth, to less than 800 mm in areas of theSouthern Tablelands. Rainfall is generallygreater to the east of “The Divide” wherethe abrupt rise of the Ranges from thecoastal plain enhances rainfall through oro-graphic lift of moist easterly winds.
The Western Slopes and Plains
West of “The Divide,” the Ranges andTablelands gradually descend into theWestern Slopes and Plains. With this grad-ual descent, and consequently less pro-nounced orographic lift effect on generallydrier westerlies, average annual rainfall alsodrops gradually away from around 800 mmto around 500 mm on the Plains. In warmermonths a heat-related inland trough cangenerate significant thunderstorm activity,particularly in the north. The climate of theWestern Slopes and Plains is generally hotand dry with a cooler winter. Average maxi-mum temperatures gradually increase asheight above sea level decreases and sum-mer can be very hot. In winter, mild, dry,sunny days are the norm, but winter nightscan be very cold.
The Arid Plains
Continuing west into the central and farnorthwest regions of the State, the climatebecomes hotter and semi-arid to arid, withaverage annual rainfall dropping below 500mm and reaching as low as 200 mm in thefar west and northwest. Though winterdays are often mild, winter nights can bevery cold.
27
24
21
1815
12
...
. ... . . .. . .
. . . ..
. . ... . .
... . .
.. . .
.
.. .
Hay
Cooma
Dubbo
Moree
Cobar
Bowral
Albury
Sydney
Orange
Mudgee
Nyngan
Bourke
Ivanhoe
Canberra
Inverell
ArmidaleNarrabri
Newcastle
Deniliquin
Condobolin
Hungerford
Broken Hill
Moruya Heads
Coonabarabran
Port Macquarie
Tibooburra
WalgettYamba
Coffs HarbourTamworth
Griffith
Wollongong
Wagga
Tenterfield
Lismore
Average annual rainfall (mm)
Average daily maximumtemperature (°C)
0 200 300 400 500 600 800 1000 1200 1600 2000 2400 3200
-3 0 3 6 9 12 15 18 21 24 27 30 33 36 39
7
New South Wales has a northeast tosouthwest variation in the seasonality ofrainfall. Summers in the northeast are wet,due to moist onshore easterly trade windsand frequent intrusions of tropical air fromthe north. However rainfall is lower in win-ter when this region lies beneath the sub-tropical ridge. In contrast, southwestwinters are showery under the influence ofprevailing westerlies while summer rainfallis low. In southeast and central NewSouth Wales, where these two regimesoverlap, rainfall is spread more uniformlythrough the year. The northwest is aridwith low average rainfall in all seasons.
Wind speed and direction varies fromday to night, from season to season andfrom place to place. The most markeddaily and seasonal variations occur on thecoast and adjacent tablelands. In sum-mer, the sea breeze brings considerablerelief to coastal areas as a ‘cool change’during the afternoon. In winter, the west-erly land breeze is prominent between thetablelands and the coast, especially whenreinforced by seasonal southwest to westwinds over the south of the State. While
these seasonal winds cause cold, show-ery weather on the western slopes andparts of the tablelands, they reach thecoast as dry and rather cool westerlies,associated with clear skies and sunshine.Over the State, seasonal winds are pre-dominantly southeast to northeast in thesummer when the subtropical ridge lies tothe south of the State, and southwest tonorthwest in the winter when its averageposition is across the north of the State.
The highest incidence of strong windgusts occurs on the Snowy Mountainsand coastal New South Wales. The maxi-mum recorded wind gust on the NewSouth Wales mainland was 174 km/h atRichmond during a thunderstorm on 3December 2001. At Lord Howe Island atropical cyclone brought a 178 km/h guston 30 January 1948. Coastal NSW canexperience gale to storm-force windsfrom East Coast Lows, and also powerfulwind gusts when strong southerlychanges known as Southerly Bustersmake their way up the coast.
Lord Howe and Norfolk Islands are bothwithin the New South Wales Bureau’s area
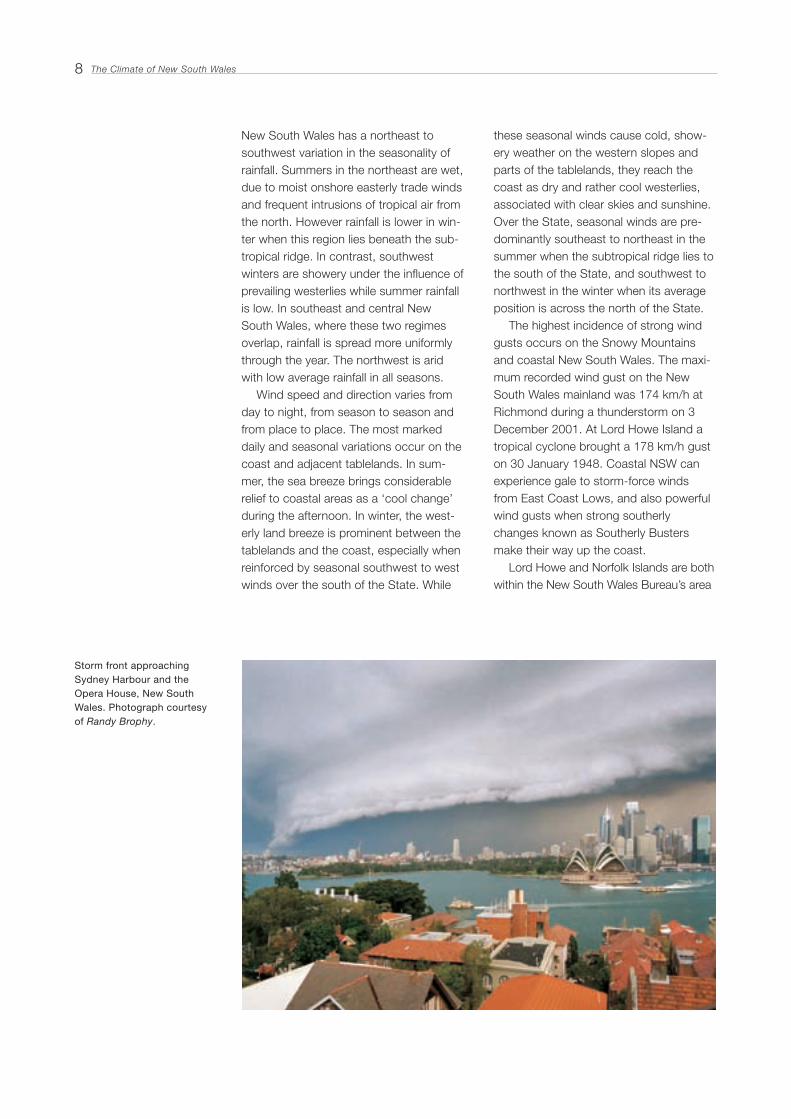
Storm front approachingSydney Harbour and theOpera House, New SouthWales. Photograph courtesyof Randy Brophy.
The Climate of New South Wales8

of responsibility. Their subtropical climate istempered by the surrounding sea, withsmall daily and annual temperatureranges, particularly compared with thecontinental climate of the mainland. Me-dian annual rainfalls are 1587 mm and1293 mm respectively.
As well as the geographical variabilitydescribed above, another significant fea-ture of the climate of New South Wales,along with much of Australia, is its high in-terannual and interdecadal variability. Thisvariability is caused by the interplay ofcontinual changes in the oceans and at-mosphere around Australia and Antarcticaand the associated broad scale climate in-fluences and circulations. The most wellknown of these is the El Niño/La Niñacycle in the Pacific Ocean which alterna-tively can bring (or exacerbate) droughtand wet conditions across inland NewSouth Wales, in particular. On the decadaltime scale this naturally occurring variabil-ity has resulted in extended periods ofcooler, flood-dominated and warmer,drought-dominated conditions over thepast 100 years. The high rainfall of the1950s and 1970s contrasts with the lowrainfall of the 1940s and the most recentextended drought, 2001 to 2008 (seegraph below).
A changing climate
Climate change and its effects have be-come a critical issue for governmentsworldwide. The plants and animals of ourplanet, including humans, are dependenton the specific climates to which they haveadapted. According to the United Nations’Intergovernmental Panel on ClimateChange (IPCC) ‘most of the warming ob-served over the last 50 years is attributableto human activities.’ Anthropogenic, orhuman-induced climate change is rapidlyaltering climate regimes around the globe.The transition to these new climate stateshas the potential to devastate ecosystemsand the human populations that dependon them. The economic and human healthramifications of anthropogenic climatechange have become a focus of much re-search and global discussion.
Over the 100 years of the existence ofthe Bureau of Meteorology, average tem-peratures have steadily increased. Ac-cording to the IPCC, hot days, hot nightsand heatwaves have become more fre-quent around the globe. Additionally,‘eleven of the twelve years in the period1995-2006 rank among the top 12warmest years for the planet in the instru-mental record since 1850’.
The Climate of New South Wales 9R
ainf
all(
mm
)
1900 1910 1920 1930 1940 1950 1960 1970 1980 1990 2000
1000
900
800
700
600
500
400
300
200
100
0
New South Wales annual average rainfall 1900 - 2006.
Dry Period: 1900 – 1946Average rainfall: 477.7 mm
Wet period: 1947 – 2000Average rainfall: 573.9 mm
Dry Period:2001 – 2006Average rainfall:439.5 mm
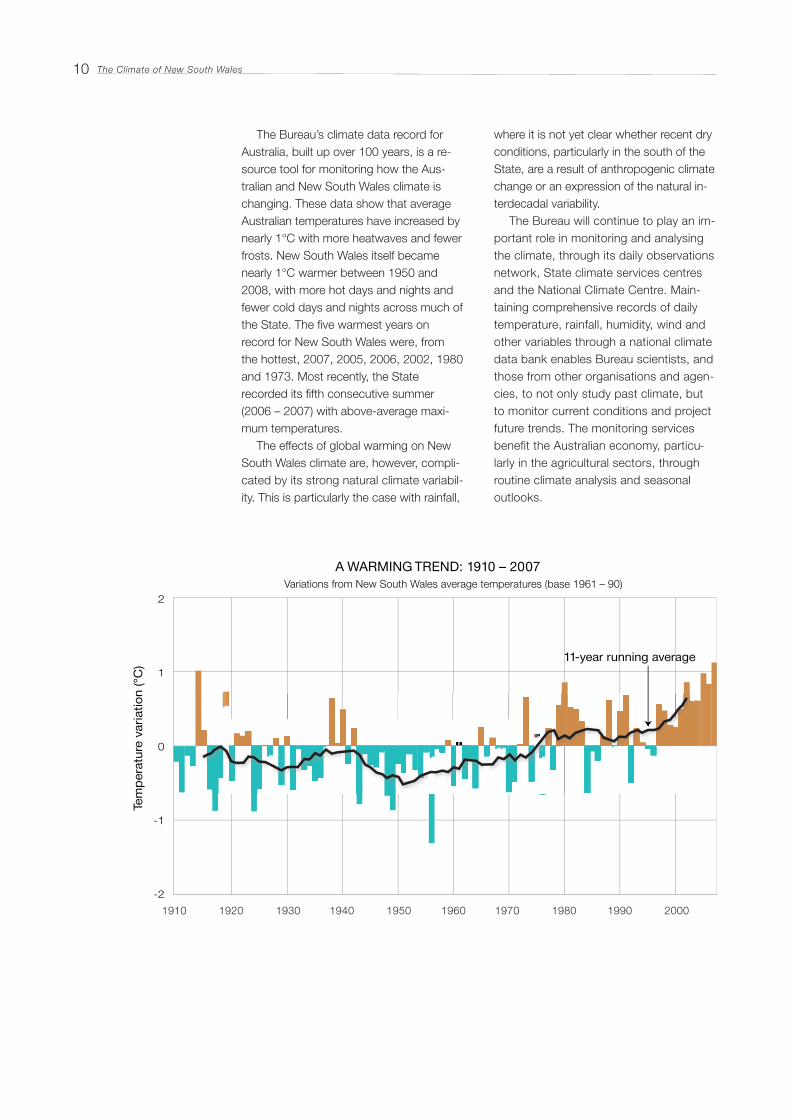
The Bureau’s climate data record forAustralia, built up over 100 years, is a re-source tool for monitoring how the Aus-tralian and New South Wales climate ischanging. These data show that averageAustralian temperatures have increased bynearly 1°C with more heatwaves and fewerfrosts. New South Wales itself becamenearly 1°C warmer between 1950 and2008, with more hot days and nights andfewer cold days and nights across much ofthe State. The five warmest years onrecord for New South Wales were, fromthe hottest, 2007, 2005, 2006, 2002, 1980and 1973. Most recently, the Staterecorded its fifth consecutive summer(2006 – 2007) with above-average maxi-mum temperatures.
The effects of global warming on NewSouth Wales climate are, however, compli-cated by its strong natural climate variabil-ity. This is particularly the case with rainfall,
where it is not yet clear whether recent dryconditions, particularly in the south of theState, are a result of anthropogenic climatechange or an expression of the natural in-terdecadal variability.
The Bureau will continue to play an im-portant role in monitoring and analysingthe climate, through its daily observationsnetwork, State climate services centresand the National Climate Centre. Main-taining comprehensive records of dailytemperature, rainfall, humidity, wind andother variables through a national climatedata bank enables Bureau scientists, andthose from other organisations and agen-cies, to not only study past climate, butto monitor current conditions and projectfuture trends. The monitoring servicesbenefit the Australian economy, particu-larly in the agricultural sectors, throughroutine climate analysis and seasonaloutlooks.
2
1
0
-1
-2
Variations from New South Wales average temperatures (base 1961 – 90)
Tem
per
atur
eva
riat
ion
(°C
)
11-year running average
A WARMING TREND: 1910 – 2007
1910 1920 1930 1940 1950 1960 1970 1980 1990 2000
The Climate of New South Wales10

Precious legacy -our reference climate stations
Of the 100 reference climate stations, 24 are in NewSouth Wales and include Yamba Pilot Station, nearClarence Heads, the longest serving manually oper-ated weather station in New South Wales with mini-mal changes to the site. Francis Freeburn recordedthe first observations on 22 May 1877– clear skiesand smooth seas with a maximum temperature of75°F (24°C) and light westerly winds.
To qualify as a reference climate station, a stationneeds more than 30 years of homogeneous records,where human-influenced environmental changes havebeen and/or are expected to remain at a minimum.Yamba’s site has changed little, although the instru-ments and communication technology have evolved.Francis Freeburn estimated the wind speed, and readthe pressure from a mercury-in-glass barometer;today we have electronic wind and pressure sensors.
Francis and his successors reported observationsto the Bureau by telegram; then came telex (1979), an
electronic terminal (1985) and a laptop computer (1996).The ideal site (which probably does not existanywhere in the world) would offer:
• long period of records with a healthy history;
• few changes in exposure and measurementtechniques;
• instrument sites which have not been moved;
• a small turnover of enthusiastic and diligentobservers;
• location away from urban influences; and
• few changes to the local environment, includingtrees and buildings.
Dave Smith (left), weather observer at Yamba Pilot Stationfor over 26 years, and pilot Alan Jones mark the 126thbirthday of the weather station in 2003.(Photograph courtesy of The Daily Examiner).
While the Sydney Observatory climate record has been compromised by the many changes in thesurrounding buildings, topography, and the heat island effect over 150 years, the Bureau has put intenseeffort into identifying reference climate stations nationwide that provide high quality data for research.
The Climate of New South Wales 11

‘I was there’ makes for powerful meteoro-logical memories: many of us pass ontales of ‘the day when the floods cut offour property…the dust storm blanketedthe city… the giant hailstones hit… thecyclone ruined our holiday… the bushfiresburned a huge area and sent smoke halfway to New Zealand.’ For those on theland, it is often the lingering assault of aparticularly infamous drought.
Significant weather events may costlives, buffet the economy, change insuranceprocedures, or in contemporary language,trigger the revision of risk managementstrategies. For instance, the Queen’s Birth-
day storm of 2007 saw parts of NewSouth Wales declared a natural disasterarea with widespread wind and flooddamage, and almost 20,000 calls to theState Emergency Service.
Communities affected by such naturaldisasters often wonder what makes a cer-tain event ‘significant’. Did they endure oneof the most intense events of its type? Havefrequencies increased, are trends changing?
Add to such familiar ponderings theprojected greater extremes under climatechange scenarios, and our tendency tomake lists and rankings becomes evenmore compelling.
Sydney storm, 2008.Photograph courtesy ofthe Daily Telegraph.
Recording and recalling oursignificant weather
From sport to science, Australians watch keenly to see records broken
A century of storms, fires, flood and drought in New South Wales

Some of the answers are in this snap-shot of New South Wales meteorologicalhistory since the Bureau of Meteorologywas born in 1908. We sought a balanceacross districts and decades, basing thefirst half century on our 1958 publication“50 Years of Weather – New South Wales1908-57”. The subsequent revolutions inweather observing technology and com-munications, and population growth, nat-urally provide much more detail for recentdecades.
If you find some long ago weather taleof your family is ‘lost’, check our refer-ences. We have a comprehensive data-bank of New South Wales weather, muchof it online. You’re invited to further explorethe climate of the State via the internet(www.bom.gov.au) and our publications.
Life’s certainties include death, taxesand wild weather; that’s why the Bureauwas created as a scientific shield to helpprotect Australians and their property frommeteorological impacts.
The 76,000 tonne coal carrierPasha Bulker grounded onNobbys Beach at Newcastleduring an East Coast Low on8 June 2007.Photograph courtesy of PeterStoop of the Newcastle Herald..
Recording and recalling our significant weather 13

Features of New South Wales Weather
Hailstones from the Sydneyhail storm of 14 April 1999,compared with a sevencentimetre diameter cricketball.
Recording and recalling our significant weather14
Each year on average, several people dieand damage worth more than $100 millionis caused as a result of more than 100 se-vere storms across New South Wales andthe Australian Capital Territory.
Severe thunderstorms are defined asthose producing:
• hail 2 cm or larger in diameter
• wind gusts of 90 km/h or stronger
• a tornado; or
• intense rainfall resulting in flashflooding.
For the catastrophic severe thunderstormslisted below, these criteria are far exceededwith maximum hail sizes commonly reach-ing 7 cm, measured wind gusts up to 153km/h, numerous tornadoes and sometimes
deaths. Severe thunderstorms can occurin any month but are much more frequentfrom late spring through to mid-summer.More than 70 per cent of the followingstorms occurred during this peak period,with nearly one-third in January alone.
Many of the events described here arefrom Sydney primarily because it is a largeand densely-populated area with long anddetailed records. It is fair to say that manyother areas of New South Wales, particu-larly about the coast and ranges north ofSydney, are equally if not more at risk fromthese destructive phenomena. Any dam-age estimates listed were made at thetime of the storm. In many cases the costof earlier events would easily exceed $25-50 million in current values.
Severe thunderstorms

Lightning strike nearCanberra, ACT, on 16 January2003, two days before the firestorm that destroyed 400homes and claimed four livesin the nation's capital city.Photograph courtesy ofChris Arndt.
Recording and recalling our significant weather 15
1914 On 25 November 1914, a severe thunderstorm, possibly accompanied by a tor-nado, struck Sydney’s northern and harbour-side suburbs. The storm torethrough a row of shops opposite Lindfield railway station before moving overMiddle Head to Watsons Bay where winds lifted a 16’ (5 metre) skiff 50’(15 metres) into the air.
1919 In Sydney city an exceptionally heavy fall of hail just after midnight on 25 October1919 caused great damage to buildings when the hail blocked gutters and drainsallowing heavy rainfall to overflow into ceilings and basements.
1931 On the morning of 6 July 1931, a heavy hailstorm caused £200,000 ($400,000)worth of damage in Sydney city and suburbs. The Manly ferry service was tem-porarily suspended, following the onset of southerly gales.
1937 One of the more disastrous storms in Sydney’s history occurred on the afternoonof 25 January 1937 when a tornadic thunderstorm tore through suburbs includingMarrickville, Mascot, Botany and Matraville. Five people died and many morewere injured as buildings collapsed and heavy rain generated flash floods.
1940 On the afternoon of 31 October 1940, a tornado carved a narrow damage path12 miles (19km) long through thousands of Sydney houses, resulting in twodeaths. A well-developed waterspout was seen as the storm moved out to sea.Sydney city recorded a wind gust of 153 km/h as the storm passed overhead.
1941 A tornado swept through Orange on 8 June 1941. It was said to be the fierceststorm ever known in the district up to that time.

Recording and recalling our significant weather16
1947 On 1 January 1947, a violent thunderstorm pounded Sydney city and the easternsuburbs with hailstones larger than cricket balls (7 cm) causing widespreaddamage to tiled roofs and cars. Hundreds of people were injured by flying glassand the damage bill reached hundreds of thousands of pounds.
1957 A tornadic squall at Warriewood and Narrabeen caused more than £40,000($80,000) worth of damage on 9 July 1957. The tornado moved inland from thesea for about 3 miles (5 km), un-roofing houses.
1967 On 28 January 1967, thunderstorms left a trail of damage 100 km long throughthe New South Wales Riverina towns of Finley and Tocumwal and into Victoria.Severe winds, hail as large as tennis balls and possibly several small and transienttornadoes uprooted trees and damaged buildings.
1970 On 1 January 1970, a massive tornado, ‘probably more intense than any otherdocumented in Australian literature’ at that time, carved a damage path 22 kmlong and up to 1.6 km wide through the Bulahdelah State Forest. Over onemillion marketable trees were damaged or destroyed by the tornado and cricketball-sized hail.
1971 On 26 January 1971, torrential rainfall from a thunderstorm over southern Canberracaused severe flash flooding in stormwater channels adjacent to roads in the WodenValley. Seven people died when their cars were swept into the flood waters. Rainfallsof up to 100 mm in one hour were recorded. Damage was around $9 m.
A long-lived complex of thunderstorms brought widespread hail to Sydney on 21August 1971, with the heaviest falls from Ashfield to Bondi. While the largest hailwas generally only up to 2 cm diameter, it accumulated to depths of around 10-15cm over flat ground and in drifts more than one metre high in some streets.
1975 Flash flooding from thunderstorms resulted in $15 m worth of damage in the Gosford,Sydney and Illawarra regions during 10-11 March 1975. Sydney airport recorded174.7 mm in the six hours to 3 pm on 10 March, and Mt Kiera in the Illawarrareceived 591 mm in a 30-hour period.
Violent hailstorm at Rose Bay,Sydney Harbour, New Year's Day1947. Photograph courtesy of the
Sydney Morning Herald.

Recording and recalling our significant weather 17
Mounds of hail entrench carsand taxis after a passing stormin Rushcutters Bay, 21 August1971. Photograph courtesy ofAustralian Consolidated Press.
1976 A series of severe thunderstorms on 10 November 1976 caused considerabledamage in western and southern Sydney with tennis-ball size (6 cm) hail andwind damage reported around Lidcombe/Auburn. Damage reached $40 m,with 10 people injured.
1978 Severe thunderstorms struck between Newcastle and Wollongong on 10-11 Feb-ruary 1978, causing extensive damage to buildings and eight injuries. Wind gustsreached 141 km/h at Newcastle and a tornado damaged many homes in theDrummoyne / Hunters Hill area of Sydney. The total damage bill was $15 m.
On 1 March 1978, severe thunderstorms on the north coast injured two people,left 15 homeless and caused damage estimated at approximately $5 m.
1984 Late in the evening of 8 November 1984, torrential rainfall from thunderstormscaused flash flooding and $80 m in damage to homes and vehicles in Sydney cityand the eastern suburbs. Observatory Hill in Sydney city recorded its highest-everhourly rainfall of 120.3 mm between 10 and 11 pm.
1986 On 22 January 1986, a severe hailstorm in the Orange district caused extensivedamage to homes and vehicles and destroyed much of the apple crop at a costof $25 m.
On 3 October 1986, hail up to 6 cm diameter injured at least 10 people andcaused $104 m damage to hundreds of homes in Sydney’s western suburbs, in-cluding Hurstville and Rockdale.
1990 On the afternoon of Sunday 18 March 1990 a violent thunderstorm with hailstonesup to 9cm diameter battered western Sydney suburbs, with Auburn and Bankstownreceiving the most serious damage. Three people were reported injured and thedamage bill was over $319 m.
1991 A severe thunderstorm accompanied by destructive winds estimated at 230 km/h,7cm diameter hail and flash flooding caused over $138 m damage to northernSydney suburbs on the afternoon of 21 January 1991. The ferocious stormclaimed one life and damaged more than 10,000 houses and 50,000 trees.
1992 On 12 February 1992, severe thunderstorms left a trail of damage throughSydney’s western and north-western suburbs, the central coast and as far north

Recording and recalling our significant weather18
as Williamtown in the Hunter district. They brought hail up to 7.5 cm diameter, flashflooding, severe winds and possibly a tornado. Damage was estimated at $118 m.
1994 A severe storm caused $29 m damage in the Sydney metropolitan area on 20November 1994, with many trees brought down and houses damaged, particularlynorth of the harbour. Property damage was also reported from inland areas includingNarromine and Dubbo where wind gusts reached up to 140 km/h.
1995 A tornado in the Merimbula and Pambula areas on 16 April 1995 injured 34 peopleand damaged or destroyed more than 100 homes along with vehicles and otherbuildings. Damage estimates exceeded $25 m.
1996 There were widespread reports of severe thunderstorms across New SouthWales on 29 September 1996, with large hail, destructive winds and at least threetornadoes. The worst impact was in Armidale where hail up to 8 cm diameter and156 km/h wind gusts caused $104 m damage to thousands of homes, public build-ings and vehicles.
During the evening of 23 November 1996, a band of near-stationary thunder-storms brought torrential rain to the Coffs Harbour Creek catchment with rainfallup to 400 mm recorded in just 4.5 hours. One person drowned as a flash floodcombined with a high tide flooded most businesses in the town centre. The totaldamage bill reached $20 m.
On 11 December 1996, Singleton in the Hunter Valley was declared a natural disasterarea after a thunderstorm with 7 cm diameter hail damaged roofing on more than1000 houses and buildings at a cost of $49 m. Severe thunderstorms were reportedfrom many other areas of the State including Springwood, Bundanoon and Kyogle.
1997 Severe thunderstorms were widespread over much of the Central and NorthernTablelands and Sydney metropolitan area with hail up to 5cm diameter, severewinds and flash flooding reported. The damage in Sydney alone reached $40 m.
The base of a tornadic thunderstormat Coonabarabran, New South Wales,20 January 2005. Photographcourtesy of Vivian Evans.

Recording and recalling our significant weather 19
1998 A severe thunderstorm with destructive winds and golfball-sized hail struck thewestern New South Wales town of Nyngan about 3:15 pm on 5 January 1998.Three houses were destroyed, 18 wholly unroofed and many other houses, busi-nesses and public buildings were damaged. The damage estimate was $12 m.
1999 The most damaging Australian thunderstorm to date, with a cost of $1.7 billion,savaged Sydney’s eastern suburbs and parts of the city on the evening of 14 April1999. Hail of at least 9 cm diameter damaged 22,000 homes and 63,000 carsand injured many people. A man died when struck by lightning.
2001 Winds up to 130 km/h, large hailstones and flash flooding caused extensivedamage in Dubbo on 6 January 2001. About 400 buildings and 150 motor vehi-cles were damaged and hundreds of trees uprooted in what locals described as'the worst storm in living memory'. Dubbo was declared a natural disaster areawith a total damage bill exceeding $25 m.
On 17 January 2001, hail up to 7cm diameter, high winds and flash floodingdevastated Casino in northeast New South Wales, damaging 800 homes and300 motor vehicles at a cost of $35m. Severe thunderstorms hit many othertowns in northern New South Wales, including Grafton where wind gusts weremeasured at 135 km/h.
On 3 December 2001, a thunderstorm at Richmond produced the highest windgust ever recorded on mainland New South Wales – 174 km/h. Later that after-noon two schoolchildren died when a tree fell on their tent in the northern suburbs.
2005 Broken Hill was declared a natural disaster area after a severe thunderstormcaused extensive damage at 9 pm on 6 November 2005. Around 20 houses wereunroofed, another 20 partially unroofed and powerlines brought down. Two peoplewere rescued from a car trapped in floodwaters. The damage bill was $3.8 m.
A severe thunderstorm with heavy rain and strong winds, and possibly a tornado,caused widespread damage to more than 50 suburbs in Canberra on 2 December2005. The storm brought down hundreds of trees and power lines, unroofedbuildings and resulted in one death. The total damage bill was $15 m.
2006 On 31 December 2006, a severe late afternoon thunderstorm brought exceptionallyheavy rainfall, wind damage and deep drifts of hail to Canberra’s southern suburbs.Lake Tuggeranong was clogged with debris and livestock in rural areas was lost.
Monthly distribution of severe thunderstorms 1989 –2008
Ave
rage
per
mon
th
25
20
15
10
5
0Jul Aug Sep Oct Nov Dec Jan Feb Mar Apr May Jun
Frequency distribution ofreported severe storms inNew South Wales. Thepreference for the latespring–summer period isshared with many other partsof Australia.

Recording and recalling our significant weather20
2007 On 27 February, the Civic Centre and the Australian National University in Canberrawere blanketed in hail at least 20 cm deep. Many vehicles were damaged andmore than 1100 homes and buildings were flooded due to blocked drains andgutters. On 10 February, very heavy rain caused flooding and damage to housesin Weston Creek and Kambah.
On 8 October 2007, Lismore was declared a natural disaster area after a severethunderstorm with 7 cm diameter hail and high winds caused $59 m worth ofdamage and injured more than 17 people. Another severe hailstorm hit SouthLismore the following day and on 26 October a tornado damaged the nearby townof Dunoon.
On 9 December 2007 a severe thunderstorm devastated western and north-western Sydney with hail up to 7 cm diameter. The State Emergency Service re-ceived over 6000 calls for assistance and Blacktown, Baulkham Hills, Hornsby andPenrith were declared natural disaster areas. The damage bill reached $201 m.
Radar imagery of the 9 December2007 hailstorm at its peak whengiant hail was being produced.A vertical slice through the stormshows the high reflectivity extendedto a height of over 12 kilometres.
Warning graphic showing the forecastpath of the thunderstorm thatproduced giant hail in Blacktownand parts of western Sydney on9 December 2007. This detailedwarning was issued 30 minutes priorto any reports of hail being received.

Recording and recalling our significant weather 21
Maitland flooded, 1955.Photograph courtesy of theMaitland Mercury.
1910s Northwest New South Wales suffered destructive floods in 1910, with numerousplaces experiencing their highest river heights on record up until that time. In1917, the Murray River and its tributaries were at their highest for 28 years.
1920s In the 1920s numerous locations recorded their highest-ever floods up until thatdate, including Coonamble on the Castlereagh River in 1920, Cooma in 1922,Queanbeyan on the Molonglo River in 1925 and Ungarie on the Lachlan River in1928. In 1929 flood waters in Taree reached 18 inches (557 mm) above therecord set 63 years before.
1930s The most dramatic floods during the 1930s occurred between 1930-34. In 1931Adelong recorded its ‘most serious flood for 50 years’ and in 1934 Bombalaexperienced its ‘highest flood on record’ up until that time.
1940s Significant floods were recorded in Tamworth in 1941, and in other parts of thenorthwest and the coast in 1945 and 1946. In 1949, most buildings in centralKempsey were washed away by the largest recorded flood up until that time onthe Macleay River. There were six deaths and damage was estimated at $200 m.
1954 In February 1954, torrential rainfall from a category 3 severe tropical cycloneproduced disastrous floods in Lismore, Murwillumbah and Casino. Thirty peopledied. (See also Tropical Cyclone impacts, page 27).
1955 The Hunter, Gwydir, Namoi, Macquarie and Castlereagh catchments reportedrecord flood levels in February 1955, and there was major flooding in the Macintyreand Darling. Twenty-five people died and destruction exceeded $700 m.
1956 In 1956, floodwaters from the Darling and Murray rivers peaked simultaneously,
Floods
Floods have provided dramatic evidenceof Australia’s climate variability since recordsbegan. In New South Wales, floods areoften associated with East Coast Lows, orin some cases, tropical cyclones. Othercauses include weather systems (inlandtroughs) that bring tropical moisture from
the north, cold fronts and thunderstorms.Thunderstorms often generate flash floodswith little time between the rainfall and theensuing flood. Listed below are some ofthe State’s most dramatic floods. Any costestimates were made at the time of theevent.

Recording and recalling our significant weather22
forcing urgent construction of a levee around Wentworth near the junction of thetwo mighty rivers. This was the biggest flood on the Murray River since 1870, withsome areas flooded up to 100 km from the natural flow of the river.
1971 On 26 January 1971, torrential rainfall from a thunderstorm over southern Canberracaused severe flash flooding in stormwater channels in the Woden Valley. Sevenpeople died when their cars were swept into the flood waters. Rainfalls of up to100mm in one hour were recorded and damage was estimated at around $9 m.
1974 In March 1974, category 2 tropical cyclone Zoe produced major flooding in northernNew South Wales where 200 people were evacuated from Murwillumbah and 500families evacuated from Lismore. Landslides cut the main railway line in four placesbetween Casino and Coffs Harbour. (See also Tropical Cyclone section, see page 28).
On 24 April 1974, severe flash flooding in Sydney's western suburbs and the BlueMountains resulted in $20 m worth of damage and one death following about 200mm of rain in three days.
1984 On 18 February 1984, intense rainfall with totals exceeding 800 mm in 24 hoursfell on the escarpment west of Wollongong, causing severe erosion and flashflooding. Six hundred people were evacuated from Dapto as the surging watersoverturned cars and damaged houses in Dapto. Remarkably, nobody died.
1986 An East Coast Low passing close to Sydney on 6 August 1986 brought the city’shighest 24-hour rainfall to date – 327.6 mm. There was serious flash flooding andtraffic chaos in western Sydney with the final damage bill exceeding $35 m. TheGeorges River reached major flood level and the Hawkesbury River peaked at11.3 metres at Windsor Bridge.
1990 In April 1990 a record flood in Nyngan breached levee banks, causing damageestimated at $65 m. The population was evacuated by helicopter. Major floodingalso occurred along the Castlereagh, Lachlan, Macquarie, Darling, Paroo, Warregoand Namoi Rivers.
1996 During the evening of 23 November 1996, a band of near-stationary thunderstormsbrought torrential rain to the Coffs Harbour Creek catchment with up to 400 mmrainfall recorded in just 4.5 hours. One person drowned as a flash flood combinedwith a high tide flooded most businesses in the town centre. Damage reached $20 m.
Maitland's levee banks hold nearthe Belmore Bridge, June 2007.Photograph courtesy of the
Maitland Mercury.

Recording and recalling our significant weather 23
Flood Warnings
The frequency and severity of floods in the 1940s and 1950s inspired the establishment of FloodWarning Networks across Australia. In New South Wales, the Bureau of Meteorology combines withthe State Emergency Service to provide timely warnings, reducing the threat to life and property.
New South Wales now has flood warning networks and floodwarning methodologies for 33 major river valleys, providingflood forecasts to 163 places, and flash flood forecasts to 12locations.
Data come from approximately 830 automated river-gauges and 640 automated rain-gauges. They are trans-mitted to the Bureau both in real time (radio or mobile phonesystems) and on request (telephone telemetry).
The New South Wales Flood Warning Consultative
Committee coordinates cooperative funding by the FederalGovernment (rain-gauges) and State and local govern-ments (river-gauges). The continuing improvement of theflood warning networks has brought significant improve-ments in the forecasts of the time of arrival and height offloods. For instance, the percentage of river height fore-casts accurate to within 0.3 metres has risen from ap-proximately 40 per cent in the early 1980s to 80 per centtoday.
Testing the radio signal from an automatic rain-gauge atNundle, near the head of the Peel River.
Maintenance on an automatic river height gauge onWilsons River near Lismore.
1998 On 17 August 1998, flash floods and resultant landslides cut all major roads andtrain lines into Wollongong. Two people died and damage to suburban homesexceeded $40 m. Some 24-hour rainfall totals in the area included 445 mm atMt Ousley, 410 mm at Bulli Pass and 337 mm at Keiraville.
2001 In the late summer an East Coast Low brought serious flooding to northeast NewSouth Wales. Floodwaters up to half a metre deep engulfed buildings in Lismoreand natural disaster areas were declared in Lismore, Kyogle and Bellingen. In a sep-arate event, Moree was marooned when rainfall up to 300 mm cut roads. Damageexceeded $100 m and one person was believed to have drowned north of Lismore.
2007 The worst flooding in the Hunter Valley since 1971 came during an East CoastLow in June which set many new long-term rainfall records. Nine people died in theHunter River and Newcastle area. There were nearly 20,000 calls to the StateEmergency Service, and more than 4000 people were evacuated from Mait-land. Damage exceeded $1.4 billion. (See also East Coast Low section).

Recording and recalling our significant weather24
1926/27 Eight people died and more than two million hectares were burnt along theNorth Coast of New South Wales and in Canberra, Albury, Dubbo and Griffith.
1938/39 Thirteen people died and many houses and plantations were lost as fires ragedthrough the Blue Mountains, Dubbo and the Snowy Mountains. There weresignificant fires in the Australian Capital Territory, where a huge fire front sweptthrough Mt Franklin, Uriarra, Tidbinbilla, Cuppacumbalong and Lanyon.
1951/52 There were 11 reported deaths when around 5000 fires burned out 4.5 millionhectares of western New South Wales. In November, 371,000 hectares of cypresspine and timbered land were burned in the Pilliga area, and 266,000 hectaresof grass-land burnt in the Dubbo /Forbes district. In January, 330,000 hectareswere burned out at Mangoplah near Wagga Wagga. Two people died and10,000 hectares were burnt in the ACT.
1957/58 In December 1957 gale-force winds drove fires through Leura and WentworthFalls in the Blue Mountains, burning more than 200,000 hectares. There werefive deaths and around 160 buildings were destroyed.
1968/69 Some 1.2 million hectares were burned, chiefly between 18-20 November inthe North Coast district, and between 28-29 November in the Blue Mountains,where five people died and 150 homes were destroyed in Blaxland, Springwoodand Falconbridge.
1974/75 Bushfires were widespread across Australia, and New South Wales sufferedmost. In the western districts, three people died at Balranald, and lossesincluded 5 million hectares of grassland, more than 10,000 km of fencing and50,000 stock.
1984/85 This was the worst fire season in 10 years for the grassed western areas.Lightning strikes started over 100 fires on Christmas Day alone. The largestsingle fire was near Cobar in mid-January, with 516,000 hectacres burned. Thetoll from 6000 fires included five deaths, 3.5 million hectares burned, 40,000stock losses and damage around $40 m.
1993/94 From December 1993 through January 1994 more than 800 bushfires burnedalong the eastern seaboard from the Queensland border to the Hunter Valley,Blue Mountains, Sydney suburbs and as far south as Batemans Bay. In theSydney suburbs of Janali and West Como, many homes were destroyedand four people died. Overall, 225 buildings were lost, another 150 homesdamaged and more than 800,000 hectares of bushland burnt.
Bushfires
Bushfires have had devastating impactson New South Wales communities. On av-erage a major fire involving loss of life andproperty occurs every 10 years or so. Boththe grassed western areas and the forestsalong and east of the Great DividingRange have endured major fires. Thebushfire season typically starts in earlyspring in northern areas, and spreads to
the remainder of the State by late springinto early summer. The worst fires in theforest areas typically follow droughts, oc-curring late in the year or early in the NewYear when unseasonal westerly windsbring very hot, dry air from the interior.Later in the summer and autumn, the firerisk eases with the coming of cooler,moister easterly winds.

Recording and recalling our significant weather 25
Smoke from New SouthWales bushfires being blownover the Tasman Sea, 1 Janu-ary 2002 (Bureau of Meteorol-ogy enhancement of imagefrom a National Oceanic andAtmospheric Administrationpolar-orbiting satellite).
Fires rage through the RoyalNational Park near Bundeenaduring the January 1994 firesin eastern New South Wales.Photograph courtesy ofthe Sydney Daily Telegraph,News Ltd.
1997/1998 More than 250 fires burned between late November 1997 and late February1998 in difficult and sparsely populated terrain in the Pilliga, Hawkesbury,Hunter, Blue Mountains, Central Coast and Shoalhaven areas. At least threepeople died. More than 500,000 hectares were burnt and at least 10 houseswere lost in Menai in southern Sydney on 2 December.
2001/02 The majority of more than 450 bushfires were in the Greater Sydney, Hunter,North Coast, mid-north coast, Northern Tablelands and Central Tablelandsareas. Many were started by lightning over the Great Dividing Range. Lossesincluded 750,000 hectares burnt out, 109 houses and 6000 cattle.
2002/03 The frequency of extreme fire weather days was unprecedented, running fromearly spring 2002 to late summer 2003. Three people died in New South Walesand almost 1.5 million hectares were burned. Catastrophic fires burned into thesouthern suburbs of Canberra on 18 January claiming four lives, causing 450injuries and destroying 488 houses. Damage exceeded $350 m.

Recording and recalling our significant weather26
1911 Tropical cyclone No.1B made landfall in the Gulf of Carpentaria on 5 January1911. It moved south over inland Queensland and New South Wales as an intenselow-pressure system before crossing out to sea again near Wollongong around14 January. Wind gusts of 74 knots (137 km/h) were recorded in Sydney.
1928 A category 1 tropical cyclone, No.50, made landfall south of Brisbane on14 February 1928 and then moved inland north of the New South Wales border.There was severe wind damage to houses, buildings and trees in many areas ofnorthern New South Wales including the Tweed Valley, Murwillumbah, Mullumbimby,Byron Bay, Kingscliff, Bangalow and Casino. South Grafton was flooded and atGlen Innes there was immense damage to crops from wind and rain.
1934 Tropical cyclone No.69 made landfall in the Gulf of Carpentaria then moved inlandover Queensland and New South Wales to Coffs Harbour on 2 February. This very
Tropical cyclones have affected NewSouth Wales in various ways over the lastcentury with five making direct landfall onits coast. Five others have made landfall inQueensland, usually in the Gulf of Carpen-taria, before moving southwards over landinto New South Wales as severe low-pres-sure systems and then crossing back outto sea across the coast. Several othershave moved close to the New SouthWales coast without making landfall and
many more have remained well offshorebut caused significant waves on itsbeaches. Tropical cyclones are charac-terised by their peak wind gusts (see tablebelow). During the Bureau’s first century,two Category 3 cyclones hit New SouthWales. The Bureau initially numbered trop-ical cyclones, then formally named themfrom 1964. Following are significant tropi-cal cyclone impacts on New South Walesover the past 100 years.
Category Strongest gust Typical effects
1 Less than 125 km/h Gales. Minimal house damage. Damageto some crops, trees and caravans.Boats may drag moorings.
2 125 - 164 km/h Destructive winds. Minor house damage.Significant damage to signs, trees andcaravans. Heavy damage to some crops.Risk of power failure. Small boats maybreak moorings.
3 165 - 224 km/h Very destructive winds. Some roof andstructural damage. Some caravansdestroyed. Power failure likely.
4 225 - 279 km/h Very destructive winds. Significantroofing and structural damage. Manycaravans destroyed and blown away.Dangerous airborne debris. Widespreadpower failures.
5 More than 280 km/h Extremely destructive winds.
Tropical cyclones

Recording and recalling our significant weather 27
severe coastal storm brought flooding rains to the New South Wales coast.A heavy swell with 12 metre waves was reported at Bondi beach, Sydney.
1938 Tropical cyclone No.77 made landfall at Bundaberg in Queensland as a category1 system on 19 January before moving southwards into New South Wales andcrossing to the sea near Yamba on 22 January. Waves broke as far as 1.6 km offTweed Heads and flood water was up to three metres deep in the main street ofKyogle. One person drowned.
1939 A category 1 tropical cyclone, No.80, moved southwards from the Coral Seatouching the coast at Cape Byron on 5-6 March. Shipping was disrupted andgales extended possibly as far as the New South Wales south coast.
1950 Tropical cyclone No.119 made landfall in the Gulf of Carpentaria on 16 Januarythen moved south over Queensland and into New South Wales on 18-19 January.Sydney recorded its second-lowest barometric pressure of 988 hPa when theremains of the cyclone crossed out to sea. Ten lives were lost, mostly throughdrowning in swollen rivers, and seven yachts were wrecked in Sydney Harbour.
1954 Category 3 severe tropical cyclone No.137 made landfall on the Gold Coast on 20February then moved south over the New South Wales Northern Rivers during thenext 24 hours. Torrential rainfall produced disastrous floods in Lismore, Murwillum-bah and Casino and high winds destroyed houses and twisted large trees out ofthe ground. Thirty people died. The sea broke through and flooded parts of ByronBay, where the outer section of the town jetty was swept away, taking all 22vessels of the fishing fleet.
1959 Tropical cyclone Beatrice moved across the Coral Sea from New Caledonia,crossing the coast at Cape Byron on 21 January as a Category 2 system witha central pressure of 986 hPa. Beatrice damaged infrastructure along the northcoast and eroded beaches.

Recording and recalling our significant weather28
1964 Category 2 tropical cyclone Audrey made landfall in the Gulf of Carpentaria on11 January then tracked across Queensland and Northern New South Wales toCoffs Harbour on 14 January. There was extensive flooding and stock losses andbuildings were badly damaged in many areas including Glen Innes and Grafton.Every building at Boggabilla was partially or completely unroofed.
1967 Category 3 tropical cyclone Dinah made landfall at Fraser island in Queensland on29 January. Although it re-curved out to sea, it still brought a large storm surge tothe Tweed River, isolating Fingal. Around Brunswick Heads several banana planta-tions were wiped out, and hundreds of hectares of sugar cane in the Tweed Valleywere blown over.
1974 Tropical cyclone Pam passed around 500 km east of Brisbane and the northernNew South Wales coast in February bringing powerful waves, record high tidesand a storm surge to the east coast. Palm Beach residents abandoned theirproperties as seawater drove over the top of 6.2 m boulder walls and surgedthrough their premises.
Category 2 tropical cyclone Zoe made landfall at Coolangatta/Tweed Heads on13 March, then re-curved into the Tasman Sea. It produced major flooding innorthern New South Wales where 200 people were evacuated from Murwillumbahand 500 families were evacuated from Lismore. Landslides cut the main railwayline in four places between Casino and Coffs Harbour.
1990 Tropical cyclone Nancy (satellite image shown below) crossed the New SouthWales coast at Cape Byron on 3 February as a category 2 system, bringing heavyrain and flooding as far south as Sydney. Five people drowned, and damage inQueensland and New South Wales reached $36 m.

Recording and recalling our significant weather 29
Some of Australia’s worst maritime disas-ters are caused by the destructive winds,torrential rainfall and rough seas of EastCoast Lows, very intense low-pressuresystems characteristic of the easterncoastline of Australia. The tragediesinclude the Dunbar in 1857 (21 lives lost),the Sumatra in 1923 (46 deaths) and thesix lives lost in the 1998 Sydney-Hobartyacht race.
Although they are meteorologically dis-tinct from tropical cyclones, East CoastLows bring similar weather effects includ-ing coastal erosion and inundation. Gener-
ally short-lived, lasting for several days atmost, they will often intensify rapidlyovernight within a pre-existing trough oflow pressure, or in the wake of a cold frontmoving into the Tasman Sea. They canoccur at any time but are most commonduring autumn and winter months with acluster of significant events often occurringover a period of several weeks. Fifty-sixper cent of the major events listed belowoccurred during July. These are the EastCoast Lows which caused significantdamage and/or deaths during theBureau’s first century.
1912 On 14 July 1912 an East Coast Low deepened offshore from Newcastle, haltingshipping and ferry traffic. There was exceptional beach erosion, even insideSydney Harbour where erosion washaways of three metres were noted. Wavesreportedly lifted a 235-ton boulder onto Bondi beach.
1917 A very severe East Coast Low moved south parallel to the New South Wales coastfrom 18-20 September 1917. The Nerong foundered 2 km off Norah Head on 19September in gale-force winds, with the loss of three lives. “Much damage” wasreported in Sydney and Newcastle.
1921 There were two significant East Coast Lows in the winter of 1921. The first, from25-26 June, resulted in 26 lives lost when the steamers Fitzroy and Our Jackfoundered off Cape Hawke near Forster in gales and heavy seas. Between 22-24July, an intense low pressure system brought gales to the New South Walescoast, damaging the Manly ferries and disrupting shipping.
Winds from an East CoastLow flattened this sugarcane at Condong on 3 May1996. Photograph courtesyof Tweed River RegionalMuseum.
East Coast Lows

Recording and recalling our significant weather30
1923 During late June 1923, an East Coast Low developed rapidly on the Mid-NorthCoast. On June 26, the SS Sumatra was lost with 46 lives between CrescentHead and Port Macquarie in “fresh to strong south to south east gales” while onSydney harbour, passengers were injured when the Manly ferry Burraba nearlysank in fierce squalls.
1927 An intense East Coast Low developed off Port Macquarie between 18-19 April1927, causing “great damage” further south in Sydney. There were “terrificgales” with a launch lost on Botany Bay and the SS Riverina driven ashore nearGabo Island.
1935 An East Coast Low damaged all areas of the central and southern coast, includingSydney and Newcastle, between 18-20 June 1935. Five people drowned in smallship sinkings, and very high tides and huge seas demolished the surf life savingpavilion at Coogee beach.
1937 A very severe East Coast Low, said to be the ‘worst since 1927’, tracked south-wards along the New South Wales coast between 19-23 June 1937. It reached acentral pressure of 995 hpa and caused severe delays to shipping.
1945 Between 10-13 June 1945, the Northern Rivers experienced flooding rains andsignificant erosion on the foreshore as a deep East Coast Low moved slowlysouthwards along the New South Wales coast. The steamer Coweambah waslost off Southwest Rocks, with at least one death.
1950 A series of East Coast Lows developed off the New South Wales coast in June1950, a month which saw Sydney register a record monthly rainfall of 642.7 mm.The Macleay River flooded disastrously and the heavily-flooded Clarence Rivercarved a new path to the sea. At least five people drowned in floods during themonth and the Navy motorship Fairwind was lost with a crew of 17 during astorm that raged between 23-26 June.
1966 An intense East Coast Low off the New South Wales south coast brought galesand rough seas in May 1966. During the early hours of 21 May the dredge WDAtlas foundered with the loss of 13 lives. Helicopters despatched from the RANair station HMAS Albatross rescued four survivors.
Erosion from East Coast Lows at OldBar near Taree on the NSW mid-northcoast, winter 2008. The houses weresubsequently demolished as hazards.Photograph courtesy of Phil Watson,NSW Department of Environmentand Climate Change.

Recording and recalling our significant weather 31
1974 A major East Coast Low which caused widespread damage to the coastlinebetween Seal Rocks and Wollongong on 27 May is known as the Sygna Stormfrom the grounding of a 30,503 tonne coal ship of that name on Stockton Beach.Nobby’s Signal at Newcastle recorded a wind gust of 165 km/h, equivalent instrength to a category 3 severe tropical cyclone, and phenomenal waves over-topped sand dunes 5-6 metres above sea level. Six people died.
1986 An East Coast Low passing close to Sydney on 6 August 1986 brought the city’shighest 24-hour rainfall to date, 327.6 mm. There was serious flash flooding andtraffic chaos in western Sydney with the final damage bill exceeding $35 m. TheHawkesbury River reached moderate flood level, peaking at 11.3 metres atWindsor Bridge.
1996 An East Cost Low between 30-31 August 1996 caused almost $20m damage andcost two lives. The highest rainfall total was 386 mm at Darkes Forest in theIllawarra. Wind gusts peaked at 119 km/h near Wollongong.
1998 On 23 June 1998 an East Coast Low caused more than $12 m in damage andbrought significant disruption to the Hunter and Northern Tablelands. Boats wereblown from their moorings and washed ashore between Port Stephens and LakeMacquarie, and heavy snowfalls blocked roads in the Barrington Tops nearGloucester. A peak wind gust of 152 km/h was recorded at Nobby’s Signal atNewcastle.
2005 Between 1-2 February 2005, an intense East Coast Low brought widespread severeweather conditions to southeast Australia. There were numerous reports of 3-6cmdiameter hail across Sydney and the Blue Mountains, flash flooding in Bexley androofs were blown off buildings in Gladesville. The damage in New South Wales,Victoria and Tasmania reached $216.7 m.
2007 Five East Coast Lows occurred during June 2007—a rare, if not unprecedentedsequence. The first (8-9 June), known as the Queen’s Birthday Storm, had themost impact, resulting in nine deaths and widespread damage along the Hunter,central coast and Sydney coastlines associated with sustained heavy rain, flooding,strong winds and large ocean waves and swell. The coal carrier Pasha Bulker(76,741 tonnes) ran aground at Nobby’s Beach in Newcastle.
East Coast Low image fromthe Japanese geostationarymeteorological satellite MTSATat 9.30 am Eastern StandardTIme on 27 June 2007.

Recording and recalling our significant weather32
1914-15 Northern Victoria and New South Wales were in severe drought for the 10-12months up to June-July 1915.
1918-20 The 1918-20 drought was one of the major droughts in New South Waleshistory. The wheat yield dropped to a disastrous 4 million bushels in 1919 andsheep numbers dwindled from 42 m to 33 m.
1939-45 Drought was generally endemic in North South Wales from 1939 to August1945. During one severe period in 1944, numerous districts recorded theirlowest rainfall on record up until that time and the wheat yield totalled only 17million bushels. By December, the Hunter River had ceased to flow alongmost of its course and by January 1945 the Hawkesbury River was dry at NorthRichmond.
In December, Sydney reported a series of severe dust storms.
1957 There was a prolonged period of drought around Australia between 1957-68.In New South Wales in 1957, many inland districts reported their lowest twelvemonths of rain on record up until that time, and in scores of other areas 1957rainfall figures were only slightly above those recorded during the 1901-02,1918-20 and 1944 droughts. The wheat yield fell dramatically to around 4-5million bushels compared with 50 million bushels in other years. Devastatingbushfires swept through the Blue Mountains in December 1957.
1967-68 New South Wales was again in severe drought for the 14-15 months to May 1968.
1972-73 Western and central New South Wales were in severe drought for 9-10 monthsending February 1973.
1982-83 In terms of short-term rainfall deficiencies (up to one year) and their impacts, the1982-83 drought was probably Australia’s worst in the the twentieth century.This drought caused losses in excess of $3 billion, mostly in crop and livestock,with dust storms blowing away millions of dollars worth of topsoil. This eventfirst brought into prominence the link between El Niño and Australian drought.
2002-03 2001 to the present has been the driest on record over parts of eastern Aus-tralia, and arguably the worst on record financially for New South Wales with99.5 per cent of the State drought-stricken in April 2003. In 2002-03 wheatproduction was down 69 per cent to 2.5 million tonnes and sheep and lambnumbers dropped to their lowest numbers since 1947, with 4.8 million lost inNew South Wales.
On 23 October 2002 a severe dust storm engulfed New South Wales with visi-bility west of the divide just 300 metres in many areas. Dust was reported up to3 km above the ground.
Droughts
Periodic droughts have had a major im-pact on New South Wales, sometimesthreatening the livelihood of entire ruralcommunities, especially when they spanseveral seasons. On average a drought
seriously affects the State every 10 -20years. Drought is often associated withthe El Niño weather phenomenon; the1982/83 drought over southeasternAustralia was a classic example.

Recording and recalling our significant weather 33
Hand-fed sheep at Warialda,northern NSW, 1994 drought.Photograph by GrahamJohnson. Photograph cour-tesy NSW Department ofPrimary Industry.
Dustorm approachingvineyard at Gundaroo,early 2003.Photograph courtesy ofAnthony Ritchard.

Recording and recalling our significant weather34
1942 Two notable Southerly Busters were recorded in 1942. The first reached104 km/h at 4 pm on 25 January 1942 and was followed by severethunderstorms. The second recorded 109 km/h at 4:40pm on 4 October.
1943 Significant Southerly Busters in 1943 struck on 23 March (maximum of 95 km/hat 3:40 pm) and on 28 March (108 km/h at 9:50pm.)
1945 On 9 November 1945 a Southerly Buster of 105 km/h occurred at 6:10 pm,accompanied by thunderstorms.
1946 An early Southerly Buster reached Sydney at 11:50am on 27 November 1946with a strength of 96 km/h. The temperature before the change reached 37.4°C.
1948 The strongest Southerly Buster on record at Sydney Airport hit at 6:40 pm on18 December 1948 with a maximum wind gust of 113 km/h. The maximumtemperature that day was 34.8°C.
1951 On 6 December 1951, wind gusts from a Southerly Buster reached 98 km/h.
Southerly Buster, Boxing Day 1996,Narrabeen. Photograph courtesy ofJohn Grainger.
Southerly Busters
One of Australia’s best known ‘localwinds’ is the Southerly Buster (also knownas Southerly Burster), a surge of cool airthat moves rapidly northward along thecoast of New South Wales. SoutherlyBusters are often accompanied by windsexceeding gale force, and rapid tempera-ture drops. They usually arrive after somedays of hot dusty weather in southeasternAustralia.
Sydney has recorded more than 200Southerly Busters in the past 70 years, 22
with peak wind gusts of at least 100km/h. The record gust was 113 km/h on18 December 1948. Temperatures pre-ceding Southerly Busters are often hot,with 38°C or more measured in 33 events,the highest being 44.2°C in January 2006.More than 90 per cent of SoutherlyBusters hit between October and Febru-ary, with 45 per cent recorded in Decem-ber and January. The Southerly Busterslisted below include those which broughtgusts of at least 100 km/h to Sydney.
Recording and recalling our significant weather 35
1957 After a maximum temperature of 40.4°C on 2 December 1957, a squallySoutherly Buster reached Sydney at 5:30 pm, with a peak gust of 104 km/h.
1958 Wind gusts in a Southerly Buster reached 100 km/h at 5:10pm on 10 January 1958.
1973 Notable Southerly Busters in 1973 struck on the evening of 6 February (maximumgust 98 km/h) after a maximum that day of 39.7°C, and at 5:10pm on 20 November(maximum gust 96 km/h) after a maximum of 38.4°C.
1979 On 13 February 1979, a peak gust of 98 km/h was reached at 8:20 pm during aSoutherly Buster. Sydney’s maximum temperature reached 39.8°C.
1982 A Southerly Buster on 25 November 1982 was accompanied by dust storms andpreceded by a record November maximum temperature of 41.8°C at Sydney.The maximum wind gust at Sydney Airport was 89 km/h at 4:10 pm.
1994 A very late Southerly Buster arrived at 2:00 am on 29 December 1994, with apeak gust of 98 km/h at 3:09 am.
1995 A Southerly Buster on 12 March 1995 brought a peak gust of 98 km/h at 6:25 pm.
2001 On 15 January 2001, a Southerly Buster with a maximum gust of 100 km/hcaused blackouts, property damage and uprooted trees. Temperatures reached46°C at Penrith. This was the hottest day in Sydney’s western suburbs since 1939.
2003 The second strongest Southerly Buster on record reached a maximum gustof 109 km/h at 5:22 pm on 8 January 2003. Thunderstorms with small hailfollowed the change and 70 suburbs lost power after lightning strikes.
2004 A Southerly Buster with a maximum gust of 91 km/h reached Sydney at4:30 pm on 4 December 2004 after a maximum temperature of 41.8°C.
2006 On 1 January 2006, a Southerly Buster reached Sydney at 8:17 pm with amaximum gust of 95 km/h. The maximum temperature at Observatory Hillthat day was 44.2°C, the second highest on record.

Recording and recalling our significant weather36
1910 Very heavy snowfalls on the Central Tablelands from 18-19 July 1910 disruptedrail traffic and isolated communities. Snow was 61 cm deep at Blackheath, 55 cmdeep at Mount Victoria and 46 cm deep at Oberon.
1946 Heavy snowfalls in the Monaro district on 20 June 1946 disrupted communicationsand caused heavy stock losses. Local newspaper reports described it as one ofthe worst snowstorms in the region’s history. Snow depths of 75-105 cm wererecorded at Adaminaby, isolating the town for six days.
1949 From 19-20 July 1949 Canberra had its biggest snowfall on record with up to 22 cmof snow making all roads in and out of the city impassable. Canberra Airport wasclosed for two days. The Monaro district suffered one of its bleakest winters. InNimmitabel, snow lay continuously on the ground through July.
1956 The greatest snow depth ever recorded in Australia was on 6 September 1956when the then Snowy Mountains Hydro-electric Authority measured a depth of197 inches (five metres) at Wilkinson’s Valley snow course (near Mount Kosciuszko)at an elevation of 1981 metres.
1964 The winter of 1964 was the second biggest snow season on record, dubbed ‘theyear of the shovel’ after almost continuous blizzards in the mountains buried carsand ski lifts. The newly-built chairlift between the Alpine Way at Thredbo andCharlotte Pass had to be abandoned after people became trapped for hours dueto massive snowfalls and high winds.
1965 There were heavy snowfalls in the Blue Mountains and Central Tablelands from18-20 July 1965 with areas around Lithgow reporting 30-60 cm snow on ground,their heaviest snow since 1900. Roads were blocked and power and phone servicescut for more than 24 hours. Snow fell as far north as Gunnedah on the NorthWest Slopes and there were reports of snow settling in outer northern Sydneysuburbs such as Dural and Glenorie.
1981 The winter of 1981 had the greatest snow depth (3.62 metres) measured at theSnowy Mountains Hydro-electric Authority’s site at Charlotte Pass.
1984 An intense cold outbreak from 3-4 July 1984 saw snow as far north asToowoomba in southeast Queensland, and moderate to heavy falls to the NorthernTablelands. The town of Guyra experienced possibly the coldest mid-afternoontemperature ever recorded outside the Snowy Mountains with -3.2°C recorded at3:00 pm, more than 12°C below normal.
Snowfalls
In a meteorological sense, New South Walesalpine areas are defined as those above1200 metres where snow could reason-ably be expected to fall during the wintermonths. Snow becomes a major weatherevent when it occurs outside these normalbounds. Cold outbreaks can bring heavysnowfalls well north to the New SouthWales/Queensland border during winter,
causing major disruption to communitiesand infrastructure all along the Tablelands. Insome instances snow can even fall on theNew South Wales coastal strip. In one rareevent in 1836, snow settled to a depth of2.5 cm in Sydney city. Snow can also occurat unseasonable times. Alpine areas expe-rienced a white Christmas several timesduring the Bureau’s first 100 years.

Recording and recalling our significant weather 37
1986 On the afternoon of 28 July 1986, snow fell in Sydney city and other locations in-cluding Sydney Airport and Bankstown, but did not settle on the ground. The lastfall that actually settled in the city was on 28 June 1836 when snow ‘nearly an inch(2.5 cm) in depth’ covered the streets while a ‘razor-keen wind’ blew from the west.
1987 On 1 July 1987 the Monaro region, Snowy Mountains, Blue Mountains and theSouthern Highlands suffered some of the heaviest snowfalls since 1949. Areasaround Bombala, Nimmitabel and Delegate had between one and two metres ofsnow, closing roads and bringing down power and telephone lines. The snowremained on the ground for up to two weeks and a million sheep were caughtwithout shelter and food.
1990 From 24 June to 6 July 1990 persistent strong southwest winds caused regularsnowfalls on the Central Tablelands and in the Snowy Mountains. Oberon on theCentral Tablelands recorded 13 consecutive days of snow with wind-blown snowdrifts up to a metre deep in the area.
2004 On 17-18 July 2004 snowfalls were reported as far north as Glen Innes on theNorthern Tablelands and to low elevations on the Southern Tablelands. The snowclosed all roads in the Cooma/Bombala/Jindabyne area of the Southern Table-lands, the Great Western Highway at Blackheath and the road between Sconeand Gloucester in the Hunter.
2005 Snowfalls of up to 40 cm were recorded in the Jindabyne area from 8-10 July2005, isolating towns for several days and cutting power supplies for two days. AtNimmitabel, roofs collapsed and large tree branches fell onto roads due to theweight of snow. Snow extended as far north as Guyra on the Northern Tablelandswhich had up to 5 cm of snow.
2006 On 16 November 2006 Canberra had its first November snow since 1949, althoughit did not settle on the ground. The snow extended to the Northern Tablelandswhere the Uralla district reported 4cm of snow.
Residents of the Snowy Mountains had a white Christmas on 25 December 2006with about 15 cm snow recorded over the Alps. A similar snowfall occurred onChristmas Day 1968.
An unseasonal snow storm atDanglemah Road, Woolbrook,New South Wales 2006.Photograph by Ruth Watson.
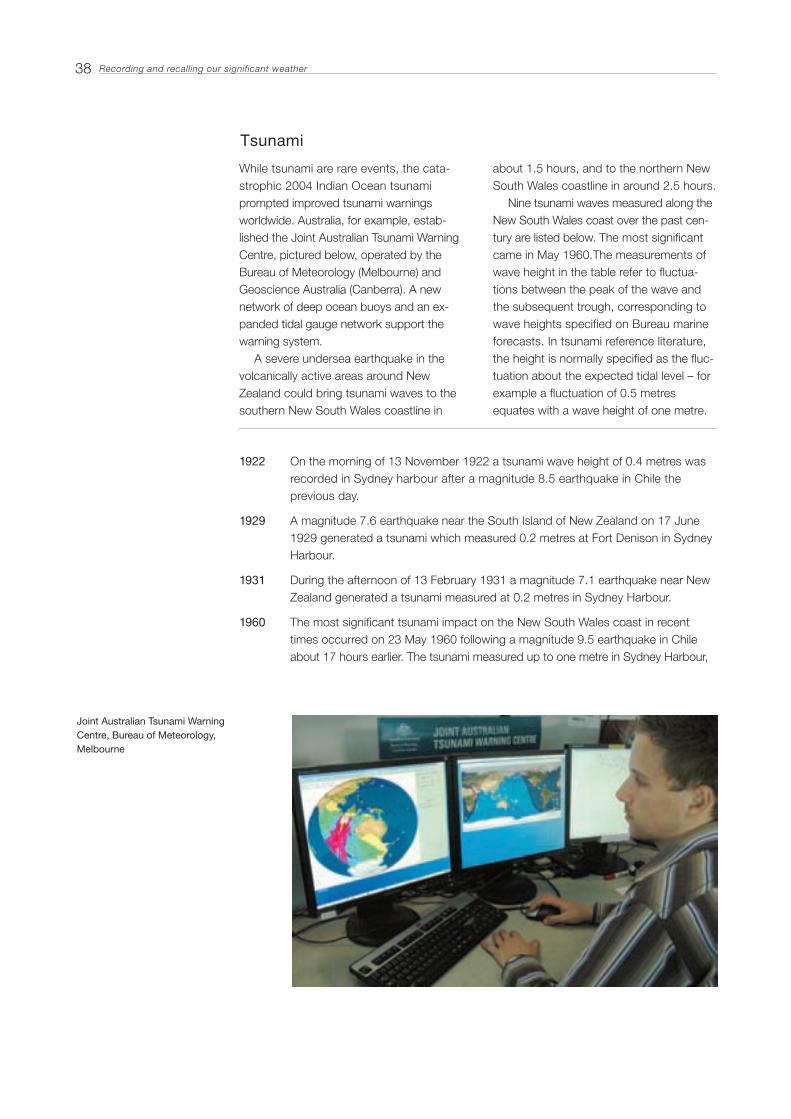
Recording and recalling our significant weather38
1922 On the morning of 13 November 1922 a tsunami wave height of 0.4 metres wasrecorded in Sydney harbour after a magnitude 8.5 earthquake in Chile theprevious day.
1929 A magnitude 7.6 earthquake near the South Island of New Zealand on 17 June1929 generated a tsunami which measured 0.2 metres at Fort Denison in SydneyHarbour.
1931 During the afternoon of 13 February 1931 a magnitude 7.1 earthquake near NewZealand generated a tsunami measured at 0.2 metres in Sydney Harbour.
1960 The most significant tsunami impact on the New South Wales coast in recenttimes occurred on 23 May 1960 following a magnitude 9.5 earthquake in Chileabout 17 hours earlier. The tsunami measured up to one metre in Sydney Harbour,
Joint Australian Tsunami WarningCentre, Bureau of Meteorology,Melbourne
Tsunami
While tsunami are rare events, the cata-strophic 2004 Indian Ocean tsunamiprompted improved tsunami warningsworldwide. Australia, for example, estab-lished the Joint Australian Tsunami WarningCentre, pictured below, operated by theBureau of Meteorology (Melbourne) andGeoscience Australia (Canberra). A newnetwork of deep ocean buoys and an ex-panded tidal gauge network support thewarning system.
A severe undersea earthquake in thevolcanically active areas around NewZealand could bring tsunami waves to thesouthern New South Wales coastline in
about 1.5 hours, and to the northern NewSouth Wales coastline in around 2.5 hours.
Nine tsunami waves measured along theNew South Wales coast over the past cen-tury are listed below. The most significantcame in May 1960.The measurements ofwave height in the table refer to fluctua-tions between the peak of the wave andthe subsequent trough, corresponding towave heights specified on Bureau marineforecasts. In tsunami reference literature,the height is normally specified as the fluc-tuation about the expected tidal level – forexample a fluctuation of 0.5 metresequates with a wave height of one metre.

Recording and recalling our significant weather 39
1.2 metres at Iluka and 1.8 metres at Eden. It caused rapid fluctuations in waterlevels in many enclosed harbours including Evans Head, Newcastle, Sydney,Batemans Bay and Eden. In Sydney Harbour boats were damaged when tornfrom their moorings. The Chilean earthquake is to date the largest recorded bymodern instruments.
1964 On 29 March 1964 a tsunami generated by a magnitude 9.2 earthquake in Alaskabrought a wave height of 0.4 metres to Sydney Harbour. The Alaskan earthquakeintensity is second only to the 1960 Chilean earthquake.
1989 A tsunami generated by a magnitude 8.1 earthquake near Macquarie Island in theSouthern Ocean was measured at 0.2 metres in Sydney Harbour on 23 May 1989.
2004 On 26 December 2004 a magnitude 9.0 earthquake in Indonesian waters south ofBanda Aceh produced a catastrophic tsunami that resulted in over 200,000deaths across the Indian Ocean. The oceanographic effects of the Asian tsunamiwere felt over much of the globe. In New South Wales the tide gauge at Port Kemblarecorded a fluctuation of around one metre 12 hours later.
Only two days previously, a magnitude 8.1 earthquake near Macquarie Islandgenerated a tsunami that registered 0.2 metres high at Port Kembla.
2007 A magnitude 8.0 earthquake in the Solomon Islands on 2 April 2007 triggered atsunami warning for locations along the east coast of New South Wales, resulting inthe closure of Sydney’s beaches, the suspension of Manly ferry services and theevacuation of students from some beachside schools to higher ground. Sea levelrises of 0.1 metres were recorded at Port Kembla on the New South Wales southcoast, and the warning was cancelled with no damage reported.
Computer simulation of atsunami spreading from anundersea earthquake offNew Zealand.
(yellow/green = highest waves).

Acknowledgments
© Commonwealth of Australia 2009
This work is copyright. Apart from any use as permitted under the Copyright Act 1968, no partmay be reproduced by any process without prior written permission from the Commonwealth avail-able from the Attorney-General’s Department.
Requests and inquiries concerning reproduction and rights should be addressed to the Common-wealth Copyright Administration, Copyright Law Branch, Attorney-General’s Department, RobertGarran Offices, National Circuit, Barton ACT 2600.
Online forms are available at http://www.ag.gov.au/cca
40
Much of this booklet draws on material collated by Bureau staff. The main contributors were MelissaLynne and Andrew Treloar with assistance from Julie Evans and staff from the New South WalesClimate Services Centre
All images within this publication are from the Bureau of Meteorology unless otherwise credited.
For further information regarding any of the topics presented in this publication: www.bom.gov.au
ISBN 970 0 642 70603 4