bureau of detention rt - charlotte county | p a g e a message from the commander the charlotte...
TRANSCRIPT
2016
Yea
r E
nd
Rep
ort
Charlotte County Sheriff’s Office
Bureau of Detention
Major Earl Goodwyne 26601 Airport Rd.
Punta Gorda, FL 33982 (941) 833-6300
2017

1 | P a g e
A Message from the Commander
The Charlotte County Sheriff’s Office Bureau of Detention consists of Jail Operations, Civil Services, and Court Security. The Bureau is dedicated to providing security and safety for all citizens of Charlotte County. The Bureau of Detention implemented new programs incorporating the use of Life Skills training, increased Mental Health Care, and more formalized Discharge Planning to help properly identify needs and transition inmates back into the general public more successfully.
The Bureau of Detention has continued its contract with the U.S. Marshal Service to house federal inmates. This contract brings in additional revenue to the county and reduces taxpayer support for detention operations. We are able to accommodate our local needs as well as offer service to other agencies that may benefit from our facility.
On February 16, 2017, our facility passed the Florida Model Jail Standards Inspection which is an annual re-inspection and scored exceptionally high. On March 28, 2017 our facility passed PREA with no violations. In addition, we received a tri-annual Florida Corrections Accreditation Commission inspection and were in 100 percent compliance of the applicable mandatory standards on December 17, 2015. The following information has been compiled to give an overview of the Bureau of Detention for the year 2017.
2 | P a g e
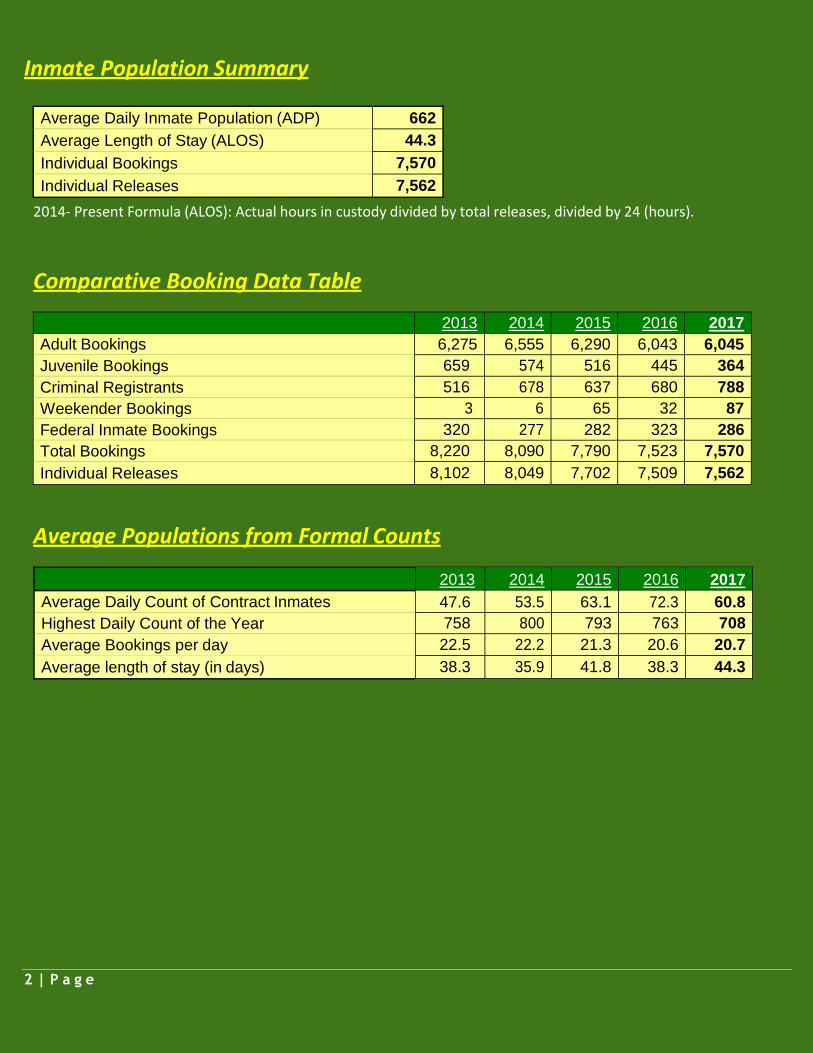
Inmate Population Summary
Average Daily Inmate Population (ADP) 662
Average Length of Stay (ALOS) 44.3
Individual Bookings 7,570
Individual Releases 7,562
2014- Present Formula (ALOS): Actual hours in custody divided by total releases, divided by 24 (hours).
Comparative Booking Data Table
2013 2014 2015 2016 2017
Adult Bookings 6,275 6,555 6,290 6,043 6,045
Juvenile Bookings 659 574 516 445 364
Criminal Registrants 516 678 637 680 788
Weekender Bookings 3 6 65 32 87
Federal Inmate Bookings 320 277 282 323 286
Total Bookings 8,220 8,090 7,790 7,523 7,570
Individual Releases 8,102 8,049 7,702 7,509 7,562
Average Populations from Formal Counts
2013 2014 2015 2016 2017
Average Daily Count of Contract Inmates 47.6 53.5 63.1 72.3 60.8
Highest Daily Count of the Year 758 800 793 763 708
Average Bookings per day 22.5 22.2 21.3 20.6 20.7
Average length of stay (in days) 38.3 35.9 41.8 38.3 44.3
3 | P a g e
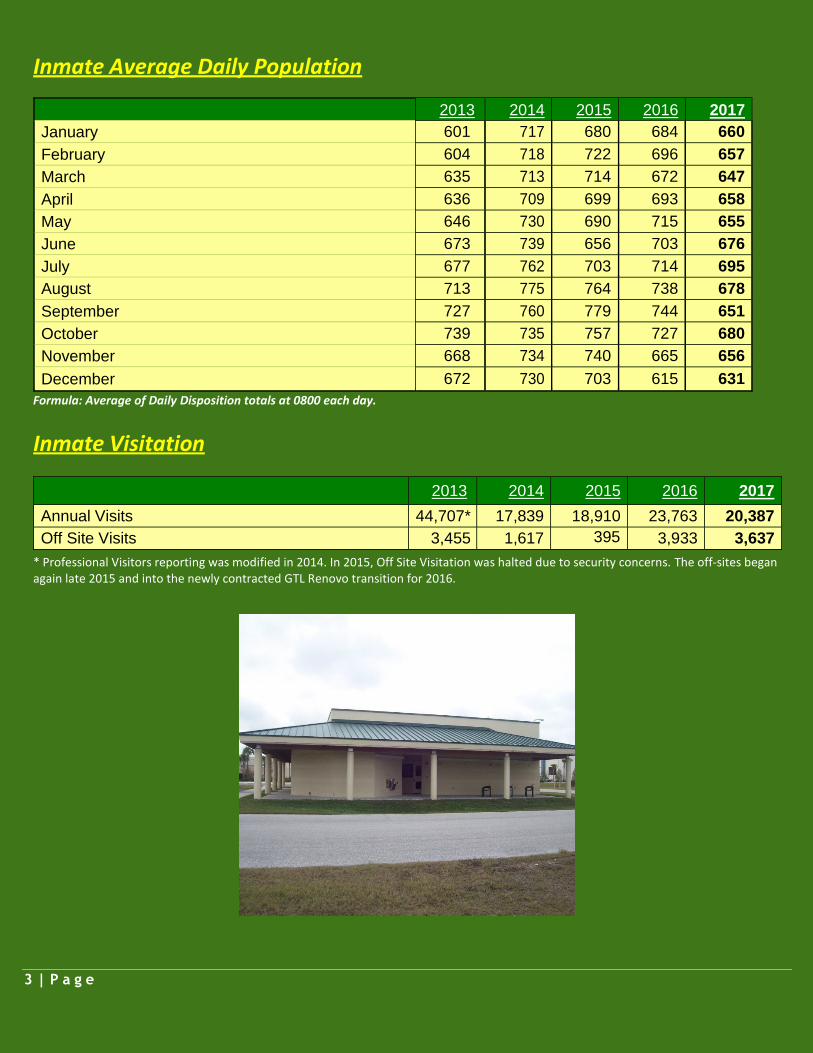
Inmate Average Daily Population
2013 2014 2015 2016 2017
January 601 717 680 684 660
February 604 718 722
696 657
March 635 713 714 672 647
April 636 709 699 693 658
May 646 730 690 715 655
June 673 739 656 703 676
July 677 762 703 714 695
August 713 775 764
738 678
September 727 760 779 744 651
October 739 735 757 727 680
November 668 734 740 665 656
December 672 730 703 615 631
Formula: Average of Daily Disposition totals at 0800 each day.
Inmate Visitation
2013 2014 2015 2016 2017
Annual Visits 44,707* 17,839 18,910 23,763 20,387
Off Site Visits 3,455 1,617 395 3,933 3,637
* Professional Visitors reporting was modified in 2014. In 2015, Off Site Visitation was halted due to security concerns. The off-sites began again late 2015 and into the newly contracted GTL Renovo transition for 2016.

4 | P a g e
Court Services (Civil/Security)
2013 2014 2015 2016 2017
Alias/ Pluries/ Insolvency 473 586 672 658 683
Code Enforcement 15 21 14 21 22
Court Appointed 191 346 206 314 107
Title IV-D 503 519 501 446 460
Juvenile Summonses 589 633 327* 174 168
Public Defender 818 421 475 408 330
State Attorney 4,828 3,817 3,463 2,997 3,210
Traffic 770 847 1,248 819 1030
Court Order- Judges 49 30 61 40 15
State Agency- Billing 1 0 0 1 2
Other Paid Papers 1,046 930 920 882 837
Writ of Garnishment 11 5 1 9 2
Baker Act (Incomp) 27 16 27 27 20
Writ of Possession 478 450 445 391 358
Writ of Replevin 5 19 4 8 7
Distress Writ` 0 0 0 0 0
Orders of Impoundment 0 0 0 0 0
Injunction – Domestic Violence with Child 165 144 127 144 185
Injunction – Domestic Violence without Child 210 206 184 245 300
Injunction – Chapter 39/ Juvenile 2 0 0 0 0
Injunction – Dating Violence 26 20 13 14 33
Injunction – Sexual Violence 7 18 10 10 15
Injunction – Repeat Violence 136 103 66 78 79
Injunction – Stalking Violence 89 180 163 189 169
Injunction – Other 353 478 343 3636 343
333
Tax Deed Certificate 1,202 690 611 636 819
Injunctions - Foreign 0 0 1 0 0
Child Pick-Up Order 1 0 3 4 8
Marchman Act Service Only 11 32 37 27 39
Marchman Act Pickup 4 1 6 8 9
Writ Assistance 0 0 0 0 0
Total 11,661 10,390 10,063 8,893 9,240 * The Jail began issuing both Juvenile Detention Hearing and Arraignment dates upon release. This was previously completed through Civil process.

5 | P a g e
Court Services (Civil/Security)
2013 2014 2015 2016 2017
Individuals Entering Justice Center through Security 397,063 411,101 397,227 356,007 312,825
Contraband Found in Lobby 4,218 3,277 4,110 3,714 4,950
X-Ray Scans in Lobby 187,038 171,174 173,845 166,508 156,271
Warrant Arrests at Justice Center 165 162 150 134 99
New In-Custody Arrests at Justice Center 224 307 202 288 169
Warrantless Probation Arrests at Justice Center 10 4 1 93 195
Inmates Transported to Courts 4,070 4,898 4,127 4,026 3,966
6 | P a g e
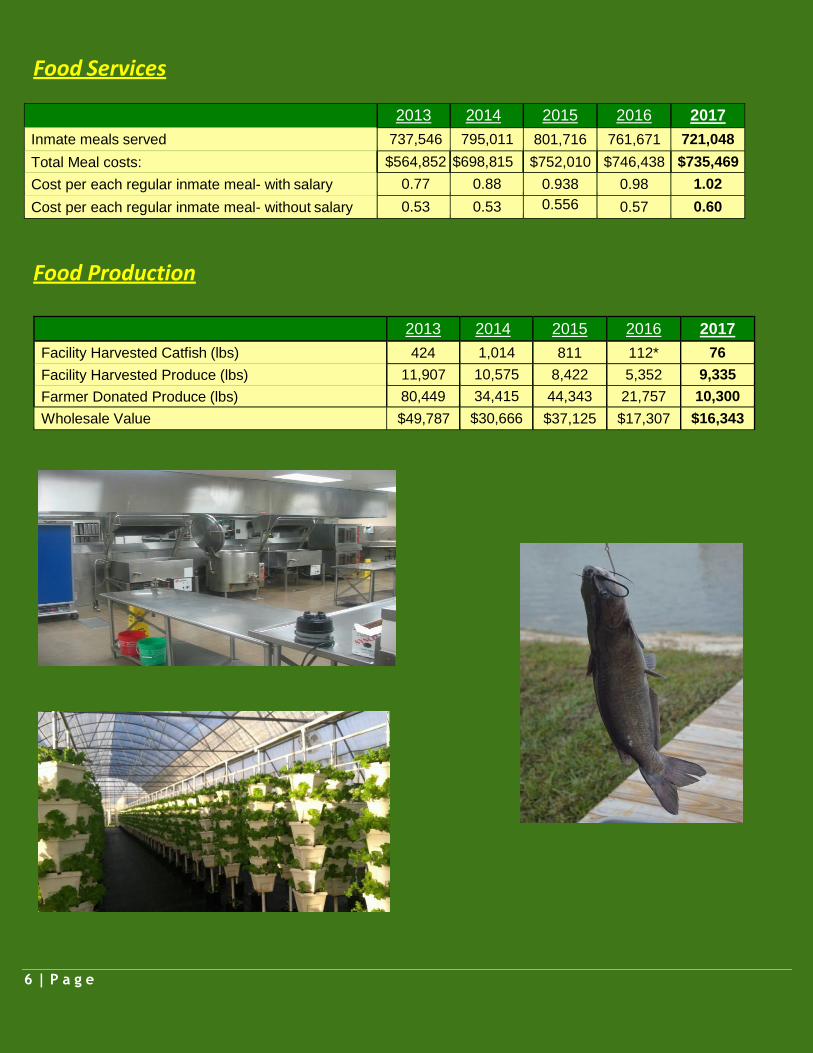
Food Services
Food Production 2013 2014 2015 2016 2017
Facility Harvested Catfish (lbs) 424 1,014 811 112* 76
Facility Harvested Produce (lbs) 11,907 10,575 8,422 5,352 9,335
Farmer Donated Produce (lbs) 80,449 34,415 44,343 21,757 10,300
Wholesale Value $49,787 $30,666 $37,125 $17,307 $16,343
2013 2014 2015 2016 2017
Inmate meals served 737,546 795,011 801,716 761,671 721,048
Total Meal costs: $564,852 $698,815 $752,010 $746,438 $735,469
Cost per each regular inmate meal- with salary 0.77 0.88 0.938 0.98 1.02
Cost per each regular inmate meal- without salary 0.53 0.53 0.556 0.57 0.60

7 | P a g e
Inmate Disciplinary Reports
2013 2014 2015 2016 2017
Disciplinary Reports Written 738 804 753 809 789
Disciplinary Reports Sustained 676 707 602 628 562
Disciplinary Reports Not Sustained/Incomplete/Dism 62 97 151 181 227
2013 2014 2015 2016 2017
Disciplinary Segregation (days) 11,926 13,667 11,221 10,729 8,964
Suspended Visitation (days) 12,211 *** 13,488 14,785 13,216
Suspended Commissary (days) 12,211 *** 13,052 13,122 13,333
Forfeited Gain Time (days) 500 545 453 277 120
Instant Adjudications 1,094 1,058 1,432 1,342 1,061
*** Data Corruption in reporting. Zeurcher created a solution for 2015 year.
Medical Services Provided
2013 2014 2015 2016 2017
Doctor Sick call 620 1,198 2,576 1,931 1,696
ANRP Sick call 4,301 2,531 5,766 5,666 4,861
Nurses Sick Call 3,013 4,557 5,145 3,994 5,045
Dentist (Exam) 784 996 988 890 523
Psychiatrist (Exam) 481 560 467 548 575
Mental Health 2,099 3,580 4,306 5,099 8,505
Hospital Days 64 73 116 171 278
Emergency room visits 71 75 64 132 178
Inmate Screenings 7,312 7,329 6,917 6,751 6,807
Infirmary admissions 1,392 1,692 1,706 1,678 1,789
Infirmary housing days 3,412 4,789 4,396 12,922* 12,138
* Increased LOS for Mental Health Days were observed in 2016, as well as tracking of Inmates placed in overflow housing units due to lack of bed space within the main Infirmary.
Inmate fees for medical services: Doctor visit without nurse sick call referral
$10.00
Dentist visit without nurse sick call referral $10.00 Dentist visit with nurse sick call referral $5.00 Doctor visit with nurse sick call referral $5.00 Nurse sick call $5.00 Prescription fee $3.00 Psychiatrist visit No charge
8 | P a g e
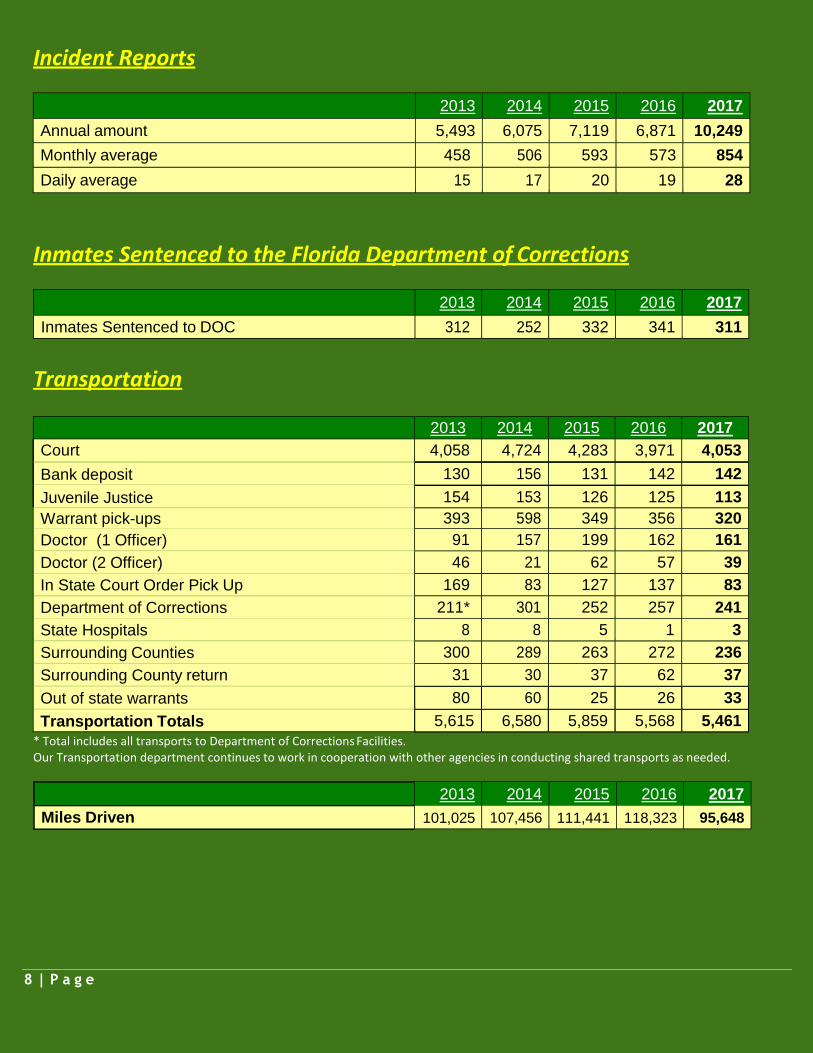
Incident Reports
2013 2014 2015 2016 2017
Annual amount 5,493 6,075 7,119 6,871 10,249
Monthly average 458 506 593 573 854
Daily average 15 17 20 19 28
Inmates Sentenced to the Florida Department of Corrections
2013 2014 2015 2016 2017
Inmates Sentenced to DOC 312 252 332 341 311
Transportation 2013 2014 2015 2016 2017
Court 4,058 4,724 4,283 3,971 4,053
Bank deposit 130 156 131 142 142
Juvenile Justice 154 153 126 125 113
Warrant pick-ups 393 598 349 356 320
Doctor (1 Officer) 91 157 199 162 161
Doctor (2 Officer) 46 21 62 57 39
In State Court Order Pick Up 169 83 127 137 83
Department of Corrections 211* 301 252 257 241
State Hospitals 8 8 5 1 3
Surrounding Counties 300 289 263 272 236
Surrounding County return 31 30 37 62 37
Out of state warrants 80 60 25 26 33
Transportation Totals 5,615 6,580 5,859 5,568 5,461
* Total includes all transports to Department of Corrections Facilities. Our Transportation department continues to work in cooperation with other agencies in conducting shared transports as needed.
2013 2014 2015 2016 2017
Miles Driven 101,025 107,456 111,441 118,323 95,648
9 | P a g e
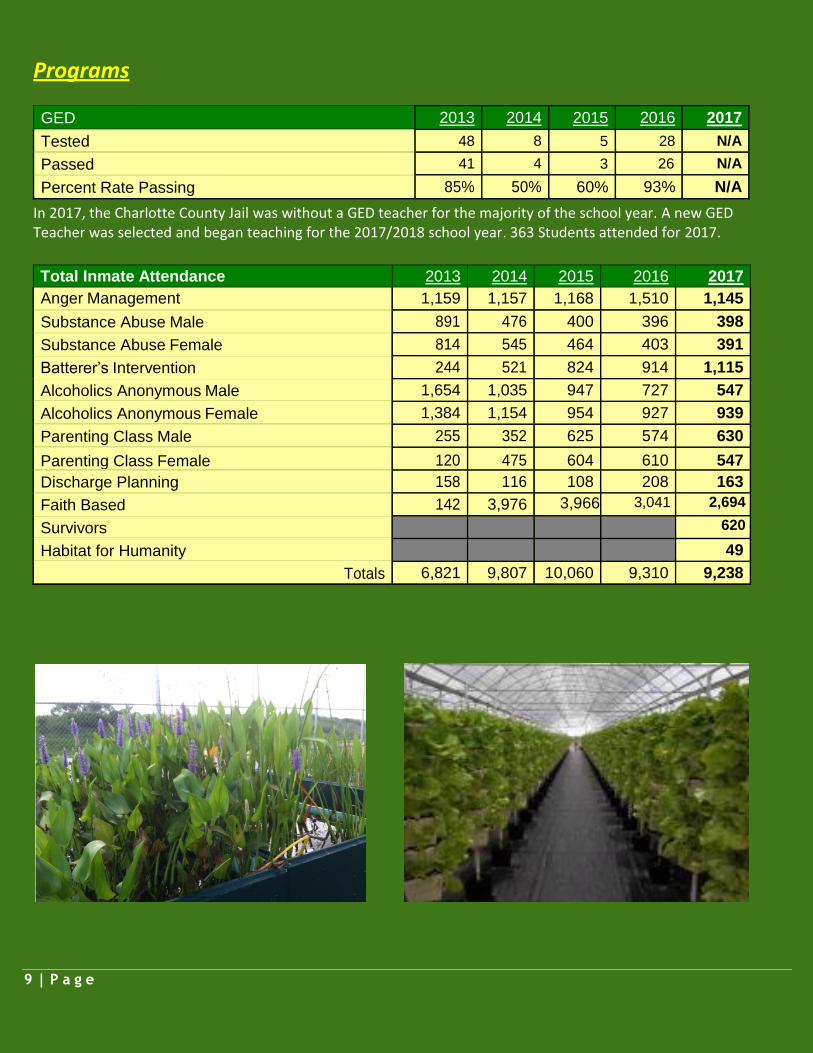
Programs
GED 2013 2014 2015 2016 2017
Tested 48 8 5 28 N/A
Passed 41 4 3 26 N/A
Percent Rate Passing 85% 50% 60% 93% N/A
In 2017, the Charlotte County Jail was without a GED teacher for the majority of the school year. A new GED Teacher was selected and began teaching for the 2017/2018 school year. 363 Students attended for 2017.
Total Inmate Attendance 2013 2014 2015 2016 2017
Anger Management 1,159 1,157 1,168 1,510 1,145
Substance Abuse Male 891 476 400 396 398
Substance Abuse Female 814 545 464 403 391
Batterer’s Intervention 244 521 824 914 1,115
Alcoholics Anonymous Male 1,654 1,035 947 727 547
Alcoholics Anonymous Female 1,384 1,154 954 927 939
Parenting Class Male 255 352 625 574 630
Parenting Class Female 120 475 604 610 547
Discharge Planning 158 116 108 208 163
Faith Based 142 3,976 3,966 3,041 2,694
Survivors 620
Habitat for Humanity 49
Totals 6,821 9,807 10,060 10,197
9,310 9,238

10 | P a g e
Flower Program
The Charlotte County Jail has coordinated with local retailers to accept donations of wilted or dying plants. These plants are then revitalized and repurposed to non-profit and county events throughout the year to defer costs. During this year, the inmate program has provided plants to the Charlotte County Government sites, Habitat for Humanity, Team Punta Gorda, and CARE events.
2014 2015 2016 2017
Plants donated 353 245 92 106
Number of Events 20 31 21 23
Road Side Clean Up
The Charlotte County Jail coordinates with code compliance to complete cleanup efforts throughout Charlotte County. Officers are MDOT certified to complete roadside and homeless camp clean ups.
2014 2015 2016 2017
Clean Up (Sites) 4 20 32 20
Pounds of Debris Removed 3,500 31,500 43,900 105,500
11 | P a g e
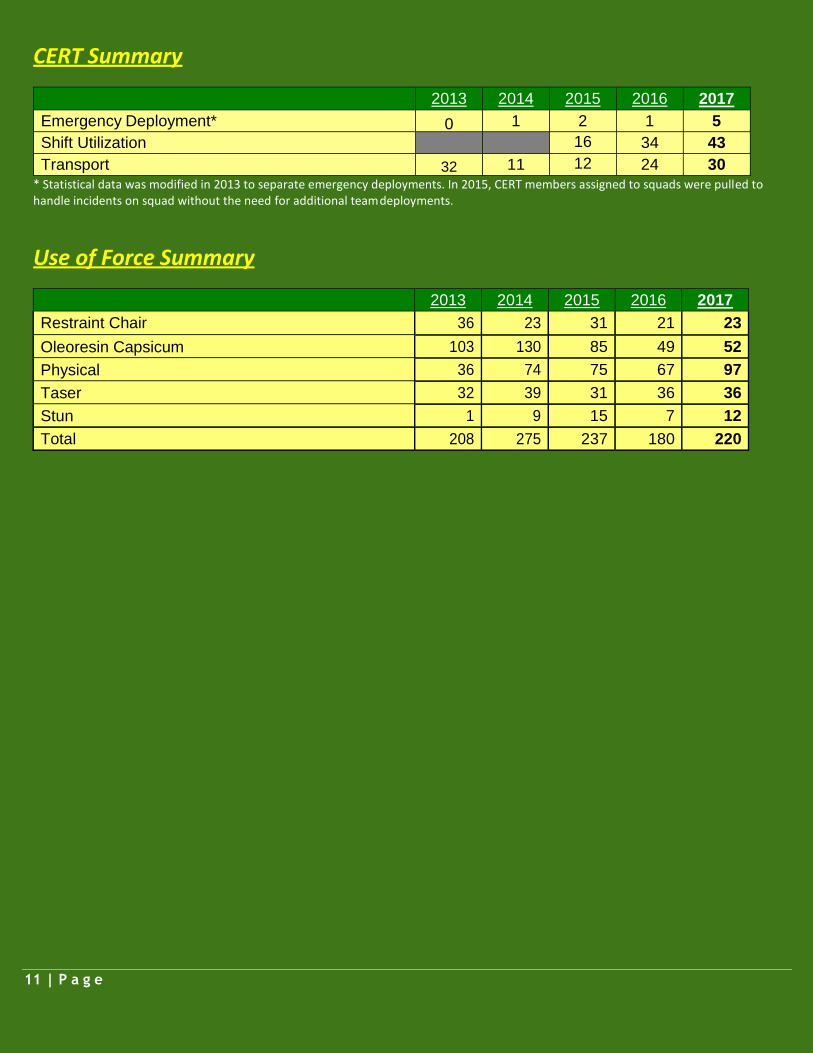
CERT Summary
2013 2014 2015 2016 2017
Emergency Deployment* 0 1 2 1 5
Shift Utilization 16 34 43
Transport 32 11 12 24 30 * Statistical data was modified in 2013 to separate emergency deployments. In 2015, CERT members assigned to squads were pulled to handle incidents on squad without the need for additional team deployments.
Use of Force Summary
2013 2014 2015 2016 2017
Restraint Chair 36 23 31 21 23
Oleoresin Capsicum 103 130 85 49 52
Physical 36 74 75 67 97
Taser 32 39 31 36 36
Stun 1 9 15 7 12
Total 208 275 237 180 220