bundling drought tolerance and index insurance v2
TRANSCRIPT

BUNDLING DROUGHT TOLERANCE & INDEX INSURANCE TO REDUCE RURAL HOUSEHOLD VULNERABILITY TO DROUGHT
Travis J. Lybbert & Michael R. Carter
Department of Agricultural & Resource Economics, University of California, Davis
April 2013
Prepared for Edited Volume,
Risk, Resources, Governance and Development: Foundations of Public Policy
Abstract
Seasonal weather fluctuations directly and dramatically shape rural household welfare in developing countries. With climate projections of more severe and more frequent extreme weather events, this vulnerability will likely remain central to global poverty concerns and policy debates for the coming decades. In many contexts, drought presents a major weather risk, and drought tolerant crop varieties have thus attracted widespread attention. Index insurance has garnered similar enthusiasm as an instrument for reducing producers’ vulnerability to weather. In many rainfed agricultural settings, neither technological innovation in drought tolerance nor financial innovation in index insurance is sufficient in isolation – and that the true potential of either to reduce household vulnerability might only be tapped when bundled with the other. In isolation, drought tolerant crops may protect against moderate drought but leave farmers’ exposure to extreme drought risk virtually unchanged. While drought index insurance may provide more complete protection against drought, rural households may be unwilling to pay actuarially fair prices to access this insurance. Proper bundling of the two may help resolve this conundrum by leveraging complementarities between the two types of innovation. We calibrate such a bundled drought tolerance-‐drought index insurance package in the context of Ecuador to illustrate this possibility.
Keywords: Drought, Vulnerability, Drought Tolerance, Index Insurance, Risk.
JEL Codes: O33, Q12, D80
Lybbert and Carter “Bundling Drought Tolerance & Drought Index Insurance” April 2013
2
1. INTRODUCTION
Drought is fundamentally a weather event characterized by below normal precipitation, but its human impacts are much more complex and nuanced than this simple climatic definition might suggest. In human welfare terms, drought effects are shaped by the geophysical, agronomic, social, economic, and political features of a given context. Among many of the world’s poor, frequent drought combined with an unfortunate confluence of these mediating features makes drought one of their most worrisome perennial concerns. In rural rainfed settings, drought can damage or destroy crops and livestock, causing hunger and illness and reducing household food security. These immediate effects can induce persistent harm by triggering costly coping responses such as liquidating assets, skipping meals and choosing inferior foods that can have persistent effects and reduce long-‐run household welfare. Moreover, it is not just the occurrence of drought that carries a hefty burden; for vulnerable households the very threat of drought can prevent them from taking full advantage of their resources and keep them poorer than they otherwise might be.
Since World War II, development and relief efforts have largely aimed to provide frontline responses to weather shocks such as floods and droughts and, more recently, to reduce household vulnerability to these shocks. While the essence of these policy objectives remains the same, climate change projections of more extreme and more frequent weather events in many poor places have added new urgency to mitigating the weather risks born by the rural poor. In the case of drought risk, a flurry of innovative interventions to reduce these risks has attracted substantial attention and funding from both the public and private sectors. Drought tolerance (DT) in crops and index insurance (II) – agronomic and financial innovations, respectively – have generated particularly high expectations.
In this paper, we argue that some of the hype around DT and II should be moderated by an appreciation of their respective limitations. In isolation, DT may protect against crop losses to moderate drought but leave farmers’ exposure to extreme drought risk virtually unchanged. While II might provide good protection against both moderate and severe drought, rural households may be unwilling to pay actuarially fair prices to access II that offers such complete protection.
By exploring a simple complementarity between the two, however, we also argue that properly bundling DT and II may restore a good deal of the promise of these innovations. In particular, when bundled with DT that protects against moderate drought, II could be redesigned to only cover the kind of severe drought events that might overpower any protection offered by DT. Such an extreme event II product could be offered at substantially lower prices and thereby be more accessible to poor farmers. Further, the increase in II demand due to the implicit subsidy provided by DT may improve the long-‐run viability of these emerging financial markets.
2. DROUGHT RISK, VULNERABILITY & DEVELOPMENT INTERVENTIONS
The UN recently estimated that 1.5 billion people were vulnerable to drought.1 Although difficult to assess rigorously, this vulnerability to drought conceptually begins with drought as purely a
1 http://www.un.org/News/Press/docs/2012/gaef3352.doc.htm Accessed 13 February 2013.

Lybbert and Carter “Bundling Drought Tolerance & Drought Index Insurance” April 2013
3
precipitation-‐based measure and adds the necessary biophysical, infrastructural, social, economic and political filters to identify those populations for whom low precipitation imposes a serious welfare burden in terms of nutrition, income, assets and future wellbeing. Given that each of these layers is spatially heterogeneous, these hundreds of millions of vulnerable households tend to be concentrated in specific regions. Although pockets of national-‐level drought vulnerability exist in Central and South America, drought vulnerability at the national level is highest in Asia and, especially, Africa (Eriyagama et al., 2009).
To appreciate the welfare effects of drought among vulnerable households, a few important nuances are important to keep in mind. First, although drought often conjures up images of a weather-‐worn and weary farmer leaning on a hoe and surveying a dusty plot of withering crops that were supposed to produce food for his family, such images can be misleading. Most poor farmers rely heavily on markets for selling their production and most rely even more heavily on markets for buying food. This means that for many of the rural poor the direct impact of drought on their own food production can be less worrisome than the indirect effect on food prices and households’ access to food.
Second, as mentioned earlier, drought can trigger a series of behavioral responses that imply that the total welfare burden of drought is much higher than what might be observed in the immediate aftermath of a drought event. In addition to the so-‐called ‘ex post’ risk effect that encompasses these immediate effects, the threat of drought like a bully induces households to opt out of higher return livelihoods and store their assets in forms that have low or negative returns but high liquidity. Elbers et al. (2007) use a panel of household data from Zimbabwe to quantify the magnitude of these effects and find that more than half of the drought risk burden is due to this ex ante threat of drought rather than the actual occurrence of drought. Similarly, much of the drought burden is essentially hidden from direct observation in many settings.
Lastly, individual drought coping responses can be aggregated across households in ways that magnifies the overall drought burden in a region or country. For example, when livestock markets are poorly integrated, a shared drought event that prompts many to sell animals in order to fund food purchases can cause livestock prices to plummet once local markets aggregate this individual drought response. In even more dramatic fashion, severe and persistent drought can spur mass migrations of displaced populations and lead to social and political tensions that, when mixed with other instabilities. As a case in point, several years of extreme drought in Syria after 2005 – which forced many rural households to migrate to urban edges – seem to have set the stage for the subsequent socio-‐political instability (e.g., Hoerling et al., 2011). While extended drought was surely not the only cause of this civil conflict, it acted as a ‘threat multiplier’ that interacted in potent ways with other existing threats (Johnstone and Mazo, 2011).
Since it is difficult overstate the burden drought can impose in some settings, several different angles have emerged to remedy the impacts of drought.2 Table 1 organizes several common drought-‐related
2 In a different spirit entirely, drought can bring distinct and important benefits to some interest groups. This can be particularly apparent in political realms where “everybody loves a good drought” (Sainath, 1996). Especially
Lybbert and Carter “Bundling Drought Tolerance & Drought Index Insurance” April 2013
4
interventions. While this table is intended primarily to provide a backdrop to our discussion of DT and II in the subsequent section, a few things are worth noting. Aside from infrastructure, information, organizations, many of these interventions treat individuals or households directly, which raises some important targeting issues. These issues arise because drought is less of a shared experience than it may seem; idiosyncratic factors such spatial variation in rainfall, local soil and topographical differences that affect how much moisture is retrained in the soil, differences in cropping and livelihood strategies, and heterogeneous mitigation, coping and recovery capacities mediate how a particular household bears up in a drought – and how much of an impact a particular intervention might have.
Many of the interventions in Table 1 aim to address ex post drought effects directly. Whether they also reduce ex ante effects depends largely on how reliable they are – as perceived by key decision makers in households and before drought occurs. A farmer is unlikely to put his household’s welfare on the line based on interventions that may or may not help in the wake of a drought, and drought is likely to continue to impose an important ex ante burden. Agronomic technologies and practices may ultimately reduce a household’s vulnerability to drought, but such a household must gain sufficient familiarity and experience with these innovations before they are likely to feel less bullied by the threat of drought.
3. DROUGHT TOLERANCE & DROUGHT INDEX INSURANCE: PROSPECTS & COMPLEMENTARITY
Both of the drought interventions we explore in this paper, DT and II, aim to directly reduce farmers’ vulnerability to drought. While both are quite simple conceptually and closely related to familiar approaches to mitigating drought risk, each has evolved rapidly in recent years thanks to a flurry of investment and innovation in the past decade. In this section, we describe these recent experiences and the near-‐term prospects for DT and II to reduce drought vulnerability among the rural poor. We then introduce the complementarity between the two that is the basis for our argument that a bundled DT-‐II product may be much more potent than either of the two in isolation.
3.1 Drought Tolerance
As an agronomic intervention, DT has been a long-‐standing breeding objective. Conventional breeding has often selected for resistance to moisture or temperature stress in order to target specific agroclimatic zones with improved varieties. What is innovative in the current generation of DT is the set of tools and techniques breeders are bringing to bear on the problem. Agricultural biotechnology tools such as marker assisted selection have rapidly advanced conventional plant breeding. Genetic engineering likewise pushes the frontier for DT innovation. Although there are dissenting views about how much we can expect from this DT innovation stream (Gurian-‐Sherman, 2012), the promise and potential of these new breeding tools have attracted almost unprecedented investments aimed at DT research from both the private and public sector. Major private sector players see substantial profit opportunities for these new generation DT technologies in North America, Australia and elsewhere in
egregious and disturbing are claims that droughts provide opportunities to oppress or punish specific ethnic groups or other factions.

Lybbert and Carter “Bundling Drought Tolerance & Drought Index Insurance” April 2013
5
the coming decades. For example, Monsanto estimates that the market for a DT trait in maize in the U.S. alone could be $500 million by 2020.3
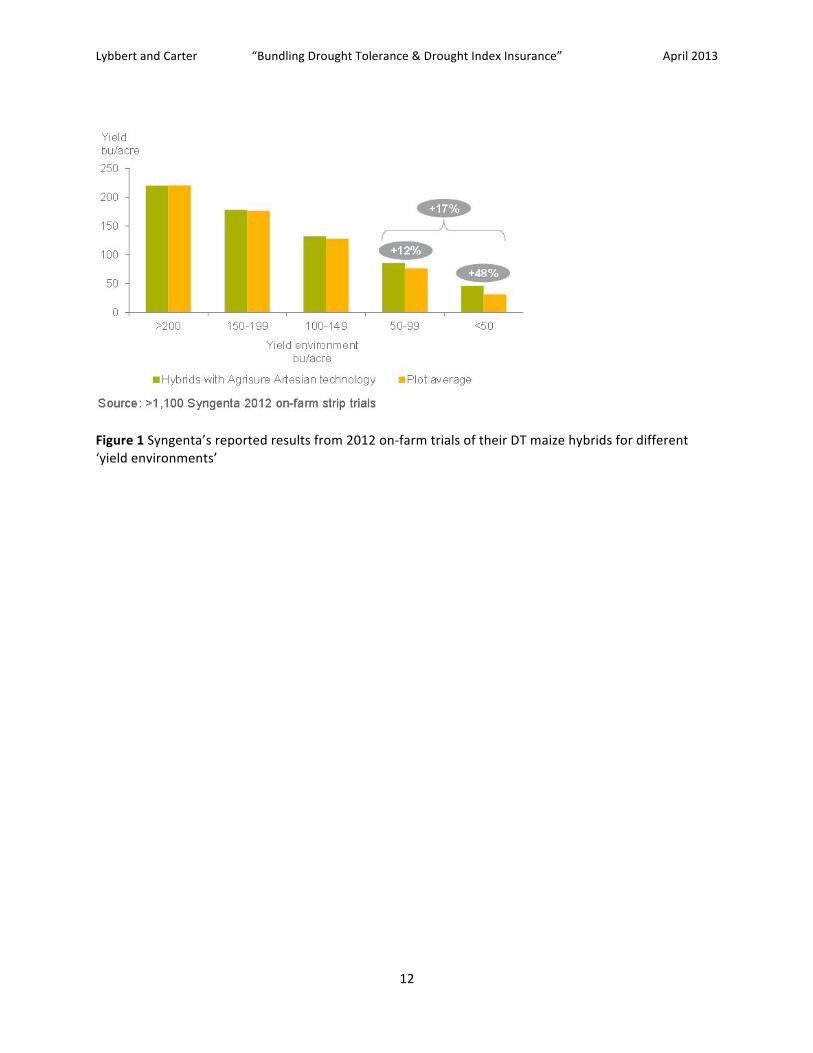
Monsanto, Syngenta and Pioneer have all recently released new maize hybrids with new generation DT traits. Monsanto’s genetically engineered DT products are marketed as Genuity Droughtgard Hybrids. Syngenta and Pioneer released their (non-‐genetically engineered) DT maize products in 2012 under the names Agrisure Artesian (“Maximize your yield without risking it all on weather”) and Optimum AQUAmax, respectively. Although farmer experiences with these new DT maize hybrids are limited by their recent release, the severe drought conditions that were prevalent across much of the corn belt of the U.S. in 2012 provided a useful test of the potential DT benefits they confer. As reported by these seed companies (and keeping the obvious caveats in mind),4 on-‐farm trials of these hybrids show average DT yield benefits in the range of 5-‐17%. Syngenta reported the results of their on-‐farm trials in a format that clearly shows how these DT benefits vary by drought environment as shown in Figure 1: whereas the DT benefit of their Agrisure Artesian maize hybrids is negligible for environments with average yields above 100 bu/acre, the DT benefits for plots with more pronounced drought pressure were more dramatic (48% for plots with yields below 50 bu/acre).
The decade of private sector research and development in DT crops has been matched by a similar explosion of public sector investments in DT technologies. Universities, national agricultural research institutes and international research centers that are part of the Consultative Group for International Agricultural Research (CGIAR) have made important breakthroughs in the area with financial support from development agencies, research foundations, and other donors. Several public-‐private partnerships focused on DT drops have emerged as these public sector entities have collaborated with the major private sector players. Two important such partnerships are focused on breeding DT crops for Africa. The Drought Tolerant Maize for Africa (DTMA) project started in 2007 and is coordinated by two CGIAR centers (CIMMYT and IITA) and involves several national agricultural research centers, public and private seed companies, and farmer groups in 13 countries. The Water Efficient Maize for Africa (WEMA) project began in 2008 and is led by the African Agricultural Technology Foundation in collaboration with Monsanto, CIMMYT and several national research centers. Together, these two initiatives have attracted substantial investments in DT research.
These public-‐private partnerships are facilitated by four features of agricultural research in this area. First, DT research is often characterized by large up front fixed costs and small (near zero) marginal costs of producing DT traits. Second, agroecological variation implies that breeding these DT traits into maize hybrids that are well-‐adapted to local growing conditions can require significant late-‐stage breeding effort. Third, private seed companies clearly segment profitable markets for their products from lower priority markets. Fourth, many private and public agricultural research organizations are eager to demonstrate the potential of agricultural biotechnology in ongoing debates about the costs and benefits of new technologies based on these techniques. Thanks to the confluence of these four features, private
3 http://www.monsanto.com/SiteCollectionDocuments/whistlestop-‐drought-‐posters.pdf accessed 13 Feb 2013. 4 These on-‐farm trial results are available at http://www.genuity.com/corn/Pages/Genuity-‐DroughtGard-‐Hybrids.aspx, accessed 13 February 2013.
Lybbert and Carter “Bundling Drought Tolerance & Drought Index Insurance” April 2013
6
seed companies have been eager to collaborate with public research organizations, and the public sector is similarly eager to collaborate with the private companies.
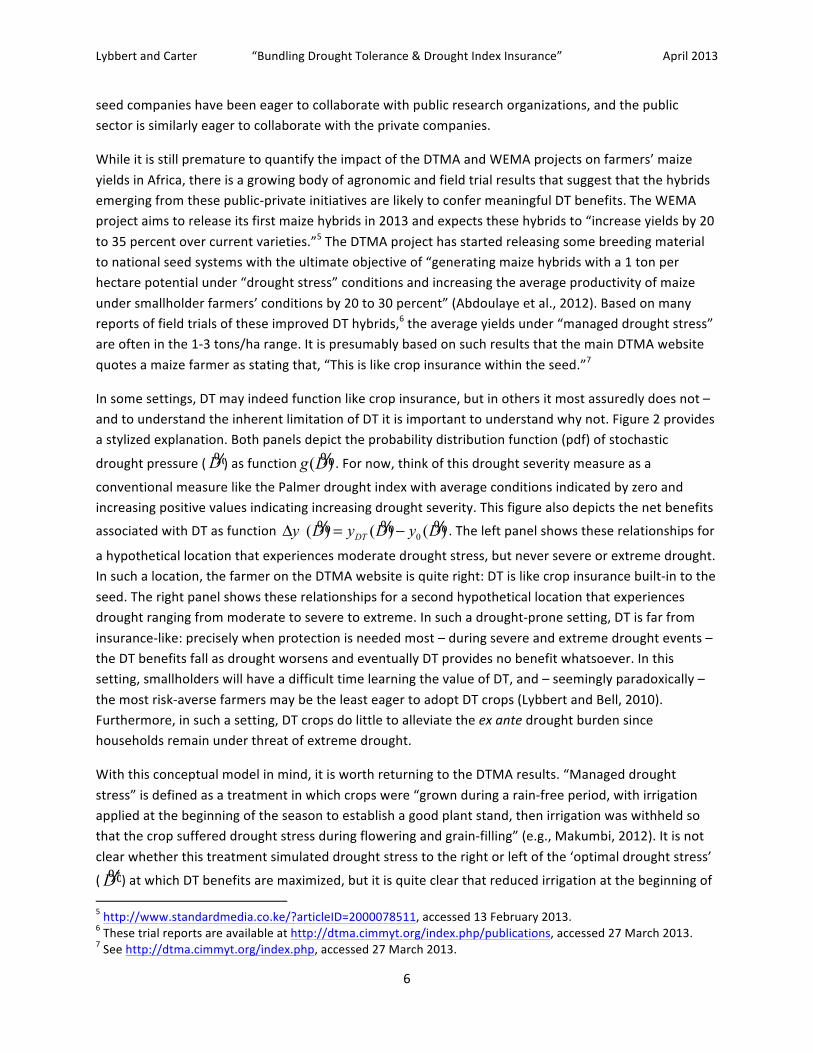
While it is still premature to quantify the impact of the DTMA and WEMA projects on farmers’ maize yields in Africa, there is a growing body of agronomic and field trial results that suggest that the hybrids emerging from these public-‐private initiatives are likely to confer meaningful DT benefits. The WEMA project aims to release its first maize hybrids in 2013 and expects these hybrids to “increase yields by 20 to 35 percent over current varieties.”5 The DTMA project has started releasing some breeding material to national seed systems with the ultimate objective of “generating maize hybrids with a 1 ton per hectare potential under “drought stress” conditions and increasing the average productivity of maize under smallholder farmers’ conditions by 20 to 30 percent” (Abdoulaye et al., 2012). Based on many reports of field trials of these improved DT hybrids,6 the average yields under “managed drought stress” are often in the 1-‐3 tons/ha range. It is presumably based on such results that the main DTMA website quotes a maize farmer as stating that, “This is like crop insurance within the seed.”7
In some settings, DT may indeed function like crop insurance, but in others it most assuredly does not – and to understand the inherent limitation of DT it is important to understand why not. Figure 2 provides a stylized explanation. Both panels depict the probability distribution function (pdf) of stochastic
drought pressure (D%) as function ( )g D%. For now, think of this drought severity measure as a
conventional measure like the Palmer drought index with average conditions indicated by zero and increasing positive values indicating increasing drought severity. This figure also depicts the net benefits
associated with DT as function 0( ) ( ) ( )DTy D y D y DΔ = −% % %. The left panel shows these relationships for
a hypothetical location that experiences moderate drought stress, but never severe or extreme drought. In such a location, the farmer on the DTMA website is quite right: DT is like crop insurance built-‐in to the seed. The right panel shows these relationships for a second hypothetical location that experiences drought ranging from moderate to severe to extreme. In such a drought-‐prone setting, DT is far from insurance-‐like: precisely when protection is needed most – during severe and extreme drought events – the DT benefits fall as drought worsens and eventually DT provides no benefit whatsoever. In this setting, smallholders will have a difficult time learning the value of DT, and – seemingly paradoxically – the most risk-‐averse farmers may be the least eager to adopt DT crops (Lybbert and Bell, 2010). Furthermore, in such a setting, DT crops do little to alleviate the ex ante drought burden since households remain under threat of extreme drought.
With this conceptual model in mind, it is worth returning to the DTMA results. “Managed drought stress” is defined as a treatment in which crops were “grown during a rain-‐free period, with irrigation applied at the beginning of the season to establish a good plant stand, then irrigation was withheld so that the crop suffered drought stress during flowering and grain-‐filling” (e.g., Makumbi, 2012). It is not clear whether this treatment simulated drought stress to the right or left of the ‘optimal drought stress’
( *D%) at which DT benefits are maximized, but it is quite clear that reduced irrigation at the beginning of 5 http://www.standardmedia.co.ke/?articleID=2000078511, accessed 13 February 2013. 6 These trial reports are available at http://dtma.cimmyt.org/index.php/publications, accessed 27 March 2013. 7 See http://dtma.cimmyt.org/index.php, accessed 27 March 2013.

Lybbert and Carter “Bundling Drought Tolerance & Drought Index Insurance” April 2013
7
the season would quickly erode any DT benefits. While none of the DTMA trials enable one to understand the drought-‐yield profiles as shown in Figure 2, it is almost certainly true that smallholders in Sub-‐Saharan Africa are more likely to face drought risks like the panel on the right than the one on the left, which has direct implications for the prospects of DT maize in these settings. To underscore this important point, consider anew the on-‐farm trial results as reported by Syngenta in Figure 1. The lowest ‘yield environment’ reported in these results (<50 bu/acre) suggests an impressive 48% yield gain, but a maize yield of this level corresponds to the 90th percentile of maize yields in Ethiopia. It seems likely that the median Ethiopian maize farmer would confront a very different range of potential DT benefits.
3.2 Index Insurance
Agricultural index insurance works not by insuring the farm household directly against its own specific income or yield losses,8 but instead by insuring against a direct or predicted measure of the average or typical losses experienced by farms located in the vicinity of the household. An index insurance contract can be represented as an indemnity schedule that links payments to an index that predict typical losses in the zone covered by the index. To avoid problems of moral hazard and adverse selection the level of the index cannot be influenced by the actions of the insured, nor can its level depend on which particular individuals choose to purchase the insurance.
Recent technological advances in remote sensing and automated weather measurement that permit estimation of crop losses (as well as the potential of older ideas like area yield insurance9) open the door to innovative index insurance contracts. Realizing the risk transfer potential of these advances faces both demand-‐ and supply-‐side constraints. A number of recent projects have shown that the supply-‐side challenges can be overcome.
Despite this supply-‐side progress, contract demand and uptake has been sometimes tepid. As discussed in Carter (2012), a number of demand-‐side challenges remain, including devising insurance indexes that are highly correlated with individual farmer outcomes (reducing residual uninsured or ‘basis’ risk). When these problems are resolved, an emerging but still small body of research shows that the impacts of index insurance can be substantial (Bellemare et al., 2012; Janzen and Carter, 2012; Karlan et al., 2012).
While index insurance for small farm agriculture is still a work in progress, we here focus on its complementarities with DT varieties. That is, index insurance can insure extreme event losses where even DT varieties fail, whereas DT is a more cost-‐effective risk management tool than index insurance for less extreme events. As a package, they thus offer a relatively low cost, but highly effective risk
8 A myriad of experience shows, trying to insure all sources of variation in agricultural outcomes for small farmers is beset by a host of problems rooted in the costs of obtaining information on small farm outcomes that renders such insurance infeasible (Hazell, 1992). 9 Area yield insurance measures average yields in a defined geographic area (e.g., a valley, or administrative district) and makes payments when these average yields fall below a specified ‘strikepoint’ level.

Lybbert and Carter “Bundling Drought Tolerance & Drought Index Insurance” April 2013
8
management solution. Demand for such a bundle seems likely to be high,10 creating a sustainable market for both products.
Prior to turning to our analysis that substantiates these points, it is worth mentioning one key difference between DT varieties and index insurance. The development of DT varieties has extremely high fixed, up-‐front costs, but once developed the marginal costs of offering the DT trait to farmers is close to zero. While index insurance has modest up-‐front development costs, it requires the payment of an annual premium, which is comprised of two pieces: the expected payout plus an additional loading required to cover distribution and other administrative costs. While governments and donors appear willing to subsidize the up-‐front development costs for both DT varieties and index insurance, they are seem less willing to subsidize an annual premium. For this reason, in the analysis to follow we will assume that DT seeds cost the farmer no more than non-‐DT seeds, whereas we will assume that the farmer must pay the full annual cost of the insurance premium.
This feature of the cost structure of the index insurance industry provides a central motivation for bundling DT and II. Specifically, this cost structure implies that farmers’ willingness to pay for these insurance products will critically determine the viability of these financial markets. In other words, poor farmers will only have access to an appropriate selection of index insurance products if their demand for these products is sufficient to sustain and encourage the development of these markets. In some contexts, this reality may be at odds with existing evidence suggesting that farmers can be quite sensitive to price when facing index insurance products.
3.3 The Drought Tolerance -‐ Drought Index Insurance Complementarity
With these specific limitations of stand-‐alone DT and II in mind, we now turn to the complementarity that makes bundling them potentially interesting. This complementarity, which is tied to drought severity, is quite simple. A bundled DT-‐II product can offer monotonic benefits as drought severity increases because II can incrementally cover the severe drought pressure beyond the point where relative DT benefits begin to fade. On the flip side, with DT covering low to moderate drought events, II can be designed so it only covers rarer and more extreme droughts, which can substantially reduce the actuarially fair premium associated with the insurance. In this way, bundling with DT may offer what governments and donors seem unwilling to offer: a long-‐term – albeit implicit – subsidy on index insurance premiums.
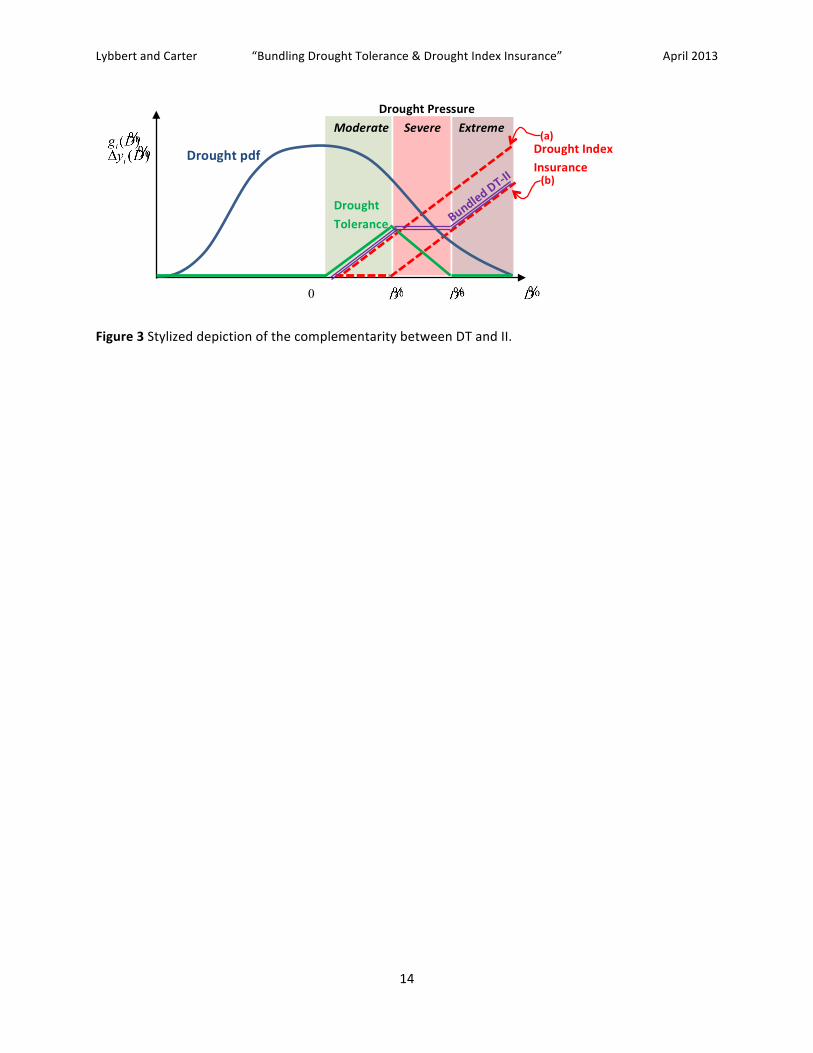
Figure 3, which borrows the same format and notation as Figure 2, depicts the essence of this complementarity graphically. The net yield gains associated with DT are represented as a triangular distribution centered on *D%. As before, these net DT gains begin to decrease in severe drought and are zero in extreme drought when crops fail (i.e., when yield that is too meager to justify harvesting). Two II contracts are depicted in the figure: (a) a ‘full coverage’ contract that pays out in moderate, severe and extreme drought, and (b) a potentially much cheaper ‘limited coverage’ contract that pays out only in severe and extreme drought. Finally, the figure shows what a stylized DT-‐II bundle would look like in this
10 Work by Karlan et al. (2012) and McIntosh et al. (2013) shows that the demand for index insurance appears to be quite price elastic.

Lybbert and Carter “Bundling Drought Tolerance & Drought Index Insurance” April 2013
9
case. Note that as drought intensity increases in the severe drought range the falling DT net gains are offset by rising II payoffs. In extreme drought, II continues to provide a payout. In this stylized example, the resulting payoff profile for bundled DT-‐II is never decreasing in drought severity, which implies that such a bundled product can reduce both the ex post and ex ante drought risk burdens.
In practice, bundling a particular DT crop with index insurance raises a few important – if somewhat nuanced – considerations. First, whereas the net payoff profile for a DT crop can only be altered through hard earned breeding breakthroughs and innovations in agronomic practices or other inputs, the payoff profile for II can easily be changed to fit a given context. Before one can properly construct a II contract that complements a given DT crop, one must understand the net yield profile of the DT crop. Second, although the depiction in Figure 3 suggests that modifying the II contract to complement the DT crop is simply a matter of changing the strike point (i.e., the point along the drought index continuum where the contract begins to payout), in practice optimizing the design of a II contract to fit a particular DT crop is likely to be more complex than this. To the extent that a DT trait changes the relationship between drought and yield differently at different levels of drought severity, optimizing the bundled II contract may require more than adjusting the strike point.
4. CALIBRATING & EVALUATING A DT-‐II BUNDLE FOR MAIZE IN ECUADOR
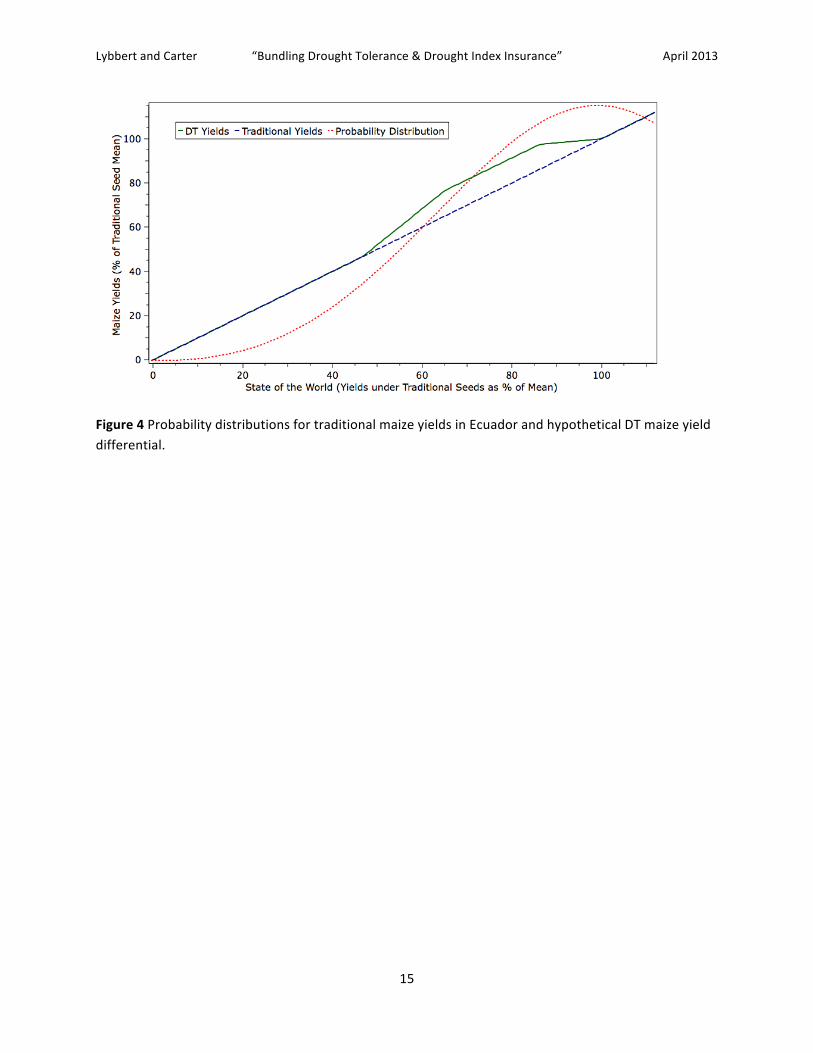
In this section, we use maize data from a drought-‐prone region of Ecuador to analyze how a DT-‐II bundle might operate in practice. The Ecuadoran government annually collects yield data from random samples of producers in different regions of the country.11 For this analysis, we use the maize yield data covering 2001-‐2011 from the coastal Guayquil department to estimate the underlying probability structure for the traditional maize yields. In Figure 4, below average yields have been standardized by the long-‐term average yields in the region (i.e., the mode of the probability distribution is at 100%). While factors other than drought stress explain some of this yield variability, we assume for simplicity that all yield declines are driven by drought stress.
Based on the limited evidence described above, we make some stylized assumptions about DT impacts. The dashed 45-‐degree line in Figure 4 simply graphs yields under the traditional technology as a function of itself. The solid displays our assumptions about DT. As can be seen, we assume that for moderate drought pressure, DT stabilizes yields at nearly their long-‐term expected average even as yields under the traditional technology drop to 85% of that average (there is a 15% probability that yields will fall in this range). As drought pressure increases, and traditional yields fall from 85% to 65% of their long-‐term average), DT yields also begin to slowly decline. However, we assume that DT maintains a 20% yield advantage, compared to non-‐DT seeds, over this range (there is a 20% probability that drought pressure and yields will fall in this range). As drought pressure further increases and yields fall to 45% of their long-‐term average (a 10% probability), we assume that the advantages of DT disappear and that DT yields become identical to traditional yields over the lowest 5% tail of the probability distribution. In summary, we assume that DT affords modest to strong yield advantages 90% of the time under unfavorable conditions. 11 The data come from the annual ESPAC survey collected by the Ministry of Agriculture. More details on the survey can be found in Castillo et al. (2012).

Lybbert and Carter “Bundling Drought Tolerance & Drought Index Insurance” April 2013
10
We consider two stylized index insurance contracts. The first has a ‘strike point’ when yields reach 85% of their long-‐term average. Under this contract, farmers are compensated dollar-‐for-‐dollar for every loss in area yield that occurs beyond this point. Under this high strike contract, farmer would never receive less than the value of 85% of their long-‐term mean yield, less the cost of the premium. Similarly, we consider a lower strike point contract that pays off when yields fall below 65% of their long-‐term average, stabilizing farm incomes at those that would be realized under these conditions. This second, lower strike point has been selected to correspond with drought pressure levels when DT seeds begin to lose their efficacy.
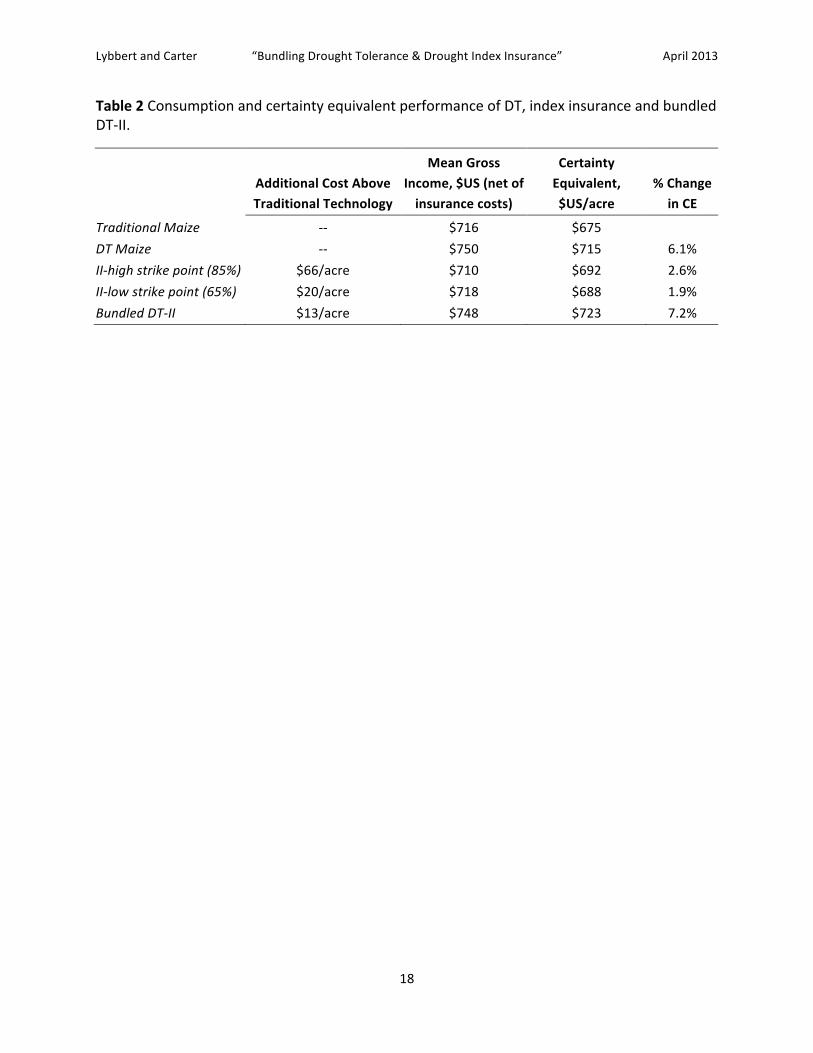
Table 2 and Figure 5 compare these alternative agronomic and financial technologies. Using the current market value of maize in Ecuador, we calculate all figures in US dollars. Traditional maize returns an average gross income of $716/acre, whereas DT varieties under our assumptions would return $750.12 While this is a modest increase, DT also has a substantial impact on risk. Figure 5 illustrates gross incomes under traditional (green solid line) and DT technologies (blue dashed line) as a function of drought pressure. To value this change in risk, we calculate the certainty equivalent of the gross income streams implied by the two technologies. For this calculation, we assume that individuals’ preferences can be characterized by a constant relative risk aversion utility function, with a coefficient of relative risk aversion of 1.1. As reported in Table 2, the certainty equivalent of the DT technology is 6.1% higher than that of the traditional technology ($715 versus $675/acre).
Table 2 also reports the certainty equivalent value of stand-‐along index insurance that is introduced to farmers using the traditional technology. The high strike point contract would cost $66 per-‐acre and of modestly reduces expected gross income as the insurance is priced at 20% above actuarially fair. However, even with this mark-‐up, this insurance would increase the certainty equivalence by almost 3%. The low strike point contract, when introduced with the traditional technology costs $20/acre and increases certainty equivalence by about 2%.
As the comparison between the two index insurance contracts makes clear, farmers would clearly value the additional stabilization of yields provided by the higher strike point contract. However, can this additional stabilization be provided more efficiently by DT seeds rather than by a high strike point insurance contract? Similarly, the certainty equivalence of DT technology is reduced by the fact that the technology fails under extreme conditions. Can the additional stabilization provided by a low strike point contract offer substantial additional value to the risk averse farmer?
The final row in Table 2 addresses these questions. For the analysis, we assume that the low strike contract is calibrated to DT yields. That is, the contract only begins to pay off when DT yields fall below 65% of the long-‐term average of traditional seeds. The fact that these lower yields are less likely with DT seeds reduces the cost of this insurance from $20 to $13/acre.13 In combination, the DT-‐II bundle yields a gross income function given by the dotted red line in Figure 5. The bundle stabilizes gross farmer income levels under the most extreme conditions. It also reaps the benefits of DT under moderate
12 The proportionate increase in net-‐income would of course be much larger assuming the cost structure of DT and traditional production is identical. 13 Note that this insurance price would further incentivize the adoption of DT varieties.
Lybbert and Carter “Bundling Drought Tolerance & Drought Index Insurance” April 2013
11
drought pressure. As reported in Table 2, the certainty equivalent of the DT-‐II bundle is $723, or 7.2% higher than the certainty equivalent returns of the traditional technology. While it is doubtlessly possible to design more finely tuned packages, this simple example does illustrate the complementarity between DT and II technologies, which is ultimately based on their complementary statistical properties.
5. CONCLUSION
Many of the world’s poor are vulnerable to drought in some way. Climate change adds urgency to alleviating this drought vulnerability, which imposes a serious welfare burden on the poor. While DT and II have attracted substantial attention as stand-‐alone interventions in this regards, we argue that their true potency is likely to emerge only when they are properly bundled. Such a DT-‐II bundle overcomes their stand-‐alone limitations by leveraging a fundamental complementarity between the two. We demonstrate this complementarity conceptually and use maize data from Ecuador to illustrate how a bundled product could look and how it might affect household welfare.
The argument for bundling DT and II rests firmly on the prospective benefits to farm households. Their perspective must remain central to any effort to calibrate and refine a DT-‐II product in practice. How should an II contract be optimized to properly reflect a given DT benefit profile? What information will farmers need about these DT-‐optimized contracts to appreciate the synergies associated with bundled DT-‐II? In contexts where the risk of extreme drought and total crop loss is non-‐trivial, we find the case for bundled DT-‐II to be compelling – but there are several key design and delivery questions that remain. With the expected release of many DT crops in the near future, now is the time to begin exploring these questions.
Lybbert and Carter “Bundling Drought Tolerance & Drought Index Insurance” April 2013
12
Figure 1 Syngenta’s reported results from 2012 on-‐farm trials of their DT maize hybrids for different ‘yield environments’

Lybbert and Carter “Bundling Drought Tolerance & Drought Index Insurance” April 2013
13
Figure 2 Stylized differences in drought severity, drought probabilities and net DT benefits for two hypothetical locations.
0
Moderate Moderate Severe Extreme
0
Lybbert and Carter “Bundling Drought Tolerance & Drought Index Insurance” April 2013
14
Figure 3 Stylized depiction of the complementarity between DT and II.
Drought Pressure Moderate Severe Extreme
0
Bundled
DT-‐II
Drought pdf
Drought Tolerance
Drought Index Insurance
(a)
(b)
Lybbert and Carter “Bundling Drought Tolerance & Drought Index Insurance” April 2013
15
Figure 4 Probability distributions for traditional maize yields in Ecuador and hypothetical DT maize yield differential.

Lybbert and Carter “Bundling Drought Tolerance & Drought Index Insurance” April 2013
16
Figure 5 The performance of bundled DT and insurance in gross farmer income.

Lybbert and Carter “Bundling Drought Tolerance & Drought Index Insurance” April 2013
17
Table 1 Different categories of drought interventions with examples for each
Type of Drought Intervention
Examples
Acute Relief Food aid and humanitarian aid Refugee security and support Cash transfers and vouchers
Agronomic Breeding staple crops for better drought resistance and early maturity Resource conservation practices such as zero tillage and water harvesting Permanent and supplemental irrigation Extension to promote adoption of improved inputs and practices
Financial Income diversification and livelihood support programs Microcredit and savings Insurance
Organizational Cooperatives and producer associations to provide access to inputs and higher value markets Social organizations to provide informal safety nets
Infrastructural & Informational
Improved roads to reduce transport and transactions costs in order to better integrate markets Improved weather information and climate models to provide better daily, weekly and seasonal weather forecasts
Lybbert and Carter “Bundling Drought Tolerance & Drought Index Insurance” April 2013
18
Table 2 Consumption and certainty equivalent performance of DT, index insurance and bundled DT-‐II.
Additional Cost Above Traditional Technology
Mean Gross Income, $US (net of insurance costs)
Certainty Equivalent, $US/acre
% Change in CE
Traditional Maize -‐-‐ $716 $675 DT Maize -‐-‐ $750 $715 6.1%
II-‐high strike point (85%) $66/acre $710 $692 2.6% II-‐low strike point (65%) $20/acre $718 $688 1.9% Bundled DT-‐II $13/acre $748 $723 7.2%
Lybbert and Carter “Bundling Drought Tolerance & Drought Index Insurance” April 2013
19
REFERENCES
Abdoulaye T, Bamire AS, Wiredu AN, Baco MN, Fofana M. Characterization of Maize-‐Producing Communities in Bénin, Ghana, Mali, and Nigeria: West Africa Regional Synthesis Report. Drought Tolerant Maize for Africa (DTMA) Project -‐ Community Surveys. IITA: Ibadan, Nigeria; 2012.
Bellemare MF, Carter MR, Elabed G, Guirkinger C. Managing Basis Risk with Index Insurance: The Case of
West African Cotton Farmers. Working Paper 2012.
Elbers C, Gunning J-‐W, Kinsey B. Growth and Risk: Methodology and Micro Evidence. World Bank
Economic Review 2007;21; 1-‐20.
Eriyagama N, Smakhtin V, Gamage N. Mapping Drought Patterns and Impacts: A Global Perspective.
IWMI Resaerch Report, 133. International Water Management Institute; 2009.
Gurian-‐Sherman D. High and Dry: Why Genetic Engineering Is Not Solving Agriculture's Drought Problem
in a Thirsty World. Union of Concerned Scientists: Cambridge, MA; 2012.
Hazell PB. The Appropriate Role of Agricultural Insurance in Developing Countries. Journal of
International Development 1992;4; 567-‐581.
Hoerling M, Eischeid J, Perlwitz J, Quan XW, Zhang T, Pegion P. On the Increased Frequency of
Mediterranean Drought. Journal of Climate 2011.
Janzen SA, Carter MR. The Impact of Microinsurance on Asset Accumulation and Human Capital
Investments: Evidence from a Drought in Kenya. Working Paper 2012.
Johnstone S, Mazo J. Global Warming and the Arab Spring. Survival 2011;53; 11-‐17.
Karlan D, Osei RD, Osei-‐Akoto I, Udry C. Agricultural Decisions after Relaxing Credit and Risk Constraints.
National Bureau of Economic Research; 2012.
Lybbert T, Bell A. Stochastic Benefit Streams, Learning, and Technology Diffusion: Why Drought
Tolerance Is Not the New Bt. AgBioForum 2010;13.
Makumbi D. Results of the 2011 Regional Trials Coordianted by Cimmyt-‐Kenya. CIMMYT: Nairobi, Kenya;
2012.

Lybbert and Carter “Bundling Drought Tolerance & Drought Index Insurance” April 2013
20
Sainath P. Everybody Loves a Good Drought: Stories from India's Poorest Districts. Penguin Books India; 1996.