bulrom migration (final nov2013) - daily maili.dailymail.co.uk/i/pdf/migrantreport.pdf ·...
TRANSCRIPT

1
Bulgarian and Romanian migration to the South East and UK: profile of A2 migrants and their distribution Report prepared for the South East Strategic Partnership for Migration Dr Christian Nygaard Adam Pasierbek Dr Ellie Francis-Brophy November 2013 International Centre for Housing and Urban Economics, University of Reading, Whiteknights, Reading, Berkshire, RG6 6AH; [email protected]
School of Politics, Economics & International Relations (SPEIR) International Centre for Housing & Urban Economics (ICHUE)

2
TABLE OF CONTENTS
Executive Summary and implications for South East authorities .......................................... 3
Introduction .............................................................................................................................................. 9 Part 1 Profile of A2 Migration .......................................................................................................... 10 Migration flows ............................................................................................................................................. 10 A2 migrant profile ......................................................................................................................................... 14 Demographics and sample descriptives ....................................................................................................... 15 Labour market and economic activity .......................................................................................................... 17 Social security and benefits .......................................................................................................................... 23 Spatial distribution ........................................................................................................................................ 24
Part 2 EU and domestic (England) distribution of A2 migrants ........................................... 27 EU15 distribution of A2 citizens .................................................................................................................... 27 England regional distribution of A2 migrants ............................................................................................... 33
Conclusion .............................................................................................................................................. 35
Appendix A – Selected studies/reports on impacts of A2 transitional controls ............. 37 References .............................................................................................................................................. 40

3
Executive Summary and implications for South East authorities Remit, aim and context of research Migration from Bulgaria and Romania to the UK and South East England has increased consistently from around 2004 – before formal accession to the EU. This study was commissioned by the South East Strategic Partnership for Migration in order to update the profiling of A2 migration to the UK and assist in South East authorities’ planning for the ending of transitional controls on Bulgarian & Romanian nationals’ access to UK labour markets from 1st January 2014. The report consists of two parts:
Part 1: Profile of Bulgarian and Romanian migrants from Annual Population Survey (APS); Part 2: EU 15 and regional distribution across England of A2 migrants.
A key concern for many local authorities in the South East particularly relates to the inflow of Roma community members. Given that the key data sources that this report draws on do not include information to separate out such migrants, no attempt has been made to specifically address Roma migration. As well as responding to economic and network drivers of migration, Roma communities also adjust to discrimination and racism across Europe. For further information on Roma, a recent report by EU Network of Independent Experts on Social Inclusion (Frazer and Marlier 2011) provides a detailed analysis of Roma communities across Europe and public policy specific issues.
HEADLINE FINDINGS
1. In terms of migration from Bulgaria and Romania to the UK the year 2004 stands out; EU wide the rate of A2 migration has declined since 2007 Based on employment level data (LFS, ONS) the flow of Bulgarian and Romanian nationals to the UK changed significantly (increased) in 2004. This coincides with the accession of the A8 countries. Subsequent A2 EU accession does, however, not appear to have affected the rate of A2 employment growth in the UK, which has remained relatively stable since 2004. At the start of 2013 some 140,600 A2 nationals worked in the UK. For comparison, migration to the EU15 increased significantly in 2007, but the rate of A2 population growth in the EU15 has abated subsequently.
2. After London, the South East is a favoured destination for A2 nationals After London, the South East region contains the largest concentration of Bulgarian and Romanian nationals (16%). According to the APS some 70% of A2 nationals live in the South East-London-East Anglia regions. The South East region also accounted for the second highest share of NINO allocations (14%) to A2 nationals in England in 2012/13.
3. Presence of existing A2 communities in the South East will be a continued key pull factor The SE region contains the second highest regional concentration of A2 nationals. In our estimation network effects are the strongest determinant of A2 migrants location decision so existing communities of A2 migrants will attract new arrivals. The South East’s

4
closeness to labour markets in London and East Anglia means that chain and network effects will continue to draw A2s to the South East, even if they are not seeking employment in the SE specifically. Modelling of regional A2 NINO allocations suggests some increase in the share of A2 nationals outside London. The increase in the share of Bulgarian nationals in the South East is somewhat greater than the increase in the share of Romanian nationals. The share of SE NINO allocations to Bulgarian nationals increased from ca. 12% in 2002/03 to 19% in 2011/12; while the share of NINO allocations to Romanian nationals increased from 10% to 12%.
4. High private rental costs are unlikely to be a significant push factor from the South East region Higher South East housing costs are generally compensated through the higher available earnings. However, neither is found to be a significant determinant of A2 distribution across English regions.
5. Commuting from the South East appears higher than for other regions There is some evidence that a greater share of A2 nationals commute from the South East to both London and East Anglia than the other way around. This may be a result of existing A2 communities in the South East attracting new arrivals and the relative ease of connecting to other areas for work.
6. Employment opportunities in the South East are a pull factor Relative to other regions unemployment in the SE is low. Our modelling suggests that A2 migration is greater to regions with a lower unemployment rate. This is particularly the case for Bulgarian nationals who, on average since 2004, have been more highly skilled and earned higher wages. The South East region has an above the English average share of jobs in financial services, construction and caring, leisure and other service occupations that provide employment opportunities, for skilled professionals, skilled trades and lower skilled employment. In addition, the South East has a substantial agricultural industry. More generally, the South East has an above average jobs density; it borders regions (London and South West) where job density also is high; and has the highest share of people employed in the private sector (82.2%) (based on 2011 data, NOMIS latest available).
7. Employment rate of 16-‐64 year old A2s peaked in 2006/07 For the UK as a whole the employment rate of 16-64 year old residents born in Bulgaria and Romania peaked in 2006/07 (4 quarter average 2006/07 approximately 90%) and has subsequently declined (4 quarter average Jul/Sept 2012-Apr/Jun 2013 approximately 75%). The A2 employment rate, however, remains above the UK average.
5
8. Little negative impact on native (UK) unemployment rates From the literature the evidence on the impact of international migration on native (UK) employment and unemployment rates is mixed. Research focusing on A8 migration tends not to find a negative impact on native unemployment levels (MAC 2012). Similarly, sectoral and occupational distribution of A2 migrants may indicate a high degree of complementarity to the UK born workforce. Complementarity and substitutability of labour is not tested in this report. Inference therefore draws on past UK migration research. For the period since 2004 NOMIS data shows an increase in the unemployment rate of UK-born 16-64 year old residents in the South East as well as not UK-born white residents.1 The increase in the latter population is, however, substantially lower than in the UK-born population.
9. A2 nationals provide a supply of labour in a number of sectors and occupations with hard-‐to-‐fill vacancies that are important to the South East’s economic development Most A2 migrants work in the construction sector, real estate and business services and hotels and restaurants (hospitality). These are often sectors with an above average rate of hard-to-fill vacancies. These are also sectors where the South East has an above average English share of employment. A2 migrants are concentrated in skilled trade occupations, but there is also some evidence of an increase in elementary and machine operative occupations amongst A2s arriving since 2007. When examined by years in the UK, there is a declining trend in the share of elementary workers and a corresponding increasing trend in the share of higher (categories 1-4) and skilled trades.
10. The ending of transitional controls may result in some change in the skills level of A2 migrants A2 migrants are relatively young and often better skilled than both A8 migrants and the UK population. However, we found some increase in lower skilled migration in the last couple of years and reduced employment levels over the most recent migration cohort (2007-11). While the complementarity vis-à-vis the British workforce may not significantly affect employment levels in the UK born population – though this will vary across localities – previous migration research shows that new arrivals are more likely to substitute for earlier migration cohorts.
11. Impact on public services in the short-‐run is likely to be limited by the age of A2 arrivals, but existing pressure points are likely to be stretched further Most A2 migrants arrive without infant dependents (<5%) and only some 10% establish families with infant children in the first 1-4 years. However, the proportion of arrivals with children aged 16 or less (includes infants) is higher, approximately a third. In both cases population growth per se will put additional pressure on local authority educational resources. The impacts on maternity wards and infant medical services may thus be muted in the short-term (though where resources are already stretched migration will add to the burden). A more direct and short-term impact is likely in the provision of schooling. 1 Note: Due to changes in ethnicity categories in 2011 the comparison over time is tentative. A2 migrants

6
In line with other studies the report finds that the uptake of benefits in the existing A2 population is low. The propensity to claim state benefits is very low for arrivals since 2004. A somewhat larger proportion of Romanians claim benefits (16%) than Bulgarians (13%), but these are both very low compared to the UK population (40%). The most frequently claimed benefit is Child Tax credit. A change in the profile of A2s arriving may well result in some increases in welfare payments. The report shows that both unemployment level and inactivity rates are higher for post-2007 arrivals.
12. New arrivals do not necessarily imply a similar net increase of migrants Discrepancies between employment levels and NINO allocations suggest that many A2 migrants are temporary residents. Costs and benefits associated with continued in-migration therefore need to allow for a degree of replacing like-for-like. The discrepancy between NINO allocation and employment levels provides a rough indicator of return migration. According to this measure, for every 2 Bulgarian and Romanian nationals in the period 2002-2012, 1 A2 national left the UK.
13. The UK’s share of A2 nationals in the EU15 has remained stable since 2007 The distribution of A2 migrants across the EU15 has remained relatively stable since 2007. The exceptions are Italy (increase) and Spain (decrease). The UK’s share of EU15 A2 migrants is approximately 4%. EU15 modelling suggests continued stability in A2 distribution across Europe after 2013 – assuming that relative labour market opportunities (measured by the unemployment rate) are unchanged across the EU15 in the short term. For the South East this implies that any increase in the flows of A2 migrants is likely to stem primarily from a larger share of the A2 flow to the UK (network and labour market effects), rather than significant changes in the distribution of A2 migrants across EU 15. Estimation of A2 distribution across the EU15 shows that also across EU 15 network effects and relative labour market opportunities are key determinants of migration flows. The strength of network effects is likely to constitute a stabilizing effect on A2 migration flows post 2013. A2 labour market transitional controls are not found to significantly affect the distribution of Bulgarian and Romanian nationals across the EU15. Untested is, however, whether labour market restrictions have affected the profile of A2 migrants. If UK unemployment falls relative to other EU15 countries, and especially relative to Spain and Italy, then our modelling suggests an increase in the share of A2 migrants coming to the UK. Importantly, transitional controls will not only be lifted in the UK, but across the EU15 and this may have an additional stabilising impact on the UK’s share of A2 migrants if relative economic conditions change.
14. Issues for South East authorities to consider Net international migration has over the past two decades accounted for almost 50% of the UK’s population growth and is projected to account for some two-thirds of population growth until 2035 (Cangiano 2012). In a number of localities the rate of net international migration during the 1990s/2000s led to a discrepancy between resident-population estimates and actual populations with negative consequences for local authority finances. Continued population growth (natural and migration) will result in further
7
demand on public services (such as schooling) and the availability of housing or land for house building. Beyond such population growth, a key issue for South East authorities to consider is the impact of a change in the socio-economic, specifically skills levels of A2 migrants, following the ending of transitional arrangements. If the A8 experience is taken as indicative then the ending of transitional arrangements may result in a greater share of lower skilled migrants. This report finds some evidence of an increase in such migration, but cannot draw firm conclusions. The below points are speculative and raised as points to be considered in planning.
Ø Given the age and employment rate of A2 migrants the fiscal impact of additional arrivals is likely to be net positive. However, the distribution of benefits and costs is uneven with income taxes collected by Treasury and some welfare payments coming out of local budgets. Local taxes (such as council tax) are only likely to make a significant contribution to local budgets if house building is expanded to accommodate additional migrants (assuming net migrant population growth) or if empty dwellings are brought back into regular use. Where migrants live in houses of multiple-occupancy or makeshift accommodation arrangements no additional council tax is likely;
Ø A2 migrants constitute an important source of labour in a number of employment sectors that report hard-to-fill vacancies and will likely continue to do so. However, the effect of the ending of the SAWS scheme on labour supply in the agricultural sector is as yet unknown. The literature generally finds little evidence that migration from Eastern Europe has significantly reduced the employment levels of native UK residents. One reason for this may be that such migration has complemented rather than significantly substituted for native UK labour. Nevertheless, NOMIS data also suggests that since 2004 the employment rate of UK-born 16-64 year old residents in the South East has fallen somewhat whereas that of not UK-born other white residents has increased somewhat. At local levels such effects may very well be more pronounced and contribute to an uneven geography of those who benefit and lose as a result of A2 migration;
Ø Lower-skilled A2 migration may constitute a more direct substitute for existing lower-skilled migrants from A8 and other countries. This could lead to an increase in the rate of A8 return migration, but may also lead to greater inter-community competition and, potentially, negatively affect social cohesion. The latter is more likely where the rate of return migration does not increase;
Ø Any impact on existing migrant communities, in particular A8 migrants, may affect welfare budgets and consumption of public services in affected communities;
Ø Where continued (and lower skilled) A2 migration leads to higher return migration in other migrant communities the net gain from A2 migration may be reduced. In a worst-case scenario where A2 migrants were to replace A8 or other temporary migrants at lower wages (worst case) there could be a net income loss.

8
Data source and robustness Analysis is only as good as the data that it draws on. While noise and data inconsistencies generally tend to disappear in large samples they can have very significant impact on analysis when considering sub-‐population or small samples. The key data sources in this report are the Annual Population Survey (APS), Eurostat /Labour Force Surveys and National Insurance Number allocations. At various points in the report caution is expressed regarding the data at single points in time and data over time. Generally, the greater the number of cells per table in this report the smaller the associated number of observations behind the report percentages. In line with the license agreement no cells are based on less than 5 observations, but it remains the case that small numbers are likely to cause volatility over time that make it more difficult to robustly generalize trends. The definition of what constitutes a migrant is not consistent throughout this report. In the APS analysis migration status is based on country of birth. In the EU/LFS analysis migration is based on citizenship. NINO data is based on nationality. For some countries these distinctions make little difference – for others the differences are very large and often reflect historic links and relations that are not easily captured in the analysis. For instance, according to Eurostat data there were 272 thousand A2 residents in Germany according to citizenship, but 1,953 thousand A2 residents according to country of birth. While caution is expressed a number of times throughout the report this has not been done for each table. The reader is therefore reminded that migration research often draws on small sample data and that, at smaller spatial scales, such data becomes more volatile and less robust.

9
Introduction Bulgaria and Romania joined the European Union in 2007. Unlike the earlier accession of Eastern European countries (A8) in 2004 significant restrictions were place on A2 citizens’ access to basic EU benefits and rights. In the UK these restrictions included access to: labour markets, social housing and a number of social security benefits. These restrictions were imposed on A2 migrants, in part, in response to the significant under-estimation of migration from Eastern Europe to Western Europe following accession to the EU. Across the EU Bulgarian and Romanian accession was staged in three phases: 2007-09 (only Finland and Sweden granted full labour market access); 2009-2012/13 (simplifications or full access introduced across EU15 except UK, Ireland and Germany). The effect of A8 East-West migration was particularly felt in the UK, which was one of only a small number of countries that placed little transitional restrictions on the new EU members. Between 2001 and 2012 close to a million people born in the A8 countries settled in the UK (ONS 2013). With the ending of transitional arrangements for Bulgarians and Romanians on 31 December 2013 there is a concern that flows of migrants to the UK may once again significantly increase. Moreover, there is a concern at Local Authority level that a significant influx of migrants may further stretch public funds and resources with a detrimental impact on the quality of services and the ability of Local Authorities to meet statutory requirements. Estimates of number of A2-migrants post 2013 vary substantially. It is, on the whole, impossible to firmly predict the flow of new arrivals. Standard models of international migration can reasonably inform us about the longer-term trends in aggregated migration flows from lower income/less developed countries or crisis stricken countries to higher income/more developed countries, but are less well suited to inform us of flows from individual countries to specific destination countries. For instance, standard wage-differential and return to human capital models of international migration would, as also shown in the data, suggest a net outflow from Bulgaria and Romania to Western Europe. However, wage differentials or return to human capital across the potential destination countries in Western Europe are unlikely to be significant enough to allow for accurate prediction of destination. Chain, network or gravity models of migration further suggest that the concentration of migrant communities in potential destination countries determine future flow. Existing concentrations of migrant thus often embody historical, cultural and political institutions. As well as determining flows between countries existing concentrations of migrants also determine the within distribution of new migrants. In the UK flows of new migrants have been relatively stable in their regional distribution for most migrant communities. However, a notable exception to this pattern was A8 migration after 2004. One explanation for this divergence may be due to the low concentration of A8 migrants prior to EU accession. That is, pre-accession Polish and other A8 communities in the UK were often the results of political forces unrelated to migration flows in the 2000s and often too small to exert gravitational pull or provide the transaction costs reducing benefits of
10
migrant communities. It is therefore notable that A8 migration to the UK was more regional dispersed than many other groups of migrants. This report is divided into 2 parts. Part 1 profiles recent A2 migration and migrants to the UK. Key issues considered in this part are recent flows and the extent to which 2014 can be expected to constitute a watershed moment like 2004 was for A8 migration. Secondly, profiling of A2 migrants is intended to assist South East local authorities to prepare for the ending of transitional arrangements when considering impacts on public policy/service delivery. Part 2 focuses on the EU15 and English distribution of recent A2 migration. This part does not attempt to estimate an expected number of new arrivals, but rather attempts to estimate the impact of an end to transitional arrangements on the distribution of A2 migrants across key EU member states. Secondly, it models the regional distribution of A2 migrants across English regions. Appendix A summarises key findings from the Migration Advisory Committee and NIESR on the impact of ending transitional arrangements. Part 1 draws on the Annual Population Survey (APS) and examines the socio-economic profile of A2 migrants according to migration cohort and years of residency in the UK. Part 2 uses EU15 labour force survey data and national insurance number (NINO) allocation data to analyse the distribution of A2 migrants across the EU15 and English regions. After London, the South East region contains the largest concentration of Bulgarian and Romanian nationals. No attempt is made to specifically estimate the number of A2 nationals that will arrive following the lifting of transitional arrangements. Migration flows are determined by a range of factors and, beyond year-to-year fluctuations (and measurement fluctuations), are likely to be determined by relative opportunities in different countries. One such opportunity is the ending of transitional regimes, but different institutional and historic factors across the EU can only imperfectly be captured. It is therefore beyond the scope of this study to forecast economic and relative opportunities for the EU15 countries considered in the report and Bulgaria and Romania. However, an attempt is made to evaluate theoretical drivers of migration and distribution of past A2 migration and relate this to their socio-economic profile. Section 2 therefore estimates the distribution of A2 migrants since 2007.
Part 1 Profile of A2 Migration
Migration flows Migration data in the UK is fraught with uncertainty. There is no single authoritative source of immigration and emigration statistics. While some of the data deficiencies are reduced with respect to aggregate flows they become magnified when looking at regional or sub-regional level. The primary source of long-term migration to the UK is the International Passenger Survey (IPS) augmented for Irish flows, asylum seekers and individuals who switch

11
migration/duration intentions. At the regional and sub-regional level the Labour Force Survey is used for calibration of spatial distribution (ONS n.d.). Figure 1 and 2 shows estimates of in, out and net migration flows for Bulgarian (panel 1) and Romanian (panel 2) nationals. Figure 1 In, out and net migration from Bulgaria and Romania to the UK 2000-2011 (‘000s)
Source: ONS 2013. Note: figures are in thousands; vertical dashed line indicates EU accession year. Unsurprisingly the number of Bulgarian migrants is lower than the number of Romanian migrants – Bulgaria’s population is 7.4 million versus Romania’s population of 20 million. In terms of net migration to the UK over the period 2000-2011 the ONS estimates that some 15,000 and 32,000 persons migrated from Bulgaria and Romania, respectively, to the UK. The net migration rate over the entire period was thus 2 per 1000 and 1.6 per 1000 residents from Bulgaria and Romania, respectively (based on 2011 population figures for each country). Figure 1 panel 1 shows that Bulgarian net migration to the UK has fluctuated relatively little since 2002 with an average net migration of some 2,000 people per annum. While the year-to-year rates have been somewhat more volatile since 2007 the significant shift appears to have occurred in 2002. The trend is somewhat different for Romanian migrants. Figure 1 panel 2 shows a significant increase in net migration from Romania following accession to he EU in 2007. The trend has, however, been reducing since 2009. An alternative approach to analyzing A2 migration to the UK is to look at employment levels by country of birth. Unlike A8 migration, especially migration from Poland, which particularly accelerated upon EU accession in 2004 (ONS 2011), migration from Bulgaria and Romania started accelerating prior to their countries’ EU accession and at the same time as A8 migration. Not withstanding restrictions on access to labour markets in the UK significant numbers of A2 citizens have already relocated to the UK. This does, of course, not mean that a change in the migration regime at the end of 2013 cannot result in an additional increase in the numbers of A2 migrants, but it may suggests that the restrictions in place since 2007 have not constituted a significant barrier to relocation to the UK or finding employment and therefore not substantively affected the distribution of A2 nationals across Europe. The exemption of self-employment from
05
10
20072000 2005 2010Year
Net Bulgarian Bulgarian InBulgarian out
02
46
810
20072000 2005 2010Year
Net Romanian Romanian inRomanian out

12
transitional restrictions is a likely explanation for this weak regulatory deterrent effect. These trends are shown in Figure 2 panel 1 which shows employment levels for residents in the UK aged 16 and above for A8 and A2 country of birth. Figure 2 Employment level by country of birth 1997-2013, ‘000s (panel 1) and Q1 2001=100 (panel 2)
Source: LFS/ONS. Note: Vertical dashed lines indicates EU accession years. Figure 2 panel 1 shows the dramatic increase in employment levels from A8 countries post EU accession in 2004. However, Figure 2 panel 2 shows that the rate of growth for A2-migrants post 2004 was almost comparable to that of A8 migrants following A8 EU accession and has been greater than that of A8 migrants since 2009. The greater seasonality in the A2 employment data likely reflects the impact of SAWS migration. In terms of rate of employment growth this has remained largely stable since 2004 with little apparent acceleration or deceleration over the period. Notably, A2 migrants’ employment rights remained curtailed post 2007 and were required to obtain an accession worker card (some highly skilled migrants and the quota restricted Seasonal Agricultural Workers Scheme migrants were exempted). A2 migrants then qualified for the full movement rights as workers under EU law upon completion of 12 continuous months employment with an accession worker card (UKBA/Home Office). The SAWS scheme only runs for 6 months and did therefore, in principle, not provide a bridging arrangement to full labour market access. Overall employment of Bulgarians and Romanians increased from 5,924 workers in the first quarter of 2001 to 140,640 workers in the second quarter of 2013 – a 22 fold rise in employment level. For comparison the increase in A8 employment level of the same period was 17 fold. The extent to which transitional arrangements constituted a de facto barrier to migration or employment in the UK is likely to have been weakened by the exemption from transitional controls for self-employed migrants. As shows below, almost 50% of A2 nationals are self-employed. Notwithstanding the large increase in employment levels to date the employment level is likely to continue to increase after restrictions are lifted at the end of 2013. This does not necessarily imply acceleration in the number of new A2 arrivals – though some increase can be expected if the UK’s economic conditions improve relative to the EU15 (see Part 2) – but will also reflect that many Bulgarians and Romanians are already present in the UK and will be in a position to formalize their labour market attachment.
020
040
060
080
0
1997q1 2001q1 2005q1 2009q1 2013q1time
A8 employment level A2 employment level
050
010
0015
0020
0025
00
Em
ploy
men
t ind
ex (Q
1 20
01=1
00)
1997q1 2001q1 2005q1 2009q1 2013q1time
A8 employment index A2 employment index

13
Figure 3 portrays a somewhat different picture with respect to A2 accession. Here is shown the cumulative stock of NINO allocations to A2 migrants (panel 1) and quarterly allocations (panel 2). Unlike the employment level data there is a clear shift in the data series around the time of accession – the level of NINO holders increases sharply (panel 1). However, when looking at quarterly allocations (panel 2) the rate of allocations to Bulgarian migrants appears to have slowed down after 2008 – though the same is not the case for Romanian migrants. Notably, the number of Seasonal Agricultural Worker Scheme entrants doubled from some 8,000 in 2007 to 16,000 in 2008 before rising to and average of 20,000. Figure 3 NINO registration A2 nationals 2002-2012, cumulative (panel1) and quarterly (panel 2)
Source: DWP. Unlike the employment level data, however, NINO data does not provide robust information on A2 stock as records are not deleted if a migrant leaves the UK. Given high economic activity rates amongst A2 migrants (see below) the discrepancy between the two series in Jan-Mar 2012 (NINO) and Apr-Jun 2012 (employment level; allowing for a lag in finding employment) provides as crude measure of A2 temporary employment in the UK. Between Jan-Mar 2002 and 2012 some 210,000 NINOs were allocated to A2 nationals. Over the same period the level of A2 nationals employed in the UK increased by 98,300. The discrepancy suggests that roughly half (53.2%) of A2 nationals obtaining a NINO over this period left regular employment. Figure 3 panel 2 is, however, a better indicator of A2 migrants entering the regular labour market. Both employed and self-employed migrants require national insurance registration and the series is therefore likely to provide a reasonably accurate measure of the impact of EU accession in 2007. However, the series does not provide an accurate measure of new A2 migrants as it is likely to cover both those and regularization of A2 migrants arrived prior to 2007 exercising treaty rights.
050
100
150
Thousand
2002q1 2004q3 2007q1 2009q3 2012q1
Bulgaria Romania
02
46
8
Thousand
2002q1 2004q3 2007q1 2009q3 2012q1
Bulgaria Romania

14
A2 migrant profile A key concern around migration levels is the impact on labour market public services and communities. In this section the Annual Population Survey (APS) is used to profile migrants from Bulgaria and Romania in the 2000s.2 The comparison is divided into three periods ‘pre-2004’, ‘A8 EU accession 2004-2006’ and ‘A2 EU accession 2007 and later’. The profiling of A2 migrants is intended to provide local authorities with an understanding of the likely labour market, public service and benefits impact of A2 migration. A number of recent studies are concerned with the analysis of migration impacts on labour markets (MAC 2012, Nickell and Salaheen 2008, Manacorda et al 2006, Hatton and Tani 2003, Giulietti 2009). Overall the results from these studies find a negligible impact on average wages, but with some impact at the two tails of the income distribution. Manacorda et al (2009) find some evidence that migration negatively affects the income of other migrant groups as opposed to native British workers. This suggests that migrant labour complements rather than substitutes for native labour, but not necessarily other migrant labour (Giulietti 2009). With respect to A8 migration there is little evidence that this has affected native unemployment rates; although Dustmann et al (2005) find some evidence that total migration may have led to a small increase in unemployment for natives with intermediate qualifications. NOMIS data for the South East suggests that over the period 2004-2011 the employment rate of UK born 16-64 year old residents fell somewhat whereas that of non-UK born other white residents increased somewhat.3 At local levels such effects may very well be more pronounced and contribute to an uneven geography of those who benefit and lose as a result of A2 migration. The National Institute of Economic and Social Research (NIESR 2011, in MAC 2012) estimated the monetary impact of Tier 1 and Tier 2 migration on the consumption of public services (education, health and other personal services). For each of the services the report found that the consumption value was less than that for the resident non-migrant population. The key reason for this is the age and demographic characteristic of migrants (i.e. younger and less established then resident non-migrant households). Estimates by Dustmanm and Frattini (2013) suggest that recent arrivals (post 2000) from the European Economic Area have made a net positive fiscal contribution to the UK. While many of the negative impacts discussed in public and political discourse pertaining to migrants are difficult to evidence with real data, it is also clear that an increase in population – whether due to natural causes or migration – will result in adjustments at community and local authority level. Local Authorities, in particular, are concerned with the impact that additional migrant residents may have in terms of school place provision, health provision, A&E provision as well as other public services. The analysis in this section therefore provides a profile of recent migrants with respect to their age and demographic profile, labour market connections and social security benefits. While a profile of this type gives an indication of the kinds of people that are more likely to arrive in the coming years, it is also clear that certain aspects of the profile – for instance
2 Special License access was obtained for the identification of Bulgarian and Romanian respondents and additional geographic information. 3 Due to changes in ethnicity categories in 2011 the comparison over time is tentative.

15
receipts of social security benefits – are institutionally determined and are set to change with the end of transitional arrangements. Moreover, as with much migration research, national surveys, such as the APS, often only include small numbers of migrants. The methodology for collecting the data often means that migrants in less well regulated housing circumstances (tied accommodation, multiple occupancy, informal accommodation arrangements) are undercounted. Given the restrictions placed upon A2 migrants until the end of 2013 it is likely that this undercounting is particularly relevant for A2 migrants. Also, small numbers increase the volatility of trends and increase the average impact of what might otherwise be outliers.
Demographics and sample descriptives Figure 4 shows the distribution of arrival years for Bulgarian and Romanian born residents in the UK based on APS data from 2005-2012. Figure 4 Year of arrival Bulgarian and Romanian residents in the UK, APS
Source: APS various 2005-2012. Note: the data point entry for 1989 is the sum of all A2 respondents arriving prior to 1990.
Until 2009 the trends in the arrival years is similar to the IPS data for both groups. Post-2009 Bulgarian arrivals do, however, taper off more strongly than the IPS data in Figure 1. Part of the reason for this may be that very recent arrivals are the most likely to be undercounted in the APS. Altogether some 2,169 respondents born in the A2 countries are identified in calendar versions of the APS. Roughly 1/3 of these arrived prior to A8 EU accession, a fifth arrived between 2004-2006 and just under half arrived after 2007. Table 1 summarises the age distribution of the different arrival cohorts. Adjusted for the average difference between the three arrival cohorts the final row in Table 1 shows that the median age (mid 20s) for A2 migrants has remained largely constant. More than half of the pooled (2005-2012) migrants are in the age groups 20-35. Rolfe et al (2013) surmise that the demographic profile of A2 migrants might follow that found for A8 in the
010
020
030
040
0
Pre
199
019
9019
9119
9219
9319
9419
9519
9619
9719
9819
9920
0020
0120
0220
0320
0420
0520
0620
0720
0820
0920
1020
1120
12
Bulgarians APS Romanians APS
16
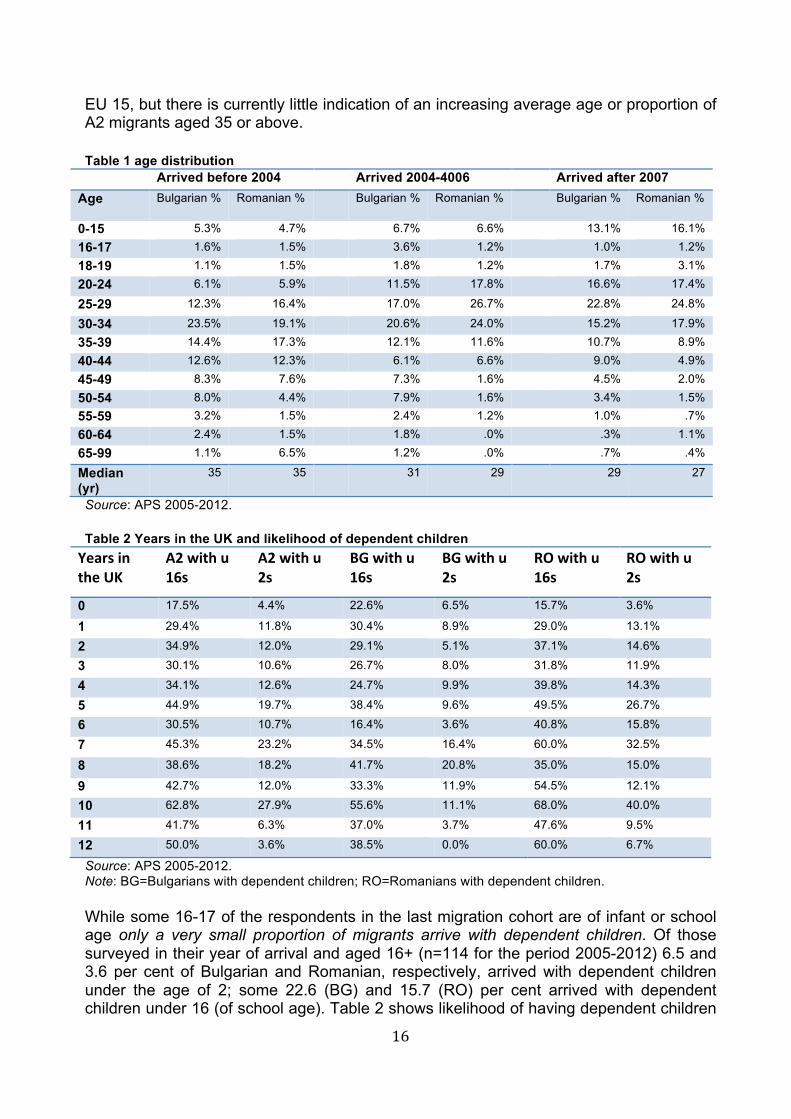
EU 15, but there is currently little indication of an increasing average age or proportion of A2 migrants aged 35 or above.
Table 1 age distribution
Arrived before 2004 Arrived 2004-4006 Arrived after 2007 Age Bulgarian % Romanian % Bulgarian % Romanian % Bulgarian % Romanian %
0-15 5.3% 4.7% 6.7% 6.6% 13.1% 16.1% 16-17 1.6% 1.5% 3.6% 1.2% 1.0% 1.2% 18-19 1.1% 1.5% 1.8% 1.2% 1.7% 3.1% 20-24 6.1% 5.9% 11.5% 17.8% 16.6% 17.4%
25-29 12.3% 16.4% 17.0% 26.7% 22.8% 24.8%
30-34 23.5% 19.1% 20.6% 24.0% 15.2% 17.9% 35-39 14.4% 17.3% 12.1% 11.6% 10.7% 8.9% 40-44 12.6% 12.3% 6.1% 6.6% 9.0% 4.9% 45-49 8.3% 7.6% 7.3% 1.6% 4.5% 2.0% 50-54 8.0% 4.4% 7.9% 1.6% 3.4% 1.5% 55-59 3.2% 1.5% 2.4% 1.2% 1.0% .7% 60-64 2.4% 1.5% 1.8% .0% .3% 1.1% 65-99 1.1% 6.5% 1.2% .0% .7% .4%
Median (yr)
35 35 31 29 29 27
Source: APS 2005-2012. Table 2 Years in the UK and likelihood of dependent children Years in the UK
A2 with u 16s
A2 with u 2s
BG with u 16s
BG with u 2s
RO with u 16s
RO with u 2s
0 17.5% 4.4% 22.6% 6.5% 15.7% 3.6%
1 29.4% 11.8% 30.4% 8.9% 29.0% 13.1%
2 34.9% 12.0% 29.1% 5.1% 37.1% 14.6%
3 30.1% 10.6% 26.7% 8.0% 31.8% 11.9%
4 34.1% 12.6% 24.7% 9.9% 39.8% 14.3%
5 44.9% 19.7% 38.4% 9.6% 49.5% 26.7%
6 30.5% 10.7% 16.4% 3.6% 40.8% 15.8%
7 45.3% 23.2% 34.5% 16.4% 60.0% 32.5%
8 38.6% 18.2% 41.7% 20.8% 35.0% 15.0%
9 42.7% 12.0% 33.3% 11.9% 54.5% 12.1%
10 62.8% 27.9% 55.6% 11.1% 68.0% 40.0%
11 41.7% 6.3% 37.0% 3.7% 47.6% 9.5%
12 50.0% 3.6% 38.5% 0.0% 60.0% 6.7%
Source: APS 2005-2012. Note: BG=Bulgarians with dependent children; RO=Romanians with dependent children. While some 16-17 of the respondents in the last migration cohort are of infant or school age only a very small proportion of migrants arrive with dependent children. Of those surveyed in their year of arrival and aged 16+ (n=114 for the period 2005-2012) 6.5 and 3.6 per cent of Bulgarian and Romanian, respectively, arrived with dependent children under the age of 2; some 22.6 (BG) and 15.7 (RO) per cent arrived with dependent children under 16 (of school age). Table 2 shows likelihood of having dependent children

17
(under 16 and under 2) by years in the UK. While most A2 migrants arrive with no dependent children (infants) some 10-12 per cent are likely to have infant dependents within the first 1-4 years of living in the UK. After 5-10 years in the UK some 12-20 per cent of respondents are likely to have infant dependents. Although the numbers in Table 2 suggest that Romanian respondents are more likely to have infant dependents as they remain in the UK, the numbers overall are too small to rigorously conclude this. In terms of gender distribution there is a marginally higher share of female A2 respondents in the APS than male respondents, 53% vs 47%. This gender difference is replicated in each of the arrival cohorts apart from Bulgarians post 2007 where there gender distribution is reversed – 54% vs 46% respectively.
Labour market and economic activity Table 4 details the educational attainment of A2 migrants. Due to small-numbers license related restrictions some of the categories have been merged. Table 3 shows that the proportion of A2 migrants with degree or equivalent is lower in the post-2004 cohorts and also a difference between Bulgarian and Romanian migrants with degree level education. In the post-2007 cohort some 21% of Bulgarian migrants had degree level education compared to 14% for Romanian migrants. At the lower-qualified end the situation is reversed with a larger proportion of Romanian migrants reporting no qualifications. Table 3 Highest educational attainment by arrival cohort Arrived
before 2004 Arrived 2004-‐2006
Arrived after 2007
BG RO BG RO BG RO
Degree or equivalent
25.7% 25.5% 16.8% 12.6% 21.4% 14.3%
Higher education 6.8% 4.9 7.6% 5.2% 2.6% 6.2% GCE A Level or GCSE grades A-C
11.7% 15.4 5.0% 13.1% 9.7% 12.8%
Other qualifications 43.8% 41.3 54.6% 52.4% 52.6% 48.5% No qualification/ DK 12.1% 12.9% 15.9% 15.8% 13.6% 18.2%
Source: APS 2005-2012. Note: DK=Don’t know. A common concern for a range of migrant groups is how well their skills and learned trades (human capital) translate into recognized and accepted forms of UK qualifications. Perhaps unsurprisingly therefore many A2 migrants’ qualifications are classified as ‘other’. The proportion of respondents with no qualifications is comparable for the two EU accession cohorts (2004 and 2007) and marginally above that of A2 migrants arriving before 2004. This can, however, reflect additional attainment by A2 migrants resident since 2004 rather than a qualitative difference in the profile of A2 migrants. Both the ‘other qualification’ and ‘no qualification’ categories decrease with years spent in the UK; conversely the share of A2 migrants with ‘degree’ in particular, but also ‘higher education’ increases with years in the UK. Previous research by Kausar (2011) and MAC (2008) finds that education levels of A2 migrants is somewhat above that of A8 migrants and the UK born when measuring education by ‘age when left full-time education. APS data also shows that Bulgarian migrants tend to have an additional year of schooling/fulltime education compared to Romanian migrants.4 However, this appears particularly the case
4 Primary school age in both countries is 7 years.
18
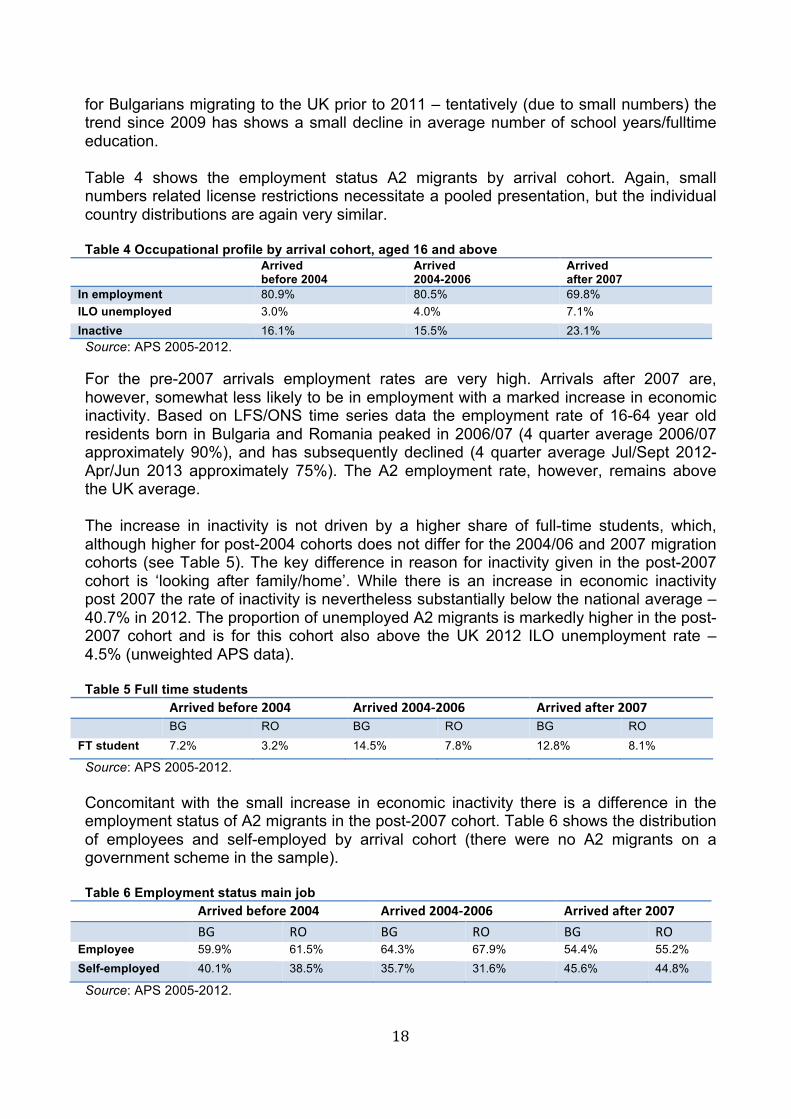
for Bulgarians migrating to the UK prior to 2011 – tentatively (due to small numbers) the trend since 2009 has shows a small decline in average number of school years/fulltime education. Table 4 shows the employment status A2 migrants by arrival cohort. Again, small numbers related license restrictions necessitate a pooled presentation, but the individual country distributions are again very similar. Table 4 Occupational profile by arrival cohort, aged 16 and above Arrived
before 2004 Arrived 2004-2006
Arrived after 2007
In employment 80.9% 80.5% 69.8% ILO unemployed 3.0% 4.0% 7.1% Inactive 16.1% 15.5% 23.1% Source: APS 2005-2012. For the pre-2007 arrivals employment rates are very high. Arrivals after 2007 are, however, somewhat less likely to be in employment with a marked increase in economic inactivity. Based on LFS/ONS time series data the employment rate of 16-64 year old residents born in Bulgaria and Romania peaked in 2006/07 (4 quarter average 2006/07 approximately 90%), and has subsequently declined (4 quarter average Jul/Sept 2012-Apr/Jun 2013 approximately 75%). The A2 employment rate, however, remains above the UK average. The increase in inactivity is not driven by a higher share of full-time students, which, although higher for post-2004 cohorts does not differ for the 2004/06 and 2007 migration cohorts (see Table 5). The key difference in reason for inactivity given in the post-2007 cohort is ‘looking after family/home’. While there is an increase in economic inactivity post 2007 the rate of inactivity is nevertheless substantially below the national average – 40.7% in 2012. The proportion of unemployed A2 migrants is markedly higher in the post-2007 cohort and is for this cohort also above the UK 2012 ILO unemployment rate – 4.5% (unweighted APS data). Table 5 Full time students Arrived before 2004 Arrived 2004-‐2006 Arrived after 2007 BG RO BG RO BG RO FT student 7.2% 3.2% 14.5% 7.8% 12.8% 8.1%
Source: APS 2005-2012. Concomitant with the small increase in economic inactivity there is a difference in the employment status of A2 migrants in the post-2007 cohort. Table 6 shows the distribution of employees and self-employed by arrival cohort (there were no A2 migrants on a government scheme in the sample). Table 6 Employment status main job Arrived before 2004 Arrived 2004-‐2006 Arrived after 2007 BG RO BG RO BG RO Employee 59.9% 61.5% 64.3% 67.9% 54.4% 55.2% Self-employed 40.1% 38.5% 35.7% 31.6% 45.6% 44.8%
Source: APS 2005-2012.

19
Table 6 shows an increase in the share of self-employed workers amongst both Bulgarian and Romanian migrants post 2007. Overall the share of self-employed A2 migrants is substantially above the UK average (15.7% on the above basis). Importantly transitional arrangements are not applicable to self-employed A2 migrants. Differences between the arrival cohorts are thus likely to reflect later cohorts taking advantage of this exception when claiming treaty rights. However, difference may also in part reflect length of engagement with the UK labour market – e.g. starting out as self-employed and over time becoming an employee. Table 7 Employment status main job by year of arrival and years in the UK Year of arrival Self-‐employed % Years in the UK Self-‐employed % Before 2000 33.30% 12+ 29.30%
2001 45.60% 11 28.60%
2002 43.50% 10 45.30%
2003 42.70% 9 38.00%
2004 36.40% 8 40.70%
2005 29.10% 7 41.30%
2006 35.30% 6 41.40%
2007 42.60% 5 38.50%
2008 43.80% 4 45.50%
2009 44.70% 3 41.60%
2010 39.40% 2 40.10%
2011 60.70% 1 40.90%
2012 66.70% 0 37.30%
Source: APS 2005-2012. Note: Due to the pooled nature of the data someone who arrived in 2007 has not automatically lived in the UK for 5 years; length of residence depends on the year they were sampled, e.g. if 2009 then the person has lived in the UK for 2 years. When analyzing employment status by year of arrival there is a declining trend in the self-employed share until 2004. However, when analyzing employment status by years in the UK, there is no longer a clear trend for the first 10 years of residence in the UK. The average self-employment rate in the first 10 years of residence is approximately 40%, whereas it declines to 28 per cent for those who have lived in the UK for more than 10 years. This data is shown in Table 7. While the number of observations is smaller for 2011-12 the most recent arrival cohorts do appear to exhibit a higher self-employment rate than earlier arrivals. When examining the type of self-employment status there is relatively little difference between the 2004-2006 and the post-2007 cohorts. Both cohorts are more likely than pre-2004 arrivals to be ‘working for self’ (67% v 58%) or be agency workers (10-12% v 9%). The change in employment status for later cohorts may be related to difficult employment environment more generally in the UK during this period, but may also reflect a change in the type of qualification that A2 migrants arrive with and their occupational profile. This is explored further in Table 8 and Table 9. Table 8 shows an increase in the share of A2 migrants employed in ‘elementary occupations’ and a small increase in the share of A2 migrants employed as ‘operatives’ of machinery and plants. Compared to the pre-2004 cohort and 2011 census results for England and Wales, A2 migrants arriving after 2004 are less likely to be employed in the 4 highest occupational classifications and more likely to be employed in skilled trades

20
and elementary occupations. Part of the explanation for this is likely to be that skilled employment, to date, is more restricted than self-employment, but may also indicate a degree of upward mobility over time. Table 9 shows the occupational profile by years living in the UK. Table 8 Occupational profile by arrival cohort Arrived
before 2004 Arrived 2004-‐2006
Arrived after 2007
Census 2011 (all UK)
1 Managers and Senior Officials
11.1% 4.4% 3.0% 10.8%
2 Professional occupations 15.2% 4.7% 5.8% 17.4%
3 Associate Professional and Technical
10.7% 6.0% 6.1% 12.7%
4 Administrative and Secretarial
7.2% 5.4% 2.8% 11.4%
5 Skilled Trades Occupations
20.9% 24.7% 20.3% 11.5%
6 Personal Service Occupations
7.8% 17.1% 11.2% 9.4%
7 Sales and Customer Service Occupations
1.8% 4.7% 4.1% 8.4%
8 Process, Plant and Machine Operatives
6.7% 7.9% 9.2% 7.2%
9 Elementary Occupations 18.7% 25.0% 37.5% 11.1%
Source: APS 2005-2012; ONS. Table 9 Occupational profile by years in the UK
Years in the UK
Cat. 1-4 (Managers- admin/secr.)
Cat. 5 (Skilled trades)
Cat. 6 (Personal services)
Cat. 7 & 8 (Sales and operatives)
Cat. 8 (Elementary)
0 13.6% 13.6% 15.3% 6.8% 50.8% 1 14.7% 15.8% 14.7% 12.0% 42.9% 2 24.5% 21.1% 14.8% 12.2% 27.4% 3 19.1% 26.1% 13.0% 13.0% 28.7% 4 21.7% 24.3% 8.5% 15.9% 29.6% 5 23.1% 20.4% 12.9% 12.9% 30.6% 6 29.0% 29.0% 8.3% 11.0% 22.8% 7 27.9% 26.0% 13.5% 11.5% 21.2% 8 29.7% 28.6% 11.0% 8.8% 22.0% 9 46.8% 20.3% 2.5% 11.4% 19.0% 10 56.6% 20.8% 5.7% 5.7% 11.3% Source: APS 2005-2012. When analyzing occupational status by number of years in the UK there is a clear declining trend in the share of elementary workers and a corresponding clear increasing trend in the share of higher (categories 1-4) and skilled trades occupational groups. The large change in occupational category for A2 migrants resident in the UK for over a year is therefore likely to reflect the employment restrictions associated with the transitional arrangements. However, as shown in Table 3, there is potentially some indication of an increased share of unskilled migration post 2007, if accurate this may indicate a change in the occupational profile – and hence labour market impact – of continued A2 migration.

21
A lesson from A8 migration was the changing occupational profile of arrivals between 2004-2006, with an increase in the proportion of A8 migrants in elementary or process operative occupations (MAC 2008). The importance of A2 migration and employment in a range of elementary occupations is, however, also highlighted in MAC (2013) where a concern is raised that the ending of the transitional arrangements and the SAWS arrangements may cause labour supply shortages in a some low-skilled/agricultural activities. A key question regarding the end of transitional arrangements is therefore whether a similar shift in the occupational profile can be expected for A2 migrants and the extent to which A2 migrants compliment or substitute for the resident population. For the latter issue research on average impacts from migration suggests that impact on UK-born employment/unemployment is negligible, but there is some evidence on wage levels of other migrant workers (see MAC 2012 for an overview of these studies). Assuming that A2 migration follows a similar trend then the primary displacement effect, if any, is likely to affect other migrants. Table 10 shows industry of occupation. Due to small-numbers related license restrictions only combined values for Bulgarian and Romanian respondents are shown. Table 10 Sector of employment by migration cohort Arrived
before 2004 Arrived 2004-‐2006
Arrived after 2007
Census 2011
Agriculture, hunting, fishing, mining and quarrying
1.3% 1.3% 2.3% 1.1%
Manufacturing 5.9% 5.4% 9.1% 8.9%
Construction 25.7% 29.2% 22.2% 7.7%
Wholesale, retail and motor services 6.1% 6.7% 7.6% 15.9%
Hotel and restaurant 6.8% 12.7% 13.4% 5.6%
Transport, storage, communication 7.0% 2.2% 5.6% 9.0%
Financial intermediaries 2.6% 1.9% 1.2% 4.3%
Real estate and business services 16.6% 14.0% 17.9% 12.9%
Public administration and defence 1.7% 1.0% 0.5% 6.0%
Education 6.5% 1.3% 1.5% 9.9%
Health and social services 14.0% 17.1% 11.4% 12.5%
Other community services 3.5% 2.9% 2.6% 5.0%
Private HH with employment 2.2% 4.1% 3.5% --
Source: APS 2005-2012. Note: The ‘electricity, gas, water’ and ‘extra-UK’ categories are omitted due to small numbers. Census 2011 provides approximate comparisons to the England and Wales average due to category amalgamations. Real estate and business services is based on an amalgamation of census categories ‘real estate activities’, ‘professional and scientific activities’ and administrative and support services’. Table 10 shows that while a number of A2 migrants work in agriculture this is a relatively small employment category overall. Most A2 migrants work in the construction sector, real estate and business services and hotels and restaurants (hospitality). Employment in these sectors is substantially above the England and Wales 2011 census averages. There is, on the whole, little difference between the different migration cohorts. While

22
numbers are too low to draw a robust conclusion the post-2007 cohort employment in manufacturing exhibits some increase. These sectors of employment are, according to the 2012 Employer Skill Survey (UKCES 2012), sectors with above average levels of vacancies and, in particular, ‘hard-to-fill’ vacancies – both at the low-skilled and skilled level of employment. A number of A2 migrants are also employed in private households (final row of Table 10). Some two-thirds of employers cited lack of adequately skilled applicants – qualifications, experience and attitude – as the key reason for vacancies being hard-to-fill (UKCES 2012). A third of employers cite the low number of applicants and jobs-related issues (such as employment terms and conditions, time of working hours/shift work and location) as reasons for vacancies being hard-to-fill (UKCES 2012). The latter was particularly the case for elementary occupations and related to lack of interest in the offered work, hours of work and motivation/personality of applicant (UKCES 2012). Due to low numbers it is difficult to draw any robust inference with regards to sector of employment by years spent in the UK. From the data (not shown) there appears to be a consistent increase in the proportion of A2 migrants working in the construction sector, but numbers in other sectors are either too low or show no particular trend to allow for further conclusions. Finally, Table 11 shows average gross weekly earnings, hourly pay and hours worked by migration cohort. Table 11 Inflation adjusted earnings by migration cohort Arrived
before 2004 Arrived
2004-‐2006 Arrived after
2007
Bulgarian Romanian Bulgarian Romanian Bulgarian Romanian
Mean
Med
ian
Mean
Med
ian
Mean
Med
ian
Mean
Med
ian
Mean
Med
ian
Mean
Med
ian
Gross weekly pay 405 341 442 369 372 272 303 284 305 232 293 244
Gross hourly pay 10.7 8.6 11.5 9.7 9.2 6.5 7.6 6.5 8.0 5.6 7.5 6.1
Total usual hours in main job
40 40 41 40 41 40 41 40 38 40 38 40
Source: APS 2005-2012. Note: £=2005; respondents aged 16 or above. Table 11 shows a general increase in earnings and hourly pay for Bulgarian and Romanian migrants over time. In terms of hours worked there is less variation with the median hours worked per week at 40 hours. Overall earnings and hourly pay increases substantially by length of residence in the UK. Table 12 shows weekly pay and hourly pay by year of residency in the UK (all figures in constant values £=2005). Other research on migrant pay has found substantial convergence on native pay by length of stay in the UK (Lemos 2011a). Accordingly, Table 12 shows that while many migrants may commence their employment career in lower paid jobs there is upwards mobility with length of residence in the UK. Institutional factors, such as the transitional arrangements,

23
are a likely inhibitor of early mobility. At the same time, the prospect – and likelihood – of increasing earnings generate additional pull factors of migration. Lemos (2011b) also finds that migrants from A8 and A2 countries often experience a positive earnings gap. There is, however, some variation in earnings for Bulgarian and Romanian migrants. While Romanian migrants pre-2004 on average earn more than Bulgarian migrants, this is reversed after 2004. The difference is only weakly significant when comparing average weekly pay, but significant at conventional levels (p <.05) when comparing average hourly pay with Romanian migrants earning an average of £1 less per hour. Differences in pay may reflect differences in education levels (Table 3 and 5). From Table 11 it is also clear that the variation in pay when comparing average and median hourly pay is greater for Bulgarians than for Romanians (median values for Bulgarians post 2004 generally below median values for Romanians, except 2012), which may again reflect a somewhat great diversity in education levels/human capital amongst Bulgarians. Table 12 Inflation adjusted earnings by length of residency Gross weekly pay Gross hourly pay Years in the UK Mean Median Mean Median 0 207 205 5.3 5.4 1 308 237 8.2 5.8 2 331 268 8.3 6.4 3 285 242 7.4 6.1 4 353 260 8.6 6.4 5 328 276 8.4 6.9 6 317 282 8.6 7.4 7 390 319 9.8 7.1 8 355 295 8.8 6.5 9 389 348 9.9 8.6 10 475 450 11.8 11.8 Source: APS 2005-2012. Note: £=2005; respondents aged 16 or above. Compared to APS respondents born in England median hourly pay rates in 2012 for Bulgarians was lower - £10.50 and £9.09, respectively (differences in average hourly pay was less - £0.30). Median hourly pay for Romanians was again below both of these at £7.84. Notably these differences do not control for differences in age – the average/median age of respondents in 2012. The median age of respondents born in England was 43, in Bulgaria 35 and in Romania 33.
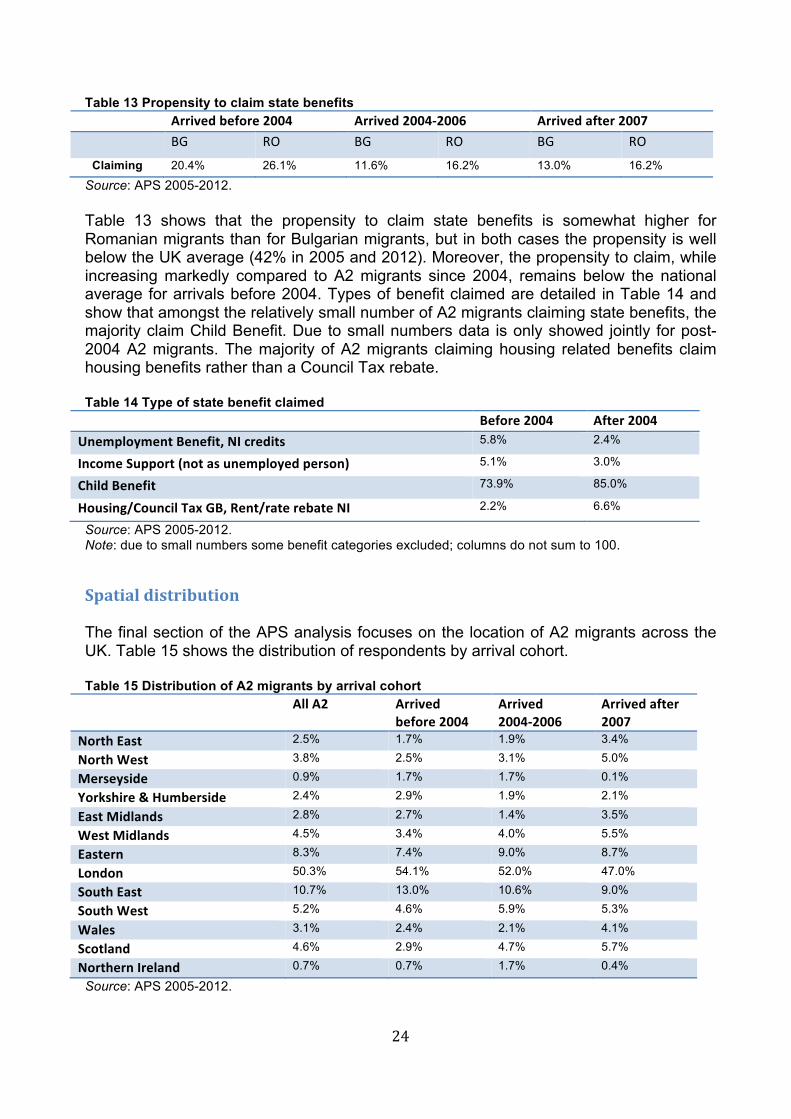
Social security and benefits A key concern for many local authorities is the potential impact of additional A2 migration on public services and resources. This section examines the propensity of current A2 residents to claim benefits. In the demographic section it was already shown that only a very small proportion of A2 migrants arrive with infant dependents, but that some 10-12 per cent were likely to have an infant dependent within 1-4 years of residency; roughly 1/3 of A2 migrants were likely to have dependent of school age within 1-4 years of arrival. Table 13 shows the propensity to claim benefits by migration cohort.
24
Table 13 Propensity to claim state benefits Arrived before 2004 Arrived 2004-‐2006 Arrived after 2007 BG RO BG RO BG RO
Claiming 20.4% 26.1% 11.6% 16.2% 13.0% 16.2%
Source: APS 2005-2012. Table 13 shows that the propensity to claim state benefits is somewhat higher for Romanian migrants than for Bulgarian migrants, but in both cases the propensity is well below the UK average (42% in 2005 and 2012). Moreover, the propensity to claim, while increasing markedly compared to A2 migrants since 2004, remains below the national average for arrivals before 2004. Types of benefit claimed are detailed in Table 14 and show that amongst the relatively small number of A2 migrants claiming state benefits, the majority claim Child Benefit. Due to small numbers data is only showed jointly for post-2004 A2 migrants. The majority of A2 migrants claiming housing related benefits claim housing benefits rather than a Council Tax rebate. Table 14 Type of state benefit claimed Before 2004 After 2004 Unemployment Benefit, NI credits 5.8% 2.4%
Income Support (not as unemployed person) 5.1% 3.0%
Child Benefit 73.9% 85.0%
Housing/Council Tax GB, Rent/rate rebate NI 2.2% 6.6%
Source: APS 2005-2012. Note: due to small numbers some benefit categories excluded; columns do not sum to 100.
Spatial distribution The final section of the APS analysis focuses on the location of A2 migrants across the UK. Table 15 shows the distribution of respondents by arrival cohort. Table 15 Distribution of A2 migrants by arrival cohort All A2 Arrived
before 2004 Arrived 2004-‐2006
Arrived after 2007
North East 2.5% 1.7% 1.9% 3.4%
North West 3.8% 2.5% 3.1% 5.0%
Merseyside 0.9% 1.7% 1.7% 0.1%
Yorkshire & Humberside 2.4% 2.9% 1.9% 2.1%
East Midlands 2.8% 2.7% 1.4% 3.5%
West Midlands 4.5% 3.4% 4.0% 5.5%
Eastern 8.3% 7.4% 9.0% 8.7%
London 50.3% 54.1% 52.0% 47.0%
South East 10.7% 13.0% 10.6% 9.0%
South West 5.2% 4.6% 5.9% 5.3%
Wales 3.1% 2.4% 2.1% 4.1%
Scotland 4.6% 2.9% 4.7% 5.7%
Northern Ireland 0.7% 0.7% 1.7% 0.4%
Source: APS 2005-2012.

25
Table 15 shows the concentration of A2 migrants in London and to a smaller extent the South East. Over the period there also appears to be an increasing dispersion of A2 migrants; while some 54 per cent of pre-2004 migrants are located in London, this share fell to 47 per cent for the post-2007 cohort. Similarly there is a small decline in the proportion of A2 migrants settling in the South East post 2007. The regional distribution portrayed by the APS data differs significantly from that portrayed by NINO allocations data. In part this may reflect small number of APS observations in the most recent years 2011 and 2012. Part 2 analyses the drivers of regional dispersion in further detail based on NINO allocations. Here too there is evidence of a decrease in London’s share of A2 migrants, but not the SE’s share. Employment opportunities in the UK are a key pull factor. According to the latest available NOMIS data (2011) the South East has an above average jobs density; it borders regions (London and South West) where job density also is high; and has the highest share of people employed in the private sector (82.2%). Moreover, it has a greater concentration of micro-employers (1-4) where vacancies, when there are vacancies, are often classified as hard-to-fill. However, accommodation and living costs in this part of the UK are above that of other regions, which might have a centrifugal effect – a potential interpretation of the dispersal trend in Table 15. Table 16 compares the distribution of A2 migrants by area of usual residence and area of work and thus gives an indication of broad-brush commuting trends. Overall, Table 16 shows that East Anglia and inner London attract a greater proportion of workers than residents. For the South East and Outer London these trends are reversed, with more A2 migrants choosing to reside in these regions and work in other regions. For the East, South East and the London economy Table 17 shows the live-work trends. Table 16 Distribution of A2 migrants by region of residence and work Live Work Tyne & Wear 1.1% 1.3%
Rest of Northern region 1.0% 0.9%
South Yorkshire 0.5% 0.5%
West Yorkshire 0.6% 0.6%
Rest of Yorks & Humberside 0.8% 0.8%
East Midlands 3.3% 3.8%
East Anglia 3.4% 8.3%
Inner London 17.0% 29.1%
Outer London 35.6% 21.4%
Rest of South East 16.1% 11.6%
South West 4.9% 5.5%
West Midlands (met county) 1.9% 1.7%
Rest of West Midlands 2.1% 2.6%
Greater Manchester 1.9% 2.1%
Merseyside 0.6% 0.5%
Rest of North West 1.2% 1.5%
Wales 3.0% 2.7%
Strathclyde 1.0% 0.8%
Rest of Scotland 3.1% 3.4%
Northern Ireland 0.8% 0.8%
Source: APS 2005-2012.

26
Table 17 Live-work matrix for A2 migrants in the East, South East and London Work East
Anglia Inner London
Outer London
Rest of South East
Sum
Live
East Anglia 96.0% 0.0% 0.0% 0.0% 96.0%
Inner London 1.6% 83.7% 12.2% 0.4% 98.0%
Outer London 3.3% 38.7% 51.5% 4.1% 97.5%
Rest of South East 21.8% 6.8% 6.0% 62.0% 96.6%
Source: APS 2005-2012. For southern parts of England Table 17 shows that while most A2 migrants who are resident in East Anglia also work in East Anglia. The proportion of A2 migrants working in this region overall is, however, greater with roughly a fifth of A2 migrants resident in the rest of the South East working in East Anglia. A large proportion of A2 migrants living in Outer London commute to Inner London for work – there is, however, relatively little A2 commuting from the London economy to regions outside London. The final column in Table 17 shows that the majority of A2 migrants settled in the 4 regions also work in one of the 4 regions. Overall some 60 per cent of A2 migrants in the pooled APS sample were resident in 39 local authorities. Outside London the top 5 LA areas of residence were Slough, Edinburgh, Peterborough, Luton and Brighton and Hove. Outside London the top 5 LA areas of work were Brighton and Hove, Manchester, Leicester, Birmingham and Plymouth. For the South East Table 18 shows the Local Authorities in the South East with at least a 3.5% share total SE NINO allocation to either Bulgarian or Romanian nationals in 2011/12. Across the South East Bulgarian nationals are more concentrated than Romanian nationals who are more evenly distributed across local authorities (exceptions are listed in Table 18). Table 18 Concentration of A2 nationals in SE local authorities Bulgarian Romanian Medway (3.5%) Portsmouth (6.5%) Portsmouth (3.5%) Slough (3.5%) Wokingham (5.5%) Canterbury (4.6%) Canterbury (6.5%) Maidstone (9.2%) Maidstone (15.4%) Swale (7.4%) Swale (11.4%) Tonbridge and Malling (3.9%) Tonbridge and Malling (4.5%) Waverly (4.0%) Chichester (5.0%) Source: DWP.

27
Part 2 EU and domestic (England) distribution of A2 migrants This part analyses the distribution of A2 nationals across the EU15 countries and English regions.5 The analysis focusing on EU15 distribution is concerned with labour market and migration restriction effects on the distribution of flows.
EU15 distribution of A2 citizens The measure for ease of labour market access follows Holland et al (2011) where a Mobilityindex is generated based on the labour mobility/access in each of the EU15 countries relative to the EU15 average. Countries with labour market restrictions are given a value of -1, countries without labour market restrictions are given a value of 1; country index values are weighted by each respective country’s share in total EU15 population to reflect the capacity of individual countries to absorb higher levels of immigration (Holland et al 2011). In order to account for a number of EU15 countries relaxing restrictions on A2 migration after 2009 (restrictions with simplifications) a modified index is employed in this study. Countries with restrictions with simplification are given a value of 0 and countries where simplifications do (do not) pertain to employment in agriculture and construction are given a value of 0.5 (-0.5). Figure 5 shows the index value for a subset of years. In contrast to the same indicator for A8 migration the UK shows a consistent negative index implying that formal access to UK labour markets is, alongside Germany’s, the most restricted amongst the EU15. The graph also shows the relative attractiveness of Italy and Spain (post 2009) – but also Sweden, Portugal, Greece and to a lesser extent Finland. Sweden and Finland are, perhaps, not generally seen as key destinations for A2 migrants.6 Greater restrictions placed on A2 migrants in the UK, in part, explains the concern that lifting such restrictions will lead to an increasing flow of migrants. In previous research Holland et al (2011) finds that transitional arrangements in other EU15 countries may have diverted some A8 migrants to the UK and Ireland. Table 19 shows the distribution of A2 citizens across the EU15 between 2001 and 2011. The three last rows show the total number (‘000) of A2 residents across EU15 countries, the share of A2 citizens of EU15’s population and an index of A2 citizens living in the EU15 countries (1997=100). The table shows the very high concentration of A2 citizens in Germany at the start of the period. This is in part related to historic links to Transylvania and the Banat, parts of Romania, with a wave of migration from these areas to Germany in 1990-1992 (Suciu 2010). By the time of accession to the EU, however, the share of Romanian citizens in Germany declined to 8.7 per cent. Similar to the UK experience a large increase in A2 migration occurred prior to EU accession.
5 EU15 are: Austria, Belgium, Denmark, Finland, France, Germany, Greece, Ireland, Italy, Luxembourg, Netherlands, Portugal, Spain, Sweden and the UK. 6 However, based on a relatively small sample (n=360) Suciu (2010) shows that in the 1990s a fifth of permanent emigrants from the Banat region in Romania settled in Sweden.

28
Figure 5 Population adjusted mobility index EU2 to EU15
Note: Authors’ calculations. Table 19 Distribution of A2 citizens across EU15, 2001-2011. Row Labels End 2001 End 2006 End 2008 End 2011 Austria 5.7 2.1 1.8 2.0 Belgium 1.2 1.0 1.1 2.1 Denmark 0.4 0.2 0.2 0.5 Finland 0.2 0.1 0.1 0.1 France 3.2 3.8 2.8 3.0 Germany 32.3 8.7 6.8 9.2 Greece 5.1 3.5 3.0 2.8 Ireland 1.3 0.6 0.8 0.5 Italy 23.4 26.3 36.0 38.0 Luxembourg 0.1 0.1 0.1 0.1 Netherlands 0.8 0.4 0.7 0.9 Portugal 2.7 1.1 0.6 0.7 Spain 19.6 48.3 41.4 35.1 Sweden 0.8 0.2 0.4 0.5 UK 3.2 3.6 4.3 4.6 EU2 (000) 26.1 91.8 155.3 197.7 E2 % of EU15 0.10 0.35 0.59 0.74 EU2 Index 157 551 932 1187 Source: Holland et al (2011) for values 2001-2009. Eurostat migr_pop1ctz for 2011 except for Germany, Greece, Luxembourg and Portugal where a weighted average of Q4 2011 and Q1 2012 is calculated from LFS statistics (lfsq_pganws). Note 1: period chosen to approximate population prior to Phase 1 and Phase to of A2 EU accession. The A2 statistics for Portugal differ substantially in different data sources. Note 2: In order to construct a structurally consistent series, reflecting the trend in increases/decreases rather than absolute numbers, LFS a weighted average of Q4 and Q1 from the LFS was used from 2007 onwards. Data is based on citizenship in all cases apart from LFS data, which is nationality based. A comparable series based on country of birth would significantly increase the share of A2 migrants in Germany.

29
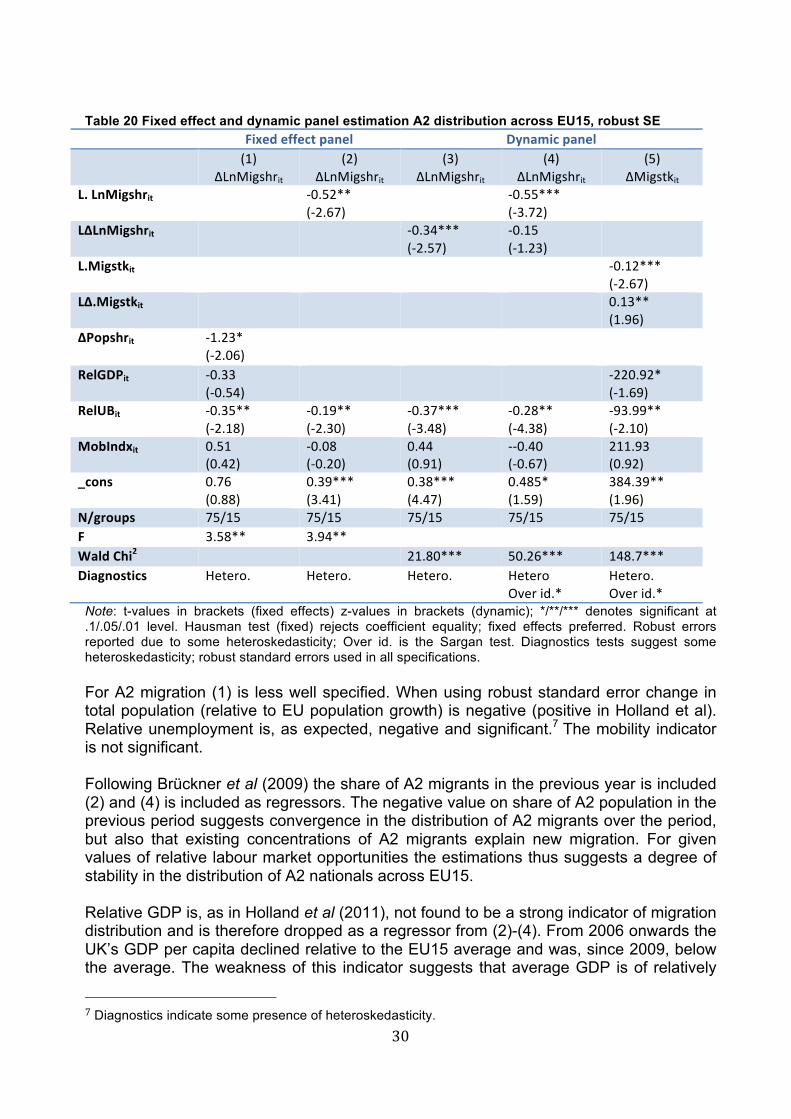
Since 2007 the distribution across the EU15 has remained relatively stable except in the case of Spain and Italy where there was a substantial decline and increase, respectively. For other countries the share of A2 migrants has changed relatively little; for the UK there was a percentage point increase. The increase was somewhat greater in Germany following the financial crisis of 2008/09. Overall the year-on-year rate of growth in the A2 population residing in the EU15 countries peaked in 2003 (at 40%) and 2007 (at 43%); since 2004 the growth rate continually declined – it reached 8.6% in 2011 (Eurostat 2013). Table 20 analyses the distribution of A2 nationals across EU15 from 2007-2011. Estimations are based on fixed effects panel regressions (1-2) and dynamic panel estimations (3-5). The estimation procedure follows earlier studies of A8 migration/distribution in regressing change in the share of migrants across EU15 countries on a set of economic factors as well as past migration (chain/network migration) and labour market institutions (Holland et al 2011, Brückner et al 2009). Labour market restrictions are captured by the Mobilityindex indicator described above. Robust standard errors are used in all estimations. Estimation (1) replicates the specification used in Holland et al 2011 estimating A8 migration. In Holland et al it was found that the share of A8 migration was positively related to the change in population and negatively related to relative unemployment. Countries imposing greater labour market restrictions received a smaller share of A8 migrants. Relative GDP was not found a significant determinant. If the A8 results translate to A2 migration post ending of transitional arrangements, the implication of this would be an increasing share when lifting restrictions.
Table 20 legend: Migshareit: Share of EU15 A2 population residing in country i, end of year; Table 18. Migstkit: Number of A2 citizens residing in country i, end of year; Table 18. Popshrit: Country i's share of EU15 population; Eurostat. RelGDP: GDP per capita in country i relative to EU average; Eurostat. RelUB: Unemployment in country i relative to EU average; Eurostat. Mobindxit: Labour market access relative to EU average; described in text. Ln: Natural log. L.: Lagged operator. Δ.: Delta/change operator.
30
Table 20 Fixed effect and dynamic panel estimation A2 distribution across EU15, robust SE
Fixed effect panel Dynamic panel (1)
ΔLnMigshrit (2)
ΔLnMigshrit (3)
ΔLnMigshrit (4)
ΔLnMigshrit (5)
ΔMigstkit L. LnMigshrit -‐0.52**
(-‐2.67) -‐0.55***
(-‐3.72)
LΔLnMigshrit -‐0.34*** (-‐2.57)
-‐0.15 (-‐1.23)
L.Migstkit -‐0.12*** (-‐2.67)
LΔ.Migstkit 0.13** (1.96)
ΔPopshrit -‐1.23* (-‐2.06)
RelGDPit -‐0.33 (-‐0.54)
-‐220.92* (-‐1.69)
RelUBit -‐0.35** (-‐2.18)
-‐0.19** (-‐2.30)
-‐0.37*** (-‐3.48)
-‐0.28** (-‐4.38)
-‐93.99** (-‐2.10)
MobIndxit 0.51 (0.42)
-‐0.08 (-‐0.20)
0.44 (0.91)
-‐-‐0.40 (-‐0.67)
211.93 (0.92)
_cons 0.76 (0.88)
0.39*** (3.41)
0.38*** (4.47)
0.485* (1.59)
384.39** (1.96)
N/groups 75/15 75/15 75/15 75/15 75/15 F 3.58** 3.94** Wald Chi2 21.80*** 50.26*** 148.7*** Diagnostics Hetero. Hetero. Hetero. Hetero
Over id.* Hetero. Over id.*
Note: t-values in brackets (fixed effects) z-values in brackets (dynamic); */**/*** denotes significant at .1/.05/.01 level. Hausman test (fixed) rejects coefficient equality; fixed effects preferred. Robust errors reported due to some heteroskedasticity; Over id. is the Sargan test. Diagnostics tests suggest some heteroskedasticity; robust standard errors used in all specifications. For A2 migration (1) is less well specified. When using robust standard error change in total population (relative to EU population growth) is negative (positive in Holland et al). Relative unemployment is, as expected, negative and significant.7 The mobility indicator is not significant. Following Brückner et al (2009) the share of A2 migrants in the previous year is included (2) and (4) is included as regressors. The negative value on share of A2 population in the previous period suggests convergence in the distribution of A2 migrants over the period, but also that existing concentrations of A2 migrants explain new migration. For given values of relative labour market opportunities the estimations thus suggests a degree of stability in the distribution of A2 nationals across EU15. Relative GDP is, as in Holland et al (2011), not found to be a strong indicator of migration distribution and is therefore dropped as a regressor from (2)-(4). From 2006 onwards the UK’s GDP per capita declined relative to the EU15 average and was, since 2009, below the average. The weakness of this indicator suggests that average GDP is of relatively
7 Diagnostics indicate some presence of heteroskedasticity.

31
low importance when selecting destination country. The reason for this is likely to be that, compared to Bulgarian and Romanian levels of GDP, all countries in the EU15 are attractive destinations.8 Labour market condition (unemployment), however, is a strong indicator of migration distribution. Countries with above average rates of unemployment attracted smaller shares of new A2 migrants. The effectiveness of institutional labour market restrictions are less clear from these two specifications. In the reported estimation relative attractiveness is not a good indicator of migration shares – Italy and Spain are both found to be attractive, but the share of A2 migrants in the latter continuously declined over the period. However, when using conventional standard errors the Mobility index is positively related to change in the share of A2 migrants. The difference in outcomes raises concerns about the specification. In (3)-(4) the change in the share of A2 migrants in the previous period is included as a determinant. The negative value of the share of A2 migrants (not change in share) remains significant, but the lagged value of the change is only significant when included separately. The UK’s relative unemployment rate was below that of the EU15. The UK would therefore experience a positive increase in its share of A2 migration. Diagnostic tests find no problem with serial correlation, but the Sargan test for instrument validity is weakly significant (p<0.10). In estimation (5) the net change in A2 migrant numbers is the variable to be explained (dependent variable). This specification gives an indication of absolute numbers. The negative coefficient on number of A2 migrants in the previous year again indicates some convergence across the EU15 over this period. Unlike in the share-change regressions, net migration in the previous year is positively related to net migration in the current year. This indicator thus suggests a degree of chain migration. Over the period 1997-2011 the coefficient of variation (CoV) for A2 distribution initially decreased until 2001. Between 2001 and 2007 it again increased as Italy and Spain attracted greater shares. Since 2007 the CoV has decreased again as A2 citizens are becoming more dispersed across the EU15. The Mobility index is again insignificant in the robust specification. Overall the findings in Table 20 suggest that labour market conditions in the form of employment opportunities and chain/network effects are the key determinants of A2 migration. Restrictions on labour market access – at least as applied since 2007/2009 and according to the here employed measure – do not appear independently to have exerted a strong effect. The implication with respect ending of transitional arrangements would be that this institutional change, in isolation, would not have a significant impact on the destination choice of new A2 migrants. In terms of numbers the results can be used for crude estimates of effects if labour market conditions alter. When fitted to past net migration (5) gives a point estimate for relative unemployment in the range 94 (thousands) migrants. The UK’s relative value in 2011 was 0.82 (lower than the EU15 average). Other things equal (e.g. unemployment remains unchanged across other EU15 countries) an improvement in the UK’s
8 The highest relative GDP is found in Luxembourg, Denmark and Sweden.

32
unemployment rate to 7% would reduce this ratio to 0.74. Using the point estimates from Table 20 this would imply a short-run increase in UK net migration from A2 countries of some 7.5 (thousand) additional net migrants; net A2 migration to the UK in 2011 was 16.4 (thousand). A permanent change in relative unemployment rates would, however, have a larger impact. Notably, restrictions are not only being relaxed in the UK, but across the remaining EU15 (where not already done so). Compared to the UK unemployment is lower or similar to the UK’s in a number of other key economies – Germany and Sweden. While it has not been possible, in this study, to disaggregate the country of origin for net migration flows the findings in Table 20 suggest not only flows from Bulgaria and Romania, but also from Spain, Portugal and Greece where unemployment levels currently are high. With respect to the end of transitional agreements at the end of 2012 the estimations suggest a number of implications for A2 migration to the UK.
• The existing concentration of A2 migrants in the UK is, compared to a number of competing destinations, low. Chain and network migration suggests that existing flows/concentrations exert a pull factor even after the initial economic rationale for the early concentration has weakened or diminished. In practice this implies a greater degree of stability in migration flows. Nevertheless, the UK has the 4th highest concentration and may, in combination with other factors, attain a higher level of EU wide concentration.
• Like most EU15 countries the UK has experienced an increase in unemployment since the mid 2000s. However, the UK’s unemployment rate has consistently been below that of the EU15 and has widened since 2008. The estimations in Table 20 find a significant relationship between relative unemployment and share of A2 migrants. If unemployment in countries such as Spain and Greece remains high it is likely that the UK will experience some increase in its share of A2 migrants.
• The two above effects are, however, not greatly affected by formal labour market restrictions on A2 citizens – as measured in this study. In the estimations in Table 20 the Mobility index is not well identified and, frequently, not significant at conventional levels. On this measure there is therefore little evidence that existing restrictions have significantly determined the distribution of A2 migration flows since 2007. In part this is likely to be related to what formally constitute restricted labour market access. For instance, the UK operates agricultural and sectoral schemes that enable A2 migrants to temporarily work in the UK. Over the period in question the SAWS scheme was expanded. However, as shown in part 1 the share of A2 migrants working in agriculture is relatively low. Most A2 migrants in the UK work in ‘construction’, ‘real estate and business services’ and ‘accommodation and catering’. Moreover, nearly half of post-2004 migrants are self-employed. Transitional arrangements do not apply to self-employed A2 migrants. In other words, while labour market access is restricted for employees and the UK has maintain restrictions where other countries have gradually simplified access, self-employed migrants are not restricted in the UK either.
• While transitional restrictions, on the here employed measure, do not appear to have significantly altered the relative distribution of A2 migration the UK can expect continued inflows of A2 migrants. The main conclusion to the drawn from the estimations is therefore that ending of transitional regime is unlikely to alter the recent trend. In recent trends the level of A2 employment in the UK has increased, but the rate of NINO registrations to Romanians has fluctuated around a flat trend

33
and the rate of NINO registrations to Bulgarians has fluctuated around a downward sloping trend.
If recent A2 migration provides a guide to A2 migration in the near future the lifting of transitional arrangements is therefore unlikely to exert a significant independent effect on the distribution of A2 migrants. However, the ending of transitional arrangements may be coinciding with an improving economic outlook and labour market context for the UK that very well might result in an increase in the share of A2 migrants. Moreover, the emerging network of A2 migrants in the UK is likely to additionally exert some pull.
England regional distribution of A2 migrants There are no differences in A2 labour marked access across England. The estimation approach in this section follows the estimation approach for EU15 estimation. Table 20 summarises static and dynamic estimates of regional distribution of A2 migrants for the period 2002-2012. Unlike EU15 analysis, which draws substantively on labour force surveys, the regional distribution analysis is based on NINO allocations in English regions. NINO allocations are examined jointly and separately for the A2 countries. At a regional level LFSAPS data becomes more erratic from year to year due to small sample sizes. However, we reiterate that regional trends differ for APS data and NINO data.
The estimation results again show a degree of convergence over time. The coefficient of variation for A2 population distribution declines over the period from 0.85 to 0.75. This decline is, however, not monotonous and shows considerable re-concentration at the time of EU accession, before again dispersing. This trend is the same for both Bulgarian and Romanian NINO applicants. As with the EU15 analysis regional estimations include past migration (network effects), regional labour market conditions and regional earnings. Overall Table 21 suggests that past migration dominate the regional distribution of A2 nationals. In the fixed effect estimations only the share of A2 migrants, alternatively each of the Bulgarians and Romanians, is significant. The negative coefficient again indicates convergence across the regions. In the dynamic estimations chain migration and network effects are again important determinants. Here the change in the share of A2 migrants is included as an additional regressor and captures momentum in migration flows. The estimations again show convergence across the regions and some momentum in flows (i.e. the share change in the previous period). Unlike the fixed effect estimations the dynamic estimations show some labour market effect. On average regions with higher unemployment are likely to receive a lower share of A2 nationals. This does, however, not appear to be equally true for Bulgarian and Romanians when examined separately.
Table 21 legend: Migshareit: Share of EU15 A2 population residing in region i; APS. RelEarn25it: Region i earnings at the 25th percentile relative to England average;
NOMIS. RelUBit: Region i unemployment relative England average; NOMIS. Ln: Natural log. L.: Lagged operator. Δ.: Delta/change operator.
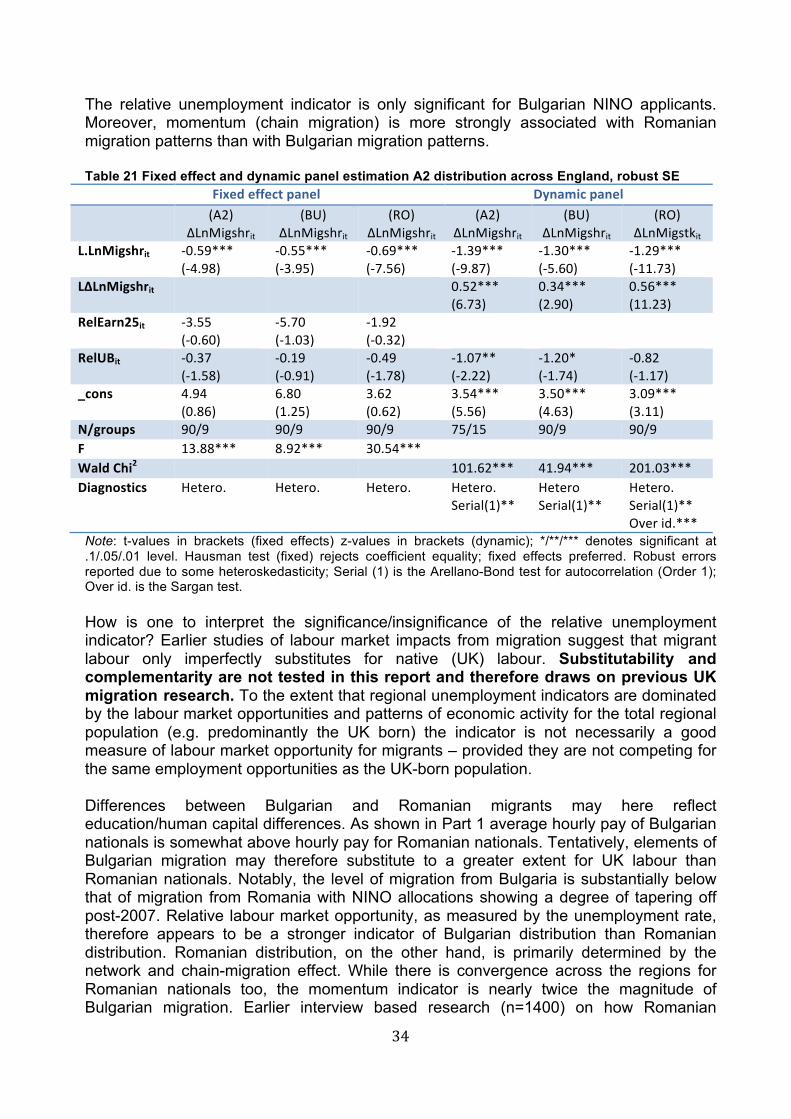
34
The relative unemployment indicator is only significant for Bulgarian NINO applicants. Moreover, momentum (chain migration) is more strongly associated with Romanian migration patterns than with Bulgarian migration patterns. Table 21 Fixed effect and dynamic panel estimation A2 distribution across England, robust SE
Fixed effect panel Dynamic panel (A2)
ΔLnMigshrit (BU)
ΔLnMigshrit (RO)
ΔLnMigshrit (A2)
ΔLnMigshrit (BU)
ΔLnMigshrit (RO)
ΔLnMigstkit L.LnMigshrit -‐0.59***
(-‐4.98) -‐0.55*** (-‐3.95)
-‐0.69*** (-‐7.56)
-‐1.39*** (-‐9.87)
-‐1.30*** (-‐5.60)
-‐1.29*** (-‐11.73)
LΔLnMigshrit 0.52*** (6.73)
0.34*** (2.90)
0.56*** (11.23)
RelEarn25it -‐3.55 (-‐0.60)
-‐5.70 (-‐1.03)
-‐1.92 (-‐0.32)
RelUBit -‐0.37 (-‐1.58)
-‐0.19 (-‐0.91)
-‐0.49 (-‐1.78)
-‐1.07** (-‐2.22)
-‐1.20* (-‐1.74)
-‐0.82 (-‐1.17)
_cons 4.94 (0.86)
6.80 (1.25)
3.62 (0.62)
3.54*** (5.56)
3.50*** (4.63)
3.09*** (3.11)
N/groups 90/9 90/9 90/9 75/15 90/9 90/9 F 13.88*** 8.92*** 30.54*** Wald Chi2 101.62*** 41.94*** 201.03*** Diagnostics Hetero. Hetero. Hetero. Hetero.
Serial(1)** Hetero Serial(1)**
Hetero. Serial(1)** Over id.***
Note: t-values in brackets (fixed effects) z-values in brackets (dynamic); */**/*** denotes significant at .1/.05/.01 level. Hausman test (fixed) rejects coefficient equality; fixed effects preferred. Robust errors reported due to some heteroskedasticity; Serial (1) is the Arellano-Bond test for autocorrelation (Order 1); Over id. is the Sargan test. How is one to interpret the significance/insignificance of the relative unemployment indicator? Earlier studies of labour market impacts from migration suggest that migrant labour only imperfectly substitutes for native (UK) labour. Substitutability and complementarity are not tested in this report and therefore draws on previous UK migration research. To the extent that regional unemployment indicators are dominated by the labour market opportunities and patterns of economic activity for the total regional population (e.g. predominantly the UK born) the indicator is not necessarily a good measure of labour market opportunity for migrants – provided they are not competing for the same employment opportunities as the UK-born population. Differences between Bulgarian and Romanian migrants may here reflect education/human capital differences. As shown in Part 1 average hourly pay of Bulgarian nationals is somewhat above hourly pay for Romanian nationals. Tentatively, elements of Bulgarian migration may therefore substitute to a greater extent for UK labour than Romanian nationals. Notably, the level of migration from Bulgaria is substantially below that of migration from Romania with NINO allocations showing a degree of tapering off post-2007. Relative labour market opportunity, as measured by the unemployment rate, therefore appears to be a stronger indicator of Bulgarian distribution than Romanian distribution. Romanian distribution, on the other hand, is primarily determined by the network and chain-migration effect. While there is convergence across the regions for Romanian nationals too, the momentum indicator is nearly twice the magnitude of Bulgarian migration. Earlier interview based research (n=1400) on how Romanian

35
nationals obtain employment overseas shows that friends and relatives are the main means of finding work; the use of labour intermediation companies in Romania is found to be as important as asking employers directly (Suciu 2010).
Conclusion Predicting the number of A2 migrants coming to the UK is inherently difficult and fraught with uncertainty. Data limitations and estimation strategies aside a number of human (individual), social and political factors can only poorly be captured in estimation work. Bulgaria and Romania have both experience longer periods of population decline due to net outmigration and flows cannot continue in perpetuity. This section has attempted to model the distribution of recent A2 migration across the EU15 and English regions. Both exercises find that past migration (network effect) is an important determinant of new migrants’ location. The descriptive data in Part 2 shows the relative stability of A2 distribution since 2007. The exception here is Italy (increase) and Spain (decline) where the relative share of A2 migrants has altered substantially. The UK’s share of A2 migrants has remained largely stable albeit showing a small increase since EU accession. Notwithstanding the increasing number of A2 nationals now living and working in the UK (Part 1) the UK has not attracted a significantly greater share of A2 migrants overall. One explanation for this may of course be the UK’s retention of transitional controls in 2009 when a number of other EU15 countries relaxed or removed their transitional controls. The modeling of A2 distribution in Table 20 attempts to control for this effect by constructing a labour mobility index (based on Holland et al 2011) and finds that formal labour market restrictions, as measured in this study, do not appear to have exerted a significant independent effect on the distribution of A2 migrants. This finding differs from similar studies of A8 migration after A8 accession in 2004 and also differs from the Migration Advisory Committee’s expectations in 2008, but is not dissimilar to analysis found elsewhere (Holland et al 2011). However, the analysis also shows that change in economic conditions – measured by relative unemployment rates – is an explanatory factor in A2 migration patterns. Most of the EU15 countries were significantly affected by the economic and financial turmoil of 2008. However, the impact, in terms of employment and economic activity, has differed from country to country. Moreover, the pattern of recovery is likely to continue to differ. This means that transitional arrangements in the UK are ending at a time when the relative structure and patterns of employment across the EU15 is changing (at least in the short term). Against this background it is feasible that the UK might receive a larger share of A2 migrants than in the recent past. However, the estimations in this study do not find the magnitude of increase to be in the vicinity of some of the more extreme predictions. A key question in this respect is naturally whether A2 migrants expect relative economic conditions to be permanent or short-medium term. A permanent change in relative economic conditions would likely have a greater impact on migration patterns then discussed in this study. Relative income levels (GDP per capita) are not found to be a significant determinant of A2 migration distribution. Reasons for this are untested, but it is speculated that similarities between the EU15 countries, compared to conditions in Bulgaria and Romania, make the each of these a desirable destination.

36
Across English regions network effects are found to dominate the location of A2 migrants. While there overall is some convergence across the regions London and the areas adjacent to London can expect to continue to receive the greatest share of new A2 migrants. There is some tentative evidence that this might particularly be the case for migrants from Bulgaria where relative unemployment is found to be a determinant of concentration. The South East & West, East Midlands and East of England exhibit below average unemployment levels. Albeit a weak effect, the finding may be related to a greater proportion of degree level Bulgarian migrants. Bulgarian migrants constitute the smallest share of A2 migration. Relative labour market effects appear not to be a strong determinant of Romanian distribution across English regions. A likely implication of this is that A2, especially Romanian migrants, are less likely to directly compete with British labour in the regions (areas) they settle. A key example here is the SAWS where A2 migrants currently constitute the only source of labour supply and a key source of temporary agricultural labour supply overall. More generally, however, high employment rates and little responsiveness to unemployment rates may suggest a degree of complementarity rather than substitutability. Other factors such as relative earnings (at the median and lower quartile) and relative private sector rents were not found to be significant determinants of A2 distribution. For South East local authorities the implications is the continued concentration of A2 migrants in this region (alongside London, as the main destination, and the East of England). As shows in Part 1 A2 migrants are relatively young and often better skilled than both A8 migrants and the UK population. However, Part 1 also finds some increase in lower skilled migration in the last couple of years and reduced employment levels for the most recent migration cohort.

37
Appendix A – Selected studies/reports on impacts of A2 transitional controls NIESR (2013) Potential impacts on the UK of future migration from Bulgaria and Romania The report was commissioned to provide evidence for the UK government on the potential impact of migration from Bulgaria and Romania following the end of transitional arrangements at the end of 2013. Key points:
• Due to lack of accurate current data on migration it is not possible to predict the scale of future migration from Bulgaria and Romania.
• Key destinations for A2 migrants are Spain, Italy and to a smaller extent Germany. • Economic migrants from Bulgaria and Romania are generally young and healthy
and unlikely to make major demands on the health service. • A2 migrants are concentrated in hospitality, cleaning services, construction and
trade. • While current A2 migrants have a higher degree of skilled/intermediary
qualifications (than A8) the lifting of restrictions on employment post 2013 is likely to predicate greater concentration of lower skilled migration.
• A2 migration is likely to be less geographically dispersed than A8 migration; the South East is likely to be the preferred destination within England.
• Migration of families may increase pressure on school places, especially in areas with existing pressure.
• Little evidence that A2 migrant children have a negative impact on school performance, but additional language assistance/support will be required.
• Impacts on housing markets will primarily be felt in the private rented sector. While much is written about impact on social housing there is currently little evidence to substantiate significant impact in this sector. Impact on the private sector will depend on length of residence and local housing market conditions (in particular supply of privately rented accommodation).
• The evidence base for welfare/benefits impact is limited. However, the evidence that exists suggests that Eastern European Migrants are less likely to claim benefits than other migrant groups or the general population.
• Child benefit is the most claimed benefit amongst those who do claim benefits. MAC (2013) Migrant Seasonal Workers: The study was commissioned to analyse what might happen then the Seasonal Agricultural Worker Scheme (SAWS) terminates with the ending of transitional arrangements at the end of 2013. Key points:
• Since 2008 the SAWS has only been open to Bulgarian and Romanian workers. • The current quote is 21,250, which constitutes roughly 1/3 of the total number of
seasonal and casual workers in agriculture.

38
• Most parties (growers, supermarkets and consumers) gain from the SAWS. • The work is seasonal – maximum duration 6 mnts; high return migration rate. • Little evidence of crowding-out/displacement of British labour. • Evidence provided to the MAC suggests that growers and operators in agriculture
experience difficulties in recruiting and retaining British workers. Reasons may be multiple – relatively low pay, but physically demanding; little incentive to come off social security benefits for seasonal work.
• Agricultural growers and operators do not expect A2 labour supply to dissipate following the end of transitional arrangements, but full access to EU labour markets may imply wage pressure to recruit sufficient numbers of workers. This may have implication for the labour/capital intensity of the agricultural industry and prices of agricultural output. Changes in price of British produce may affect the competitiveness of the UK agricultural sector.
MAC (2008) The labour market impact of relaxing restrictions on employment in the UK of nationals from Bulgarian and Romanian member states. The report was commissioned by the UK government as part of its mandatory review of restrictions imposed on Bulgarian and Romanian nationals following the Treaty of Accession in 2005. Key points:
• Impossible to predict accurate migration flows from A2 to the UK; any flows are contingent on decision in other EU15 countries. The report considered that loosening restrictions if other EU15 countries retained theirs would likely lead to a greater influx of migrants; conversely retaining restrictions if other EU15 countries relaxed theirs would lessen flows to the UK. In both cases network effects were expected to constitute a source of persistence or inertia in flows.
• Whether positive or negative the removal of restrictions [after 2008] likely to have small overall labour markets and economic impact. However, negative risks [in 2008] outweighed positive risks, hence recommended that restrictions be kept in place post 2009.
• The report focused on specific sectoral impacts in agriculture, constriction, food processing, hospitality and social care. These sectors were chosen due to being major employers of low skilled labour.
- Agricultural sector: heavily dependent on immigrant labour supply without any, realistic, short-term alternative. Recommended [in 2008] to expand the SAWS to 21,250.
- Social care: some evidence of labour shortage, but a concern that lifting restrictions [in 2009] could lead a larger flow of new entrants than the sector could absorb - at a time of expected economic downturn.
- Construction and hospitality: no evidence of a labour shortage, but an expectation that these sectors would be particularly affected by the expected economic downturn.
• Drawing on available research the report highlighted select evidence showing a greater impact on supply side than on the demand side with associated small deflationary effect, but also stressed the limited evidence relating to A2 migration.

39
• Drew a distinction between short-term and long-term impacts. Short-term A2 migration likely to make a positive fiscal contribution due to high employment rate and less dependence on benefits/welfare support; long-term effect depending on skills level, future tax payments an length of residence in the country.
• Finally, the report considered relaxing the work permit rules. - Following a resident labour market test (plus a number of expect jobs) A2
nationals can be granted authorisation to be employed in the UK. - The report considered that a partial relaxation [in 2009] would enable a
gradual adjustment to a full relaxation at the end of the transitional arrangements period and incentivise more highly skilled migration. Flows of skilled migrants were expected to be smaller than less skilled migrants and have greater external benefits (to the existing workforce). It also considered that the UK’s labour market already was relatively flexible so that an extended adjustment period might not be required.

40
References Cangiano, A. (2012) ‘The impact of migration on UK population growth’, Migration
Observatory Briefing, COMPAS, University of Oxford. Dustmann, C. and Frattini, T. (2013) ‘The fiscal effect of immigration to the UK’, CReAM
discussion paper series, CDP No 22/13, Department of Economics, University College London.
Dustmann, C., Fabbri F. and Preston, I. (2005) ‘The impact of immigration on the UK labour market’, CReAM discussion paper series 0501, Centre for Research and Analysis of Migration (CReAM), Department of Economics, University College London.
Frazer, H. and Marlier, E. (2011) Promoting the Social Inclusion of Roma, Synthesis Report based on the national reports prepared by the EU Network of Independnet Experts on Social Inclusion, European Commission.
Holland, D., Fic, T., Paluchowski, P., Rincon-Aznar, A. and Stokes, L. (2011) ‘Labour mobility within the EU – the impact of enlargement and transitional arrangements’, NIESR Discussion Paper, No 379.
Giulietti, C. (2009). ‘Immigration and displacement across local labour markets’, Working Paper 2/2009, Centre for Population Change.
Hatton, T. and Tani, M. (2003) ‘Immigration and inter-regional mobility in the UK, 1982-2000’, Economic Journal, Vol. 115, No. 507.
Kausar, R. (2011) Identifying social and economic push and pull factors for migration to the UK by Bulgarian and Romanian nationals, DCLG: London.
Lemos, S. (2011a) ‘Immigrant Economic Assimilation: Evidence from UK longitudinal data between 1978 and 2006’, Working Paper no 11/39, University of Leicester.
Lemos, S. (2011b) ‘Mind the Gap: what gap? A detailed picture of the immigrant-native earnings gap in the UK using longitudinal data between 1978 and 2006’, Working Paper no 11/38, University of Leicester.
Manacorda, M., Manning, A. and Wadsworth, J. (2006) ‘The impact of immigration on the structure of male wages: theory and evidence from Britain’, IZA Discussion Paper No. 2352, Bonn.
Migration Advisory Committee. (2013) Migrant Seasonal Workers: The impact on the horticulture and food processing sectors of closing the Seasonal Agricultural Workers Scheme, Home Office: London.
Migration Advisory Committee. (2012) Analysis of the Impacts of Migration, Home Office: London.
Migration Advisory Committee. (2008) The labour market impact of relaxing restrictions on employment in the UK of nationals of Bulgarian and Romanian EU member states, Home Office: London.
Nickell, S. and Saleheen, J. (2008). The impact of immigration on occupational wages: evidence from Britain. Working Paper No. 08-6, Federal Reserve Bank of Boston.
Rolfe, H., Fic, T., Mumtaz, L., Roman, M. Prohaska, M. and Doudeva, L. (2013) Potential impacts on the UK of future migration from Bulgaria and Romania, National Institute of Economic and Social Research.
Suciu, O. (2010) ‘Migration in Europe: case studies: Bulgaria and Romania’, CRCE Colloquium, http://www.crce.org.uk.
UKBA/Home Office (n.d.) A2 – the accession of Bulgaria and Romania to the EU, www.ukba.homeoffice.co.uk