bulletin wind energy 2014
TRANSCRIPT

W i n d E n e r g y A r o u n d t h e W o r l d Special Issue 2015
Quarterly Bulletin
Special Issue:
World Wind Energy Report 2014

GamesaofficialsiteGamesa_official /
Extensive knowledge of our customersʼ needs, acquired during our 21 years in the business, endorse the versatility of the Gamesa 2.0-2.5 MW platform and its unmatched track record, with 18 GW installed worldwide. This platform, which boasts average fl eet availability of over 98%, guarantees capital-light, low-maintenance power production. That makes us the most flexible and trustworthy ally in global wind technology solutions.
AF GAMESA 2015 2MW WINDPOWER.indd 1 18/03/15 09:04

1
Dear Members and Friends of WWEA,
This special edition of our WWEA Quarterly Bulletin focuses on the worldwide wind statistics: You will find detailed statistics and installation figures from more than 100 countries as of end of the year 2014. Together with our international experts, we have analyzed the regional and continental deployment rates of wind power and we present you our conclusions here as well.
In addition, we have been able to include updated statistics as of mid-2015, based on the world’s 15 largest wind markets.
Our statistics show that wind power stands still for a great success story - both years 2014 and 2015 mark new records in installations!
These statistics are reflecting only the installations in larger, grid-connected wind farms. Hence we find it very important also to be able to present you some insights into the market for off grid electrification systems: We have conducted a survey amongst investors in such systems, with a special focus on West African markets. You will find interesting results and conclusions from this report.
A historic overview of the development of the Chinese wind market in the 21st century is given by WWEA President Emeritus Dr. Preben Maegaard, who has closely worked since many years with many of the key players in China.
With best wishes,
Stefan GsängerSecretary General World Wind Energy Association
From The Editor

2
Editorial CommitteeEditor-in-Chief: Stefan Gsänger
Associate Editor-in-Chief: Shi Pengfei
Paul Gipe
Jami Hossain
Editors: Martina Bachvarova
Shane Mulligan
Yu Guiyong
Visual Design: Liu Zhan
ContactMartina Bachvarova
Tel. +49-228-369 40-80
Fax +49-228-369 40-84
WWEA Head Office
Charles-de-Gaulle-Str. 5, 53113 Bonn, Germany
A detailed supplier listing and
other information can be found at
www.wwindea.org
Yu Guiyong
Tel. +86-10-5979 6665
Fax +86-10-6422 8215
CWEA Secretariat
28 N. 3rd Ring Road E., Beijing, P. R. China
A detailed supplier listing and
other information can be found at
www.cwea.org.cn
Published by
World Wind Energy Association (WWEA)
Produced by
Chinese Wind Energy Association (CWEA)
Special Issue 2015
01 From the Editor
Report04 Special: World Wind Energy Report 201420 Update: Half-year Report 2015
Inside WWEA22 New Chair of WWEA Small Wind: Morten V. Petersen24 China’s Way to Leadership within Wind Energy: Background and Future
Small Wind and Off Grid34 African Rural Electrification: A Private Sector Perspective on Investment Conditions

3

4
Report Special Issue 2015
By World Wind Energy Association (WWEA)
Special: World Wind Energy Report 2014
Key Facts and Figures
➤ World wide wind capacity end of 2014: 371’559 Megawatt.
➤ Capacity added in 2014: 52’654 Megawatt (a 48 % increase from2013).
➤ Annual growth rate 2014/2013:16.4 %.
➤ Potential annual power output:800 Terawatt hours, >4 % of global demand.
➤ Global wind sector turnover in 2014:100 billion Euro/120 billion USD.
➤ Number of countries using wind:105.
➤ Largest markets for new turbines:
1. China: 23 Gigawatt
2. Germany: 5.8 Gigawatt
3. USA: 4.8 Gigawatt
4. Brazil: 2.5 Gigawatt
5. India: 2.3 Gigawatt
➤ Continental shares in overall wind capacity:
1. Asia: 39.3%
2. Europe: 35.5%
3. North America: 20.3%
➤ Continental growth rates:
1. Africa: 66.0%
2. Latin America: 63.3%
3. Asia: 22.8%
4. Oceania: 20.3%
5. Europe: 10.4%
6. North America: 9.7%
➤ Expected global capacity:
2017: > 500’000 Megawatt
2020: > 700’000 Megawatt
2030: 2’000’000 Megawatt

5
ReportSpecial Issue 2015
General Situation: New Record in New Installations
Without a doubt, wind power has become a pillar of the energy systems in many countries and is recognised as a reliable and affordable source of electricity.
In the year 2014, the worldwide
wind capacity reached 371’559 Megawatts (MW), from 319’036MW in 2013, 282’810 MW in 2012, 236’813 MW in 2011 and 197’005 MW in 2010.
The market for new wind turbines reached a new record: 52’654MW were installed in 2014, an increase of 48 % compared with 2013 when 35’551 MW were erected.
The contribution of wind power to the energy supply has reached a substantial share even on the global level: the total of wind turbines installed around the globe by the end of 2014 potentially contribute some 800 Terawatt hours to the worldwide electricity supply – more than 4 % of global electricity demand.
In the year 2014, 105 countries were identified where wind energy isused for electricity generation. A new entrant on the list is Samoa, a small island state that is aiming at a 100 % renewable energy supply by 2017.
52 countries installed new wind turbines, up from46 in 2013.
The world wide economic turnover in the wind sector reached 86 billion € (100 billion US$) in 2014, up from 68 billion € (80 billion US$) in 2012 and 2013,and 56 billion € (65 billion US$) in the year 2011.
Rebounding Worldwide Growth Rate
Although 2014 saw a new
record for new installations, growth is still below the long-term average. The average growth rate offers a good indicator of the vitality of the market. The growth rate is the relation between the new installed wind power capacity and the installed capacity of the previous year.
After an average growth of 25 % in the previous decade, sector growth decreased in recent years, but seems to be on the increase again. In 2014, the global growth rate went up to 16.4 %, after 2013 saw the lowest rate in two decades at 12.8 %. Yet 2014 is still
lower than the year 2012 with19.2 %, which was already substantially below the long term average.
Strongest Growth in Latin America and Africa
Latin America and Africa show the highest growth rates, continuing the trend towards more geographical diversification that we have seen in recent years.
Africa in particular has overcome its status as a low growth region, increasing it growth rate to 66% after a low of 5.8% growth only two years ago.
Similar to Africa, Latin America has made a rebound after a low of 38.9% following 2012 and increasing to 63.3 % following 2013. This increase was driven in part by impressive participation from Uruguay which posted a growth rate of 793 %, and Chile with a growth rate of 150 %.

6
Report Special Issue 2015
In total, six countries showed a growth rate over 100%; alongside Uruguay and Chile, they included the Philippines with 555 %, South Africa with 459 %, Pakistan with 142 % and Tunisia with 137 %.
As in the last two to three years, strong growth occurred mainly in African, Eastern European and Latin American markets, while the more traditional markets in Western Europe, North America and Asia have seen more modest growth.
The highest growth rates in Europe in 2014were found in Iceland, with 67 %, Finland with 40 % and Ukraine with 34 %.
Two Latin American countries showed high growth as well: Brazil with 72 % and Honduras with 49 %.
Growth substantially above the global average was also seen in Australia, Turkey and Sweden.
Top Wind Markets 2014: Diversity in Big Five Markets
The Big Five markets – China,
USA, Germany, Spain, and India – have realized the bulk of wind power development over the last two decades. In 2014, they represented 266 GW, or 72 % of the worldwide wind capacity, only slightly less than
in the previous year. However, their market position remained strong as they added 36 GW, 61 % more than in 2013 (23 GW),accounting for 69 % of all new installations.
The top 10 markets have substantially increased their capacity additions from 28 GW to 44 GW (83 % of the total new capacity) while their overall wind capacity share remained constant at 84 %.
Among the top markets, China, Germany and USA continue to play a very strong role: This three countries accounted for almost two thirds (65%) of the world wind market in 2014.
China now controls 31 % of the global installed capacity, adding 23 GW in 2014 (44 % of the added capacity). China showed steady global market share, after the peak in the year 2012 when one of every two new wind turbines installed globally was located in China.
Alongside China, Germany, the UK, Canada and Brazil maintained robust growth rates close to or above the global average, while development seems to have stagnated somewhat in both Spain and Italy.
With robust growth from 8 GW to 10 GW, Canada moved up the rankings from ninth in 2013 to seventh in 2014. Even more surprising is Brazil’s entrance into the top ten, with a growth rate of 72 %. Brazil climbed three rankings with 2 GW of additional capacity.

7
ReportSpecial Issue 2015
The Spanish market showed stagnation with only 27 MW added, equalling an increase incapacity of 0.1 %. It is expected that Spain will be surpassed by India before March 2015 as the country with the fourth largest wind capacity.
In total 33 countries invested substantially in wind farms in 2014 – four more than in 2013 – with each adding at least 100 MW. Among them, China, Germany and the USA play still an exceptional role as global lead markets.
Ten countries can be seen as major markets with turbine sales of between 0.5 GW and 2.5 GW: these are India, the UK, Canada, France, Brazil, Sweden, Australia, Turkey, Mexico and Chile.
In 2014, the number of medium-sized markets for new turbines –
between 100 and 500 MW per year – reached a total of 20 (three years ago, only ten markets had such size): Italy, Portugal, Denmark, Poland, Romania, the Netherlands, Japan, Ireland, Austria, Greece, Belgium, Morocco, Finland, South Africa, Uruguay, Ukraine, Pakistan, Tunisia, the Philippines, and newcomer Peru.
By the end of 2014, 24 countries had installations of more than 1 GW, anumber that has remained unchanged since 2012. However, all these countries have now at least 2 GW of installed capacity, and there is currently no country with an installed capacity between 1 and 2 GW.
Today 54 countries are host to wind farms with an overall capacity of 100 MW or more, up from 51 countries one year ago. Ten years ago, in the year 2005, only 24 countries had more than 100 MW installed capacity.
As of the end of 2014, 105 countries are using wind power for electricity generation. Samoa installed wind power for the first time, as part of its strategy to reacha 100 % renewable energy supply by 2017.
Installed Capacity by Country Size
In order to understand the
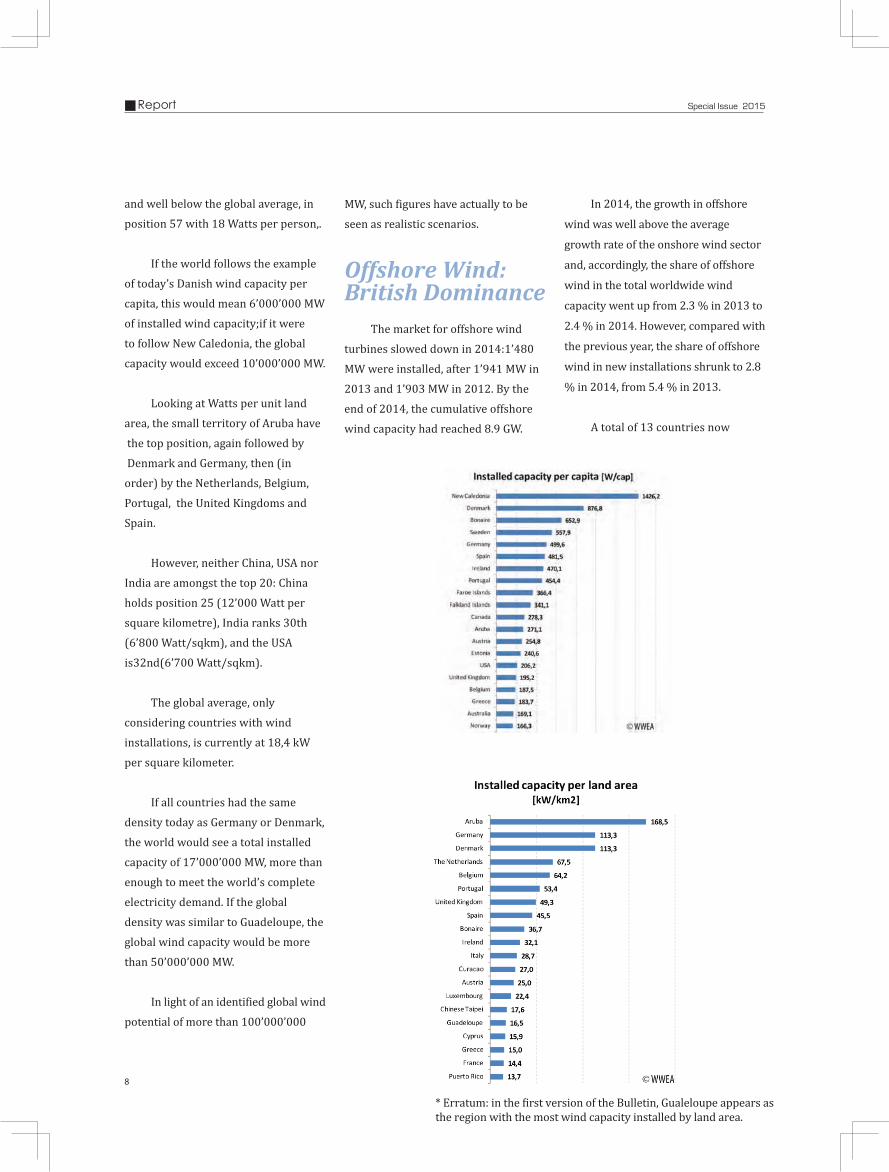
actual commitment of a country to wind power and its progress in wind power utilization, it is worthwhile to look not only at the total figures, but also to examine the installed capacity in relation to the size of a country. When we do so it becomes clear that some of the smaller countries have made remarkable progress in wind power utilization, and also reveals the potential of wind power utilization.
The Pacific French territory of New Caledonia, for instance, is the new leader in terms of installed wind capacity per person: for each inhabitant, the territory has an installed wind capacity of 1426 Watts; it is followed by Denmark which has 877 Watts installed per inhabitant. Among the major countries, Sweden, Germany, Spain, Ireland and Portugal rank in the top ten per capita. The USA now ranks 15th, with just over 200 Watts per person, and China ranks 34th, with 87 Watts per person. While far behind their absolute rankings, both China and USA are still above the world per capita average of 53 Watts per person. India is even lower,
8
Report Special Issue 2015
and well below the global average, in position 57 with 18 Watts per person,.
If the world follows the example of today’s Danish wind capacity per capita, this would mean 6’000’000 MW of installed wind capacity;if it were to follow New Caledonia, the global capacity would exceed 10’000’000 MW.
Looking at Watts per unit land area, the small territory of Aruba have the top position, again followed by Denmark and Germany, then (in order) by the Netherlands, Belgium,Portugal, the United Kingdoms and Spain.
However, neither China, USA nor India are amongst the top 20: China holds position 25 (12’000 Watt per square kilometre), India ranks 30th (6’800 Watt/sqkm), and the USA is32nd(6’700 Watt/sqkm).
The global average, only
considering countries with wind installations, is currently at 18,4 kW per square kilometer.
If all countries had the same density today as Germany or Denmark, the world would see a total installed capacity of 17’000’000 MW, more than enough to meet the world’s complete electricity demand. If the global density was similar to Guadeloupe, the global wind capacity would be more than 50’000’000 MW.
In light of an identi�ied global wind potential of more than 100’000’000
MW, such �igures have actually to be seen as realistic scenarios.
Offshore Wind: British Dominance
The market for offshore wind turbines slowed down in 2014:1’480 MW were installed, after 1’941 MW in 2013 and 1’903 MW in 2012. By the end of 2014, the cumulative offshore wind capacity had reached 8.9 GW.
In 2014, the growth in offshore
wind was well above the average
growth rate of the onshore wind sector
and, accordingly, the share of offshore
wind in the total worldwide wind
capacity went up from 2.3 % in 2013 to
2.4 % in 2014. However, compared with
the previous year, the share of offshore
wind in new installations shrunk to 2.8
% in 2014, from 5.4 % in 2013.
A total of 13 countries now
* Erratum: in the �irst version of the Bulletin, Gualeloupe appears asthe region with the most wind capacity installed by land area.

9
ReportSpecial Issue 2015
have offshore wind farms, eleven in Europeand two in Asia. Only three countries added major offshore wind farms in 2014: the United Kingdom, Belgiumand Germany.
The UK represented 54 % of the offshore market (36 % in 2013) and added 813 MW of offshore wind turbines. The country has a exceptional role and a dominant position in the offshore wind sector. More than half of all offshore wind turbines are currently installed in British waters.
Germany moves to the second position after installing 528 MW of offshore turbines. Offshore wind now represents 3.4 % of the total installations in Germany.
Denmark, now third in the ranking, didn’t have any new installations in 2014.
Belgium became the third largest market for new offshore turbines in 2014, installing 141 MW in a year.
Other counties like Japan or Korea have ambitious offshore wind programmes, however, both countries face major technical challenges, due in particular to deep water which requires innovative technical solutions.
Continents: Asia Now Undisputed Leader, ahead of Europe
A notable – but not unexpected
– shift has occurred, in that Europe is no longer the continent with highest installed wind energy capacity. Due to modest growth rates in recent years, Europe has now lost its dominant position to Asia, which now represents 39 % of the total installed capacity, compared to Europe’s 36 %. In terms of new capacity, Europe accounted for 33 % in 2014, compared to Asia’s 52 %.
After several years of decline,
the North American share has increased again, mainly due to the very strong performance of the US market. North America’s share of new wind turbines recovered from a low of 7 % in the year 2013 to reach13 % in 2014. By the end of 2014, 20.3
% of global wind capacity was to be found in North America.
Latin America saw major progress for the fourth year in a row,increasing its share in new capacity from 1.2 % in 2010, 2.9 % in 2011, 4 % in 2012 and 5 % in 2013 to substantial 8.3 % in 2014. In share of total capacity, Latin America improved from 1 % in 2010 to 3 % in 2014.
Africa’s share in new installations increased to 1.9 % in 2014, after 1.2 % in 2013. However, the continent has still a long way to go: although representing about one seventh of the world’s population, only one out of 150 wind turbines have been installed on this continent so far.

10
Report Special Issue 2015
Africa
The total of all wind turbines installed in Africa in 2014 reacheda capacity of 2’455,1 MW (0.7 % of the global capacity), of which 976 MW were added in 2014 (compared with 418 MW added in 2013).
After many years of stagnation, Africa had the highest growth rate of all continents: 66 %. Two years ago, growth was only at 6 %.
As in the previous year, commercial wind turbines could be found in 12 African countries, though with quite diverse market sizes among them. New capacity included new wind farms in five countries:Morocco, Egypt, South Africa, Tunisia and Nigeria.
Africa has a new leader in terms of installed capacity: after more than a decade in which Egypt was the top African Wind country, Morocco has
now taken over this role.
Africa now has five major wind markets,of which three are found in Northern Africa: Morocco (787 MW installed capacity), Egypt (616 MW) and Tunisia (245 MW).
Two Subsaharan countries are now also playing an important role: South Africa(570 MW), one of the new shooting stars, and Ethiopia (171 MW).
In general, new political support
schemes will be needed to support the financing of additional wind farms in Africa. Governments should implement feed-in tariff programmes, with a special focus on community development, including community ownership models.
A special consideration should be given to small scale and hybrid systems for rural electrification, so that hundreds of millions Africans in unserved areas can eventually benefit from modern electricity services.
Asia
Asia continued to be the continent showing the strongest increase in installed capacity in 2014, adding 27 GW, following from17 GW in 2013.
The total installed wind capacity in Asia is now 146 GW, representing 39 % of global capacity.
A total of 19 Asian countries are

11
ReportSpecial Issue 2015
using wind power today, however there are only two big markets, China and India, and seven smaller and medium sized markets with a capacity of more than 100 MW: Japan, Chinese Taipei (Taiwan), South Korea, Pakistan, Thailand, Philippines, and Iran. Only these nine countries have added new capacity during the year 2014.
The continent’s growth rate has recovered from a low17 % in 2013, reaching 23 % in 2014. This is still far from the value achieved in 2010, of 51 %.
Ten Asian countries and regions installed new wind turbines during the year 2014: China, India, Japan, South Korea, Turkey (most wind farms are on the Asian part of this country), Pakistan, Chinese Taipei, Philippines, Iran and Thailand. China, asin previous years, accounted for a majority (78 %) of the Asian wind capacity, followed by India with 15 % (from17 % in 2013). All other countries have market shares of less than 2 %.
With 114 GW, China already fulfilled its goal of 100 GW for the year 2015 more than a year in advance. In the coming years, a stable
market size, similar to that of 2014, is expected.
In 2014 India was the fifth largest market for new turbines worldwide. Similar to previous years, the country showed an increase of 2’315 MW (after adding 1’829 MW in 2013 and 2’441 MW in 2012), reaching a total capacity of 22.5 GW. In general, the Indian wind market has a very good future potential. One indicator of this is the recently increased wind potential assessment, which was lifted to more than 300 GW. However, policy uncertainties and unpaid electricity bills have damaged investors’ confidence.
Japan lost one place in the global ranking, being passed by Romania, but continued to be number three in Asia with a total capacity of 2.8 GW with an additional 130 MW in 2014.However, the expected shift toward more renewable energy after the nuclear accident in Fukushima has not yet resulted in a major take-off of the Japanese wind market, neither onshore nor offshore. Still, long permission processes remain a major hurdle against rapid development of wind power in the country.
Turkey, geographically predominantly in Asia, again showed strong growth, adding 804 MW (after 646 MW in 2013) and reaching 3.7 GW of wind capacity. The private sector in the country shows strong interest in wind power investment, while the government still seems to favour more expensive nuclear power, although wind power is one of the cheapest electricity sources in Turkey.
As in previous years,South Korea showed only modest growth in 2014: the country added 48 MW, reaching a total capacity of 609 MW, after 79 MW in 2013. Several large and well-known Korean companies have recently pulled back on wind investments, and the country seems poised to lose momentum in a future key technology and industry.
After no installations in 2013, Pakistan installed 150 MW of capacity in 2014, reaching a cumulative capacity of 256 MW.WWEA, in cooperation with the government of Pakistan, analysed the main barriers for wind investment, and the government has started improving the situation based on the conclusions of the study. Hence, new wind farms are expected to go online in 2015.
Australia and Oceania
The region including Australia and Oceania increased its installed capacity by 757 MW, equalling a
growth of 20.3 % - a record high after several years of very modest growth. All of the additional new capacity was in Australia and the newcomer state of Samoa (0.5 MW).
Australia added 757 MW of new capacity in 2014, reaching 3’806 MW total.Unfortunately the Australian government gave a signal to the wind industry that new investment is

12
Report Special Issue 2015
not really welcome, and targets for renewable energy have been reduced. The new conditions were so bad that WWEA decided not to hold the World Wind Energy Conference in Sydney in 2015, but to wait until a better political environment is in place. The new Australian government is expected to create more favourable frameworks in future.
Europe
The wind capacity in Europe grew from 119 GW in 2013 to 132 GW in 2014. This equals a growth rate of 10.4 % (compared with 11 % in 2013) which led Europe to lose its number one position in terms of total capacity. Europe added 12.4 GW in 2013 (after 11.9 GW in 2012).In all, 34 European countries had wind installations, more than on any other continent.
Germany added a record amount of 5’808 MW in 2014, becoming the second largest market for new turbines worldwide, and continued to be biggest wind market on the continent, reaching a total capacity of more than 40 GW. These installations include some wind farms that were installed but not yet feeding into the grid by end of 2014. The German wind boom has been caused mainly by anticipated changes in renewable energy legislation: The backbone of German Energiewende, the EEG law, has been amended and in 2015 the government wants to introduce
tenders for major projects, replacing the current feed-in tariff. This change may completely change the investment landscape in the country, as many typical investors, especially cooperatives and SMEs, will struggle with the new frameworks.
The second largest European market for wind turbines was, for the third time in a row, the United Kingdom, which installed 1.7 GW to reach a total capacity of 12.4 GW. Close to 50 % of the new installations were offshore.
Former pioneer and lead market
Spain continued losing market share. Only 27 MW were installed in 2014 and 2015 is expected to be similar. The future of wind power in the country is far from clear.
Italy substantially decreased its market activity to 107 MW, from 444 MW in 2013. France became the fourth largest market in Europe with a total capacity of 9.2 GW (1 GW of new installations). Sweden reached the 1 GW mark of new installations in a year and is now number eleven in the world ranking, with 5.4 GW installed. Romania (3.2 GW) and Poland (3.8 GW)continued with a modest but very

13
ReportSpecial Issue 2015
stable market growth, adding 437 MW and 444 MW respectively.
Amongst the CIS countries, Ukraine installed a capacity of 126 MW in 2014, Azerbaijan 50 MW and Kazakhstan 38.4 MW.
Several European countries have
reached very high wind power shares in their electricity supply: Denmark had 34 % of its power coming from wind, Spain and Portugal both exceeded 20 %, Ireland was at 16 % and Germany was close to 10 %.
The mid-term prospects of the European Union markets are not
overly bright as the EU council adopted very modest renewable energy targets for the year 2030. However, increasing competitiveness of wind power on liberalised power markets, and strong public pressure in favour of clean and inexhaustible energy sources, are factors in favour of a sound future of wind power.
Latin America In 2014, Latin America became
the most dynamic continent for wind power investment, mainly due to Uruguay, Chile and Brazil. Uruguay netted a growth rate of 793 %, the highest ever seen.
The continent has significantly increased its global share in both new wind turbines installations, reaching 8,3 % (from 4 % in 2013) and in cumulative installed capacity with a share of 3 % in 2014, from 1,8 % in 2013.
Nine Latin American countries installed new wind turbines in the year 2014: Brazil (2’495 MW new), Mexico (559 MW), Chile (502 MW),
Uruguay (470 MW), Peru (147 MW, with a first major windfarm in the country), Argentina (53 MW), Costa Rica (50 MW), Nicaragua (44 MW) andHonduras (50 MW).
With the exception of Brazil, Mexico,Chile, and Uruguay, most Latin American wind markets can still be
regarded as in a state of infancy.
A growing interest in wind power can be observed in the Caribbean and Central American countries. New projects will be developed in the near future in countries like Cuba Honduras and Guatemala, which is currently constructing its first wind farm of 50 MW.
North America In the year 2014, North
America re-gained some strength
after its all-time low growth rate in 2013 of 4.1 %. However, its growth rate of 9.7 % is still well below the global average.
Despite the growth, the USA became the third biggest market for new turbines in 2014 after China and Germany.

14
Report Special Issue 2015
Future challenges and prospects worldwide
Six major drivers will have a decisive impact on the mid-term and long-term prospects of wind power:
1. The ongoing debate on climate change and how to develope missions-free energy solutions – eventually aimed at a 100 % renewable energy supply globally.
2. The depletion of fossil as well as nuclear resources, especially reflected in fluctuating oil and gas prices which represent a huge challenge for the developing countries especially.
3. An increasing number of local communities, regions and countries which are proving that 100 % renewable energy is practically possible.
4. Increasing awareness regarding the hazardous risks and high costs related with the utilisation of nuclear energy, driven by reports on the nuclear disaster in Fukushima, along with recent reports of cost overruns on new nuclear projects in Finland, France and UK.
5. The increasing awareness regarding the potentials and actual contributions of wind and other renewable energies to an energy supply which is economically, socially, as well as ecologically sustainable.
6. Further improvements in wind energy and related technologies, including balancing, backup and storage technologies.
In order to make use of the full potential of wind and other renewable energies, it will be of crucial importance to strengthen the related
frameworks, institutions and policies. The world community as well as
national governments will have to set up additional policies in favour of wind energy.
Special consideration has to be given to the deployment of renewable energy in the so-called developing countries.
Incentives for decentralised and integrated 100 % renewable energy supply need to be created, again especially but not exclusively for developing countries.
Another key issue for the prospects of wind power is social acceptance. Studies from Scotland, Germany, the USA and Australia suggest that social acceptance is significantly higher in the case of wind farms which are owned by the local community.
Still there are major regulatory uncertainties in North America: The long-term future of the national support scheme in the US is unclear, although the Obama administration recently made clear statements in favour of renewable energy and also indicating stronger commitments within the UN climate change frameworks.
The Canadian market saw an increase of 25.9 % in 2014. Some 1’871 MW were installed in 2014, after 1’ 497 MW in 2013 and 936 MW in 2012,
to a total of 9.7 GW.
Major growth is expected to occur
in North America in 2015, especially in the USA where more than 12.7 GW are now under construction.

15
ReportSpecial Issue 2015
Obviously in such cases opposition against wind power is also significantly lower – and incomprehensive arguments against wind power like health concerns don't play a relevant role in the public debate.
Policymakers have to draw the right conclusions from such results and introduce legislation that favours community based ownership models of wind farms instead of favouring only large corporations.
It is encouraging to see that renewable energy is about to move into the center of the debate at the UN Climate Change conferences. Some experts have already proposed the creation of a completely new global forum for the worldwide expansion of renewable energies. It will be of crucial importance for the final success of all international climate change negotiations that the key role of renewable energies is recognised and the global Energiewende will be started.
In order to provide more financial resources on an international level, WWEA has suggested, together with our partners of the International Renewable Energy Alliance, a Global
Feed-in Tariff Programme as part of the Green Climate Fund. For off-grid applications, loan guarantees and support schemes could pave the way.
Forecast 2020In spite of the need to reinforce
national and international policies and to accelerate the deployment of wind power, it is evident that the global appetite for investment in wind power is strong, and many projects are in the pipeline.
Further substantial growth can be expected especially in China, India, Europe and North America.
Very high growth rates can be
expected in several Latin American countries, in particular in Brazil, as well as in new Asian and Eastern European markets. In the mid-term, some of the African countries will see major investment, above all in Northern Africa, but also in South Africa.
Based on the current growth rates, WWEA revises its expectations for the future growth of the global wind capacity:
In the first half of the year 2017,
the global capacity is expected to hit
500’000 MW. By the end of year 2020, at
least 700’000 MW is expected globally.
For the year 2030, a global wind
capacity of 2’000’000 MW is possible.

16
Report Special Issue 2015
Position 2014
Country/Region
Total capacity
end 2014[MW]
Added capacity
2014[MW]
Growth rate 2014
[%]
Installed Capacity
per CapitaW/person
Installed Capacity per sqkmkW/sqkm
Total capacity
end 2013[MW]
Total capacity
end 2012[MW]
Total capacity end 2011
[MW]
Total capacity
end 2010[MW]
1 China 114'763.0 23'350.0 25.7 84.7 12.0 91'324.0 75'324.0 62'364.0 44'733.0
2 United States 65'754.0 4'854.0 7.6 206.2 6.7 61'108.0 59'882.0 46'919.0 40'180.0
3 Germany 40'468.0 5'808.0 16.8 499.6 113.3 34'660.0 31'315.0 29'075.0 27'215.0
4 Spain 22'986.5 27.5 0.1 481.5 45.5 22'959.0 22'796.0 21'673.0 20'676.0
5 India * 22'465.0 2'315.1 11.5 18.2 6.8 20'150.0 18'321.0 15'880.0 13'065.8
6 United Kingdom 12'440.3 1'736.4 16.1 195.2 51.0 10'710.9 8'635.9 6'018.0 5'203.8
7 Canada 9'694.0 1'871.0 25.9 278.3 1.0 7'698.0 6'201.0 5'265.0 4'008.0
8 France 9'296.0 1'042.0 12.6 140.3 14.4 8'254.0 7'499.8 6'607.6 5'628.7
9 Italy 8'662.8 107.5 1.3 140.4 28.7 8'551.0 8'144.0 6'737.0 5'797.0
10 Brazil 5'961.6 2'495.5 72.0 29.4 0.7 3'466.1 2'507.0 1'429.0 930.0
11 Sweden 5'425.0 1'050.0 21.4 557.9 12.0 4'470.0 3'745.0 2'798.0 2'052.0
12 Portugal * 4'953.0 229.0 4.0 454.4 53.4 4'724.0 4'525.0 4'083.0 3'702.0
13 Denmark 4'883.0 111.0 2.3 876.8 113.3 4'772.0 4'162.0 3'927.0 3'734.0
14 Poland 3'834.0 444.0 13.1 100.0 12.3 3'390.0 2'497.0 1'616.4 1'179.0
15 Australia 3'806.0 757.0 24.8 169.1 0.5 3'049.0 2'584.0 2'226.0 1'880.0
16 Turkey 3'763.0 804.0 27.2 46.1 4.8 2'959.0 2'312.0 1'799.0 1'274.0
17 Romania 3'220.0 437.0 15.7 148.2 12.6 2'783.0 1'905.0 826.0 591.0
18 Netherlands 2'805.0 141.0 4.2 166.2 67.5 2'693.0 2'391.0 2'328.0 2'269.0
19 Japan * 2'788.0 130.4 4.5 21.9 7.4 2'669.0 2'614.0 2'501.0 2'304.0
20 Mexico 2'551.0 559.0 28.1 21.2 1.3 1'992.0 1'348.0 929.0 521.0
21 Ireland 2'272.0 222.0 10.9 470.1 32.1 2'049.0 1'738.0 1'631.0 1'428.0
22 Austria 2'095.0 411.0 24.4 254.8 25.0 1'684.0 1'378.0 1'084.0 1'010.6
23 Greece 1'980.0 114.0 6.2 183.7 15.0 1'865.0 1'749.0 1'626.5 1'208.0
24 Belgium 1'959.0 308.0 18.7 187.5 64.2 1'651.0 1'375.0 1'078.0 886.0
25 Norway 856.0 88.0 11.5 166.3 2.6 768.0 703.0 520.0 434.6
26 Chile 836.0 502.0 149.6 48.1 1.1 335.0 190.0 190.0 170.0
27 Morocco 787.0 300.0 61.6 23.9 1.8 487.0 291.0 291.0 286.0
28 Bulgaria 691.0 10.0 1.5 99.8 6.2 681.0 674.0 503.0 499.0
29 Chinese Taipei 633.0 18.8 3.1 27.1 17.6 614.2 563.8 563.8 518.7
30 Finland 627.0 179.0 40.0 119.0 1.9 448.0 288.0 197.0 197.0
31 New Zealand 623.0 0.0 0.0 141.5 2.3 623.0 622.8 622.8 506.0
32 Egypt 616.0 66.0 12.0 7.1 0.6 550.0 550.0 550.0 550.0
33 Korea, South 609.0 47.7 8.5 12.4 6.1 561.3 482.6 406.3 379.3
34 South Africa 570.0 468.0 458.8 11.8 0.5 102.0 10.1 10.1 10.0
35 Uruguay 529.4 470.0 792.7 158.8 3.0 59.3 55.7 40.5 30.5
36 Ukraine 409.5 126.3 34.0 9.2 0.7 371.0 276.0 151.1 87.4
37 Croatia 347.0 45.0 14.9 77.6 6.1 302.0 180.0 131.0 89.0
38 Hungary 329.4 0.0 0.0 33.2 3.5 329.4 329.4 329.4 295.0
39 Estonia 302.7 22.7 8.1 240.6 6.7 280.0 269.0 184.0 149.0
40 Czech Republic 283.0 14.0 5.2 26.6 3.6 269.0 260.0 217.0 215.0
41 Lithuania 279.0 0.0 0.0 79.6 4.3 279.0 225.0 179.0 163.0
42 Argentina 271.0 53.0 24.8 6.3 0.1 217.1 140.9 129.2 54.0
43 Pakistan 256.0 150.0 141.5 1.3 0.3 106.0 106.0 6.0 6.0
44 Tunisia 245.0 141.0 135.6 22.4 1.5 104.0 104.0 54.0 54.0
45 Thailand 223.0 30.0 15.5 3.3 0.3 193.0 112.0 8.0 0.0
46 Philippines 216.0 183.0 554.5 2.0 0.7 33.0 33.0 33.0 33.0

17
ReportSpecial Issue 2015
Position 2014
Country/Region
Total capacity
end 2014[MW]
Added capacity
2014[MW]
Growth rate 2014
[%]
Installed Capacity
per CapitaW/person
Installed Capacity per sqkmkW/sqkm
Total capacity
end 2013[MW]
Total capacity
end 2012[MW]
Total capacity end 2011
[MW]
Total capacity
end 2010[MW]
47 Costa Rica 198.0 50.0 33.6 41.6 3.9 148.2 148.2 148.2 123.0
48 Nicaragua 186.0 44.4 31.4 31.8 1.4 141.6 102.0 63.0 63.0
49 Ethiopia 171.0 0.0 0.0 1.8 - 171.0 51.0 30.0 0.0
50 Honduras 152.0 50.0 49.0 17.7 1.4 102.0 102.0 70.0 0.0
51 Peru 148.0 147.3 ∞ 4.9 0.1 0.7 0.7 0.7 0.7
52 Cyprus 147.0 0.0 0.0 125.4 15.9 147.0 147.0 134.0 82.0
53 Puerto Rico 125.0 0.0 0.0 34.5 13.7 125.0 125.0 0.0 0.0
54 Iran 117.5 17.5 17.5 1.5 0.1 100.0 100.0 100.0 100.0
55 Dominican Republic 85.3 0.0 0.0 8.2 0.7 85.3 33.6 33.6 0.2
56 Latvia 68.0 0.0 0.0 31.4 1.1 68.0 68.0 31.0 30.0
57 Switzerland 60.3 0.0 0.0 7.5 1.5 60.3 50.0 45.5 42.3
58 Luxembourg 58.0 0.0 0.0 111.4 22.4 58.0 58.0 44.0 44.0
59 Mongolia 50.9 0.0 0.0 17.2 - 50.9 1.3 1.3 1.3
60 Jamaica 47.7 0.0 0.0 16.3 4.3 47.7 47.7 47.7 29.7
61 New Caledonia 38.2 0.0 0.0 1426.2 2.1 38.2 38.2 38.2 38.2
62 Vietnam 31.0 0.0 0.0 0.3 0.1 31.0 31.0 31.0 31.0
63 Aruba 30.0 0.0 0.0 271.1 168.5 30.0 30.0 30.0 30.0
64 Venezuela 30.0 0.0 0.0 1.0 - 30.0 30.0 0.0 0.0
65 Guadeloupe 26.8 0.0 0.0 5.90 16.5 26.8 26.8 26.8 26.8
66 Cabo Verde 25.5 0.0 0.0 47.4 6.3 25.5 25.5 25.5 2.8
67 Reunion Island 23.4 0.0 0.0 27.8 9.3 23.4 23.4 23.4 23.4
68 Colombia 19.5 0.0 0.0 0.4 - 19.5 19.5 19.5 19.5
69 Ecuador 19.0 0.0 0.0 1.2 0.1 19.0 2.5 2.5 2.5
70 Faroe Islands 18.3 14.3 357.5 366.4 13.1 4.0 4.0 4.0 4.0
71 Russia 16.8 0.0 0.0 0.1 - 16.8 16.8 16.8 15.4
72 Guyana 13.5 0.0 0.0 18.4 0.1 13.5 13.5 13.5 13.5
73 Curacao 12.0 0.0 0.0 81.7 27.0 12.0 12.0 12.0 12.0
74 Cuba 11.7 0.0 0.0 1.1 0.1 11.7 11.7 11.7 11.7
75 Bonaire 10.8 0.0 0.0 652.9 36.7 10.8 10.8 10.8 10.8
76 Algeria 10.1 0.0 0.0 0.3 - 10.1 0.1 0.1 0.1
77 Fiji 10.0 0.0 0.0 11.1 0.5 10.0 10.0 10.0 10.0
78 Dominica 7.2 0.0 0.0 98.0 9.6 7.2 7.2 7.2 7.2
79 Israel 6.0 0.0 0.0 0.8 0.3 6.0 6.0 6.0 6.0
80 Belarus 3.4 0.0 0.0 0.4 - 3.4 3.4 3.4 3.4
81 Nigeria 3.2 1.0 45.5 - - 2.2 2.2 2.2 2.2
82 Iceland 3.0 1.2 66.7 9.5 - 1.8 1.8 0.0 0.0
83 Slovakia 3.0 0.0 0.0 0.6 0.1 3.0 3.0 3.0 3.0
84 Vanuatu 3.0 0.0 0.0 11.2 0.2 3.0 3.0 3.0 3.0
85 St. Kitts and Nevis 2.2 0.0 0.0 40.6 8.4 2.2 2.2 2.2 0.0
86 Azerbaijan 2.0 0.0 0.0 0.2 - 2.0 2.0 2.0 0.0
87 Kazakhstan 2.0 0.0 0.0 0.1 - 2.0 2.0 2.0 0.5
88 Antarctica 1.6 0.0 0.0 - - 1.6 1.6 1.6 1.6
89 Jordan 1.5 0.0 0.0 0.2 - 1.5 1.5 1.5 1.5
90 Indonesia 1.4 0.0 0.0 - - 1.4 1.4 1.4 1.4
91 Madagascar 1.2 0.0 0.0 0.1 - 1.2 1.2 1.2 0.0
92 Martinique 1.1 0.0 0.0 2.8 1.0 1.1 1.1 1.1 1.1

18
Report Special Issue 2015
Position 2014
Country/Region
Total capacity
end 2014[MW]
Added capacity
2014[MW]
Growth rate 2014
[%]
Installed Capacity
per CapitaW/person
Installed Capacity per sqkmkW/sqkm
Total capacity
end 2013[MW]
Total capacity
end 2012[MW]
Total capacity end 2011
[MW]
Total capacity
end 2010[MW]
93 Mauritus 1.1 0.0 0.0 0.8 0.5 1.1 1.1 1.1 0.0
94 Falkland Islands 1.0 0.0 0.0 341.1 0.1 1.0 1.0 1.0 1.0
95 United Arab Emirates 0.9 0.0 0.0 0.2 - 0.9 1.0
96 Eritrea 0.8 0.0 0.0 0.1 - 0.8 0.8 0.8 0.8
97 Grenada 0.7 0.0 0.0 6.4 2.0 0.7 0.7 0.7 0.7
98 St. Pierre-et-M. 0.6 0.0 0.0 101.9 2.5 0.6 0.6 0.6 0.6
99 Syria 0.6 0.0 0.0 - - 0.6 0.6 0.6 0.6
100 Samoa 0.5 0.5 ∞ 2.5 - 0.0 0.0 0.0 0.0
101 Namibia 0.2 0.0 0.0 0.1 - 0.2 0.2 0.2 0.2
102 North Korea 0.2 0.0 0.0 - - 0.2 0.2 0.2 0.2
103 Afghanistan 0.1 0.0 0.0 - - 0.1 0.1 - -
104 Bolivia 0.1 0.0 0.0 - - 0.1 0.1 0.1 0.1
105 Nepal 0.1 0.0 0.0 - - 0.1 0.1 - -
Total 371'374 52'565 16.4 318'530 282'608 236'803 197'004
8
Photo: Tian yucai

19
ReportSpecial Issue 2015
8

20
Report Special Issue 2015
The worldwide wind capacity reached 392’927 MW by the end of June 2015, out of which 21’678 MW were added in the first six months of 2015. This increase is substantially higher than in the first half of 2014
and 2013, when 17.6 GW respectively 13.9 GW were added. All wind turbines installed worldwide by mid-2015 can generate 4 % of the world’s electricity demand.
The global wind capacity grew by
5.8% within six months (after 5.6 % in the same period in 2014 and 4.9 % in 2013) and by 16.8 % on an annual basis (mid-2015 compared with mid-2014). In comparison, the annual growth rate in 2014 was lower (16.5 %).
Reasons for the relatively positive development of the worldwide wind markets are certainly the economic advantages of wind power, after all its increasing competitiveness, uncertainties regarding the international oil and gas supply, and the pressing need to go for emission free technologies in order to mitigate climate change and air pollution.
Stefan Gsänger, WWEA Secretary
General: “The world market for wind power is booming like never before, and we expect new record installations for the total year 2015. The main markets are still China – with an astonishing growth of more than 10 Gigawatt within six months – USA, Germany and India. Brazil showed the highest growth rate of all major markets, the country has increased its wind power capacity by 14 % since the beginning of this year.
– 21.7 GW of new installations in the first half of 2015, after 17 GW in 2014– Worldwide wind capacity has reached 392 GW, 428 GW expected for full year– China close to 125 GW of installed capacity– Newcomer Brazil: fourth largest market for new wind turbines
By World Wind Energy Association (WWEA)
Update: Half-year Report 2015

21
ReportSpecial Issue 2015
However, several of the European markets are now very flat, and also the largest European market Germany expects a major slowdown in the coming one to two years, after the
expected regulatory changes are in force.
The wind industry globally is today driven by a large variety of shareholders and stakeholders, from
small and medium sized enterprises, large industries, energy cooperatives to environmental groups. For the future success, it will be crucial to continue and rather increase this variety.”
Major markets-H1 2015 growth rates

22
Inside WWEA Special Issue 2015
New Chair of WWEA Small Wind:Morten V. Petersen
Mr Morten V. Petersen, Chair of the Danish Small Wind Association, has been appointed as new Chair of the WWEA Small Wind section. Mr Petersen has been involved in renewables and in particular in small wind since many years and has also broad international experience, living and working in Europe and Asia.
As Chairman of the small wind section of the World Wind Energy Association, Mr Petersen will guide the work of this group in a voluntary function. In a first statement, he underlined the important role of small wind in the future energy supply and the importance of strict quality standards for this technology.
Morten V. Petersen, Chair of WWEA Small Wind: “Small wind has to play a vital role in the global energy supply, in particular in a more distributed energy system. This is the case for industrialized countries, like my home country
WWEA Small Wind:
WWEA Small Wind has approximately 100 members from all sub-sectors of the small wind industry and is
growing rapidly, in parallel with the growing interest in small wind technology around the world. Amongst the
WWEA Small Wind members are the leading manufacturers of small wind turbines, national small wind associations,
scientists, etc.
The main activities of WWEA Small Wind include the organisation of the annual World Summit for Small Wind,
the main international meeting point of the global small wind community, and the publication of the Small Wind
World Report. On the WWEA Small Wind portal www.small-wind.org, updated market information can be found about
national small wind markets, products and services.
Denmark, but even more in the developing world where small wind hybrid system are often the ideal and only practical solution to provide energy access.
We must be aware that in order to increase small wind share in the global energy mix, the industry has still to grow and mature, with the help of smart government policies which support the uptake of this sector. One key for the success of small wind will be the focus on global and harmonized quality standards."
Stefan Gsänger, WWEA Secretary General: “I look forward to working even more closely with Morten on small wind dissemination strategies. With his many years of his experience, in particular from a business viewpoint, he will be a great asset for WWEA’s work. Small wind is an important technology and has the potential to deliver electricity to hundreds of millions all over the world.”

23
Inside WWEASpecial Issue 2015

24
Inside WWEA Special Issue 2015
Introducing Wind Power
In 2004, Chinese Wind Energy Association (CWEA) and World Wind Energy Association (WWEA) jointly held the 3rd World Wind Energy Conference in Beijing. Being the
president of the WWEA, I became conference chairman, which put me in a very privileged role to get in contact with the leading relevant authorities as well as being responsible of the official opening of the conference.
I had the honour to deliver the opening conference speech where I took the opportunity
China’s Way to Leadership within Wind Energy:Background and FutureBy Preben Maegaard
Nordic Folkecenter for Renewable Energy, Denmark
Meeting at the Planning and Reform Commission, Beijing, February 2004, for preparations of the WWEC2004

25
Inside WWEASpecial Issue 2015
to present my vision and expectancy, that China would become a world leader within wind energy similar to the internationally leading position that China enjoyed within solar thermal energy with more collector area installed by that time than the rest of the world together.
During a preparatory meeting in February 2004 for the WWEC2004 in Beijing at the Planning and Reform Commission, promotion measures for the conference were discussed: How to attract as many visitors and companies to exhibit their products as possible. Based on the experiences from already well-developed wind energy countries, my recommendation to the Chinese authorities was to announce plans of launching an officially guaranteed tariff system. Considering the potential of the long-term market for clean energy technologies in China, the relevant international, industrial sector would not hesitate to use the opportunity to present their products at the WWEC exhibition to secure their share in an emerging market, when realizing that other manufacturers and service companies were already aware of. With companies in big numbers attending, conference participants in significant numbers could have been expected,
was my advice. While previous World Wind Energy Conferences had occupied exhibition floor area of a few hundred square meters and the number of conference participants would count some hundreds, the total exhibition space of the Beijing International Conference Center of 4.000 sqm was now available.
The number of conference participants coming from all parts of the world reached around 2000, including energy ministers, Jürgen Trittin from Germany and Svend Auken from Denmark, two countries with the most advanced wind turbine technology. Among the other international notabilities were Dr. Hermann Scheer, member of the German parliament and president of EUROSOLAR. At the conference, China was officially represented by a major delegation, including Shi Dinghuan, President of the Chinese Renewable Energy Society and prof. He Dexin, President of the Chinese Wind Energy Association.
China’s Take-off Within Wind Power
2005 can be considered as a take-off point
German Minister of Environment, Jürgen Trittin and Dr. Hermann Scheer, MdB and president of EUROSOLAR received the World Wind Energy Award at the WWEC20004 conference ceremony, Beijing 2004 (left); Preben Maegaard with Prof. He Dexin, President of the Chinese Wind Energy Association (right)

26
Inside WWEA Special Issue 2015
for modern wind energy in China. Within the following five years, a historic change occurred to the wind power development in the country. In 2010, China became the country with the largest annual newly-added installed capacity in the world and the largest manufacturing capacity of any country. In 2013, the installed wind power capacity of China reached 16 GW. The accumulated wind power capacity of China reached 91 GW, and the wind power generation of China reached 135 TWh. This made wind power the third biggest source of supply in China in the wake of thermal power and hydropower. Adding of new capacity has continued; in 2014, China installed 23 GW, almost 50% more than the proceeding year and provides a tremendous infrastructural effort and challenge. China has become the country with the largest investments in wind energy in the world, as a global champion of wind power has contributed significantly to the historical turning point of the renewables by the second decade of the century.
China played a special role in the global change to the renewables as new renewable capacity installations in the Non-OECD countries exceeded deployment within the OECD, for the first time in 2013. China’s increasing new
capacity additions of both solar PV and wind made the difference as in 2013, according to REN21, for the first time new renewable power capacity surpassed new fossil fuel and atomic energy accumulated additions in China. Considering the Chinese government’s commitment to implement its wind resources, the installed capacity could grow to more than 217 GW in 2020 and very likely 500 GW by 2030.
The Beginnings of the Development of Wind Power
During my annual visits to China since 2004, it has become my impression, that China in several ways pursues a development within wind energy that is comparable to the Danish way of introducing modern wind energy. In 1980, Denmark began to implement wind power at a commercial level. By 2015, wind power in Denmark accounted for over 40% of its total electric power consumption of 36 TWh, which is more than the 33% share planned by the government. The percentage is calculated to reach 50% by 2020, however, it is likely that it will be significantly higher. The former minister of energy, announced a four times increase of the present
Delegation from Shanghai on the visit to Folkecenter for Renewable Energy, Denmark, in 2005 to discuss transfer of wind energy technology (left); Preben Maegaard, Prof. Gu Weidong and Anna Krenz at the presentation of the book “Wind Power for the World” at the 5th World Non-Grid-Connected Power Conference, Beijing 2013 (right)

27
Inside WWEASpecial Issue 2015
5 GW of wind power to 20 GW. This means that wind power can be expected within a decade or so to cover much more than the present demand for electricity. In case that this promising development materializes, new valuable experiences and knowledge within management of very big shares of intermittent power systems will be achieved which other countries, not least China, will benefit from as well.
When searching for the roots of the story, the focus points especially to the role of Denmark. Here, the first commercial, reliable and affordable wind turbines appeared as the people’s response to the oil crisis in the 1970s. Denmark relied almost 100% on imported oil for heating, electricity and mobility. A paradigm shift within the supply of energy was absolutely necessary. Fortunately, many people had visions and lust to design and manufacture the perfect windmill. Thus, it is a long cavalcade of developers, inventors and manufacturers who each gave their bigger or smaller contributions through the trial-and-error method and countless concepts to the bottom-up process that took its beginning in 1975 and in the course of five to eight years, became a real
modern industry.
The proliferation of contemporary wind power took a few centuries ago. The pioneering country was Denmark with its absolute dominance from 1975 and the following 15 years. With progressive legislation, Germany since 1990 demonstrated that political visions and will, more than good wind resources, soon made Europe’s largest economy the champion of wind energy; and finally China, that in 2005 from a quite low level with a concentrated effort entered the arena and just five years later could celebrate its role as the global No. 1, both in terms of installed and manufacturing wind power capacity. China has shown a direction. There are numerous other countries that still can use it as a role model.
Ten years later, in 2005, China joined the wind energy frontrunners. By opening the door for the best available technology, the nation with the largest population in the world intentionally avoided mistakes that had delayed and derailed the industrialisation within wind energy in several other countries. Chinese leaders from the outset focused on what was
XEMC WIND representatives at the Folkecenter, signing agreement for cooperation for the exchange of technology (left); Preben Maegaard and Anil Kane visiting Goldwind Factory, Beijing, China (right)

28
Inside WWEA Special Issue 2015
already industrial standard within design and wind energy engineering while other countries also with a strong industrial basis continued to search for the ideal wind power concept, built exotic prototypes and failed.
China soon after 2005 gave priority to have its own industry and complete supply chain and consequently got numerous suppliers of wind turbines. Twenty-two foreign manufacturers settled in China and dominated the market with a share of 82%. The balance of 18% was divided among a number of domestic manufacturers some of which had made joint ventures with foreign partners. On the Chinese Top-10 list international companies were numbers one to five in terms of market share while a domestic manufacturer became number six. The biggest windmill was of 850 kW and soon followed by a 1.5 MW well proven design, the next step of development.
Since the China Renewable Energy Law was implemented in 2005, domestic wind farm development and construction grew rapidly resulting in enormous growth rates of wind power equipment manufacturing industry. Wind turbines of 1.5 MW capacity became the standard size and accounted for 75%, while a new generation of 2 MW turbines were introduced and represented 15% of the wind power market in 2011. Following the trend at the international market some of the Chinese manufacturers launched direct-drive wind turbines that accounted for 25% of the market.
During a five years period and a concerted effort a completely new industry emerged that made China the absolute leader both in terms of manufacturing and installed wind power capacity. The main wind turbine components such as blades, hub, gearbox, generator,
inverter, control system and tower were all produced domestically. Local production rate reached more than 90%. Consequently, international companies disappeared from the list of the most produced wind turbines in China. In 2011, the Top-5 wind power manufacturers on the domestic market were Goldwind, Sinovel, United Power, Ming Yang and Dongfeng. Among them Sinovel, Goldwind, United Power and Ming Yang had climbed into the world Top-10 list.
Growing BigSince 2011, a consolidation process took
place. Out of the more than 50 manufacturers that offered wind turbines of 1 MW or bigger, 10 major manufacturers emerged supplying 2.0 MW to 3.6 MW advanced wind turbine systems. Following the trend in other leading wind industry countries, Chinese manufacturers moved into the 5 MW class especially for the first offshore wind farms, that China entered earlier than many other countries and with equipment of own origin. The offshore sector seems to be the driving factor in the continuous up-scaling of the wind turbines. In Denmark the first 8 MW wind turbine with a rotor size of 164 m was installed for testing in 2014 which in itself inspires other manufacturers to climb one step up and develop similar or even larger wind turbines in an apparently never ending effort.
Following trends towards large-capacity wind turbines, basic research should be strengthened to master the design methodologies and technology advances needed to develop advanced large turbines based on China’s wind farm characteristics. Before 2020, 5 MW wind turbines will be commercially deployed and prototype 5 MW to 10 MW offshore systems will materialize. Conceptual

29
Inside WWEASpecial Issue 2015
design and key technology development will be completed for offshore turbines of 10 MW or larger. Prototype certification is expected to be completed for super-large (deep water) offshore systems (10 MW or larger). In China some manufacturers and research institutes already have initiated R&D programs for 10 MW systems, prototypes of which will be available around 2020. This indicates that China belongs to the wind energy league with the will and ability to be among the absolute global leaders in terms of size and technological innovation within a young field of technology.
In the book, “Wind Power for the World”, published in 2013, professor He Dexin, president of the World Wind Association and the Chinese Wind Energy Association, writes, that between 2030 and 2050, wind power, power systems and energy storage technologies in China will further expand the scale, with co-ordinated development of land-based, near offshore and far offshore projects. About 30 GW of capacity will be added annually, accounting for about half of newly installed capacity. By 2050, installed capacity could reach 1 TW, about 26% of total power capacity. Wind power will meet 17% of national electricity consumption and become a major power supply, with a wide range of industrial applications.
Projecting Wind Power
On this background I attempt to make a view into the future with some visions and projections how the global wind energy sector may evolve during the coming decades, realizing the uncertainties that are inherent in such calculations. Seen over a 40-years period, solar and wind power are realistic substitutes
to the fossil fuels, coal, oil and natural gas, that in 2010 delivered 14 000 TWh of the world total electric power demand of around 20 000 TWh. With a theoretical calculation based on a 40-year transitional period of the total substitution of fossil fuels with solar and wind energy, I let 4 000 TWh/y come from solar energy and 10 000 TWh/y from wind.
In terms of wind power, each GW installed capacity will have a yearly output of around 2 TWh, or half of conventional fossil fuel power generation relative to the capacity. Consequently, to replace 10 000 TWh of fossil fuel power production, 5 000 GW capacity of wind turbines will be required. As one GW is the equivalent of 500 wind turbine seach of 2 MW, there will have to be installed 500 x 5 000 GW = 2 500 000 wind turbines with an average size of 2 MW. When manufactured over a 40-years period, about 60 000 wind turbines, as an average, will be needed every year. Considering that a wind turbine has a life time of around 20 years, repowering in the future alone will add a similar number to be manufactured every year.
Furthermore, in the coming decades, the global demand for generating capacity will increase as well with around 100 GW new capacity per year – from 5 500 GW in 2012 to around 7 000 GW conventional power generation capacity by 2030. The manufacturing capacity in such a scenario has to be lifted to the size of order of 150 000 wind turbines of 2 MW equivalents or 300 GW per year. There is a longway to go for the world wind industry to achieve an industrial output of this quantity considering that in the record year 2014, the wind industry supplied 25 000 units (50 GW) of 2 MW wind turbine equivalents. The growth potential over the coming decades
30
Inside WWEA Special Issue 2015
thus is by a factor six more than in the 2014 reference year.
When related to the looming climate crisis and the dwindling fossil fuels, it is necessary to be sober when aiming for the above mentioned production levels for wind turbines, which, not withstanding the size of growth in the sector, still needs several decades to replace the current fossil fuel electricity generation. In addition to meeting existing consumption levels, capacity will have to greatly expand, especially in the developing countries which are currently strongly underserved.
Further growth within wind power manufacturing will have involvement in many industries.
Already at the beginning of the century, the German wind turbine industry consumed more steel than the shipyards in Germany. After the automotive industry, it was the second largest consumer of steel. With strong growth as outlined, the wind energy industry is capable of evolving to become the world's largest consumer of steel and many other
commodities. This would be a strong stimulus for the world economy and employment of some million people. Being a key industry, it will create increased activities in many other industrial sectors as well.
Fluctuating Power – Future Challenges
The various renewable forms of energy (solar, wind, biomass, etc.) can provide an alternative to fossil fuels when they are used in combination with one another. None of the renewable energy forms are capable of covering the need for electricity, heat and transportation if they are used alone. There must be, however, a multiform effort involving many kinds of supply systems, energy storage and saving mechanisms, as well as appropriate user-management strategies.
In areas with high shares of wind or solar availability, these energies will more and more be seen as a base load that periodically covers the supply of power of 100% and often more. Overall, a picture of power systems of the
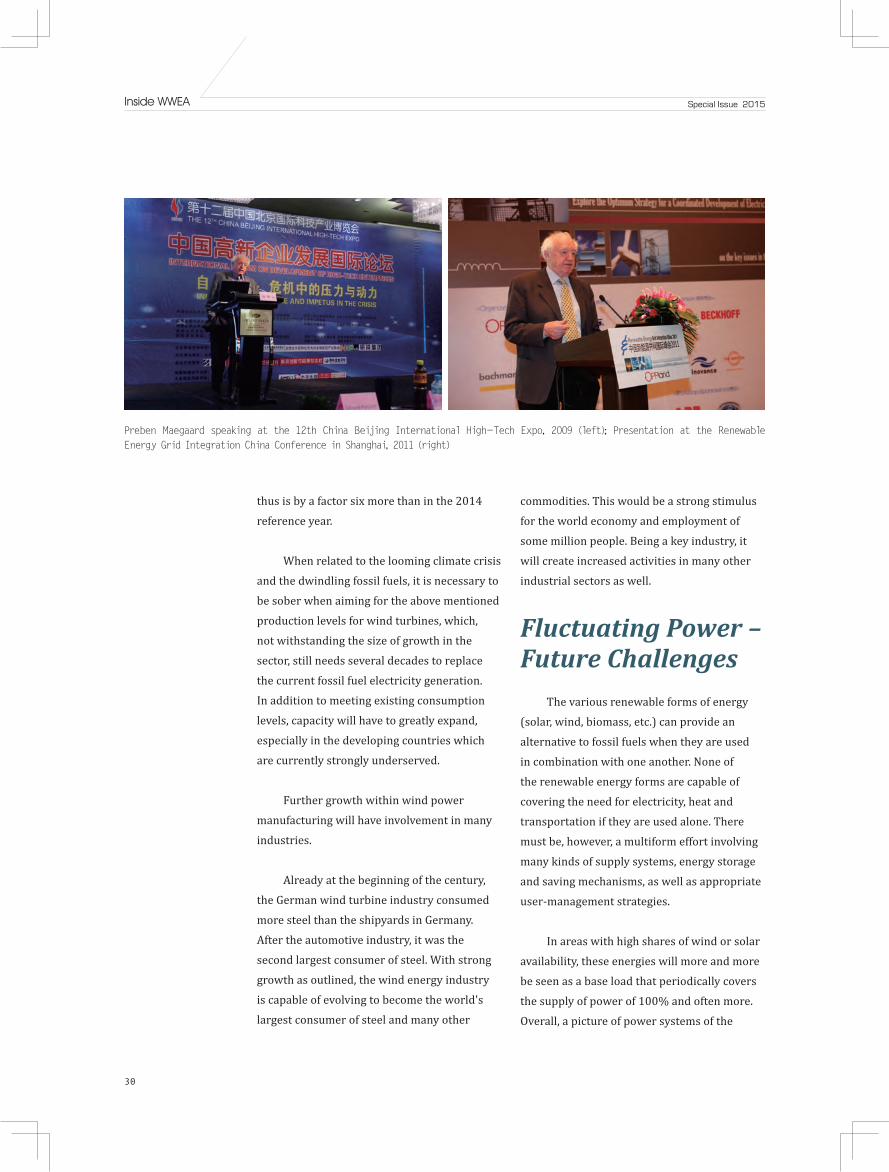
Preben Maegaard speaking at the 12th China Beijing International High-Tech Expo, 2009 (left); Presentation at the Renewable Energy Grid Integration China Conference in Shanghai, 2011 (right)

31
Inside WWEASpecial Issue 2015
future emerges as a complex combination of on-site, mini-grid, and centralized grid levels, with renewables and natural gas generation and energy storage at all levels, and with all levels coordinated and interacting, according to a range of requirements for cost, reliability, flexibility, and service. Future power systems will need to handle flexibility on the demand side as well as on the supply side while maintaining security and reliability in order to compensate for periods of low wind output as well as production peaks.
Some regions and even countries already have relatively high shares of fluctuating power supply. During periods of low peak power demand and high wind speeds, wind power can currently fully cover the national consumption of electricity; at the local level, the share of wind power may even be 400% of actual consumption. Interregional compensation with strong power line connections to neighbouring countries plays an important role for upregulation and downregulation, often at extremely low spot market prices. It may be a short-term solution, as the present importers of excess power most likely in the future will be less interested in buying power as the deployment of fluctuating forms of renewable energy will only increase in neighbouring countries as well. The reality is that new outlets for periodical overcapacities will be required locally.
Stronger two-way cross-border interconnections to transfer renewable power generated in one country to neighbouring countries are increasing, not least in North Western Europe. However, with increased simultaneous amounts of fluctuating power from solar and wind, countries in the same region will try to export their excess power to each other’s systems. From a grid stability
perspective, different storage technologies are suited for different balancing time frames, ranging from seconds to minutes, minutes to hours, and even to days or weeks. As seasonal storage from summer to winter or from windy to calm seasons, huge hot water ponds up to 90°C are emerging in Denmark, a country with high share of district heating.
Electricity storage will be an essential part of the integrated systems that see power supply, mobility, heating and cooling as a whole together with existing possibilities such as demand-side management. These systems should be affordable, sustainable and efficient. By 2015, there exist many different electricity storage systems, but only a few are functional and commercially available. Moreover, these technologies need to be compared by their investment volume, their losses and their potential for centralized and decentralized applications. The storage solutions have to be viewed by their limits, environmental effects, geographical requirements, investment, complexity and efficiency. Furthermore, storage technologies have to be optimized in terms of size and capacity, responding time and flexibility, as well as their cost-effectiveness.
Hydropower is a traditional form of large-scale energy storage on power grids, in the form of both conventional and pumped hydro. Conventional hydropower plants are routinely used to ramp and cycle. For other types of conventional power plants, however, ramping and cycling on a daily or hourly basis can reduce equipment lifetime, cause higher maintenance costs and stability of emissions equipment.
Postponing combustion of biomass (straw, wood chips, pellets) can be considered as a cheap and reliable season-to-season storage

32
Inside WWEA Special Issue 2015
solution where solar and wind energy is the primary sources of supply while stored biomass is the primary back-up fuel. Because biomass functions as an ideal long-term storage solution, and due to its limited availability, it is necessary that it be reserved for combustion in combined heat and power stations with efficiencies of 85% or more. Their primary function is for balancing by upregulation when solar and wind energy cannot cover the demand loads.
The problems associated to this have gradually emerged along with the increase of the percentage of wind power in the total electric power consumption. In Denmark, comprehensive projects and programs for the development of new applications of renewable energy have been launched. Also the Chinese government has made efforts and attempts in the development process of wind power to match with the new situation as wind energy and other new energy resources are generally by nature unstable, thus leading to significant fluctuations of their electric output. This is bringing big challenges to the utilization of electric power, which calls for innovation and
new advanced concepts in various countries, including China.
In this process, professor GuWeidong, Nanjing University, has conducted a Chinese national “973” research program and put forward the pioneering non-grid-connected development model. He proposes that a smart grid system based on the non-grid-connected coordinated power supply of multiple and new energy resources should be set up. The theory mentioned has sparked a new field for the worldwide multiple application of large-scale wind and solar power for the manufacturing of basic industrial products and services for which there will a big demand in a post-fossil-fuel age as well. These research fields are unprecedented worldwide and open up for new ways of integrating huge quantities of excess power.
In 2005, I first had the theory presented in combination with the ambitious Dongtai Green City project in the Jiangsu Province also pioneered by professor Gu. It consists of 100 000 MW wind energy capacity in the shallow waters of the Yellow Sea, which set new
Preben Maegaard and Prof. Gu Weidong, at the International Renewable Energy Agency (IRENA), Abu Dhabi (left); Visit to the Institute of Macro Economics, Nanjing University (right)

33
Inside WWEASpecial Issue 2015
dimensions for viewing the prospects of wind energy and its application within traditional energy intensive industrial sectors.
At several international conferences, at IRENA, and at various workshops the theory has been presented as China’s contribution to bring answers to an emerging concern especially in the utility sectors worldwide associated with the rising amounts of fluctuating power. As Denmark with its more than 40% wind energy is facing special excess power problems, I have at various occasions referred to the non-grid-connected concept. Thus, the achievements have been playing an important role for bringing new answers to the energy development of China and the world at large.
Examples of innovative use of solar and wind energy include: Large-scale non-grid-connected wind-power seawater desalination; Large-scale direct wind-power hydrogen and oxygen production; Non-ferrous metallurgical industry; Wind/methane power-to-gas integration; Wind/hydrogen reduction iron-making. This new system succeeds in making the power grids more flexible and intelligent, i.e. transforming high-energy-consuming industries into new intelligent loads which can carry out peak regulation and balancing for power-grid facilities. While only a limited share of electricity production is fed into national grid, the excess power will be used as a primary energy source for new industrial applications that will need energy back up from storable energy forms like natural gas and biomass.
With such principles as well as the building of full-scale demonstration projects, China has taken leadership and demonstrated to the rest of the world its will and ability to deploy the vast potential of solar and wind energy in a wide variety of practical applications. It should be seen as part of the
take-off of a historical transition that is still at its early stage and within the coming decades will lead to a reformation of basic energy structures in our societies that rely on big amounts of affordable and environmentally beneficial energy solutions.
Looking Forward Renewable energies will have the key
role in the global push toward a CO2-neutral future of energy production. Due to the in-principle unlimited potential of solar and wind resources, in comparison to the current global energy regime, they can be seen as the primary source of supply for meeting the future demand for electricity, heating and mobility, irrespective of their intermittent character.
China has become a large wind power equipment manufacturing country and the country with most wind power installed capacity in the world. Wind power generation has got a substantial place in China's electric power structure which will increase substantially more in the decades to come like it will be the case at the global level as well where the wind power will play a more and more important role in the increasing energy supply, reducing greenhouse gas emissions, driving economic growth, increasing employment and building harmonious societies.
I go fully along with professor He Dexin’s closing remarks in his chapter in the book, Wind Power for the World: Wind is our wealth given by nature. We should cherish it and make good use of it. There are no national boundaries in wind energy utilisation, therefore, as a member of the big family of the world, China will surely exert all the strength and do a good job to leave our children a green, clean earth in the future.

Small Wind and off Grid
34
Special Issue 2015
Africa has abundant renewable energy resources along with (in some countries) major fossil resources, yet the continent is experiencing an energy crisis, as a large share of the population has no access to modern energy services. Access to energy is exceedingly limited, especially in rural areas. This remains a major barrier to economic development, both social and political. Although energy resources are not distributed evenly throughout the continent, there is a huge potential for various renewable energies to widely satisfy the demand of the African population (see map below). The wind across the continent, the watersheds in Central Africa, the fault of the Rift Valley in West Africa, and the sunshine enjoyed continentally, offer wind, hydro, geothermal and solar energy sources that are unparalleled globally. Africa is also the fastest growing region in the world economically:12 out of the 20 fastest growing economies in the world are in Africa, and it is expected that additional economic power will come through improved access to energy.
African Rural Electrification:A Private Sector Perspectiveon Investment ConditionsBy Clément Gaudin, WWEA, with additional contributions from Stefan Gsänger,
Nopenyo Dabla, and Christian Tigges.
Wind power has a great role to play in the access to energy in Africa, as it is among the lowest cost renewable energy solutions available, and is competitive with fossil fuels (especially when taking into account externalities such as climate change).
In many countries hydropower is often the main electricity source, and according to the International Renewable Energy Agency (IRENA),90% to 95% of the total technical hydropower potential in Africa has not been exploited. The situation is similar for solar, which has by far the largest renewable resource potential in Africa. The average annual solar radiation in Africa ranges between 5 and 7 kWh /m², similar to the irradiation found in the Arabian Peninsula, northern Australia, and northern Chile. Yet despite of its high solar irradiation, Africa contributes only a small part of the global PV production capacity.
To overcome the energy crisis in Africa,

Small Wind and off Grid
35
Special Issue 2015
Figure 1: Map of identified renewable energy potential in Africa, made by IRENA
Table 1: list of respondents to the survey
Companies Respondents Countries / regions of activity
STG International Amy Mueller / Director Lesotho
INENSUS NicoPeterschmidt / CEO Senegal
Niger Sahel Energie Sunny Akuopha Mali
Touba Solar Rama General Manager Senegal
Alternative EnergyJean Jacques Cobinah / General
ManagerIvory Coast
Énergie Tilgaz Mali CEO Mali
Rayon Vert Chief Executive Senegal
TERRA Technologies Chief Executive Senegal
Sahel EnergieSolaireAmadou Makane Balla Coulibaly /
Chief ExecutiveSenegal
GIZ / PeracodMme Mireille Ehemba, Project
Manager in Rural ElectrificationSenegal
KAMA - SAKibily Demba Doumbia / Technical
ManagerMali
Renewable Energy Corporation Guenter Boehm / CEO Liberia
Habitat Cohérent et Solution Énergétique (HACSE)
Etienne Sauvage / International Technical Expert
West Africa
Eco-solaris Martin Lambert / General Manager Benin
GERES Benjamin Paillière Mali, Senegal, Benin
CDS Mauritanie Ould Edou Lebatt / General Manager Mauritania
SSD Koraye Abdoulaye Keita / General Manager Mali
KayerSarl Assan Dieng / Chief Executive Senegal
Access SarlDiarra Mahamadou Karamoko /
ExecutiveMali
EgeteerSolaire Condy Dnaw / General Manager Senegal
Vergnet Ludovic Dehondt / Manager Africa

Small Wind and off Grid
36
Special Issue 2015
renewable energy has a great role to play. That is why today there is a need for investment from the private sector to bridge the gap between demand and resource availability. Currently, the investment trend is beginning to change. The African renewable energy market is becoming increasingly attractive for private investors. Notably in South Africa, Morocco, Egypt, Ethiopia, Kenya, and Senegal, many investment opportunities in renewable energy are emerging.
It is in this context that the World Wind Energy Association decided to conduct a study on the market for rural electrification through renewable energies in Western Africa. The association set up a study analysing the private sector, households, and public institutions. This analysis of the private sector involveda survey of companies in Africa,primarily in Mali and Senegal.
One of the main objectives of this survey is to understand the challenges and opportunities that renewable energy companies encounter when they run decentralized rural electrification projects in developing countries. Another important objective is to show the positive effects of rural electrification from the private sector point of view.
Responses provided by surveyed companies show an overview of the private sector in Africa. Responses also help to clarify the opportunities and barriers for a company that has activities in the region. The qualitative and quantitative responses of this study were analysed in order to highlight the most important findings. In total, 13 companies answered our questionnaire and 10 were interviewed. The companies that answered
to the questionnaire have implemented more than 1200 energy projects in 12 countries.
Findings & DiscussionPrivate sector perspective:
The survey results showthatthe most widely used technology is solar and that only threecompanies are using wind, all of which are in Senegal, a region with a large coastal area. Some of the interviewed respondents indicated that it is difficult to find enough windin non-coastal areas.However, it may be possible to find wind energy potential in inland regions.Mali for instance, where, in the Sahelian and Saharan zones, the annual average wind speed is estimated at 3 m/s to 7 m/s. 1
The results reveal that rural electrification projects are commonly driven by three main
Figure 2: Type of renewable energy used by selected operators
Figure 3: Share of respondents that have generated profit without any international grants/donations or governmental aid
1. AFDB & Climate Investment Funds (2015), Mali country profile, Renewable Energy in Africa, http://www.afdb.org/fileadmin/uploads/afdb/Documents/Generic-Documents/Profil_ER_Mal_Web_light.pdf.

Small Wind and off Grid
37
Special Issue 2015
reasons (with some overlap): economic (70%), social reasons (64%) and energy access (64%).Thusrural electrification projects are mostly initiated by economic opportunity. Although not all of the projects may be profitable, 40% of the respondents in Mali and Senegal have reported that they developed profitable projects without any international subsidies or governmental aid. Concluded from the data, the result is that 50% of the respondents have generated profit by running these projects in Africa.
For the private sector, there are still several remaining problems that make profit complicated. According to respondents from Mali, Senegal and Ivory Coast, reliability of payment is the biggest barrier: 100% of the respondents said it has been a challenge.Mali for instance, faces extreme poverty which affects more than two-thirds of its population: 72% of Malians livewith less than $2 US a day, and half of them live on less than $1 US a day. Furthermore, poverty is essentially rural, where the incidence of poverty reaches73%, as opposed to 20% in urban areas. 2The average monthly income of an inhabitant from ruralMali is 29,640 FCFA (45 €). 3With a large part of the economic activity based on agriculture (see figure 4), the rural population has also unpredictable incomes. Unpredictability combined with low incomes, leaves rural people with low purchasing power. The economic situation in Mali is not isolated and similar situations can be found throughout West Africa. 4
With agricultural seasonal incomes, rural people might be more willing and able to pay
in the harvest season than in other periods. In this context, the entrepreneurs have to find an adapted offer to make their projects profitable.Presently some successful business models do exist, but there is not one business model that can be applied for all rural electrification projects. However, more and more successful business models are appearing.
For one company we interviewed, their business model relied ona loan system for villagers. Individual kits were sold and financed by a credit facility provided by the company, but only if the kits could develop users’ activities (such as handicrafts). In this system, userscould repay the loan from the benefits of their new activities. For another company in Senegal, which has mostly farmers as a clientele, the problem was that farmers couldn’t pay monthly. In this case they were paying with a credit facility, but according to the entrepreneur, this system might be risky if farmers were to accumulate too many loans. In the context of irregular income, maintaining flexibility in the payment schedule and aligning payments with agricultural crops could be an option to prevent payment
Figure 4: Principal economic activities, in villages electrified by respondents
2. CollectifsStratégiesAlimentaires (2011), Rapport pays: Mali, http://www.csa-be.org/IMG/pdf_Rapport_Mali_FINAL.pdf.3. FRES (2013), Rapport Annuel, http://www.fres.nl/wp-content/uploads/2015/03/2013_FR_FRES_jaarverslag.pdf.4. Assemblée Nationale Française (2015), La stabilité et le développement de l’Afrique francophone, http://www.assemblee-nationale.fr/14/rap-info/i2746.asp#P16_342.

Small Wind and off Grid
38
Special Issue 2015
defaults. For example, the payment could be made the day of the market with a higher price during the harvest season. Using a prepaid card might also be a solution because of its flexibility, but only a properly conducted study would allow us to consider which solution is the more suitable. 5Alternately, a report by Peracod, a program created by the Senegalese government, the Deutsche Gesellschaft für Internationale ZusammenarbeitGmbH (GIZ) and other international development agencies, documents successful business models for profitable rural electrification projects in Senegal.6Although older (2006), this report could still prove useful for current business models.
Around 90% of the companies surveyed have their services paid directly by the villagers (the end users).The same companies are supported by governments or international organizations in development and installation of the associated infrastructure. This shows that although a majority of the villages can pay for the service, they cannot pay for the installation investment. Consequently, companies, villagers or communities need to find other sources of finance, like banks, private investors etc. However, for the West African entrepreneurs, finance from national banks is very difficult to find, and this is considered to be a barrier by 90% of the respondents. During the establishing of a
Table 2: Evaluated operational challenges
Evaluation of challenges during the exercise of the activity
Did you perceive these following factors as challenges during the exercise of your activities? Yes No
Taxation 70% 30%
Availability of qualified personal 75% 25%
Competitive situation 14% 86%
Social factors (culture, organization in the villages…) 44% 56%
Quality of the equipment 56% 44%
Reliability of payment 100% 0%
The importation of goods 78% 22%
Table 3: Evaluated structural barriers
Evaluation of barriers during the establishing of the project
Did you perceive these following factors as barriers during the establishing of your projects? Yes No
Supporting policies in general 88% 12%
Administrative procedures (bureaucracy in terms of immigration, company’s creation...) 25% 75%
Evaluation of costs 60% 40%
Finance from national public institutions 50% 50%
Finance from international public institutions 50% 50%
Finance from the national banks 89% 11%
Finance from the international banks 50% 50%
Available market information 60% 40%
5. Julie Bobée (2010), L'électrification rurale par l'énergie solaire. Etude de cas au Bénin,http://www.memoireonline.com/11/10/4073/Lelectrification-rurale-par-lenergie-solaire-Etude-de-cas-au-Benin.html. 6. Peracod (2006), Modèle d’électrification rurale pour localités de moins de 500 habitants au Sénégal, http://www.peracod.sn/IMG/pdf/modele_electrification_des_localites_de_500hab.pdf.

Small Wind and off Grid
39
Special Issue 2015
project, the access to finance from private investors or banks is very limited because they need more guarantee.
What are the barriers to profitable projects?
Tables 1 and 2 present the findings of two questions intending to identify the barriers during the activity and establishment of the project. The factors by themselves where not treated as a “barrier” or a “challenge”, since the questions were structured in a neutral tone it was solely dependenton the respondents’ answers. Taxation, for instance, has been identified as a challenge by 70% of the respondents.
Barriers identification
As noted above, reliability of payment is a major obstacle to profitable projects, but there areother barriers as well.Again, taxation has been described as an obstacle for profitability. In Mali, 50% of the respondents reported that taxation has been a barrier. However, the government is making an effort on this point. There exists a decree on suspension of the value added tax (VAT) and duties on imported renewable energy equipment. It abolishes these taxes for five years starting from September 2009, thereby promoting the import of solar panels, solar lamps and other RE equipment. The decree was renewed – and improved – in early 2014, for the next five years to come.
In Senegal, 83% of the respondents reported that taxation has been a barrier. Yet as in Mali there existsa legal framework, created to facilitate the importation of renewable energy products. Material is reportedly "tax-free" but according to Condy Ndaw and Assane Dieng, two Senegalese entrepreneurs, the reality is
somewhat different. It is complicated to obtain this exemption, as you need to pass by the ministry and obtain a letter of exemption which takes excessive time. Moreover, 88% of the entrepreneurs interrogated in Mali and Senegal said that supporting policies in general remain a barrier for the establishing of a project.
Another important obstacleis the importation of goods; for Mali and Senegal, almost 80% of the respondents said it represents a barrier. Guenter Boehm, an entrepreneur in Liberia, West Africa, described in an interview that importation of goods requires time mainly because of customs. According to him, the customs are time consuming and sometimes non transparent. The seriousness of this statement can be confirmed by the map of Borderless below, which shows a complex road governance situation in ECOWAS.
Availability of qualified personal has also been described as a challenge by 75% of the respondents. For Mali and Senegal, nearly 65% of the respondents reported that they had to provide technical training for villagers.
On the other hand, competitive situations were not reported as a barrier by 86% of the respondents. This in fact suggests a good opportunity for many entrepreneurs as low competition leaves more freedom in the market.
Indeed, several barriers remain and the risk of investing in rural electrification is still high for the moment, as there is no guarantee on return of investment. The respondents from the survey also illustrated the financial riskfor rural electrification projects, which 70% of the respondents even found strong or very strong. A large portion (77%) indicated that their financial performance was worse than what they had expected. However, capital and

Small Wind and off Grid
40
Special Issue 2015
Pablo Caldeiro
Figure 5: Financial performances of selected operators
Figure 6: Political risk evaluated by respondents
Figure 7: Financial risk evaluated by respondents
Figure 8: Map of road governance in ECOWAS’ countries in 2013

Small Wind and off Grid
41
Special Issue 2015
operational expenses were never higher than 30% off from the original expectations.Also, if financial performances were mostly worse than expected, technical performances were generally as or better than expected. Furthermore, 70% of the respondents described political risk as rather weak in Mali and Senegal.
Positive effects of rural electrification from the private sector perspective
The figure below presents the findings concerning the positive effects from rural electrification by renewable energies. For this question, the respondents rated each of the following categories on a scale of one to five: one meaning the category had no positive effect, and five meaning the category had the best possible positive effect.
This figure shows the results of 11
respondents (from Mali and Senegal) and the average of their answers. For instance, according to the average response, the availability of electricity has a substantial positive effect on the increase of the existent economic activity.
At the end, 91% of the respondents thought that the projects were worth pursuing.
ConclusionThere is still a high perceived financial
risk for investment in rural electrification based
on renewable energy in West Africa. In order
to decrease the risk for an entrepreneur or
an investor, solutions must be found. Several
respondents pointed out the necessity of
improvement in the legal frameworks and
incentive policies. The following points are a non-
exhaustive list of ideas that may help to increase
Figure 9: Qualitative measurement of the positive effects brought by electricity in rural villages
Figure 10: Proportion of respondents who thought their projects were worth pursuing

Small Wind and off Grid
42
Special Issue 2015
the attractiveness and thus the development of RE
in the developing world:
Government:
• Creation of facilities and favourable policies for new entrepreneurs in RE:
- Remove taxes like VAT and importation taxes at the beginning of the activity (first 5 years) and then decrease them with time (example: reduce VAT consecutively for the following 5 years).
- Make the exemption of taxes easy to obtain and guarantee its implementation.
- Create a feed-in tariff, but “easy” to obtain.- Creation of a certification system to
improve material quality and have a fair competitive situation.
Government / other international institutions:
• Give more resources to national rural electrification agencies in orderto give them more capacity to create policies and promote renewable energies.
• Establish a detailed study on business models for rural electrification projects, as has been done by Peracod in 2006. For instance,
create a business model for rural electrification projects in Mali, for villages from more than 500 inhabitants.
• Establish capacity building programmes to educate local communities, entrepreneurs, government officials and the national banks on hybrid power systems.
Private sector:
• The private sector should organize,with NGOs and development agencies, a pressure group in order to submit concrete recommendations to the government about favourable policies for RE, at a regional (eg.,ECOWAS) or national level, which can be supported by international organisations.
• Make the technology affordable to villagers through a credit system, as the investment is a problem. This system would require a reliable risk analysis and a plan of the future economic growth.
• To follow the development of new economic activities and the increasing of the demand.
• For a company, to maintain the systems in place is important to assure credibility. But this charge has to be transferred on to the price.
AFDB & Climate Investment Funds (2015), Mali country profile, Renewable Energy in Africa, http://www.afdb.org/fileadmin/uploads/afdb/Documents/Generic-Documents/Profil_ER_Mal_Web_light.pdf.
CollectifsStratégiesAlimentaires (2011), Rapport pays: Mali, http://www.csa-be.org/IMG/pdf_Rapport_Mali_FINAL.pdf.
FRES (2013), Rapport Annuel,http://www.fres.nl/wp-content/uploads/2015/03/2013_FR_FRES_jaarverslag.pdf.
Assemblée NationaleFrançaise (2015), La stabilitéet le développement de l’Afrique francophone, http://www.assemblee-nationale.fr/14/rap-info/i2746.asp#P16_342.
Atlas NEPAD (may 2013), Une nouvelle ruralitéémergente,http://issuu.com/cirad/docs/atlas_nepad_version_fran__aise_mai_.
Julie Bobée (2010), L'électrificationruraleparl'énergiesolaire. Etude de cas au Bénin,http://www.memoireonline.com/11/10/4073/Lelectrification-rurale-par-lenergie-solaire-Etude-de-cas-au-Benin.html.
Peracod (2006), Modèled’électrificationrurale pour localités de moins de 500 habitants au Sénégal, http://www.peracod.sn/IMG/pdf/modele_electrification_des_localites_de_500hab.pdf.
IRENA (2014), L’Afrique et les énergies renouvelables,https://www.irena.org/documentdownloads/publications/afrique_énergies_renouvelables.pdf.
Refe
renc
e

Regional Focus
43
ISSUE 2 June 2015

Regional Focus
44
ISSUE 2 June 2015

GamesaofficialsiteGamesa_official /
Extensive knowledge of our customersʼ needs, acquired during our 21 years in the business, endorse the versatility of the Gamesa 2.0-2.5 MW platform and its unmatched track record, with 18 GW installed worldwide. This platform, which boasts average fl eet availability of over 98%, guarantees capital-light, low-maintenance power production. That makes us the most flexible and trustworthy ally in global wind technology solutions.
AF GAMESA 2015 2MW WINDPOWER.indd 1 18/03/15 09:04
