buletini mujor - ballina no.172... · 2017-05-07 · monthly statistics bulletin, no. 172,...
TRANSCRIPT

Buletini MujorStatistikor
B A N K A Q E N D R O R E E R E P U B L I K Ë S S Ë K O S O V Ë S
C E N T R A L N A B A N K A R E P U B L I K E K O S O VA
C E N T R A L B A N K O F T H E R E P U B L I C O F K O S O V O
D E C E M B E R 2 0 1 5 / N O . 1 7 2
Monthly Statistics Bulletin

2 |
Efficiency of Banks in South-East Europe: With Special Reference to Kosovo CBK Working Paper no. 4

| 1
Buletini Mujor Statistikor
December 2015 Monthly Statistics Bulletin
BANKA QENDRORE E REPUBLIKËS SË KOSOVËS
CENTRALNA BANKA REPUBLIKE KOSOVA
CENTRAL BANK OF THE REPUBLIC OF KOSOVO
Monthly Statistics Bulletin

2 |
Monthly Statistics Bulletin December 2015
MONTHLY STATISTICS BULLETIN No. 172, December 2015
Prepared by the Statistics Department, Central Bank of the Republic of Kosovo
Bedri Zymeri, Director, Statistics Department
For information regarding this publication, please contact:
Statistics Department, Central Bank of the Republic of Kosovo
Garibaldi 33, Prishtinë 10000
Tel: +381 38 222 055 extention 114
E-mail: [email protected]
Monthly Statistics Bulletin (MSB) is a standard source of statistics on four sectors of the economy. MSB
publishes current information on selected macroeconomic indicators for Kosovo, data on financial sector
(surveys on financial corporations, balance sheets, income statements, depozits, loans, interest rates,
exchange rates, payments system, etc.), data on external sector (balance of payments, international
investment position, foreign direct investments, external debt, international trade in goods, etc.), as well as
other data on key indicators on the fiscal sector and the real sector. MSB is published monthly.
Copyright © 2015, Central Bank of the Republic of Kosovo
Users of these data are requested to cite the source.
Suggested citation: Central Bank of the Republic of Kosovo
Monthly Statistics Bulletin, No. 172, Prishtina 2015
Address:
Central Bank of the Republic of Kosovo
Garibaldi 33, Prishtina 10000
Fax: +381 38 243 763
Tel: +381 38 222 055
E-mail: [email protected]
Web: www.bqk-kos.org

| 3
Buletini Mujor Statistikor
December 2015 Monthly Statistics Bulletin

4 |
Monthly Statistics Bulletin December 2015
ABBREVIATIONS:
BOP Balance of Payments
BPM5 Balance of Payments Manual (fifth edition)
CBK Central Bank of the Republic of Kosovo
CEFTA Central European Free Trade Agreement
CPI Consumer Price Index
DC Depository Corporations
ECB European Central Bank
ESA 95 European System of Regional and National Accounts 1995
EU European Union
EULEX European Union Rule of Law Mission
FA Financial Auxiliaries
FC Financial Corporations
FDI Foreign Direct Investments
GDP Gross Domestic Product
IC Insurance Companies
IMF International Monetary Fund
IRR Interest Rate Report
KPST Kosovo Pension Saving Trust
MFSM Manual on Monetary and Financial Statistics
NFA Net Foreign Assets
NFC Non Financial Corporations
NPISH Nonprofit Institutions Serving Households
ODC Other Depository Corporations
OFC Other Finanical Corporations
OFI Other Financial Intermediaries
PAK Privatization Agency of Kosovo
PF Pension Funds
SBR Statistical Bank Report
SNA 93 United Nations System of National Account 1993
TPL Third Party Liability
UNMIK United Nations Interim Administration Mission in Kosovo
VAT Value Added Tax
CONVENTIONS:
“ “ event does not exist
“ . “ event exists, data are not available
“…“ nil or negligible
( e ) estimated
( p ) preliminary
revised data are marked by “bold”
NOTE: For detailed description refer to explanatory notes. Monthly Statistics Bulletin, No. 172, Prishtinë 2015. Any correction that may be required will be made in the web site version. This publication includes the data available until 31 January 2016.

| 5
Buletini Mujor Statistikor
December 2015 Monthly Statistics Bulletin
CONTENTS
SELECTED MACROECONOMIC INDICATORS ----------------------------------------------------------- 09
PART I. GRAPHICAL PRESENTATION --------------------------------------------------------------------- 11
1. Financial corporations assets --------------------------------------------------------------------- 11
2. FC net foreign assets ------------------------------------------------------------------------------- 11
3. Growth of net foreign assets at FC -------------------------------------------------------------- 11
4. Sectoral breakdown of deposits at CBK -------------------------------------------------------- 12
5. Sectoral and currency breakdown of deposits at ODC ------------------------------------- 12
6. Maturity breakdown of deposits at ODC -------------------------------------------------------- 12
7. Sectoral breakdown of loans at ODC ----------------------------------------------------------- 13
8. Sectoral breakdown of new loans at ODC ----------------------------------------------------- 13
9. Other depository corporations loans by economic sectors -------------------------------- 13
10. Maturity breakdown of ODC loans --------------------------------------------------------------- 14
11. Growth of loans and deposits at ODC ---------------------------------------------------------- 14
12. Interest rates on loans and deposits of ODC -------------------------------------------------- 14
13. ODC income and expenditures ------------------------------------------------------------------- 15
14. Growth of income at ODC and contribution to the growth --------------------------------- 15
15. Growth of expenditures at ODC and contributions to the growth ------------------------- 15
16. Interest rates on loans of OFI --------------------------------------------------------------------- 16
17. OFI new loans by sectors -------------------------------------------------------------------------- 16
18. Maturity breakdown of OFI loans ----------------------------------------------------------------- 16
19. OFI loans by sectors -------------------------------------------------------------------------------- 17
20. OFI loans by economic sectors ------------------------------------------------------------------- 17
21. International transfers through money transferring agencies------------------------------ 17
22. Kosovo budget ---------------------------------------------------------------------------------------- 18
23. Consumer Prices Index ----------------------------------------------------------------------------- 18
24. Consumer Prices Index, main categories ----------------------------------------------------- 18
25. Imports and producer prices----------------------------------------------------------------------- 19
26. Exchange rates against euro currency --------------------------------------------------------- 19
27. Real effective Exchange rate ---------------------------------------------------------------------- 19
28. Trade balance ----------------------------------------------------------------------------------------- 20
29. Exports of goods ------------------------------------------------------------------------------------- 20
30. Imports of goods ------------------------------------------------------------------------------------- 20
31. Balance of Payments of Kosovo ----------------------------------------------------------------- 21
32. Current account -------------------------------------------------------------------------------------- 21
33. Financial account ------------------------------------------------------------------------------------ 21
34. International investments position --------------------------------------------------------------- 22
35. International investments position, by sectors ------------------------------------------------ 22
36. Direct investments, by main countries ---------------------------------------------------------- 22
37. Reserve assets --------------------------------------------------------------------------------------- 23
38. Gross external debt ---------------------------------------------------------------------------------- 23
39. Gross external debt, by creditors ----------------------------------------------------------------- 23
PART II. STATISTICAL TABLES ------------------------------------------------------------------------------ 25
1. FC survey ---------------------------------------------------------------------------------------------- 25
1.1. NFA and domestic claims ------------------------------------------------------------------ 25
1.2. Liabilities --------------------------------------------------------------------------------------- 26
2. DC survey ---------------------------------------------------------------------------------------------- 27
2.1. NFA and domestic claims ------------------------------------------------------------------ 27

6 |
Monthly Statistics Bulletin December 2015
2.2. Liabilities --------------------------------------------------------------------------------------- 28
3. CBK survey -------------------------------------------------------------------------------------------- 29
3.1. NFA and domestic claims ------------------------------------------------------------------ 29
3.2. Liabilities --------------------------------------------------------------------------------------- 30
4. ODC survey -------------------------------------------------------------------------------------------- 31
4.1. NFA and domestic claims ------------------------------------------------------------------ 31
4.2. Liabilities --------------------------------------------------------------------------------------- 32
5. OFC survey -------------------------------------------------------------------------------------------- 33
5.1. NFA and domestic claims ------------------------------------------------------------------ 33
5.2. Liabilities --------------------------------------------------------------------------------------- 34
6. Other intermediary financial survey -------------------------------------------------------------- 35
6.1 Net foreign assets and internal claims --------------------------------------------------- 35
6.2 Liabilities ----------------------------------------------------------------------------------------- 36
7. Insurance companies survey ---------------------------------------------------------------------- 37
7.1 Net foreign assets and internal claims ---------------------------------------------------- 37
7.2. Liabilities ---------------------------------------------------------------------------------------- 38
8. Pension funds survey ------------------------------------------------------------------------------- 39
8.1. Net foreign assets, internal claims and liabilities -------------------------------------- 39
9. Financial auxiliaries survey ------------------------------------------------------------------------ 40
9.1. Net foreign assets and internal and internal claims ----------------------------------- 40
9.2. Liabilities ---------------------------------------------------------------------------------------- 41
10. CBK balance sheet ---------------------------------------------------------------------------------- 42
10.1. Assets ------------------------------------------------------------------------------------------ 42
10.2. Liabilities --------------------------------------------------------------------------------------- 43
11. ODC balance sheet ---------------------------------------------------------------------------------- 44
11.1. Assets ------------------------------------------------------------------------------------------ 44
11.2. Liabilities --------------------------------------------------------------------------------------- 45
12. Deposits at ODC ------------------------------------------------------------------------------------- 46
12.1. Euro deposits --------------------------------------------------------------------------------- 46
12.2. NFC, euro deposits ------------------------------------------------------------------------- 47
12.3. Households and NPISH, euro deposits ------------------------------------------------ 48
12.4. FC, euro deposits---------------------------------------------------------------------------- 49
12.5. Non-euro deposits --------------------------------------------------------------------------- 50
13. ODC loans --------------------------------------------------------------------------------------------- 51
13.1. Main sectors ---------------------------------------------------------------------------------- 51
13.2. New loans------------------------------------------------------------------------------------- 52
13.3. Main economic sectors -------------------------------------------------------------------- 53
13.4. Industry, electricity and construction --------------------------------------------------- 54
13.5. Services ---------------------------------------------------------------------------------------- 55
14. ODC effective interest rates ----------------------------------------------------------------------- 56
14.1. Deposit interest rate ------------------------------------------------------------------------ 56
14.2. Loan interest rates -------------------------------------------------------------------------- 57
15. ODC income statement ----------------------------------------------------------------------------- 58
15.1. Income and expenditures ----------------------------------------------------------------- 58
16. Other financial intermediaries balance sheet -------------------------------------------------- 59
16.1. Assets ----------------------------------------------------------------------------------------- 59
16.2. Liabilities -------------------------------------------------------------------------------------- 60
17. Other financial intermediaries loans ------------------------------------------------------------- 61

| 7
Buletini Mujor Statistikor
December 2015 Monthly Statistics Bulletin
17.1. Maturity ---------------------------------------------------------------------------------------- 61
17.2. Economic sectors -------------------------------------------------------------------------- 62
17.3. New loans------------------------------------------------------------------------------------- 63
17.4. Nonfinancial corporations new loans --------------------------------------------------- 64
17.5. Household new loans(1) ------------------------------------------------------------------ 65
17.6. Household new loans(2) ------------------------------------------------------------------ 66
18. Other financial intermediaries effective interest rates --------------------------------------- 67
18.1. Loan interest rates -------------------------------------------------------------------------- 67
19. Other financial intermediaries income statement --------------------------------------------- 68
19.1. Income and expenditures ----------------------------------------------------------------- 68
20. Other financial intermediaries balance sheet -------------------------------------------------- 69
20.1. Assets and liabilities ------------------------------------------------------------------------ 69
21. Financial auxiliaries balance sheet -------------------------------------------------------------- 70
21.1. Income and expenditures ----------------------------------------------------------------- 70
22. Financial auxiliaries international transfers ---------------------------------------------------- 71
22.1. Incoming and outgoing transfers -------------------------------------------------------- 71
23. Payment system -------------------------------------------------------------------------------------- 72
23.1. Selected indicators ------------------------------------------------------------------------- 72
24. Foreign transfers ------------------------------------------------------------------------------------- 73
24.1. Income and outflow transfers ------------------------------------------------------------ 73
25. IC activity ----------------------------------------------------------------------------------------------- 74
25.1. Income premiums and paid claims ----------------------------------------------------- 74
26. Kosovo budget ---------------------------------------------------------------------------------------- 75
26.1. Structure of revenues ---------------------------------------------------------------------- 75
26.2. Structure of expenditures ----------------------------------------------------------------- 75
27. Gross domestic product ---------------------------------------------------------------------------- 76
27.1. Expenditure approach --------------------------------------------------------------------- 76
27.2. Approach by economic activity ---------------------------------------------------------- 76
28. Prices (CPI) -------------------------------------------------------------------------------------------- 77
28.1. Main components --------------------------------------------------------------------------- 77
28.2. Imports and producer prices ------------------------------------------------------------- 78
29. Balance of payments -------------------------------------------------------------------------------- 79
29.1. Main components --------------------------------------------------------------------------- 79
29.2. Current account ----------------------------------------------------------------------------- 80
29.3. Goods ------------------------------------------------------------------------------------------ 81
29.4. Services-net ---------------------------------------------------------------------------------- 82
29.5. Services-credit ------------------------------------------------------------------------------- 83
29.6. Debit ------------------------------------------------------------------------------------------- 84
29.7. Primary income ------------------------------------------------------------------------------ 85
29.8. Secondary income -------------------------------------------------------------------------- 86
29.8.1. Remittances by channels --------------------------------------------------------------- 87
29.8.2. Remittances by country ----------------------------------------------------------------- 88
29.9. Financial account – neto ------------------------------------------------------------------ 89
29.10. Financial account-investments abroad ----------------------------------------------- 90
29.11. Financial account-investments in reporting economy ----------------------------- 91
30. International investments position ---------------------------------------------------------------- 92
30.1 Main components (1) ------------------------------------------------------------------------ 92
30.2 Main components (2) ------------------------------------------------------------------------ 93

8 |
Monthly Statistics Bulletin December 2015
30.3 By sectors -------------------------------------------------------------------------------------- 94
30.4 Assets ------------------------------------------------------------------------------------------- 95
30.5 Liabilities ---------------------------------------------------------------------------------------- 96
30.6 Reconciliation with the balance of payments statistics ------------------------------ 97
31. Direct investments ------------------------------------------------------------------------------------ 98
31.1 By geographical breakdown --------------------------------------------------------------- 98
31.2 By economic activity (flow statistics) ----------------------------------------------------- 99
31.3 By countries (flow statistics) ------------------------------------------------------------- 100
32. External debt ----------------------------------------------------------------------------------------- 101
32.1 Gross position ------------------------------------------------------------------------------- 101
32.2 Gross position by creditors --------------------------------------------------------------- 102
32.3 Solvency plan ------------------------------------------------------------------------------- 102
32.4 Net position ---------------------------------------------------------------------------------- 103
33. Reconciliation statement of portfolio position ------------------------------------------------ 104
33.1 Portfolio investments position ----------------------------------------------------------- 104
34. Trade balance --------------------------------------------------------------------------------------- 105
34.1 Exports by trading partners -------------------------------------------------------------- 105
34.2 Exports by trading partners-European Union --------------------------------------- 106
34.3 Exports by trading partners-CEFTA --------------------------------------------------- 107
34.4 Exports by trading partners-other European and Non-European countries -- 108
34.5 Imports by trading partners -------------------------------------------------------------- 109
34.6 Imports by trading partners-European Union ---------------------------------------- 110
34.7 Imports by trading partners-CEFTA --------------------------------------------------- 111
34.8 Imports by trading partners-other European and Non-European countries -- 112
34.9 Exports by commodity groups----------------------------------------------------------- 113
34.10 Imports by commodity groups --------------------------------------------------------- 114
34.11 Imports by trading partners and main commodity groups ---------------------- 115
34.12 Imports by Broad Economic Categories (BEC) ----------------------------------- 116
35. Exchange rate --------------------------------------------------------------------------------------- 117
35.1 Exchange rate against euro ----------------------------------------------------------- 117
35.2 Nominal and real effective exchange rate ----------------------------------------- 118
PART III. EXPLANATORY NOTES -------------------------------------------------------------------------- 119

| 9
Buletini Mujor Statistikor
December 2015 Monthly Statistics Bulletin
Macroeconomic indicators
Description 2008 2009 2010 2011 2012 2013 2014
In millions of euro
REAL SECTOR 1/
GDP (in millions of euro) 3,616.1 4,022.4 4,204.3 4,594.6 4,949.9 5,232.8 5,375.5
Prices (annual average) 9.4% -2.4% 3.5% 7.3% 2.5% 1.8% 0.4%
Prices ( Year on Year) 0.5% 0.1% 6.6% 3.6% 3.7% 0.5% -0.4%
Employment 24.1% 26.1% n/a n/a 25.6% 28.4% 26.9%
Unemployment 47.5% 45.4% n/a n/a 30.9% 30.0% 35.3%
FINANCIAL SECTOR
Financial corporations assets 3,370.3 4,006.0 4,441.2 4,722.2 5,294.5 5,838.9 5,793.4
of which: ODC 1,808.3 2,204.6 2,455.1 2,649.7 2,829.3 3,059.3 3,185.7
ODC loans 1,183.4 1,289.0 1,458.7 1,698.1 1,763.4 1,805.8 1,882.4
Deposits at ODC 1,444.1 1,744.8 1,936.8 2,104.0 2,279.1 2,449.0 2,537.5
EXTERNAL SECTOR
Balance of Payments -450.5 -273.9 -494.4 -616.4 -367.2 -304.7 -415.8
Current account -460.9 -374.2 -515.7 -658.4 -380.2 -339.4 -437.0
Trade balance of goods -1,644.7 -1,646.3 -1,741.6 -2,047.1 -2,050.1 -1,995.6 -2058.6
Trade balance of services 146.6 227.8 176.4 256.3 323.8 312.2 335.9
Compensation of employees 175.4 168.7 171.6 208.2 214.3 218.9 200.4
Remittances (inflows) 608.7 585.7 584.3 584.8 605.1 620.8 693.7
Capital and financial account -288.4 -113.1 -275.8 -377.5 -141.0 -132.2 -145.0
Direct investments in Kosovo 369.9 295.5 368.5 384.4 229.1 280.2 151.2
Portfoio Investment 109.9 124.8 48.6 57.8 185.7 139.3 13.3
Other Investment -75.1 256.8 -46.7 4.8 -374.9 14.4 22.6
Reseve assets 18.2 -94.8 53.4 -61.2 261.4 -35.7 -57.0
Errors and ommissions 162.1 160.9 218.5 238.9 226.2 172.5 270.8
International Investment Position 912.4 484.2 428.8 133.9 248.8 363.7 297.3
Assets 2,533.7 2,809.5 3,246.7 3,325.1 3,705.1 4,102.6 4,276.6
Liabilities 1,621.2 2,325.3 2,817.8 3,222.9 3,456.3 3,738.8 3,979.3
External debt 736.6 1,191.4 1,371.5 1,428.4 1,517.3 1,608.2 1,737.1
Public external debt na 309.3 325.9 320.0 401.4 383.9 392.8
Privat external debt 736.6 882.1 1,045.6 1,108.4 1,115.9 1,224.3 1,344.3
1 / Source data for the real sector is the Kosovo Agency of Statistics.

10 |
Monthly Statistics Bulletin December 2015
1. Financial corporations assets (M illions of Euro: End of period)
2. Financial corporations net foreign assets
(M illions of Euro: End of period)
3. Growth of financial corporations net foreign assets (Year-on-year)
0
500
1,000
1,500
2,000
2,500
3,000
3,500
Q1 Q2 Q3 Q4 Q1 Q2 Q3 Q4 Q1 Q2 Q3 Q4 Q1 Q2 Q3 Q4 Q1 Q2 Q3 Q4 Q1 Q2 Q3 Q4 Q1 Q2 Q3 Q4 Q1 Q2 Q3 Q4 Q1 Q2 Q3 Q4 Q1 Q2 Q3 Q4
2006 2007 2008 2009 2010 2011 2012 2013 2014 2015
CBK ODC OFC
0
1,000
2,000
3,000
4,000
5,000
6,000
7,000
Q1 Q2 Q3 Q4 Q1 Q2 Q3 Q4 Q1 Q2 Q3 Q4 Q1 Q2 Q3 Q4 Q1 Q2 Q3 Q4 Q1 Q2 Q3 Q4 Q1 Q2 Q3 Q4 Q1 Q2 Q3 Q4 Q1 Q2 Q3 Q4 Q1 Q2 Q3 Q4
2006 2007 2008 2009 2010 2011 2012 2013 2014 2015
CBK assets ODC assets OFC assets
28.8%
65.0%
5.0%
8.1% 4.1%
-0.9%
-8.3%
27.5%
11.2%-4.3%
1.7%
36.3%
22.9%
-4.8%-5.5%
16.8%
26.0%
0.3%
43.5%
32.6%
-22.9%
18.2%
69.7%
7.8%
30.9%
-2.4%
19.6%6.3%
-40%
-20%
0%
20%
40%
60%
80%
Q1 Q2 Q3 Q4 Q1 Q2 Q3 Q4 Q1 Q2 Q3 Q4 Q1 Q2 Q3 Q4 Q1 Q2 Q3 Q4 Q1 Q2 Q3 Q4 Q1 Q2 Q3 Q4 Q1 Q2 Q3 Q4 Q1 Q2 Q3 Q4 Q1 Q2 Q3 Q4
2006 2007 2008 2009 2010 2011 2012 2013 2014 2015
CBK ODC OFC

| 11
Buletini Mujor Statistikor
December 2015 Monthly Statistics Bulletin
4. Sectoral breakdown of deposits at CBK(M illions of Euro: End of period)
5. Sectoral and currency breakdown of deposits at ODC (M illions of Euro: End of period)
6. Maturity breakdown of deposits at ODC(M illions of Euro: End of period)
0
200
400
600
800
1,000
1,200
1,400
1,600
Q1 Q2 Q3 Q4 Q1 Q2 Q3 Q4 Q1 Q2 Q3 Q4 Q1 Q2 Q3 Q4 Q1 Q2 Q3 Q4 Q1 Q2 Q3 Q4 Q1 Q2 Q3 Q4 Q1 Q2 Q3 Q4 Q1 Q2 Q3 Q4 Q1 Q2 Q3 Q4
2006 2007 2008 2009 2010 2011 2012 2013 2014 2015
ODC OFC Central government (transferable deposits) Central government (time deposits) Nonfinanical corporations (public and other)
0
500
1,000
1,500
2,000
2,500
3,000
Q1 Q2 Q3 Q4 Q1 Q2 Q3 Q4 Q1 Q2 Q3 Q4 Q1 Q2 Q3 Q4 Q1 Q2 Q3 Q4 Q1 Q2 Q3 Q4 Q1 Q2 Q3 Q4 Q1 Q2 Q3 Q4 Q1 Q2 Q3 Q4 Q1 Q2 Q3 Q4
2006 2007 2008 2009 2010 2011 2012 2013 2014 2015
Non-residents Government Other financial corporations Public nonfinancial corporations Other nonfinancial corporations Households NPISH
0
500
1,000
1,500
2,000
2,500
3,000
Q1 Q2 Q3 Q4 Q1 Q2 Q3 Q4 Q1 Q2 Q3 Q4 Q1 Q2 Q3 Q4 Q1 Q2 Q3 Q4 Q1 Q2 Q3 Q4 Q1 Q2 Q3 Q4 Q1 Q2 Q3 Q4 Q1 Q2 Q3 Q4 Q1 Q2 Q3 Q4
2006 2007 2008 2009 2010 2011 2012 2013 2014 2015
Methodological change

12 |
Monthly Statistics Bulletin December 2015
7. Sectoral breakdown of loans at ODC(M illions of Euro: End of period)
8. Sectoral breakdown of new loans at ODC(M illions of Euro)
9. Other depository corporations loans by economic sectors(M illions of Euro: End of period)
0
500
1,000
1,500
2,000
2,500
Q1 Q2 Q3 Q4 Q1 Q2 Q3 Q4 Q1 Q2 Q3 Q4 Q1 Q2 Q3 Q4 Q1 Q2 Q3 Q4 Q1 Q2 Q3 Q4 Q1 Q2 Q3 Q4 Q1 Q2 Q3 Q4 Q1 Q2 Q3 Q4 Q1 Q2 Q3 Q4
2006 2007 2008 2009 2010 2011 2012 2013 2014 2015
Other nonfinancial corporations Households Other
0
200
400
600
800
1,000
1,200
1,400
1,600
Q1 Q2 Q3 Q4 Q1 Q2 Q3 Q4 Q1 Q2 Q3 Q4 Q1 Q2 Q3 Q4 Q1 Q2 Q3 Q4 Q1 Q2 Q3 Q4 Q1 Q2 Q3 Q4 Q1 Q2 Q3 Q4 Q1 Q2 Q3 Q4 Q1 Q2 Q3 Q4
2006 2007 2008 2009 2010 2011 2012 2013 2014 2015
Services Industry, e lecricity and construcution Agr icul ture
0
40
80
120
160
200
240
280
320
360
Q1 Q2 Q3 Q4 Q1 Q2 Q3 Q4 Q1 Q2 Q3 Q4 Q1 Q2 Q3 Q4 Q1 Q2 Q3 Q4 Q1 Q2 Q3 Q4 Q1 Q2 Q3 Q4 Q1 Q2 Q3 Q4 Q1 Q2 Q3 Q4 Q1 Q2 Q3 Q4
2006 2007 2008 2009 2010 2011 2012 2013 2014 2015
Nonfinancial corporations Households

| 13
Buletini Mujor Statistikor
December 2015 Monthly Statistics Bulletin
10. Maturity breakdown of ODC loans(M illions of Euro: End of period)
11. ODC loans to deposit ratio and annual growth of loans and deposits (Year-on-year)
12. Interest rates on loans and deposits of ODC
0%
2%
4%
6%
8%
10%
12%
14%
16%
18%
Q1 Q2 Q3 Q4 Q1 Q2 Q3 Q4 Q1 Q2 Q3 Q4 Q1 Q2 Q3 Q4 Q1 Q2 Q3 Q4 Q1 Q2 Q3 Q4 Q1 Q2 Q3 Q4 Q1 Q2 Q3 Q4 Q1 Q2 Q3 Q4 Q1 Q2 Q3 Q4
2006 2007 2008 2009 2010 2011 2012 2013 2014 2015
Loan interest rates Deposit in terest rates
0%
10%
20%
30%
40%
50%
60%
70%
80%
90%
Q1 Q2 Q3 Q4 Q1 Q2 Q3 Q4 Q1 Q2 Q3 Q4 Q1 Q2 Q3 Q4 Q1 Q2 Q3 Q4 Q1 Q2 Q3 Q4 Q1 Q2 Q3 Q4 Q1 Q2 Q3 Q4 Q1 Q2 Q3 Q4 Q1 Q2 Q3 Q4
2006 2007 2008 2009 2010 2011 2012 2013 2014 2015
Loans/deposist ratio Deposits Loans
0
500
1,000
1,500
2,000
2,500
Q1 Q2 Q3 Q4 Q1 Q2 Q3 Q4 Q1 Q2 Q3 Q4 Q1 Q2 Q3 Q4 Q1 Q2 Q3 Q4 Q1 Q2 Q3 Q4 Q1 Q2 Q3 Q4 Q1 Q2 Q3 Q4 Q1 Q2 Q3 Q4 Q1 Q2 Q3 Q4
2006 2007 2008 2009 2010 2011 2012 2013 2014 2015
Up to 1 year Over 1 year and up to 2 years Over 2 years and up to 5 years Over 5 years and up to 10 years Over 10 years
Methodological change
Methodological change

14 |
Monthly Statistics Bulletin December 2015
13. ODC income and expenditures(M illions of Euro: End of period)
14. Growth of income at ODC and contribution to the growth (Year-on-year)
15. Growth of expenditures at ODC and contributions to the growth(Year-on-year)
-50
0
50
100
150
200
250
300
Q1 Q2 Q3 Q4 Q1 Q2 Q3 Q4 Q1 Q2 Q3 Q4 Q1 Q2 Q3 Q4 Q1 Q2 Q3 Q4 Q1 Q2 Q3 Q4 Q1 Q2 Q3 Q4 Q1 Q2 Q3 Q4 Q1 Q2 Q3 Q4 Q1 Q2 Q3 Q4
2006 2007 2008 2009 2010 2011 2012 2013 2014 2015
Income Expenditures Net income
-10%
-5%
0%
5%
10%
15%
20%
25%
30%
35%
40%
45%
Q1 Q2 Q3 Q4 Q1 Q2 Q3 Q4 Q1 Q2 Q3 Q4 Q1 Q2 Q3 Q4 Q1 Q2 Q3 Q4 Q1 Q2 Q3 Q4 Q1 Q2 Q3 Q4 Q1 Q2 Q3 Q4 Q1 Q2 Q3 Q4 Q1 Q2 Q3 Q4
2006 2007 2008 2009 2010 2011 2012 2013 2014 2015
Loans Bank placements Por tfolio Other Fees and commissions Other income Income
-60%
-40%
-20%
0%
20%
40%
60%
80%
100%
120%
140%
Q1 Q2 Q3 Q4 Q1 Q2 Q3 Q4 Q1 Q2 Q3 Q4 Q1 Q2 Q3 Q4 Q1 Q2 Q3 Q4 Q1 Q2 Q3 Q4 Q1 Q2 Q3 Q4 Q1 Q2 Q3 Q4 Q1 Q2 Q3 Q4 Q1 Q2 Q3 Q4
2006 2007 2008 2009 2010 2011 2012 2013 2014 2015
General and administrative expenditures Depriciation on fixed assets Loans provisions and other assets losses
Fees and commissions Other Borrowings
Deposits Expenditures

| 15
Buletini Mujor Statistikor
December 2015 Monthly Statistics Bulletin
16. Interest rates on loans of OFI
17. OFI new loans by sectors(Thousands of euro: Cumulat ive data during the reference month)
18. Maturity breakdown of OFI loans(M illions of Euro: End of period)
0
2,000
4,000
6,000
8,000
10,000
12,000
Jan FebMar Apr May Jun Jul AugSep OctNovDecJan FebMar Apr May Jun Jul AugSep OctNovDecJan FebMar Apr May Jun Jul AugSep OctNovDecJan FebMar Apr May Jun Jul AugSep OctNovDec
2012 2013 2014 2015
Households Non-financial corporations
19%
20%
21%
22%
23%
24%
25%
26%
Jan FebMar Apr May Jun Jul AugSep Oct NovDecJan FebMar Apr May Jun Jul AugSep Oct NovDecJan FebMar Apr May Jun Jul AugSep Oct NovDecJan FebMar Apr May Jun Jul AugSep Oct NovDec
2012 2013 2014 2015
Other financial intermediaries interest ra tes
0
10
20
30
40
50
60
70
80
90
100
Jan FebMar Apr May Jun Jul AugSep Oct NovDecJan FebMar Apr May Jun Jul AugSep Oct NovDecJan FebMar Apr May Jun Jul AugSep Oct NovDecJan FebMar Apr May Jun Jul AugSep Oct NovDec
2012 2013 2014 2015
≤ 1 y ear >1 ≤ 2 y ears > 2 ≤ 5 y ears > 10 years > 5 ≤ 10 y ears
16 |
Monthly Statistics Bulletin December 2015
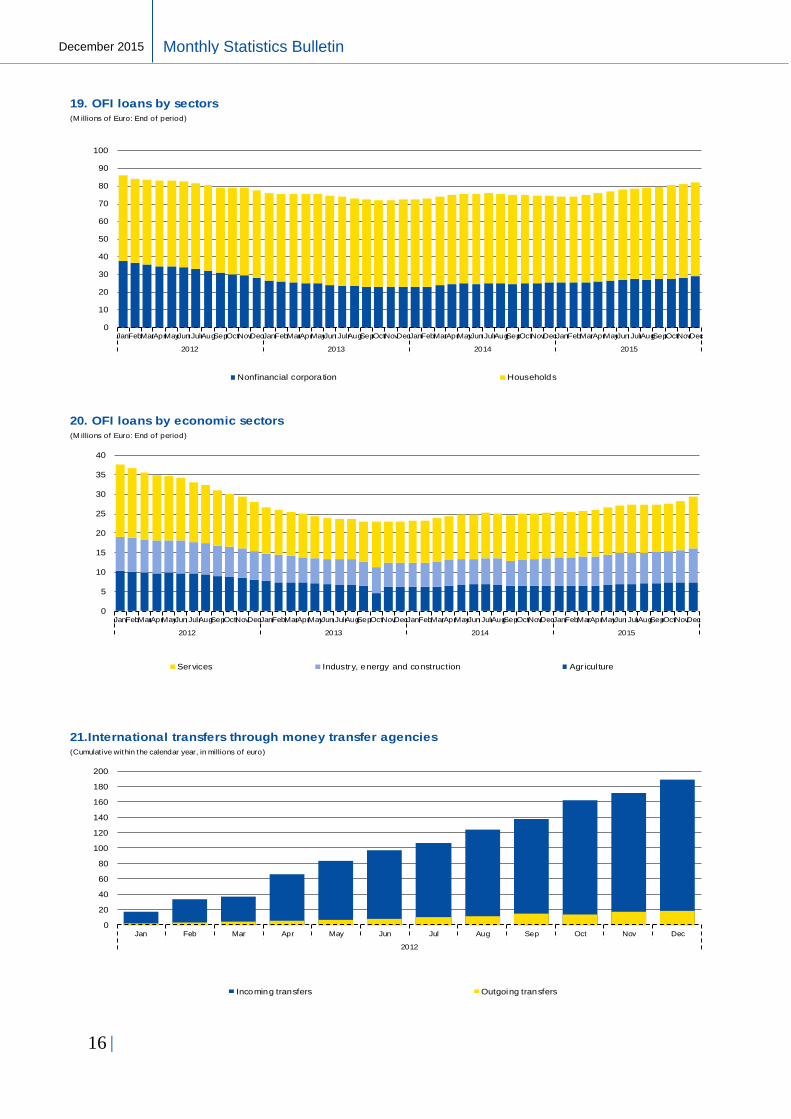
19. OFI loans by sectors(M illions of Euro: End of period)
20. OFI loans by economic sectors(M illions of Euro: End of period)
21.International transfers through money transfer agencies(Cumulat ive within the calendar year, in millions of euro)
0
10
20
30
40
50
60
70
80
90
100
JanFebMarAprMayJun JulAugSepOctNovDecJanFebMarAprMayJun JulAugSepOctNovDecJanFebMarAprMayJun JulAugSepOctNovDecJanFebMarAprMayJun JulAugSepOctNovDec
2012 2013 2014 2015
Nonfinancial corporation Households
0
5
10
15
20
25
30
35
40
JanFebMarAprMayJun JulAugSepOctNovDecJanFebMarAprMayJun JulAugSepOctNovDecJanFebMarAprMayJun JulAugSepOctNovDecJanFebMarAprMayJun JulAugSepOctNovDec
2012 2013 2014 2015
Services Industry, energy and construction Agr icul ture
0
20
40
60
80
100
120
140
160
180
200
Jan Feb Mar Apr May Jun Jul Aug Sep Oct Nov Dec
2012
Incoming transfers Outgoing transfers

| 17
Buletini Mujor Statistikor
December 2015 Monthly Statistics Bulletin
22. Kosovo budget(M illions of euro)
23. Prices
24. Prices, main categories(Year-on-year)
0
30
60
90
120
150
180
Jan Feb Mar Apr May Jun Jul Aug Sep Oct
2015
Income Expenditures
-0.1%-0.4%
10.7%
-1.9%
-1.7%1.5%
2.7%
2.4%
3.5%
2.2%
2.1%
2.1%
-1.8% -1.8%
1.3%
7.1% 6.4%7.6%
-1.7%
0.4%
6.2%5.1%
-3.7%
-10%
-5%
0%
5%
10%
15%
20%
25%
30%
Q1 Q2 Q3 Q4 Q1 Q2 Q3 Q4 Q1 Q2 Q3 Q4 Q1 Q2 Q3 Q4 Q1 Q2 Q3 Q4 Q1 Q2 Q3 Q4 Q1 Q2 Q3 Q4 Q1 Q2 Q3 Q4 Q1 Q2 Q3 Q4 Q1 Q2 Q3 Q4
2006 2007 2008 2009 2010 2011 2012 2013 2014 2015
Food and beverages Alcoolic drinks and tobacco Footwear Housing services, water, electricity, e tc.
1.1%
10.5%
0.5% 0.1%
6.6%
3.6%
3.7%
0.5%-0.4% -0.1%
-5%
-3%
-1%
1%
3%
5%
7%
9%
11%
13%
15%
Q1 Q2 Q3 Q4 Q1 Q2 Q3 Q4 Q1 Q2 Q3 Q4 Q1 Q2 Q3 Q4 Q1 Q2 Q3 Q4 Q1 Q2 Q3 Q4 Q1 Q2 Q3 Q4 Q1 Q2 Q3 Q4 Q1 Q2 Q3 Q4 Q1 Q2 Q3 Q4
2006 2007 2008 2009 2010 2011 2012 2013 2014 2015
Year-on-year

18 |
Monthly Statistics Bulletin December 2015
25. Import and producer prices(Year-on-year, Jan 2010 = 100)
26. Exchange rate against euro currency(Period average)
27. Real effective exchange rate (Index)
-10%
-5%
0%
5%
10%
15%
20%
Q1 Q2 Q3 Q4 Q1 Q2 Q3 Q4 Q1 Q2 Q3 Q4 Q1 Q2 Q3 Q4 Q1 Q2 Q3 Q4 Q1 Q2 Q3 Q4 Q1 Q2 Q3 Q4 Q1 Q2 Q3
2008 2009 2010 2011 2012 2013 2014 2015
Import prices Producer prices
90
92
94
96
98
100
102
104
106
108
110
112
Q1 Q2 Q3 Q4 Q1 Q2 Q3 Q4 Q1 Q2 Q3 Q4 Q1 Q2 Q3 Q4 Q1 Q2 Q3 Q4 Q1 Q2 Q3 Q4 Q1 Q2 Q3 Q4 Q1 Q2 Q3 Q4 Q1 Q2 Q3 Q4 Q1 Q2 Q3 Q4
2006 2007 2008 2009 2010 2011 2012 2013 2014 2015
REER (Total) REER (EU) REER (CEFTA)
Appreciation
Depreciation
0.0
0.2
0.4
0.6
0.8
1.0
1.2
1.4
1.6
0
20
40
60
80
100
120
140
160
Q1 Q2 Q3 Q4 Q1 Q2 Q3 Q4 Q1 Q2 Q3 Q4 Q1 Q2 Q3 Q4 Q1 Q2 Q3 Q4 Q1 Q2 Q3 Q4 Q1 Q2 Q3 Q4 Q1 Q2 Q3 Q4 Q1 Q2 Q3 Q4 Q1 Q2 Q3 Q4
2006 2007 2008 2009 2010 2011 2012 2013 2014 2015
Albanian lek Mecedonian denar Serbian dinar American dollar, right axis

| 19
Buletini Mujor Statistikor
December 2015 Monthly Statistics Bulletin
28. Trade balance(M illions of Euro: Cumulat ive data during the reference year)
29. Exports of goods(M illions of Euro: Cumulat ive data during the reference year)
30. Imports of goods(M illions of Euro: Cumulat ive data during the reference year)
0
500
1,000
1,500
2,000
2,500
3,000
Q1 Q2 Q3 Q4 Q1 Q2 Q3 Q4 Q1 Q2 Q3 Q4 Q1 Q2 Q3 Q4 Q1 Q2 Q3 Q4 Q1 Q2 Q3 Q4 Q1
2006 2007 2008 2009 2010 2011 2012
EU CEFTA Other European countries Non-European countries
0
50
100
150
200
250
300
350
Q1 Q2 Q3 Q4 Q1 Q2 Q3 Q4 Q1 Q2 Q3 Q4 Q1 Q2 Q3 Q4 Q1 Q2 Q3 Q4 Q1 Q2 Q3 Q4 Q1
2006 2007 2008 2009 2010 2011 2012
EU CEFTA Other European countries Non-European countries
-3000
-2000
-1000
1000
2000
3000
Q1 Q2 Q3 Q4 Q1 Q2 Q3 Q4 Q1 Q2 Q3 Q4 Q1 Q2 Q3 Q4 Q1 Q2 Q3 Q4 Q1 Q2 Q3 Q4 Q1
2006 2007 2008 2009 2010 2011 2012
Imports Exports Trade balance

20 |
Monthly Statistics Bulletin December 2015
31. Balance of payments of Kosovo(Flow stat ist ics, in millions of euro)
32. Current account(M illions of Euro)
33. Financial account(M illions of Euro)
-2000
-1500
-1000
-500
500
1000
2004 2005 2006 2007 2008 Q1 Q2 Q3 Q4 Q1 Q2 Q3 Q4 Q1 Q2 Q3 Q4 Q1 Q2 Q3 Q4 Q1 Q2 Q3 Q4 Q1 Q2 Q3 Q4 Q1 Q2 Q3
2009 2010 2011 2012 2013 2014 2015
Goods Services Income Current transfers
-500
-400
-300
-200
-100
100
200
300
400
2004 2005 2006 2007 2008 Q1 Q2 Q3 Q4 Q1 Q2 Q3 Q4 Q1 Q2 Q3 Q4 Q1 Q2 Q3 Q4 Q1 Q2 Q3 Q4 Q1 Q2 Q3 Q4 Q1 Q2 Q3
2009 2010 2011 2012 2013 2014 2015
Current account Capital Account Financial Account Errors and ommissions
-500
-400
-300
-200
-100
100
200
300
400
2004 2005 2006 2007 2008 Q1 Q2 Q3 Q4 Q1 Q2 Q3 Q4 Q1 Q2 Q3 Q4 Q1 Q2 Q3 Q4 Q1 Q2 Q3 Q4 Q1 Q2 Q3 Q4 Q1 Q2 Q3
2009 2010 2011 2012 2013 2014 2015
Direct investments Por tfolio invetments Other investments Reserve assets

| 21
Buletini Mujor Statistikor
December 2015 Monthly Statistics Bulletin
34. International investment position(M illions of euro: End of Period)
35. International investment position - by sectors(M illions of euro: End of Period)
36. Direct investment by main country(M illions of Euro: As of 30 September 2015)
0
500
1,000
1,500
2,000
2,500
3,000
3,500
4,000
4,500
5,000
Q1 Q2 Q3 Q4 Q1 Q2 Q3 Q4 Q1 Q2 Q3 Q4 Q1 Q2 Q3
2007 2008 2009 2010 2011 2012 2013 2014 2015
Assets Liab ilities Net
-2000
-1500
-1000
-500
0
500
1000
1500
2000
2500
Q1 Q2 Q3 Q4 Q1 Q2 Q3 Q4 Q1 Q2 Q3 Q4 Q1 Q2 Q3
2007 2008 2009 2010 2011 2012 2013 2014 2015
Central bank General Government Banks Other sectors
0.0
50.0
100.0
150.0
200.0
250.0
300.0
350.0
400.0
AT BE BG CY FR DE GR IT NL RO SI SE GB AL HR MK NO RS CH TR US AE
Inward Outward

22 |
Monthly Statistics Bulletin December 2015
37. Reserve assets
(M illions of euro: End of Period)
38. Gross external debt
(M illions of euro: End of Period)
39. Gross external debt by creditor
(M illions of Euro: As of 30 September 2015)
0
100
200
300
400
500
600
700
800
900
1,000
Q1 Q2 Q3 Q4 Q1 Q2 Q3 Q4 Q1 Q2 Q3 Q4 Q1 Q2 Q3
2007 2008 2009 2010 2011 2012 2013 2014 2015
Reserve Assets
0
500
1,000
1,500
2,000
2,500
Q1 Q2 Q3 Q4 Q1 Q2 Q3 Q4 Q1 Q2 Q3 Q4 Q1 Q2 Q3
2007 2008 2009 2010 2011 2012 2013 2014 2015
Public Privat Tota l
200
400
600
800
1000
1200
1400
1600
Inetrnational Monetary Fund World Bank Other Creditors

| 23
Buletini Mujor Statistikor
December 2015 Monthly Statistics Bulletin
Table 1.1. FC survey - net foreign assets and domestic claims
(In millions of euro: End of period)
Description
Net foreign assets Domestic claims
Claims on non residents
prej të cilave:
Liabilities to nonresidents
Net claims on central government
Claims on other sectors
of which:
Moneta-ry gold
and SDR
holdings
Deposits Securities other than shares
IMF Quota
Shares and other equity
Claims on central govern-ment
Liabilities to central government
Loans
of which:
Other non finance-al corporatio
ns
House-holds
2005 827.3 890.9 __ 422.6 242.4 __ 145.3 63.6 348.9 -225.7 __ 225.7 574.6 565.6 439.6 126.0
2006 1,173.6 1,245.7 __ 660.0 341.3 __ 170.8 72.1 231.7 -475.0 __ 475.0 706.6 694.3 548.2 146.1
2007 1,622.4 1,704.6 __ 955.0 408.9 __ 175.4 82.3 124.5 -853.3 __ 853.3 977.8 965.9 765.1 200.6
2008 1,593.1 1,726.7 __ 795.1 661.6 __ 128.2 133.6 419.6 -871.8 __ 871.8 1,291.5 1,276.8 995.7 281.0
2009 1,700.5 2,036.2 60.3 910.1 724.5 64.3 144.3 335.7 571.5 -846.3 __ 846.3 1,417.8 1,396.1 1,052.3 343.5
2010 1,957.5 2,387.7 64.0 1,257.8 525.2 68.5 269.3 430.2 766.8 -824.8 __ 824.8 1,591.6 1,568.3 1,127.7 434.2
2011 June 1,988.0 2,421.3 60.9 1,171.3 640.0 65.4 293.9 433.3 840.1 -905.2 __ 905.2 1,745.3 1,716.2 1,233.3 482.1
September 2,108.2 2,511.5 63.3 1,297.5 539.1 68.0 332.7 403.3 862.2 -905.5 __ 905.5 1,767.7 1,740.8 1,235.1 504.2
December 2,067.8 2,446.0 65.1 1,359.4 230.0 70.1 533.1 378.2 987.5 -798.4 __ 798.4 1,785.8 1,785.8 1,242.1 514.6
2012 March 2,087.9 2,449.5 63.8 1,179.7 346.9 68.8 580.9 361.6 1,000.8 -788.9 29.9 818.8 1,789.7 1,762.0 1,238.7 521.1
June 2,081.2 2,445.1 66.4 1,257.2 239.1 71.9 598.7 363.9 1,057.1 -801.1 29.9 831.0 1,858.3 1,832.9 1,281.9 548.6
September 2,301.6 2,716.8 65.0 1,129.0 598.8 70.7 622.1 415.1 985.7 -848.8 73.6 922.3 1,834.5 1,809.6 1,260.9 546.3
December 2,337.1 2,773.4 63.3 1,260.7 486.0 68.8 666.5 436.3 1,079.9 -764.7 73.8 838.5 1,847.2 1,819.4 1,271.3 546.3
2013 March 2,376.5 2,821.3 63.3 1,189.5 515.7 69.0 734.5 444.8 1,112.0 -751.8 73.9 825.7 1,863.8 1,838.7 1,287.5 549.8
June 2,352.5 2,793.0 61.9 1,008.6 646.2 67.8 777.9 440.4 1,110.8 -798.6 110.9 909.5 1,909.4 1,882.0 1,314.8 566.1
September 2,541.1 3,003.2 60.7 982.4 826.8 66.8 816.9 462.1 1,095.2 -783.8 130.8 914.6 1,879.0 1,853.2 1,291.5 560.6
December 2,558.5 3,014.1 59.6 1,143.6 818.7 65.9 651.2 455.6 1,263.4 -620.8 153.2 774.0 1,884.2 1,859.9 1,291.1 567.7
2014 March 2,592.4 3,060.7 59.5 1,104.0 899.8 66.2 660.9 468.2 1,286.2 -620.7 190.1 810.8 1,906.9 1,883.2 1,313.4 568.5
June 2,528.5 3,002.1 59.9 1,045.1 803.3 66.9 752.4 473.6 1,393.3 -580.4 230.4 810.8 1,973.8 1,949.3 1,351.3 597.0
September 2,700.7 3,158.9 61.6 1,243.8 574.9 69.1 967.4 458.2 1,373.8 -589.1 227.0 816.1 1,962.9 1,939.2 1,325.5 613.4
December 2,648.4 3,113.3 62.5 1,414.7 315.7 70.4 1,024.4 465.0 1,507.3 -488.5 247.4 735.9 1,995.8 1,971.5 1,345.5 625.3
2015 March 2,764.8 3,251.1 66.5 1,467.3 329.0 75.3 1,078.7 486.3 1,530.6 -489.8 271.1 760.9 2,020.4 1,991.9 1,361.8 629.3
June 2,656.5 3,151.9 65.4 1,315.0 400.3 74.4 1,055.8 495.9 1,659.2 -467.5 298.1 765.7 2,126.8 2,096.8 1,431.4 664.6
September 2,766.0 3,286.9 64.5 1,436.1 396.4 74.0 1,045.6 510.9 1,585.4 -532.3 317.4 849.7 2,117.7 2,086.6 1,417.7 668.2
December 2,765.1 3,288.3 65.1 1,399.4 378.2 75.1 1,086.3 523.1 1,710.1 -433.0 326.6 759.6 2,143.1 2,114.6 1,428.3 685.6

24 |
Monthly Statistics Bulletin December 2015
Table 1.2. FC survey - liabilities
(In millions of euro: End of period)
Description
Deposits Loans
Insurance technical reserves
Shares and other
equity
Other items (net)
Transferable deposits of which:
Other deposits of which:
Net equity of househol
ds in pension funds
Prepayment of premiums&res
ervs against outst- anding claims
Public non financial
corporations
Other non financial
corporations
Households
Public non fina-ncial cor-
porations
Other non financial corporati-
ons
Househ-olds
2005 830.6 315.0 67.6 76.8 155.5 515.6 181.3 33.7 298.9 3.0 174.5 152.4 22.1 165.8 2.2
2006 886.4 300.5 34.8 96.4 156.2 586.0 193.3 27.6 359.5 3.4 251.4 223.9 27.5 209.3 54.7
2007 1,110.9 386.1 49.6 133.5 187.5 724.8 188.4 43.8 489.3 … 316.1 286.2 29.9 273.8 46.0
2008 1,351.9 390.9 15.4 176.0 186.2 961.0 250.1 51.4 656.7 … 288.6 256.3 32.3 311.1 61.1
2009 1,444.3 483.2 50.1 184.0 237.7 961.0 73.9 82.9 801.9 … 422.3 380.8 41.5 326.1 79.3
2010 1,744.2 621.2 83.8 218.6 303.5 1,123.1 42.8 83.4 995.9 … 540.5 493.7 46.8 361.0 78.6
2011 June 1,757.0 591.0 71.6 185.9 315.2 1,166.0 48.0 75.0 1,039.9 … 602.7 551.5 51.1 373.1 94.7
September 1,900.1 661.3 98.3 205.0 336.9 1,238.8 51.7 81.0 1,102.9 … 598.5 545.9 52.6 377.3 93.7
December 1,933.6 658.4 68.1 208.1 360.9 1,275.1 60.8 79.7 1,129.6 … 647.8 593.3 54.5 389.7 75.0
2012 March 1,896.1 617.1 22.6 212.4 363.2 1,279.0 46.2 73.1 1,154.6 … 698.6 642.9 55.7 405.1 89.3
June 1,918.3 638.4 11.1 223.2 379.6 1,279.9 59.5 75.8 1,141.1 … 717.3 659.1 58.3 389.0 113.1
September 2,004.5 667.2 16.1 245.0 384.1 1,337.3 63.3 74.1 1,195.7 … 767.8 708.1 59.7 397.2 117.9
December 2,076.6 700.2 13.8 257.5 407.2 1,376.5 61.8 78.2 1,232.9 … 814.9 745.1 69.8 399.2 128.9
2013 March 2,077.8 692.3 19.1 234.4 415.8 1,385.5 50.9 74.2 1,255.5 … 866.8 800.3 66.2 403.6 140.0
June 2,048.9 698.9 16.0 231.8 425.2 1,350.1 48.8 75.4 1,221.3 … 880.0 808.8 41.2 398.0 137.0
September 2,169.0 761.8 14.4 270.8 450.9 1,407.2 72.9 73.6 1,255.6 … 932.2 859.5 72.7 397.5 137.6
December 2,275.3 848.0 16.4 299.6 506.6 1,427.3 55.7 98.2 1,268.4 … 990.3 919.0 71.3 403.9 152.4
2014 March 2,255.3 873.1 39.9 260.9 536.1 1,382.2 42.5 79.2 1,255.6 … 1,026.9 954.3 72.6 415.8 180.7
June 2,243.3 917.9 33.3 256.3 602.7 1,325.3 58.2 67.7 1,194.3 … 1,078.2 1,002.6 75.6 419.5 180.8
September 2,329.2 1,047.3 32.5 300.9 683.8 1,281.9 53.9 75.3 1,150.2 … 1,123.4 1,044.6 78.8 441.4 180.5
December 2,354.4 1,134.6 21.1 338.4 743.5 1,219.8 51.6 58.0 1,104.8 … 1,173.8 1,094.1 79.7 453.2 175.8
2015 March 2,380.8 1,184.9 30.9 306.0 818.7 1,196.0 37.8 66.6 1,086.5 … 1,256.3 1,175.0 81.3 479.8 178.5
June 2,393.0 1,217.7 10.9 335.3 841.8 1,175.3 36.7 72.4 1,062.8 … 1,270.0 1,184.3 85.7 484.3 165.5
September 2,466.9 1,342.9 21.8 386.4 897.6 1,124.0 24.1 60.0 1,036.7 ... 1,253.6 1,163.7 89.8 496.0 144.8
December 2,513.3 1,378.6 11.2 413.8 919.1 1,134.7 20.6 68.2 1,045.4 ... 1329.5 1,237.2 92.2 531.6 100.8

| 25
Buletini Mujor Statistikor
December 2015 Monthly Statistics Bulletin
Table 2.1. DC survey - net foreign assets and domestic claims
(In millions of euro: End of period)
Description
Net foreign assets Domestic claims
Claims on non residents Less:liabilities to
non residents
Net claims on central government
Claims on other sectors
Currency
Deposits Securities
other than
shares
IMF Quota
Claims on centr
al gov.
Less: Liabilitie
s to central
gov.
Loans of which:
Other non financail
corporations
Households
2001 583.3 604.8 239.2 358.1 7.5 __ 21.5 -44.2 -70.3 __ 70.3 26.1 25.9 25.9 __
2002 649.5 674.1 53.1 621.0 ,,, __ 24.6 -171.8 -258.6 __ 258.6 86.8 86.5 80.8 5.7
2003 695.8 727.0 73.2 533.6 119.6 __ 31.2 -112.6 -346.4 __ 346.4 233.8 232.8 193.5 39.0
2004 648.7 687.9 55.3 384.0 236.7 __ 39.2 156.9 -216.8 __ 216.8 373.8 373.7 289.9 83.7
2005 695.1 744.5 74.6 422.6 242.4 __ 49.3 289.0 -225.7 __ 225.7 514.6 513.9 387.9 126.0
2006 975.4 1,035.6 63.4 660.0 303.1 __ 60.2 162.2 -475.0 __ 475.0 637.1 636.6 490.5 146.1
2007 1,377.5 1,426.1 145.3 955.0 308.2 __ 48.6 39.1 -853.3 __ 853.3 892.4 892.1 691.3 200.6
2008 1,436.1 1,512.0 121.1 794.9 581.8 __ 75.9 311.9 -871.8 __ 871.8 1,183.8 1,183.4 901.7 281.0
2009 1,531.6 1,782.2 111.4 910.0 626.4 64.3 250.6 442.9 -846.3 __ 846.3 1,289.2 1,289.0 942.9 343.5
2010 1,616.2 1,957.1 164.3 1,257.8 372.7 68.5 340.9 632.8 -824.8 __ 824.8 1,457.5 1,457.1 1,006.6 434.2
2011 1,603.8 1,900.3 124.9 1,359.3 227.0 70.1 296.6 867.7 -798.4 __ 798.4 1,666.1 1,665.6 1,130.6 514.6
2012 1,729.7 2,102.8 141.4 1,260.7 482.7 68.8 373.1 962.9 -778.7 59.8 838.5 1,741.6 1,740.9 1,172.9 546.3
2013 October 1,931.6 2,327.9 154.8 1,254.5 682.1 66.5 396.3 975.1 -804.5 111.5 916.0 1,779.6 1,779.1 1,189.1 570.7
November 1,903.6 2,300.5 141.2 1,323.7 603.8 66.6 397.0 1,019.6 -764.8 95.2 860.0 1,784.4 1,783.4 1,195.6 568.1
December 1,965.4 2,358.3 157.9 1,143.5 815.3 65.9 392.9 1,113.3 -673.9 100.1 774.0 1,787.2 1,786.0 1,196.7 567.7
2014 January 2,025.8 2,445.8 151.8 1,115.2 922.7 66.7 420.0 1,044.7 -731.7 93.2 825.0 1,776.5 1,775.4 1,191.7 563.6
February 2,005.2 2,419.3 131.1 1,146.3 885.6 66.1 414.0 1,082.5 -692.9 118.4 811.3 1,775.4 1,775.2 1,192.2 563.0
March 1,987.3 2,395.2 140.8 1,103.8 896.3 66.2 407.9 1,124.2 -683.5 127.3 810.8 1,807.7 1,806.7 1,217.0 568.5
April 1,954.1 2,357.7 145.4 1,038.6 911.8 66.2 403.7 1,148.7 -673.4 131.5 804.9 1,822.1 1,821.0 1,226.4 575.0
May 1,927.1 2,328.3 130.1 1,050.3 882.8 66.8 401.2 1,197.0 -641.6 145.5 787.1 1,838.6 1,838.1 1,231.2 587.2
June 1,833.3 2,244.9 148.3 1,045.0 799.6 66.9 411.5 1,228.2 -644.3 166.6 810.8 1,872.5 1,871.1 1,252.9 597.0
July 1,754.0 2,172.7 158.8 1,177.3 612.2 67.5 418.7 1,250.7 -618.9 169.7 788.6 1,869.7 1,868.4 1,243.3 605.5
August 1,862.4 2,271.7 159.9 1,286.7 594.7 68.0 409.3 1,197.6 -645.0 160.2 805.2 1,842.7 1,842.3 1,214.5 608.0
September 1,791.7 2,186.6 152.6 1,243.8 571.0 69.1 394.9 1,198.9 -651.2 165.0 816.1 1,850.1 1,849.1 1,227.6 613.4
October 1,800.3 2,196.9 148.2 1,308.1 533.0 69.0 396.6 1,204.6 -650.0 177.6 827.6 1,854.5 1,853.5 1,238.6 607.1
November 1,768.7 2,166.7 124.0 1,257.7 577.0 69.3 397.9 1,248.2 -612.4 182.4 794.8 1,860.5 1,860.3 1,238.3 614.1
December 1,680.8 2,083.9 160.4 1,414.6 311.6 70.4 403.1 1,339.8 -543.2 192.7 735.9 1,883.1 1,881.9 1,235.0 639.0
2015 January 1,757.6 2,170.2 157.4 1,464.3 1,757.6 73.6 412.4 1,279.0 -584.9 188.6 773.4 1,863.9 1,862.7 1,232.9 622.2
February 1,748.8 2,152.0 142.9 1,469.2 1,748.8 73.7 403.1 1,311.2 -563.5 183.7 747.2 1,874.7 1,874.5 1,244.7 621.1
March 1,741.4 2,167.2 150.0 1,467.2 1,741.4 75.3 425.8 1,339.8 -564.4 196.5 760.9 1,904.1 1,903.1 1,263.8 629.3
April 1,726.2 2,149.1 151.0 1,459.2 1,726.2 74.9 422.9 1,376.7 -560.3 214.7 775.1 1,937.0 1,936.0 1,287.3 639.3
May 1,685.0 2,105.6 137.4 1,381.0 1,685.0 75.2 420.6 1,393.3 -563.9 207.0 770.9 1,957.2 1,957.0 1,297.0 650.4
June 1,654.7 2,088.2 152.9 1,315.0 1,654.7 74.4 433.5 1,458.6 -597.6 218.4 765.7 2,005.9 2,004.8 1,330.5 622.2
July 1,712.9 2,183.0 186.8 1,383.5 1,712.9 74.8 470.1 1,404.3 -597.6 224.6 822.2 2,001.9 2,000.9 1,320.4 671.4
August 1,814.9 2,274.2 180.9 1,460.5 408.7 73.4 459.3 1,379.6 -605.4 234.1 839.5 1985.0 1,984.7 1,301.1 622.2
September 1,787.4 2,236.3 176.1 1,436.1 392.3 74.0 448.9 1,379.6 -6.14.5 235.1 849.7 1,994.2 1,992.9 1,315.8 668.2
October 1,781.1 2,231.3 176.1 1,506.0 320.7 74.4 450.2 1,382.0 -624.7 219.0 843.6 2,006.7 2,006.1 1,312.2 685.9
November 1,751.9 2,218.2 183.1 1,471.7 322.1 76.2 466.2 1,421.4 -593.6 231.5 825.1 2,015.0 2,015.0 1,329.4 677.1
December 1,736.7 2,197.1 190.8 1,399.3 374.3 75.1 460.4 1,486.9 -533.3 226.3 759.6 2,020.1 2,019.0 1,324.1 685.4

26 |
Monthly Statistics Bulletin December 2015
Table 2.2. DC survey - liabilities
(In millions of euro: End of period)
Description
Deposits included in broad money Deposits excluded
from broad money 1/
Shares and
other equity
Other items net Transferable deposits
of which:
Other deposists
of which:
Other financial
corporations
Public non financial
corporations
Other non financail
corporations
House-holds
Other financial
corporations
Public non
financail corporati-
ons
Other non
financail corporati-
ons
Househ-olds
2001 486.8 361.5 . 7.0 135.3 219.2 125.2 . . 31.3 93.9 12.9 25.2 14.3
2002 413.6 285.3 . 3.5 160.1 121.7 128.3 . . 23.9 104.4 25.1 43.8 -4.8
2003 499.3 278.7 . 5.3 139.0 134.4 220.6 . . 87.1 133.5 29.2 61.1 -6.4
2004 719.5 303.5 29.8 34.6 81.3 145.5 416.0 19.1 149.3 24.4 222.5 __ 87.1 -1.0
2005 865.4 345.6 30.5 67.6 76.8 155.5 519.9 24.3 181.3 33.1 279.6 19.9 94.4 4.3
2006 912.8 336.4 35.9 34.8 96.4 156.2 576.3 30.5 193.3 24.6 322.4 40.6 128.8 55.4
2007 1,126.6 413.7 27.7 49.6 133.5 187.5 712.8 40.3 188.4 41.8 439.0 53.7 186.5 49.8
2008 1,393.0 454.6 63.7 15.4 176.0 186.2 938.3 47.6 250.1 44.2 593.8 74.9 233.8 46.4
2009 1,548.5 621.4 138.2 50.1 184.0 237.7 927.0 60.7 73.9 71.7 718.5 98.1 249.0 79.0
2010 1,747.9 674.3 53.1 83.8 218.6 303.5 1,073.6 85.2 30.2 73.5 883.7 138.2 278.5 84.4
2011 1,902.2 705.3 37.8 77.2 208.1 360.9 1,196.9 91.0 49.2 71.7 979.9 175.8 302.9 90.6
2012 2,036.8 759.5 41.9 31.2 257.5 407.2 1,277.3 100.4 49.8 70.5 1,053.1 206.2 321.1 128.5
2013 October 2,228.2 953.8 158.9 36.3 283.5 448.4 1,274.4 62.2 64.3 58.6 1,084.7 206.7 325.5 146.3
November 2,226.7 955.8 159.5 41.5 258.4 472.4 1,271.0 59.9 53.8 70.0 1,082.2 210.2 324.2 162.0
December 2,388.5 1,096.3 226.5 39.1 299.6 506.6 1,292.1 62.2 43.7 92.3 1,088.9 209.7 329.0 151.5
2014 January
2,380.7 1,080.2 214.8 63.3 258.3 516.2 1,300.5 68.9 35.9 85.9 1,104.8 209.8 332.0 148.0
February 2,394.3 1,104.6 216.1 79.2 254.4 527.4 1,289.7 79.0 35.4 74.8 1,095.7 207.7 333.7 152.1
March 2,412.2 1,137.7 241.4 63.1 260.9 536.1 1,274.5 80.3 30.2 72.5 1,086.6 201.4 338.8 159.2
April 2,420.7 1,158.1 251.8 61.7 253.2 561.8 1,262.7 81.8 44.9 66.4 1,064.9 198.9 326.3 156.9
May 2,430.7 1,185.8 253.1 77.2 257.2 572.2 1,244.9 81.9 45.8 63.6 1,048.4 199.5 333.7 160.2
June 2,361.7 1,142.8 201.1 57.0 256.3 602.7 1,219.0 81.1 46.0 61.1 1,025.6 200.9 341.4 157.6
July 2,304.0 1,102.6 102.1 56.4 275.6 639.3 1,201.4 81.0 45.6 64.8 1,006.3 201.5 351.2 148.0
August 2,345.2 1,174.4 104.7 72.0 298.0 668.6 1,170.7 82.3 27.2 65.5 992.2 204.7 360.6 149.6
September 2,275.0 1,103.8 32.4 56.7 300.9 683.8 1,171.2 81.2 41.6 67.4 978.4 206.6 362.2 146.7
October 2,282.3 1,127.1 58.3 44.7 292.0 699.7 1,155.1 82.0 41.7 64.9 962.2 207.2 364.5 150.9
November 2,281.4 1,154.7 95.1 22.2 296.3 708.3 1,126.8 72.2 41.4 60.7 948.1 207.0 368.9 159.6
December 2,287.4 1,194.7 60.8 21.1 338.4 743.5 1,092.7 67.2 39.4 50.2 930.6 208.7 373.8 150.6
2015 January
2,291.1 1,216.7 61.0 21.3 319.4 785.0 1,078.5 64.4 34.4 49.8 924.4 208.7 383.6 147.6
February 2,290.8 1,226.4 61.5 21.0 313.4 800.9 1,064.4 61.2 34.5 56.0 907.5 223.0 390.5 155.7
March 2,298.4 1,252.4 67.6 30.9 306.0 818.7 1,045.9 61.0 25.6 57.7 896.4 226.3 396.5 160.0
April 2,311.0 1,272.9 88.3 18.6 317.2 820.5 1,044.6 61.4 24.6 62.2 891.9 226.3 403.8 148.2
May 2,279.9 1,246.9 48.0 14.5 323.5 830.5 1,033.0 58.4 24.6 63.7 883.1 226.3 411.9 147.7
June 2,305.5 1,304.8 86.6 10.9 335.3 919.4 980.0 42.5 24.5 63.3 866.1 244.1 427.2 150.8
July 2,311.4 1,337.0 71.0 9.7 355.3 868.3 974.4 56.1 22.0 51.7 841.3 244.1 407.8 153.8
August 2,378.6 1,413.3 87.1 9.3 394.3 887.9 965.2 48.9 21.9 46.1 845.0 241.7 413.4 160.8
September 2,619.8 1,433.9 91.1 21.8 386.4 897.6 942.8 45.7 11.9 46.1 835.9 243.1 408.9 138.3
October 2,358.4 1,419.7 89.6 0.8 377.0 893.6 938.8 44.9 14.9 46.9 829.9 247.5 425.4 137.9
November 2,381.7 1,427.6 98.5 0.0 377.4 897.1 954.1 46.3 12.2 56.3 840.5 231.3 432.8 127.7
December 2,433.0 1,475.4 96.9 11.2 413.8 919.1 957.5 37.6 12.8 54.3 852.3 232.7 445.4 112.4

| 27
Buletini Mujor Statistikor
December 2015 Monthly Statistics Bulletin
Table 3.1. CBK survey - net foreign assets and domestic claims
(In millions of euro: End of period)
Description
Net foreign assets Net claims on central government
Claims on other sectors
Liabilities to ODC
Claims on non residents
of which: Less:
liabilities to non
residents
of which:
Monetary gold and
SDR
Currency Deposits Securities other than
shares
IMF Quota
SDR allocations
IMF Account
2001 293.7 296.2 __ 150.8 145.4 __ __ 2.6 __ __ -70.3 0.2 173.9
2002 345.4 345.8 __ 17.5 328.3 __ __ 0.4 __ __ -258.6 0.3 46.2
2003 454.3 454.6 __ 26.6 427.4 __ __ 0.3 __ __ -346.4 1.0 59.6
2004 344.7 349.9 __ 12.1 213.2 124.4 __ 5.2 __ __ -216.8 0.1 72.9
2005 394.4 397.5 __ 24.5 213.4 159.5 __ 3.1 __ __ -225.7 0.8 82.5
2006 641.1 641.2 __ 11.1 424.9 203.6 __ 0.1 __ __ -472.9 0.5 94.5
2007 1,057.6 1,057.6 __ 63.8 759.0 229.3 __ … __ __ -849.4 0.3 113.6
2008 1,110.7 1,110.7 __ 39.7 529.0 541.3 __ … … __ -870.5 0.3 137.2
2009 1,088.3 1,198.5 60.3 21.8 522.3 529.7 64.3 110.2 60.3 49.1 -681.5 0.2 233.2
2010 1,108.0 1,246.9 64.0 60.2 854.4 199.2 68.5 138.9 64.2 73.0 -813.1 0.5 203.6
2011 1,094.5 1,234.6 65.1 13.5 1,059.3 25.0 70.1 135.8 65.7 69.4 -797.2 0.5 209.7
2012 1,238.8 1,469.1 63.3 16.8 1,034.1 286.0 68.8 230.3 64.6 165.3 -837.9 0.7 302.1
2013 October 1,472.3 1,698.8 60.4 41.7 1,008.2 521.9 66.5 226.4 62.4 163.7 -915.2 0.6 340.3
November 1,429.6 1,653.5 60.2 29.5 1,076.0 421.0 66.6 223.9 62.5 161.0 -859.2 1.0 357.3
December 1,392.1 1,610.0 59.6 27.4 896.2 560.8 65.9 218.0 61.9 155.8 -773.3 1.2 333.2
2014 January 1,454.6 1,673.3 60.3 42.9 842.4 660.8 66.7 218.7 62.6 155.8 -824.3 1.1 323.0
February 1,428.2 1,643.6 59.5 26.5 860.6 630.9 66.1 215.4 62.0 153.2 -810.6 0.2 293.4
March 1,398.4 1,614.2 59.5 28.8 828.7 630.9 66.2 215.8 62.1 153.6 -810.0 1.0 255.7
April 1,387.9 1,603.7 59.5 32.7 799.4 645.9 66.2 215.8 62.1 153.6 -804.1 1.1 245.1
May 1,371.3 1,584.9 59.8 20.2 807.1 630.9 66.8 213.5 62.7 150.8 -786.2 0.5 228.7
June 1,333.9 1,549.5 59.9 33.0 828.6 560.9 66.9 215.6 62.8 152.6 -810.0 1.4 242.9
July 1,221.8 1,438.0 60.4 18.4 890.6 400.9 67.5 216.2 63.3 152.6 -787.8 1.2 250.7
August 1,287.8 1,501.7 60.6 36.7 1,000.3 336.0 68.0 213.9 63.8 149.9 -804.3 0.4 299.8
September 1,212.1 1,429.6 61.6 30.9 942.0 326.0 69.1 217.5 64.8 152.5 -812.1 1.0 291.2
October 1,244.6 1,462.0 61.5 34.8 966.7 330.0 69.0 217.4 64.7 152.5 -822.7 1.0 300.5
November 1,259.6 1,474.5 61.4 18.4 945.4 380.0 69.3 214.9 65.0 149.7 -789.6 0.2 338.3
December 1,146.5 1,368.1 62.5 29.2 1,085.2 120.5 70.4 221.6 66.1 155.2 -730.5 1.2 315.9
2015 January 1,174.3 1,398.9 65.3 41.3 1,097.8 120.6 73.6 224.6 69.0 155.2 -767.7 1.2 301.1
February 1,166.5 1,388.3 65.1 33.0 1,095.6 120.6 73.7 221.8 69.2 152.3 -741.4 0.3 318.9
March 1,160.7 1,391.5 66.5 26.3 1,102.5 120.5 75.3 230.8 70.6 160.0 -754.1 1.0 294.1
April 1,167.8 1,398.6 66.2 34.6 1,122.4 100.5 74.9 230.9 70.3 160.0 -768.4 1.0 275.3
May 1,144.3 1,372.7 66.2 25.9 1,064.7 140.5 75.2 228.4 70.6 157.3 -763.8 0.2 295.7
June 1,167.3 1,396.6 65.4 31.3 1,054.9 170.4 74.4 229.3 69.8 159.0 -755.7 1.1 283.2
July 1,208.6 1,473.3 65.5 47.9 1,114.4 170.4 74.8 264.6 70.2 193.9 -814.7 1.0 289.1
August 1,241.8 1,502.8 64.0 32.2 1,162.7 170.4 73.4 261.0 68.8 191.6 -831.6 0.2 289.0
September 1,258.1 1,516.6 64.5 30.0 1,193.8 154.1 74.0 258.5 69.4 188.5 -841.4 0.2 294.9
October 1,269.5 1,521.6 64.9 24.9 1,240.7 116.3 74.4 252.1 69.9 181.7 -835.7 0.6 308.8
November 1,240.3 1,496.4 66.1 35.4 1,201.8 116.4 76.2 256.1 71.5 184.1 -816.7 0.1 284.7
December 1,201.0 1,174.0 65.1 15.3 1,174.0 127.1 75.1 256.1 70.5 184.8 -754.0 1.1 316.4

28 |
Monthly Statistics Bulletin December 2015
Table 3.2 CBK survey - liabilities
(In millions of euro: End of period)
Description
Deposits included in broad money Deeposits excluded from
broad money Kap. dhe të tjera Zëra
tjerë (neto)
Transferable deposits prej të cilave: Other deposits
Other financial
corporations
Local gov.
Kapitali Profiti humbja e vitit Other
financial corporations
Local government
Public non financial
corporations
Other non financial
corporations
Other financial corporations
2006 49.9 41.9 31.0 0.4 10.5 … 8.0 8.0 __ __ __ 25.5 10.0 6.4 -1.2
2007 57.2 46.7 22.4 3.2 21.1 … 10.6 10.6 __ __ __ 33.8 20.0 9.2 3.9
2008 63.9 56.7 49.9 5.3 1.5 … 7.2 7.2 __ __ __ 41.4 30.0 7.5 -2.0
2009 130.8 130.8 129.7 … 1.1 … … … __ __ __ 44.9 30.0 3.7 -2.0
2010 45.6 45.6 43.9 … 0.0 … … … __ __ __ 47.9 30.0 3.0 -1.8
2011 39.5 39.5 36.8 … 0.2 … … … __ __ __ 54.3 30.0 5.8 -1.3
2012 51.5 51.5 49.8 … 0.0 … … … __ __ __ 50.4 30.0 1.8 -2.4
2013 August 37.9 37.9 36.2 … 0.0 … … … __ __ __ 49.2 30.0 -1.1 -2.7
September 43.1 43.1 41.4 … 0.0 … … … __ __ __ 49.1 30.0 -1.2 -2.5
October 171.4 171.4 169.8 … 0.0 … … … __ __ __ 48.7 30.0 -1.5 -2.8
November 167.6 167.6 165.9 … 0.0 … … … __ __ __ 49.4 30.0 -0.8 -2.9
December 239.0 239.0 236.6 … 0.0 … __ __ __ __ __ 50.5 30.0 0.2 -2.7
2014 January
260.2 260.2 230.3 … 28.3 … … … __ __ __ 51.0 30.0 0.5 -2.8
February 277.0 277.0 244.0 … 31.4 … __ __ __ __ __ 50.4 30.0 -0.1 -3.0
March 285.9 285.9 253.8 … 30.4 … __ __ __ __ __ 51.0 30.0 0.6 -3.1
April 291.9 291.9 263.8 … 26.4 … __ __ __ __ __ 50.8 30.0 0.4 -2.9
May 308.8 308.8 286.8 … 20.3 … __ __ __ __ __ 51.2 30.0 0.8 -3.0
June 233.8 233.8 209.8 … 22.3 … __ __ __ __ __ 51.4 30.0 1.0 -2.8
July 135.7 135.7 113.3 … 20.0 … __ __ __ __ __ 51.6 30.0 1.2 -2.8
August 135.4 135.4 112.9 … 20.0 … __ __ __ __ __ 51.8 30.0 1.4 -3.0
September 60.7 60.7 39.0 … 20.0 … __ __ __ __ __ 52.2 30.0 1.8 -3.1
October 73.5 73.5 65.2 … 5.9 … __ __ __ __ __ 51.8 30.0 1.4 -2.9
November 83.1 83.1 69.8 … 10.9 … __ __ __ __ __ 51.8 30.0 1.4 -3.1
December 53.0 53.0 39.7 … 10.9 … __ __ __ __ __ 51.0 30.0 0.6 -2.8
2015 January
56.6 56.6 43.2 … 10.9 … __ __ __ __ __ 53.0 30.0 2.0 -2.9
February 56.8 56.8 44.2 … 10.9 … __ __ __ __ __ 52.6 30.0 1.9 -3.0
March 64.9 64.9 52.0 … 11.2 … __ __ __ __ __ 51.6 30.0 0.7 -3.1
April 77.2 77.2 74.6 … 0.9 … __ __ __ __ __ 51.1 30.0 0.2 -3.3
May 37.4 37.4 35.0 … … … __ __ __ __ __ 51.1 30.0 0.2 -3.4
June 77.4 77.4 75.0 … … … __ __ __ __ __ 50.2 30.0 -0.7 1.8
July 58.7 58.7 57.1 … … … __ __ __ __ __ 50.3 30.0 -0.6 -3.2
August 75.9 75.9 73.4 … … … __ __ __ __ __ 48.8 30.0 -2.0 -3.3
September 75.3 75.3 72.9 .... .... .... __ __ __ __ __ 50.7 30.0 -0.2 -3.0
October 77.7 77.7 74.9 … 0.3 … __ __ __ __ __ 50.8 30.0 -0.1 -2.9
November 91.1 91.1 83.6 … 5.1 … __ __ __ __ __ 51.2 30.0 0.3 -3.3
December 83.4 83.4 82.3 … 0.3 … __ __ __ __ __ 51.6 30.0 0.7 -3.3

| 29
Buletini Mujor Statistikor
December 2015 Monthly Statistics Bulletin
Tabela 4.1. ODC survey - net foreign assets and domestic claims
(In millions of euro: End of period)
Description
Net foreign assets Claims on CBK
Net claims
on central government
Claims on other sectors
Claims on non residents
of which:
Less: liabilities to
non-residents
of which::
Loans of which: Currenc
y Deposi
ts Securities other than shares
Deposits
Loans
Public nonfan-ancial corp.
Other nonfina-ncial corp.
Households
2006
334.4
394.5
52.3
235.1 99.4
60.1
21.4
38.7
88.8
(2.1) 636.6
636.6 __
490.5
146.1
2007
319.9
368.5
81.5
196.0 78.9
48.6
17.9
30.7
107.5
(3.9)
892.1
892.1
0.2
691.3
200.6
2008
325.4
401.3
81.4
265.9 40.5
75.9
42.0
33.7
136.8
(1.3)
1,183.4
1,183.4
0.1
901.7
281.0
2009
443.6
583.9
89.6
387.7 97.0
140.3
65.5
74.5
233.1
(164.9)
1,289.0
1,289.0
0.3
942.9
343.5
2010
507.6
709.8
103.5
403.5
173.4
202.2
85.5
116.7
203.4
(11.6) 1,457.1
1,457.1
6.3
1,006.6
434.3
2011
509.2
665.7
111.5
300.0 202.0
156.5
64.8
90.5
220.0
(1.2)
1,665.6
1,665.6
1.5
1,130.6
516.1
2012
490.9
633.7
124.6
226.6
196.7
142.8
87.6
50.3
301.1
59.2 1,740.9
1,740.9
1.4
1,172.9
546.7
2013 August
459.3
629.2
113.1
246.3 160.2
169.9
91.4
74.4
339.7
110.7 1,779.1
1,779.1
0.3
1,189.1
571.1
September
473.9
647.1
111.7
247.6 182.9
173.1
90.4
77.1
356.8
94.4 1,783.4
1,783.4
0.3
1,195.6
568.7
October
573.4
748.3
130.6
247.3 254.4
174.9
90.4
82.4
331.8
99.4 1,786.0
1,786.0
0.2
1,196.7
568.6
2014 January
571.2
772.4
109.0
272.7 261.9
201.3
113.9
83.2
322.7
92.6 1,775.4
1,775.4
0.2
1,191.7
564.3
February
577.0
775.6
104.6
285.7 254.8
198.6
109.3
84.2
291.9
117.7 1,775.2
1,775.2
0.2
1,192.2
563.7
March
589.0
781.0
112.0
275.2 265.4
192.0
103.7
83.5
255.7
126.4 1,806.7
1,806.7
0.2
1,217.0
569.6
April
566.1
754.0
112.7
239.2 265.9
187.9
98.9
86.3
244.7
130.8 1,821.0
1,821.0
0.2
1,226.4
575.6
May
555.8
743.4
109.9
243.2
251.9
187.7
94.5
89.9
228.7
144.6 1,838.1
1,838.1
0.2
1,231.2
587.7
June
499.5
695.4
115.3
216.4 238.7
195.9
93.0
99.0
242.8
165.8 1,871.1
1,871.1
0.2
1,252.9
597.8
July
532.2
734.7
140.4
286.7
211.2
91.3
106.4
91.3
250.7
168.8 1,868.4
1,868.4
0.2
1,243.3
605.9
August
574.6
770.0
123.2
286.4 258.8
96.2
100.2
90.6
299.8
159.2 1,842.3
1,842.3
0.2
1,214.5
608.3
September
579.5
757.0
121.7
301.8 245.0
177.4
94.2
80.3
291.2
161.0 1,849.1
1,849.1
0.2
1,227.6
613.5
October
555.7
735.0
113.5
341.4 203.0
179.2
95.1
79.8
300.5
172.7 1,853.5
1,853.5
0.2
1,238.6
607.3
November
509.1
692.2
105.7
312.3
197.1
183.1
93.7
86.2
338.3
177.3 1,860.3
1,860.3
0.2
1,238.3
614.2
December
534.3
715.8
131.2
329.4
191.1
181.5
90.6
87.8
315.9
187.3 1,881.9
1,881.9
0.6
1,235.0
639.1
2015 January
582.6
770.4
115.7
365.9 207.8
187.8
95.4
89.4
307.9
182.8 1,862.7
1,862.7
0.2
1,232.9
622.4
February
582.3
763.7
110.0
373.7 188.3
181.3
92.8
85.3
323.4
177.9 1,874.5
1,874.5
0.3
1,244.7
621.4
March
580.8
775.8
123.7
364.7 204.2
195.0
110.1
83.0
298.6
189.8 1,903.1
1,903.1
0.7
1,263.8
629.4
April
558.4
750.5
116.4
336.8 207.6
192.1
104.1
85.0
275.3
208.1 1,936.0
1,936.0
0.2
1,287.3
639.7
May 540.7 732.9 111.4 316.3 222.4 192.2 99.4 90.0 285.7 199.9 1,957.0 1,957.0 0.3 1,297.0 650.4
June 489.9 694.2 124.1 260.1 225.4 204.3 94.2 105.4 273.3 211.0 2,004.8 2,004.8 0.6 1,330.5 664.6
July 504.3 709.8 138.9 269.1 219.3 205.5 111.5 90.5 279.8 217.1 2,000.9 2,000.9 0.2 1,320.4 671.4
August 573.1 771.4 148.7 297.8 238.3 198.3 135.8 59.5 267.0 226.2 1,984.7 1,984.7 0.1 1,301.1 674.1
September 529.3 719.7 146.1 242.3 238.3 190.4 105.0 83.2 285.3 226.8 1,992.8 1,992.8 0.6 1,315.8 668.2
October 511.6 709.7 151.2 265.3 204.5 198.1 101.2 94.1 309.7 302.7 2,006.1 2,006.1 0.1 1,312.2 685.9
November 511.7 721.8 147.8 269.9 205.7 210.1 100.3 104.0 286.2 223.1 2,014.9 2014.9 0.1 1329.4 677.1
December 535.7 740.0 175.5 225.2 247.2 204.3 116.0 85.9 315.7 220.7 2,019.0 2,019.0 0.6 1,324.1 685.6

30 |
Monthly Statistics Bulletin December 2015
Table 4.2. ODC survey - liabilities
(In millions of euro: End of period)
Description
Deposits included in broad money Deposits excluded from broad money
of which:
Shares and
other equity
Other items (net) Transferable deposits
of which:
Other deposits
of which:
Other nonfina
ncial corpora
tions
Households
Other financial corpor-ations
Public nonfan-ancial
corp. 1/
Other nonf-
inancial corp.
Househo-lds 2/
Other financ-
ial corpora
tions
Public nonfina
ncial corp. 1/
Other nonfan-ancial corp.
Households 2/
2001 478.4 353.1 . . 133.9 219.2 125.2 . . 31.3 93.9 . . . 20.4 -6.4
2002 409.7 281.4 . . 159.7 121.7 128.3 . . 23.9 104.4 . . . 33.2 -6.6
2003 494.0 273.4 . . 139.0 134.4 220.6 . . 87.1 133.5 1.8 1.8 . 45.0 -7.0
2004 681.9 270.9 9.0 24.7 81.3 145.5 410.9 14.0 149.3 24.4 222.5 0.0 0.0 0.0 69.1 -0.1
2005 798.8 283.0 7.2 30.0 76.8 155.5 515.8 20.2 181.3 33.1 279.6 19.9 0.7 19.3 74.0 3.4
2006 862.9 294.5 4.9 24.3 96.4 156.2 568.4 22.5 193.3 24.6 322.4 40.6 3.0 37.1 103.3 50.9
2007 1,069.3 367.1 5.3 28.5 133.5 187.5 702.3 29.8 188.4 41.8 439.0 53.7 2.0 50.3 152.7 39.8
2008 1,329.0 397.9 13.8 13.8 176.0 186.2 931.1 40.4 250.1 44.2 593.8 74.9 7.3 63.0 192.3 48.1
2009 1,417.8 490.6 8.5 48.9 184.0 237.7 927.2 60.8 73.9 71.7 718.5 97.9 11.2 83.5 204.2 81.0
2010 1,702.2 628.6 9.2 83.8 218.6 303.5 1,073.6 85.2 30.2 73.5 883.7 138.2 9.9 112.2 230.4 85.7
2011 1,862.8 665.9 10.1 67.9 208.1 360.9 1,196.9 91.0 49.2 71.7 979.9 175.8 8.0 149.7 252.8 102.2
2012
1,985.3
708.0 9.6
13.8
257.5
407.2
1,277.3
100.4
49.8
70.5
1,053.1 206.2
7.8
179.8
270.7
129.8
2013 October
2,056.7
782.3
11.9
13.5
283.4
448.4
1,274.4
62.2
64.3
58.6
1,084.7
206.7
7.2
178.8
276.8
148.5
November
2,059.2
788.2
16.2
18.8
258.4
472.4
1,271.0
59.9
53.8
70.0
1,082.2
210.2
6.9
180.2
274.7
164.4
December
2,149.4
857.3
11.8
16.4
299.6
506.6
1,292.1
62.2
43.7
92.3
1,088.9
209.7
5.9
179.4
278.5
152.8
2014 January
2,120.5
819.9
7.8
11.8
258.3
516.2
1,300.5
68.9
35.9
85.9
1,104.8 209.8
6.0
178.3
281.0
150.6
February
2,117.2
827.5 9.2
10.7
254.4
527.4
1,289.7
79.0
35.4
74.8
1,095.7
207.7
6.0
176.1
283.4
153.6
March
2,126.3
851.9
10.9
9.5
260.9
536.1
1,274.5
80.3
30.2
72.5
1,086.6
201.4
6.7
169.1
287.8
162.3
April
2,128.8 866.2
11.8
11.5
253.2
561.8
1,262.7
81.8
44.9
66.4
1,064.9
198.9
7.0
166.3
275.5
159.4
May
2,122.0
877.1
13.1
10.2
257.2
572.2
1,244.9
81.9
45.8
63.6
1,048.4
199.5
6.8
166.9
282.5
163.2
June
2,128.0 909.0
15.0
11.0
256.3
602.7
1,219.0
81.1
46.0
61.1
1,025.6 200.9
6.6
168.7
289.9
160.4
July
2,168.3 966.9
13.2
12.1
275.6
639.3
1,201.4
81.0
45.6
64.8
1,006.3
201.5
7.1
168.7
299.6
150.8
August
2,209.8
1,039.1
16.1
27.6
298.0
668.6
1,170.7
82.3
27.2
65.5
992.2
204.7
7.8
170.8
308.8
152.6
September
2,214.3
1,043.1
17.5
12.5
300.9
683.8
1,171.2
81.2
41.6
67.4
978.4 206.6
7.9
171.8
310.0
149.9
October
2,208.8
1,053.6
17.9
14.0
292.0
699.7
1,155.1
82.0
41.7
64.9
962.2
207.2
7.8
172.5
312.7
153.9
November
2,198.3
1,071.6 25.3
11.3
296.3
708.3
1,126.8
72.2
41.4
60.7
948.1
207.0
7.7
172.5
317.0
162.7
December
2,234.4
1,141.7 20.4
10.2
338.4
743.5
1,092.7
67.2
39.4
50.2
930.6
208.7
7.8
174.2
323.1
153.2
2015 January
2,237.5
1,160.7
17.7
10.4
319.4
784.4
1,077.4
64.4
34.4
49.8
923.3
208.7
7.8
174.2
330.6
157.4
February
2,234.0
1,169.6 17.2
10.1
313.4
800.9
1,064.4
61.2
34.5
56.0
907.5
223.0
7.9
187.4
337.9
163.1
March
2,233.4
1,187.5 15.5
19.6
306.0
818.7
1,045.9
61.0
25.6
57.7
896.4
226.3
8.8
190.0
344.9
167.6
April
2,240.3
1,195.7 13.7
17.7
317.2
820.5
1,044.6
61.4
24.6
62.2
891.9
226.3
8.8
190.0
352.8
158.5
May 2,242.5 1,209.5 13.1 14.5 323.5 830.5 1,033.0 58.4 24.6 63.7 883.1 226.3 8.8 190.0 360.9 153.6
June 2,230.2 1,226.9 11.6 10.9 335.3 841.8 1,003.3 59.4 24.5 60.8 855.2 244.1 12.8 207.6 349.7 154.8
July 2,252.7 1,278.3 13.9 9.7 355.3 868.3 974.4 56.1 22.0 51.7 841.3 244.1 12.8 207.6 357.5 147.7
August 2,302.7 1,337.5 13.6 9.3 394.3 887.9 965.2 48.9 21.9 46.1 845.0 241.7 13.5 198.4 364.5 142.1
September 2,301.4 1,358.6 18.2 21.8 386.4 897.6 942.8 45.7 11.9 46.1 835.9 243.1 13.9 200.8 358.2 131.6
October 2,280.7 1,342.0 14.6 19.4 377.0 893.6 938.8 44.9 14.9 46.9 829.9 247.5 13.4 203.5 374.6 134.8
November 2290.5 1336.5 14.9 12.1 377.4 897.1 954.1 43.6 12.2 56.3 840.5 231.3 6.6 190.7 381.6 132.5
December 2,349.6 1,392.0 14.5 10.9 413.8 919.1 957.5 37.6 12.8 54.3 852.3 232.7 13.9 193.1 393.8 115.0

| 31
Buletini Mujor Statistikor
December 2015 Monthly Statistics Bulletin
Table 5.1. OFC survey - net foreign assets and domestic claims
(In millions of euro: End of period)
Description
Net foreign assets Claims on depozitory corporations Net claims on
central governm-
ent
Claims on other
sectors
Claims on non-
residents
of which: Less: liabilities to non-residents
CBK Other depository corporations Loans
Securities other
than shares
Shares and other equity
Loans Transfera-ble
depositst
Other deposits
Transfe-rable
depositst
Other deposits
2005 132.1 146.4 __ 145.3 14.3 14.3 54.8 27.4 23.3 4.1 27.4 7.2 20.2 __ 60.0 51.7
2006 198.1 210.0 38.3 170.8 11.9 11.9 66.9 39.0 31.0 8.0 28.0 4.9 23.0 __ 69.5 57.7
2007 244.9 278.5 100.7 175.4 33.6 33.6 72.8 32.9 22.4 10.6 39.8 6.2 33.6 __ 85.4 73.8
2008 157.0 214.7 79.8 128.2 57.7 57.7 113.0 57.1 49.9 7.2 55.9 7.9 48.0 __ 108.3 94.0
2009 168.6 253.8 97.9 144.3 85.1 85.1 200.0 129.7 129.7 … 70.3 7.4 62.9 __ 130.8 109.4
December 341.3 430.5 152.5 269.3 89.2 89.2 142.8 43.9 43.9 … 98.8 8.2 90.6 __ 139.7 116.9
September 420.4 500.5 164.5 332.7 80.1 80.1 120.8 17.0 17.0 … 103.8 9.8 94.0 __ 136.1 110.1
December 464.0 545.7 3.2 533.1 81.7 81.7 138.1 27.7 27.7 … 110.4 7.3 103.1 __ 128.1 102.5
2012 March 520.9 588.4 3.2 580.9 67.6 67.6 141.4 27.3 27.3 … 114.1 7.7 106.4 __ 120.1 93.1
June 532.4 602.4 3.3 598.7 70.0 70.0 146.5 25.3 25.3 … 121.2 11.5 109.7 __ 130.2 105.7
September 558.0 625.7 3.2 622.1 67.7 67.7 164.0 36.9 36.9 … 127.1 12.0 115.1 13.8 123.7 99.7
2012 December 607.6 670.8 3.3 666.5 63.2 63.2 154.0 32.4 32.4 … 121.6 9.7 111.9 13.9 125.5 98.3
2013 March 677.8 739.0 3.3 734.5 61.1 61.1 153.2 49.4 49.4 … 103.9 8.9 94.9 0.0 121.2 96.9
June 720.5 782.3 3.4 777.9 61.9 61.9 110.1 18.6 18.6 … 91.5 11.8 79.7 11.6 122.6 95.9
September 759.9 821.6 3.4 816.9 61.7 61.7 113.8 19.1 19.1 … 94.7 13.5 81.2 23.3 119.2 94.2
December 593.0 655.8 3.5 651.2 62.7 62.7 313.0 213.9 213.9 … 99.1 14.6 84.5 53.1 117.5 94.4
2014 March 605.1 665.4 3.5 660.9 60.4 60.4 326.8 230.6 230.6 … 96.2 10.2 86.0 62.8 119.2 96.5
June 695.1 757.2 3.7 752.4 62.1 62.1 284.8 186.1 186.1 … 98.7 12.5 86.3 63.8 121.5 98.4
September 909.0 972.4 3.9 967.4 63.3 63.3 118.5 14.9 14.9 … 103.7 13.5 90.2 62.0 120.6 97.9
December 967.6 1,029.4 4.0 1,024.4 61.8 61.8 119.5 15.0 15.0 … 104.5 14.3 90.1 54.7 119.9 96.8
2015 March 1,023.4 1,083.9 4.2 1,078.7 60.5 60.5 127.6 26.8 26.8 … 100.9 9.9 91.0 74.6 125.5 97.9
June 998.9 1,061.2 4.4 1,055.8 62.3 62.3 157.5 49.2 49.2 … 108.3 11.3 96.9 79.7 129.8 100.9
September 988.6 1,050.6 4.0 1,045.6 62.0 62.0 151.2 46.5 46.5 … 104.7 18.8 85.9 82.3 131.7 101.9
Dhjetor 1,028.4 1,091.1 3.9 1,086.3 62.7 62.7 163.0 55.4 55.4 ... 107.5 20.7 86.8 100.3 131.6 104.2

32 |
Monthly Statistics Bulletin December 2015
Table 5.2. OFC survey - liabilities
(In millions of euro: End of period)
Description
Loans Insurance technical reserves Shares and other equity Other items
Net equity
of house-hods in in life ins.
Net equity for
households in
pension funds
Prepay-ment of preiums
and reserves
Funds contri-buted
by owners
Retained
earnings
General and special reserv
es
Profit/Loss for
the year
Other liabiliti
es
Less: other
assets
Plus: consolid
ation adjust-
ent
2004 2.3 106.5 … 88.7 17.9 58.0 42.6 8.6 5.0 1.7 1.7 9.3 7.6 __
2005 3.0 174.5 … 152.4 22.1 71.4 47.7 12.9 6.7 4.0 -2.1 4.4 6.5 __
2006 3.4 251.4 … 223.9 27.5 80.5 55.2 15.8 7.9 1.6 -0.7 7.4 8.2 __
2007 … 316.1 … 286.2 29.9 87.4 62.1 20.1 1.7 3.5 -0.4 9.6 10.0 __
2008 1.0 288.6 … 256.3 32.3 77.4 54.0 12.7 7.4 3.4 11.3 24.2 12.9 __
2009 2.9 422.3 … 380.8 41.5 77.0 53.4 19.4 7.2 -3.1 -2.7 13.1 15.8 __
December 2.9 540.5 … 493.7 46.8 82.5 59.7 13.6 7.2 2.0 -2.1 20.9 23.1 __
September 2.8 598.5 … 545.9 52.6 82.1 57.5 15.5 6.5 2.7 -6.0 17.1 23.1 __
December 3.3 647.8 … 593.3 54.5 85.4 60.4 13.3 10.8 0.9 -6.3 16.1 22.4 __
2012 March 2.5 698.6 … 642.9 55.7 87.8 63.5 12.6 10.9 0.8 -6.4 15.6 22.0 __
June 4.1 717.3 … 659.1 58.3 80.8 62.0 10.2 10.2 -1.8 -6.4 30.6 22.0 __
September 4.2 767.8 … 708.1 59.7 82.8 63.3 10.2 10.2 -1.4 4.7 30.0 25.3 __
December 7.2 814.9 … 745.1 69.8 78.1 63.5 9.8 10.7 -6.4 0.7 29.0 28.4 __
2013 March 6.1 866.8 … 800.3 66.5 76.7 64.1 3.2 9.9 -0.4 2.6 30.1 27.5 __
June 7.0 880.0 … 808.8 71.2 75.1 63.7 3.6 9.9 -2.0 2.7 28.7 26.0 __
September 6.8 932.2 … 859.5 72.7 75.9 64.2 2.4 10.6 -1.2 1.3 27.0 25.7 __
December 6.8 990.3 … 919.0 71.3 75.6 64.2 1.3 11.1 -1.0 3.9 29.8 25.9 __
2014 March 5.4 1,026.9 … 954.3 72.6 77.1 64.3 1.0 12.3 -0.5 4.4 28.7 24.3 __
June 5.2 1,078.2 … 1,002.6 75.6 78.1 64.2 0.2 13.6 0.1 3.6 28.5 24.9 __
September 3.9 1,123.4 … 1,044.6 78.8 79.1 64.3 -0.5 13.6 1.8 3.8 28.5 24.7 __
December 3.2 1,173.8 … 1,094.1 79.7 79.1 64.3 -0.5 14.4 0.9 5.6 30.4 24.8 __
2015 March 2.8 1,256.3 … 1,175.0 81.3 83.3 69.4 1.7 11.9 0.2 8.7 33.1 24.4 __
June 2.3 1,270.0 … 1,184.3 85.7 84.3 73.0 0.8 12.0 -1.4 9.2 33.5 24.3 __
September 2.4 1,253.6 … 1,163.7 89.8 87.2 75.6 0.6 12.0 -1.0 10.6 35.4 24.8 __
Dhjetor 1.0 1,329.5 … 1,237.3 92.2 86.2 76.9 0.6 14.0 -5.3 6.6 31.4 24.8 __

| 33
Buletini Mujor Statistikor
December 2015 Monthly Statistics Bulletin
Table 6.1. Other intermediary financial survey – net foreign assets and internal claims
(In millions of euro: End of period)
Description
Net foreign assets Claims on depository corporations Claims on other sectors Other claims
Claims on nonresidents
Liabilities to nenresidents
CBK Other depository corporations Loans
Currency Loans Transfe-rable
deposits
Other deposits
Other nonfina-
ncial corpora-
tions
2005 -13.4 0.8 0.8 14.3 14.3 5.8 … 5.8 3.7 2.1 53.3 51.7 51.7 1.6
2006 -11.0 0.9 0.9 11.9 11.9 2.4 … 2.4 1.9 0.5 59.5 57.7 57.7 1.8
2007 -31.3 2.4 2.4 33.6 33.6 9.6 … 9.6 3.0 6.6 74.8 73.8 73.8 0.9
2008 -51.6 6.1 6.1 57.7 57.7 6.5 … 6.5 6.5 4.5 95.0 94.0 94.0 1.0
2009 -73.7 11.
5 11.5 85.1 85.1 5.9 … 5.9 1.7 4.2 111.0 109.4 109.4 1.6
September -80.5 8.2 8.2 88.7 88.7 5.6 … 5.6 1.6 4.0 119.9 118.4 118.4 1.5
December -80.5 8.7 8.7 89.2 89.2 5.8 … 5.8 1.9 4.0 118.3 116.9 116.9 1.4
2011 March -87.1 1.2 1.2 88.3 88.3 8.1 … 8.1 2.6 5.5 117.7 116.0 116.0 1.7
June -84.6 3.6 3.6 88.3 88.3 6.6 … 6.6 1.4 5.2 118.1 115.8 115.8 2.2
September -77.2 2.9 2.9 80.1 80.1 5.7 … 5.7 1.4 4.2 112.0 110.1 110.1 1.9
December -72.4 9.2 9.2 81.7 81.7 6.8 … 6.8 2.5 4.3 104.8 102.5 102.5 2.2
2012 March -63.4 4.2 4.2 67.6 67.6 7.2 … 7.2 1.9 5.4 95.2 93.1 93.1 2.1
June -69.8 0.2 0.2 70.0 70.0 9.0 … 9.0 5.2 3.8 105.7 105.7 105.7 …
September -67.4 0.3 0.3 67.7 67.7 12.5 … 12.5 8.1 4.4 99.7 99.7 99.7 …
2012 December -62.3 0.9 0.9 63.2 63.2 8.5 … 8.5 7.0 1.5 98.3 98.3 98.3 …
2013 March -60.3 0.9 0.9 61.1 61.1 7.4 … 7.4 6.0 1.4 96.9 96.9 96.9 …
June -61.0 0.8 0.8 61.9 61.9 8.6 … 8.6 7.2 1.4 95.9 95.9 95.9 …
September -60.8 0.9 0.9 61.7 61.7 9.5 … 9.5 8.4 1.1 94.2 94.2 94.2 …
December -62.0 0.9 0.9 62.8 62.8 10.9 … 10.9 9.6 1.3 94.4 94.4 94.4 …
2014 March -59.6 0.8 0.8 60.4 60.4 7.1 … 7.1 6.0 1.1 96.5 96.5 96.5 …
June -61.2 0.9 0.9 62.1 62.1 6.5 … 6.5 5.0 1.5 98.4 98.4 98.4 …
September -62.5 0.9 0.9 63.3 63.3 9.1 … 9.1 7.6 1.5 97.9 97.9 97.9 …
2014 December -61.0 0.9 0.9 61.8 61.8 8.2 … 8.2 6.7 1.5 96.8 96.8 96.8 …
2015 March -59.6 0.8 0.8 60.5 60.5 8.0 … 8.0 5.9 2.1 97.9 97.9 97.9 …
June -61.5 0.8 0.8 62.3 62.3 7.8 … 7.8 5.5 2.3 100.9 100.9 100.9 …
September -61.1 0.9 0.9 62.0 62.0 8.3 … 8.3 6.0 2.3 101.9 101.9 101.9 …
December -61.9 0.8 0.8 62.7 62.7 7.9 … 7.9 5.1 2.8 104.2 104.2 104.2 …

34 |
Monthly Statistics Bulletin December 2015
Table 6.2. Other intermediary financial survey - liabilities
(In millions of euro: End of period)
Description
Loans Shares and other equity Other items (net)
Funds contributed by owners
Retained earnings
Profit/loss of the year
General and
special reserves
Grants from
donors
Other liabilities
Less: Other assets
Plus: Consolidation
adjustment
2005 3.0 41.5 24.8 10.2 … 6.5 … 1.1 2.3 1.2 …
2006 3.4 46.4 27.7 11.4 … 7.2 … 1.2 2.6 1.4 …
2007 … 49.0 30.6 18.1 … 0.3 … 4.1 5.5 1.4 …
September … 35.2 18.1 10.1 … 6.9 … 5.9 9.4 3.5 …
2008 … 37.6 18.8 13.6 … 5.3 … 12.3 15.9 3.6 …
March … 37.3 17.8 14.2 … 5.3 … 12.3 15.9 3.6 …
June … 38.9 18.3 15.2 … 5.3 … 11.5 15.3 3.8 …
September … 39.1 18.5 15.4 … 5.2 … 9.4 14.8 5.5 …
2009 … 38.0 14.8 17.9 … 5.2 … 5.2 10.1 4.9 …
2010 March … 37.2 15.6 16.5 … 5.2 … 5.7 11.0 5.2 …
June … 36.6 15.5 15.9 … 5.2 … 7.3 12.4 5.1 …
September … 35.9 15.7 17.6 … 2.6 … 9.1 13.2 4.1 …
December … 37.8 18.7 16.5 … 2.6 … 5.8 12.8 7.0 …
2011 March … 38.1 18.6 16.9 … 2.6 … 0.7 7.2 6.5 …
June … 38.7 19.0 17.2 … 2.5 … 1.4 8.3 6.9 …
September … 38.9 19.2 17.2 … 2.5 … 1.6 8.7 7.0 …
December … 38.7 20.1 16.2 … 2.4 … 0.4 6.8 6.4 …
2012 March … 37.5 20.8 14.2 … 2.5 … 1.6 7.1 5.5 …
June … 31.6 18.7 13.3 -2.7 2.3 … 13.1 20.7 7.6 …
September … 31.8 20.1 13.3 -3.9 2.3 … 12.9 21.3 8.4 …
December … 31.2 20.3 13.1 -4.5 2.3 … 13.3 21.4 8.0 …
2013 March … 30.2 20.3 9.4 -0.5 1.0 … 13.8 21.7 7.9 …
June … 30.2 19.9 9.9 -0.6 1.0 … 13.2 20.9 7.6 …
September … 30.1 20.4 9.9 -1.1 1.0 … 12.7 19.9 7.2 …
December … 30.6 20.4 9.9 0.2 0.1 … 12.8 19.8 7.0 …
2014 March … 30.2 20.6 9.8 -0.2 0.1 … 13.8 20.8 7.0 …
June … 29.7 20.5 9.2 0.0 0.1 … 14.0 21.4 7.4 …
September … 30.6 20.5 9.2 0.9 0.1 … 14.0 21.4 7.4 …
December … 30.4 20.5 9.2 0.7 0.1 … 13.6 20.6 7.1 …
2015 March … 31.2 20.6 10.2 0.3 0.1 … 15.1 21.9 6.7 …
June … 31.9 20.7 9.9 1.2 0.1 … 15.4 22.1 6.8 …
September … 32.9 20.8 9.9 2.1 0.1 … 16.2 23.3 7.1 ....
December … 34.5 22.2 9.9 2.4 0.1 … 15.7 22.5 6.8 …

| 35
Buletini Mujor Statistikor
December 2015 Monthly Statistics Bulletin
Table 7.1. Insurance companies survey - net foreign assets and internal claims
(In millions of euro: End of period)
Description
Net foreign assets Claims and other depository corporations Claims on other sectors
Claims on other sectors
Claims on nonresidents
CBK
Other depository corporations Other claims
Other claims
Cash
Transferable deposits
Other deposits
Transferable deposits
Other deposits
2005 December 3.5 3.5 0.2 35.8 17.4 17.4 0.0 18.4 3.5 14.9 … … 6.7 6.7
2006 December … … … 45.2 20.5 18.5 2.0 24.7 2.4 22.3 … … 10.0 10.0
2007 December … … … 49.7 20.0 14.9 5.2 29.7 2.8 26.9 … … 10.7 10.7
2008 March 0.1 0.1 0.1 51.2 20.1 11.1 9.0 31.1 3.5 27.6 … … 11.8 11.8
June 0.1 0.1 0.1 48.8 21.4 10.6 10.8 27.4 3.9 23.5 … … 12.4 12.4
September 0.1 0.1 0.1 48.8 21.4 10.6 10.8 27.4 3.9 23.5 … … 12.4 13.1
December 0.5 0.5 0.5 55.0 22.6 15.4 7.2 32.4 5.8 26.7 … … 13.3 13.3
2009 March 0.1 0.1 0.1 52.1 22.4 20.6 1.8 29.7 2.9 26.7 … … 15.6 15.6
June 0.2 0.2 0.2 49.1 12.4 10.6 1.8 36.7 4.8 31.9 … … 15.6 14.1
September 0.2 0.2 0.2 53.3 8.3 8.3 … 45.1 5.5 39.5 … … 16.0 14.2
December 0.1 0.1 0.1 51.7 7.7 7.7 … 44.0 4.0 40.0 … … 18.2 16.4
2010 March 0.1 0.1 0.1 60.1 7.6 7.6 … 52.5 4.0 48.4 … … 17.8 16.0
June 0.2 0.2 0.2 58.7 5.7 5.7 … 53.0 4.1 49.0 … … 19.2 17.4
September 0.1 0.1 0.1 60.8 5.6 5.6 … 55.1 4.1 51.0 … … 19.5 17.7
December 0.1 0.1 0.1 61.0 5.8 5.8 … 55.2 5.2 50.0 … … 20.0 18.2
2011 March 0.1 0.1 0.1 60.9 5.8 5.8 … 55.1 5.9 49.2 … … 24.1 22.3
June 0.2 0.2 0.2 62.2 7.3 7.3 … 54.9 2.7 52.1 … … 25.0 23.2
September 0.4 0.4 0.4 66.2 4.5 4.5 … 61.7 7.3 54.4 … … 23.2 21.4
December 0.1 0.1 0.1 74.0 7.7 7.7 … 66.3 3.2 63.1 … … 22.5 20.7
2012 March 0.1 0.1 0.1 75.1 5.0 5.0 … 70.1 5.0 65.1 … … 24.2 22.4
2012 June 0.1 0.1 0.1 80.1 4.8 4.8 … 75.3 5.5 69.7 … … 23.8 21.6
September 0.1 0.1 0.1 82.2 4.8 4.8 … 77.4 3.2 74.2 … … 23.4 21.6
December 0.1 0.1 0.1 83.8 5.0 5.0 … 78.8 2.1 76.7 … … 26.6 26.6
2013 March 0.2 0.2 0.2 83.0 4.9 4.9 … 78.1 2.3 75.8 … … 23.9 23.9
June 0.2 0.2 0.2 85.3 4.0 4.0 … 81.2 4.3 77.0 … … 26.2 24.8
September 0.2 0.2 0.2 88.3 4.8 4.8 … 83.5 4.7 78.7 … … 24.6 23.2
December 0.1 0.1 0.1 90.6 4.2 4.2 … 86.5 4.6 81.8 … … 22.7 21.3
2014 March 0.1 0.1 0.1 92.4 5.0 5.0 … 87.4 3.8 83.6 … … 22.3 22.3
June 0.1 0.1 0.1 95.3 4.8 4.8 … 90.5 7.0 83.5 … … 22.7 22.7
September 0.1 0.1 0.1 97.9 4.8 4.8 … 93.0 5.4 87.6 … … 22.3 22.1
December 0.0 0.0 0.0 99.9 5.0 5.0 … 94.9 7.2 87.8 … … 22.7 22.7
2015 March 0.1 0.1 0.1 101.8 10.1 10.1 … 91.7 3.6 88.1 … … 27.2 27.2
June 0.1 0.1 0.1 105.0 5.4 5.4 … 99.6 5.4 94.2 … … 28.4 27.3
September 0.1 0.1 0.1 100.6 5.0 5.0 … 95.5 12.4 83.2 10.1 10.1 29.3 28.0
December 0.0 0.0 0.0 97.3 4.5 4.5 … 92.7 9.1 83.7 10.6 10.6 26.9 24.8

36 |
Monthly Statistics Bulletin December 2015
Table 7.2. Insurance companies survey - liabilities
(In millions of euro: End of period)
Description
Loans Insurance technical reserve Shares and other equity Other items (net)
Other depository corporatio
ns
Net equity in
households in life
insurance reserves
Prepayment of premiums and
reserves against
outstanding claims
Funds contributed by owners
Retained earnings
General and
special reserves
Profit/loss of the
year
Other liabilitie
s
Less: Other asset
s
Plus: Cons-olidatio
n adjust-ment
2005 __ __ 22.1 __ 22.1 27.1 20.1 2.7 0.2 4.0 -3.2 2.1 5.3 …
2006 __ __ 27.5 __ 27.5 29.7 23.0 4.4 0.7 1.6 -2.0 4.9 6.8 …
2007 __ __ 29.9 __ 29.9 34.3 27.0 2.4 1.4 3.5 -3.8 4.0 7.8 …
June __ __ 31.4 __ 31.4 36.9 30.5 4.7 1.5 0.2 -7.0 0.9 7.9 …
September 0.6 0.6 31.4 __ 31.4 36.9 30.5 4.7 1.5 0.2 -7.0 0.9 7.9 …
2008 1.0 1.0 32.3 __ 32.3 35.9 30.5 0.0 2.1 3.4 -0.4 8.2 8.5 …
March 1.0 1.0 31.2 __ 31.2 40.6 33.8 3.6 1.9 1.2 -5.0 4.3 9.3 …
June 0.3 0.3 34.1 __ 34.1 38.8 33.8 3.3 2.4 -0.7 -8.4 1.7 10.1 …
September 0.3 0.3 35.4 __ 35.4 40.8 33.8 3.3 1.7 2.0 -7.0 3.7 10.7 …
2009 2.9 2.9 41.5 __ 41.5 35.0 33.8 2.3 2.0 -3.1 -9.4 1.4 10.8 …
2010 March 2.6 2.6 41.9 __ 41.9 36.8 34.8 -1.6 3.0 0.6 -3.3 8.7 12.0 …
June 3.0 3.0 43.8 __ 43.8 37.2 35.3 -1.8 3.0 0.7 -5.8 6.1 11.9 …
September 3.7 3.7 46.1 __ 46.1 36.3 35.3 -2.5 3.0 0.5 -5.6 6.1 11.8 …
December 3.2 3.2 47.2 __ 47.2 39.5 33.9 -2.4 7.0 0.9 -8.8 7.0 15.8 …
2011 March 3.3 3.3 48.3 __ 48.3 40.5 36.8 -2.1 4.6 1.2 -7.0 9.0 16.0 …
June 2.7 2.7 51.1 __ 51.1 41.5 37.8 -1.6 4.1 1.2 -8.0 8.0 16.0 …
September 2.8 2.8 52.6 __ 52.6 42.8 37.8 -1.6 4.0 2.7 -8.5 7.5 16.0 …
December 3.3 3.3 54.5 __ 54.5 46.3 39.9 -2.9 8.4 0.9 -7.5 8.4 15.9 …
2012 March 2.5 2.5 55.7 __ 55.7 49.9 42.3 -1.6 8.4 0.8 -8.7 7.7 16.5 …
June 4.1 4.1 58.3 __ 58.3 48.8 42.8 -3.0 8.4 0.6 -7.1 9.0 16.1 …
September 4.2 4.2 59.7 __ 59.7 50.6 42.8 -3.0 8.4 2.5 -8.8 8.1 16.9 …
2012 December 4.5 4.5 61.8 __ 61.8 47.7 39.8 1.6 8.9 -1.9 -8.9 6.3 15.2 …
2013 March 6.1 6.1 66.5 __ 66.5 46.1 43.4 -6.2 8.9 0.1 -11.6 8.0 19.6 …
June 7.0 7.0 71.2 __ 71.2 44.5 43.4 -6.3 8.9 -1.4 -10.9 7.5 18.4 …
September 6.8 6.8 72.7 __ 72.7 45.4 43.4 -7.5 9.6 -0.1 -11.8 6.7 18.5 …
December 6.8 6.8 71.3 __ 71.3 45.8 43.4 -7.9 11.0 -0.8 -10.4 8.7 19.1 …
2014 March 5.4 5.4 72.6 __ 72.6 46.5 43.4 -8.9 12.2 -0.2 -9.8 7.5 17.3 …
June 5.2 5.2 75.6 __ 75.6 48.0 43.4 -9.0 13.5 0.1 -10.7 6.7 17.5 …
September 3.9 3.9 78.8 __ 78.8 48.2 43.4 -9.7 13.6 1.0 -10.6 6.7 17.3 …
December 3.2 3.2 79.7 __ 79.7 47.7 43.4 -9.7 14.3 -0.3 -7.8 9.9 17.7 …
2015 March 2.8 2.8 81.3 __ 81.3 51.7 48.4 -8.5 11.9 -0.1 -6.8 10.8 17.6 …
June 2.3 2.3 85.7 __ 85.7 52.1 51.9 -9.1 11.9 -2.5 -6.5 11.0 17.6 …
September 2.4 2.4 89.2 __ 89.2 53.9 54.4 -9.3 11.9 -3.1 -5.9 11.6 17.5 …
December 1.0 1.0 92.2 __ 92.2 51.2 54.4 -9.3 13.9 -7.7 -9.6 8.5 18.0 …

| 37
Buletini Mujor Statistikor
December 2015 Monthly Statistics Bulletin
Table 8.1. Pension funds survey - net foreign assets, internal claims and liabilities
(In millions of euro: End of period)
Description
Net foreign assets Claims and other depository corporations
Net claims on Central
Government Claims on other sectors
Insurance technical reserves
Claims on nonresidents
CBK of which: Other depository corporations
of which:
Net equity of
households in pension
funds
Cash Shares and other equities
Transferable deposits
Transferable deposits
Other deposits
2005 142.0 142.0 … 142.0 10.4 10.0 5.9 0.4 … 0.4 __ __ __ 152.4 152.4
2006 209.1 209.1 38.3 170.8 14.8 14.4 8.4 0.5 0.5 … __ __ __ 223.9 223.9
2007 272.9 272.9 97.5 175.4 13.3 12.9 7.5 0.5 0.5 … __ __ __ 286.2 286.2
September 248.6 248.6 89.3 159.3 32.2 16.6 16.6 15.6 0.1 15.5 __ __ __ 280.7 280.7
2008 206.1 206.1 77.9 128.2 50.3 34.5 34.5 15.8 0.1 15.7 __ __ __ 256.3 256.3
March 192.9 192.9 77.1 115.8 68.3 52.2 52.2 16.1 0.1 16.0 __ __ __ 261.1 261.1
June 215.8 215.8 83.7 132.1 87.8 71.5 71.5 16.3 0.1 16.2 __ __ __ 303.6 303.6
September 229.8 229.8 91.5 138.3 118.4 101.8 101.8 16.6 0.1 16.5 __ 1.7 1.7 350.0 350.0
2009 240.2 240.2 95.9 144.3 139.0 122.1 122.1 16.9 0.1 16.9 __ 1.6 1.6 380.8 380.8
2010 March 311.6 311.6 100.1 211.5 99.4 82.2 82.2 17.3 0.1 17.2 __ 1.5 1.5 412.6 412.6
June 350.3 350.3 97.9 252.3 60.8 34.8 34.8 26.0 0.0 26.0 __ 1.4 1.4 412.5 412.5
September 379.6 379.6 134.9 244.7 73.8 42.5 42.5 31.2 0.1 31.2 __ 1.3 1.3 454.7 454.7
December 419.8 419.8 150.5 269.3 72.7 38.2 38.2 34.6 0.1 34.5 __ 1.2 1.2 493.7 493.7
2011 March 478.9 478.9 184.9 294.0 44.3 9.4 9.4 34.8 0.1 34.8 __ 1.1 1.1 524.2 524.2
June 481.5 481.5 187.7 293.9 69.0 33.9 33.9 35.1 0.1 35.0 __ 1.0 1.0 551.5 551.5
September 497.1 497.1 164.4 332.7 47.8 12.4 12.4 35.4 0.2 35.3 __ 0.9 0.9 545.9 545.9
December 536.2 536.2 3.1 533.1 56.3 20.8 20.8 35.5 0.0 35.5 __ 0.8 0.8 593.3 593.3
2012 March 584.0 584.0 3.0 580.9 58.2 22.3 22.3 35.9 0.1 35.8 __ 0.7 0.7 642.9 642.9
June 601.9 601.9 3.2 598.7 56.5 20.5 20.5 36.1 0.0 36.0 __ 0.7 0.7 659.1 659.1
September 625.2 625.2 3.1 622.1 68.5 32.0 32.0 36.5 0.1 36.4 13.8 0.6 0.6 708.1 708.1
2012 December 669.7 669.7 3.1 666.5 61.1 32.4 27.4 33.7 0.1 33.6 13.9 0.5 0.5 745.1 745.1
2013 March 737.7 737.7 3.2 734.5 62.2 49.4 44.5 17.7 0.1 17.7 0.0 0.4 0.4 800.3 800.3
June 781.1 781.1 3.2 777.9 15.8 18.6 14.6 1.2 0.0 1.1 11.6 0.4 0.4 808.8 808.8
September 820.3 820.3 3.3 816.9 15.5 14.4 14.4 1.2 0.0 1.2 23.3 0.3 0.3 859.5 859.5
December 654.6 654.6 3.3 651.2 210.9 209.7 209.7 1.2 0.0 1.2 53.1 0.3 0.3 919.0 919.0
2014 March 664.4 664.4 3.4 660.9 226.7 225.6 225.6 1.1 0.0 1.1 62.8 0.4 0.4 954.3 954.3
June 756.0 756.0 3.5 752.4 182.4 181.2 181.2 1.1 0.1 1.1 63.8 0.4 0.4 1,002.6 1,002.6
September 971.2 971.2 3.7 967.4 11.0 10.0 10.0 1.0 0.0 1.0 62.0 0.4 0.4 1,044.6 1,044.6
December 1,028.3 1,028.3 3.8 1,024.4 10.7 9.9 9.9 0.8 0.1 0.7 54.7 0.4 0.4 1,094.1 1,094.1
2015 March 1,082.8 1,082.8 4.0 1,078.7 17.3 16.7 16.7 0.6 0.0 0.6 74.6 0.3 0.3 1,175.0 1,175.0
June 1,059.9 1,059.9 4.1 1,055.8 44.2 43.8 43.8 0.5 … 0.5 79.7 0.4 0.4 1,184.3 1,184.3
September 1,049.3 1,049.3 3.7 1,045.6 41.9 41.5 41.5 0.4 … 0.4 72.2 0.4 0.4 1,163.7 1,163.7
December 1,089.9 1,089.9 3.5 1,086.3 57.3 50.9 50.9 6.4 6.1 0.3 89.6 0.4 0.4 1,237.3 1,237.3

38 |
Monthly Statistics Bulletin December 2015
Table 9.1. Financial auxiliaries survey - net foreign assets and internal claims
(In millions of euro: End of period)
Description
Net foreign assets Claims and depository corporations
CBK Other depository corporations
Cash Deposits Securities other than
shares
Other Transferable deposits
Other deposits
Transfer-able
deposits
Other deposits
2005 … … … … … 2.8 … … … 2.8 0.0 2.8
2006 … … … … … 4.5 4.0 4.0 … 0.5 0.2 0.3
2007 3.2 … … 3.2 … 0.1 … … … 0.1 0.0 0.1
September 2.1 … … 2.1 … 1.1 … … … 1.1 0.1 1.0
2008 2.1 … 0.1 1.9 … 1.1 … … … 1.1 0.1 1.1
March 1.9 … … 1.9 … 3.4 … … … 3.4 2.1 1.2
June 1.9 … … 1.9 … 3.8 … … … 3.8 1.9 1.9
September 2.0 … … 2.0 … 3.6 … … … 3.6 1.9 1.7
2009 2.0 … … 2.0 … 3.5 … … … 3.5 1.6 1.9
2010 March 1.9 … … 1.9 … 3.5 … … … 3.5 1.5 2.0
June 1.9 … … 1.9 … 3.4 … … … 3.4 1.4 2.0
September 2.0 … … 2.0 … 3.3 … … … 3.3 1.3 2.0
December 2.0 … … 2.0 … 3.2 … … … 3.2 1.2 2.0
2011 March 2.0 … … 2.0 … 3.1 … … … 3.1 1.1 2.0
June 2.0 … … 2.0 … 3.0 … … … 3.0 1.1 1.9
September 0.2 … … 0.2 … 1.1 … … … 1.1 1.0 0.1
December 0.2 … … 0.2 … 1.0 … … … 1.0 0.8 0.2
2012 March 0.2 … … 0.2 … 0.9 … … … 0.9 0.7 0.2
June 0.2 … … 0.1 … 0.9 … … … 0.8 0.7 0.2
September 0.2 … … 0.2 … 0.7 … … … 0.7 0.6 0.2
2012 December 0.2 … … 0.2 … 0.6 … … … 0.6 0.5 0.2
2013 March 0.2 … … 0.2 … 0.6 … … … 0.6 0.5 0.1
June 0.2 … … 0.2 … 0.5 … … … 0.5 0.4 0.2
September 0.2 … … 0.2 … 0.5 … … … 0.5 0.4 0.2
December 0.2 … … 0.2 … 0.5 … … … 0.5 0.3 0.2
2014 March 0.2 … … 0.2 … 0.6 … … … 0.6 0.4 0.2
June 0.2 … … 0.1 … 0.6 … … … 0.6 0.4 0.2
September 0.2 … … 0.2 … 0.6 … … … 0.6 0.4 0.1
December 0.2 … … 0.2 … 0.5 … … … 0.5 0.4 0.1
2015 March 0.2 … … 0.2 … 0.5 … … … 0.5 0.4 0.1
June 0.4 … … 0.4 … 0.4 … … … 0.4 0.4 …
September 0.4 … … 0.4 … 0.4 … … … 0.4 0.4 …
December 0.4 … … 0.4 … 0.4 … … … 0.4 0.4 …

| 39
Buletini Mujor Statistikor
December 2015 Monthly Statistics Bulletin
Table 9.2. Financial auxiliaries survey - liabilities
(In millions of euro: End of period)
Description
Shares and other equity
Other items (net)
Funds contributed by
owners
Retained earnings
General and special
reserves Valuation
adjustment
Other liablities
Minus: Other assets
Plus: Consolidated adjustment
2005 2.8 2.8 … … … … … … …
2006 4.5 4.5 … … … … … … …
2007 4.1 4.5 -0.4 … … -0.7 0.0 0.8 …
June 3.9 4.4 -0.5 … … -0.7 0.0 0.7 …
September 4.0 4.7 -0.6 … … -0.7 0.0 0.7 …
2008 3.8 4.7 -0.9 … … -0.6 0.1 0.7 …
March 4.0 4.9 -0.9 … … 1.4 2.1 0.7 …
June 4.0 4.9 -0.9 … … 1.8 1.9 0.1 …
September 3.9 4.7 -0.8 … … 1.7 1.8 0.1 …
2009 4.0 4.8 -0.8 … … 1.5 1.6 0.1 …
2010 March 4.0 4.7 -0.7 … … 1.4 1.5 0.1 …
June 4.0 4.7 -0.6 … … 1.4 1.4 0.1 …
September 4.0 4.7 -0.6 … … 1.2 1.3 0.1 …
December 4.1 4.7 -0.6 … … 1.1 1.2 0.1 …
2011 March 4.1 4.1 … … … 1.1 1.1 … …
June 4.1 4.1 … … … 1.0 1.0 … …
September 0.4 0.4 … … … 0.9 0.9 … …
December 0.4 0.4 … … … 0.8 0.8 … …
2012 March 0.4 0.4 … … … 0.7 0.8 … …
June 0.4 0.4 … … … 0.7 0.7 … …
September 0.4 0.4 … … … 0.6 0.6 … …
December 0.4 0.4 … … … 0.4 0.5 … …
2013 March 0.4 0.4 … … … 0.4 0.4 … …
June 0.4 0.4 … … … 0.3 0.4 … …
September 0.4 0.4 … … … 0.3 0.4 … …
December 0.4 0.4 … … … 0.3 0.3 … …
2014 March 0.4 0.4 … … … 0.4 0.4 … …
June 0.4 0.4 … … … 0.4 0.4 … …
September 0.4 0.4 … … … 0.4 0.4 … …
December 0.4 0.4 … … … 0.4 0.4 … …
2015 March 0.4 0.4 … … … 0.3 0.4 … …
June 0.4 0.4 … … … 0.4 0.4 … …
September 0.4 0.4 … … … 0.4 0.4 … …
December 0.4 0.4 … … … 0.4 0.4 … …

40 |
Monthly Statistics Bulletin December 2015
Table 10.1. CBK balance sheet - assets
(In millions of euro: End of period)
Description
Total Assets
Monetary gold and
SDRs
Currency and deposits Securities other than
shares
IMF quota
Other accounts receivable
Non financi-al assets
Currency (Cash)
Deposits
In euro currency
In non euro
currency
Transferable deposits
Other deposits
2001 297.1 __ 296.2 150.8 __ 150.8 145.4 99.4 46.0 __ __ 0.2 0.7
2002 346.7 __ 345.8 17.5 17.3 0.2 328.3 66.2 262.1 __ __ 0.3 0.6
2003 456.5 __ 454.0 26.6 26.3 0.3 427.4 23.8 403.6 __ __ 1.6 0.9
2004 350.7 __ 225.3 12.1 12.1 … 213.2 8.9 204.3 124.4 __ 0.3 0.7
2005 398.8 __ 237.9 24.5 24.5 … 213.4 23.0 190.5 159.5 __ 0.9 0.5
2006 643.1 __ 436.1 11.1 11.1 … 424.9 22.4 402.6 203.6 __ 2.0 1.4
2007 1,060.1 __ 822.8 63.8 63.8 … 759.0 1.9 757.1 229.3 __ 5.8 2.2
2008 1,113.2 __ 568.7 39.7 39.7 … 529.0 10.4 518.6 541.3 __ 1.0 2.2
2009 1,201.0 60.3 544.1 21.8 21.8 … 522.3 34.9 487.4 529.7 64.3 0.4 2.3
2010 1,250.0 64.0 914.6 60.2 60.2 … 854.4 25.6 828.8 199.2 68.5 1.1 2.6
2011 1,238.2 65.1 1,072.8 13.5 13.5 … 1,059.3 31.5 1,027.8 25.0 70.1 2.2 3.1
2012 1,472.6 63.3 1,050.9 16.8 16.8 … 1,034.1 99.5 934.6 286.0 68.8 0.8 2.9
2013 September 1,551.8 60.7 765.6 34.8 34.8 … 730.8 15.3 715.5 654.9 66.8 0.9 3.0
October 1,702.5 60.4 1,049.8 41.7 41.7 … 1,008.2 109.0 899.2 521.9 66.5 0.6 3.2
November 1,657.6 60.2 1,105.6 29.5 29.5 … 1,076.0 18.9 1,057.1 421.0 66.6 1.1 3.2
December 1,614.4 59.6 923.6 27.4 27.4 … 896.2 61.1 835.1 560.8 65.9 1.3 3.2
2014 January 1,677.6 60.3 885.3 42.9 42.9 … 842.4 48.5 793.9 660.8 66.7 1.2 3.2
February 1,647.0 59.5 887.1 26.5 26.5 … 860.6 4.8 855.7 630.9 66.1 0.3 3.2
March 1,618.5 59.5 857.5 28.8 28.8 … 828.7 2.5 826.2 630.9 66.2 1.1 3.2
April 1,608.2 59.5 832.1 32.7 32.7 … 799.4 5.7 793.7 645.9 66.2 1.2 3.3
May 1,588.7 59.8 827.3 20.2 20.2 … 807.1 24.4 782.7 630.9 66.8 0.7 3.3
June 1,554.1 59.9 861.6 33.0 33.0 … 828.6 126.6 702.0 560.9 66.9 1.5 3.3
July 1,442.5 60.4 909.0 18.4 18.4 … 890.6 143.6 747.0 400.9 67.5 1.3 3.3
August 1,505.4 60.6 1,037.1 36.7 36.7 … 1,000.3 176.0 824.3 336.0 68.0 0.5 3.3
September 1,433.9 61.6 972.9 30.9 30.9 … 942.0 136.0 806.0 326.0 69.1 1.1 3.3
October 1,466.3 61.5 1,001.5 34.8 34.8 … 966.7 175.7 791.0 330.0 69.0 1.1 3.3
November 1,478.0 61.4 963.8 18.4 18.4 … 945.4 157.2 788.2 380.0 69.3 0.3 3.2
December 1,372.5 62.5 1,114.4 29.2 29.2 … 1,085.2 323.4 761.8 120.5 70.4 1.5 3.2
2015 January 1,403.3 65.3 1,139.2 41.3 41.3 … 1,097.8 326.0 771.8 120.6 73.6 1.5 3.3
February 1,391.8 65.1 1,128.6 33.0 33.0 … 1,095.6 331.7 763.9 120.6 73.7 0.6 3.3
March 1,395.9 66.5 1,128.9 26.3 26.3 … 1,102.5 285.7 816.9 120.5 75.3 1.4 3.4
April 1,403.4 66.2 1,157.0 34.6 34.6 … 1,122.4 258.6 863.8 100.5 74.9 1.1 3.7
May 1,376.6 66.2 1,090.6 25.9 25.9 … 1,064.7 258.6 806.1 140.5 75.2 0.3 3.7
June 1,398.5 65.4 1,083.7 28.8 28.8 ... 1,054.9 257.8 797.1 170.4 74.4 1.2 3.6
July 1,477.9 65.5 1,162.3 47.9 47.9 … 1,114.4 237.1 877.2 170.4 74.8 1.2 3.6
August 1,506.6 64.0 1,194.9 32.2 32.2 … 1,162.7 308.0 854.7 170.4 73.4 0.4 3.6
September 1521.3 64.5 1,223.8 30.0 30.0 … 1,193.8 241.2 952.6 154.1 74.0 1.5 3.5
October 1,525.6 64.9 1,265.6 24.9 24.9 … 1,240.7 274.9 965.8 116.3 74.4 1.0 3.5
November 1,500.1 66.1 1,237.1 35.4 35.4 … 1,201.8 249.4 952.4 116.4 76.2 0.6 3.6
December 1,462.2 65.1 1,189.3 15.3 15.3 … 1,174.0 241.2 932.8 127.1 75.1 1.7 3.9

| 41
Buletini Mujor Statistikor
December 2015 Monthly Statistics Bulletin
Tabela 10.2. CBK balance sheet - liabilities
(In millions of euro: End of period)
Description
Total liabilities
Transferable deposits of which:
Other deposits
SDR allocations
IMF account
no.1
Other accounts payable
Shares and other equities
of which:
In euro currency
of which: Funds contributed by owners
Profit/loss of the year
Other depository
corporations
Other financial corporations
Central government
2001 297.1 268.1 267.9 173.9 10.6 70.2 __ __ __ 24.2 4.7 2.6 1.1
2002 346.7 334.2 334.0 46.2 24.6 258.4 __ __ __ 1.9 10.6 2.6 3.6
2003 456.5 432.5 432.2 59.6 19.2 346.1 6.5 __ __ 1.4 16.1 2.6 4.5
2004 350.7 327.5 327.5 72.9 20.7 216.8 5.1 __ __ 0.1 18.0 10.0 3.0
2005 398.8 373.8 373.8 82.5 23.3 225.7 4.1 __ __ 0.5 20.4 10.0 3.0
2006 643.1 609.4 609.4 94.5 31.0 472.9 8.0 __ __ 0.2 25.5 10.0 6.4
2007 1,060.1 1,009.7 1,009.7 113.6 22.4 849.4 10.6 __ __ 6.1 33.8 20.0 9.2
2008 1,113.2 1,064.4 1,064.4 137.2 49.9 870.5 7.2 __ __ 0.2 41.4 30.0 7.5
2009 1,201.0 921.3 921.3 233.2 129.7 556.5 125.0 60.3 49.1 0.3 44.9 30.0 3.7
2010 1,250.0 466.9 466.9 203.6 43.9 216.0 597.1 64.2 73.0 0.9 47.9 30.0 3.0
2011 1,238.2 621.6 621.6 209.7 36.8 371.7 425.5 65.7 69.4 1.7 54.3 30.0 5.8
2012 1,472.6 1,039.9 1,039.9 302.1 49.8 685.9 152.0 64.6 165.3 0.5 50.4 30.0 0.3
2013 October 1,702.5 1,347.2 1,347.2 340.3 169.8 835.2 80.0 62.4 163.7 0.4 48.7 30.0 -1.5
November 1,657.6 1,284.3 1,284.3 357.3 165.9 759.2 100.0 62.5 161.0 0.3 49.4 30.0 -0.8
December 1,614.4 1,212.7 1,212.7 333.2 236.6 640.3 133.0 61.9 155.8 0.5 50.5 30.0 0.2
2014 January 1,677.6 1,231.7 1,231.7 323.0 230.3 648.3 176.0 62.6 155.8 0.4 51.0 30.0 0.5
February 1,647.0 1,238.2 1,238.2 293.4 244.0 667.6 143.0 62.0 153.2 0.2 50.4 30.0 -0.1
March 1,618.5 1,147.8 1,147.8 255.7 253.8 606.2 203.8 62.1 153.6 0.1 51.0 30.0 0.6
April 1,608.2 1,096.2 1,096.2 245.1 263.8 559.1 245.0 62.1 153.6 0.4 50.8 30.0 0.4
May 1,588.7 1,061.7 1,061.7 228.7 286.8 524.2 262.0 62.7 150.8 0.3 51.2 30.0 0.8
June 1,554.1 1,091.8 1,091.8 242.9 209.8 615.0 195.0 62.8 152.6 0.5 51.4 30.0 1.0
July 1,442.5 1,004.5 1,004.5 250.7 113.3 617.8 170.0 63.3 152.6 0.4 51.6 30.0 1.2
August 1,505.4 1,049.6 1,049.6 299.8 112.9 614.3 190.0 63.8 149.9 0.3 51.8 30.0 1.4
September 1,433.9 1,014.2 1,014.2 291.2 39.0 662.1 150.0 64.8 152.5 0.2 52.2 30.0 1.8
October 1,466.3 1,081.8 1,081.8 300.5 65.2 707.7 115.0 64.7 152.5 0.4 51.8 30.0 1.4
November 1,477.9 1,136.2 1,136.2 338.3 69.8 714.6 75.0 65.0 149.7 0.2 51.8 30.0 1.4
December 1,372.4 1,034.7 1,034.7 315.9 39.7 665.5 65.0 66.1 155.2 0.4 50.8 30.0 0.6
2015 January 1,403.3 1,070.7 1,070.7 301.1 43.2 712.7 55.0 69.0 155.2 0.3 53.0 30.0 2.0
February 1,391.8 1,087.3 1,087.3 318.9 44.2 711.4 30.0 69.2 152.3 0.3 52.6 30.0 1.9
March 1,395.9 1,113.3 1,113.3 294.1 52.0 754.1 __ 70.6 160.0 0.3 51.6 30.0 0.7
April 1,403.4 1,121.2 1,121.2 275.3 74.6 768.4 __ 70.3 160.0 0.5 51.1 30.0 0.2
May 1,376.6 1,097.4 1,097.4 295.7 35.3 763.8 __ 70.6 157.3 0.3 51.0 30.0 0.1
June 1,398.8 1,119.0 1,119.0 283.2 75.0 758.2 __ 69.8 159.0 0.5 50.2 30.0 -0.7
July 1,477.9 1,162.7 1,162.7 283.2 57.1 814.7 __ 70.2 193.9 0.4 50.3 30.0 -0.6
August 1,506.6 1,196.7 1,196.7 289.0 73.4 831.6 __ 68.8 191.6 0.4 48.8 30.0 -2.0
September 1,521.3 1,211.8 1,211.8 294.9 72.9 841.4 __ 69.4 188.5 0.5 50.7 30.0 -0.2
October 1,525.6 1,222.3 1,222.3 308.8 74.9 835.7 ---- 69.9 181.7 0.4 50.8 30.0 -0.1
November 1,500.1 1,192.6 1,192.6 284.7 83.6 816.7 __ 71.5 184.1 0.3 51.2 30.0 0.3
December 1,462.2 1,153.9 1,153.9 316.4 82.3 754.0 __ 70.5 184.8 0.6 51.6 30.0 0.7

42 |
Monthly Statistics Bulletin December 2015
Table 11.1. ODC balance sheet - assets (In millions of euro: End of period)
Description
Total assets
Cash and balances with CBK
Balances with commercial banks
Securities Gross loans and lease financing
of which in euro: Gross loans in non euro
currency
Fixed assets
Other assets
In euro currency
In non euro currencies
Other financial
corporations
Public non financial
corporations
Other non financial
corporations
House holds
2001 519.8 265.1 212.8 212.8 . 7.5 25.9 __ __ 25.9 __ __ 4.5 3.9
2002 473.7 81.3 292.7 292.7 . … 86.5 __ __ 80.8 5.7 __ 9.5 3.7
2003 589.2 106.2 106.2 106.2 . 119.6 232.8 __ 0.2 193.5 39.0 __ 12.3 12.2
2004 816.5 116.5 186.0 169.2 16.8 112.3 373.7 __ … 289.9 83.7 __ 15.9 12.2
2005 984.4 131.7 221.9 201.0 21.0 82.9 513.9 __ … 387.9 126.0 __ 16.9 17.0
2006 1,161.2 141.1 243.3 218.8 24.5 99.4 636.6 __ … 490.5 146.1 __ 23.0 17.9
2007 1,435.0 189.0 208.1 173.4 34.7 78.9 892.1 __ 0.2 691.3 200.6 __ 27.2 39.7
2008 1,808.2 218.2 283.9 236.3 47.6 40.5 1,183.4 0.6 0.1 901.7 281.0 __ 39.0 43.1
2009 2,204.1 322.7 405.6 326.7 78.8 97.0 1,289.0 2.3 0.3 942.9 343.5 __ 43.1 46.7
2010 2,455.1 307.0 439.1 367.3 71.8 173.4 1,458.7 9.9 6.3 1,004.1 434.2 2.5 44.0 32.9
2011 2,649.7 331.5 329.5 251.8 77.7 202.0 1,698.1 17.3 1.5 1,127.0 510.9 7.3 47.4 41.3
2012 2,829.3 425.7 287.9 228.0 59.9 256.6 1,763.4 19.8 1.4 1,169.8 542.6 6.9 57.7 38.1
2013 October 2,952.0 452.8 333.6 230.0 103.6 271.7 1,798.8 18.6 0.3 1,186.9 566.5 6.4 55.5 39.5
November 2,976.7 468.4 332.0 239.4 92.6 278.1 1,803.2 18.9 0.3 1,193.4 563.9 6.3 55.2 39.8
December 3,059.3 463.3 339.9 258.8 81.0 354.5 1,805.8 20.4 0.2 1,194.5 563.9 6.1 55.5 40.3
2014 January 3,048.5 431.7 383.6 298.3 85.3 355.1 1,794.5 19.1 0.2 1,189.5 559.8 6.0 55.2 28.4
February 3,045.0 396.4 397.2 299.1 98.1 373.2 1,794.3 19.1 0.2 1,190.0 559.3 5.9 54.6 29.4
March 3,053.1 367.6 384.8 295.3 89.5 392.7 1,825.9 20.0 0.2 1,214.9 564.8 5.7 54.2 28.0
April 3,038.3 357.4 355.5 267.7 87.7 397.4 1,839.7 18.8 0.2 1,224.4 571.2 5.8 55.8 32.4
May 3,041.0 338.6 360.8 277.7 83.1 397.4 1,856.8 19.1 0.2 1,229.1 583.4 5.9 55.3 32.2
June 3,059.5 358.2 318.7 232.7 86.0 405.3 1,889.9 20.2 0.2 1,250.9 593.2 5.9 55.2 32.2
July 3,116.4 391.1 377.2 301.9 75.2 380.9 1,874.3 19.0 0.2 1,241.0 601.5 6.2 55.0 37.8
August 3,160.4 422.9 380.9 304.8 76.0 418.9 1,848.2 19.2 0.2 1,212.2 604.0 6.2 54.5 35.0
September 3,149.5 413.0 385.5 313.1 72.5 410.0 1,855.0 7.8 0.2 1,225.2 609.5 6.4 53.4 32.6
October 3,150.3 414.0 417.6 350.9 66.6 380.6 1,854.0 7.5 0.2 1,236.4 603.1 6.2 53.8 30.3
November 3,156.4 444.0 379.9 325.1 54.7 379.5 1,860.8 7.6 0.2 1,236.1 610.2 6.1 53.4 38.9
December 3,186.6 447.1 390.8 328.0 62.8 383.8 1,882.3 7.1 0.6 1,232.7 635.3 6.0 53.7 28.8
2015 January 3,212.9 423.6 444.0 381.7 62.3 396.4 1,863.1 7.2 0.2 1,230.5 618.5 6.1 54.3 31.5
February 3,223.9 433.4 448.9 390.3 58.6 372.0 1,874.9 8.1 0.3 1,242.3 617.4 6.1 54.0 40.7
March 3,250.3 422.3 444.7 366.6 78.1 400.7 1,903.5 9.2 0.7 1,261.4 625.6 6.2 53.5 25.6
April 3,256.8 391.7 423.8 363.7 60.2 422.3 1,936.4 8.8 0.2 1,284.9 635.6 6.1 52.8 29.7
May 3,262.2 397.1 395.5 336.4 59.1 429.4 1,957.4 9.1 0.3 1,294.4 646.7 6.4 52.7 30.1
June 3,269.6 397.4 341.9 286.0 56.0 443.8 2,005.2 9.0 0.6 1,328.0 660.8 6.3 52.7 28.6
July 3,296.1 418.6 348.1 287.6 60.6 443.8 2,001.1 8.8 0.2 1,317.8 667.5 6.4 51.9 32.6
August 3,349.2 148.7 384.9 323.3 61.7 472.4 1,985.1 8.9 0.1 1,298.7 670.4 6.3 53.0 38.0
September 3,321.4 431.4 334.2 271.1 63.1 473.4 1,993.3 8.2 0.6 1,313.4 664.4 6.2 53.5 35.6
October 3,331.7 460.9 354.3 289.9 64.5 423.4 2,006.5 7.8 0.1 1,309.6 682.1 6.3 55.3 31.3
November 3,339.1 434.0 367.5 307.4 60.1 437.2 2,015.3 8.1 0.1 1,326.8 673.5 6.3 55.3 29.8
December 3,387.3 491.2 316.0 254.7 61.3 473.5 2,019.4 8.7 0.6 1,321.6 682.0 5.9 57.3 29.8

| 43
Buletini Mujor Statistikor
December 2015 Monthly Statistics Bulletin
Table 11.2. ODC balance sheet - liabilities
(In millions of euro: End of period)
Description
Total liabilities
Balances from other banks
Deposits Other borrowings (incl. non neg. CD)
Write -downs,
provisions
Other liabilities
Subordinated debt
Own resources
of which:
Transferable deposits
Other deposits:
Saving deposits
Share capital
2001 519.8 . 492.3 365.4 126.8 _ 5.0 … 2.0 … 20.4 18.4
2002 473.7 . 427.2 295.9 131.3 _ 5.4 … 6.6 1.3 33.2 30.8
2003 589.2 1.8 514.0 290.5 223.5 _ 8.9 … 17.5 2.0 45.0 44.1
2004 816.5 14.3 694.5 281.0 413.5 _ 1.4 … 27.9 9.3 69.1 57.7
2005 984.4 23.0 836.7 296.6 540.1 _ 6.4 … 37.3 7.0 74.0 62.4
2006 1,161.2 30.3 924.3 308.9 615.4 _ 4.2 … 92.1 7.0 103.3 78.4
2007 1,435.0 25.8 1,143.1 380.7 762.4 _ 2.7 … 103.7 7.0 152.7 114.9
2008 1,808.2 34.9 1,444.1 429.8 1,014.2 _ … … 129.8 7.0 192.5 145.9
2009 2,204.1 58.5 1,744.9 517.8 1,229.5 _ … … 171.7 24.4 204.6 159.4
2010 2,455.1 70.7 1,936.8 671.0 923.2 342.7 23.4 0.1 160.0 33.5 230.5 170.4
2011 2,649.7 40.0 2,104.0 699.0 1,056.8 348.2 30.4 0.2 191.3 31.0 252.8 176.6
2012 2,829.3 6.0 2,279.1 751.9 1,172.1 355.0 18.9 1.7 221.4 31.0 270.8 200.1
2013 October 2,952.0 11.5 2,354.6 828.4 1,140.7 385.4 10.7 1.9 240.0 56.3 276.8 220.2
November 2,976.7 15.1 2,359.2 833.1 1,135.5 390.5 10.6 2.0 258.8 56.3 274.7 220.2
December 3,059.3 16.5 2,449.0 900.8 1,143.9 404.2 13.4 2.0 244.1 56.3 277.8 221.2
2014 January 3,048.5 21.3 2,443.4 887.4 1,134.4 421.7 13.2 1.6 231.5 56.4 281.0 221.2
February 3,045.0 21.3 2,433.4 890.7 1,113.8 428.8 13.9 1.5 235.1 56.3 283.4 221.2
March 3,053.1 21.6 2,430.8 910.4 1,085.4 435.0 13.4 1.5 241.7 56.3 287.8 221.2
April 3,038.3 23.1 2,425.9 920.0 1,062.9 443.0 13.5 1.2 241.7 57.3 275.5 226.2
May 3,041.0 25.7 2,415.1 926.7 1,035.1 453.2 14.4 1.2 244.8 57.3 282.5 226.2
June 3,059.5 29.9 2,421.0 957.8 1,006.6 456.6 17.9 1.2 242.2 57.3 289.9 226.2
July 3,116.4 26.9 2,474.9 1,029.1 975.9 469.9 17.0 1.1 239.4 57.3 299.6 231.2
August 3,160.4 25.3 2,513.6 1,096.6 922.8 494.2 16.7 1.1 237.6 57.3 308.8 231.2
September 3,149.5 22.2 2,518.0 1,100.3 908.8 508.8 16.9 1.5 233.6 47.3 310.0 231.2
October 3,150.3 22.5 2,514.0 1,112.3 880.1 521.6 17.0 1.6 235.2 47.3 312.7 231.2
November 3,156.4 27.2 2,502.7 1,129.9 844.4 528.4 16.4 2.1 243.6 47.3 317.0 231.3
December 3,186.6 31.8 2,537.5 1,198.3 803.9 535.3 14.1 2.9 229.9 47.3 323.1 231.3
2015 January 3,212.9 33.8 2,561.3 1,222.9 773.2 551.1 14.1 2.8 237.0 47.3 330.7 233.1
February 3,223.9 30.4 2,554.0 1,230.3 766.3 557.4 14.6 2.9 236.7 47.3 337.9 233.1
March 3,250.3 29.4 2,574.5 1,266.2 748.5 559.8 14.6 2.8 236.7 47.3 344.9 233.1
April 3,256.7 34.1 2,575.7 1,268.9 745.7 561.1 14.8 2.6 229.3 47.3 352.8 263.9
May 3,262.2 33.9 2,573.6 1,277.8 736.5 559.3 14.4 2.8 229.2 47.3 360.9 263.9
June 3,269.6 55.6 2,574.6 1,291.1 730.8 552.7 13.1 2.8 226.5 47.3 349.7 263.9
July 3,296.1 38.2 2,615.0 1,361.1 704.2 549.7 13.3 2.6 222.1 47.3 357.5 263.9
August 3,349.2 42.5 2,656.9 1,417.4 689.0 549.8 13.1 4.3 220.3 47.4 364.5 263.9
September 3,321.4 46.8 2,656.5 1,437.4 668.3 550.8 13.3 2.8 208.1 35.8 358.2 263.9
October 3,331.7 58.2 2,635.3 1,416.8 669.7 548.8 15.4 3.0 209.3 35.8 374.6 273.9
November 3,339.1 61.3 2,628.3 1,408.9 667.3 551.9 20.0 2.9 209.2 35.8 381.6 273.9
December 3,387.3 43.4 2,701.4 1,477.9 667.6 555.9 17.6 3.1 191.2 36.8 393.8 273.9

44 |
Monthly Statistics Bulletin December 2015
Table 12.1. ODC deposits - euro deposits
(In millions of euro: End of period)
Description
Total deposits in euro
Government Finanncial corporations Non financial corporations Other domestic sectors Nonresidents
Other depository
corporations
Other financial
intermedi-aries
Insurance company-
es
Pension funds
Financial auxilliaries
Public nonfinancial
corporati-ons
Other nonfinancial corporations
Households NPISH
2001 492.3 __ __ __ __ __ . __ 165.2 __ 165.2 313.1 313.1 __ 13.9
2002 427.2 __ __ __ __ __ . __ 183.6 __ 183.6 226.1 226.1 __ 17.5
2003 515.8 __ 1.8 1.8 __ __ . __ 226.1 __ 226.1 267.9 267.9 __ 20.0
2004 674.9 1.3 25.6 3.7 3.5 15.5 . 2.9 275.3 173.5 101.8 360.3 350.7 9.6 12.3
2005 815.3 2.9 35.4 8.1 5.8 18.8 . 2.8 319.0 211.3 107.7 440.7 428.7 12.0 17.3
2006 890.4 7.0 28.1 0.1 2.4 24.7 0.4 0.5 337.8 217.4 120.5 499.2 486.1 13.1 18.2
2007 1,092.0 4.1 39.1 3.1 5.6 28.3 0.4 1.7 386.2 215.5 170.7 647.0 631.9 15.2 15.6
2008 1,366.9 1.4 62.9 5.0 6.5 31.5 19.4 0.4 479.7 263.8 215.9 785.0 774.5 10.5 37.9
2009 1,640.1 165.0 78.2 6.1 5.9 43.1 22.6 0.4 371.5 121.6 249.9 962.2 948.8 13.4 63.2
2010 1,831.1 11.7 105.0 7.3 7.9 47.6 41.6 0.6 414.9 122.3 292.6 1,220.1 1,206.1 14.0 79.4
2011 1,982.4 2.7 117.5 9.9 6.8 57.2 43.1 0.5 406.6 128.5 278.1 1,395.6 1,373.4 22.2 60.0
2012 2,162.8 0.7 120.0 3.8 6.2 64.3 45.3 0.4 401.7 75.6 326.1 1,558.6 1,535.4 23.2 81.7
2013 October 2,225.4 1.4 85.3 3.1 8.4 67.6 5.8 0.4 425.4 89.9 335.5 1,628.6 1,600.4 28.3 84.7
November 2,235.7 2.0 90.1 3.6 8.6 69.1 8.5 0.4 411.2 84.6 326.6 1,648.9 1,623.5 25.4 83.5
December 2,314.1 1.8 88.2 2.5 7.4 72.3 5.7 0.3 455.6 72.1 383.5 1,685.1 1,658.7 26.4 83.4
2014 January 2,312.9 1.7 96.1 6.3 13.7 70.3 5.4 0.5 397.5 59.9 337.5 1,710.8 1,681.4 29.4 106.8
February 2,303.9 1.8 107.0 5.8 12.9 71.7 16.1 0.4 381.6 58.4 323.2 1,711.5 1,682.5 28.9 102.1
March 2,298.3 1.9 110.7 6.4 11.9 75.1 16.8 0.4 376.9 52.0 324.9 1,712.5 1,675.9 36.7 96.3
April 2,288.9 1.8 111.4 5.1 12.0 76.3 17.6 0.4 379.6 68.7 311.0 1,705.0 1,674.6 30.3 91.1
May 2,280.8 2.0 112.9 4.9 12.1 77.1 18.5 0.3 383.9 68.2 315.7 1,695.2 1,667.0 28.2 86.7
June 2,285.9 1.9 112.9 3.6 12.3 77.3 19.3 0.3 382.8 69.2 313.6 1,703.7 1,676.2 27.5 84.7
July 2,339.8 1.9 114.0 7.0 11.0 76.1 19.7 0.3 407.4 70.0 337.5 1,719.8 1,691.4 28.4 96.8
August 2,381.2 2.0 117.7 5.6 12.4 78.2 21.1 0.4 428.8 67.1 361.7 1,741.6 1,710.7 30.9 91.2
September 2,389.5 4.6 117.2 3.9 11.7 79.5 21.8 0.3 433.2 66.4 366.8 1,748.9 1,718.9 29.9 85.7
October 2,394.6 7.2 118.5 4.0 13.3 79.0 21.8 0.5 423.9 68.0 356.0 1,758.5 1,726.9 31.6 86.5
November 2,390.9 8.5 114.3 2.3 5.4 83.9 22.1 0.5 420.9 64.9 356.0 1,761.3 1,730.6 30.7 85.9
December 2,426.3 8.8 104.6 2.8 5.1 79.3 17.1 0.3 449.7 61.8 387.9 1,781.1 1,750.6 30.6 82.1
2015 January 2,440.6 9.1 99.4 3.0 5.0 72.9 16.7 1.8 423.2 57.1 366.1 1,822.0 1,792.2 29.8 87.0
February 2,449.7 9.2 98.2 4.4 4.5 70.9 16.0 2.3 421.6 56.8 364.8 1,836.7 1,807.7 29.0 83.9
March 2,462.5 10.1 97.1 5.3 2.9 71.5 15.7 1.7 418.0 57.4 360.6 1,839.9 1,811.2 28.7 97.4
April 2,468.2 10.0 94.9 4.6 3.8 70.8 14.0 1.7 432.8 54.5 378.3 1,837.4 1,810.3 27.1 93.2
May 2,465.0 10.2 89.5 3.0 4.3 66.9 13.6 1.7 438.8 51.3 387.5 1,836.6 1,809.2 27.4 90.0
June 2,460.3 10.5 87.7 3.9 3.4 65.3 13.5 1.7 443.0 47.6 395.3 1,834.3 1,807.8 25.6 84.9
July 2,495.7 10.4 84.6 1.8 4.1 64.4 12.6 1.8 449.4 43.8 405.6 1,849.8 1,819.3 29.9 101.5
August 2,540.9 10.9 85.7 5.6 3.6 62.1 12.3 2.1 486.4 43.4 443.1 1,862.3 1,830.1 32.2 95.7
September 2,536.8 11.2 85.3 5.2 3.8 62.2 12.2 1.9 481.0 45.9 435.2 1,865.3 1,830.8 34.5 94.0
October 2,516.6 10.3 83.1 5.1 5.3 59.7 11.4 1.6 472.0 46.5 425.5 1,861.3 1,824.7 36.5 89.9
November 2,511.2 9.3 85.0 4.5 6.8 58.1 14.2 1.5 466.4 36.2 430.2 1,862.3 1,828.3 34.0 88.1
December 2,580.0 5.9 73.3 3.3 5.1 59.0 4.9 1.1 499.9 31.5 468.5 1,895.5 1,862.3 33.2 105.3

| 45
Buletini Mujor Statistikor
December 2015 Monthly Statistics Bulletin
Table 12.2. Deposits at ODC - nonfinancial corporations, euro deposits
(In millions of euro: End of period)
Description
Non financial corporations
Public nonfinancial corporations Other nonfinancial corporations
Transfera-ble
deposits
Saving account
Other deposits
of which: Transfer-
able deposits
Saving account
Other deposits
of which:
Over 1 month and up to 3 months
Over 3 months and up to 6 months
Over2 years
Over 1 month and up to 3 months
Over 6 months and up to 1 year
Over 1 year and up to 2 years
Over2 years
2001 165.2 __ __ … __ 0.0 __ __ 165.2 133.9 … 31.3 0.0 __ __ __
2002 183.6 __ __ … __ 0.0 __ __ 183.6 159.7 … 23.9 0.0 __ __ __
2003 226.1 __ __ … __ 0.0 __ __ 226.1 139.0 … 87.1 0.0 __ __ __
2004 275.3 173.5 24.2 … 149.3 34.0 __ … 101.8 78.2 … 23.6 15.1 0.2 2.1 __
2005 319.0 211.3 29.9 … 181.3 36.6 __ … 107.7 74.4 … 33.4 14.6 5.1 0.7 __
2006 337.8 217.4 24.0 … 193.3 39.3 __ … 120.5 93.6 … 26.9 13.0 1.7 3.0 __
2007 386.2 215.5 27.1 … 188.4 126.9 __ … 170.7 128.4 … 42.3 28.4 3.7 2.0 __
2008 479.7 263.8 13.7 … 250.1 69.0 __ … 215.9 170.2 … 45.8 23.4 2.0 7.0 __
2009 371.5 121.6 47.6 … 73.9 11.4 52.3 … 249.9 178.0 … 71.9 42.3 … 5.3 10.9
2010 414.9 122.3 79.5 … 42.8 24.3 3.1 12.6 292.6 212.6 16.9 63.1 24.3 17.1 8.8 9.7
2011 406.6 128.5 67.8 0.0 60.8 29.8 17.2 11.6 278.1 201.1 14.0 62.9 17.5 18.5 7.3 8.0
2012 401.7 75.6 13.8 0.0 61.8 46.9 0.1 12.0 326.1 249.6 9.2 67.3 16.0 27.4 6.5 7.8
2013 October 425.4 89.9 13.5 0.6 75.7 54.2 5.0 12.0 335.5 271.2 15.2 49.1 5.6 27.8 6.4 7.2
November 411.2 84.6 18.8 0.2 65.7 44.3 5.0 12.0 326.6 250.7 15.8 60.1 7.7 37.4 6.3 6.9
December 455.6 72.1 16.4 0.1 55.7 35.3 5.0 12.0 383.5 286.4 17.0 80.1 9.9 54.7 7.1 5.9
2014 January 397.5 59.9 11.8 0.7 47.4 27.7 5.0 12.2 337.5 246.7 17.4 73.5 8.5 49.7 6.9 6.0
February 381.6 58.4 10.7 0.2 47.5 10.9 22.0 12.2 323.2 243.4 7.0 72.8 9.3 48.5 6.9 6.0
March 376.9 52.0 9.5 . 42.5 1.5 17.0 12.3 324.9 246.6 6.2 72.0 4.9 48.7 5.5 6.7
April 379.6 68.7 11.5 . 57.2 1.5 27.0 12.3 311.0 238.5 7.7 64.8 4.4 48.2 4.7 7.0
May 383.9 68.2 10.2 . 58.1 1.9 27.0 12.3 315.7 246.2 8.9 60.6 4.2 44.4 4.7 6.8
June 382.8 69.2 11.0 . 58.2 0.4 29.0 12.2 313.6 246.5 6.7 60.4 4.6 44.0 4.8 6.6
July 407.4 70.0 12.1 . 57.9 0.0 19.0 12.2 337.5 266.0 6.9 64.6 4.8 47.7 4.6 7.1
August 428.8 67.1 27.6 . 39.4 10.0 2.0 12.2 361.7 289.1 8.2 64.4 4.7 46.8 4.7 7.8
September 433.2 66.4 12.5 . 53.9 10.0 2.0 12.2 366.8 292.3 11.0 63.5 4.3 46.0 4.9 7.9
October 423.9 68.0 14.0 . 53.9 10.1 2.0 12.2 356.0 283.6 9.1 63.3 4.6 45.7 4.9 7.8
November 420.9 64.9 11.3 . 53.6 10.1 2.0 12.2 356.0 288.0 8.9 59.1 4.0 42.4 4.8 7.7
December 449.7 61.8 10.2 . 51.6 5.0 3.0 12.2 387.9 330.2 8.7 49.0 4.0 31.7 5.1 7.8
2015 January 423.2 57.1 10.4 . 46.7 0.0 3.0 12.2 366.1 308.8 7.9 49.4 4.1 32.1 5.1 7.8
February 421.6 56.8 10.0 . 46.7 0.1 3.0 12.2 364.8 301.2 8.1 55.5 9.3 33.0 4.9 7.9
March 418.0 57.4 19.6 . 37.8 0.2 3.0 12.2 360.6 294.4 7.5 58.6 11.0 34.3 4.0 8.8
April 432.8 54.5 17.7 . 36.8 0.2 3.0 12.2 378.3 307.5 8.0 62.8 11.2 34.4 3.8 13.0
May 438.8 51.3 14.5 . 36.8 0.2 3.0 12.2 387.5 315.2 8.0 64.2 12.7 33.1 4.1 13.3
June 443.0 47.6 10.9 . 36.7 0.1 … 12.2 395.3 323.3 7.6 64.5 14.3 31.7 5.4 13.1
July 449.4 43.8 9.7 . 34.2 … … 12.2 405.6 342.6 6.3 56.7 12.6 25.1 5.3 13.7
August 486.4 43.4 9.2 __ 34.1 … … 12.2 443.1 383.8 6.9 52.3 8.9 23.3 6.6 13.5
September 481.0 45.9 21.8 __ 24.1 … __ 12.2 435.2 375.7 7.9 51.6 9.2 21.6 6.9 13.9
October 472.0 46.5 19.4 __ 27.1 … __ 12.2 425.5 365.8 6.6 53.1 10.0 20.2 6.7 13.4
November 466.4 36.2 12.1 __ 24.1 __ … 12.2 430.2 367.9 7.8 54.6 3.4 21.4 6.6 13.3
December 499.9 31.5 10.8 __ 20.6 __ … 12.8 468.5 400.7 9.6 58.1 8.8 19.8 13.9 13.3

46 |
Monthly Statistics Bulletin December 2015
Table 12.3. Deposits at ODC - households and NPISH, euro deposits
(In millions of euro: End of period)
Description
Other domestic sectors
Households NPISH
Transferable deposits
Saving account
Other deposits
of which:
Transferable deposits
Saving account
Other deposits
Up to 1 month
Over 3 months and up to 6 months
Over 3months and up to1 year
Over 1 year and up to 2 years
Over 2 years
2001 313.1 313.1 219.2 … 93.9 __ __ 93.9 __ __ __ __ … __
2002 226.1 226.1 121.7 … 104.4 __ __ 104.4 __ __ __ __ … __
2003 267.9 267.9 134.4 … 133.5 __ __ 133.5 __ __ __ __ … __
2004 360.3 350.7 136.9 … 213.8 63.8 __ 91.8 14.2 1.9 9.6 8.9 … 0.7
2005 440.7 428.7 144.7 … 284.0 87.2 __ 109.3 26.5 19.3 12.0 10.4 … 1.6
2006 499.2 486.1 143.8 … 342.3 122.2 __ 127.9 26.5 37.1 13.1 7.6 … 5.5
2007 647.0 631.9 170.6 … 461.3 156.2 __ 141.6 74.6 50.3 15.2 11.9 … 3.3
2008 785.0 774.5 163.3 … 611.2 189.6 __ 234.6 64.8 61.6 10.5 7.7 … 2.8
2009 962.2 948.8 208.0 … 740.8 242.4 315.9 … 63.2 80.5 13.4 11.1 … 2.3
2010 1,220.1 1,206.1 270.4 274.5 661.2 30.0 76.1 347.8 61.1 108.3 14.0 13.0 0.5 0.5
2011 1,395.6 1,373.4 314.4 276.2 782.8 24.8 67.0 257.3 261.5 147.6 22.2 18.3 0.5 3.3
2012 1,558.6 1,535.4 361.5 283.2 890.8 25.2 58.4 337.8 260.5 177.6 23.2 19.7 0.0 3.4
2013 October 1,628.6 1,600.4 393.9 326.1 880.3 6.9 31.1 464.9 179.5 176.6 28.3 24.2 0.3 3.8
November 1,648.9 1,623.5 417.3 332.1 874.2 11.1 27.7 459.3 182.3 178.1 25.4 21.4 0.2 3.8
December 1,685.1 1,658.7 447.0 342.5 869.2 8.7 24.9 455.0 187.1 177.1 26.4 22.3 0.2 3.8
2014 January 1,710.8 1,681.4 455.8 357.9 867.7 6.3 24.0 451.4 192.7 176.0 29.4 25.3 0.1 4.0
February 1,711.5 1,682.5 466.6 365.3 850.6 6.4 23.3 440.0 191.5 173.8 28.9 25.1 0.1 3.8
March 1,712.5 1,675.9 474.6 372.3 829.0 4.7 19.2 434.1 185.1 166.9 36.7 32.8 0.1 3.8
April 1,705.0 1,674.6 496.9 377.9 799.9 3.8 11.6 429.1 185.9 164.2 30.3 26.7 0.1 3.5
May 1,695.2 1,667.0 505.7 384.0 777.2 3.6 11.0 413.0 180.3 164.9 28.2 24.0 0.1 4.1
June 1,703.7 1,676.2 534.5 389.6 752.0 3.3 10.3 395.0 175.5 164.9 27.5 23.3 0.2 4.0
July 1,719.8 1,691.4 568.6 401.1 721.7 2.8 9.2 365.3 174.7 166.5 28.4 25.8 0.2 2.5
August 1,741.6 1,710.7 598.6 421.6 690.5 4.1 8.6 333.7 172.4 168.5 30.9 28.3 0.1 2.5
September 1,748.9 1,718.9 615.6 436.2 667.1 3.3 8.3 310.5 172.6 169.5 29.9 27.9 0.1 2.0
October 1,758.5 1,726.9 634.1 451.0 641.8 3.3 7.8 290.6 166.6 170.5 31.6 29.5 0.1 2.0
November 1,761.3 1,730.6 646.7 461.0 622.9 3.2 6.9 277.4 161.8 170.5 30.7 28.7 0.1 2.0
December 1,781.1 1,750.6 679.9 470.2 600.5 3.4 6.0 259.7 155.2 172.2 30.6 28.5 0.1 2.0
2015 January 1,822.0 1,792.2 726.1 486.6 579.5 3.8 5.3 240.5 153.1 173.7 29.8 27.7 0.1 2.0
February 1,836.7 1,807.7 743.1 495.7 568.9 3.9 6.2 230.2 140.3 185.2 29.0 27.2 0.1 1.8
March 1,839.9 1,811.2 755.0 497.9 558.2 3.9 4.8 216.9 142.3 187.8 28.7 26.9 0.1 1.8
April 1,837.4 1,810.3 757.6 499.4 553.2 4.6 6.5 214.2 135.3 189.7 27.1 25.9 0.1 1.1
May 1,836.6 1,809.2 765.4 497.5 546.3 4.5 5.9 206.3 136.2 190.3 27.4 26.8 0.1 0.5
June 1,834.3 1,807.8 773.8 491.4 542.6 5.2 5.7 158.9 177.0 192.6 26.5 25.9 0.1 0.6
July 1,849.8 1,819.3 797.7 490.4 531.2 5.7 5.3 144.3 179.7 193.3 30.5 29.9 0.1 0.6
August 1,862.3 1,830.1 814.3 492.1 523.8 6.0 6.0 123.5 189.9 196.2 32.2 31.7 0.1 0.5
September 1,865.3 1,830.8 821.0 491.6 518.2 5.9 5.9 115.0 190.2 198.6 34.5 34.0 0.1 0.4
October 1,861.3 1,824.7 817.8 491.8 515.1 5.4 5.3 110.9 189.0 201.7 36.5 36.0 0.1 0.4
November 1,862.3 1,828.3 822.8 493.7 511.9 5.3 4.6 113.5 188.8 201.2 34.0 33.5 0.1 0.4
December 1,895.5 1,862.3 842.4 505.3 514.6 5.5 3.1 110.0 191.2 204.8 33.2 32.7 0.0 0.4
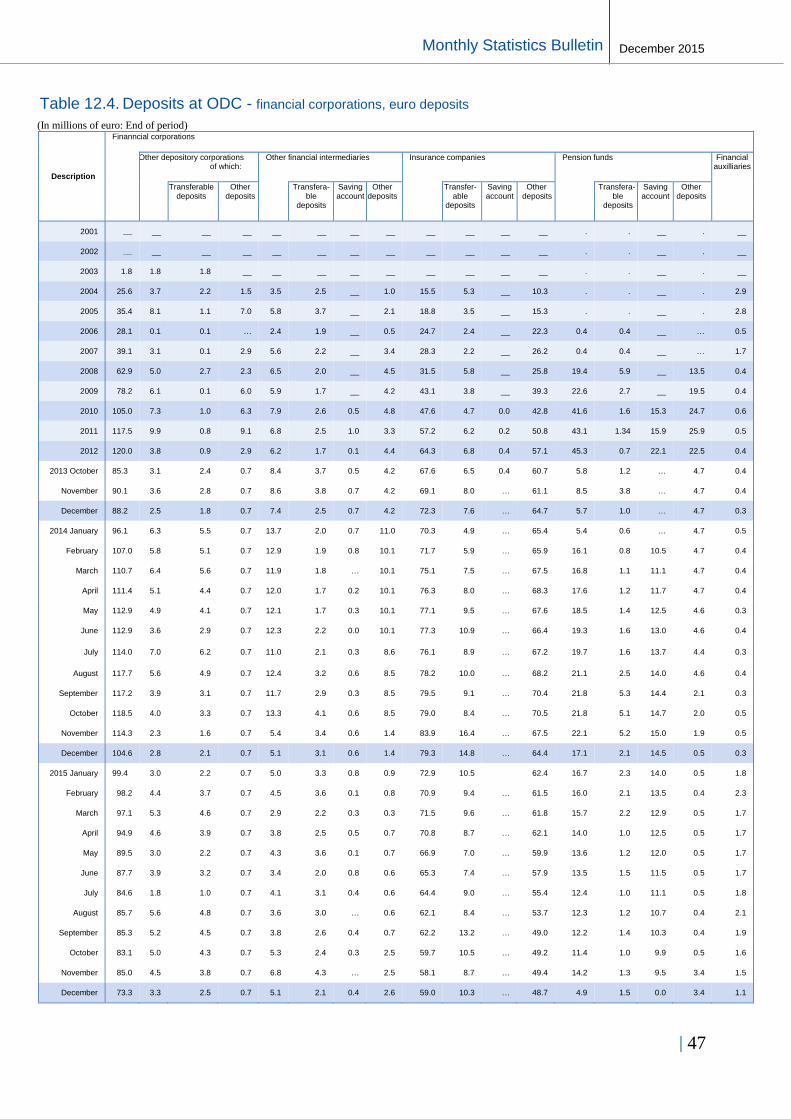
| 47
Buletini Mujor Statistikor
December 2015 Monthly Statistics Bulletin
Table 12.4. Deposits at ODC - financial corporations, euro deposits
(In millions of euro: End of period)
Description
Finanncial corporations
Other depository corporations of which:
Other financial intermediaries Insurance companies Pension funds Financial auxilliaries
Transferable deposits
Other deposits
Transfera-ble
deposits
Saving account
Other deposits
Transfer-able
deposits
Saving account
Other deposits
Transfera-ble
deposits
Saving account
Other deposits
2001 __ __ __ __ __ __ __ __ __ __ __ __ . . __ . __
2002 __ __ __ __ __ __ __ __ __ __ __ __ . . __ . __
2003 1.8 1.8 1.8 __ __ __ __ __ __ __ __ __ . . __ . __
2004 25.6 3.7 2.2 1.5 3.5 2.5 __ 1.0 15.5 5.3 __ 10.3 . . __ . 2.9
2005 35.4 8.1 1.1 7.0 5.8 3.7 __ 2.1 18.8 3.5 __ 15.3 . . __ . 2.8
2006 28.1 0.1 0.1 … 2.4 1.9 __ 0.5 24.7 2.4 __ 22.3 0.4 0.4 __ … 0.5
2007 39.1 3.1 0.1 2.9 5.6 2.2 __ 3.4 28.3 2.2 __ 26.2 0.4 0.4 __ … 1.7
2008 62.9 5.0 2.7 2.3 6.5 2.0 __ 4.5 31.5 5.8 __ 25.8 19.4 5.9 __ 13.5 0.4
2009 78.2 6.1 0.1 6.0 5.9 1.7 __ 4.2 43.1 3.8 __ 39.3 22.6 2.7 __ 19.5 0.4
2010 105.0 7.3 1.0 6.3 7.9 2.6 0.5 4.8 47.6 4.7 0.0 42.8 41.6 1.6 15.3 24.7 0.6
2011 117.5 9.9 0.8 9.1 6.8 2.5 1.0 3.3 57.2 6.2 0.2 50.8 43.1 1.34 15.9 25.9 0.5
2012 120.0 3.8 0.9 2.9 6.2 1.7 0.1 4.4 64.3 6.8 0.4 57.1 45.3 0.7 22.1 22.5 0.4
2013 October 85.3 3.1 2.4 0.7 8.4 3.7 0.5 4.2 67.6 6.5 0.4 60.7 5.8 1.2 … 4.7 0.4
November 90.1 3.6 2.8 0.7 8.6 3.8 0.7 4.2 69.1 8.0 … 61.1 8.5 3.8 … 4.7 0.4
December 88.2 2.5 1.8 0.7 7.4 2.5 0.7 4.2 72.3 7.6 … 64.7 5.7 1.0 … 4.7 0.3
2014 January 96.1 6.3 5.5 0.7 13.7 2.0 0.7 11.0 70.3 4.9 … 65.4 5.4 0.6 … 4.7 0.5
February 107.0 5.8 5.1 0.7 12.9 1.9 0.8 10.1 71.7 5.9 … 65.9 16.1 0.8 10.5 4.7 0.4
March 110.7 6.4 5.6 0.7 11.9 1.8 … 10.1 75.1 7.5 … 67.5 16.8 1.1 11.1 4.7 0.4
April 111.4 5.1 4.4 0.7 12.0 1.7 0.2 10.1 76.3 8.0 … 68.3 17.6 1.2 11.7 4.7 0.4
May 112.9 4.9 4.1 0.7 12.1 1.7 0.3 10.1 77.1 9.5 … 67.6 18.5 1.4 12.5 4.6 0.3
June 112.9 3.6 2.9 0.7 12.3 2.2 0.0 10.1 77.3 10.9 … 66.4 19.3 1.6 13.0 4.6 0.4
July 114.0 7.0 6.2 0.7 11.0 2.1 0.3 8.6 76.1 8.9 … 67.2 19.7 1.6 13.7 4.4 0.3
August 117.7 5.6 4.9 0.7 12.4 3.2 0.6 8.5 78.2 10.0 … 68.2 21.1 2.5 14.0 4.6 0.4
September 117.2 3.9 3.1 0.7 11.7 2.9 0.3 8.5 79.5 9.1 … 70.4 21.8 5.3 14.4 2.1 0.3
October 118.5 4.0 3.3 0.7 13.3 4.1 0.6 8.5 79.0 8.4 … 70.5 21.8 5.1 14.7 2.0 0.5
November 114.3 2.3 1.6 0.7 5.4 3.4 0.6 1.4 83.9 16.4 … 67.5 22.1 5.2 15.0 1.9 0.5
December 104.6 2.8 2.1 0.7 5.1 3.1 0.6 1.4 79.3 14.8 … 64.4 17.1 2.1 14.5 0.5 0.3
2015 January 99.4 3.0 2.2 0.7 5.0 3.3 0.8 0.9 72.9 10.5 62.4 16.7 2.3 14.0 0.5 1.8
February 98.2 4.4 3.7 0.7 4.5 3.6 0.1 0.8 70.9 9.4 … 61.5 16.0 2.1 13.5 0.4 2.3
March 97.1 5.3 4.6 0.7 2.9 2.2 0.3 0.3 71.5 9.6 … 61.8 15.7 2.2 12.9 0.5 1.7
April 94.9 4.6 3.9 0.7 3.8 2.5 0.5 0.7 70.8 8.7 … 62.1 14.0 1.0 12.5 0.5 1.7
May 89.5 3.0 2.2 0.7 4.3 3.6 0.1 0.7 66.9 7.0 … 59.9 13.6 1.2 12.0 0.5 1.7
June 87.7 3.9 3.2 0.7 3.4 2.0 0.8 0.6 65.3 7.4 … 57.9 13.5 1.5 11.5 0.5 1.7
July 84.6 1.8 1.0 0.7 4.1 3.1 0.4 0.6 64.4 9.0 … 55.4 12.4 1.0 11.1 0.5 1.8
August 85.7 5.6 4.8 0.7 3.6 3.0 … 0.6 62.1 8.4 … 53.7 12.3 1.2 10.7 0.4 2.1
September 85.3 5.2 4.5 0.7 3.8 2.6 0.4 0.7 62.2 13.2 … 49.0 12.2 1.4 10.3 0.4 1.9
October 83.1 5.0 4.3 0.7 5.3 2.4 0.3 2.5 59.7 10.5 … 49.2 11.4 1.0 9.9 0.5 1.6
November 85.0 4.5 3.8 0.7 6.8 4.3 … 2.5 58.1 8.7 … 49.4 14.2 1.3 9.5 3.4 1.5
December 73.3 3.3 2.5 0.7 5.1 2.1 0.4 2.6 59.0 10.3 … 48.7 4.9 1.5 0.0 3.4 1.1

48 |
Monthly Statistics Bulletin December 2015
Table 12.5. Non euro deposits
(In millions of euro: End of period)
Description
Non-euro deposits
Finanncial
corporations
of which:
Nonfinancial corporations
Other domestic sectors Non residents
CBK Other depository corporatio
ns
Other financial
intermediaries
Insurance companies
Public nonfinancial corporations
Other nonfan-ancial
corporations
Households NPISH
Transfe-rable
deposits
Saving acco-unt
Other deposits
2005 29.4 … __ … … … 2.8 __ 2.8 26.0 25.7 10.8 __ 14.9 0.3 0.5
2006 34.3 … __ … … … 3.7 0.3 3.5 29.8 29.6 12.4 __ 17.2 0.2 0.5
2007 53.3 0.5 __ … 0.1 0.4 8.1 1.5 6.6 44.3 44.2 16.2 __ 28.0 0.1 0.4
2008 81.9 0.9 __ … … 0.9 11.6 0.1 11.5 68.4 68.2 22.9 __ 45.2 0.3 1.0
2009 112.1 2.1 __ 1.2 … 0.9 18.3 1.3 17.0 91.1 90.9 29.7 __ 61.1 0.2 0.7
2010 113.8 3.1 __ 2.9 __ __ 13.7 4.3 9.4 93.8 93.3 33.1 25.9 34.3 0.5 3.1
2011 131.5 0.3 __ 0.3 __ __ 9.8 0.1 9.7 117.5 117.0 46.5 31.7 38.9 0.4 3.8
2012 120.9 1.6 __ 1.2 0.2 __ 9.6 __ 9.6 104.9 104.7 45.7 27.0 32.0 0.2 4.8
2013 August 128.9 0.3 __ __ 0.2 __ 9.8 __ 9.8 113.9 113.7 56.9 28.9 27.9 0.3 4.8
September 129.7 0.4 __ __ 0.1 __ 12.4 __ 12.4 112.1 111.8 55.8 28.8 27.2 0.3 4.8
October 131.7 0.4 __ __ 0.1 __ 13.8 __ 13.8 112.4 111.6 54.5 29.7 27.4 0.8 5.1
November 126.6 0.6 __ __ 0.3 __ 8.7 __ 8.7 112.2 111.4 55.2 29.0 27.2 0.8 5.0
December 136.9 0.7 __ __ 0.4 __ 14.3 __ 14.3 116.7 116.2 59.6 29.6 27.0 0.5 5.2
2014 January 136.4 0.1 __ __ 0.1 __ 12.6 __ 12.6 118.4 118.0 60.4 30.7 26.9 0.4 5.3
February 135.0 0.4 __ __ 0.1 __ 11.9 __ 11.9 117.3 116.7 60.9 30.4 25.4 0.6 5.4
March 138.5 0.2 __ __ 0.1 __ 15.3 __ 15.3 117.4 115.9 61.5 30.7 23.7 1.6 5.6
April 141.2 0.2 __ __ 0.1 __ 15.6 __ 15.6 119.5 118.4 64.9 30.3 23.2 1.2 5.9
May 138.8 0.4 __ __ 0.3 __ 11.7 __ 11.7 121.0 120.5 66.4 32.1 22.0 0.4 5.7
June 138.3 0.2 __ __ 0.1 __ 10.4 __ 10.4 121.4 120.8 68.2 31.6 21.0 0.6 6.3
July 141.7 0.5 __ __ 0.5 __ 10.1 __ 10.1 123.9 123.0 70.8 31.4 20.8 0.8 7.2
August 137.6 0.2 __ __ 0.2 __ 9.5 __ 9.5 121.4 120.9 70.0 31.7 19.2 0.5 6.6
September 132.0 0.1 __ __ 0.1 __ 9.4 __ 9.4 115.5 115.1 68.3 29.3 17.6 0.3 7.0
October 123.0 0.1 __ __ 0.1 __ 8.7 __ 8.7 108.0 107.5 65.6 26.6 15.4 0.4 6.3
November 113.8 0.1 __ __ 0.1 __ 8.7 __ 8.7 98.9 98.3 61.5 23.0 13.8 0.6 6.0
December 113.1 0.3 __ __ 0.3 __ 8.5 __ 8.5 97.8 97.3 63.2 21.5 12.6 0.6 6.5
2015 January 109.2 0.2 __ __ 0.1 __ 10.9 __ 10.9 92.0 91.5 58.9 21.6 11.0 0.7 6.2
February 108.4 0.1 __ … 0.1 … 12.5 __ 12.5 88.9 88.1 57.8 20.1 10.3 0.8 6.9
March 117.1 0.1 __ … … … 12.0 __ 12.0 94.7 94.0 63.7 20.9 9.4 0.7 7.9
April 111.8 0.0 __ … … __ 10.0 __ 10.0 92.7 92.1 62.8 20.4 8.9 0.6 9.0
May 111.1 0.1 __ __ … __ 8.5 __ 8.5 95.2 94.4 65.1 20.4 8.9 0.8 7.4
June 117.9 0.1 __ __ … __ 12.3 __ 12.3 97.9 96.8 68.0 20.1 8.6 1.1 7.6
July 120.9 0.1 ---- --- … --- 13.0 --- 13.0 99.5 98.4 70.6 20.2 7.6 1.1 8.2
August 121.3 0.1 __ 0.1 … __ 10.9 __ 10.9 101.7 101.2 73.7 20.2 7.3 0.6 8.6
September 124.6 0.1 __ 0.1 … __ 11.2 __ 11.2 104.0 103.5 76.6 20.0 6.9 0.5 9.3
October 123.5 0.1 __ 0.1 … __ 11.7 __ 11.7 102.8 102.3 75.8 20.1 6.4 0.5 8.8
November 121.3 0.2 __ 0.2 … __ 10.0 __ 10.0 101.5 100.0 74.4 19.2 6.4 1.5 9.4
December 124.5 0.2 __ 0.2 … __ 13.5 __ 13.5 102.8 102.2 76.6 19.3 6.2 0.6 7.8

| 49
Buletini Mujor Statistikor
December 2015 Monthly Statistics Bulletin
Table 13.1. ODC loans - main sectors
(In millions of euro: End of period)
Description
Total
Financial
corporatio
ns of which:
Nonfinancial
corporations of which:
Other
domestic
corporations
of which:
Nonresi-
dents
Loans in
Non Euro
Currency Other
financia
l
interme
diaries
Insura
nce
compa
nies
Public
nonfin
ancial
corpor
ations
Other nonfinancial
corporations
Households
Up to
1 year
Over
1 year
Up
to 1
year
Over 1
year
2001 25.9 __ __ __ 25.9 __ 25.9 24.6 1.3 __ __ __ 0.0 __ __
2002 86.5 __ __ __ 80.8 __ 80.8 67.3 13.5 5.7 5.7 1.4 4.3 __ __
2003 232.8 __ __ __ 193.7 0.2 193.5 124.7 68.9 39.0 39.0 11.4 27.7 __ __
2004 373.7 __ __ __ 289.9 … 289.9 111.5 178.5 83.7 83.7 15.9 67.8 __ __
2005 513.9 __ __ __ 387.9 … 387.9 117.9 269.9 126.0 126.0 19.5 106.4 __ __
2006 636.6 __ __ __ 490.5 … 490.5 128.7 361.8 146.1 146.1 19.7 126.4 __ __
2007 892.1 __ __ __ 691.5 0.2 691.3 174.0 517.3 200.6 200.6 24.0 176.6 __ __
2008 1,183.4 0.6 __ 0.6 901.8 0.1 901.7 191.0 710.7 281.0 281.0 20.9 260.1 __ __
2009 1,289.0 2.3 1.2 1.1 943.2 0.3 942.9 215.7 727.2 343.5 343.5 27.0 316.6 __ __
2010 1,458.7 5.7 2.6 3.0 1,014.5 6.3 1,008.3 259.4 748.9 434.3 434.2 26.5 407.6 1.6 2.5
December 1,698.1 17.3 15.6 1.7 1,128.6 1.5 1,127.0 298.8 828.2 512.4 510.9 44.0 466.9 32.5 7.3
December 1,763.4 19.8 16.3 3.5 1,171.2 1.4 1,169.8 313.4 856.4 543.0 542.6 52.2 490.4 22.5 6.9
2013 October 1,798.8 18.6 16.8 1.8 1,187.2 0.3 1,186.9 368.1 818.8 566.9 566.5 64.1 502.4 19.8 6.4
November 1,803.2 18.9 17.0 1.9 1,193.7 0.3 1,193.4 381.9 811.5 564.6 563.9 63.5 500.5 19.8 6.3
December 1,805.8 20.4 17.3 3.1 1,194.7 0.2 1,194.5 378.0 816.5 564.7 563.9 65.4 498.4 19.9 6.1
2014 January 1,794.5 19.1 17.0 2.1 1,189.7 0.2 1,189.5 379.4 810.1 560.5 559.8 65.6 494.2 19.1 6.0
February 1,794.3 19.1 16.7 2.4 1,190.2 0.2 1,190.0 366.5 823.6 560.0 559.3 60.1 499.3 19.1 5.9
March 1,825.9 20.0 16.8 3.2 1,215.1 0.2 1,214.9 388.3 826.6 565.9 564.8 65.8 499.0 19.2 5.7
April 1,839.7 18.8 16.7 2.0 1,224.6 0.2 1,224.4 395.8 828.6 571.8 571.2 66.5 504.7 18.7 5.8
May 1,856.8 19.1 16.9 2.1 1,229.2 0.2 1,229.1 397.4 831.6 583.8 583.4 68.5 514.9 18.7 5.9
June 1,889.9 20.2 17.2 3.0 1,251.0 0.2 1,250.9 399.4 851.4 594.0 593.2 69.3 523.9 18.8 5.9
July 1,874.3 19.0 17.2 1.8 1,241.2 0.2 1,241.0 396.1 844.9 602.0 601.5 70.3 531.2 5.9 6.2
August 1,848.2 19.2 17.1 0.8 1,212.4 0.2 1,212.2 375.8 836.4 604.4 604.0 69.5 534.5 5.9 6.2
September 1,855.0 7.8 5.1 2.7 1,225.3 0.2 1,225.2 386.6 838.5 609.6 609.5 70.3 539.1 5.9 6.4
October 1,854.0 7.5 5.1 2.4 1,236.6 0.2 1,236.4 368.1 868.4 603.2 603.1 48.9 554.2 0.4 6.2
November 1,860.8 7.6 5.7 1.9 1,236.3 0.2 1,236.1 377.6 858.6 610.4 610.2 50.2 560.0 0.5 6.1
December 1,882.3 7.1 5.8 1.3 1,233.4 0.6 1,232.7 367.0 865.7 635.4 635.3 69.6 565.7 0.5 6.0
2015 January 1,863.1 7.2 7.0 0.2 1,230.7 0.2 1,230.5 359.7 870.9 618.7 618.5 49.8 568.7 0.4 6.1
February 1,874.9 8.1 7.0 1.0 1,242.6 0.3
1,242.3 378.8 863.5 617.7 617.4 33.6 568.5 0.4 6.1
March 1,903.5 9.2 7.4 1.8 1,262.0 0.7 1,261.4 349.9 911.5 625.7 625.6 36.1 575.0 0.4 6.2
April 1,936.0 8.8 7.7 1.1 1,285.1 0.2 1,284.9 386.8 898.1 635.9 635.6 40.3 578.6 0.4 6.1
May 1,957.0 9.1 8.0 1.1 1,294.7 0.3 1,294.4 377.0 917.4 646.8 646.7 40.7 548.4 0.4 6.4
June 2004.8 9.0 7.4 1.5 1328.6 0.6 1328.0 366.5 961.5 660.9 660.8 41.2 563.4 0.4 6.3
July 2,000.8 8.8 7.9 0.8 1,317.9 0.2 1,317.8 348.6 969.3 667.5 667.5 42.1 569.6 0.4 6.4
August 1,984.7 8.9 8.0 0.8 1,298.8 0.1 1,298.7 332.0 960.4 670.7 670.7 55.3 573.6 0.4 6.3
September 1,992.9 8.2 7.2 0.9 1,314.0 0.6 1,313.4 329.3 980.0 664.5 664.4 54.7 568.1 0.3 6.2
October 2,006.1 7.8 6.8 1.0 1,309.8 0.1 1,309.6 315.6 994.1 682.2 682.1 55.7 585.6 0.4 6.3
November 2,014.9 8.0 7.1 1.0 1,326.8 0.1 1,326.8 311.1 1,015.7 673.5 673.5 56.0 617.4 0.3 6.3
December 2,019.0 8.7 7.4 1.1 1,322.2 0.6 1,321.6 306.9 1,014.7 682.2 682.0 58.2 623.8 0.4 5.9

50 |
Monthly Statistics Bulletin December 2015
Table 13.2. ODC loans - new loans
(In millions of euro: Cumulative data during the reference month)
Description Total 1/
Nonfinancial corporations Households
Investment loans Non-investment
loans
Overdrafts 4/ 5/
Credit
lines
Loans with
favourable
conditions
Consumer loans
Mortgage loans
Overdrafts 4/ 5/
Loans with
favourable
conditions
Other
Loans
≤ 1 year
> 1 year ≤ 5 years 2/
> 5 years
≤ 1 year 3/
> 1 year ≤ 5 years
> 5 years
≤ 1 year
> 1 year ≤ 5 years
> 5 year
s
2005 December 40.8 0.7 10.3 4.9 5.3 13.4 . 7.5 . . 4.8 - 0.4 0.0 0.1 . 1.0
2006 December 45.4 0.5 8.5 10.6 5.6 12.8 . 8.2 . . 4.7 - 0.6 0.0 0.2 . 2.0
2007 December 53.3 3.6 6.4 12.1 4.7 16.6 . 10.2 . . 6.6 - 0.6 0.0 0.4 . 2.7
2008 December 60.0 1.1 9.5 7.1 5.9 19.1 . 135.5 . . 13.6 - 2.3 1.4 5.7 . 0.0
2009 December 65.3 0.9 9.5 10.0 5.2 23.9 . 140.8 . . 12.2 - 1.6 2.0 6.2 . 0.0
2010 December 79.6 1.7 26.3 3.8 3.2 20.0 3.3 108.3 8.1 2.7 9.7 0.0 2.1 1.2 5.0 4.9 0.7
2011 December 75.5 2.0 18.1 8.6 3.3 15.8 2.7 147.8 8.6 3.0 13.8 0.0 1.7 1.1 5.9 4.5 1.0
2012 December 72.9 2.0 21.7 2.3 4.2 16.0 0.6 170.3 9.2 4.6 13.4 0.0 1.6 1.2 6.4 4.1 1.1
2013 August 50.9 0.7 12.7 0.7 1.8 5.7 3.7 176.2 8.8 4.5 13.7 0.0 1.9 1.5 6.0 2.8 1.2
September 59.4 0.9 16.1 0.5 4.3 9.2 0.3 169.3 6.8 1.9 11.5 0.0 2.9 2.2 6.7 7.8 1.8
October 82.6 0.9 25.9 11.0 4.4 11.1 0.2 180.8 6.0 2.4 12.3 0.1 1.8 2.1 7.6 8.6 1.8
November 60.0 0.9 23.0 3.8 3.4 7.4 0.0 190.1 4.7 1.7 11.4 0.0 1.8 1.2 6.5 3.8 1.7
December 86.0 0.8 26.8 16.6 3.6 11.3 1.6 192.3 11.2 3.5 14.5 0.0 1.9 1.5 6.6 2.1 1.8
2014 January 45.9 0.7 15.9 4.4 1.3 6.1 0.0 178.9 4.5 0.6 11.7 0.1 1.5 0.9 6.4 1.5 1.2
February 57.9 0.7 13.6 3.0 2.6 8.6 1.2 186.2 6.0 6.3 15.4 0.0 2.1 1.6 6.4 1.8 0.9
March 95.8 1.2 22.3 18.7 5.4 9.7 3.0 195.5 7.2 3.6 24.0 0.0 2.7 2.0 6.7 2.4 0.8
April 88.1 0.7 22.9 13.3 6.7 8.4 2.0 193.4 6.7 2.2 24.4 0.0 2.3 1.7 6.9 2.5 1.0
May 122.8 0.9 37.5 12.0 5.6 9.8 3.3 187.5 5.5 14.0 32.6 0.0 2.0 2.0 10.0 1.9 1.0
June 101.9 0.8 36.0 7.0 3.7 12.3 2.8 201.0 6.8 2.1 28.7 0.0 1.8 2.3 7.2 3.5 0.8
July 69.3 1.8 15.3 0.5 4.6 11.7 0.3 194.2 5.8 1.1 26.7 0.0 2.1 1.2 7.5 3.1 1.0
August 64.9 1.0 14.5 7.9 3.6 8.3 0.6 176.3 9.3 2.1 19.4 0.1 1.5 2.2 6.9 2.8 0.9
September 82.2 1.1 15.1 14.4 3.3 10.9 0.1 182.8 5.2 5.1 22.8 0.0 2.1 2.7 7.8 3.4 1.2
October 86.0 0.5 16.0 5.3 6.5 10.8 4.0 188.3 7.9 8.7 24.1 0.0 2.9 2.9 7.9 3.0 1.2
November 75.2 0.8 18.9 3.7 3.0 10.4 0.2 177.9 5.5 5.4 22.9 0.1 2.9 2.8 8.3 3.2 0.9
December 104.2 1.1 24.8 13.5 6.5 14.4 0.9 191.4 5.7 3.8 28.7 0.0 2.1 4.3 8.0 3.0 1.1
2015 January 47.6 0.4 9.0 7.6 2.2 6.1 0.1 166.7 7.7 1.2 14.3 0.0 1.6 2.7 8.1 2.0 0.7
February 64.2 1.4 11.4 10.3 3.1 10.6 2.0 181.4 5.5 2.0 16.3 0.0 1.7 2.7 8.2 1.9 0.8
March 104.6 0.8 21.9 10.8 7.2 14.4 2.5 192.6 6.8 8.0 29.7 0.1 1.8 2.9 8.5 3.5 1.0
April 105.5 1.3 22.5 21.1 5.4 11.5 0.4 195.5 6.8 2.9 32.0 0.0 1.8 3.9 8.6 1.7 1.0
May 107.1 0.9 36.6 10.4 5.2 11.4 0.3 203.5 5.7 3.2 29.1 0.0 2.2 3.6 8.4 2.3 1.9
June 126.9 1.0 37.8 18.2 6.4 14.8 0.9 199.6 4.9 3.7 28.9 0.1 1.8 5.9 9.2 5.8 1.7
July 96.4 0.4 18.0 15.4 8.1 10.3 4.1 189.4 5.1 4.6 24.3 0.0 1.5 3.4 9.0 5.6 0.8
August 85.2 1.0 14.0 31.3 2.9 6.1 0.3 174.2 5.5 1.8 17.0 0.2 2.0 3.5 8.7 4.4 0.7
September 87.5 0.7 19.5 18.8 5.8 7.6 0.4 142.6 6.3 2.5 21.1 0.0 1.9 4.0 8.4 4.4 0.8
October 93.7 1.5 14.2 15.3 8.6 8.5 1.5 185.2 7.1 8.6 20.9 0.0 2.0 4.5 9.1 6.9 1.2
November 75.6 1.6 17.0 11.1 3.6 8.3 1.0 178.0 5.2 2.5 17.9 0.0 1.6 4.6 9.3 5.2 1.2
December 108.0 1.3 31.2 8.5 6.8 15.1 2.8 194.4 9.0 7.4 22.2 0.0 1.9 3.7 9.0 6.2 0.9
1 / Total new loans; 2 / Total new credit in economic sectors (agriculture, industry, services); 3 / Total new credit in other economic sectors; 4/5 / Excluded when calculating the total new loans ;

| 51
Buletini Mujor Statistikor
December 2015 Monthly Statistics Bulletin
Table 13.3. ODC loans - main economic sectors, corporates
(In millions of euro: End of period)
Description
Total
Agriculture Industry, energy and construction Services
Up to 1 year
Over 1 year
Up to 1 year
Over 1 year
Up to 1 year
Over 1 year
2001 25.9 … … __ 3.8 3.8 … 22.2 22.2 …
2002 86.5 1.5 1.5 __ 13.6 13.6 … 71.4 71.4 …
2003 232.8 4.7 3.9 0.8 22.2 12.6 9.7 205.8 119.7 86.1
2004 289.9 7.9 3.9 4.1 47.8 22.5 25.3 234.2 89.5 144.8
2005 387.9 12.5 4.1 8.4 74.2 24.5 49.7 301.1 92.4 208.8
2006 490.5 16.4 3.4 13.0 97.7 28.0 69.7 376.4 120.6 255.8
2007 691.5 29.0 4.1 24.9 144.5 32.8 111.7 518.0 149.5 368.5
2008 902.4 37.4 4.1 33.3 160.2 28.9 131.2 704.8 126.4 578.4
2009 945.5 38.2 3.8 34.4 236.7 54.8 181.9 670.5 113.2 557.3
2010 1,022.8 38.2 1.7 36.5 269.3 77.1 192.2 715.3 188.5 526.8
2011 1,149.5 40.5 2.7 37.8 284.7 82.3 202.4 824.4 220.5 603.8
2012 1,194.2 43.6 3.0 40.6 290.4 74.1 216.2 860.2 232.3 627.9
2013 September 1,216.5 55.4 3.7 51.7 295.1 96.4 198.7 866.0 265.9 600.1
October 1,208.0 46.8 3.2 43.7 291.9 94.1 197.8 869.2 276.3 592.9
November 1,214.7 46.2 3.2 43.0 292.1 97.6 194.5 876.4 286.5 589.9
December 1,217.4 45.8 3.3 42.5 291.4 95.8 195.6 880.2 286.2 594.0
2014 January 1,217.4 45.8 3.3 42.5 291.4 95.8 195.6 880.2 286.2 594.0
February 1,211.5 45.3 3.3 42.0 286.4 94.5 191.9 879.8 289.4 590.4
March 1,237.1 45.3 3.4 41.9 297.9 95.4 202.5 893.9 296.8 597.1
April 1,245.4 45.3 4.3 41.1 300.6 98.2 202.4 899.5 298.5 601.0
May 1,250.4 45.3 4.3 41.0 303.4 100.0 203.4 901.7 297.0 604.7
June 1,273.3 45.5 4.5 41.0 304.8 103.4 201.5 923.0 294.9 628.0
July 1,262.5 45.3 3.4 41.9 301.3 89.3 212.1 915.9 270.1 645.8
August 1,233.9 45.0 4.7 40.3 294.3 97.2 197.1 894.6 277.2 617.4
September 1,235.6 48.9 4.9 44.0 293.7 97.2 196.6 892.9 288.0 605.0
October 1,246.3 48.2 4.3 43.9 295.3 97.0 198.4 902.8 282.5 620.3
November 1,246.1 49.4 5.0 44.4 295.0 100.1 194.9 901.7 293.2 608.5
December 1,242.8 49.4 4.0 45.5 290.0 85.8 204.2 903.4 281.8 621.5
2015 January 1,240.3 48.3 4.0 44.4 293.0 90.8 202.2 899.0 281.8 617.2
February
1,253.1
48.4
4.1
44.3
295.1
99.8
195.3
909.6
293.1
616.5
March
1,273.7
49.6
3.6
46.0
299.4
98.3
201.1
924.7
268.9
655.8
April
1,296.3
49.8
3.5
46.2
305.6
96.6
190.1
940.9
261.9
628.9
May 1,306.4 50.1 3.3 46.8 304.3 89.0 198.0 952.0 261.0 633.9
June 1,340.1 51.0 3.0 48.0 311.3 38.5 130.0 977.8 255.8 668.2
July 1,329.3 51.9 3.0 48.9 307.2 82.8 206.9 970.3 245.0 664.2
August 1,310.2 53.2 3.3 49.9 307.4 83.6 206.7 949.6 246.6 633.4
September 1,324.6 53.8 3.7 50.1 308.5 80.2 208.3 962.3 245.8 644.4
October 1,319.9 53.9 4.1 49.8 308.1 78.7 210.5 957.9 230.7 652.2
November 1,337.6 60.6 5.0 55.6 308.0 75.4 212.5 969.1 230.1 663.7
December 1,333.4 59.9 4.6 55.3 300.6 76.0 205.4 972.9 220.8 652.6

52 |
Monthly Statistics Bulletin December 2015
Table 13.4. ODC loans - industry, electricity and construction
(In millions of euro: End of period)
Description
Industry, energy and construction
Mining Manufacturing Electricity, gas and water Construction
Up to 1 year
Over 1 year
Up to 1 year
Over 1 year
Up to 1 year
Over 1 year
2001 3.8 __ 3.8 3.8 0.0 __ __ __ __ __ __
2002 13.6 __ 13.6 13.6 0.0 __ __ __ __ __ __
2003 22.2 __ 18.8 10.8 8.0 … … __ 3.4 1.7 1.7
2004 47.8 … 35.5 16.1 19.4 0.1 … 0.1 12.2 6.4 5.8
2005 74.2 0.5 47.5 11.4 36.2 0.6 0.2 0.4 25.6 12.5 13.1
2006 97.7 0.5 61.2 11.8 49.3 0.7 0.3 0.4 35.3 15.3 20.0
2007 144.5 5.6 88.3 16.3 72.0 1.2 0.4 0.8 49.5 15.6 33.9
2008 160.2 0.8 92.3 13.6 78.6 1.6 0.3 1.3 65.6 14.2 51.3
2009 236.7 14.1 119.9 17.9 102.0 13.7 10.0 3.7 89.1 21.2 67.9
2010 269.3 14.6 127.6 26.1 101.6 18.0 11.9 6.1 109.1 38.2 70.9
2011 284.7 17.2 136.7 28.4 108.3 14.5 7.9 6.6 116.3 38.8 77.4
2012 290.4 16.2 133.1 21.7 111.4 15.9 6.7 9.3 125.2 38.2 87.0
2013 October 291.9 19.4 130.2 31.2 99.0 20.5 9.7 10.8 121.8 43.5 78.4
November 292.1 19.4 131.5 33.6 97.8 21.1 10.4 10.7 120.2 43.3 76.8
December 291.4 20.1 131.7 32.7 99.1 20.8 10.2 10.6 118.7 42.3 76.5
2014 January 291.4 20.1 131.7 32.7 99.1 20.8 10.2 10.6 118.7 42.3 76.5
February 286.4 20.7 135.1 34.5 100.6 16.7 8.7 8.0 114.0 39.8 74.2
March 297.9 20.3 147.0 34.2 112.8 16.1 8.1 8.0 114.4 41.5 72.9
April 300.6 20.5 149.0 35.8 113.3 17.9 8.4 9.4 113.2 42.3 70.9
May 303.4 20.4 151.2 36.4 114.8 18.8 8.9 9.9 112.9 43.0 69.9
June 304.8 20.4 152.4 38.3 114.0 18.2 8.6 9.6 113.8 44.5 69.2
July 301.3 20.0 151.3 35.4 116.0 17.6 7.1 10.5 112.5 35.1 77.4
August 294.3 18.3 148.0 36.1 111.9 18.2 8.6 9.6 109.7 42.8 66.9
September 293.7 19.7 146.4 35.3 111.1 17.6 7.7 9.9 110.0 42.9 67.0
October 295.3 18.5 148.7 35.3 113.4 20.9 11.4 9.5 107.2 40.1 67.1
November 295.0 18.2 147.7 35.5 112.2 21.2 13.2 8.0 107.9 42.1 65.8
December 290.0 19.7 148.9 34.2 114.7 17.1 8.2 8.9 104.2 39.9 64.4
2015 January 293.0 19.3 149.2 35.7 113.5 20.2 11.2 9.0 104.3 40.5 63.8
February 295.1 17.9 154.1 36.9 117.2 20.8 11.9 8.9 102.2 41.3 61.0
March 299.4 19.2 155.1 36.1 118.9 21.0 12.4 8.7 104.1 38.6 65.6
April 305.6 18.9 161.7 43.6 118.1 21.0 13.8 7.2 104.1 39.2 64.8
May 304.3 17.3 163.9 37.3 126.6 20.5 13.4 7.1 102.6 38.3 64.4
June 311.3 18.7 168.5 38.5 130.0 20.5 13.5 7.0 103.6 37.4 66.2
July 307.2 17.5 169.4 37.5 131.9 19.2 10.4 8.8 101.1 34.9 66.2
August 307.4 17.1 172.7 38.5 134.2 18.4 10.4 8.0 99.1 34.7 64.5
September 308.5 20.0 172.0 36.2 135.7 18.7 10.8 7.9 97.8 33.1 64.7
October 308.1 18.9 173.5 36.9 136.7 18.4 10.5 7.9 97.3 31.4 66.0
November 308.0 20.1 171.9 34.4 137.5 17.8 9.9 7.9 98.3 31.1 67.2
December 300.6 19.2 164.1 35.4 128.8 17.8 9.5 8.3 99.5 31.1 68.4

| 53
Buletini Mujor Statistikor
December 2015 Monthly Statistics Bulletin
Table 13.5. ODC loans - services
(In millions of euro: End of period)
Description
Services
Whole sale and retail trade Hotel and restaurants Other trade Fin. services,
expol. real
estate, rent, bus services
of which:
Other services
Up to 1 year
Over 1 year
Up to 1
year
Over 1
year
Up to 1 year
Over 1
year
Over 1 year
Up to 1
year
Over 1
year
2001 22.2 14.0 14.0 __ 4.1 4.1 __ __ __ __ __ __ 4.1 4.1 __
2002 71.4 51.4 51.4 __ 14.6 14.6 __ __ __ __ __ __ 5.4 5.4 __
2003 205.8 113.1 75.8 37.3 71.8 31.7 40.1 1.3 0.4 0.9 __ __ 19.6 11.9 7.7
2004 234.2 172.8 66.3 106.5 18.9 9.4 9.6 5.4 2.8 2.6 3.2 3.1 33.8 10.9 22.9
2005 301.1 209.6 64.0 145.5 28.0 12.2 15.8 12.1 4.8 7.3 2.7 2.6 48.7 11.2 37.5
2006 376.4 259.5 74.5 185.0 29.5 10.5 19.0 18.3 7.4 11.0 1.1 0.9 68.0 28.1 39.9
2007 518.0 344.6 88.7 256.0 44.9 14.5 30.4 26.6 6.8 19.7 1.5 1.2 100.4 39.2 61.2
2008 704.8 437.5 79.1 358.4 45.1 6.4 38.7 22.0 2.4 19.6 6.0 4.5 194.2 37.0 157.2
2009 670.5 458.9 81.3 377.6 50.8 9.1 41.7 23.7 2.1 21.6 10.6 9.7 126.6 19.8 106.8
2010 715.3 521.2 140.5 380.7 39.5 4.2 35.3 18.9 2.9 16.1 22.0 8.8 113.6 32.1 81.5
2011 824.4 606.2 163.2 443.0 39.9 4.2 35.7 23.4 4.6 18.9 55.0 19.9 99.9 28.7 71.2
2012 860.2 635.3 185.7 449.6 38.8 4.2 34.6 22.7 2.2 20.6 54.5 12.2 108.8 28.0 80.8
2013 November 876.4 643.9 233.6 410.2 50.1 4.8 45.3 19.4 4.6 14.8 65.7 14.8 97.3 28.7 68.6
December 880.2 640.6 229.9 410.6 49.2 4.8 44.4 19.1 4.4 14.7 68.8 16.9 102.6 30.2 72.4
2014 January 880.2 640.6 229.9 410.6 49.2 4.8 44.4 19.1 4.4 14.7 68.8 16.9 102.6 30.2 72.4
February 879.8 643.5 238.0 405.6 47.8 4.6 43.2 19.5 4.7 14.7 65.7 14.8 103.3 27.3 76.0
March 893.9 653.5 241.4 412.1 48.9 4.8 44.0 19.3 4.6 14.7 66.1 15.4 106.1 30.5 75.5
April 899.5 657.2 244.8 412.5 49.6 4.9 44.6 18.3 3.5 14.8 64.1 12.8 110.3 32.4 77.9
May 901.7 654.6 242.5 412.2 50.0 4.9 45.1 18.4 3.4 15.0 64.5 12.2 114.3 34.0 80.3
June 923.0 665.0 240.0 425.0 49.7 5.0 44.7 18.1 3.4 14.8 65.7 11.4 124.4 35.2 89.2
July 915.9 662.6 219.4 443.2 49.1 4.8 44.3 18.0 3.4 14.7 65.3 11.0 120.8 31.6 89.2
August 894.6 641.4 223.7 417.7 46.8 4.5 42.3 17.9 3.5 14.4 65.1 10.8 123.5 34.6 88.8
September 892.9 648.8 231.6 417.2 48.1 5.2 42.9 17.7 3.4 14.3 53.3 11.8 125.1 36.0 89.1
October 902.8 659.5 225.7 433.8 49.8 5.7 44.2 17.8 3.5 14.3 53.4 12.2 122.2 35.4 86.9
November 901.7 652.1 234.0 418.1 50.7 5.9 44.8 17.5 3.6 13.9 54.1 13.0 127.2 36.6 90.6
December 903.4 664.0 228.7 435.2 49.7 5.1 44.7 17.1 3.2 14.0 58.9 14.3 113.7 30.6 83.1
2015 January 899.0 652.4 223.8 428.6 49.9 5.5 44.4 17.3 2.9 14.3 61.4 14.7 118.1 34.9 83.1
February 909.6 667.0 232.6 434.4 49.6 5.7 43.9 18.0 3.6 14.3 62.5 15.1 112.6 36.1 76.4
March 924.7 678.0 217.4 460.6 51.0 5.6 45.4 17.7 3.7 14.0 74.9 18.6 103.1 23.7 79.5
April 940.9 694.7 225.9 468.8 52.3 5.9 46.3 17.9 3.7 14.2 68.7 18.6 107.3 26.4 80.8
May 952.0 695.9 226.6 469.3 53.5 5.4 48.0 18.1 3.5 14.6 76.4 19.2 108.2 25.5 82.7
June 977.8 723.3 222.0 501.2 54.0 5.4 48.6 18.2 3.1 15.1 73.1 19.3 109.2 25.2 84.0
July 970.3 706.2 211.4 494.9 52.5 5.2 47.4 17.9 2.8 15.1 80.2 19.2 113.4 25.7 87.7
August 949.6 680.1 197.1 483.0 50.9 4.1 46.8 22.1 2.5 19.6 88.5 18.8 108.1 24.0 84.1
September 962.3 694.0 200.1 493.9 50.7 4.2 46.5 21.9 2.4 19.5 89.0 16.9 106.7 22.2 84.5
October 957.9 687.6 188.1 499.4 50.4 3.4 47.0 21.7 2.3 19.4 90.0 15.1 108.2 21.8 86.4
November 969.1 690.5 188.6 502.0 50.8 3.5 47.3 21.4 2.3 19.2 89.0 13.8 117.3 22.0 95.3
December 972.9 683.0 180.1 502.9 50.7 3.4 47.3 21.3 2.5 18.8 94.0 15.8 123.8 21.4 102.4

54 |
Monthly Statistics Bulletin December 2015
Table 14.1. ODC effective interest rate - deposit interest rates
(New contracts, unless otherwise indicated)
Description
Deposit
rates
Nonfinancial corporations Households
Transfer
able
deposits
Other deposits Savin
g
depos
its
Transfer
able
deposits
Other deposits Saving
deposi
ts Less than 250.000 euro More than 250.000
euro
Up to
1
mont
h
Over
1
mont
h and
up to
3
mont
hs
Over
3
mont
hs
and
up 6
mont
hs
Over
6
mont
hs
and
up 1
year
Ove
r 1
year
and
up 2
year
s
Over
2year
s Up to
1
month
Over 1
month
and up
to 3
months
Over 6
months
and up
1 year
Over
2years
Up to
1
month
Over 1
month
and up
to 3
months
Over 6
months
and up
1 year
2005 December 3.1 0.3 2.1 2.4 3.4 * 2.9 * * 1.7 0.0 1.8 2.2 * 3.3 3.9 4.0 1.7
2006 December 3.1 0.4 2.1 2.9 4.3 * 3.1 * * 1.5 0.0 1.9 2.3 * 3.4 4.2 4.5 1.7
2007 December 4.0 0.5 2.7 2.9 4.4 * 4.3 4.1 * 2.4 0.0 2.6 2.7 * 3.6 4.7 5.3 2.3
2008 December 4.4 0.5 3.1 4.0 5.3 * 3.6 4.9 * 2.9 0.1 3.2 4.6 * 4.5 5.0 3.9 2.7
2009 December 4.0 0.7 3.4 3.4 5.0 * 3.9 4.9 * 2.6 0.3 3.1 3.3 * 4.4 5.0 5.5 2.5
2010 December 3.4 0.6 2.4 3.1 5.0 5.1 * 3.7 * 2.1 0.6 2.6 2.6 3.1 4.5 4.8 5.1 2.2
2011 December 3.6 0.9 2.2 2.9 4.9 5.1 2.6 3.9 5.2 2.2 0.5 2.5 2.5 2.9 4.2 4.6 5.4 2.1
2012 December 3.7 0.8 * 2.8 * * 2.7 4.0 4.8 2.1 0.5 2.3 2.5 2.8 4.2 4.5 4.8 2.1
2013 June 3.5 0.9 * * 3.6 * * * * 2.0 0.6 2.0 2.7 2.5 3.9 4.4 4.9 1.6
July 3.6 0.7 * 2.5 * * * * * 2.0 0.8 2.3 2.2 2.5 3.7 4.5 5.0 1.6
August 3.4 0.7 * * * * 1.7 * 4.8 2.0 0.4 2.3 2.1 2.6 3.7 4.3 4.6 1.6
September 3.4 0.6 0.6 * * 4.2 * 2.6 * 2.0 0.5 2.1 2.5 2.5 3.6 4.4 4.9 1.6
October 3.3 0.6 1.3 2.3 * * 0.0 * * 2.0 0.4 2.0 2.1 2.3 3.5 4.3 4.8 1.6
November 3.2 0.4 0.5 0.6 * * * * * 1.8 0.4 1.8 2.1 2.3 3.4 4.1 4.7 1.6
December 2.4 0.5 0.8 * 0.5 * * * * 1.7 0.5 1.7 1.7 2.0 2.9 3.4 4.0 1.7
January 2.7 0.1 0.8 * 2.4 3.7 * * * * 0.3 1.6 1.7 1.9 2.8 3.3 3.8 1.4
February 2.0 0.3 0.8 0.9 1.5 * * * * * 0.3 0.9 1.3 1.8 2.1 2.7 * 1.1
March 1.7 0.4 0.5 0.5 * * * * * * 0.2 0.8 * 1.5 1.4 2.8 * 0.8
April 0.6 0.2 0.6 0.5 0.4 * * * * * 0.1 0.4 0.4 0.3 0.7 0.8 1.4 0.7
May 0.6 0.2 0.6 0.6 0.7 0.5 0.1 * * 0.6 0.1 0.4 0.3 0.3 0.7 0.8 1.5 0.7
June 0.6 0.2 0.4 0.6 * 0.1 0.0 * * 0.6 0.1 0.3 0.2 0.3 0.6 0.9 1.4 0.5
July 0.7 0.1 0.2 * * * * * 0.1 0.6 0.1 0.3 0.4 0.3 0.6 1.1 1.6 0.7
August 0.9 0.2 * 0.5 * 2.0 … * * 0.6 0.1 0.3 0.4 0.3 0.8 1.3 1.8 0.5
September 1.0 0.2 * 0.5 0.8 * … * * 0.6 … 0.3 0.4 0.2 0.8 1.4 1.9 0.5
October 0.5 0.1 * * 0.9 * 0.1 * * 0.4 … 0.3 0.4 0.2 0.6 0.6 * 0.5
November 0.6 0.2 1.0 * 0.9 * * * 0.7 0.5 0.02 0.2 0.4 0.2 0.7 0.3 1.6 0.4
2014 December 1.1 0.1 0.2 * * * * * 1.9 0.7 0.01 0.2 0.5 0.3 0.7 0.9 2.0 0.6
2015 January 0.8 0.1 0.1 * 0.1 * * * 0.6 0.6 0.01 0.2 0.6 0.3 0.6 1.1 1.9 0.4
February 0.8 0.1 0.2 1.3 1.3 * * * 0.1 0.1 0.01 0.3 0.5 0.3 0.6 1.0 1.6 0.4
March 0.8 0.1 0.2 0.0 0.7 * * * 1.1 0.1 0.01 0.4 0.5 0.2 0.6 0.6 1.3 0.3
April 0.8 0.1 0.3 1.6 0.5 * * * 1.2 0.1 0.01 0.2 0.7 0.2 0.5 0.6 1.8 0.3
May 0.9 0.1 0.7 1.5 0.1 * * * 0.9 0.1 0.01 0.2 0.5 0.3 0.6 1.0 1.8 0.3
June 0.8 0.1 1.0 1.4 * * * * * 0.1 0.01 0.4 0.7 0.3 0.5 0.9 1.7 0.3
July 0.8 0.1 0.7 * 1.6 2.6 * * 1.7 0.1 0.01 0.3 0.7 0.6 0.6 0.9 1.7 0.3
August 1.0 0.1 1.4 0.6 * 1.8 * 0.7 * 0.1 0.01 0.3 0.8 0.3 0.8 1.2 2.3 0.3
September 0.9 0.1 0.8 0.5 0.6 * * * * 0.1 0.01 0.6 0.6 0.4 0.8 0.7 2.0 0.3
October 0.9 0.1 0.9 * 1.1 * * * 1.1 0.1 0.01 0.6 0.4 0.5 0.7 0.7 2.1 0.3
November 1.0 0.1 1.0 0.5 0.5 * * * 1.7 0.1 0.01 0.5 0.6 0.5 0.9 1.1 1.7 0.3
December 1.2 0.1 0.9 0.6 1.5 3.2 * * 1.5 0.1 0.01 0.2 0.7 0.5 0.9 1.4 2.2 0.3

| 55
Buletini Mujor Statistikor
December 2015 Monthly Statistics Bulletin
Table 14.2. ODC effective interest rate - loan interest rates
(New contracts, unless otherwise indicated)
Description
Interest rate on loans /
1
Nonfinancial corporations (Loans) Households (Loans)
Investment business loans
Other business loans Overdrafts
(outstanding
amounts) 2/
Credit lines
(outstanding
amounts)
Loans with favourable
conditions /4
Overdrafts (outstandin
g amounts) 2/
Loans with favourable
conditions /4
Consumer loans
Mortgage loans / 3
Up to 1
year
Over 1
year and
up to 5
years
Over 5
years
Up to 1 year
Over 1 year
and up to
5 years
Over 5 years
Up to 1 year
Over 1 year
and up to 5
years
Over 5
years
Cash over loans
Other loans
Cash over loans
Other loans
2005 December 14.5 17.3 13.3 13.3 15.2 14.4 … 15.1 11.5 … * * … * 11.5 * * *
2006 December 14.7 * 14.5 14.5 13.6 15.2 … 15.7 12.4 … * * … * 12.4 * 13.4 *
2007 December 14.1 * 13.8 13.8 * 14.6 … 15.1 13.7 … * * … * 13.7 12.9 12.4 *
2008 December 13.8 * 13.9 13.9 14.2 13.4 … 15.0 13.5 … * 19.5 … … 13.5 9.8 10.8 8.1
2009 December 14.1 * 14.3 14.3 * … * * … * 17.8 … … 13.3 * 10.7 *
2010 December 14.3 16.1 13.9 * 18.7 14.4 * 12.7 13.3 7.7 * 22.6 6.6 8.6 14.6 * 11.7 10.3
2011 December 13.9 17.1 13.6 * 16.4 13.8 * 11.8 12.1 6.1 9.9 16.4 6.0 8.6 14.0 14.3 12.0 10.8
2012 December 12.9 15.4 12.0 10.2 15.3 13.7 * 10.7 11.9 5.9 * 12.5 6.1 8.0 13.1 * 10.8 9.8
2013 June 12.0 12.9 11.5 9.4 14.2 13.5 8.7 10.3 11.9 6.7 * 13.2 6.8 8.9 12.2 13.6 11.2 9.8
July 12.6 13.0 12.3 * 13.9 13.7 14.2 9.3 11.4 3.7 * 14.3 7.4 8.4 12.5 11.2 11.0 9.8
August 12.0 13.8 11.3 10.9 14.3 13.1 11.1 10.8 10.7 5.4 11.0 16.6 5.7 5.4 12.4 * 11.0 9.7
September 12.2 13.1 11.9 * 13.8 12.7 13.8 10.1 10.8 5.3 * 15.8 6.5 10.1 12.2 * 10.9 9.2
October 11.7 13.6 11.7 10.2 12.5 12.5 14.6 10.5 12.7 5.8 * 16.4 6.5 10.1 12.0 9.9 10.7 9.2
November 12.2 13.8 11.3 11.9 14.5 13.5 * 9.4 11.9 * * 15.9 6.0 9.8 12.5 13.8 10.4 9.5
December 11.1 12.3 10.9 9.5 11.6 12.9 * 9.4 11.0 6.0 * 14.4 4.6 7.3 11.7 * 10.4 9.0
2014 January 11.7 13.1 11.6 10.5 11.9 13.0 * 8.8 12.9 5.9 * 14.6 5.0 7.5 11.8 10.9 9.7 9.0
February 11.8 10.1 11.6 11.1 11.8 12.5 * 8.8 11.0 3.4 * 13.8 5.0 6.3 12.0 11.3 9.9 9.0
March 11.2 11.1 10.9 11.8 11.4 12.6 9.0 9.8 10.9 6.6 9.8 14.6 3.9 4.3 11.3 * 9.7 9.0
April 10.7 11.7 10.3 9.9 10.3 12.5 * 9.4 11.0 4.0 10.8 14.0 4.3 4.1 11.2 9.3 9.8 9.2
May 10.5 11.9 10.0 10.2 11.1 12.1 7.6 9.9 12.0 6.8 3.7 11.8 3.9 4.8 10.7 * 9.4 8.7
June 10.6 12.1 9.9 11.0 10.6 12.2 12.1 9.4 11.3 4.2 * 14.3 4.6 3.6 10.9 9.8 9.5 9.1
July 10.8 10.1 10.3 11.4 10.9 11.5 * 9.6 10.6 6.0 * 13.6 4.0 4.5 10.9 8.9 9.2 9.3
August 10.7 11.4 11.0 9.4 10.3 11.2 13.5 9.5 10.2 3.7 * 13.4 4.2 4.0 11.0 * 9.9 8.3
September 10.8 11.8 10.9 10.0 10.6 10.9 * 9.1 11.2 2.9 * 13.4 3.3 4.0 10.9 9.5 9.6 8.7
October 10.4 12.4 10.8 9.3 9.9 10.8 10.1 9.4 11.0 3.1 * 13.8 2.9 4.5 10.4 12.4 9.2 8.6
November 9.9 11.2 10.3 9.1 10.6 10.5 * 8.9 11.9 * * 13.3 2.7 * 9.9 * 9.1 8.0
December 9.2 10.8 9.8 8.4 9.5 10.2 11.8 9.3 11.8 2.2 * 12.9 3.2 2.3 9.1 8.8 8.0 7.8
2015 January 9.6 11.3 10.8 7.9 9.4 10.7 14.1 9.3 9.3 0.0 * 15.5 3.1 * 10.0 10.8 8.0 8.1
February 9.3 * 10.2 7.8 9.0 9.6 9.8 8.1 10.2 2.2 * 12.5 3.0 * 10.0 * 8.0 7.8
March 8.9 10.5 9.4 7.2 8.8 9.7 9.0 8.5 11.0 4.8 * 12.7 3.9 * 9.0 8.7 8.1 7.7
April 8.3 9.0 8.2 7.2 8.7 9.4 11.7 8.3 9.3 2.7 * 12.8 2.4 7.9 8.8 * 7.5 7.7
May 7.9 8.5 7.5 6.6 7.3 9.1 12.1 8.6 9.6 3.3 * 13.2 3.3 * 8.5 * 7.2 7.0
June 7.6 * 7.2 7.1 7.6 7.9 11.5 7.6 9.9 2.7 * 13.1 2.9 6.7 8.4 * 7.7 7.0
July 8.1 10.5 7.8 7.2 7.4 8.5 10.4 8.0 9.1 3.1 * 13.1 3.6 7.8 8.8 9.8 7.3 7.5
August 7.9 11.0 8.0 7.1 8.4 8.9 13.3 7.6 10.1 2.7 * 13.5 2.4 8.0 9.0 5.8 7.4 7.1
September 7.9 9.0 7.7 7.1 7.4 9.0 10.4 7.3 9.5 2.9 * 12.3 2.8 7.1 8.8 * 7.2 6.9
October 8.2 7.3 8.3 7.6 7.2 9.0 9.2 7.4 8.4 2.4 * 13.1 3.5 6.8 8.8 * 7.1 6.9
November 8.2 6.3 8.0 8.0 7.3 8.5 10.9 7.2 10.1 2.7 * 13.1 3.0 7.1 8.8 * 7.4 6.9
December 7.7 8.0 7.2 7.0 8.0 7.8 6.9 7.1 8.5 0.0 * 12.7 3.1 7.1 8.7 * 7.3 6.8

56 |
Monthly Statistics Bulletin December 2015
Table 15.1. ODC income statement - income and expenditures
(In millions of euro: Cumulative data during the year)
Description
Net profit / loss for period
Net operating profit
Net gains or losses arising for revaluations ( +/-)
Provisions for taxes Income Expenditures
Interest
income
of which: Non-Interest income
of which: Interest expenditures
Non-Interest
expenditures
of which: General and
administrative
expenses
Loans Securities Fees and commissi
ons
Deposits Provisions for loan
and other
assets losses
2007 December 33.5 41.5 157.3 117.9 103.0 3.6 39.5 23.8 115.8 26.0 23.2 20.1 17.8 69.7 -0.2 7.9
2008 December 26.0 38.0 195.0 155.7 140.4 2.3 39.3 30.2 157.0 43.1 35.1 27.7 22.8 86.2 -1.5 10.5
2009 December 27.4 31.4 203.3 164.6 159.6 1.2 38.7 32.7 171.9 52.1 48.1 33.4 26.4 86.4 -1.1 2.8
2010 December 32.8 38.2 217.2 175.8 169.6 3.1 41.4 37.5 179.0 55.3 49.4 35.6 28.3 88.1 -1.2 4.3
2011 December 36.0 41.3 240.1 195.1 186.3 4.2 45.0 41.7 198.8 58.4 51.3 43.2 34.8 97.1 -1.2 4.2
2012 December 18.5 22.5 247.0 200.5 194.9 3.0 46.6 44.2 224.6 63.1 57.6 59.1 50.3 102.4 -0.7 3.3
2013 July 17.7 18.9 144.6 116.5 113.2 1.4 28.1 26.0 125.6 37.2 34.4 31.0 25.7 57.5 0.9 2.2
August 18.7 20.1 165.9 133.1 129.4 1.5 32.8 30.0 145.8 42.4 39.2 37.8 31.6 65.5 1.0 2.5
September 22.4 23.9 186.1 149.0 145.0 1.7 37.0 33.8 162.2 47.7 43.9 40.9 33.9 73.7 1.1 2.6
October 25.7 27.6 206.8 165.7 161.1 1.9 41.1 37.8 179.2 53.1 48.8 44.2 36.5 81.9 1.1 3.0
November 23.6 25.7 226.7 181.7 176.5 2.1 45.0 41.5 201.0 58.4 53.4 52.1 43.6 90.4 1.2 3.3
December 26.0 28.0 247.8 198.2 192.5 2.3 49.6 45.6 219.8 63.8 58.0 55.5 46.1 100.5 1.2 3.2
2014 January 2.9 3.5 20.0 16.0 15.4 0.2 4.0 3.6 16.6 5.0 4.5 3.6 2.5 8.0 0.0 0.6
February 5.4 6.2 38.9 31.2 30.1 0.4 7.7 7.0 32.6 9.4 8.3 7.6 5.4 15.7 0.1 1.0
March 9.8 10.8 59.3 47.7 46.0 0.6 11.6 10.6 48.5 13.7 12.0 10.8 7.7 24.0 0.1 1.2
April 12.5 14.0 79.5 63.9 61.5 0.8 15.7 14.5 65.5 17.9 15.6 15.4 11.5 32.3 0.2 1.7
May 19.4 21.7 100.4 80.6 77.7 1.0 19.8 18.6 78.7 22.0 19.0 16.6 11.7 40.2 0.2 2.5
June 26.9 29.7 121.3 97.1 93.6 1.2 24.2 22.4 91.6 25.8 22.1 17.3 11.8 48.5 0.2 3.1
July 31.5 34.9 142.4 115.0 111.0 1.5 27.4 25.3 107.5 29.5 25.2 21.2 14.7 56.9 0.3 3.7
August 40.7 44.6 163.4 132.0 127.5 1.7 31.3 29.2 118.7 32.8 27.9 20.9 13.5 65.1 0.3 4.3
September 46.9 51.4 183.1 147.8 142.7 2.0 35.3 32.9 131.6 35.9 30.3 22.4 14.2 73.4 0.4 4.9
October 49.6 54.4 202.9 163.6 158.0 2.2 39.3 36.8 148.6 38.6 32.5 28.1 19.0 81.8 0.5 5.3
November 54.0 59.1 222.6 179.5 173.4 2.5 43.1 40.3 163.5 41.2 34.5 31.6 21.7 90.7 0.5 5.7
December 60.1 66.4 243.7 195.9 189.5 2.9 47.8 44.5 177.4 44.0 36.4 31.6 20.5 101.8 0.5 6.8
2015 January 5.7 5.9 20.8 16.5 16.1 0.3 4.3 3.8 14.9 2.3 1.8 4.6 3.7 7.9 0.6 0.8
February 12.9 13.8 39.1 31.2 30.3 0.6 7.9 7.2 25.3 4.3 3.3 5.1 3.4 15.9 0.6 1.4
March 19.9 21.5 59.2 47.2 45.8 1.0 12.0 11.0 37.7 6.4 4.9 6.8 4.2 24.5 0.5 2.0
April 28.7 31.5 79.7 62.9 60.9 1.3 16.8 14.8 48.2 8.6 6.3 6.5 2.9 33.1 0.6 2.8
May 39.2 42.7 101.4 78.3 76.2 1.7 23.1 18.5 58.7 10.2 7.7 7.9 2.9 40.6 0.8 3.6
June 46.2 46.2 119.7 94.3 91.6 2.1 24.6 22.4 68.9 12.1 9.1 7.2 1.7 49.6 0.8 4.6
July 52.6 47.3 139.9 110.2 107.0 2.5 29.0 26.6 87.3 14.0 10.5 10.0 3.4 58.0 0.7 5.3
August 59.7 53.9 159.6 125.6 121.9 2.8 33.2 30.8 99.9 15.9 11.9 9.1 1.2 69.1 0.8 5.8
September 69.3 69.3 179.2 140.8 136.5 3.2 37.6 34.7 109.9 17.6 13.1 8.9 … 76.3 0.9 7.1
October 66.7 74.6 198.8 156.2 151.3 3.7 41.7 38.7 123.3 19.4 14.3 10.1 0.2 86.0 1.0 7.9
November 72.7 82.3 217.8 171.0 165.7 4.0 45.7 42.5 135.5 21.0 15.5 10.0 -0.9 95.9 1.0 8.6
December 83.8 94.7 238.2 186.0 180.4 4.4 51.1 47.1 143.5 22.6 16.7 3.6 -8.4 107.5 1.1 9.7
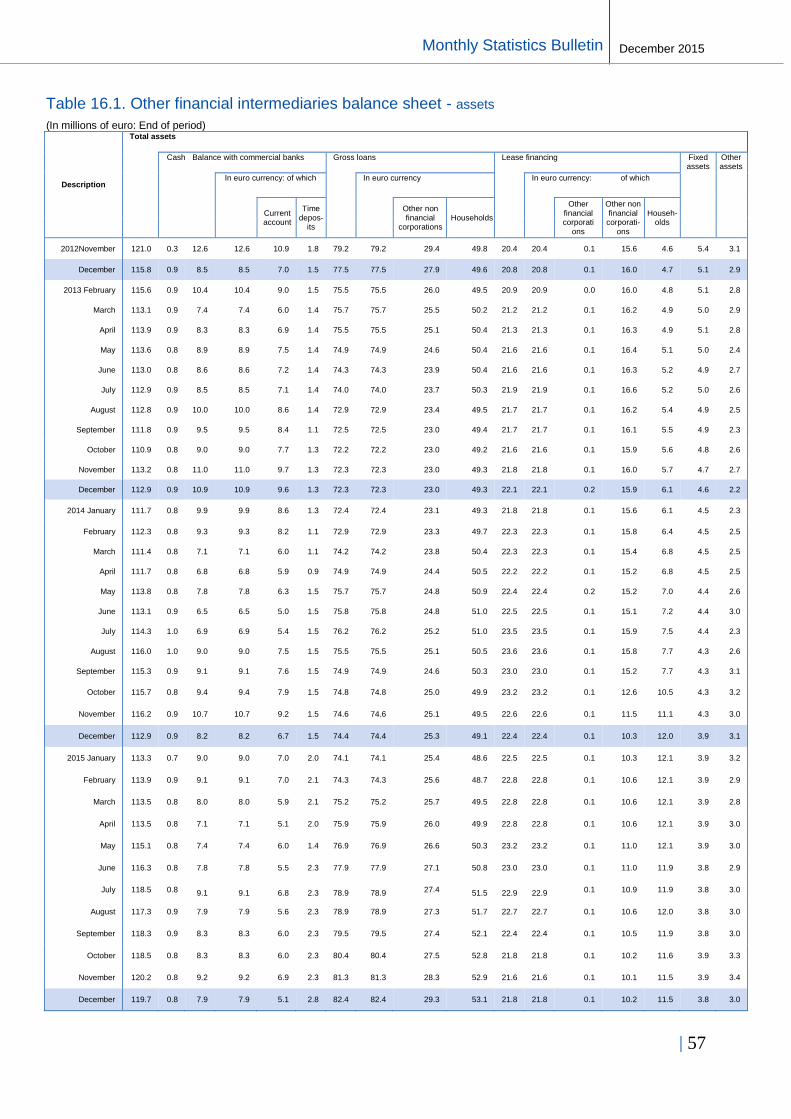
| 57
Buletini Mujor Statistikor
December 2015 Monthly Statistics Bulletin
Table 16.1. Other financial intermediaries balance sheet - assets
(In millions of euro: End of period)
Description
Total assets
Cash Balance with commercial banks Gross loans Lease financing Fixed assets
Other assets
In euro currency: of which In euro currency In euro currency: of which
Current account
Time depos-
its
Other non financial
corporations Households
Other financial corporati
ons
Other non financial
corporati-ons
Househ-olds
2012November 121.0 0.3 12.6 12.6 10.9 1.8 79.2 79.2 29.4 49.8 20.4 20.4 0.1 15.6 4.6 5.4 3.1
December 115.8 0.9 8.5 8.5 7.0 1.5 77.5 77.5 27.9 49.6 20.8 20.8 0.1 16.0 4.7 5.1 2.9
2013 February 115.6 0.9 10.4 10.4 9.0 1.5 75.5 75.5 26.0 49.5 20.9 20.9 0.0 16.0 4.8 5.1 2.8
March 113.1 0.9 7.4 7.4 6.0 1.4 75.7 75.7 25.5 50.2 21.2 21.2 0.1 16.2 4.9 5.0 2.9
April 113.9 0.9 8.3 8.3 6.9 1.4 75.5 75.5 25.1 50.4 21.3 21.3 0.1 16.3 4.9 5.1 2.8
May 113.6 0.8 8.9 8.9 7.5 1.4 74.9 74.9 24.6 50.4 21.6 21.6 0.1 16.4 5.1 5.0 2.4
June 113.0 0.8 8.6 8.6 7.2 1.4 74.3 74.3 23.9 50.4 21.6 21.6 0.1 16.3 5.2 4.9 2.7
July 112.9 0.9 8.5 8.5 7.1 1.4 74.0 74.0 23.7 50.3 21.9 21.9 0.1 16.6 5.2 5.0 2.6
August 112.8 0.9 10.0 10.0 8.6 1.4 72.9 72.9 23.4 49.5 21.7 21.7 0.1 16.2 5.4 4.9 2.5
September 111.8 0.9 9.5 9.5 8.4 1.1 72.5 72.5 23.0 49.4 21.7 21.7 0.1 16.1 5.5 4.9 2.3
October 110.9 0.8 9.0 9.0 7.7 1.3 72.2 72.2 23.0 49.2 21.6 21.6 0.1 15.9 5.6 4.8 2.6
November 113.2 0.8 11.0 11.0 9.7 1.3 72.3 72.3 23.0 49.3 21.8 21.8 0.1 16.0 5.7 4.7 2.7
December 112.9 0.9 10.9 10.9 9.6 1.3 72.3 72.3 23.0 49.3 22.1 22.1 0.2 15.9 6.1 4.6 2.2
2014 January 111.7 0.8 9.9 9.9 8.6 1.3 72.4 72.4 23.1 49.3 21.8 21.8 0.1 15.6 6.1 4.5 2.3
February 112.3 0.8 9.3 9.3 8.2 1.1 72.9 72.9 23.3 49.7 22.3 22.3 0.1 15.8 6.4 4.5 2.5
March 111.4 0.8 7.1 7.1 6.0 1.1 74.2 74.2 23.8 50.4 22.3 22.3 0.1 15.4 6.8 4.5 2.5
April 111.7 0.8 6.8 6.8 5.9 0.9 74.9 74.9 24.4 50.5 22.2 22.2 0.1 15.2 6.8 4.5 2.5
May 113.8 0.8 7.8 7.8 6.3 1.5 75.7 75.7 24.8 50.9 22.4 22.4 0.2 15.2 7.0 4.4 2.6
June 113.1 0.9 6.5 6.5 5.0 1.5 75.8 75.8 24.8 51.0 22.5 22.5 0.1 15.1 7.2 4.4 3.0
July 114.3 1.0 6.9 6.9 5.4 1.5 76.2 76.2 25.2 51.0 23.5 23.5 0.1 15.9 7.5 4.4 2.3
August 116.0 1.0 9.0 9.0 7.5 1.5 75.5 75.5 25.1 50.5 23.6 23.6 0.1 15.8 7.7 4.3 2.6
September 115.3 0.9 9.1 9.1 7.6 1.5 74.9 74.9 24.6 50.3 23.0 23.0 0.1 15.2 7.7 4.3 3.1
October 115.7 0.8 9.4 9.4 7.9 1.5 74.8 74.8 25.0 49.9 23.2 23.2 0.1 12.6 10.5 4.3 3.2
November 116.2 0.9 10.7 10.7 9.2 1.5 74.6 74.6 25.1 49.5 22.6 22.6 0.1 11.5 11.1 4.3 3.0
December 112.9 0.9 8.2 8.2 6.7 1.5 74.4 74.4 25.3 49.1 22.4 22.4 0.1 10.3 12.0 3.9 3.1
2015 January 113.3 0.7 9.0 9.0 7.0 2.0 74.1 74.1 25.4 48.6 22.5 22.5 0.1 10.3 12.1 3.9 3.2
February 113.9 0.9 9.1 9.1 7.0 2.1 74.3 74.3 25.6 48.7 22.8 22.8 0.1 10.6 12.1 3.9 2.9
March 113.5 0.8 8.0 8.0 5.9 2.1 75.2 75.2 25.7 49.5 22.8 22.8 0.1 10.6 12.1 3.9 2.8
April 113.5 0.8 7.1 7.1 5.1 2.0 75.9 75.9 26.0 49.9 22.8 22.8 0.1 10.6 12.1 3.9 3.0
May 115.1 0.8 7.4 7.4 6.0 1.4 76.9 76.9 26.6 50.3 23.2 23.2 0.1 11.0 12.1 3.9 3.0
June 116.3 0.8 7.8 7.8 5.5 2.3 77.9 77.9 27.1 50.8 23.0 23.0 0.1 11.0 11.9 3.8 2.9
July 118.5 0.8 9.1 9.1 6.8 2.3 78.9 78.9 27.4 51.5 22.9 22.9 0.1 10.9 11.9 3.8 3.0
August 117.3 0.9 7.9 7.9 5.6 2.3 78.9 78.9 27.3 51.7 22.7 22.7 0.1 10.6 12.0 3.8 3.0
September 118.3 0.9 8.3 8.3 6.0 2.3 79.5 79.5 27.4 52.1 22.4 22.4 0.1 10.5 11.9 3.8 3.0
October 118.5 0.8 8.3 8.3 6.0 2.3 80.4 80.4 27.5 52.8 21.8 21.8 0.1 10.2 11.6 3.9 3.3
November 120.2 0.8 9.2 9.2 6.9 2.3 81.3 81.3 28.3 52.9 21.6 21.6 0.1 10.1 11.5 3.9 3.4
December 119.7 0.8 7.9 7.9 5.1 2.8 82.4 82.4 29.3 53.1 21.8 21.8 0.1 10.2 11.5 3.8 3.0

58 |
Monthly Statistics Bulletin December 2015
Table 16.2. Other financial intermediaries balance sheet - liabilities
(In millions of euro: End of period)
Description
Total liabilities
Other
accounts payable
Own resources
Domestic Share
capital Contigency
reserves General reserves
Profit/loss of the year
Retained profit/loss
Non residents
2012 Auugust 122.1 90.4 21.7 31.7 17.1 0.1 2.2 -3.2 13.2 2.4
September 120.9 89.1 21.3 31.8 17.7 0.1 2.2 -3.9 13.3 2.4
October 120.8 88.9 21.9 31.9 17.8 0.1 2.2 -3.9 13.3 2.4
November 121.0 89.7 22.9 31.3 17.9 0.1 2.2 -4.5 13.3 2.4
December 115.8 84.6 21.4 31.2 17.9 0.1 2.2 -4.5 13.1 2.4
2013 January 114.4 83.4 31.0 31.0 17.9 0.1 1.0 0.1 9.5 2.4
February 115.6 84.8 30.8 30.8 17.1 __ 1.0 0.1 9.4 3.1
March 113.1 82.9 11.8 30.2 17.2 __ 1.0 -0.5 9.4 3.1
April 113.9 84.2 84.2 29.7 16.6 __ 1.0 -0.6 9.5 3.1
May 113.6 83.4 83.4 30.3 16.6 __ 1.0 -0.6 10.2 3.1
June 113.0 82.7 82.7 30.2 16.8 __ 1.0 -0.6 9.9 3.1
July 112.9 82.9 82.9 29.9 17.0 __ 1.0 -1.1 9.9 3.1
August 112.8 82.8 82.8 30.0 17.1 __ 1.0 -1.1 9.9 3.1
September 111.8 81.7 81.7 30.1 17.3 __ 1.0 -1.1 9.9 3.1
October 110.9 80.3 80.3 30.6 17.9 __ 1.0 -1.3 9.9 3.1
November 113.2 82.6 82.6 30.6 18.0 __ 1.0 -1.4 9.9 3.1
December 112.9 83.5 83.5 29.4 17.3 __ 0.0 -0.2 9.1 3.1
2014 January 111.7 81.9 81.3 29.8 17.2 __ 0.0 -0.8 10.2 3.1
February 112.3 81.9 81.9 30.4 17.3 __ 0.0 -0.1 10.1 3.1
March 111.4 81.1 81.1 30.2 17.5 __ 0.0 -0.2 9.8 3.1
April 111.7 82.0 82.0 29.7 17.4 __ 0.0 0.0 9.2 3.1
May 113.8 84.0 84.0 29.8 17.4 __ 0.0 0.0 9.2 3.1
June 113.1 83.4 83.4 29.7 17.4 __ 0.0 0.0 9.2 3.1
July 114.3 84.5 84.5 29.8 17.3 __ 0.0 0.1 9.2 3.1
August 116.0 86.0 86.0 30.0 17.4 __ 0.0 0.3 9.2 3.1
September 115.3 84.7 84.7 30.6 17.4 __ 0.0 0.9 9.2 3.1
October 115.7 85.1 85.1 30.7 17.4 __ 0.0 1.0 9.2 3.1
November 116.2 85.4 85.4 30.8 17.4 __ 0.0 1.0 9.2 3.1
December 112.9 82.5 82.5 30.4 17.4 __ 0.0 0.7 9.2 3.1
2015 January 113.3 82.2 82.2 31.1 17.4 __ 0.0 0.1 10.4 3.1
February 113.9 82.7 82.7 31.2 17.4 __ 0.0 0.4 10.2 3.1
March 113.5 82.4 82.4 31.2 17.5 __ 0.0 0.3 10.2 3.1
April 113.5 82.3 82.3 31.3 17.6 __ 0.0 0.6 9.9 3.1
May 115.1 83.6 83.6 31.5 17.6 __ 0.0 0.8 9.9 3.1
June 116.3 84.4 84.4 31.9 17.6 __ 0.0 1.2 9.9 3.1
July 118.5 86.3 86.3 32.2 17.6 __ 0.0 1.4 9.9 3.1
August 117.3 84.5 84.5 32.9 17.7 __ … 2.1 9.9 3.1
September 118.3 85.4 85.4 32.9 17.7 __ … 2.1 9.9 3.1
October 118.5 85.1 85.1 33.5 18.0 --- … 2.4 9.9 3.1
November 120.2 86.6 86.6 33.5 18.1 --- … 2.4 9.9 3.1
December 119.7 85.2 85.2 34.5 19.0 --- … 2.4 9.9 3.1

| 59
Buletini Mujor Statistikor
December 2015 Monthly Statistics Bulletin
Tabela 17.1. Other financial intermediaries loans – by maturity
(In millions of euro: End of period)
Description
Total loans
Financial corporations
Non financail corporations Households and other sectors Non residents
≤ 1 yar
>1 ≤ 2 years
> 2 ≤ 5 years
> 5 ≤ 10
years
> 10 years
≤ 1 yar
>1 ≤ 2 years
> 2 ≤ 5 years
> 5 ≤ 10
years
> 10 years
2012 December 77.5 __ 27.9 4.4 9.8 13.4 0.4 __ 49.6 8.1 24.6 16.7 0.2 … __
2013 February 75.5 __ 26.0 4.3 8.9 12.4 0.4 __ 49.5 8.5 24.5 16.3 0.2 … __
March 75.7 __ 25.5 4.4 8.7 12.0 0.3 __ 50.2 8.7 25.2 16.1 0.2 … __
April 75.5 __ 25.1 4.5 8.6 11.6 0.3 __ 50.4 8.9 25.1 16.2 0.2 … __
May 74.9 __ 24.6 4.7 8.3 11.3 0.3 __ 50.3 8.8 25.2 16.2 0.2 … __
June 74.3 __ 23.9 4.6 8.2 10.8 0.3 __ 50.4 8.9 25.1 16.3 0.2 … __
July 74.0 __ 23.7 4.7 8.2 10.5 0.3 __ 50.3 8.7 22.9 18.5 0.1 … __
August 72.9 __ 23.4 4.6 8.3 10.1 0.3 __ 49.5 8.6 24.0 16.5 0.4 … __
September 72.5 __ 23.0 4.4 8.1 10.2 0.3 __ 49.4 8.1 24.8 16.4 0.1 … __
October 72.2 __ 23.0 4.3 8.3 10.1 0.3 __ 49.2 7.6 24.5 16.9 0.1 … __
November 72.3 __ 23.0 4.2 8.4 10.1 0.3 __ 49.3 7.5 24.7 16.8 0.3 … __
December 72.3 __ 23.0 4.1 8.6 10.0 0.3 __ 49.3 7.5 20.3 21.2 0.3 … __
2014 January 72.4 __ 23.1 4.1 8.9 9.8 0.3 __ 49.3 7.6 24.4 17.2 0.1 … __
February 72.9 __ 23.3 4.1 9.1 9.7 0.3 __ 49.7 7.8 24.5 17.3 0.1 … __
March 74.2 __ 23.8 4.3 9.4 9.9 0.2 __ 50.4 8.4 24.2 17.7 0.1 … __
April 74.9 __ 24.4 4.3 9.8 10.0 0.2 __ 50.5 7.9 24.0 18.6 0.1 … __
May 75.7 __ 24.8 4.2 10.1 10.3 0.2 __ 50.9 8.4 24.2 18.2 0.1 … __
June 75.8 __ 24.8 4.0 10.2 10.4 0.2 __ 51.0 8.4 23.7 18.7 0.1 … __
July 76.2 __ 25.2 3.9 10.3 10.7 0.2 __ 51.0 8.3 23.9 18.8 0.1 … __
August 75.5 __ 25.1 4.0 10.4 10.5 0.2 __ 50.5 8.0 23.4 19.0 0.1 … __
September 74.9 __ 24.6 3.2 10.7 10.6 0.2 __ 50.3 7.8 23.3 19.1 0.1 … __
October 74.8 __ 25.0 3.2 10.8 10.8 0.2 __ 49.9 7.5 23.0 19.2 0.1 … __
November 74.6 __ 25.1 3.0 10.9 11.0 0.2 __ 49.5 7.5 22.8 19.2 0.1 … __
December 74.4 __ 25.3 2.7 11.3 11.2 0.2 __ 49.1 7.3 22.5 19.2 0.1 … __
2015 January 74.1 __ 25.4 2.5 11.1 11.6 0.2 __ 48.6 7.4 22.1 19.0 0.1 … __
February 74.3 __ 25.6 2.7 11.0 11.7 0.2 __ 48.7 7.6 21.9 19.1 0.1 … __
March 75.2 __ 25.7 2.7 11.0 11.9 0.2 __ 49.5 8.0 22.1 19.3 0.1 … __
April 75.9 __ 26.0 2.8 10.8 12.3 0.2 __ 49.9 8.6 21.6 19.6 0.1 … __
May 76.9 __ 26.6 3.2 10.6 12.6 0.1 __ 50.3 8.7 21.7 19.8 0.1 … __
June 77.9 __ 27.1 3.4 10.5 13.0 0.1 __ 50.8 8.7 21.7 20.3 0.1 … __
July 78.9 __ 27.4 3.5 10.5 13.3 0.1 __ 51.5 8.7 21.9 20.8 0.1 … __
August
78.9 __ 27.3 3.1 10.3 13.7 0.1 __ 51.7 8.9 21.7 21.0 0.1 … __
September 79.5 __ 27.4 3.1 10.3 13.8 0.1 __ 52.1 8.7 21.7 21.6 0.1 … __
October 80.4 --- 27.5 4.3 12.2 10.7 0.4 --- 52.8 11.7 25.0 15.4 0.8 … __
November 81.4 –– 28.3 4.7 12.2 11.0 0.4 __ 52.9 11.1 25.1 15.8 0.1 0.1 __
December 82.4 –– 29.3 4.6 12.5 11.8 0.3 __ 53.1 11.3 24.9 15.9 0.1 0.1 __

60 |
Monthly Statistics Bulletin December 2015
Table17.2. Other financial intermediaries balance sheet – economic sectors
(In millions of euro: End of period)
Description
Total loans
Agriculture Industry, energy and reconstruction Services
Mining Manufacturing Electricity, gas and water
Construction Trade Hotels and restaurants
Other trades
Financial services , real estate, rent, etc.
Other services
2012 September 31.0 9.0 7.8 __ 2.3 __ 5.4 14.2 5.9 1.4 0.3 0.6 6.0
October 30.1 8.7 7.8 __ 2.2 __ 5.5 13.6 5.4 1.3 0.3 0.6 6.0
November 29.4 8.5 7.5 __ 2.3 __ 5.3 13.3 5.2 1.2 0.3 1.1 5.4
December 27.9 8.0 7.4 __ 2.1 __ 5.3 12.5 4.8 1.1 0.3 0.8 5.4
2013 January 26.7 7.7 7.1 __ 2.0 __ 5.1 11.9 4.6 0.6 0.8 1.0 5.0
February 26.0 7.5 6.9 __ 1.8 __ 5.2 11.6 4.4 1.0 0.3 1.0 4.8
March 25.5 7.4 6.8 __ 1.7 __ 4.5 11.3 4.3 0.9 0.4 1.1 4.7
April 25.1 7.3 6.5 __ 1.7 __ 4.8 11.3 4.0 1.2 0.3 1.1 4.7
May 24.6 7.0 6.5 __ 1.7 __ 4.8 10.8 4.1 1.3 0.3 1.0 4.3
June 23.9 6.8 6.5 __ 1.7 __ 4.8 10.6 3.9 1.1 0.3 1.0 4.2
July 23.7 6.7 6.6 __ 1.7 __ 4.9 10.4 3.8 1.1 0.3 1.2 4.0
August 23.4 6.6 6.3 __ 1.8 __ 4.5 10.5 3.7 1.1 0.3 1.5 3.9
September 23.0 6.4 6.2 __ 1.8 __ 4.4 10.4 3.7 1.0 0.3 1.4 4.0
October 23.0 4.6 6.6 __ 1.8 __ 4.7 11.9 3.5 0.9 0.3 1.5 5.7
November 23.0 6.3 6.1 __ 1.8 __ 4.3 10.6 3.7 0.9 0.3 1.5 4.0
December 23.0 6.2 6.2 __ 1.8 __ 4.4 10.7 3.8 0.9 0.3 1.5 4.1
2014 January 23.1 6.2 6.1 __ 1.8 __ 4.3 10.7 3.8 0.9 0.3 1.9 3.8
February 23.3 6.2 6.1 __ 1.8 __ 4.3 10.9 3.9 0.8 0.3 1.8 3.9
March 23.8 6.3 6.3 __ 1.9 __ 4.5 11.1 4.1 0.9 0.3 2.1 3.7
April 24.4 6.5 6.5 __ 2.0 __ 4.5 11.4 4.2 0.9 0.4 1.8 4.1
May 24.8 6.8 6.5 __ 1.9 __ 4.6 11.5 4.3 0.9 0.4 1.8 4.2
June 24.8 6.9 6.5 __ 1.9 __ 4.6 11.4 4.3 0.9 0.4 1.7 4.1
July 25.2 6.8 6.7 __ 1.9 __ 4.8 11.7 4.5 1.1 0.4 1.7 4.1
August 25.1 6.7 6.7 __ 1.9 __ 4.8 11.6 4.4 0.9 0.4 2.2 3.7
September 24.6 6.5 6.6 __ 1.9 __ 4.8 11.5 4.4 0.8 0.5 2.1 3.7
October 25.0 6.4 6.8 __ 2.0 __ 4.8 11.8 4.5 0.9 0.5 2.2 3.8
November 25.1 6.5 6.8 __ 2.0 __ 4.8 11.8 4.5 0.8 0.5 2.2 3.8
December 25.3 6.4 7.1 __ 2.2 __ 5.0 11.8 4.5 0.8 0.5 2.2 3.8
2015 January 25.4 6.4 7.2 __ 2.2 __ 5.0 11.8 4.4 0.8 0.5 2.2 3.7
February 25.6 6.5 7.4 __ 2.2 __ 5.1 11.7 4.4 0.8 0.6 2.2 3.7
March 25.7 6.5 7.4 __ 2.3 __ 5.1 11.8 4.5 0.8 0.6 2.5 3.4
April 26.0 6.5 7.5 __ 2.3 __ 5.2 12.0 4.6 0.8 0.6 2.7 3.4
May 26.6 6.7 7.8 __ 2.2 __ 5.6 12.2 4.7 0.8 0.6 2.8 3.3
June 27.1 6.8 8.0 __ 2.3 __ 5.7 12.3 4.7 0.9 0.6 2.8 3.2
July 27.4 7.0 8.0 __ 2.3 __ 5.7 12.4 4.6 0.9 0.6 2.9 3.3
August 27.3 7.1 8.0 __ 2.3 __ 5.6 12.3 4.5 0.9 0.6 2.9 3.3
September 27.4 7.1 8.1 __ 2.3 __ 5.6 12.3 4.3 0.9 0.6 2.9 3.6
October 27.5 7.2 8.1 __ 2.5 ---- 5.5 12.2 4.8 1.0 0.6 3.0 3.5
November 28.3 7.4 8.3 __ 2.4 __ 5.7 12.6 4.8 1.0 0.6 3.2 3.5
December 29.3 7.4 8.6 0.1 2.6 __ 5.8 13.3 5.0 1.0 0.6 3.5 2.6

| 61
Buletini Mujor Statistikor
December 2015 Monthly Statistics Bulletin
Tabela 17.3. Other financial intermediaries loans – new loans
(In thousands of euro: Cumulative data during the reference month)
Description Total
Nonfinancial corporations and households
Nonfinancial corporations
Households Nonfinancial
corporations and households
Investing and noninvesting loans
Investing and noninvesting loans
Consumer loans Mortgages Other loans
No. Amount No. Amount No. Amount No. Amount No. Amount No. Amount
2012 August 2,409 5,073.7 562 1,312.7 1,426 2,914.8 256 384.8 58 301.2 107 160.2
September 2,556 5,594.4 555 1,392.7 1,623 3,308.6 211 284.3 53 246.2 114 362.6
October 3,020 6,388.8 486 1,487.3 1,847 3,712.1 539 781.6 40 234.9 108 172.8
November 2,897 6,557.3 458 1,559.3 1,784 3,503.9 491 739.9 31 569.6 133 184.8
December 3,276 6,884.5 544 1,741.3 2,066 3,886.3 505 751.7 26 169.2 135 336.0
2013 January 2,604 4,763.8 493 953.4 1,669 3,125.6 309 457.1 17 80.3 116 147.4
February 2,729 5,306.7 571 1,275.0 1,702 3,226.0 326 478.1 25 145.5 105 182.1
March 3,684 6,738.1 769 1,876.2 2,302 4,035.8 431 470.0 23 138.6 159 217.4
April 3,186 6,319.1 708 1,468.3 1,966 3,784.7 377 477.4 34 456.1 101 132.6
May 3,035 6,044.1 757 1,218.6 1,822 3,975.2 340 506.8 25 164.4 91 179.0
June 2,994 5,599.1 737 1,425.8 1,700 3,252.3 360 453.5 34 238.1 163 229.3
July 2,923 6,565.5 685 1,328.3 1,669 3,790.4 360 475.3 35 474.5 174 497.0
August 2,124 4,380.3 475 971.7 1,222 2,583.2 293 435.7 22 130.4 112 259.2
September 2,694 5,650.6 610 1,331.3 1,498 3,238.0 430 621.0 42 247.4 114 212.9
October 2,818 5,862.2 657 1,688.1 1,590 3,177.2 415 580.1 43 266.8 113 150.0
November 2,761 6,080.5 565 1,555.9 1,534 3,414.3 518 656.9 45 233.7 99 219.7
December 3,388 7,630.5 765 2,343.5 1,888 4,094.7 580 714.8 53 278.8 102 198.7
2014 January 2,737 5,349.3 532 1,223.4 1,642 3,136.1 455 639.8 37 188.7 71 161.3
February 2,978 6,475.1 609 1,519.0 1,798 3,772.9 452 591.0 48 464.4 71 127.8
March 3,687 7,285.8 849 1,925.6 1,965 4,109.7 706 734.4 58 291.2 109 225.0
April 3,432 6,383.4 814 1,901.6 1,763 3,417.0 733 686.5 44 234.5 78 143.9
May 3,621 7,202.3 975 2,327.1 1,654 2,833.3 705 744.3 64 311.7 223 985.8
June 3,466 6,948.0 927 2,090.7 1,603 2,771.8 738 837.7 76 383.1 122 864.7
July 3,304 7,700.0 888 2,719.7 1,517 2,704.4 692 774.1 54 247.0 153 1,254.8
August 2,532 5,340.1 693 1,712.6 1,189 2,526.0 522 642.9 59 329.6 69 129.0
September 3,090 6,006.4 909 1,992.2 1,474 2,794.4 611 945.2 29 154.0 67 120.6
October 3,140 6,551.0 964 2,572.5 1,476 2,873.4 583 741.2 34 192.1 83 171.8
November 2,828 6,345.6 848 2,215.8 1,358 3,099.8 496 661.7 35 182.9 91 185.4
December 3,500 7,568.2 1,053 2,852.1 1,620 3,088.7 673 1,076.5 39 210.6 115 340.2
2015 January 2,737 5,956.1 757 2,315.4 1,391 2,659.8 490 682.4 35 154.5 64 143.9
February 2,939 6,284.1 875 2,481.0 1,502 2,779.2 487 786.3 29 138.4 46 99.2
March 3,472 7,322.1 867 2,075.6 1,857 3,627.6 615 1,042.8 42 229.3 91 346.9
April 3,703 7,323.1 1,012 2,669.0 1,913 3,574.6 627 706.5 43 207.0 108 166.0
May 3,633 7,642.5 906 3,018.5 1,955 3,473.5 536 577.2 53 282.2 183 291.2
June 3,634 7,606.6 865 2,663.1 1,954 3,581.9 582 724.2 61 367.6 172 269.9
July 3,443 7,264.7 876 2,397.3 1,746 3,464.9 587 761.0 67 385.9 167 255.6
August 2,768 6,407.9 697 2,109.5 1,351 2,829.7 532 893.7 66 322.1 122 252.9
September 3,168 7,172.3 756 2,384.2 1,701 3,429.8 502 637.6 91 474.2 118 246.5
October 3,591 7,371.9 919 2,375.4 1,909 3,688.2 521 675.1 74 356.4 168 276.9
November 3,312 7,374.7 912 2,610.1 1,709 3,533.0 473 555.9 69 383.8 149 291.9
December 4,068 9,616.5 1,169 4,122.0 2,086 4,101.6 575 649.5 81 413.2 157 330.2

62 |
Monthly Statistics Bulletin December 2015
Table 17.4. Other financial intermediaries loans – non-fincancial corporations new loans
(In thousands of euro: Cumulative data during the reference month)
Description
Total
Nonfinancial corporations
Investment loans Noninvestment loans
Other loans
≤ 1 year > 1 year ≤ 5
years > 5 years ≤ 1 year
> 1 year ≤ 5 years
> 5 years
No. Amount No. Amount No. Amount No. Amount No. Amount No. Amount No. Amount No. Amount
2012 July 617.0 1,849.0 112.0 206.1 145.0 502.1 1.0 6.0 109.0 150.3 236.0 967.3 … … 14.0 17.1
August 582.0 1,341.4 109.0 161.9 137.0 374.7 … … 99.0 134.1 217.0 642.1 … … 20.0 28.8
September 576.0 1,627.0 99.0 289.3 148.0 410.1 … … 76.0 102.1 232.0 591.2 … … 21.0 234.3
October 514.0 1,553.1 114.0 75.3 137.0 483.7 … … 92.0 111.7 143.0 816.6 … … 28.0 65.7
November 482.0 1,588.0 122.0 259.7 183.0 853.6 2.0 18.3 61.0 74.0 90.0 353.7 … … 24.0 28.7
December 566.0 1,757.1 173.0 168.7 175.0 864.1 … … 93.0 145.9 103.0 562.7 … … 22.0 15.8
2013 January 526.0 980.6 167.0 218.4 167.0 470.7 … … 66.0 44.5 93.0 219.9 … … 33.0 27.2
February 606.0 1,346.4 212.0 272.3 173.0 403.4 … … 80.0 153.5 105.0 441.2 1.0 4.5 35.0 71.4
March 841.0 1,982.8 277.0 295.5 230.0 843.7 … … 121.0 202.6 141.0 534.4 … … 72.0 106.6
April 756.0 1,513.6 211.0 256.2 219.0 659.7 … … 96.0 152.6 182.0 399.9 … … 48.0 45.3
May 801.0 1,329.3 190.0 258.2 154.0 292.2 1.0 12.1 187.0 172.0 225.0 484.1 … … 44.0 110.7
June 790.0 1,486.8 212.0 340.1 206.0 532.4 … … 133.0 117.5 186.0 435.8 … … 53.0 60.9
July 795.0 1,709.5 182.0 227.6 230.0 580.0 … … 93.0 91.6 179.0 424.5 1.0 4.6 110.0 381.3
August 523.0 1,060.9 114.0 111.7 148.0 476.0 … … 84.0 106.4 129.0 277.6 … … 48.0 89.2
September 672.0 1,451.6 119.0 187.6 237.0 634.2 … … 115.0 145.6 139.0 363.9 … … 62.0 120.4
October 695.0 1,753.9 131.0 122.8 274.0 935.3 … … 119.0 121.3 132.0 504.0 1.0 4.7 38.0 65.9
November 605.0 1,626.2 138.0 201.1 229.0 838.3 … … 72.0 93.1 125.0 419.1 1.0 4.3 40.0 70.3
December 808.0 2,436.2 161.0 399.0 285.0 1,365.5 … … 132.0 129.0 187.0 450.1 … … 43.0 92.7
2014 January 562.0 1,303.5 128.0 153.8 189.0 708.4 … … 111.0 90.8 103.0 267.5 1.0 3.0 30.0 80.1
February 637.0 1,558.6 168.0 182.3 228.0 637.2 … … 92.0 124.9 121.0 574.6 … … 28.0 39.6
March 897.0 2,048.0 191.0 267.8 325.0 921.7 … … 146.0 145.8 187.0 590.3 … … 48.0 122.5
April 843.0 1,952.6 214.0 287.8 323.0 976.9 … … 99.0 105.6 178.0 531.4 … … 29.0 51.0
May 1,143.0 3,017.0 257.0 301.9 394.0 1,198.5 … … 97.0 106.4 226.0 718.9 1.0 1.5 168.0 689.9
June 989.0 2,629.3 248.0 286.7 398.0 1,165.5 … … 88.0 89.4 192.0 546.1 1.0 3.0 62.0 538.6
July 979.0 3,568.2 221.0 366.2 407.0 1,375.8 … … 87.0 91.8 173.0 885.9 … … 91.0 848.4
August 718.0 1,759.1 150.0 162.3 332.0 872.5 … … 71.0 77.0 140.0 600.8 … … 25.0 46.5
September 934.0 2,041.4 206.0 265.2 424.0 1,017.9 … … 90.0 97.1 189.0 612.1 … … 25.0 49.3
October 1,005.0 2,671.0 228.0 307.4 472.0 1,431.3 … … 77.0 87.7 187.0 746.1 … … 41.0 98.5
November 881.0 2,290.1 167.0 198.1 419.0 1,228.3 … … 70.0 73.0 192.0 716.5 … … 33.0 74.4
December 1,100.0 3,065.7 237.0 271.5 531.0 1,609.0 … … 76.0 70.0 209.0 901.7 … … 47.0 213.6
2015 January 785.0 2,399.7 195.0 242.8 369.0 1,268.5 … … 59.0 95.5 134.0 708.6 … … 28.0 84.3
February 897.0 2,525.6 235.0 244.3 392.0 1,087.9 … … 74.0 121.5 174.0 1,027.3 … … 22.0 44.6
March 903.0 2,339.8 259.0 300.5 428.0 1,137.4 … … 53.0 88.1 127.0 549.6 … … 36.0 264.2
April 1,049.0 2,751.4 285.0 323.2 514.0 1,508.1 … … 64.0 59.6 149.0 778.1 … … 37.0 82.4
May 965.0 3,181.2 256.0 541.1 449.0 1,328.4 … … 54.0 105.8 147.0 1,043.2 … … 59.0 162.8
June 934.0 2,834.4 251.0 400.9 435.0 1,474.0 … … 49.0 46.4 130.0 741.8 … … 69.0 171.3
July 966.0 2,557.6 215.0 334.7 446.0 1,288.5 … … 72.0 61.8 143.0 712.3 … … 90.0 160.3
August 753.0 2,258.9 164.0 304.7 384.0 1,305.5 … … 44.0 53.4 105.0 445.9 … … 56.0 149.4
September 821.0 2,564.8 162.0 200.9 406.0 1,412.3 … … 61.0 79.2 127.0 691.9 … … 65.0 180.7
October 990.0 2,522.1 217.0 265.3 523.0 1,564.8 … … 63.0 57.1 116.0 488.3 … … 71.0 146.7
November 998.0 2,806.5 253.0 324.3 454.0 1,521.9 … … 54.0 73.1 151.0 690.7 … … 86.0 196.4
December 1,253.0 4,355.7 242.0 483.3 587.0 2,110.7 … … 101.0 116.6 239.0 1,411.5 … … 84.0 233.7

| 63
Buletini Mujor Statistikor
December 2015 Monthly Statistics Bulletin
Tabela 17.5. Other financial intermediaries loans – household new loans (1)
(In thousands of euro: Cumulative data during the reference month)
Description Total
Households
Investment loans Noninvestment loans
≤ 1 year > 1 year ≤ 5 years > 5 years ≤ 1 year > 1 year ≤ 5 years > 5 years
No. Amount No. Amount No. Amount No. Amount No. Amount No. Amount No. Amount
2012 July 1,485 3,076.0 310 371.3 388 1,087.7 … … 322 302.6 465 1,314.4 … …
August 1,426 2,914.8 288 343.9 346 1,006.0 … … 324 334.7 467 1,178.5 1 51.8
September 1,623 3,308.6 259 345.7 373 1,078.5 … … 423 368.2 562 1,264.9 6 251.3
October 1,847 3,712.1 251 314.9 384 1,081.5 … … 518 463.2 692 1,740.1 2 112.5
November 1,784 3,503.9 284 355.2 407 1,130.1 … … 449 421.3 643 1,532.4 1 64.9
December 2,066 3,886.3 422 395.9 442 1,095.2 … … 518 516.9 683 1,838.3 1 40.0
2013 January 1,669 3,125.6 371 396.8 407 1,155.4 … … 457 423.1 434 1,150.3 … …
February 1,702 3,226.0 424 487.9 363 948.5 … … 494 463.4 419 1,199.6 2 126.7
March 2,302 4,035.8 432 479.8 448 1,120.6 … … 788 623.2 632 1,716.5 2 95.7
April 1,966 3,784.7 329 380.3 386 1,029.1 … … 626 574.0 623 1,734.3 2 67.0
May 1,822 3,975.2 366 407.2 356 961.7 … … 497 494.1 602 2,096.3 1 15.9
June 1,700 3,252.3 343 400.7 348 843.2 … … 431 402.4 575 1,438.1 3 167.8
July 1,669 3,790.4 376 433.6 391 1,003.9 … … 332 322.6 568 1,957.7 2 72.6
August 1,222 2,583.2 271 332.7 305 786.3 … … 221 261.9 420 1,036.7 5 165.6
September 1,498 3,238.0 331 349.7 335 943.9 … … 284 282.3 543 1,479.2 5 183.0
October 1,590 3,177.2 284 316.9 349 917.7 … … 388 358.7 564 1,443.3 5 140.6
November 1,534 3,414.3 276 292.0 368 955.3 … … 329 433.5 559 1,641.0 2 92.5
December 1,888 4,094.7 441 487.9 442 1,020.2 … … 365 382.0 632 1,812.0 8 392.6
2014 January 1,642 3,136.1 391 407.9 394 1,064.1 … … 344 362.2 512 1,257.7 1 44.2
February 1,798 3,772.9 391 458.8 370 1,063.9 … … 509 535.2 521 1,436.9 7 278.0
March 1,965 4,109.7 350 467.2 418 1,184.3 … … 588 524.8 600 1,524.0 9 409.4
April 1,763 3,417.0 373 424.3 365 977.2 … … 454 388.2 568 1,477.7 3 149.5
May 1,654 2,833.3 314 366.2 352 941.3 … … 436 396.8 552 1,129.0 … …
June 1,603 2,771.8 354 401.6 331 867.6 … … 352 326.2 566 1,176.4 … …
July 1,517 2,704.4 354 385.1 412 1,005.0 … … 296 298.4 455 1,015.8 … …
August 1,189 2,526.0 263 307.8 290 789.7 … … 229 252.7 401 929.2 6 246.7
September 1,474 2,794.4 316 357.4 385 984.0 … … 256 222.9 514 1,119.7 3 110.4
October 1,476 2,873.4 298 374.5 386 970.4 … … 323 284.9 465 1,004.5 4 239.1
November 1,358 3,099.8 309 413.1 335 880.0 … … 276 250.9 430 996.7 8 559.1
December 1,620 3,088.7 398 404.4 428 1,020.1 … … 319 313.2 468 1,107.5 7 243.6
2015 January 1,391 2,659.8 397 409.7 382 962.7 … … 261 292.0 345 772.6 6 222.8
February 1,502 2,779.2 393 458.1 409 1,055.7 … … 320 316.4 376 831.5 4 117.6
March 1,857 3,627.6 423 502.0 478 1,357.6 … … 441 428.7 513 1,157.1 2 182.3
April 1,913 3,574.6 437 445.5 498 1,439.8 … … 462 428.6 512 1,113.5 4 147.2
May 1,955 3,473.5 510 478.4 450 1,305.7 … … 461 429.5 528 1,112.2 6 147.7
June 1,954 3,581.9 538 476.8 524 1,434.0 … … 344 320.7 546 1,296.0 2 54.4
July 1,746 3,464.9 460 454.3 516 1,527.7 … … 305 293.0 462 1,063.9 3 126.0
August 1,351 2,829.7 361 364.0 377 1,097.2 … … 206 223.2 403 972.4 4 172.9
September 1,701 3,429.8 418 378.4 455 1,381.6 … … 311 304.3 515 1,294.3 2 71.2
October 1,909 3,688.2 408 403.8 492 1,494.3 … … 434 415.7 575 1,374.4 … …
November 1,709 3,533.0 292 323.7 476 1,430.3 … … 382 351.3 553 1,231.3 6 196.4
December 2,086 4,101.6 603 600.7 563 1,612.6 … … 355 332.1 556 1,279.2 9 277.0

64 |
Monthly Statistics Bulletin December 2015
Tabela 17.6. Other financial intermediaries loans - household new loans (2)
(In thousands of euro: Cumulative data during the reference month)
Description
Total
Households
Consumer loans
Mortgage loans Other loans
≤ 1 year > 1 year ≤ 5 years > 5 years
No. Amount No. Amount No. Amount No. Amount No. Amount No. Amount
2012 July 326 755.2 108 86.6 110 216.5 … … 40 346.6 68 105.5
August 401 817.5 102 72.8 154 312.0 … … 58 301.2 87 131.4
September 357 658.9 95 63.7 116 220.6 … … 53 246.2 93 128.3
October 659 1,123.6 208 170.6 331 611.1 … … 40 234.9 80 107.1
November 631 1,465.4 194 163.7 297 576.2 … … 31 569.6 109 156.0
December 644 1,241.1 195 147.8 310 603.9 … … 26 169.2 113 320.2
2013 January 409 657.6 125 98.8 184 358.4 … … 17 80.3 83 120.2
February 421 734.3 151 118.9 175 359.3 … … 25 145.5 70 110.6
March 541 719.4 241 158.8 190 311.2 … … 23 138.6 87 110.8
April 464 1,020.8 183 133.6 194 343.9 … … 34 456.1 53 87.2
May 412 739.5 141 113.9 199 393.0 … … 25 164.4 47 68.3
June 504 860.1 173 122.4 187 331.2 … … 34 238.1 110 168.4
July 459 1,065.5 181 139.0 179 336.3 … … 35 474.5 64 115.7
August 379 736.2 139 110.8 154 324.9 … … 22 130.4 64 170.0
September 524 960.9 174 144.3 256 476.6 … … 42 247.4 52 92.6
October 533 931.1 203 178.1 212 402.0 … … 43 266.8 75 84.2
November 622 1,040.0 263 195.2 255 461.7 … … 45 233.7 59 149.4
December 692 1,099.5 311 207.5 269 507.3 … … 53 278.8 59 106.0
2014 January 533 909.7 224 209.1 231 430.7 … … 37 188.7 41 81.2
February 543 1,143.6 233 179.0 219 412.0 … … 48 464.4 43 88.2
March 825 1,128.1 454 293.5 252 440.9 … … 58 291.2 61 102.5
April 826 1,013.8 513 294.4 220 392.1 … … 44 234.5 49 92.9
May 824 1,352.0 481 338.2 224 406.1 … … 64 311.7 55 295.9
June 874 1,547.0 474 299.6 264 538.1 … … 76 383.1 60 326.1
July 808 1,427.5 429 267.3 263 506.8 … … 54 247.0 62 406.4
August 625 1,055.0 322 241.1 200 401.8 … … 59 329.6 44 82.5
September 682 1,170.5 324 292.7 287 652.5 … … 29 154.0 42 71.3
October 659 1,006.6 324 240.6 259 500.6 … … 34 192.1 42 73.3
November 589 955.7 279 210.5 217 451.2 … … 35 182.9 58 111.0
December 780 1,413.7 370 352.7 303 723.8 … … 39 210.6 68 126.6
2015 January 561 896.5 298 242.0 192 440.4 … … 35 154.5 36 59.6
February 540 979.3 285 307.2 202 479.1 … … 29 138.4 24 54.6
March 712 1,354.8 374 429.5 241 613.3 … … 42 229.3 55 82.7
April 741 997.1 421 286.3 206 420.2 … … 43 207.0 71 83.6
May 713 987.8 334 191.7 202 385.5 … … 53 282.2 124 128.4
June 746 1,190.4 340 248.6 242 475.6 … … 61 367.6 103 98.6
July 731 1,242.2 358 304.9 229 456.1 … … 67 385.9 77 95.4
August 664 1,319.3 313 356.8 219 536.9 … … 66 322.1 66 103.5
September 646 1,177.7 288 248.6 214 389.1 … … 91 474.2 53 65.9
October 692 1,161.6 275 172.2 246 502.9 … … 74 356.4 97 130.2
November 605 1,035.2 263 174.4 210 381.5 … … 69 383.8 63 95.5
December 729 1,159.1 330 204.3 245 445.2 … … 81 413.2 73 96.5
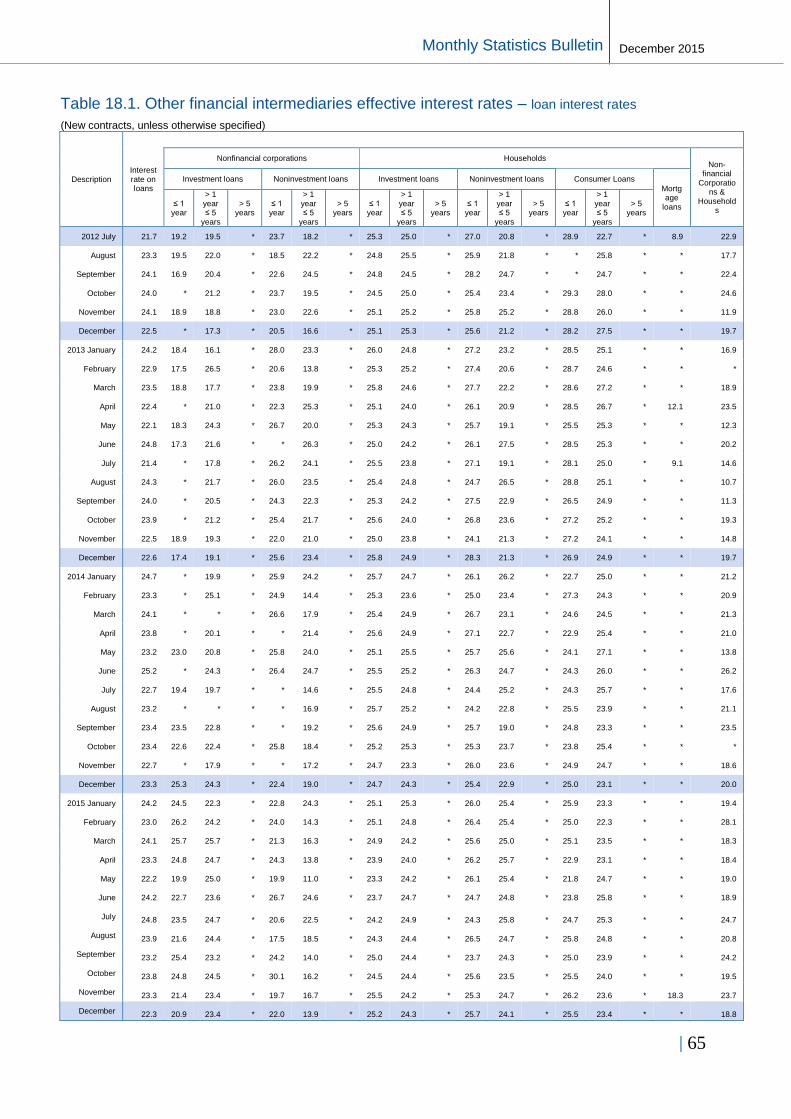
| 65
Buletini Mujor Statistikor
December 2015 Monthly Statistics Bulletin
Table 18.1. Other financial intermediaries effective interest rates – loan interest rates
(New contracts, unless otherwise specified)
Description Interest rate on loans
Nonfinancial corporations Households Non-
financial Corporatio
ns & Household
s
Investment loans Noninvestment loans Investment loans Noninvestment loans Consumer Loans
Mortgage
loans ≤ 1 year
> 1 year ≤ 5
years
> 5 years
≤ 1 year
> 1 year ≤ 5
years
> 5 years
≤ 1 year
> 1 year ≤ 5
years
> 5 years
≤ 1 year
> 1 year ≤ 5
years
> 5 years
≤ 1 year
> 1 year ≤ 5
years
> 5 years
2012 July 21.7 19.2 19.5 * 23.7 18.2 * 25.3 25.0 * 27.0 20.8 * 28.9 22.7 * 8.9 22.9
August 23.3 19.5 22.0 * 18.5 22.2 * 24.8 25.5 * 25.9 21.8 * * 25.8 * * 17.7
September 24.1 16.9 20.4 * 22.6 24.5 * 24.8 24.5 * 28.2 24.7 * * 24.7 * * 22.4
October 24.0 * 21.2 * 23.7 19.5 * 24.5 25.0 * 25.4 23.4 * 29.3 28.0 * * 24.6
November 24.1 18.9 18.8 * 23.0 22.6 * 25.1 25.2 * 25.8 25.2 * 28.8 26.0 * * 11.9
December 22.5 * 17.3 * 20.5 16.6 * 25.1 25.3 * 25.6 21.2 * 28.2 27.5 * * 19.7
2013 January 24.2 18.4 16.1 * 28.0 23.3 * 26.0 24.8 * 27.2 23.2 * 28.5 25.1 * * 16.9
February 22.9 17.5 26.5 * 20.6 13.8 * 25.3 25.2 * 27.4 20.6 * 28.7 24.6 * * *
March 23.5 18.8 17.7 * 23.8 19.9 * 25.8 24.6 * 27.7 22.2 * 28.6 27.2 * * 18.9
April 22.4 * 21.0 * 22.3 25.3 * 25.1 24.0 * 26.1 20.9 * 28.5 26.7 * 12.1 23.5
May 22.1 18.3 24.3 * 26.7 20.0 * 25.3 24.3 * 25.7 19.1 * 25.5 25.3 * * 12.3
June 24.8 17.3 21.6 * * 26.3 * 25.0 24.2 * 26.1 27.5 * 28.5 25.3 * * 20.2
July 21.4 * 17.8 * 26.2 24.1 * 25.5 23.8 * 27.1 19.1 * 28.1 25.0 * 9.1 14.6
August 24.3 * 21.7 * 26.0 23.5 * 25.4 24.8 * 24.7 26.5 * 28.8 25.1 * * 10.7
September 24.0 * 20.5 * 24.3 22.3 * 25.3 24.2 * 27.5 22.9 * 26.5 24.9 * * 11.3
October 23.9 * 21.2 * 25.4 21.7 * 25.6 24.0 * 26.8 23.6 * 27.2 25.2 * * 19.3
November 22.5 18.9 19.3 * 22.0 21.0 * 25.0 23.8 * 24.1 21.3 * 27.2 24.1 * * 14.8
December 22.6 17.4 19.1 * 25.6 23.4 * 25.8 24.9 * 28.3 21.3 * 26.9 24.9 * * 19.7
2014 January 24.7 * 19.9 * 25.9 24.2 * 25.7 24.7 * 26.1 26.2 * 22.7 25.0 * * 21.2
February 23.3 * 25.1 * 24.9 14.4 * 25.3 23.6 * 25.0 23.4 * 27.3 24.3 * * 20.9
March 24.1 * * * 26.6 17.9 * 25.4 24.9 * 26.7 23.1 * 24.6 24.5 * * 21.3
April 23.8 * 20.1 * * 21.4 * 25.6 24.9 * 27.1 22.7 * 22.9 25.4 * * 21.0
May 23.2 23.0 20.8 * 25.8 24.0 * 25.1 25.5 * 25.7 25.6 * 24.1 27.1 * * 13.8
June 25.2 * 24.3 * 26.4 24.7 * 25.5 25.2 * 26.3 24.7 * 24.3 26.0 * * 26.2
July 22.7 19.4 19.7 * * 14.6 * 25.5 24.8 * 24.4 25.2 * 24.3 25.7 * * 17.6
August 23.2 * * * * 16.9 * 25.7 25.2 * 24.2 22.8 * 25.5 23.9 * * 21.1
September 23.4 23.5 22.8 * * 19.2 * 25.6 24.9 * 25.7 19.0 * 24.8 23.3 * * 23.5
October 23.4 22.6 22.4 * 25.8 18.4 * 25.2 25.3 * 25.3 23.7 * 23.8 25.4 * * *
November 22.7 * 17.9 * * 17.2 * 24.7 23.3 * 26.0 23.6 * 24.9 24.7 * * 18.6
December 23.3 25.3 24.3 * 22.4 19.0 * 24.7 24.3 * 25.4 22.9 * 25.0 23.1 * * 20.0
2015 January 24.2 24.5 22.3 * 22.8 24.3 * 25.1 25.3 * 26.0 25.4 * 25.9 23.3 * * 19.4
February 23.0 26.2 24.2 * 24.0 14.3 * 25.1 24.8 * 26.4 25.4 * 25.0 22.3 * * 28.1
March 24.1 25.7 25.7 * 21.3 16.3 * 24.9 24.2 * 25.6 25.0 * 25.1 23.5 * * 18.3
April 23.3 24.8 24.7 * 24.3 13.8 * 23.9 24.0 * 26.2 25.7 * 22.9 23.1 * * 18.4
May 22.2 19.9 25.0 * 19.9 11.0 * 23.3 24.2 * 26.1 25.4 * 21.8 24.7 * * 19.0
June 24.2 22.7 23.6 * 26.7 24.6 * 23.7 24.7 * 24.7 24.8 * 23.8 25.8 * * 18.9
July 24.8 23.5 24.7 * 20.6 22.5 * 24.2 24.9 * 24.3 25.8 * 24.7 25.3 * * 24.7
August 23.9 21.6 24.4 * 17.5 18.5 * 24.3 24.4 * 26.5 24.7 * 25.8 24.8 * * 20.8
September 23.2 25.4 23.2 * 24.2 14.0 * 25.0 24.4 * 23.7 24.3 * 25.0 23.9 * * 24.2
October 23.8 24.8 24.5 * 30.1 16.2 * 24.5 24.4 * 25.6 23.5 * 25.5 24.0 * * 19.5
November 23.3 21.4 23.4 * 19.7 16.7 * 25.5 24.2 * 25.3 24.7 * 26.2 23.6 * 18.3 23.7
December 22.3 20.9 23.4 * 22.0 13.9 * 25.2 24.3 * 25.7 24.1 * 25.5 23.4 * * 18.8

66 |
Monthly Statistics Bulletin December 2015
Table 19.1. Other financial intermediary income statement – income and expenditures
(In millions of euro: Cumulative data during the year)
Description
Net profit/loss for the period
Income Expenditures
Interest income Noninterest income
Income from revaluation
Expendi-tures
income
Noninterest income Other operating expenditures
Losses from
revalu-ation
Income from
services
Income from
admini-stration
Other operating income
Provision for loan losses
Personnel and
admini-strative expend-
itures
Expendi-tures on depraci-
ation
Other expe-
nditures
2012 November -4.5 18.4 15.8 2.6 0.2 0.8 1.7 … 23.0 4.3 16.1 5.0 11.1 2.6 0.7 1.9 -4.5
December -4.5 20.8 17.2 3.6 0.2 0.8 2.6 … 25.3 4.7 17.5 5.1 12.5 3.0 1.0 2.1 -4.5
2013 January 0.1 1.8 1.5 0.4 … 0.1 0.3 … 1.7 0.4 1.1 0.1 1.0 0.2 0.1 0.2 …
February 2.9 3.6 2.7 0.9 … 0.1 0.7 0.5 0.7 3.4 2.3 0.3 2.0 0.5 0.1 0.4 …
March -0.5 5.3 4.1 1.2 0.1 0.2 0.9 … 5.8 1.0 4.0 1.1 2.9 0.8 0.2 0.6 …
April -0.6 6.6 5.4 1.3 0.1 0.3 0.9 … 7.2 1.3 4.9 1.1 3.8 1.0 0.3 0.8 …
May -0.6 8.1 6.6 1.5 0.1 0.3 1.1 … 8.7 1.6 5.8 1.1 4.7 1.3 0.3 1.0 …
June -0.6 9.8 7.9 1.9 0.1 0.4 1.4 … 10.4 2.0 6.9 1.3 5.6 1.5 0.4 1.2 …
July -1.0 11.4 9.3 2.1 0.1 0.4 1.6 … 12.4 2.3 8.4 1.6 6.8 1.7 0.4 1.3 …
August -1.0 13.0 10.6 2.4 0.2 0.5 1.8 … 14.0 2.6 9.4 1.7 7.7 2.0 0.5 1.6 …
September -1.3 14.4 11.8 2.7 0.2 0.5 2.0 0.2 15.7 3.0 10.5 1.8 8.7 2.2 0.5 1.7 …
October -1.6 16.1 13.1 3.0 0.2 0.6 2.2 0.5 17.8 3.3 11.7 2.0 9.7 2.8 0.6 2.2 …
November -1.9 17.6 14.4 3.2 0.2 0.7 2.4 0.7 19.5 3.6 12.8 2.1 10.6 3.2 0.6 2.6 …
December -0.3 19.2 15.5 3.7 0.3 0.7 2.7 0.7 19.5 3.8 13.4 2.1 11.3 2.4 0.8 1.6 …
2014 January -0.8 2.5 2.1 0.5 … 0.2 0.2 … 3.3 0.8 2.2 0.8 1.4 0.3 0.2 0.1 …
February -0.1 3.0 2.5 0.5 0.1 0.1 0.3 … 3.1 0.6 2.2 0.4 1.7 0.3 0.1 0.2 …
March -0.2 4.6 3.8 0.9 0.1 0.2 0.6 … 4.9 0.9 3.4 0.8 2.6 0.5 0.1 0.4 …
April 0.0 6.1 5.0 1.1 0.1 0.2 0.8 … 6.2 1.2 4.3 0.8 3.5 0.7 0.2 0.5 …
May 0.0 7.7 6.3 1.4 0.1 0.3 1.0 … 7.7 1.5 5.3 0.9 4.4 0.8 0.2 0.6 …
June 0.0 9.3 7.7 1.7 0.2 0.4 1.1 … 9.3 1.8 6.5 1.2 5.3 1.0 0.3 0.7 …
July 0.1 11.1 9.1 2.0 0.2 0.4 1.3 … 10.9 2.1 7.6 1.3 6.3 1.2 0.3 0.9 …
August 0.3 12.6 10.4 2.2 0.2 0.5 1.5 … 12.3 2.4 8.5 1.4 7.1 1.3 0.4 1.0 …
September 0.9 14.2 11.7 2.4 0.2 0.6 1.7 … 13.3 2.8 9.0 1.1 7.9 1.5 0.4 1.1 …
October 1.0 15.8 13.1 2.7 0.2 0.6 1.8 … 14.8 3.1 10.0 1.2 8.8 1.7 0.4 1.3 …
November 1.0 17.4 14.4 2.9 0.3 0.7 2.0 … 16.3 3.4 11.1 1.3 9.7 1.9 0.5 1.4 …
December 1.3 19.3 16.1 3.3 0.3 0.8 2.2 … 18.0 3.8 11.7 0.8 10.9 2.5 0.6 1.9 …
2015 January 0.1 1.6 1.4 0.2 0.0 0.1 0.1 … 1.5 0.3 1.0 0.2 0.9 0.2 0.0 0.1 …
February 0.5 3.2 2.7 0.5 0.0 0.1 0.3 … 2.7 0.6 1.8 0.1 1.7 0.3 0.1 0.2 …
March 0.4 4.9 4.1 0.8 0.1 0.2 0.5 … 4.6 1.0 3.1 0.5 2.6 0.5 0.1 0.4 …
April 0.6 6.7 5.6 1.1 0.1 0.3 0.7 … 6.1 1.3 4.2 0.6 3.6 0.6 0.1 0.5 …
May 0.8 8.3 6.9 1.4 0.1 0.4 0.9 … 7.5 1.6 5.2 0.7 4.4 0.8 0.2 0.6 …
June 1.2 10.0 8.3 1.7 0.2 0.5 1.0 … 8.8 1.9 5.9 0.6 5.3 1.0 0.2 0.8 …
July 1.5 11.8 9.8 2.0 0.2 0.6 1.2 … 10.3 2.2 6.9 0.7 6.2 1.1 0.3 0.9 …
August 2.1 13.1 10.9 2.2 0.2 0.6 1.4 … 11.0 2.5 7.2 0.4 6.8 1.3 0.3 1.0 …
September 2.1 15.6 12.7 2.8 0.2 0.7 1.9 … 13.5 3.0 9.0 1.0 8.0 1.4 0.3 1.1 …
October 2.4 17.4 14.2 3.2 0.6 0.8 1.8 … 15.0 3.3 10.0 1.1 8.9 1.6 0.4 1.3 …
November 2.4 19.0 15.7 3.4 0.7 0.9 1.8 … 16.6 3.6 11.0 1.2 9.8 2.0 0.4 1.6 …
December 2.5 21.1 17.2 3.9 0.8 0.9 2.2 … 18.7 4.0 12.3 1.2 11.1 2.4 0.5 1.9 …

| 67
Buletini Mujor Statistikor
December 2015 Monthly Statistics Bulletin
Table 20.1. Financial auxiliaries balance sheet – assets and liabilities
(In millions of euro: End of period)
Description
Total assets Total libilities
Cash and balance with commercial banks
Fixed assets
Other assets
Debt
to clients
Other payable accounts
Own resources
Cash
Balance with
comme-rcial
banks
In euro currency
Sharehol-der
capital
General reserves
and other
reserves
Profit/loss of the year
Retained profit/loss
2012 November 7.8 1.9 0.8 1.1 0.5 5.5 7.8 0.2 2.5 5.2 5.2 0.3 0.1 2.9 1.9
December 8.2 2.1 1.1 1.1 0.5 5.6 8.2 0.4 2.5 5.2 5.2 0.3 0.2 3.0 1.8
2013 January 7.4 2.0 1.0 0.9 0.5 5.0 7.4 0.5 1.7 5.3 5.3 0.4 0.0 0.3 4.6
February 8.0 2.1 1.1 1.0 0.5 5.3 8.0 0.5 2.0 5.5 5.5 0.3 0.0 0.5 4.6
March 8.3 2.1 1.1 1.1 0.5 5.7 8.3 0.4 2.2 5.8 5.8 0.3 0.0 0.8 4.6
April 9.7 2.6 1.2 1.4 0.5 6.5 9.7 0.5 3.1 6.0 6.0 0.3 0.0 1.1 4.6
May 8.8 2.4 1.2 1.2 0.5 5.9 8.8 0.3 2.2 6.3 6.3 0.3 0.0 1.4 4.6
June 9.6 2.7 1.3 1.4 0.5 6.4 9.6 0.5 2.6 6.6 6.6 0.4 0.0 1.6 4.6
July 8.8 2.7 1.4 1.3 0.5 5.7 8.8 1.7 3.4 3.7 3.7 0.6 0.0 1.8 1.3
August 9.8 2.7 1.4 1.3 0.5 6.6 9.8 3.4 2.5 4.0 0.7 0.0 2.0 2.0 1.3
September 7.5 2.8 1.5 1.3 0.5 4.2 7.5 3.0 0.3 4.2 4.2 0.7 0.0 2.2 1.3
October 6.7 2.8 1.6 1.2 0.5 3.4 6.7 2.1 0.3 4.4 4.4 0.7 0.2 2.5 1.2
November 7.6 2.8 1.7 1.2 0.5 4.3 7.6 2.6 0.3 4.7 4.7 0.7 0.0 2.8 1.2
December 7.6 3.3 1.9 1.5 0.5 3.7 7.6 3.3 0.5 3.9 3.9 0.7 0.0 3.0 0.2
2014 January 6.3 3.0 1.7 1.3 0.5 2.7 6.3 1.9 0.3 4.1 4.1 0.8 0.0 0.3 3.0
February 6.9 3.3 1.8 1.6 0.5 3.1 6.9 2.2 0.4 4.3 4.3 0.8 0.0 0.5 3.1
March 7.9 3.7 1.9 1.8 0.5 3.7 7.9 2.9 0.5 4.5 4.5 0.9 0.0 0.7 2.9
April 7.7 3.8 1.9 1.9 0.5 3.5 7.7 2.4 0.5 4.8 4.8 1.0 0.0 1.1 2.9
May 8.6 4.2 2.0 2.2 0.6 3.8 8.6 2.5 0.8 5.2 5.2 1.0 0.0 1.4 2.9
June 8.9 4.2 2.2 2.0 0.6 4.1 8.9 2.9 0.6 5.4 5.4 1.0 0.0 1.6 2.9
July 8.0 4.2 2.3 1.9 0.6 3.2 8.0 1.9 0.5 5.7 5.7 0.9 0.0 1.8 2.9
August 9.1 4.5 2.2 2.2 0.6 4.0 9.1 2.6 0.6 5.9 5.9 0.9 0.0 2.2 2.9
September 10.1 4.4 2.3 2.2 0.7 5.0 10.1 3.3 0.7 6.1 6.1 0.9 0.0 2.4 2.9
October 9.4 3.7 2.3 1.4 0.7 5.0 9.4 2.2 0.7 6.5 6.5 0.9 0.0 2.7 2.9
November 10.9 4.3 2.5 1.8 0.7 5.9 10.9 3.3 0.8 6.8 6.8 0.9 0.0 3.0 2.9
December 8.8 3.9 2.5 1.6 0.8 4.0 9.0 3.2 0.8 4.9 4.9 0.9 0.0 3.2 0.9
2015 January 8.9 4.2 2.6 1.6 0.8 3.9 8.9 2.9 0.8 5.2 5.2 0.9 0.0 0.3 4.0
February 8.9 4.0 2.5 1.5 0.8 4.1 8.9 2.6 0.8 5.5 5.5 0.9 0.0 0.6 4.1
March 8.9 4.2 2.6 1.6 0.8 3.9 8.9 2.5 0.6 5.7 5.7 0.9 0.0 0.8 4.1
April 9.2 4.5 2.7 1.8 0.8 4.0 9.2 2.6 0.6 6.0 6.0 0.8 0.0 1.1 4.1
May 9.9 4.2 2.8 1.4 0.8 5.0 9.9 3.0 0.8 6.1 6.1 0.8 0.0 1.5 3.8
June 10.1 4.4 2.9 1.5 0.8 4.9 10.1 2.7 1.0 6.4 6.4 0.8 0.0 1.7 3.8
July 8.9 4.4 2.9 1.5 0.8 3.8 8.9 1.7 0.6 6.6 6.6 0.8 0.0 2.0 3.7
August 10.9 4.2 3.0 1.3 0.8 5.2 10.2 2.7 0.6 6.9 6.9 0.8 0.0 2.3 3.7
September 10.1 4.6 2.9 1.6 0.8 4.8 10.1 2.3 0.6 7.2 7.2 0.8 0.0 2.6 3.8
October 11.4 4.6 3.0 1.6 0.8 6.0 11.4 2.9 1.0 7.5 7.5 0.8 0.0 2.9 3.8
November 11.3 4.9 3.1 1.8 0.8 5.6 11.3 2.8 0.7 7.8 7.8 0.8 0.0 3.2 3.8
December 10.8 6.6 3.2 3.3 3.3 3.5 10.8 2.3 0.5 8.0 8.0 1.7 0.0 3.4 2.8

68 |
Monthly Statistics Bulletin December 2015
Table 21.1. Financial auxiliaries Income statement – income and expenditures
(In millions of euro: Cumulative data during the year)
Description
Net income
Income Expenses
Income from
transfers
Income from
interest Other income
Expenses
from transfers
Expenses from
interest
Other expenses
2012 December 3.0 5.2 4.6 … 0.6 2.2 0.5 … 1.7
2013 January 0.3 0.4 0.3 … 0.1 0.1 0.0 … 0.1
February 0.5 0.8 0.7 … 0.1 0.3 0.1 … 0.2
March 0.8 1.3 1.1 … 0.2 0.5 0.1 … 0.4
April 1.1 1.6 1.2 … 0.3 0.5 0.1 … 0.3
May 1.4 2.2 1.8 … 0.4 0.9 0.2 … 0.7
June 1.6 2.7 2.2 … 0.5 1.1 0.2 … 0.8
July 1.8 3.1 2.5 … 0.6 1.4 0.3 … 1.1
August 2.0 3.6 2.9 … 0.7 1.6 0.3 … 1.3
September 2.2 4.0 3.3 … 0.8 1.8 0.4 … 1.4
October 2.5 4.6 3.7 … 0.9 2.1 0.4 … 1.7
November 2.8 5.1 4.1 … 0.9 2.3 0.5 … 1.8
December 3.0 5.6 4.6 … 1.0 2.6 0.6 … 2.1
2014 January 0.3 0.5 0.4 … 0.1 0.2 0.0 … 0.1
February 0.5 0.9 0.7 … 0.2 0.4 0.1 … 0.3
March 0.7 1.5 1.1 … 0.3 0.7 0.2 … 0.6
April 1.1 2.0 1.5 … 0.5 1.0 0.2 … 0.7
May 1.4 2.8 2.0 … 0.8 1.3 0.3 … 1.1
June 1.6 3.2 2.3 … 0.8 1.6 0.3 … 1.2
July 1.8 3.7 2.7 … 1.0 1.8 0.4 … 1.5
August 2.2 4.2 3.0 … 1.2 2.0 0.4 … 1.6
September 2.4 4.8 3.4 … 1.3 2.4 0.5 … 1.9
October 2.7 5.4 3.9 … 1.5 2.7 0.6 … 2.1
November 3.0 5.9 4.3 … 1.6 2.9 0.6 … 2.3
December 3.2 6.6 4.8 … 1.7 3.4 0.7 … 2.7
2015 January 0.3 0.5 0.4 … 0.2 0.2 0.1 … 0.2
February 0.6 1.1 0.8 … 0.3 0.5 0.1 … 0.4
March 0.8 1.7 1.2 … 0.4 0.9 0.2 … 0.7
April 1.1 2.2 1.6 … 0.6 1.1 0.2 … 0.9
May 1.5 2.9 2.1 … 0.8 1.4 0.3 … 1.1
June 1.1
2.2 1.6 … 0.6 1.1 0.2 … 0.9
July 2.0 4.1 3.0 … 1.2 2.1 0.4 … 1.7
August 2.3 4.7 3.3 … 1.3 2.3 0.4 … 1.9
September 2.6 5.2 3.7 … 1.5 2.7 0.5 … 2.2
October 2.9 5.9 4.3 … 1.7 3.0 0.6 … 2.4
November 3.2 6.5 4.7 … 1.8 3.3 0.6 … 2.6
December 3.4 7.1 5.2 … 2.0 3.7 0.7 … 3.0

| 69
Buletini Mujor Statistikor
December 2015 Monthly Statistics Bulletin
Table 22.1. Financial auxiliaries international transfers – incoming and outgoing transfers
(In millions of euro: Cumulative data during the reference year, excluding the number of transfers)
Description Incoming transfers Outgoing transfers The number of incoming
transfers The number of outgoing
transfers
January 16.5 1.5 50,577 2,854
February 32.7 2.7 103,141 5,326
March 37.1 4.4 155,740 8,175
April 66.0 5.6 198,616 12,648
May 83.1 6.9 252,408 13,658
June 97.2 8.1 296,595 16,973
July 106.9 9.6 330,200 19,522
August 123.4 10.8 372,415 24,449
September 137.9 14.3 418,851 25,871
October 162.7 13.5 482,039 28,463
November 171.7 17.2 525,222 31,158
2012 December 189.1 18.1 579,445 34,447

70 |
Monthly Statistics Bulletin December 2015
Table 23.1. Payment system - selected indicators
(In millions of euro: Cumulative data during the reference period)
Description Interbank clearing
system
Bank clients withdrawing through
ATM
Abroad bank clients withdrawing through
ATM
Bank clients payments through POS
Abroad bank clients payments through
POS E-banking payments
2001
80 _ _ _ _ _
2002
841 _ _ _ _ _
2003
1,416 _ _ _ _ _
2004
1,716 _ _ _ _ _
2005
1,919 _ _ _ _ _
2006
2,325 _ _ _ _ _
2007
2,460 _ _ _ _
2008
1,090
102
26
11
2
132
2009
1,330
120
29
19
3
171
2010 June
1,113
120
27
19
4
175
September
1,228
126
63
19
5
221
December
1,490
140
17
24
4
242
2011 March
920.1
121
29
21
4
195
June
1,233
158
33
29
5
270
September
1,386
159
84
32
6
363
December
1,547
169
36
39
6
365
2012 March
1,071.7
140
33
30
5
210
June
1,412
168
38
36
6
299
September
1,568
190
90
46
9
506
December
1,630
175
39
38
7
484
2013 March
1,330
153
37
34
6
472
June
1,519
182
39
39
7
589
September
1,715
181
108
44
10
755
December
1,872
194
42
41
10
856
2014 March
1,538
169
38
43
6
716
June
1,644
202
41
47
8
953
September
1,732
203
85
53
11
1,226
December
1,919
224
34
61
10
1,326
2015 January
481 59 14 28 3 332
February 469 69 11 15 3 312
March 560 75 7 17 8 412
April 623 83 15 19 4 438
May 595 86 15 20 4 463
June 614 84 15 21 4 493
July 695 92 24 20 10 558
August 646 96 32 20 10 555
September 593 91 10 19 5 494
October 731 102 8 20 5 549
November 591 99 6 18 4 508
December 877 118 11 23 6 644

| 71
Buletini Mujor Statistikor
December 2015 Monthly Statistics Bulletin
Tabele 24.1. ODC network and number of employees – main regions
Description
Total network units
Number of employees
Prishtina Prizren Peja Gjilani Mitrovica
2005 237 68 39 35 39 32 2,341
2006 220 68 37 37 41 26 2,416
2007 236 70 39 40 45 31 2,715
2008 287 97 44 51 59 35 3,607
2009 295 97 46 52 64 35 3,459
2010 311 100 49 57 66 39 3,610
2011 310 102 50 59 64 35 3,728
2012 310 101 50 59 67 33 3,722
May 306 104 48 57 64 33 3,636
June 305 104 48 56 64 33 3,638
July 302 104 47 55 64 32 3,616
August 300 104 45 54 65 30 3,604
September 301 101 47 54 65 34 3,590
October 301 101 47 54 65 34 3,571
November 303 103 47 54 65 34 3,546
December 298 102 47 52 62 35 3,549
2014 January 299 102 47 52 62 36 3,549
February 295 101 46 51 61 36 3,549
March 290 97 46 51 58 37 3,521
April 284 95 45 51 57 36 3,521
May 279 95 44 48 57 35 3,487
June 279 95 44 48 57 35 3,488
July 280 97 45 48 56 34 3,500
August 280 97 45 48 56 34 3,510
September 280 97 45 47 56 35 3,514
October 277 97 45 46 55 34 3,510
November 275 96 45 46 54 34 3,514
December 277 97 45 46 55 34 3,507
2015 January 277 97 45 46 55 34 3,518
February 273 97 42 46 54 34 3,521
March 273 97 42 46 54 34 3,510
April 273 97 41 46 54 35 3,513
June 274 99 41 46 53 35 3,531
July 268 95 40 45 53 35 3,503
August 266 94 40 45 52 35 3,548
September 265 93 40 45 52 35 3,409
October 265 93 40 45 52 35 3,398
November 265 93 40 45 52 35 3,387
December 265 93 40 45 52 35 3,375
Prishtina region: Prishtina, Gllogovc, Fushë Kosovë, Lipjan, Obiliq, Podujevë, Shtime; Prizren region: Prizren, Dragash, Rahovec, Suharekë, Malishevë, Mamushë;
Peja region: Pejë, Klinë, Gjakovë, Istog, Deqan, Junik;
Gjilani region: Gjilan, Kaçanik, Kamenicë, Novo Berd, Shtërpc, Ferizaj, Viti;
Mitrovica region: Mitrovicë, Skenderaj, Vushtri, Zubin Potok, Zveqan, Leposaviq.

72 |
Monthly Statistics Bulletin December 2015
Table 25.1. IC activity - income premiums and paid claims (In millions of euro: Cumulative data during the reference period)
Description
Amount of premiums received 1/ Number of policies sold (in thousand) Amount of claims paid
Third Party
Liability
Border policies
Other (Non third party
liability)
Third Party
Liability
Border policies
Other (Non third party
liability)
Third Party
Liability 2/
Border policies
Other (Non third party
liability)
2001 31.2 31.2 . . 180 180 . . 2.66 2.66 . .
2002 31.0 27.2 3.7 0.1 247 175 72.4 … 3.54 3.54 . .
2003 37.1 29.2 6.6 1.3 265 199 62 4 5.6 5.3 0.3 …
2004 39.1 28.7 8.6 1.7 371 242 120.6 8 6.74 5.75 0.58 0.42
2005 47.2 33.3 7.1 6.8 373 224 135 15 9.2 7.9 0.3 0.9
2006 48.7 34.7 9.4 4.6 406 252 136.2 18 10.93 9.82 0.48 0.63
2007 50.8 34.9 10.2 5.7 406 233 144 30 12.8 10.9 0.7 1.3
2008 56.4 35.6 10.9 9.9 476 252 153 72 17.7 14.7 1.0 2.0
2009 67.8 36.4 12.7 18.7 511.8 253.4 181.3 77.0 18.8 13.7 1.2 3.9
2010 71.2 40.6 10.6 20.0 540.7 258.0 192.8 89.9 26.5 19.2 1.1 6.3
2011 78.1 45.8 9.6 22.7 605.2 285.9 220.5 98.9 26.8 18.0 1.0 7.9
2012 81.5 44.2 14.7 22.6 757.2 278.2 355.4 123.5 30.6 18.9 1.1 10.5
2013 November 71.3 41.1 11.5 18.7 853.2 300.7 407.9 144.6 35.3 19.5 1.1 14.7
December 77.4 43.9 13.1 20.4 917.5 323.7 437.2 156.7 38.4 21.4 1.2 15.8
2014 January 6.0 2.7 0.5 2.8 59.9 21.9 21.7 16.3 2.8 1.7 0.0 1.0
February 11.4 5.3 1.0 5.0 117.1 41.3 43.0 32.7 5.1 3.0 0.1 1.9
March 18.0 9.4 2.0 6.6 188.0 72.2 69.1 46.7 7.6 4.6 0.2 2.8
April 26.4 14.2 3.1 9.1 277.9 108.2 107.5 62.3 10.6 6.4 0.3 3.9
May 33.2 18.4 4.1 10.7 354.1 139.8 138.4 76.0 13.5 8.0 0.4 5.0
June 39.2 22.1 5.0 12.1 428.4 168.6 170.4 89.4 15.9 9.7 0.5 5.8
July 47.6 26.1 8.0 13.5 574.1 200.4 272.0 101.7 18.5 11.3 0.6 6.6
August 55.0 29.8 10.2 15.0 693.1 230.6 349.1 113.3 20.8 12.8 0.6 7.4
September 61.2 33.2 11.1 16.9 765.7 258.0 380.7 127.0 23.1 14.1 0.8 8.2
October 67.6 36.5 12.0 19.1 845.6 284.3 412.8 148.5 25.5 15.6 0.9 8.9
November 73.0 39.2 13.0 20.8 906.8 306.5 438.4 161.9 28.2 17.3 1.1 9.8
December 80.1 42.3 14.6 23.2 998.0 332.4 488.6 177.1 31.2 19.1 1.3 10.8
2015 January 5.3 2.7 - 2.6 93.3 44.8 22.6 25.9 2.6 1.5 0.0 1.2
February 11.8 5.2 1.2 5.3 128.4 42.5 45.3 40.6 5.6 3.3 0.2 2.2
March 18.0 8.8 2.1 7.1 200.6 70.0 75.0 55.6 9.0 5.6 0.2 3.2
April 25.7 13.2 3.1 9.3 285.6 104.3 111.0 70.3 13.3 8.4 0.3 4.6
May 32.4 17.3 4.1 11.0 364.0 134.8 145.3 83.9 15.8 9.9 0.3 5.5
June 25.7 13.2 3.1 9.3 285.6 104.3 111.0 70.3 13.3 8.4 0.3 4.6
July 47.2 25.7 7.2 14.2 608.9 202.3 289.7 116.9 22.0 13.9 0.5 7.5
August 54.5 29.8 8.5 16.2 723.4 237.6 356.5 129.3 24.5 15.3 0.6 8.6
September 61.0 33.4 8.9 18.8 784.9 268.3 373.6 142.9 27.1 16.7 0.6 9.8
October 67.7 36.8 9.2 21.8 845.4 297.4 390.0 158.0 30.3 18.6 0.8 11.0
November 72.9 39.8 9.5 23.6 893.3 321.2 401.5 170.6 33.5 20.6 0.8 12.1
December 78.8 43.1 10.2 25.5 977.5 350.0 442.0 185.5 37.0 22.8 1.1 13.0
1/ Inculdes only non-life insurance.
2/ Includes claims paid by the Kosovo Compensation Fund.

| 73
Buletini Mujor Statistikor
December 2015 Monthly Statistics Bulletin
Table 26.1. Kosovo budget – structure of revenues
(In millions of euro)
Decription
Total income
Tax revenues
Non tax revenues - central
level
Own income
Concessional tax
Tantiems Dedicated revenues
PAK
Borrowings from IFI
Divide-nta
Receipts from
security issues
Border taxes
Border returns
Local Taxes
KTA returns
Central elvel
Local government
2015 January 112 86 47 - 41 -2 3 8 4 4 1 0 6 - 1 7
February 87 71 52 - 21 -3 3 8 4 3 - 0 - - 0 5
March 132 87 68 - 22 -3 4 8 4 4 - 6 - - 2 25
April 137 112 75 - 40 -2 4 7 3 4 1 6 - 10 0 -5
May 119 92 76 - 18 -3 4 8 3 4 - 0 - - 0 15
June 131 103 84 - 21 -2 4 8 3 5 - 0 0 - 0 15
July 182 128 96 -1 36 -3 5 7 2 4 7 2 0 0 36 -1
August 140 113 96 -1 20 -3 4 7 3 4 - - 0 - 0 15
September 144 109 87 -1 27 -3 4 7 3 4 - 1 -0 - 2 20
October 149 131 91 -1 42 -1 5 9 4 5 2 7 0 5 0 -10
Source: Ministry of Finance
Table 26.2. Kosovo budget – structure of expenditures
(In millions of euro)
Description
Total expenditures
Central level
Local level
Other financing
Wages and
salaries
Goods and
services
Local expend-
itures
Subsi-dies and
transfers
Capital expend-
itures
Wages and
salaries
Goods and
services
Local expendi-
tures
Subsidies and
transfers
Capital expendit-
ures
External debt
2015 January 70 49 22 1 1 25 - 21 20 0 1 0 0 0 0
February 112 79 23 12 2 35 8 29 20 3 1 0 5 3 3
March 117 80 23 10 1 31 15 27 19 2 0 1 5 10 10
April 123 92 23 15 2 40 12 31 20 4 1 1 5 0 0
May 123 86 24 14 1 29 18 34 21 3 1 1 8 3 3
June 133 98 24 10 1 31 32 34 21 3 1 1 9 1 1
July 127 92 24 9 1 32 26 34 20 2 0 1 10 1 127
August 122 86 23 11 1 30 21 32 20 2 0 1 9 4 4
September 132 85 23 10 1 31 20 37 20 3 1 1 12 10 10
October
155
111
24
13
1
36
37
37
21
4
1
1
11
7
7
Source: Ministry of Finance

74 |
Monthly Statistics Bulletin December 2015
Table 27.1. Gross domestic product with constant prices (In millions of euro: with constant prices from the previous year)
Description
GDP by expenditures approach Real growth
rate Final consumption expenditures Gross capital
formation
Net export
Final consumption expenditures
of households
Government final
consumption expenditures
Final consumption expenditures
NPISH
Export of goods and services Goods and services import
Goods export
Services export
Goods import
Services import
2008 3,616.1 3,912.8 3,268.9 620.8 23.1 1,123.7 -1,420.4 547.1 188.3 358.8 1,967.5 1,734.4 233.1 4.5
2009 4,022.4 4,218.2 3,569.3 624.3 24.5 1,340.3 -1,536.0 683.9 193.2 490.6 2,219.9 1,935.5 284.4 3.6
2010 4,204.3 4,325.1 3,651.5 648.4 25.1 1,405.0 -1,525.8 781.5 227.9 553.6 2,307.3 1,927.3 380.0 3.3
2011 4,594.6 4,652.0 3,900.3 722.8 29.0 1,565.0 -1,622.4 907.0 309.4 597.6 2,529.3 2,180.8 348.6 4.4
2012 4,949.9 5,104.3 4,264.3 820.0 20.0 1,422.3 -1,576.7 948.4 320.8 627.5 2,525.1 2,239.1 286.0 2.8
2013 5,232.8 5,437.8 4,568.2 869.6 na 1,460.2 -1,665.2 944.7 na na 2,609.9 na na 3.4
2014 Q1* 1,087.3 1,146.8 960.7 186.1 na 300.8 -360.3 189.1 na na 549.4 na na 1.7
Q2* 1,361.0 1,390.7 1,169.0 221.7 na 418.1 -447.8 237.7 na na 685.5 na na -2.5
Q3* 1,486.2 1,546.3 1,336.3 211.0 na 395.0 -455.0 377.6 na na 832.7 na na 1.4
Q4* 1,440.9 1535.7 1,272.0 263.8 na 379.3 -474.1 274.1 na na 748.2 na na 3.3
2015 Q1* 1,168.3 1.226.5 1,037.6 188.9 na 270.7 -329.0 218.5 na na 547.5 na na 0.2
Q2* 1,433.3 1.472.1 1,241.3 230.8 na 444.9 -483.2 262.6 na na 745.7 na na 0.1
*Note: Estimated
Source: Kosovo Agency of Statistics
Table 27.2. Gross domestic product (expenditure approach) - structure (In percentage)
Description
GDp by expenditure
Final consumption Gros
capital
formation
Net export
Final
consumption
of housholds
Government final expenditures Final
consumption
expenditures
NPISH
Export of goods and services Import of goods and services
Kosovo
Government
Donors
(wages)
Export
of
goods
Export
of
services
Import
of
goods
Import
of
services
2008 100 107.5 89.9 17.0 9.2 7.8 0.6 31.1 -38.6 15.7 5.6 10.1 54.3 48.1 6.2
2009 100 103.7 86.7 16.4 10.0 6.4 0.6 31.1 -34.9 17.1 4.4 12.7 52.0 44.9 7.0
2010 100 102.6 85.6 16.4 11.3 5.1 0.6 33.0 -35.6 19.9 6.9 13.0 55.5 46.7 8.8
2011 100 103.3 86.0 16.7 12.0 4.6 0.6 33.9 -37.2 19.6 6.7 12.8 56.8 49.5 7.3
2012 100 105.2 88.1 16.6 12.4 4.3 0.4 29.0 -34.1 18.2 5.7 12.6 52.4 46.7 5.7
2013 100 104.0 87.3 16.2 12.4 3.9 0.4 27.6 -31.6 17.4 5.7 11.7 49.0 43.1 5.9
Source: Kosovo Agency of Statistics

| 75
Buletini Mujor Statistikor
December 2015 Monthly Statistics Bulletin
Table 28.1. Prices – main components
(May 2002=100)
Code Description Weight December 2015 /
May 2002 Monthly change (in
percent) Annual change (in
percent)
Total - Consumer Price Index 1,000.0 127.0 0.1 % -0.3 %
0.1 Food and alcoolic baverages 408.8 133.7 0.1% -0.1 %
0.2 Alcoholic bevarages and tobacco 52.1 197.3 -0.1% 10.4 %
0.3 Clothing and footwear 44.7 95.0 0.3% 2.3 %
0.4 Housing, water, electricity, gas and other fuels 89.2 143.4 0.5% -3.7 %
0.5 Furnishing, household equipments, and routine 84.8 111.7 0.0% 2.2 %
0.6 Health 28.3 117.1 0.7 % 3.2 %
0.7 Transport 130.7 130.8 -0.2% -7.4 %
0.8 Communication 31.7 93.6 -0.1% 0.2 %
0.9 Recreation and culture 45.1 106.9 0.0 % 0.6 %
10 Education 12.6 79.1 0.4 % 0.4 %
11 Restorants and hotels 33.6 116.7 0.7 % 1.5 %
12 Miscellanous and services 38.4 122.1 - 0.6 % 0.9 %
Source: Kosovo Agency of Statistics

76 |
Monthly Statistics Bulletin December 2015
Table 28.2. Import and producer prices
Description
Import price index Producer price index
2010=100 2010=100
2006 87.9 -
Q1 89.4 -
Q2 92.1 -
Q3 91.1 -
2007 Q4 91.6 -
Q1 95.0 -
Q2 100.9 -
Q3 102.5 -
2008 Q4 96.9 -
Q1 93.7 94.9
Q2 94.2 96.5
Q3 94.0 96.5
2009 Q4 94.3 96.6
Q1 95.7 97.1
Q2 99.0 98.0
Q3 101.4 101.1
2010 Q4 103.9 103.9
Q1 107.8 105.2
Q2 108.4 104.5
Q3 109.9 104.4
2011 Q4 111.0 104.2
Q1 113.9 104.6
Q2 114.9 105.8
Q3 115.4 107.1
2012 Q4 115.8 108.8
Q1 116.1 111.3
Q2 115.0 109.3
Q3 114.8 106.9
2013 Q4 114.8 109.0
Q1 115.5 109.8
Q2 114.3 109.5
Q3 114.8 110.8
2014 Q4 114.4 113.5
Q1 113.8 113.7
Q2 114.1 114.1
2015 Q3 114.0 113.8
Source: Kosovo Agency of Statistics

| 77
Buletini Mujor Statistikor
December 2015 Monthly Statistics Bulletin
Table 29.1. Balance of payments - main components
(In millions of euro)
Descreption
Balance from current and capital account Balance from financial account
Errors and
omission
Current account Capital account
Goods Services Primary income
Secondary income
Direct
investment Portfolio
investment Other
investment Reserve assets
2005 -228.7 -247.6 -1,078.5 -8.5 139.1 700.3 18.9 53.8 107.6 -17.5 -68.7 32.4 174.8
2006 -205.2 -226.1 -1,173.1 29.0 158.8 759.2 20.8 -35.7 289.2 -65.4 -181.7 -77.9 240.9
2007 -197.5 -214.0 -1,354.4 112.0 186.3 842.0 16.5 5.8 -431.0 34.5 108.0 294.3 203.3
2008 -450.5 -460.9 -1,644.7 146.6 164.0 873.2 10.5 -288.4 -341.5 109.9 -75.1 18.2 162.1
2009 -273.9 -374.2 -1,646.3 227.8 60.9 983.4 100.3 -113.1 -280.9 124.8 137.8 -94.8 160.9
2010 -494.4 -515.7 -1,741.6 176.4 67.0 982.5 21.3 -275.8 -331.1 48.6 -46.7 53.4 218.5
2011 -616.4 -658.4 -2,047.1 256.3 111.3 1,021.1 42.0 -377.5 -378.9 57.8 4.8 -61.2 238.9
2012 -367.2 -380.2 -2,050.1 323.8 153.6 1,192.5 12.9 -141.0 -213.3 185.7 -374.9 261.4 226.2
2013 -304.7 -339.4 -1,995.6 312.2 121.5 1,222.4 34.7 -132.2 -250.2 139.3 14.4 -35.7 172.5
2014 -415.8 -437.0 -2,058.6 335.9 113.8 1,171.9 21.2 -145.0 -123.8 13.3 22.6 -57.0 270.8
2011 Q1 -25.2 -38.5 -380.0 72.3 41.3 227.9 13.3 3.8 -81.7 53.1 -28.6 60.9 29.0
Q2 -158.5 -164.5 -511.4 66.7 28.4 251.7 6.0 -210.7 -98.6 49.7 -133.5 -28.2 -52.2
Q3 -190.4 -196.7 -554.4 60.0 21.2 276.4 6.3 23.8 -105.8 8.8 118.1 2.6 214.2
Q4 -242.3 -258.7 -601.5 57.2 20.4 265.1 16.4 -194.4 -92.9 -53.8 48.9 -96.5 47.9
2012 Q1 -21.8 -20.9 -369.4 43.8 37.4 267.2 -0.9 -13.8 -55.0 81.0 -47.8 8.0 8.0
Q2 -118.4 -120.9 -543.0 75.9 43.9 302.3 2.5 -86.4 -23.5 -37.0 -36.9 11.1 32.0
Q3 -145.2 -143.5 -605.5 122.8 20.3 318.9 -1.7 25.9 -88.5 163.2 -255.0 206.2 171.1
Q4 -81.8 -94.9 -532.2 81.3 51.9 304.1 13.0 -66.7 -46.3 -21.5 -35.1 36.2 15.1
2013 Q1 -2.8 -13.4 -390.7 60.6 42.4 274.3 10.6 10.1 -57.3 53.5 20.1 -6.3 12.9
Q2 -114.3 -117.5 -518.6 79.7 32.5 288.9 3.1 -138.1 -83.8 81.7 -150.6 14.6 -23.8
Q3 -90.1 -99.7 -551.9 124.1 2.1 326.0 9.7 58.1 -56.8 91.8 -46.2 69.3 148.1
Q4 -97.5 -108.8 -534.3 47.8 44.6 333.2 11.4 -62.2 -52.4 -87.7 191.1 -113.3 35.3
2014 Q1 -34.2 -37.6 -391.9 63.3 31.4 259.7 3.4 33.4 -37.5 50.2 26.8 -6.2 67.6
Q2 -158.4 -155.8 -538.5 75.1 31.4 276.1 -2.6 -115.8 -0.2 3.2 -97.1 -21.7 42.6
Q3 -83.8 -88.4 -582.7 138.0 23.5 332.9 4.6 44.8 -67.2 59.3 1.1 51.7 128.6
Q4 -139.4 -155.2 -545.5 59.5 27.5 303.3 15.8 -107.4 -19.0 -99.4 91.8 -80.8 32.0
2014 October -47.6 -50.1 -191.5 21.2 13.1 107.1 2.5 -9.3 -14.7 -36.4 38.0 3.7 38.3
November -69.9 -68.8 -169.0 21.9 4.9 73.5 -1.1 -44.7 -16.1 15.2 -53.3 9.5 25.2
December -21.9 -36.4 -185.0 16.4 9.5 122.7 14.4 -53.4 11.8 -78.1 107.0 -94.0 -31.4
2015 January 9.0 9.0 -102.0 17.8 11.4 81.9 0.0 64.4 -27.0 15.1 45.7 30.6 55.4
February -12.9 -13.8 -128.0 19.8 11.8 82.5 0.9 -13.1 -19.1 -19.5 31.8 -6.3 -0.2
March -29.1 -29.0 -156.6 21.9 13.5 92.2 -0.1 -21.2 -27.4 9.2 4.3 -7.3 7.9
April -57.2 -57.2 -177.5 25.0 1.3 93.9 0.1 -60.9 -44.7 3.5 -4.7 -15.0 -3.7
May -69.9 -69.2 -189.3 21.8 7.8 90.5 -0.8 -64.6 -26.1 55.3 -106.1 12.3 5.3
June -53.9 -53.5 -187.2 26.6 14.8 92.2 -0.3 -59.1 3.7 -8.7 -37.3 -16.9 -5.3
July 13.6 12.3 -189.7 71.0 14.6 116.4 1.3 18.6 -27.1 -12.9 -34.8 93.4 5.1
August -26.0 -25.5 -198.1 44.7 -2.0 129.9 -0.5 56.2 -43.0 19.6 64.2 15.4 82.1
September -86.5 -86.7 -187.6 20.9 -5.2 85.2 0.2 -62.6 -28.8 -7.8 -39.8 13.8 23.9
October -83.4 -83.2 -199.7 20.9 1.0 94.5 -0.2 -39.0 -31.5 -50.0 39.4 3.2 44.5
November -74.1 -73.4 -181.0 22.2 8.9 76.5 -0.8 -32.6 -8.7 3.2 10.3 -37.5 41.5
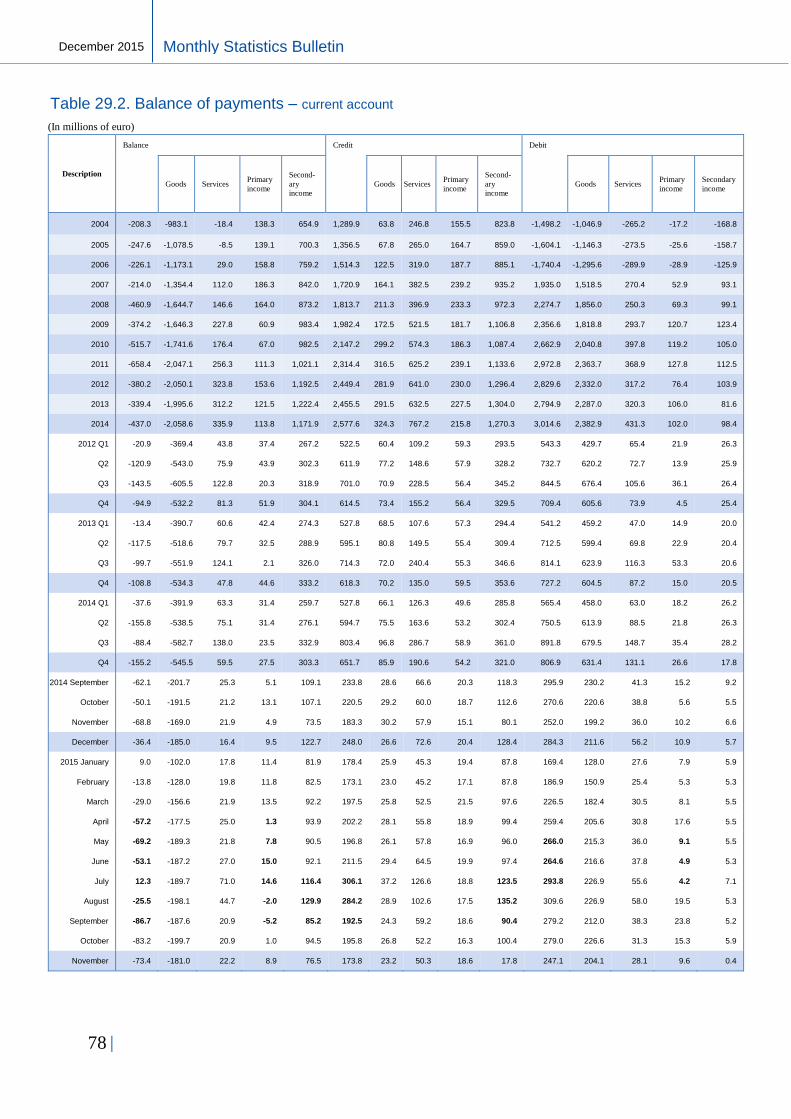
78 |
Monthly Statistics Bulletin December 2015
Table 29.2. Balance of payments – current account
(In millions of euro)
Description
Balance Credit Debit
Goods Services Primary
income
Second-
ary
income
Goods Services Primary
income
Second-
ary
income
Goods Services Primary
income
Secondary
income
2004 -208.3 -983.1 -18.4 138.3 654.9 1,289.9 63.8 246.8 155.5 823.8 -1,498.2 -1,046.9 -265.2 -17.2 -168.8
2005 -247.6 -1,078.5 -8.5 139.1 700.3 1,356.5 67.8 265.0 164.7 859.0 -1,604.1 -1,146.3 -273.5 -25.6 -158.7
2006 -226.1 -1,173.1 29.0 158.8 759.2 1,514.3 122.5 319.0 187.7 885.1 -1,740.4 -1,295.6 -289.9 -28.9 -125.9
2007 -214.0 -1,354.4 112.0 186.3 842.0 1,720.9 164.1 382.5 239.2 935.2 1,935.0 1,518.5 270.4 52.9 93.1
2008 -460.9 -1,644.7 146.6 164.0 873.2 1,813.7 211.3 396.9 233.3 972.3 2,274.7 1,856.0 250.3 69.3 99.1
2009 -374.2 -1,646.3 227.8 60.9 983.4 1,982.4 172.5 521.5 181.7 1,106.8 2,356.6 1,818.8 293.7 120.7 123.4
2010 -515.7 -1,741.6 176.4 67.0 982.5 2,147.2 299.2 574.3 186.3 1,087.4 2,662.9 2,040.8 397.8 119.2 105.0
2011 -658.4 -2,047.1 256.3 111.3 1,021.1 2,314.4 316.5 625.2 239.1 1,133.6 2,972.8 2,363.7 368.9 127.8 112.5
2012 -380.2 -2,050.1 323.8 153.6 1,192.5 2,449.4 281.9 641.0 230.0 1,296.4 2,829.6 2,332.0 317.2 76.4 103.9
2013 -339.4 -1,995.6 312.2 121.5 1,222.4 2,455.5 291.5 632.5 227.5 1,304.0 2,794.9 2,287.0 320.3 106.0 81.6
2014 -437.0 -2,058.6 335.9 113.8 1,171.9 2,577.6 324.3 767.2 215.8 1,270.3 3,014.6 2,382.9 431.3 102.0 98.4
2012 Q1 -20.9 -369.4 43.8 37.4 267.2 522.5 60.4 109.2 59.3 293.5 543.3 429.7 65.4 21.9 26.3
Q2 -120.9 -543.0 75.9 43.9 302.3 611.9 77.2 148.6 57.9 328.2 732.7 620.2 72.7 13.9 25.9
Q3 -143.5 -605.5 122.8 20.3 318.9 701.0 70.9 228.5 56.4 345.2 844.5 676.4 105.6 36.1 26.4
Q4 -94.9 -532.2 81.3 51.9 304.1 614.5 73.4 155.2 56.4 329.5 709.4 605.6 73.9 4.5 25.4
2013 Q1 -13.4 -390.7 60.6 42.4 274.3 527.8 68.5 107.6 57.3 294.4 541.2 459.2 47.0 14.9 20.0
Q2 -117.5 -518.6 79.7 32.5 288.9 595.1 80.8 149.5 55.4 309.4 712.5 599.4 69.8 22.9 20.4
Q3 -99.7 -551.9 124.1 2.1 326.0 714.3 72.0 240.4 55.3 346.6 814.1 623.9 116.3 53.3 20.6
Q4 -108.8 -534.3 47.8 44.6 333.2 618.3 70.2 135.0 59.5 353.6 727.2 604.5 87.2 15.0 20.5
2014 Q1 -37.6 -391.9 63.3 31.4 259.7 527.8 66.1 126.3 49.6 285.8 565.4 458.0 63.0 18.2 26.2
Q2 -155.8 -538.5 75.1 31.4 276.1 594.7 75.5 163.6 53.2 302.4 750.5 613.9 88.5 21.8 26.3
Q3 -88.4 -582.7 138.0 23.5 332.9 803.4 96.8 286.7 58.9 361.0 891.8 679.5 148.7 35.4 28.2
Q4 -155.2 -545.5 59.5 27.5 303.3 651.7 85.9 190.6 54.2 321.0 806.9 631.4 131.1 26.6 17.8
2014 September -62.1 -201.7 25.3 5.1 109.1 233.8 28.6 66.6 20.3 118.3 295.9 230.2 41.3 15.2 9.2
October -50.1 -191.5 21.2 13.1 107.1 220.5 29.2 60.0 18.7 112.6 270.6 220.6 38.8 5.6 5.5
November -68.8 -169.0 21.9 4.9 73.5 183.3 30.2 57.9 15.1 80.1 252.0 199.2 36.0 10.2 6.6
December -36.4 -185.0 16.4 9.5 122.7 248.0 26.6 72.6 20.4 128.4 284.3 211.6 56.2 10.9 5.7
2015 January 9.0 -102.0 17.8 11.4 81.9 178.4 25.9 45.3 19.4 87.8 169.4 128.0 27.6 7.9 5.9
February -13.8 -128.0 19.8 11.8 82.5 173.1 23.0 45.2 17.1 87.8 186.9 150.9 25.4 5.3 5.3
March -29.0 -156.6 21.9 13.5 92.2 197.5 25.8 52.5 21.5 97.6 226.5 182.4 30.5 8.1 5.5
April -57.2 -177.5 25.0 1.3 93.9 202.2 28.1 55.8 18.9 99.4 259.4 205.6 30.8 17.6 5.5
May -69.2 -189.3 21.8 7.8 90.5 196.8 26.1 57.8 16.9 96.0 266.0 215.3 36.0 9.1 5.5
June -53.1 -187.2 27.0 15.0 92.1 211.5 29.4 64.5 19.9 97.4 264.6 216.6 37.8 4.9 5.3
July 12.3 -189.7 71.0 14.6 116.4 306.1 37.2 126.6 18.8 123.5 293.8 226.9 55.6 4.2 7.1
August -25.5 -198.1 44.7 -2.0 129.9 284.2 28.9 102.6 17.5 135.2 309.6 226.9 58.0 19.5 5.3
September -86.7 -187.6 20.9 -5.2 85.2 192.5 24.3 59.2 18.6 90.4 279.2 212.0 38.3 23.8 5.2
October -83.2 -199.7 20.9 1.0 94.5 195.8 26.8 52.2 16.3 100.4 279.0 226.6 31.3 15.3 5.9
November -73.4 -181.0 22.2 8.9 76.5 173.8 23.2 50.3 18.6 17.8 247.1 204.1 28.1 9.6 0.4

| 79
Buletini Mujor Statistikor
December 2015 Monthly Statistics Bulletin
Table 29.3. Goods
(In millions of euro, cumulative within the year)
Description
Total goods
General merchandise on a balance of payments basis Net exports of goods under merchanting
(credit)
Nonmonetary gold
Credit
Debit Goods
acquired
under
merchanting
(negative
credit)
Goods sold
under
merchanting
(credit)
Credit
Debit
of which
Re-
exports
(credit)
2007 -1,354.4 -1,354.4 164.1 1,518.5 1.3 … … … … … …
2008 -1,644.7 -1,644.7 211.3 1,856.0 1.6 … … … … … …
2009 -1,646.3 -1,646.3 172.5 1,818.8 1.3 … … … … … …
2010 -1,741.6 -1,741.6 299.2 2,040.8 2.3 … … … … … …
2011 Q1 -2,047.1 -2,047.1 316.5 2,363.7 2.4 … … … … … …
Q2 -369.4 -369.4 60.4 429.7 0.4 … … … … … …
Q3 -912.4 -912.4 137.6 1,049.9 0.9 … … … … … …
Q4 -1,517.9 -1,517.9 208.5 1,726.4 1.6 … … … … … …
2012 Q1 -2,047.1 -2,047.1 316.5 2,363.7 2.4 … … … … … …
Q2 -369.4 -369.4 60.4 429.7 0.4 … … … … … …
Q3 -912.4 -912.4 137.6 1,049.9 0.9 … … … … … …
Q4 -2,050.1 -2,050.1 281.9 2,332.0 2.1 … … … … … …
2013 Q1 -390.7 -390.7 68.5 459.2 0.5 … … … … … …
Q2 -909.3 -909.3 149.3 1,058.6 1.0 … … … … … …
Q3 -1,461.2 -1,461.2 221.3 1,682.5 1.7 … … … … … …
Q4 -1,995.6 -1,995.6 291.5 2,287.0 2.2 … … … … … …
2014 Q1 -391.9 -391.9 66.1 458.0 0.4 … … … … … …
Q2 -930.4 -930.4 141.5 1,071.9 1.1 … … … … … …
Q3 -1,513.1 -1,513.1 238.3 1,751.5 3.0 … … … … … …
Q4 -2,058.6 -2,058.6 324.3 2,382.9 4.7 … … … … … …
2014 August -1,311.5 -1,311.5 209.8 1,521.2 2.3 … … … … … …
September -1,513.1 -1,513.1 238.3 1,751.5 3.0 … … … … … …
October -1,704.6 -1,704.6 267.5 1,972.1 3.3 … … … … … …
November -1,873.6 -1,873.6 297.7 2,171.3 4.0 … … … … … …
December -2,058.6 -2,058.6 324.3 2,382.9 4.7 … … … … … …
2015 January -102.0 -102.0 25.9 127.9 0.4 … … … … … …
February -230.0 -230.0 48.9 278.9 1.0 … … … … … …
March -386.6 -386.6 74.7 461.3 1.7 … … … … … …
April -564.1 -564.1 102.8 666.9 2.6 … … … … … …
May -753.3 -753.3 128.9 882.2 3.3 … … … … … …
June -940.5 -940.5 158.4 1,098.9 4.2 … … … … … …
July -1,130.2 -1,130.2 195.6 1,325.8 5.1 … … … … … …
August -1,328.3 -1,328.3 224.5 1,552.7 6.4 … … … … … …
September -1,515.9 -1,515.9 248.8 1,764.7 7.3 … … … … … …
October -1,715.6 -1,715.6 275.6 1,991.3 8.2 … … … … … …
November -1,896.6 -1,896.6 298.8 2,195.4 8.9 … … … … … …
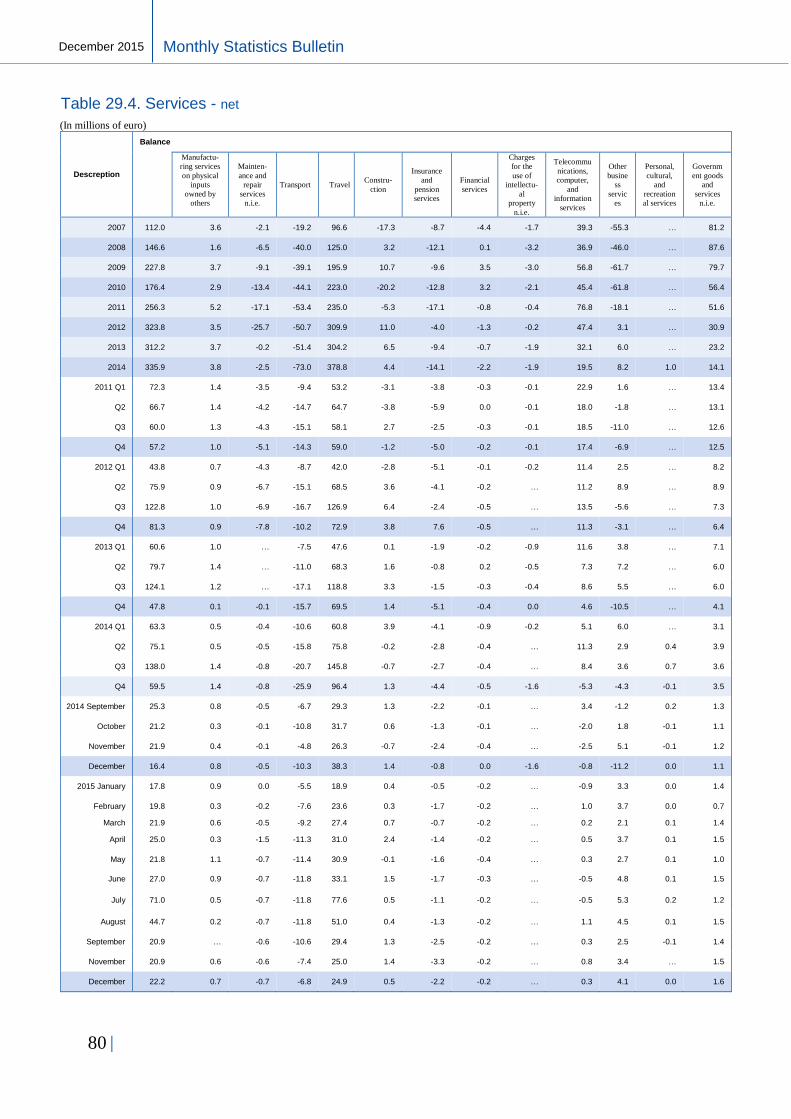
80 |
Monthly Statistics Bulletin December 2015
Table 29.4. Services - net
(In millions of euro)
Descreption
Balance
Manufactu-
ring services
on physical
inputs
owned by
others
Mainten-
ance and
repair
services
n.i.e.
Transport Travel Constru-
ction
Insurance
and
pension
services
Financial
services
Charges
for the
use of
intellectu-
al
property
n.i.e.
Telecommu
nications,
computer,
and
information
services
Other
busine
ss
servic
es
Personal,
cultural,
and
recreation
al services
Governm
ent goods
and
services
n.i.e.
2007 112.0 3.6 -2.1 -19.2 96.6 -17.3 -8.7 -4.4 -1.7 39.3 -55.3 … 81.2
2008 146.6 1.6 -6.5 -40.0 125.0 3.2 -12.1 0.1 -3.2 36.9 -46.0 … 87.6
2009 227.8 3.7 -9.1 -39.1 195.9 10.7 -9.6 3.5 -3.0 56.8 -61.7 … 79.7
2010 176.4 2.9 -13.4 -44.1 223.0 -20.2 -12.8 3.2 -2.1 45.4 -61.8 … 56.4
2011 256.3 5.2 -17.1 -53.4 235.0 -5.3 -17.1 -0.8 -0.4 76.8 -18.1 … 51.6
2012 323.8 3.5 -25.7 -50.7 309.9 11.0 -4.0 -1.3 -0.2 47.4 3.1 … 30.9
2013 312.2 3.7 -0.2 -51.4 304.2 6.5 -9.4 -0.7 -1.9 32.1 6.0 … 23.2
2014 335.9 3.8 -2.5 -73.0 378.8 4.4 -14.1 -2.2 -1.9 19.5 8.2 1.0 14.1
2011 Q1 72.3 1.4 -3.5 -9.4 53.2 -3.1 -3.8 -0.3 -0.1 22.9 1.6 … 13.4
Q2 66.7 1.4 -4.2 -14.7 64.7 -3.8 -5.9 0.0 -0.1 18.0 -1.8 … 13.1
Q3 60.0 1.3 -4.3 -15.1 58.1 2.7 -2.5 -0.3 -0.1 18.5 -11.0 … 12.6
Q4 57.2 1.0 -5.1 -14.3 59.0 -1.2 -5.0 -0.2 -0.1 17.4 -6.9 … 12.5
2012 Q1 43.8 0.7 -4.3 -8.7 42.0 -2.8 -5.1 -0.1 -0.2 11.4 2.5 … 8.2
Q2 75.9 0.9 -6.7 -15.1 68.5 3.6 -4.1 -0.2 … 11.2 8.9 … 8.9
Q3 122.8 1.0 -6.9 -16.7 126.9 6.4 -2.4 -0.5 … 13.5 -5.6 … 7.3
Q4 81.3 0.9 -7.8 -10.2 72.9 3.8 7.6 -0.5 … 11.3 -3.1 … 6.4
2013 Q1 60.6 1.0 … -7.5 47.6 0.1 -1.9 -0.2 -0.9 11.6 3.8 … 7.1
Q2 79.7 1.4 … -11.0 68.3 1.6 -0.8 0.2 -0.5 7.3 7.2 … 6.0
Q3 124.1 1.2 … -17.1 118.8 3.3 -1.5 -0.3 -0.4 8.6 5.5 … 6.0
Q4 47.8 0.1 -0.1 -15.7 69.5 1.4 -5.1 -0.4 0.0 4.6 -10.5 … 4.1
2014 Q1 63.3 0.5 -0.4 -10.6 60.8 3.9 -4.1 -0.9 -0.2 5.1 6.0 … 3.1
Q2 75.1 0.5 -0.5 -15.8 75.8 -0.2 -2.8 -0.4 … 11.3 2.9 0.4 3.9
Q3 138.0 1.4 -0.8 -20.7 145.8 -0.7 -2.7 -0.4 … 8.4 3.6 0.7 3.6
Q4 59.5 1.4 -0.8 -25.9 96.4 1.3 -4.4 -0.5 -1.6 -5.3 -4.3 -0.1 3.5
2014 September 25.3 0.8 -0.5 -6.7 29.3 1.3 -2.2 -0.1 … 3.4 -1.2 0.2 1.3
October 21.2 0.3 -0.1 -10.8 31.7 0.6 -1.3 -0.1 … -2.0 1.8 -0.1 1.1
November 21.9 0.4 -0.1 -4.8 26.3 -0.7 -2.4 -0.4 … -2.5 5.1 -0.1 1.2
December 16.4 0.8 -0.5 -10.3 38.3 1.4 -0.8 0.0 -1.6 -0.8 -11.2 0.0 1.1
2015 January 17.8 0.9 0.0 -5.5 18.9 0.4 -0.5 -0.2 … -0.9 3.3 0.0 1.4
February 19.8 0.3 -0.2 -7.6 23.6 0.3 -1.7 -0.2 … 1.0 3.7 0.0 0.7
March 21.9 0.6 -0.5 -9.2 27.4 0.7 -0.7 -0.2 … 0.2 2.1 0.1 1.4
April 25.0 0.3 -1.5 -11.3 31.0 2.4 -1.4 -0.2 … 0.5 3.7 0.1 1.5
May 21.8 1.1 -0.7 -11.4 30.9 -0.1 -1.6 -0.4 … 0.3 2.7 0.1 1.0
June 27.0 0.9 -0.7 -11.8 33.1 1.5 -1.7 -0.3 … -0.5 4.8 0.1 1.5
July 71.0 0.5 -0.7 -11.8 77.6 0.5 -1.1 -0.2 … -0.5 5.3 0.2 1.2
August 44.7 0.2 -0.7 -11.8 51.0 0.4 -1.3 -0.2 … 1.1 4.5 0.1 1.5
September 20.9 … -0.6 -10.6 29.4 1.3 -2.5 -0.2 … 0.3 2.5 -0.1 1.4
November 20.9 0.6 -0.6 -7.4 25.0 1.4 -3.3 -0.2 … 0.8 3.4 … 1.5
December 22.2 0.7 -0.7 -6.8 24.9 0.5 -2.2 -0.2 … 0.3 4.1 0.0 1.6

| 81
Buletini Mujor Statistikor
December 2015 Monthly Statistics Bulletin
Table 29.5. Services - credit
(In millions of euro)
Descreption
Credit
Manufacturi
ng services
on physical
inputs
owned by
others
Maintenan
ce and
repair
services
n.i.e.
Transport Travel Construction
Insurance
and
pension
services
Financial
services
Charges
for the
use of
intellectua
l property
n.i.e.
Telecommunicat
ions, computer,
and information
services
Other
business
services
Personal,
cultural,
and
recreation
al services
Governm
ent goods
and
services
n.i.e.
2007 382.5 13.1 … 31.6 146.4 2.9 11.5 1.5 0.1 58.3 32.4 … 84.7
2008 396.9 5.3 … 29.0 177.6 8.9 12.1 2.7 0.5 57.3 13.6 … 90.0
2009 521.5 4.8 … 30.1 277.6 15.7 14.8 5.4 1.2 72.5 18.2 … 81.4
2010 574.3 5.7 … 31.2 327.7 6.4 15.5 3.7 0.6 79.7 40.9 … 62.7
2011 625.2 8.4 … 28.6 336.6 13.7 13.9 0.3 … 96.9 75.3 … 51.6
2012 641.0 5.0 … 29.3 383.4 22.4 25.3 0.7 0.1 70.4 61.6 … 42.9
2013 632.5 13.6 … 36.6 404.8 9.4 22.7 2.0 0.4 59.8 44.3 … 39.0
2014 767.2 12.3 … 26.6 504.2 12.0 21.8 0.1 0.2 77.7 75.0 2.5 34.7
2011 Q1 137.9 2.3 … 7.6 63.7 1.0 2.5 0.2 … 27.1 20.2 … 13.4
Q2 147.8 2.4 … 4.9 80.0 0.7 2.3 0.0 … 26.2 18.2 … 13.1
Q3 198.9 1.8 … 8.5 121.2 8.3 5.5 0.1 … 22.3 18.6 … 12.6
Q4 140.5 1.9 … 7.6 71.6 3.6 3.6 0.1 … 21.3 18.3 … 12.5
2012 Q1 109.2 1.1 … 6.6 51.1 1.2 2.6 … … 16.1 18.6 … 11.9
Q2 148.6 1.7 … 5.8 83.1 4.0 4.4 … 0.1 16.5 21.6 … 11.3
Q3 228.5 1.0 … 5.8 166.7 10.0 7.2 0.1 … 18.7 9.3 … 9.6
Q4 155.2 1.2 … 11.1 82.9 7.2 11.1 0.5 … 19.1 12.0 … 10.1
2013 Q1 107.6 3.3 … 6.9 53.6 0.4 4.8 0.1 0.1 17.7 11.1 … 9.6
Q2 149.5 3.5 … 12.8 89.8 2.3 7.1 0.5 0.1 13.3 9.6 … 10.4
Q3 240.4 3.9 … 10.9 176.2 4.9 6.7 1.1 … 15.5 11.0 … 10.1
Q4 135.0 2.8 … 6.1 85.2 1.9 4.0 0.2 0.1 13.2 12.6 … 8.8
2014 Q1 126.3 2.0 … 5.2 73.1 4.4 2.9 … … 10.7 18.6 0.6 8.8
Q2 163.6 2.8 … 6.3 100.7 1.9 6.7 … 0.1 17.3 18.1 0.9 8.8
Q3 286.7 3.8 … 8.4 210.2 2.3 7.1 … … 26.9 18.5 0.8 8.6
Q4 190.6 3.8 … 6.6 120.2 3.4 5.1 … … 22.8 19.8 0.2 8.6
2014 September 66.6 1.6 … 2.9 40.6 1.4 1.2 … … 8.9 6.8 0.2 2.8
October 60.0 1.1 … 2.5 38.3 0.9 1.5 … … 7.6 5.3 0.1 2.9
November 57.9 1.1 … 1.8 34.4 0.8 1.4 … … 7.2 8.2 0.0 2.9
December 72.6 1.6 … 2.3 47.5 1.6 2.3 … … 8.0 6.3 0.1 2.9
2015 January 45.3 1.2 … 2.4 27.8 0.8 1.9 … … 3.8 4.4 0.1 2.9
February 45.2 1.0 … 1.8 27.7 0.4 1.0 … … 5.2 5.1 0.1 2.8
March 52.5 1.4 … 2.5 32.8 0.8 1.8 … … 5.3 5.0 0.1 2.8
April 55.8 0.5 … 1.9 36.2 2.5 1.8 0.0 … 4.8 4.9 0.2 2.9
May 57.8 2.2 … 2.7 39.2 0.8 1.6 0.1 … 4.1 4.1 0.2 2.9
June 64.5 2.1 … 2.4 43.6 1.6 1.5 0.0 … 4.1 5.9 0.2 2.9
July 126.5 1.6 … 3.3 104.2 0.9 2.3 0.0 … 4.6 6.4 0.3 2.9
August 102.5 0.5 … 3.8 81.7 1.0 2.0 0.1 … 5.2 5.2 0.1 2.9
September 59.2 0.6 … 3.5 40.9 1.4 0.9 0.0 … 4.6 4.3 0.1 2.9
October 52.2 0.9 … 3.4 32.8 1.9 0.7 0.0 … 4.9 4.6 0.0 2.9
November 50.3 1.0 … 2.5 32.2 0.8 1.3 0.1 … 4.0 5.4 0.1 3.0
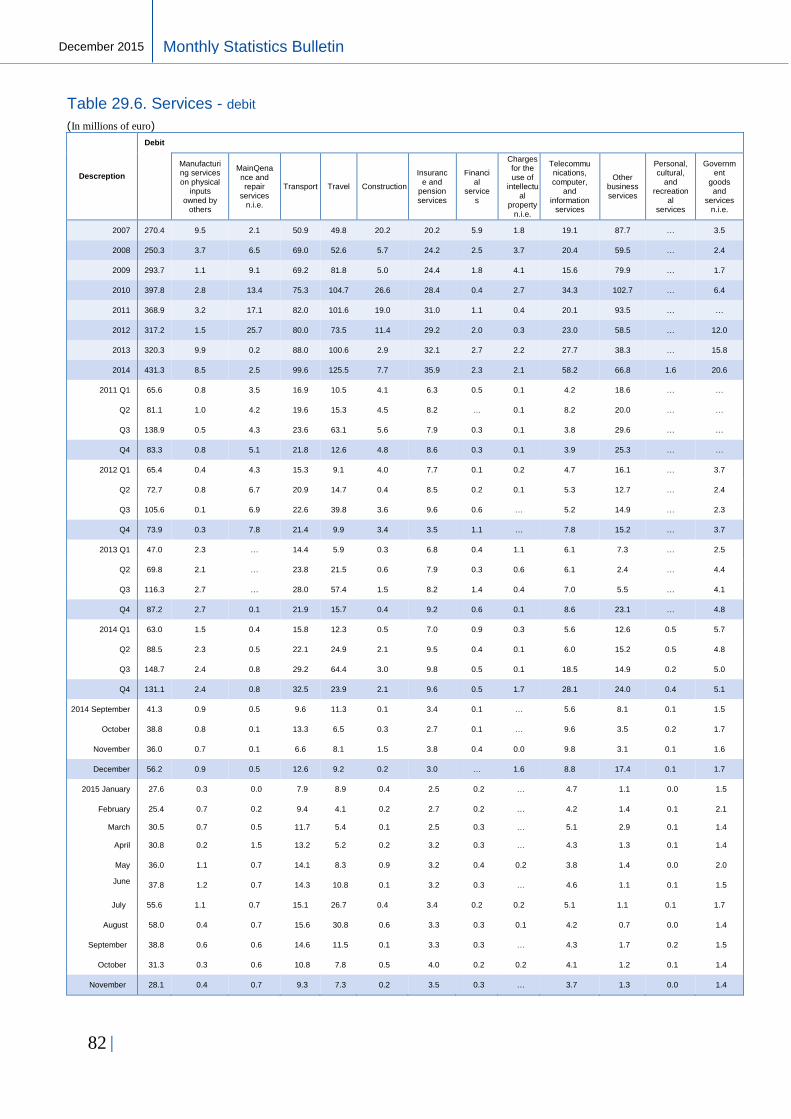
82 |
Monthly Statistics Bulletin December 2015
Table 29.6. Services - debit
(In millions of euro)
Descreption
Debit
Manufacturing services on physical
inputs owned by
others
MainQenance and repair
services n.i.e.
Transport Travel Construction
Insurance and
pension services
Financial
services
Charges for the use of
intellectual
property n.i.e.
Telecommunications, computer,
and information
services
Other business services
Personal, cultural,
and recreation
al services
Government
goods and
services n.i.e.
2007 270.4 9.5 2.1 50.9 49.8 20.2 20.2 5.9 1.8 19.1 87.7 … 3.5
2008 250.3 3.7 6.5 69.0 52.6 5.7 24.2 2.5 3.7 20.4 59.5 … 2.4
2009 293.7 1.1 9.1 69.2 81.8 5.0 24.4 1.8 4.1 15.6 79.9 … 1.7
2010 397.8 2.8 13.4 75.3 104.7 26.6 28.4 0.4 2.7 34.3 102.7 … 6.4
2011 368.9 3.2 17.1 82.0 101.6 19.0 31.0 1.1 0.4 20.1 93.5 … …
2012 317.2 1.5 25.7 80.0 73.5 11.4 29.2 2.0 0.3 23.0 58.5 … 12.0
2013 320.3 9.9 0.2 88.0 100.6 2.9 32.1 2.7 2.2 27.7 38.3 … 15.8
2014 431.3 8.5 2.5 99.6 125.5 7.7 35.9 2.3 2.1 58.2 66.8 1.6 20.6
2011 Q1 65.6 0.8 3.5 16.9 10.5 4.1 6.3 0.5 0.1 4.2 18.6 … …
Q2 81.1 1.0 4.2 19.6 15.3 4.5 8.2 … 0.1 8.2 20.0 … …
Q3 138.9 0.5 4.3 23.6 63.1 5.6 7.9 0.3 0.1 3.8 29.6 … …
Q4 83.3 0.8 5.1 21.8 12.6 4.8 8.6 0.3 0.1 3.9 25.3 … …
2012 Q1 65.4 0.4 4.3 15.3 9.1 4.0 7.7 0.1 0.2 4.7 16.1 … 3.7
Q2 72.7 0.8 6.7 20.9 14.7 0.4 8.5 0.2 0.1 5.3 12.7 … 2.4
Q3 105.6 0.1 6.9 22.6 39.8 3.6 9.6 0.6 … 5.2 14.9 … 2.3
Q4 73.9 0.3 7.8 21.4 9.9 3.4 3.5 1.1 … 7.8 15.2 … 3.7
2013 Q1 47.0 2.3 … 14.4 5.9 0.3 6.8 0.4 1.1 6.1 7.3 … 2.5
Q2 69.8 2.1 … 23.8 21.5 0.6 7.9 0.3 0.6 6.1 2.4 … 4.4
Q3 116.3 2.7 … 28.0 57.4 1.5 8.2 1.4 0.4 7.0 5.5 … 4.1
Q4 87.2 2.7 0.1 21.9 15.7 0.4 9.2 0.6 0.1 8.6 23.1 … 4.8
2014 Q1 63.0 1.5 0.4 15.8 12.3 0.5 7.0 0.9 0.3 5.6 12.6 0.5 5.7
Q2 88.5 2.3 0.5 22.1 24.9 2.1 9.5 0.4 0.1 6.0 15.2 0.5 4.8
Q3 148.7 2.4 0.8 29.2 64.4 3.0 9.8 0.5 0.1 18.5 14.9 0.2 5.0
Q4 131.1 2.4 0.8 32.5 23.9 2.1 9.6 0.5 1.7 28.1 24.0 0.4 5.1
2014 September 41.3 0.9 0.5 9.6 11.3 0.1 3.4 0.1 … 5.6 8.1 0.1 1.5
October 38.8 0.8 0.1 13.3 6.5 0.3 2.7 0.1 … 9.6 3.5 0.2 1.7
November 36.0 0.7 0.1 6.6 8.1 1.5 3.8 0.4 0.0 9.8 3.1 0.1 1.6
December 56.2 0.9 0.5 12.6 9.2 0.2 3.0 … 1.6 8.8 17.4 0.1 1.7
2015 January 27.6 0.3 0.0 7.9 8.9 0.4 2.5 0.2 … 4.7 1.1 0.0 1.5
February 25.4 0.7 0.2 9.4 4.1 0.2 2.7 0.2 … 4.2 1.4 0.1 2.1
March 30.5 0.7 0.5 11.7 5.4 0.1 2.5 0.3 … 5.1 2.9 0.1 1.4
April 30.8 0.2 1.5 13.2 5.2 0.2 3.2 0.3 … 4.3 1.3 0.1 1.4
May 36.0 1.1 0.7 14.1 8.3 0.9 3.2 0.4 0.2 3.8 1.4 0.0 2.0
June
37.8 1.2 0.7 14.3 10.8 0.1 3.2 0.3 … 4.6 1.1 0.1 1.5
July 55.6 1.1 0.7 15.1 26.7 0.4 3.4 0.2 0.2 5.1 1.1 0.1 1.7
August 58.0 0.4 0.7 15.6 30.8 0.6 3.3 0.3 0.1 4.2 0.7 0.0 1.4
September 38.8 0.6 0.6 14.6 11.5 0.1 3.3 0.3 … 4.3 1.7 0.2 1.5
October 31.3 0.3 0.6 10.8 7.8 0.5 4.0 0.2 0.2 4.1 1.2 0.1 1.4
November 28.1 0.4 0.7 9.3 7.3 0.2 3.5 0.3 … 3.7 1.3 0.0 1.4

| 83
Buletini Mujor Statistikor
December 2015 Monthly Statistics Bulletin
Table 29.7. Primary income
(In millions of euro)
Descreption
Balance Credit Debit
Compensation of
employees
Investment
income
Other
primary
income
Compensation of
employees
Investment
income
Other
primary
income
Compensation of
employees
Investment
income
Other
primary
income
2007 186.3 154.9 31.5 … 239.2 155.6 83.6 … 52.9 0.8 52.2 …
2008 164.0 175.4 -11.4 … 233.3 176.2 57.1 … 69.3 0.8 68.5 …
2009 60.9 168.7 -107.8 … 181.7 169.7 12.0 … 120.7 0.9 119.8 …
2010 67.0 171.6 -104.6 … 186.3 176.1 10.1 … 119.2 4.5 114.7 …
2011 111.3 208.2 -96.9 … 239.1 221.3 17.8 … 127.8 13.1 114.7 …
2012 153.6 214.3 -60.6 … 230.0 219.9 10.1 … 76.4 5.6 70.8 …
2013 121.5 218.9 -97.4 … 227.5 223.2 4.3 … 106.0 4.3 101.6 …
2014 113.8 200.4 -85.9 -0.7 215.8 206.5 8.0 1.3 102.0 6.1 93.9 2.0
Q1 41.3 50.2 -8.9 … 56.1 52.6 3.5 … 14.8 2.4 12.4 …
Q2 28.4 55.7 -27.3 … 63.2 58.8 4.5 … 34.8 3.0 31.8 …
Q3 21.2 54.2 -33.0 … 62.4 57.5 4.8 … 41.2 3.3 37.8 …
2011 Q4 20.4 48.1 -27.7 … 57.3 52.3 5.0 … 37.0 4.3 32.7 …
Q1 37.4 53.1 -15.7 … 59.3 55.6 3.7 … 21.9 2.5 19.4 …
Q2 43.9 53.6 -9.6 … 57.9 55.2 2.7 … 13.9 1.6 12.4 …
Q3 20.3 53.1 -32.8 … 56.4 53.7 2.7 … 36.1 0.7 35.4 …
2012 Q4 51.9 54.5 -2.5 … 56.4 55.4 1.0 … 4.5 0.9 3.5 …
Q1 42.4 55.4 -13.0 … 57.3 56.0 1.2 … 14.9 0.6 14.2 …
Q2 32.5 52.8 -20.3 … 55.4 53.9 1.5 … 22.9 1.1 21.7 …
Q3 2.1 53.8 -51.8 … 55.3 54.9 0.4 … 53.3 1.1 52.2 …
2013 Q4 44.6 56.9 -12.3 … 59.5 58.4 1.1 … 15.0 1.5 13.5 …
2014 Q1 31.4 46.1 -14.8 … 49.6 48.1 1.5 … 18.2 2.0 16.2 …
Q2 31.4 49.9 -18.6 0.1 53.2 50.8 1.9 0.5 21.8 0.9 20.5 0.4
Q3 23.5 54.2 -30.8 0.1 58.9 55.2 3.2 0.5 35.4 1.0 34.0 0.4
Q4 27.5 50.2 -21.8 -0.9 54.2 52.4 1.5 0.3 26.6 2.2 23.3 1.2
2014 September 5.1 18.8 -13.7 0.0 20.3 19.1 1.1 0.1 15.2 0.3 14.8 0.1
October 13.1 17.7 -4.6 0.0 18.7 18.0 0.5 0.1 5.6 0.3 5.2 0.1
November 4.9 13.0 -7.4 -0.8 15.1 14.5 0.5 0.1 10.2 1.4 7.8 0.9
December 9.5 19.4 -9.8 -0.1 20.4 19.9 0.5 0.0 10.9 0.4 10.3 0.1
2015 January 11.4 17.9 -6.6 0.0 19.4 18.4 0.8 0.1 7.9 0.5 7.4 0.1
February 11.8 16.1 -4.4 0.0 17.1 16.4 0.6 0.1 5.3 0.3 4.9 0.1
March 13.5 18.2 -4.5 -0.3 21.5 18.8 2.6 0.1 8.1 0.6 7.1 0.3
April 1.3 17.8 -16.4 -0.2 18.9 18.2 0.6 0.1 17.6 0.4 17.0 0.3
May 7.8 15.9 -8.1 0.0 16.9 16.2 0.6 0.1 9.1 0.3 8.7 0.1
June 15.0 18.8 -3.9 0.0 19.9 19.2 0.5 0.1 4.9 0.4 4.4 0.1
July 14.6 17.5 -3.2 0.4 18.8 17.8 0.6 0.4 4.2 0.3 3.8 0.1
August -2.0 16.5 -18.2 -0.2 17.5 16.7 0.5 0.3 19.5 0.2 18.7 0.5
September -5.2 17.7 -22.9 0.0 18.6 17.9 0.5 0.1 23.8 0.2 23.4 0.1
October 1.0 14.9 -13.7 -0.2 16.3 15.4 0.7 0.2 15.3 0.5 14.4 0.3
November 8.9 17.4 -8.0 -7.7 18.6 17.8 0.6 0.1 9.6 0.4 8.6 7.9

84 |
Monthly Statistics Bulletin December 2015
Table 29.8. Secondary income
(In millions of euro)
Descreption
Secondary income Credit Debit
General
government
Financial corporations, nonfinancial corporations, households, and NPISHs
General government
Financial corporations, nonfinancial corporations,
households, and NPISHs
General government
Financial corporations, nonfinancial corporations,
households, and NPISHs
2007 842.0 245.1 596.9 935.2 251.4 683.8 93.1 6.3 86.8
2008 873.2 223.5 649.7 972.3 223.5 748.8 99.1 … 99.1
2009 983.4 322.9 660.5 1,106.8 322.9 783.9 123.4 … 123.4
2010 982.5 319.5 662.9 1,087.4 319.5 767.9 105.0 … 105.0
2011 1,021.1 322.2 698.9 1,133.6 322.2 811.4 112.5 … 112.5
2012 1,192.5 401.6 791.0 1,296.4 401.6 894.9 103.9 … 103.9
2013 1,222.4 341.9 880.5 1,304.0 341.9 962.0 81.6 … 81.6
2014 1,171.9 291.9 880.0 1,270.3 291.9 978.4 98.4 … 98.4
2011 Q1 227.9 79.4 148.5 255.1 79.4 175.7 27.2 … 27.2
Q2 251.7 86.6 165.1 280.8 86.6 194.2 29.1 … 29.1
Q3 276.4 81.7 194.7 304.6 81.7 222.9 28.2 … 28.2
Q4 265.1 74.5 190.6 293.0 74.5 218.5 27.9 … 27.9
2012 Q1 267.2 102.1 165.2 293.5 102.1 191.5 26.3 … 26.3
Q2 302.3 118.7 183.6 328.2 118.7 209.5 25.9 … 25.9
Q3 318.9 93.3 225.5 345.2 93.3 251.9 26.4 … 26.4
Q4 304.1 87.5 216.6 329.5 87.5 242.0 25.4 … 25.4
2013 Q1 274.3 90.3 184.1 301.3 90.3 211.0 27.0 … 27.0
Q2 288.9 86.6 202.3 316.3 86.6 229.7 27.4 … 27.4
Q3 326.0 69.9 256.1 353.6 69.9 283.6 27.6 … 27.6
Q4 333.2 122.9 210.3 360.5 122.9 237.7 27.4 … 27.4
2014 Q1 259.7 88.9 170.7 285.8 88.9 196.9 26.2 … 26.2
Q2 276.1 68.5 207.6 302.4 68.5 233.9 26.3 … 26.3
Q3 332.9 74.2 258.7 361.0 74.2 286.8 28.2 … 28.2
Q4 303.3 60.3 243.0 321.0 60.3 260.8 17.8 … 17.8
2014 September 109.1 36.2 72.9 118.3 36.2 82.2 9.2 … 9.2
October 107.1 19.3 87.7 112.6 19.3 93.3 5.5 … 5.5
November 73.5 12.9 60.6 80.1 12.9 67.2 6.6 … 6.6
December 122.7 28.1 94.6 128.4 28.1 100.3 5.7 … 5.7
2015 January 81.9 13.6 68.3 87.8 13.6 74.2 5.9 … 5.9
February 82.5 17.5 65.0 87.8 17.5 70.3 5.3 … 5.3
March 92.2 18.6 73.6 97.6 18.6 79.0 5.5 … 5.5
April 93.9 17.9 76.0 99.4 17.9 81.5 5.5 … 5.5
May 90.5 14.6 75.9 96.0 14.6 81.4 5.5 … 5.5
June 92.1 17.3 74.8 97.4 17.3 80.1 5.3 … 5.3
July 116.4 22.1 94.3 123.5 22.1 101.3 7.1 … 7.1
August 129.9 15.1 114.8 135.2 15.1 120.0 5.3 … 5.3
September 85.2 15.3 69.9 90.4 15.3 75.1 5.2 … 5.2
October 94.5 16.9 77.7 100.4 16.9 83.5 5.9 … 5.9
November 76.5 12.9 63.6 81.7 12.9 68.8 5.2 … 5.2

| 85
Buletini Mujor Statistikor
December 2015 Monthly Statistics Bulletin
Table 29.8.1 Remittances – by channels
(In millions of euro)
Description Total
Banks MTC Other
2004 357.0 . . .
2005 418.0 . . .
2006 467.1 135.1 184.7 147.3
2007 515.6 137.1 198.7 179.8
2008 608.7 126.3 213.1 269.3
2009 585.7 148.8 213.1 223.8
2010 584.3 141.3 213.1 229.9
2011 584.8 139.7 225.3 219.8
2012 605.6 126.5 218.5 260.6
2013 620.8 158.9 211.4 250.5
2014 693.7 175.3 272.6 245.7
Q1 125.1 30.3 50.1 44.7
Q2 138.2 25.2 55.1 57.9
Q3 164.9 48.9 55.7 60.3
2011 Q4 156.6 35.2 64.5 56.9
Q1 119.1 23.3 47.1 48.7
Q2 142.4 21.8 55.0 65.6
Q3 175.2 56.3 52.0 66.9
2012 Q4 168.9 25.1 64.5 79.3
Q1 127.8 33.1 45.6 49.1
Q2 144.6 32.9 51.5 60.2
Q3 182.2 60.8 52.5 68.9
2013 Q4 166.2 32.1 61.8 72.3
2014 Q1 130.9 29.9 54.6 46.4
Q2 160.3 35.0 68.4 56.9
Q3 214.4 71.8 65.8 76.9
Q4 188.1 38.7 83.8 65.6
2014 September 59.2 10.3 25.9 23.0
October 70.4 13.2 32.7 24.5
November 50.2 7.2 24.9 18.2
December 67.5 18.3 26.3 23.0
2015 January 56.3 16.7 22.5 17.2
February 47.8 7.3 24.8 15.7
March 55.2 11.3 25.8 18.1
April 57.7 13.7 25.4 18.6
May 62.2 13.8 27.8 20.6
June 58.0 10.7 28.5 18.7
July 75.7 25.7 25.6 24.4
August 97.6 43.4 23.2 31.0
September 55.6 9.4 28.2 18.0
October 62.0 11.1 28.4 22.5
November 51.9 7.9 26.8 17.3
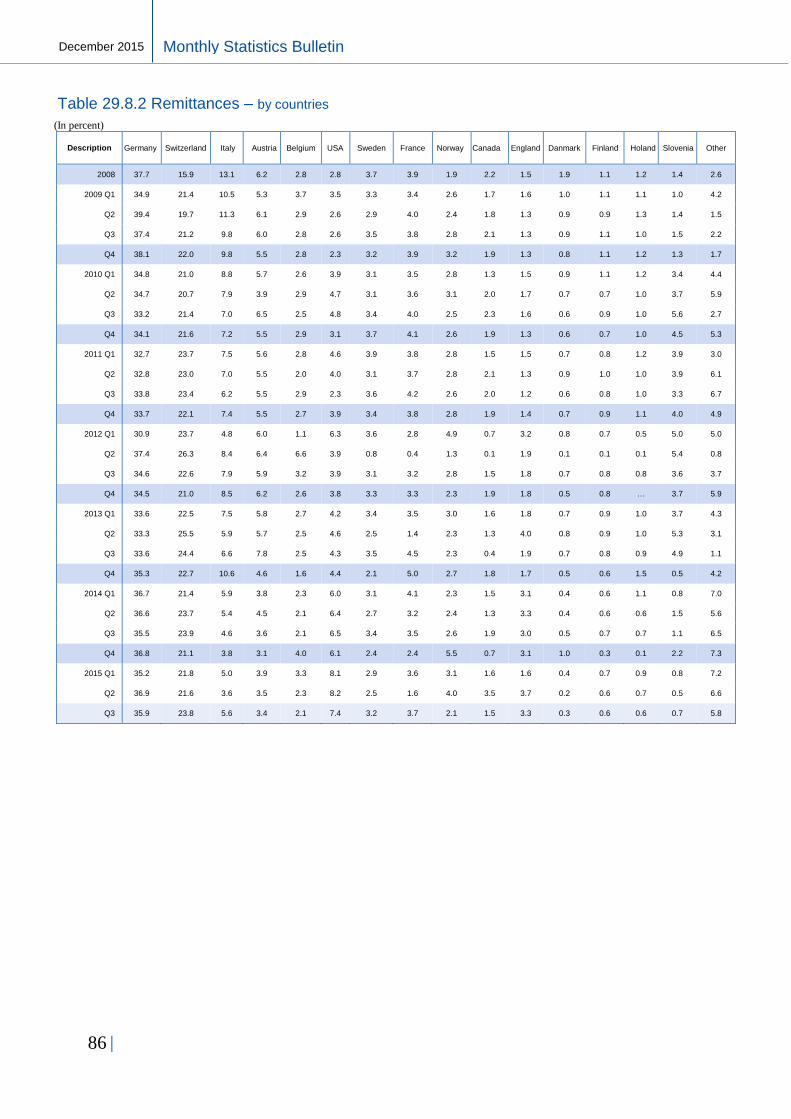
86 |
Monthly Statistics Bulletin December 2015
Table 29.8.2 Remittances – by countries
(In percent)
Description Germany Switzerland Italy Austria Belgium USA Sweden France Norway Canada England Danmark Finland Holand Slovenia Other
2008 37.7 15.9 13.1 6.2 2.8 2.8 3.7 3.9 1.9 2.2 1.5 1.9 1.1 1.2 1.4 2.6
2009 Q1 34.9 21.4 10.5 5.3 3.7 3.5 3.3 3.4 2.6 1.7 1.6 1.0 1.1 1.1 1.0 4.2
Q2 39.4 19.7 11.3 6.1 2.9 2.6 2.9 4.0 2.4 1.8 1.3 0.9 0.9 1.3 1.4 1.5
Q3 37.4 21.2 9.8 6.0 2.8 2.6 3.5 3.8 2.8 2.1 1.3 0.9 1.1 1.0 1.5 2.2
Q4 38.1 22.0 9.8 5.5 2.8 2.3 3.2 3.9 3.2 1.9 1.3 0.8 1.1 1.2 1.3 1.7
2010 Q1 34.8 21.0 8.8 5.7 2.6 3.9 3.1 3.5 2.8 1.3 1.5 0.9 1.1 1.2 3.4 4.4
Q2 34.7 20.7 7.9 3.9 2.9 4.7 3.1 3.6 3.1 2.0 1.7 0.7 0.7 1.0 3.7 5.9
Q3 33.2 21.4 7.0 6.5 2.5 4.8 3.4 4.0 2.5 2.3 1.6 0.6 0.9 1.0 5.6 2.7
Q4 34.1 21.6 7.2 5.5 2.9 3.1 3.7 4.1 2.6 1.9 1.3 0.6 0.7 1.0 4.5 5.3
2011 Q1 32.7 23.7 7.5 5.6 2.8 4.6 3.9 3.8 2.8 1.5 1.5 0.7 0.8 1.2 3.9 3.0
Q2 32.8 23.0 7.0 5.5 2.0 4.0 3.1 3.7 2.8 2.1 1.3 0.9 1.0 1.0 3.9 6.1
Q3 33.8 23.4 6.2 5.5 2.9 2.3 3.6 4.2 2.6 2.0 1.2 0.6 0.8 1.0 3.3 6.7
Q4 33.7 22.1 7.4 5.5 2.7 3.9 3.4 3.8 2.8 1.9 1.4 0.7 0.9 1.1 4.0 4.9
2012 Q1 30.9 23.7 4.8 6.0 1.1 6.3 3.6 2.8 4.9 0.7 3.2 0.8 0.7 0.5 5.0 5.0
Q2 37.4 26.3 8.4 6.4 6.6 3.9 0.8 0.4 1.3 0.1 1.9 0.1 0.1 0.1 5.4 0.8
Q3 34.6 22.6 7.9 5.9 3.2 3.9 3.1 3.2 2.8 1.5 1.8 0.7 0.8 0.8 3.6 3.7
Q4 34.5 21.0 8.5 6.2 2.6 3.8 3.3 3.3 2.3 1.9 1.8 0.5 0.8 … 3.7 5.9
2013 Q1 33.6 22.5 7.5 5.8 2.7 4.2 3.4 3.5 3.0 1.6 1.8 0.7 0.9 1.0 3.7 4.3
Q2 33.3 25.5 5.9 5.7 2.5 4.6 2.5 1.4 2.3 1.3 4.0 0.8 0.9 1.0 5.3 3.1
Q3 33.6 24.4 6.6 7.8 2.5 4.3 3.5 4.5 2.3 0.4 1.9 0.7 0.8 0.9 4.9 1.1
Q4 35.3 22.7 10.6 4.6 1.6 4.4 2.1 5.0 2.7 1.8 1.7 0.5 0.6 1.5 0.5 4.2
2014 Q1 36.7 21.4 5.9 3.8 2.3 6.0 3.1 4.1 2.3 1.5 3.1 0.4 0.6 1.1 0.8 7.0
Q2 36.6 23.7 5.4 4.5 2.1 6.4 2.7 3.2 2.4 1.3 3.3 0.4 0.6 0.6 1.5 5.6
Q3 35.5 23.9 4.6 3.6 2.1 6.5 3.4 3.5 2.6 1.9 3.0 0.5 0.7 0.7 1.1 6.5
Q4 36.8 21.1 3.8 3.1 4.0 6.1 2.4 2.4 5.5 0.7 3.1 1.0 0.3 0.1 2.2 7.3
2015 Q1 35.2 21.8 5.0 3.9 3.3 8.1 2.9 3.6 3.1 1.6 1.6 0.4 0.7 0.9 0.8 7.2
Q2 36.9 21.6 3.6 3.5 2.3 8.2 2.5 1.6 4.0 3.5 3.7 0.2 0.6 0.7 0.5 6.6
Q3 35.9 23.8 5.6 3.4 2.1 7.4 3.2 3.7 2.1 1.5 3.3 0.3 0.6 0.6 0.7 5.8
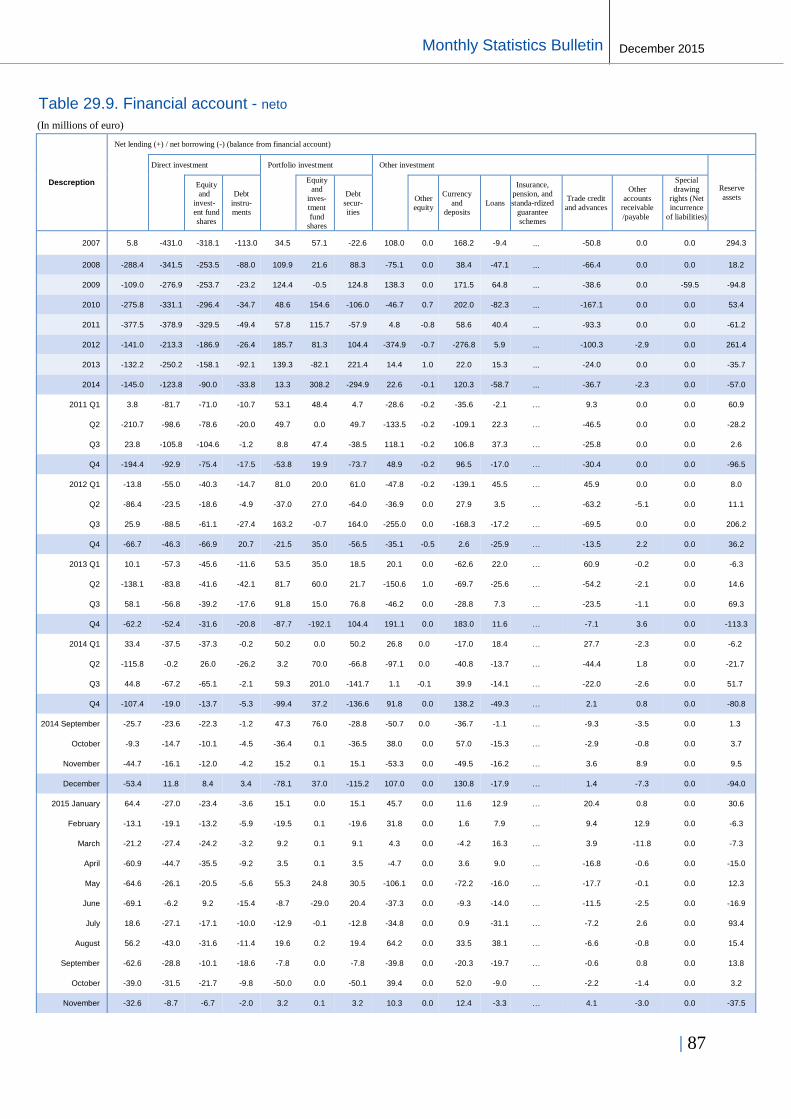
| 87
Buletini Mujor Statistikor
December 2015 Monthly Statistics Bulletin
Table 29.9. Financial account - neto
(In millions of euro)
Descreption
Net lending (+) / net borrowing (-) (balance from financial account)
Direct investment Portfolio investment Other investment
Reserve
assets
Equity
and
invest-
ent fund
shares
Debt
instru-
ments
Equity
and
inves-
tment
fund
shares
Debt
secur-
ities
Other
equity
Currency
and
deposits
Loans
Insurance,
pension, and
standa-rdized
guarantee
schemes
Trade credit
and advances
Other
accounts
receivable
/payable
Special
drawing
rights (Net
incurrence
of liabilities)
2007 5.8 -431.0 -318.1 -113.0 34.5 57.1 -22.6 108.0 0.0 168.2 -9.4 … -50.8 0.0 0.0 294.3
2008 -288.4 -341.5 -253.5 -88.0 109.9 21.6 88.3 -75.1 0.0 38.4 -47.1 … -66.4 0.0 0.0 18.2
2009 -109.0 -276.9 -253.7 -23.2 124.4 -0.5 124.8 138.3 0.0 171.5 64.8 … -38.6 0.0 -59.5 -94.8
2010 -275.8 -331.1 -296.4 -34.7 48.6 154.6 -106.0 -46.7 0.7 202.0 -82.3 … -167.1 0.0 0.0 53.4
2011 -377.5 -378.9 -329.5 -49.4 57.8 115.7 -57.9 4.8 -0.8 58.6 40.4 … -93.3 0.0 0.0 -61.2
2012 -141.0 -213.3 -186.9 -26.4 185.7 81.3 104.4 -374.9 -0.7 -276.8 5.9 … -100.3 -2.9 0.0 261.4
2013 -132.2 -250.2 -158.1 -92.1 139.3 -82.1 221.4 14.4 1.0 22.0 15.3 … -24.0 0.0 0.0 -35.7
2014 -145.0 -123.8 -90.0 -33.8 13.3 308.2 -294.9 22.6 -0.1 120.3 -58.7 … -36.7 -2.3 0.0 -57.0
2011 Q1 3.8 -81.7 -71.0 -10.7 53.1 48.4 4.7 -28.6 -0.2 -35.6 -2.1 … 9.3 0.0 0.0 60.9
Q2 -210.7 -98.6 -78.6 -20.0 49.7 0.0 49.7 -133.5 -0.2 -109.1 22.3 … -46.5 0.0 0.0 -28.2
Q3 23.8 -105.8 -104.6 -1.2 8.8 47.4 -38.5 118.1 -0.2 106.8 37.3 … -25.8 0.0 0.0 2.6
Q4 -194.4 -92.9 -75.4 -17.5 -53.8 19.9 -73.7 48.9 -0.2 96.5 -17.0 … -30.4 0.0 0.0 -96.5
2012 Q1 -13.8 -55.0 -40.3 -14.7 81.0 20.0 61.0 -47.8 -0.2 -139.1 45.5 … 45.9 0.0 0.0 8.0
Q2 -86.4 -23.5 -18.6 -4.9 -37.0 27.0 -64.0 -36.9 0.0 27.9 3.5 … -63.2 -5.1 0.0 11.1
Q3 25.9 -88.5 -61.1 -27.4 163.2 -0.7 164.0 -255.0 0.0 -168.3 -17.2 … -69.5 0.0 0.0 206.2
Q4 -66.7 -46.3 -66.9 20.7 -21.5 35.0 -56.5 -35.1 -0.5 2.6 -25.9 … -13.5 2.2 0.0 36.2
2013 Q1 10.1 -57.3 -45.6 -11.6 53.5 35.0 18.5 20.1 0.0 -62.6 22.0 … 60.9 -0.2 0.0 -6.3
Q2 -138.1 -83.8 -41.6 -42.1 81.7 60.0 21.7 -150.6 1.0 -69.7 -25.6 … -54.2 -2.1 0.0 14.6
Q3 58.1 -56.8 -39.2 -17.6 91.8 15.0 76.8 -46.2 0.0 -28.8 7.3 … -23.5 -1.1 0.0 69.3
Q4 -62.2 -52.4 -31.6 -20.8 -87.7 -192.1 104.4 191.1 0.0 183.0 11.6 … -7.1 3.6 0.0 -113.3
2014 Q1 33.4 -37.5 -37.3 -0.2 50.2 0.0 50.2 26.8 0.0 -17.0 18.4 … 27.7 -2.3 0.0 -6.2
Q2 -115.8 -0.2 26.0 -26.2 3.2 70.0 -66.8 -97.1 0.0 -40.8 -13.7 … -44.4 1.8 0.0 -21.7
Q3 44.8 -67.2 -65.1 -2.1 59.3 201.0 -141.7 1.1 -0.1 39.9 -14.1 … -22.0 -2.6 0.0 51.7
Q4 -107.4 -19.0 -13.7 -5.3 -99.4 37.2 -136.6 91.8 0.0 138.2 -49.3 … 2.1 0.8 0.0 -80.8
2014 September -25.7 -23.6 -22.3 -1.2 47.3 76.0 -28.8 -50.7 0.0 -36.7 -1.1 … -9.3 -3.5 0.0 1.3
October -9.3 -14.7 -10.1 -4.5 -36.4 0.1 -36.5 38.0 0.0 57.0 -15.3 … -2.9 -0.8 0.0 3.7
November -44.7 -16.1 -12.0 -4.2 15.2 0.1 15.1 -53.3 0.0 -49.5 -16.2 … 3.6 8.9 0.0 9.5
December -53.4 11.8 8.4 3.4 -78.1 37.0 -115.2 107.0 0.0 130.8 -17.9 … 1.4 -7.3 0.0 -94.0
2015 January 64.4 -27.0 -23.4 -3.6 15.1 0.0 15.1 45.7 0.0 11.6 12.9 … 20.4 0.8 0.0 30.6
February -13.1 -19.1 -13.2 -5.9 -19.5 0.1 -19.6 31.8 0.0 1.6 7.9 … 9.4 12.9 0.0 -6.3
March -21.2 -27.4 -24.2 -3.2 9.2 0.1 9.1 4.3 0.0 -4.2 16.3 … 3.9 -11.8 0.0 -7.3
April -60.9 -44.7 -35.5 -9.2 3.5 0.1 3.5 -4.7 0.0 3.6 9.0 … -16.8 -0.6 0.0 -15.0
May -64.6 -26.1 -20.5 -5.6 55.3 24.8 30.5 -106.1 0.0 -72.2 -16.0 … -17.7 -0.1 0.0 12.3
June -69.1 -6.2 9.2 -15.4 -8.7 -29.0 20.4 -37.3 0.0 -9.3 -14.0 … -11.5 -2.5 0.0 -16.9
July 18.6 -27.1 -17.1 -10.0 -12.9 -0.1 -12.8 -34.8 0.0 0.9 -31.1 … -7.2 2.6 0.0 93.4
August 56.2 -43.0 -31.6 -11.4 19.6 0.2 19.4 64.2 0.0 33.5 38.1 … -6.6 -0.8 0.0 15.4
September -62.6 -28.8 -10.1 -18.6 -7.8 0.0 -7.8 -39.8 0.0 -20.3 -19.7 … -0.6 0.8 0.0 13.8
October -39.0 -31.5 -21.7 -9.8 -50.0 0.0 -50.1 39.4 0.0 52.0 -9.0 … -2.2 -1.4 0.0 3.2
November -32.6 -8.7 -6.7 -2.0 3.2 0.1 3.2 10.3 0.0 12.4 -3.3 … 4.1 -3.0 0.0 -37.5

88 |
Monthly Statistics Bulletin December 2015
Table 29.10. Financial account – investments abroad
(In millions of euro)
Descreption
Net acquisition of financial assets
Direct investment Portfolio investment Other investment
Reserve assets
Equity
and
inve-
stment
fund
shares
Debt
instru-
ments
Equity and
investment
fund shares
Debt
securitie
s
Other
equity
Currency
and deposits Loans
Insurance,
pension, and
standardi-zed
guarantee
schemes
Trade
credit
and
adva-
nces
Other
accounts
receivable
/payable
2007 508.5 9.7 9.7 0.0 34.5 57.1 -22.6 170.0 0.0 164.6 4.5 … 0.9 0.0 294.3
2008 231.2 28.4 25.0 3.4 109.9 21.6 88.3 74.7 0.0 62.5 1.4 … 10.8 0.0 18.2
2009 230.6 10.5 10.5 0.0 124.8 0.0 124.8 190.1 0.0 195.0 -7.9 … 3.0 0.0 -94.8
2010 405.6 37.4 34.7 2.7 48.6 154.6 -106.0 266.2 0.0 242.2 19.2 … 4.7 0.0 53.4
2011 83.7 5.5 15.7 -10.2 57.8 115.7 -57.9 81.7 0.0 57.3 24.6 … -0.3 0.0 -61.2
2012 316.6 15.8 15.8 0.0 185.7 81.3 104.4 -146.3 0.0 -179.8 31.3 … 0.0 2.2 261.4
2013 217.2 30.0 17.9 12.1 139.3 -82.1 221.4 83.5 0.0 60.5 30.7 … -4.8 -2.8 -35.7
2014 90.4 27.3 26.6 0.8 13.3 308.2 -294.9 106.8 0.0 157.4 -50.6 … 1.2 -1.3 -57.0
2011 Q1 73.3 2.8 1.8 1.0 53.1 48.4 4.7 -43.5 0.0 -43.4 1.3 … -1.4 0.0 60.9
Q2 -47.7 -7.8 3.4 -11.2 49.7 0.0 49.7 -61.3 0.0 -83.7 21.3 … 1.1 0.0 -28.2
Q3 128.2 5.5 5.5 0.0 8.8 47.4 -38.5 111.2 0.0 109.0 2.2 … 0.0 0.0 2.6
Q4 -70.1 5.0 5.0 0.0 -53.8 19.9 -73.7 75.3 0.0 75.4 -0.2 … 0.0 0.0 -96.5
2012 Q1 -22.1 1.7 1.7 0.0 81.0 20.0 61.0 -112.8 0.0 -119.6 6.8 … 0.0 0.0 8.0
Q2 7.9 6.4 6.4 0.0 -37.0 27.0 -64.0 27.5 0.0 27.9 -0.4 … 0.0 0.0 11.1
Q3 265.4 3.7 3.7 0.0 163.2 -0.7 164.0 -107.7 0.0 -128.6 20.9 … 0.0 0.0 206.2
Q4 65.3 3.9 3.9 0.0 -21.5 35.0 -56.5 46.7 0.0 40.5 4.0 … 0.0 2.2 36.2
2013 Q1 11.1 3.1 3.1 0.0 53.5 35.0 18.5 -39.1 0.0 -51.6 13.1 … 0.6 -1.2 -6.3
Q2 -4.9 5.0 2.6 2.4 81.7 60.0 21.7 -106.1 0.0 -89.7 -10.0 … -5.2 -1.3 14.6
Q3 208.0 13.8 7.7 6.1 91.8 15.0 76.8 33.1 0.0 24.2 12.1 … -1.3 -1.8 69.3
Q4 2.9 8.2 4.6 3.6 -87.7 -192.1 104.4 195.6 0.0 177.7 15.4 … 1.1 1.4 -113.3
2014 Q1 58.0 5.2 5.2 0.0 50.2 0.0 50.2 8.7 0.0 -3.9 12.0 … 0.1 0.5 -6.2
Q2 -75.8 -3.8 8.3 -12.1 3.2 70.0 -66.8 -53.5 0.0 -51.2 -4.5 … 1.3 0.9 -21.7
Q3 169.0 15.5 6.0 9.5 59.3 201.0 -141.7 42.6 0.0 76.6 -32.8 … 2.5 -3.7 51.7
Q4 -60.8 10.4 7.0 3.4 -99.4 37.2 -136.6 108.9 0.0 135.9 -25.3 … -2.7 1.0 -80.8
2014 September -2.0 5.2 3.0 2.3 47.3 76.0 -28.8 -55.8 0.0 -42.5 -9.4 …
0.0 -3.8 1.3
October 17.5 3.9 2.9 1.0 -36.4 0.1 -36.5 46.3 0.0 58.8 -11.9 … -1.2 0.6 3.7
November -23.6 3.4 2.3 1.1 15.2 0.1 15.1 -51.7 0.0 -51.1 -7.8 … -0.7 7.8 9.5
December -54.7 3.1 1.8 1.3 -78.1 37.0 -115.2 114.4 0.0 128.2 -5.6 … -0.8 -7.4 -94.0
2015 January 83.9 3.1 2.9 0.2 15.1 0.0 15.1 35.1 0.0 17.6 16.7 … 0.5 0.2 30.6
February -11.7 3.0 2.9 0.1 -19.5 0.1 -19.6 11.2 0.0 0.7 -3.0 … -0.1 13.6 -6.3
March 11.8 3.1 3.1 0.0 9.2 0.1 9.1 6.8 0.0 14.5 4.5 … 0.8 -13.1 -7.3
April -4.0 2.4 2.3 0.1 3.5 0.1 3.5 5.0 0.0 -1.8 6.0 … 0.4 0.4 -15.0
May -11.8 3.8 3.8 0.0 55.3 24.8 30.5 -83.3 0.0 -76.9 -6.6 … 0.4 -0.3 12.3
June -40.7 -3.0 2.0 -5.0 -8.7 -29.0 20.4 -12.2 0.0 -14.4 2.4 … 0.4 -0.6 -16.9
July 102.5 2.8 2.8 0.0 -12.9 -0.1 -12.8 19.1 0.0 18.5 -3.4 … 2.6 1.3 93.4
August 101.5 3.5 3.2 0.3 19.6 0.2 19.4 63.1 0.0 58.2 5.4 … 0.8 -1.3 15.4
September -37.0 2.1 1.5 0.6 -7.8 0.0 -7.8 -45.2 0.0 -51.0 6.4 … -0.5 0.0 13.8
October -0.4 3.3 2.9 0.4 -50.0 0.0 -50.1 43.1 0.0 48.1 -3.5 … -0.8 -0.7 3.2
November -11.5 2.5 2.2 0.2 3.2 0.1 3.2 20.3 0.0 11.5 9.5 … -0.7 0.0 -37.5

| 89
Buletini Mujor Statistikor
December 2015 Monthly Statistics Bulletin
Table 29.11. Financial account – investments in reporting economy
(In millions of euro)
Descreption
Net incurrence of liabilities
Direct investment Portfolio investment
Other investment
Equity
and investent
fund shares
Debt instrum
ents
Equity
and investment fund
shares
Debt secur-ities
Other equity
Currency and
deposits Loans
Insurance, pension, and standardized guarantee schemes
Trade credt and advances
Other acco-unts
receivable/pay
able
Special drawing
rights (Net incurrence
of liabilities)
2007 502.7 440.7 327.8 113.0 0.0 0.0 0.0 61.9 0.0 -3.6 13.9 … 51.7 0.0 0.0
2008 519.6 369.9 278.5 91.4 0.0 0.0 0.0 149.7 0.0 24.1 48.5 … 77.2 0.0 0.0
2009 339.7 287.4 264.3 23.2 0.5 0.5 0.0 51.8 0.0 23.5 -72.7 … 41.5 0.0 59.5
2010 681.4 368.5 331.1 37.4 0.0 0.0 0.0 312.9 -0.7 40.2 101.5 … 171.8 0.0 0.0
2011 461.2 384.4 345.2 39.2 0.0 0.0 0.0 76.8 0.8 -1.3 -15.8 … 93.1 0.0 0.0
2012 457.6 229.1 202.7 26.4 0.0 0.0 0.0 228.5 0.7 97.0 25.4 … 100.3 5.1 0.0
2013 349.4 280.2 176.0 104.2 0.0 0.0 0.0 69.2 -1.0 38.5 15.4 … 19.1 -2.8 0.0
2014 235.4 151.2 116.6 34.6 0.0 0.0 0.0 84.2 0.1 37.1 8.1 … 37.9 1.0 0.0
2011 Q1 69.5 84.4 72.8 11.7 0.0 0.0 0.0 -14.9 0.2 -7.8 3.4 … -10.7 0.0 0.0
Q2 163.0 90.8 82.0 8.8 0.0 0.0 0.0 72.2 0.2 25.4 -1.0 … 47.6 0.0 0.0
Q3 104.4 111.3 110.1 1.2 0.0 0.0 0.0 -6.9 0.2 2.1 -35.0 … 25.8 0.0 0.0
Q4 124.3 97.8 80.3 17.5 0.0 0.0 0.0 26.4 0.2 -21.1 16.9 … 30.4 0.0 0.0
2012 Q1 -8.3 56.7 42.0 14.7 0.0 0.0 0.0 -65.0 0.2 19.5 -38.7 … -45.9 0.0 0.0
Q2 94.3 29.9 25.0 4.9 0.0 0.0 0.0 64.4 0.0 0.0 -3.9 … 63.2 5.1 0.0
Q3 239.6 92.3 64.8 27.4 0.0 0.0 0.0 147.3 0.0 39.6 38.1 … 69.5 0.0 0.0
Q4 132.0 50.2 70.9 -20.7 0.0 0.0 0.0 81.8 0.5 37.9 29.9 … 13.5 0.0 0.0
2013 Q1 1.1 60.3 48.7 11.6 0.0 0.0 0.0 -59.2 0.0 10.9 -8.9 … -60.3 -1.0 0.0
Q2 133.2 88.7 44.2 44.5 0.0 0.0 0.0 44.5 -1.0 -20.0 15.6 … 49.1 0.9 0.0
Q3 149.9 70.6 46.9 23.7 0.0 0.0 0.0 79.3 0.0 52.9 4.8 … 22.2 -0.6 0.0
Q4 65.2 60.6 36.3 24.4 0.0 0.0 0.0 4.5 0.0 -5.4 3.8 … 8.2 -2.1 0.0
2014 Q1 24.6 42.7 42.5 0.2 0.0 0.0 0.0 -18.1 0.0 13.1 -6.4 … -27.5 2.7 0.0
Q2 40.0 -3.6 -17.7 14.1 0.0 0.0 0.0 43.6 0.0 -10.4 9.2 … 45.6 -0.9 0.0
Q3 124.2 82.6 71.1 11.5 0.0 0.0 0.0 41.6 0.1 36.7 -18.7 … 24.6 -1.1 0.0
Q4 46.6 29.4 20.7 8.8 0.0 0.0 0.0 17.1 0.0 -2.3 24.0 … -4.8 0.2 0.0
2014 September 23.7 28.8 25.3 3.5 0.0 0.0 0.0 -5.1 0.0 -5.8 -8.3 …
9.3 -0.4 0.0
October 26.8 18.6 13.0 5.5 0.0 0.0 0.0 8.2 0.0 1.8 3.3 … 1.8 1.4 0.0
November 21.1 19.6 14.3 5.3 0.0 0.0 0.0 1.5 0.0 -1.6 8.4 … -4.3 -1.0 0.0
December -1.3 -8.7 -6.6 -2.0 0.0 0.0 0.0 7.4 0.0 -2.5 12.2 … -2.2 -0.2 0.0
2015 January 19.5 30.1 26.3 3.8 0.0 0.0 0.0 -10.6 0.0 6.0 3.8 … -19.8 -0.6 0.0
February 1.4 22.1 16.1 6.0 0.0 0.0 0.0 -20.6 0.0 -1.0 -10.9 … -9.5 0.7 0.0
March 33.0 30.5 27.3 3.2 0.0 0.0 0.0 2.5 0.0 18.7 -11.8 … -3.1 -1.3 0.0
April 56.8 47.1 37.8 9.3 0.0 0.0 0.0 9.7 0.0 -5.4 -3.1 … 17.2 1.0 0.0
May 52.7 30.0 24.3 5.6 0.0 0.0 0.0 22.8 0.0 -4.6 9.4 … 18.1 -0.2 0.0
June 28.3 3.2 -7.2 10.4 0.0 0.0 0.0 25.1 0.0 -5.2 16.4 … 11.9 1.9 0.0
July 83.9 30.0 20.0 10.0 0.0 0.0 0.0 53.9 0.0 17.6 27.7 … 9.8 -1.2 0.0
August 45.4 46.5 34.8 11.7 0.0 0.0 0.0 -1.1 0.0 24.7 -32.7 … 7.3 -0.5 0.0
September 25.5 30.9 11.7 19.2 0.0 0.0 0.0 -5.4 0.0 -30.8 26.0 … 0.1 -0.8 0.0
October 38.5 34.8 24.5 10.2 0.0 0.0 0.0 3.8 0.0 -3.8 5.5 … 1.4 0.7 0.0
November 21.1 11.2 8.9 2.3 0.0 0.0 0.0 10.0 0.0 -0.9 12.8 … -4.9 3.0 0.0

90 |
Monthly Statistics Bulletin December 2015
Table 30.1. International Investments Position – main components (1) (In millions of euro: End of Period)
Description
Net Assets
Direct investm
ents
Portfolio investment
Other investments
Reserve Assets
Equity and
investment fund shares
Debt instruments
Central Bank
General Governm
ent
Deposit-taking corporations
Other Sectors
2007 1,254.2 2,397.2 15.2 444.4 158.9 285.5 1,285.6 317.7 … 289.6 678.3 652.0
2008 912.4 2,537.1 43.8 463.9 112.5 351.4 1,359.1 225.8 … 360.8 772.5 670.3
2009 484.2 2,816.9 59.1 622.0 140.1 481.9 1,559.4 290.4 … 486.9 782.1 576.5
2010 428.8 3,256.9 96.6 693.8 194.2 499.6 1,832.0 460.2 … 536.4 835.5 634.5
2011 133.9 3,325.1 102.0 740.2 296.0 444.3 1,908.2 592.8 … 473.5 841.9 574.7
2012 248.8 3,705.1 117.8 986.6 666.3 320.3 1,760.6 453.4 … 436.8 870.4 840.0
2013 363.7 4,102.6 147.5 1,192.6 650.8 541.7 1,963.2 472.9 … 493.9 996.5 799.3
2012 Q1 206.5 3,344.2 103.8 860.6 580.9 279.8 1,798.9 537.5 … 414.1 847.3 580.9
Q2 147.3 3,351.7 110.2 814.5 598.7 215.9 1,826.1 579.0 … 394.9 852.1 600.9
Q3 237.7 3,634.0 113.9 998.7 621.9 376.8 1,715.6 417.8 … 436.9 860.9 805.8
Q4 248.8 3,705.1 117.8 986.6 666.3 320.3 1,760.6 453.4 … 436.8 870.4 840.0
2013 Q1 416.8 3,857.2 120.9 1,073.1 734.3 338.8 1,829.8 457.2 … 400.4 972.2 833.4
Q2 276.2 3,846.9 125.2 1,138.1 777.6 360.5 1,737.3 366.9 … 385.2 985.3 846.2
Q3 414.9 4,076.4 139.6 1,253.9 816.6 437.3 1,768.9 314.1 … 465.1 989.7 913.9
Q4 363.7 4,102.6 147.5 1,192.6 650.8 541.7 1,963.2 472.9 … 493.9 996.5 799.3
2014 Q1 401.9 4,172.4 152.7 1,252.4 660.4 592.0 1,974.3 443.7 … 515.7 1,014.9 793.1
Q2 328.4 4,117.8 148.9 1,280.8 752.4 528.4 1,916.2 439.8 … 456.7 1,019.7 771.8
Q3 380.4 4,302.2 164.4 1,354.1 967.4 386.7 1,958.2 412.5 … 512.0 1,033.7 825.5
Q4 297.3 4,276.6 174.6 1,274.7 1,024.4 250.3 2,081.5 512.4 … 524.8 1,044.3 745.9
2015 Q1 381.4 4,418.0 183.7 1,333.7 1,078.7 255.0 2,133.9 510.8 … 571.5 1,051.6 768.2
Q2 154.5 4,342.6 187.0 1,365.0 1,055.8 309.1 2,042.8 509.3 … 468.7 1,064.7 747.9
Q3 151.3 4,496.0 195.4 1,353.1 1,045.6 307.5 2,079.1 524.6 … 481.4 1,073.1 868.5

| 91
Buletini Mujor Statistikor
December 2015 Monthly Statistics Bulletin
Table 30.2. International Investments Position – main components (2)
(In millions of euro: End of Period)
Description
Net Liabilities
Direct investment
Portfolio investment
Other investments
Equity and investment fund shares
Debt securities
Central Bank
General Government
Deposit-taking
corporaQions
Other Sectors
2007 1,254.2 1,143.0 924.5 … … … 218.6 … … 49.8 168.8
2008 912.4 1,624.6 1,294.3 … … … 330.3 … … 84.7 245.6
2009 484.2 2,332.7 1,589.8 … … … 742.9 60.3 249.0 158.6 275.0
2010 428.8 2,828.0 1,971.0 … … … 857.0 65.9 260.0 223.1 308.0
2011 133.9 3,191.2 2,326.1 … … … 865.1 66.4 253.6 198.5 346.6
2012 248.8 3,456.3 2,524.3 … … … 931.9 65.0 336.5 176.1 354.4
2013 363.7 3,738.8 2,816.4 … … … 922.4 62.1 321.8 208.8 329.7
2012 Q1 206.5 3,137.7 2,369.4 … … … 768.3 65.3 247.4 190.7 264.9
Q2 147.3 3,204.4 2,385.0 … … … 819.4 67.5 253.5 176.6 321.8
Q3 237.7 3,396.2 2,471.5 … … … 924.8 66.9 294.2 184.7 378.9
Q4 248.8 3,456.3 2,524.3 … … … 931.9 65.0 336.5 176.1 354.4
2013 Q1 416.8 3,440.4 2,582.4 … … … 858.0 65.1 332.8 187.5 272.5
Q2 276.2 3,570.7 2,669.4 … … … 901.3 63.8 331.1 185.0 321.4
Q3 414.9 3,661.5 2,739.9 … … … 921.6 63.2 324.6 207.6 326.2
Q4 363.7 3,738.8 2,816.4 … … … 922.4 62.1 321.8 208.8 329.7
2014 Q1 401.9 3,770.5 2,859.7 … … … 910.8 62.2 317.6 225.9 305.1
Q2 328.4 3,789.4 2,838.1 … … … 951.3 62.9 319.0 230.1 339.4
Q3 380.4 3,921.8 2,923.0 … … … 998.8 65.4 318.1 229.8 385.6
Q4 297.3 3,979.3 2,961.4 … … … 1,017.9 66.3 326.4 235.0 390.1
2015 Q1 381.4 4,036.7 3,032.8 … … … 1,003.8 71.2 329.2 251.2 352.2
Q2 154.5 4,188.1 3,112.3 … … … 1,075.8 69.8 330.6 260.9 414.5
Q3 151.3 4,344.7 3,221.9 … … … 1,122.9 69.5 367.2 247.9 438.2

92 |
Monthly Statistics Bulletin December 2015
Table 30.3. International Investments Position – by sectors
(In millions of euro: End of Period)
Description
International Investment Position NET
Central Bank of the Republic of Kosovo
Banks General Government
Other sectors
Assets Liabilities Assets Liabilities Assets Liabilities Assets Liabilities
2007 1,254.2 1,057.6 1,057.6 … 319.9 368.5 48.6 … … … -123.3 971.1 1,094.4
2008 912.4 1,110.7 1,110.7 … 318.1 401.3 83.2 … … … -516.4 1,025.0 1,541.4
2009 484.2 1,089.3 1,149.6 60.3 427.3 583.9 156.7 -249.0 … 249.0 -783.3 1,083.4 1,866.7
2010 428.8 1,129.0 1,194.8 65.9 488.0 709.8 221.8 -260.0 … 260.0 -928.1 1,352.2 2,280.3
2011 133.9 1,114.8 1,181.3 66.4 479.1 675.5 196.4 -253.6 … 253.6 -1,206.4 1,468.4 2,674.8
2012 248.8 1,351.9 1,416.8 65.0 458.0 633.6 175.6 -336.5 … 336.5 -1,224.5 1,654.7 2,879.3
2013 363.7 1,497.2 1,559.3 62.1 540.2 748.3 208.1 -321.8 … 321.8 -1,351.9 1,794.9 3,146.9
2012 Q1 206.5 1,136.0 1,201.4 65.3 418.4 607.8 189.4 -247.4 … 247.4 -1,100.5 1,535.0 2,635.5
Q2 147.3 1,139.4 1,206.9 67.5 404.7 580.7 176.0 -253.5 … 253.5 -1,143.4 1,564.1 2,707.5
Q3 237.7 1,337.7 1,404.6 66.9 448.5 632.6 184.1 -294.2 … 294.2 -1,254.2 1,596.8 2,851.0
Q4 248.8 1,351.9 1,416.8 65.0 458.0 633.6 175.6 -336.5 … 336.5 -1,224.5 1,654.7 2,879.3
2013 Q1 416.8 1,362.6 1,427.7 65.1 416.3 602.0 185.8 -332.8 … 332.8 -1,029.2 1,827.5 2,856.7
Q2 276.2 1,362.7 1,426.5 63.8 347.9 532.2 184.3 -331.1 … 331.1 -1,103.3 1,888.2 2,991.6
Q3 414.9 1,433.5 1,496.7 63.2 426.8 633.6 206.8 -324.6 … 324.6 -1,120.8 1,946.1 3,066.9
Q4 363.7 1,497.2 1,559.3 62.1 540.2 748.3 208.1 -321.8 … 321.8 -1,351.9 1,794.9 3,146.9
2014 Q1 401.9 1,501.1 1,563.3 62.2 555.8 781.0 225.2 -317.6 … 317.6 -1,337.4 1,828.2 3,165.6
Q2 328.4 1,435.0 1,497.9 62.9 466.1 695.4 229.3 -319.0 … 319.0 -1,253.8 1,924.5 3,178.3
Q3 380.4 1,310.9 1,376.3 65.4 528.0 757.0 229.0 -318.1 … 318.1 -1,140.5 2,168.9 3,309.4
Q4 297.3 1,247.3 1,313.7 66.3 481.6 715.8 234.2 -326.4 … 326.4 1,105.2 2,247.1 3,352.3
2015 Q1 381.4 1,260.8 1,332.0 71.2 517.8 768.2 250.3 -329.2 … 329.2 -1,068.0 2,317.9 3,385.9
Q2 154.5 1,267.5 1,337.3 69.8 434.0 694.2 260.1 -330.6 … 330.6 -1,216.4 2,311.2 3,527.6
Q3 151.3 1,389.6 1,459.1 69.5 472.7 719.7 247.0 -367.2 … 367.2 -1,343.8 2,317.2 3,661.0

| 93
Buletini Mujor Statistikor
December 2015 Monthly Statistics Bulletin
Table 30.4. International Investments Position – assets
(In millions of euro: End of Period)
Description
Net IIP Kosovo's international assets
International equity International debt
Direct investments
Abroad
Equity securities
Direct investments
Abroad
Debt securiities
Other investments
Reserve Assets
2007 1,254.2 2,397.2 174.1 15.2 158.9 2,223.1 0.0 285.5 1,285.6 652.0
2008 912.4 2,537.1 152.9 40.4 112.5 2,384.2 3.4 351.4 1,359.1 670.3
2009 484.2 2,816.9 191.7 51.6 140.1 2,625.2 7.4 481.9 1,559.4 576.5
2010 428.8 3,256.9 280.6 86.4 194.2 2,976.3 10.2 499.6 1,832.0 634.5
2011 133.9 3,325.1 398.0 102.0 296.0 2,927.1 … 444.3 1,908.2 574.7
2012 248.8 3,705.1 784.2 117.8 666.3 2,920.9 … 320.3 1,760.6 840.0
2013 363.7 4,102.6 786.2 135.4 650.8 3,316.4 12.1 541.7 1,963.2 799.3
2012 Q1 206.5 3,344.2 684.7 103.8 580.9 2,659.5 … 279.8 1,798.9 580.9
Q2 319.3 3,351.7 708.8 110.2 598.7 2,642.9 … 215.9 1,826.1 600.9
Q3 237.7 3,634.0 735.8 113.9 621.9 2,898.2 … 376.8 1,715.6 805.8
Q4 248.8 3,705.1 784.2 117.8 666.3 2,920.9 … 320.3 1,760.6 840.0
2013 Q1 416.8 3,857.2 855.2 120.9 734.3 3,002.0 … 338.8 1,829.8 833.4
Q2 276.2 3,846.9 901.1 123.5 777.6 2,945.8 1.8 360.5 1,737.3 846.2
Q3 414.9 4,076.4 947.8 131.1 816.6 3,128.6 8.5 437.3 1,768.9 913.9
Q4 363.7 4,102.6 786.2 135.4 650.8 3,316.4 12.1 541.7 1,963.2 799.3
2014 Q1 401.9 4,172.4 801.0 140.6 660.4 3,371.4 12.1 592.0 1,974.3 793.1
Q2 328.4 4,117.8 901.4 148.9 752.4 3,216.4 … 528.4 1,916.2 771.8
Q3 380.4 4,302.2 1,122.3 154.9 967.4 3,179.9 9.5 386.7 1,958.2 825.5
Q4 297.3 4,276.6 1,186.3 161.9 1,024.4 3,090.3 12.6 250.3 2,081.5 745.9
2015 Q1 381.4 4,418.0 1,249.4 170.7 1,078.7 3,168.6 13.0 255.0 2,133.9 766.7
Q2 154.5 4,342.6 1,234.7 178.8 1,055.8 3,107.9 8.2 309.1 2,042.8 747.9
Q3 151.3 4,496.0 1,232.0 186.4 1,045.6 3,264.0 8.9 307.5 2,079.1 868.5

94 |
Monthly Statistics Bulletin December 2015
Table 30.5. International Investments Position – liabilities
(In millions of euro: End of Period)
Description
Net IIP Liabilities
International equity International debt
Direct
investments
Equity and investment fund
shares
Direct
investments Debt
securities Other
investments
2007 1,254.2 1,143.0 621.2 621.2 … 521.8 303.2 … 218.6
2008 912.4 1,624.6 886.5 886.5 … 738.1 407.8 … 330.3
2009 484.2 2,332.7 1,139.4 1,139.4 … 1,193.3 450.4 … 742.9
2010 428.8 2,828.0 1,455.3 1,455.3 … 1,372.8 515.8 … 857.0
2011 133.9 3,191.2 1,760.7 1,760.7 … 1,430.5 565.4 … 865.1
2012 248.8 3,456.3 1,938.4 1,938.4 … 1,517.8 585.9 … 931.9
2013 363.7 3,738.8 2,129.9 2,129.9 … 1,608.9 686.5 … 922.4
2012 Q1 206.5 3,137.7 1,795.8 1,795.8 … 1,341.9 573.6 … 768.3
Q2 319.3 3,032.4 1,794.9 1,794.9 … 1,237.5 590.1 … 647.4
Q3 237.7 3,396.2 1,862.4 1,862.4 … 1,533.9 609.1 … 924.8
Q4 248.8 3,456.3 1,938.4 1,938.4 … 1,517.8 585.9 … 931.9
2013 Q1 416.8 3,440.4 1,985.8 1,985.8 … 1,454.6 596.7 … 858.0
Q2 276.2 3,570.7 2,029.0 2,029.0 … 1,541.7 640.4 … 901.3
Q3 414.9 3,661.5 2,075.9 2,075.9 … 1,585.6 664.0 … 921.6
Q4 363.7 3,738.8 2,129.9 2,129.9 … 1,608.9 686.5 … 922.4
2014 Q1 401.9 3,770.5 2,173.0 2,173.0 … 1,597.5 686.7 … 910.8
Q2 328.4 3,789.4 2,140.4 2,140.4 … 1,649.0 697.8 … 951.3
Q3 380.4 3,921.8 2,211.9 2,211.9 … 1,709.9 711.1 … 998.8
Q4 297.3 3,979.3 2,241.4 2,241.4 … 1,737.9 720.0 … 1,017.9
2015 Q1 381.4 4,036.6 2,310.0 2,310.0 … 1,726.6 722.8 … 1,003.8
Q2 154.5 4,188.1 2,364.4 2,364.4 … 1,823.7 747.9 … 1,075.8
Q3 151.3 4,344.7 2,432.1 2,432.1 … 1,912.6 789.7 … 1,122.9
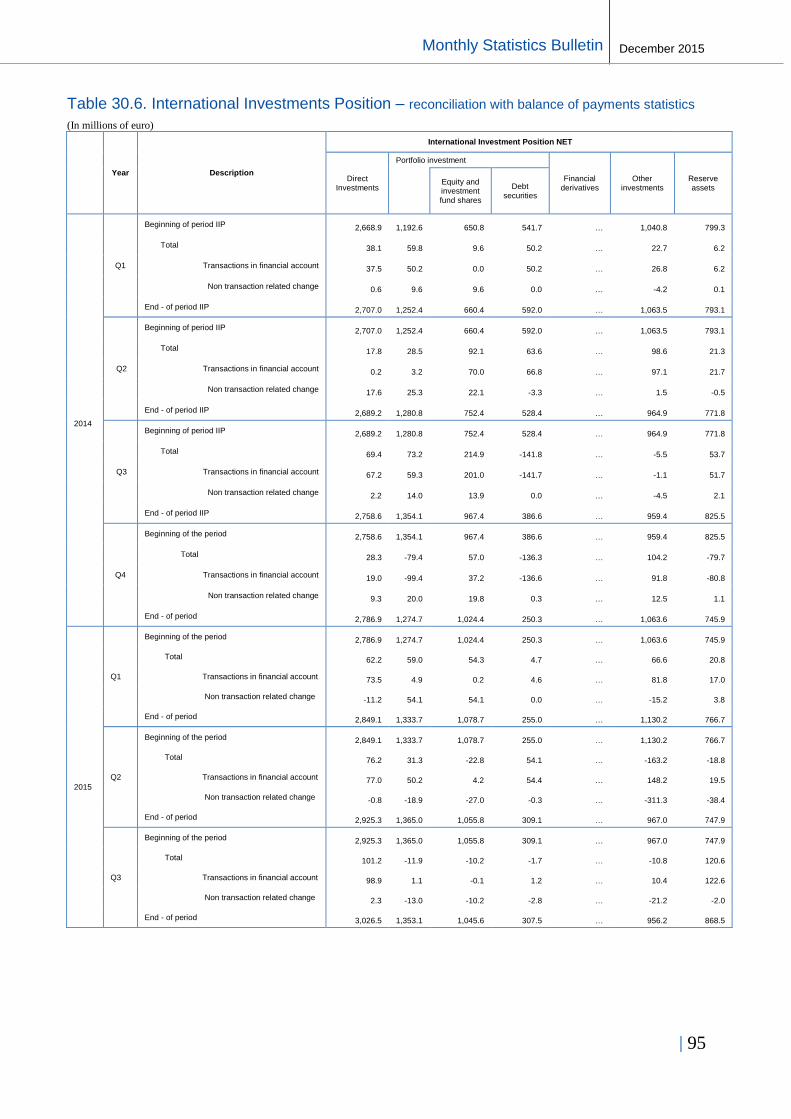
| 95
Buletini Mujor Statistikor
December 2015 Monthly Statistics Bulletin
Table 30.6. International Investments Position – reconciliation with balance of payments statistics
(In millions of euro)
Year Description
International Investment Position NET
Direct Investments
Portfolio investment
Financial derivatives
Other investments
Reserve assets
Equity and investment fund shares
Debt securities
2014
Q1
Beginning of period IIP 2,668.9 1,192.6 650.8 541.7 … 1,040.8 799.3
Total 38.1 59.8 9.6 50.2 … 22.7 6.2
Transactions in financial account 37.5 50.2 0.0 50.2 … 26.8 6.2
Non transaction related change 0.6 9.6 9.6 0.0 … -4.2 0.1
End - of period IIP 2,707.0 1,252.4 660.4 592.0 … 1,063.5 793.1
Q2
Beginning of period IIP 2,707.0 1,252.4 660.4 592.0 … 1,063.5 793.1
Total 17.8 28.5 92.1 63.6 … 98.6 21.3
Transactions in financial account 0.2 3.2 70.0 66.8 … 97.1 21.7
Non transaction related change 17.6 25.3 22.1 -3.3 … 1.5 -0.5
End - of period IIP 2,689.2 1,280.8 752.4 528.4 … 964.9 771.8
Q3
Beginning of period IIP 2,689.2 1,280.8 752.4 528.4 … 964.9 771.8
Total 69.4 73.2 214.9 -141.8 … -5.5 53.7
Transactions in financial account 67.2 59.3 201.0 -141.7 … -1.1 51.7
Non transaction related change 2.2 14.0 13.9 0.0 … -4.5 2.1
End - of period IIP 2,758.6 1,354.1 967.4 386.6 … 959.4 825.5
Q4
Beginning of the period 2,758.6 1,354.1 967.4 386.6 … 959.4 825.5
Total 28.3 -79.4 57.0 -136.3 … 104.2 -79.7
Transactions in financial account 19.0 -99.4 37.2 -136.6 … 91.8 -80.8
Non transaction related change 9.3 20.0 19.8 0.3 … 12.5 1.1
End - of period 2,786.9 1,274.7 1,024.4 250.3 … 1,063.6 745.9
Beginning of the period 2,786.9 1,274.7 1,024.4 250.3 … 1,063.6 745.9
2015
Total 62.2 59.0 54.3 4.7 … 66.6 20.8
Q1 Transactions in financial account 73.5 4.9 0.2 4.6 … 81.8 17.0
Non transaction related change -11.2 54.1 54.1 0.0 … -15.2 3.8
End - of period 2,849.1 1,333.7 1,078.7 255.0 … 1,130.2 766.7
Beginning of the period 2,849.1 1,333.7 1,078.7 255.0 … 1,130.2 766.7
Total 76.2 31.3 -22.8 54.1 … -163.2 -18.8
Q2 Transactions in financial account 77.0 50.2 4.2 54.4 … 148.2 19.5
Non transaction related change -0.8 -18.9 -27.0 -0.3 … -311.3 -38.4
End - of period 2,925.3 1,365.0 1,055.8 309.1 … 967.0 747.9
Beginning of the period 2,925.3 1,365.0 1,055.8 309.1 … 967.0 747.9
Total 101.2 -11.9 -10.2 -1.7 … -10.8 120.6
Q3 Transactions in financial account 98.9 1.1 -0.1 1.2 … 10.4 122.6
Non transaction related change 2.3 -13.0 -10.2 -2.8 … -21.2 -2.0
End - of period 3,026.5 1,353.1 1,045.6 307.5 … 956.2 868.5

96 |
Monthly Statistics Bulletin December 2015
Table 31.1. Direct investments - by geographical breakdown
(In millions of euro: As at end-September 2015)
Country
Total incoming direct Investments Total outgoing direct investments
Equity
Other capital transactions
Equity Other capital transactions
European Union 1,084.5 817.2 267.3 78.9 71.0 7.9
AQ Austria 172.4 143.0 29.4 3.9 3.6 0.3
BE Belgium 14.7 11.6 3.1 2.8 2.8 0.0
BG Bulgaria 32.3 3.8 28.4 0.6 0.6 0.0
CY Cyprus 6.6 2.0 4.7 3.7 3.7 0.0
FR France 17.1 17.2 -0.1 3.4 3.4 0.0
DE Germany 275.0 269.9 5.1 25.0 25.0 0.0
GR Greece 9.1 8.4 0.7 1.9 1.9 0.0
IQ Itally 21.3 21.2 0.1 3.9 3.9 0.0
NL Holand 161.3 123.4 37.9 11.7 4.1 7.6
RO Rumania 3.9 3.9 0.1 0.3 0.3 0.0
SI Slovenia 241.6 91.8 149.8 8.4 8.4 0.0
SE Sweden 24.3 24.0 0.3 1.4 1.4 0.0
GB Great Britain 70.5 66.9 3.7 7.3 7.3 0.0
Other EU countries 34.4 30.1 4.2 4.5 4.5 0.0
Other European countries 791.9 562.6 229.4 99.1 98.1 1.0
AL Albania 130.3 84.1 46.3 44.5 44.0 0.6
HR Croatia 11.4 9.3 2.1 3.4 3.4 0.0
MK Macedonia 25.8 16.9 8.8 13.7 13.5 0.2
NO Norway 19.3 18.1 1.2 0.6 0.6 0.0
RS Serbia 15.0 10.9 4.0 6.7 6.7 0.0
CH Switzerland 240.0 212.6 27.4 12.5 12.3 0.3
QR Turkey 336.0 198.4 137.5 4.3 4.3 0.0
Other European countries 14.1 12.2 1.9 13.4 13.4 0.0
Other counQries 146.9 116.7 30.2 17.3 17.3 0.0
US United States 83.2 60.3 22.9 9.1 9.1 0.0
AE United Arab Emirates 38.1 33.3 4.8 1.5 1.5 0.0
Other countries 25.7 23.1 2.6 6.7 6.7 0.0
Other countries (not alocated) 1,198.5 935.7 262.8 0.0 0.0 0.0
ZZ Non-specified 1,198.5 935.7 262.8 … 0.0 …
Total 3,221.9 2,432.1 789.7 195.4 186.4 8.9

| 97
Buletini Mujor Statistikor
December 2015 Monthly Statistics Bulletin
Table 31.2. Direct investments – by economic activity
(Flow data; In millions of euro)
Description Total
Agriculture,
hunting, forestry, fishing
Mining and
tuarrying
Manufacturing
Electricity, gas
and water supply
Construction
Wholesale, retail trade,
repair of motor
vehicles etc.
Hotels and restaurants
Transport, storage
and communica
tion
Financial intermediation
Real estate, renting and business activities
Other services*
Other not elsewhere classified activities
2007 440.7 7.9 41.5 74.8 2.5 5.2 12.7 12.7 129.2 102.0 30.9 4.5 16.9
2008 369.9 8.5 17.4 53.7 16.7 13.5 10.1 2.1 51.0 109.6 62.2 2.1 23.0
2009 295.5 13.1 7.0 57.6 8.7 35.5 16.2 2.4 21.9 75.3 43.9 2.7 11.3
2010 368.5 0.9 17.7 101.1 … 54.2 6.8 … -15.9 39.4 75.5 1.3 87.6
2011 384.4 0.6 -5.2 46.9 0.2 133.1 11.6 0.2 29.0 33.0 60.5 11.3 63.2
2012 229.1 0.3 -25.0 27.4 2.2 31.1 9.3 0.5 32.4 22.4 115.7 1.8 11.0
2013 280.2 0.4 -14.1 11.5 48.8 17.3 14.6 0.8 51.0 4.4 136.1 3.3 6.2
2014 151.2 0.2 4.2 -34.0 13.4 -19.9 8.4 0.4 -9.1 41.9 142.1 2.2 1.4
2010 Q1 69.5 0.2 0.2 11.5 … 2.0 1.2 … -3.2 18.8 17.3 0.3 21.3
Q2 48.0 0.2 2.7 16.4 … -18.3 1.0 … -4.3 10.0 10.8 0.4 29.2
Q3 119.1 0.3 10.6 22.7 … 41.2 3.5 … -4.3 -0.3 19.2 0.7 25.6
Q4 132.0 0.2 4.2 50.5 … 29.3 1.1 … -4.1 10.9 28.3 … 11.6
2011 Q1 84.4 0.1 0.2 9.6 0.0 28.1 2.5 0.0 4.5 8.0 15.4 1.0 15.0
Q2 90.8 0.1 3.0 20.3 0.0 22.4 3.8 0.0 10.4 6.5 11.2 1.8 11.3
Q3 111.3 0.2 -2.7 13.2 0.0 37.9 2.8 0.1 12.7 4.2 18.7 5.9 18.2
Q4 97.8 0.2 -5.6 3.8 0.1 44.8 2.5 0.0 1.4 14.3 15.1 2.6 18.7
2012 Q1 56.7 0.0 -1.6 2.3 … 7.2 0.2 … 2.5 10.8 24.5 … 10.8
Q2 29.9 0.1 -8.0 1.1 … 4.8 1.1 … 7.4 -7.0 30.4 0.0 0.0
Q3 92.3 0.1 -7.1 18.6 1.6 21.2 3.0 0.3 12.3 11.6 29.9 0.7 0.1
Q4 50.2 0.1 -8.4 5.5 0.6 -2.0 4.9 0.2 10.2 7.0 30.9 1.0 0.1
2013 Q1 60.3 0.0 -4.5 0.8 1.3 12.5 0.8 2.4 10.6 6.9 28.9 0.3 0.2
Q2 88.7 0.3 -5.3 7.1 30.0 15.4 2.2 … 13.8 -7.7 32.5 0.5 0.1
Q3 70.6 0.1 -0.9 11.9 7.2 -13.7 6.2 0.5 19.1 0.2 38.5 1.5 0.0
Q4 60.6 0.0 -3.4 -8.3 10.3 3.1 5.5 -2.1 7.5 5.0 36.2 1.0 6.0
2014 Q1 42.7 0.0 -3.1 -6.6 2.2 9.1 4.8 … -2.0 10.5 26.7 0.8 0.2
Q2 -3.6 0.0 -0.6 -22.3 7.0 -24.9 2.4 … -4.1 2.8 34.6 1.2 0.4
Q3 82.6 0.0 0.0 4.6 2.0 10.7 2.7 0.0 4.8 18.1 38.1 1.1 0.3
Q4 29.4 0.1 7.8 -9.7 4.1 -14.8 -1.1 … -7.9 10.5 39.0 0.9 0.5
2014 October 18.6 … -1.6 1.1 1.3 3.1 0.6 … -1.8 1.4 14.0 0.2 0.3
November 19.6 … -1.6 0.3 0.0 5.0 0.5 … -1.8 4.1 12.6 0.4 …
December -8.7 0.1 11.0 -11.1 2.7 -22.9 -2.3 … -4.3 5.0 12.5 0.3 0.2
2015 January 30.1 … -3.6 -0.4 2.0 2.9 0.5 … -0.1 6.8 21.7 0.3 -0.1
February 22.1 0.3 -0.9 2.8 1.3 -3.5 0.3 … 0.3 6.8 14.3 0.5 0.0
March 30.5 … -2.6 -0.3 0.1 4.4 0.9 … -0.7 7.9 20.0 0.5 0.2
April 47.1 0.0 -1.0 3.4 1.6 23.5 0.9 … -0.2 7.2 10.8 0.8 0.2
May 30.0 … -2.3 2.7 2.0 2.4 1.1 … 0.3 8.5 14.9 0.4 0.1
June -6.7 … -2.8 -1.9 0.1 -0.2 1.4 … -3.1 -11.9 10.2 0.6 1.0
July 30.0 0.0 -3.9 2.4 2.0 -1.8 2.8 … 2.0 9.2 16.2 0.3 0.8
August 46.6 0.0 -3.9 3.5 0.1 11.1 0.7 … 11.9 6.1 19.6 -1.2 -1.3
September 31.0 0.1 -4.0 -3.4 2.2 11.8 1.9 … 10.4 -7.5 19.0 0.4 0.0
October 34.8 0.3 0.3 -0.3 0.8 7.3 2.9 … 2.7 6.3 13.6 0.9 0.1
November 11.2 0.1 0.1 1.7 0.1 -4.1 0.8 -0.1 -3.8 5.2 10.4 0.5 0.1

98 |
Monthly Statistics Bulletin December 2015
Table 31.3. Direct investments in Kosovo – by countries
(Flow data; In millions of euro)
Description Total
of which:
Austria Germany Slovenia UK Switzerland Turkey Netherlands Albania US France
2007 440.7 35.4 48.1 56.2 116.2 9.7 5.4 41.2 3.4 8.8 8.6
2008 369.9 51.3 44.0 44.3 36.6 32.1 23.8 25.9 21.9 4.8 3.5
2009 295.5 15.5 75.2 50.8 6.2 22.7 14.5 23.1 23.3 11.8 6.0
2010 368.5 21.1 91.5 34.0 38.9 35.1 4.9 17.2 20.3 12.6 3.8
2011 384.4 19.6 66.6 16.2 80.1 30.9 34.7 4.7 11.2 14.3 0.2
2012 229.1 0.4 49.5 9.3 14.3 43.8 65.6 -25.6 4.7 10.8 6.3
2013 280.2 10.7 21.7 7.0 10.7 41.7 88.6 -0.1 19.3 12.7 3.8
2014 151.2 30.3 29.4 -9.4 -39.5 38.2 20.0 -7.8 20.4 14.7 3.3
2010 Q1 69.5 4.1 11.6 18.8 1.9 8.4 1.7 0.2 3.5 3.7 1.1
Q2 48.0 5.6 9.9 2.1 -23.3 6.1 1.1 1.4 9.4 5.6 0.8
Q3 119.1 7.0 14.3 10.3 34.0 14.0 1.2 8.7 5.0 1.2 1.1
Q4 132.0 4.4 55.8 2.8 26.2 6.6 0.8 6.9 2.4 2.1 0.8
2011 Q1 84.4 1.6 21.5 6.3 20.3 7.1 8.5 1.4 2.2 3.3 0.7
Q2 90.8 7.4 10.8 2.8 … 7.8 12.6 4.8 1.4 3.0 …
Q3 111.3 8.9 25.2 5.2 30.2 5.8 16.4 -7.7 2.1 7.4 0.8
Q4 97.8 1.7 9.1 1.9 29.6 10.2 -2.8 6.1 5.5 0.6 -1.3
2012 Q1 56.7 2.3 11.7 2.4 5.8 11.1 4.9 0.3 0.8 2.6 0.3
Q2 29.9 -10.8 8.1 3.0 4.8 9.0 16.9 -6.3 -5.0 3.1 1.8
Q3 92.3 5.6 21.3 5.3 14.5 9.9 19.5 -7.1 5.8 2.3 2.2
Q4 50.2 3.2 8.4 -1.5 -10.8 13.8 24.2 -12.5 3.1 2.7 1.9
2013 Q1 60.3 5.1 7.5 5.0 12.9 11.3 8.9 -5.9 1.5 1.4 0.3
Q2 88.7 3.9 -8.3 3.6 13.0 9.3 42.9 -0.9 9.7 3.8 1.2
Q3 70.6 -1.5 14.3 … -14.4 11.0 23.9 4.3 7.1 4.4 1.7
Q4 60.6 3.2 8.3 -1.5 -0.8 10.1 12.9 2.3 1.0 3.1 0.6
2014 Q1 42.7 4.0 11.0 2.6 2.8 8.8 -8.5 -2.3 5.6 3.0 0.5
Q2 -3.6 9.5 2.2 -12.0 -31.9 6.5 4.8 -11.4 7.2 4.0 0.6
Q3 82.6 8.3 17.7 1.8 7.4 11.9 11.2 -1.6 6.7 4.1 1.2
Q4 29.4 8.5 -1.5 -1.9 -17.8 11.0 8.3 11.6 0.9 3.5 1.0
2014 September 28.8 5.0 5.3 0.6 2.8 3.2 3.3 -0.5 0.6 1.8 0.8
October 18.6 2.6 4.7 -0.4 3.0 2.7 1.3 -0.2 0.8 1.0 0.6
November 19.6 1.2 3.4 -0.4 2.9 3.7 4.0 -0.5 2.8 0.8 0.0
December -8.7 4.7 -9.5 -1.1 -23.6 4.6 3.0 12.2 -2.6 1.6 0.4
2015 January 30.1 3.4 3.8 0.4 2.1 8.6 7.7 -3.2 3.0 1.3 0.4
February 22.1 4.9 3.2 0.7 -4.9 5.4 5.9 -0.4 2.5 1.6 0.3
March 30.5 1.5 4.4 0.2 3.9 5.5 6.5 -2.3 4.2 2.6 0.5
April 47.1 4.7 5.3 0.3 19.2 9.7 1.8 0.3 0.6 1.6 0.2
May 30.0 5.8 5.9 0.7 0.8 5.4 2.2 -1.8 2.9 3.0 0.2
June -6.7 5.7 -12.7 -0.2 -3.2 6.3 -0.5 -9.7 3.1 2.6 0.1
July 30.0 5.2 5.4 1.8 -3.6 6.6 5.3 -3.4 4.0 2.0 0.9
August 46.6 1.4 3.6 11.3 9.6 8.2 5.3 -2.3 3.2 2.3 0.3
September 31.0 -10.2 1.8 9.9 8.8 5.8 5.6 -2.6 5.5 2.0 0.5
October 34.8 3.2 4.3 3.2 7.7 4.6 1.9 0.1 4.6 0.1 0.1
November 11.2 2.5 3.9 -2.0 -5.5 4.3 2.8 0.0 1.2 1.8 0.0

| 99
Buletini Mujor Statistikor
December 2015 Monthly Statistics Bulletin
Table 32.1. Gross external debt position
(In millions of euro: End of period - September 2015)
Description
Total gross external debt
Public and publicly guaranteed external debt Private sector external debt not publicly guaranteed Direct
investments: crediting between
companies
Governement Central Bank of the Republic of Kosovo
Deposit-taking Corporations, except the Central Bank
Other sectors
Short-term
Long-term
Short-term
Long-term
Short-term
Long-term
Short-term
Long-term
2007 520.6 - - - - - - - 520.6 48.6 48.6 - 168.8 141.1 27.7 303.2
2008 736.6 - - - - - - - 736.6 83.2 83.2 - 245.6 194.5 51.1 407.8
2009 1,191.4 309.3 249.0 - 249.0 60.3 0.8 59.5 882.1 156.7 156.7 - 275.0 221.2 53.8 450.4
2010 1,371.5 325.9 260.0 - 260.0 65.9 1.7 64.2 1,045.6 221.8 221.8 - 308.0 232.7 75.4 515.8
2011 1,428.4 320.0 253.6 - 253.6 66.4 0.7 65.7 1,108.4 196.4 196.4 - 346.6 259.8 86.8 565.4
2012 Q1 1,340.6 312.7 247.4 - 247.4 65.3 1.1 64.2 1,027.9 189.4 189.4 - 264.9 222.0 42.9 573.6
Q2 1,236.8 321.0 253.5 - 253.5 67.5 0.7 66.7 915.9 176.0 176.0 - 149.8 110.9 38.8 590.1
Q3 1,533.2 361.2 294.2 - 294.2 66.9 0.9 66.0 1,172.1 184.1 184.1 - 378.9 340.6 38.3 609.1
Q4 1,517.3 401.4 336.5 - 336.5 65.0 0.4 64.6 1,115.9 175.6 175.6 - 354.4 321.0 33.5 585.9
2013 Q1 1,452.9 398.0 332.8 - 332.8 65.1 0.3 64.8 1,054.9 185.8 185.8 - 272.5 238.3 34.2 596.7
Q2 1,541.0 394.8 331.1 - 331.1 63.8 0.1 63.7 1,146.1 184.3 184.3 - 321.4 277.1 44.3 640.4
Q3 1,584.8 387.8 324.6 - 324.6 63.2 0.3 62.9 1,197.0 206.8 206.8 - 326.2 278.4 47.7 664.0
Q4 1,608.2 383.9 321.8 - 321.8 62.1 0.3 61.9 1,224.3 208.1 208.1 - 329.7 281.1 48.5 686.5
2014 Q1 1,596.8 379.8 317.6 - 317.6 62.2 0.1 62.1 1,217.0 225.2 225.2 - 305.1 249.1 56.0 686.7
Q2 1,648.3 381.8 319.0 - 319.0 62.9 0.2 62.7 1,266.4 229.3 229.3 - 339.4 283.4 55.9 697.8
Q3 1,709.0 383.4 318.1 - 318.1 65.4 0.1 65.2 1,325.6 229.0 229.0 - 385.6 314.3 71.2 711.1
Q4 1,737.1 392.8 326.4 - 326.4 66.3 0.3 66.1 1,344.3 234.2 234.2 - 390.1 294.8 95.3 720.0
2015 Q1
1,725.7
400.4
329.2
-
329.2
71.2
0.2
71.0
1,325.4
250.3 250.3 - 352.2 254.5 97.7 722.8
Q2 1,822.9 400.3 330.6 - 330.6 69.8 0.2 69.6 1,422.5 260.1 260.1 - 414.5 304.4 110.1 747.9
Q3 1,911.7 436.8 367.2 - 367.2 69.5 0.2 69.4 1,474.9 247.0 247.0 - 438.2 314.6 123.7 789.7

100 |
Monthly Statistics Bulletin December 2015
Table 32.2. Gross external debt position by creditors
(In millions of euro: As at end- September 2015)
Description
Total gross external debt
Gross external debt excluding direct investments
Direct investments: crediting between
companies
Government Central Bank of Qhe Republic of Kosovo
Deposit-taking
Corporations, except the
Central Bank
Other sector
s
International Monetary Fund
201.9
201.9
132.5
69.4 - - -
World Bank 208.2 208.2 208.2 - - - -
IBRD 181.0 181.0 181.0 - - - -
IDA 27.2 27.2 27.2 - - - -
Other creditors 1,501.6 711.9 26.5 0.2 247.0 438.2 789.7
Total debt 1,911.7 1,122.0 367.2 69.5 247.0 438.2 789.7
Notice: IBRD – International Bank for Riconstruction and development
IDA – International Development Association

| 101
Buletini Mujor Statistikor
December 2015 Monthly Statistics Bulletin
Table 32.3. Public sector debt service payment schedule
(In millions of euro: As at end - September 2015)
Description
One year or less (several months)
Over one year up to two years
the 3-rd year
the 4-th year
the 5-fth year
Over 5 up to 10 years
Over 10 up to 15 years
Over 15
years
Immediate 0 - 3 4-6 7 - 9 10 - 12
13 - 18 19 - 24
External debt of public sector
64.3
-
7.7
21.5
13.6
21.4
63.8
33.0
30.9
33.4
33.5
33.1
98.4
78.5
89.5
Principal
56.6 -
7.4
17.9
13.3
17.9
56.9
29.4
27.5
27.2
27.9
28.1
80.1
70.7
89.2
interest
7.8 -
0.3
3.6
0.3
3.5
6.9
3.6
3.3
6.2
5.6
5.0
18.2
7.8
0.3
External debt of private sector guaranteed by the Government
- - - - - - -
- - - - - - - -
Principal - - - - - - -
- - - - - - - -
Interest - - - - - - -
- - - - - - - -
Total
64.3 -
7.7
21.5
13.6
21.4
63.8
33.0
30.9
33.4
33.5
33.1
98.4
78.5
89.5
Principal
56.6 -
7.4
17.9
13.3
17.9
56.9
29.4
27.5
27.2
27.9
28.1
80.1
70.7
89.2
Interest
7.8 -
0.3
3.6
0.3
3.5
6.9
3.6
3.3
6.2
5.6
5.0
18.2
7.8
0.3

102 |
Monthly Statistics Bulletin December 2015
Table 32.4. Net external debt position
(In millions of euro: As at end - September 2015)
Description Gross external debt (1) External assets in
debt instruments (2) Net external debt (3)=(1)-
(2)
General Government 367.2 0.0 367.2
Short-term 0.0 0.0 0.0
Long-term 367.2 0.0 367.2
Special Drawing Rights (SDRs), alocations 0.0 0.0 0.0
Currency and deposits 0.0 0.0 0.0
Debt securities 0.0 0.0 0.0
Loans 367.2 0.0 367.2
Trade credits and advances 0.0 0.0 0.0
Other debt liabilities 0.0 0.0 0.0
Central Bank 69.5 1,459.1 -1,389.6
Short-term 0.2 1,378.1 -1,377.9
Currency and deposits 0.2 1,224.0 -1,223.9
Debt securities 0.0 154.1 -154.1
Loans 0.0 0.0 0.0
trade credits and advances 0.0 0.0 0.0
Other debt instruments 0.0 0.0 0.0
Long-term 69.4 81.0 -11.6
SDR alocations 69.4 81.0 -11.6
Currency and deposits 0.0 0.0 0.0
Debt securites 0.0 0.0 0.0
Loans 0.0 0.0 0.0
Trade credit and advances 0.0 0.0 0.0
Other debt instruments 0.0 0.0 0.0
Depsoitory corporations except the Central Bank 247.0 719.7 -472.7
Short-term 247.0 719.7 -472.7
Currency and deposits 161.6 388.4 -226.8
Debt securities 0.0 238.3 -238.3
Loans 83.2 89.9 -6.7
Trade credit and advances 0.0 0.0 0.0
Other debt liabilities 2.2 3.1 -0.9
Long-term 0.0 0.0 0.0
Other sectors 438.2 1,076.3 -638.0
Short-term 314.6 14.9 299.6
Currency and deposits 0.0 0.0 0.0
Debt securities 0.0 0.3 -0.3
Loans 143.4 0.0 143.4
Trade credit and advances 171.2 14.7 156.5
Other debt liabilities 0.0 0.0 0.0
Long-term 123.7 1,061.3 -937.7
Currency and deposits 0.0 1,058.4 -1,058.4
Debt securities 0.0 2.9 -2.9
Loans 123.7 0.0 123.7
Direct investments: Intercompany lending 789.7 0.0 789.7
Debt liabilties of direct investment enterprises to direct investors 0.0 0.0 0.0
Debt liabilities of direct investors to direct investments enterprises 789.7 0.0 789.7
Debt liabilities to fellow enterprises 0.0 0.0 0.0
NEt external debt (3) 1,911.7 3,255.1 -1,343.4

| 103
Buletini Mujor Statistikor
December 2015 Monthly Statistics Bulletin
Table 33.1. Portfolio investments holding (assets) by country of residency
of the non-resident
(In millions of euro: As at end-September 2015)
Description
Country Equity Total securities
debt
Total
Long term
securities debt Short term
securities debt
AE United Emirates - 0.1 0.1 - 0.1
AT Austria - 6.2 - 6.2 6.2
BE Belgium - 0.1 - 0.1 0.1
BG Bulgaria - 0.1 0.1 - 0.1
BR Brazili - 0.2 0.2 - 0.2
CZ Czech Republic - 0.1 0.1 - 0.1
DE Germany 0.1 73.3 - 73.3 73.4
DK Denmark - 34.0 - 34.0 34.0
FI Finland - 10.0 - 10.0 10.0
FR France 33.3 16.0 - 16.0 49.4
GB Great Britain - 0.1 0.1 - 0.1
GR Greece - 0.0 0.0 - 0.0
HU Hungary - 0.1 0.1 - 0.1
IE Ireland 550.1 0.2 0.2 - 550.4
IT Italy - 30.1 0.1 30.0 30.1
LU Luxembourg 461.0 38.6 0.1 38.5 499.6
LV Latvia - 0.1 0.1 - 0.1
NL Netherlands - 51.1 0.1 51.0 51.1
PL Poland - 8.0 - 8.0 8.0
PT Portugal - 0.1 0.1 - 0.1
RO Romania - 0.2 0.2 - 0.2
SE Sweden - 15.2 0.2 15.0 15.2
SI Slovenia - 1.2 1.2 - 1.2
SK Slovakia - 1.1 - 1.1 1.1
TR Turkey - 0.1 0.1 - 0.1
US United States 0.7 21.4 0.4 21.0 22.0
Total value of investments
1,045.2 307.8 3.5 304.3 1,353.1

104 |
Monthly Statistics Bulletin December 2015
Table 34.1. Exports by trading partners
(In millions of euro: Cumulative data during the reference year)
Description
Total exports
Europe
Non-european countries
European union CEFTA Other european
countries
EU 15 EU 10 EU 2
2001 10.6 … … … … … … … …
2002 27.6 … … … … … … … …
2003 35.6 35.1 14.9 13.7 1.0 0.2 18.2 2.0 0.5
2004 56.6 55.5 16.6 15.0 1.2 0.4 23.5 15.4 1.0
2005 56.3 54.2 21.8 19.2 1.5 1.2 29.9 2.6 2.0
2006 110.8 109.4 42.3 23.4 5.2 13.7 51.7 15.4 1.3
2007 165.1 156.8 69.3 53.1 5.1 11.1 65.1 22.4 8.3
2008 198.5 171.1 94.0 80.8 10.5 2.7 61.5 15.6 27.3
2009 November 149.0 130.4 64.3 57.6 4.0 2.6 48.4 17.7 18.6
December 165.3 144.2 71.3 64.0 4.3 2.9 53.5 19.5 21.1
2010 January 15.8 12.1 7.9 6.9 0.3 0.7 3.6 0.7 3.6
February 31.4 26.2 17.0 15.3 0.7 1.1 7.5 1.6 5.2
March 52.6 45.7 29.7 26.3 1.5 1.9 13.1 2.9 6.8
April 78.0 65.7 41.0 36.3 2.4 2.4 18.8 5.9 12.3
May 111.0 92.2 55.8 50.4 2.6 2.8 25.1 11.3 18.8
June 141.7 117.0 68.7 62.1 3.3 3.2 34.0 14.4 24.7
July 162.9 133.1 78.0 70.1 3.9 4.1 39.1 15.9 29.9
August 189.2 150.5 85.8 76.6 4.4 4.9 45.8 18.8 38.7
September 214.3 169.9 95.2 84.2 5.3 5.7 53.5 21.1 44.5
October 242.7 190.6 106.2 93.9 6.1 6.2 59.6 24.8 52.1
November 268.7 212.4 120.2 107.0 6.7 6.5 64.9 27.4 56.2
December 294.0 233.4 131.5 116.8 7.7 7.1 70.9 31.0 60.6
2011 January 22.9 18.9 12.6 11.5 0.9 0.1 5.5 0.8 4.0
February 48.5 42.6 29.3 26.5 2.1 0.8 11.2 2.0 5.9
March 74.8 64.7 43.7 39.4 3.5 0.9 18.0 3.0 10.1
April 104.1 89.6 56.8 51.0 4.9 1.0 24.9 7.9 14.5
May 133.4 109.9 67.3 60.3 5.8 1.2 31.6 11.1 23.4
June 164.2 135.4 77.5 69.6 6.6 1.3 38.2 19.7 28.8
July 193.5 160.2 86.6 77.3 7.7 1.5 48.1 25.5 33.4
August 217.3 177.6 93.7 83.8 8.1 1.8 56.3 27.6 39.6
September 241.6 196.6 104.3 93.9 8.5 1.9 63.3 29.0 45.0
October 268.8 219.4 118.9 107.8 9.0 2.1 70.0 30.5 49.4
November 290.9 236.6 128.1 116.4 9.5 2.2 76.0 32.6 54.2
December 312.5 254.1 136.4 124.0 10.2 2.2 82.4 35.3 58.4
2012 January 19.6 15.5 8.3 7.9 0.3 … 5.0 2.3 4.0
Source: Statistical Agency of Kosovo and CBK calculations

| 105
Buletini Mujor Statistikor
December 2015 Monthly Statistics Bulletin
Table 34.2. Export by trading partners - European Union
(In millions of euro: Cumulative data during the reference year)
Description
European union
EU 15
of which:
EU 10 of which:
EU 2 of which:
Austria Belgium France Germany Greece Italy Holand United Kingdom
Czech Republic
Slovenia Bulgaria
2003 14.9 13.7 1.4 … … 3.8 1.8 6.2 0.2 0.1 1.0 … 0.7 0.2 0.2
2004 16.6 15.0 0.9 … 0.2 3.3 4.3 5.5 0.1 0.6 1.2 … 1.0 0.4 0.4
2005 21.8 19.2 1.0 … 0.5 3.2 5.4 5.7 0.1 … 1.5 … 1.2 1.2 1.0
2006 42.3 23.4 1.2 … 0.2 4.0 3.9 12.7 1.1 … 5.2 0.4 4.5 13.7 13.5
2007 69.3 53.1 2.0 5.6 0.1 16.2 8.4 9.7 2.3 0.2 5.1 0.2 4.3 11.1 10.0
2008 94.0 80.8 2.1 28.1 0.2 7.2 10.9 25.5 1.9 0.2 10.5 1.1 6.3 2.7 2.6
2009 November 64.3 57.6 1.8 4.6 0.5 7.1 0.2 41.3 1.4 0.2 4.0 0.5 2.6 2.6 2.4
December 71.3 64.0 2.0 5.2 0.6 7.6 0.2 46.2 1.5 0.2 4.3 0.5 2.9 2.9 2.7
2010 January 7.9 6.9 0.3 0.3 0.2 0.4 … 5.6 0.1 … 0.3 … 0.2 0.7 0.5
February 17.0 15.3 0.7 0.8 0.3 1.0 … 12.4 0.1 0.1 0.7 … 0.6 1.1 0.9
March 29.7 26.3 1.3 1.2 0.3 2.8 … 20.3 0.2 0.2 1.5 0.1 1.4 1.9 1.6
April 41.0 36.3 2.0 2.3 0.4 3.2 … 27.6 0.2 0.3 2.4 0.1 2.2 2.4 2.1
May 55.8 50.4 2.6 4.7 0.5 4.7 … 36.6 0.4 0.4 2.6 0.1 2.4 2.8 2.6
June 68.7 62.1 3.1 6.6 0.5 5.4 … 44.8 0.5 0.4 3.3 0.1 3.1 3.2 3.0
July 78.0 70.1 3.6 6.6 0.7 6.3 … 51.0 0.6 0.5 3.9 0.1 3.5 4.1 3.8
August 85.8 76.6 4.0 6.9 0.7 7.3 … 55.5 0.7 0.5 4.4 0.1 4.0 4.9 4.6
September 95.2 84.2 4.7 7.5 0.8 8.1 0.2 60.5 0.8 0.6 5.3 0.1 4.9 5.7 5.5
October 106.2 93.9 5.0 8.4 0.8 9.5 0.2 67.2 0.9 0.6 6.1 0.1 5.2 6.2 5.9
November 120.2 107.0 5.4 10.6 0.9 13.3 0.2 73.8 1.0 0.6 6.7 0.2 5.6 6.5 6.2
December 131.5 116.8 5.6 11.5 1.0 15.4 0.2 80.1 1.0 0.7 7.7 0.3 6.2 7.1 6.8
2011 January 12.6 11.5 0.4 2.6 0.1 0.9 … 7.3 0.1 … 0.9 0.1 0.7 0.1 …
February 29.3 26.5 0.9 3.7 0.2 3.2 … 18.2 0.1 … 2.1 0.1 1.4 0.8 0.1
March 43.7 39.4 1.6 4.2 0.3 4.6 … 28.1 0.2 … 3.5 0.1 2.5 0.9 0.2
April 56.8 51.0 2.4 4.6 0.5 8.1 0.1 34.6 0.4 … 4.9 0.1 3.6 1.0 0.3
May 67.3 60.3 3.0 4.6 0.5 10.2 0.1 40.9 0.6 0.3 5.8 0.1 4.4 1.2 0.5
June 77.5 69.6 3.5 4.6 0.8 11.7 0.1 47.3 0.9 0.5 6.6 0.1 4.9 1.3 0.6
July 86.6 77.3 3.8 4.7 0.8 12.7 0.1 53.2 1.2 0.5 7.7 0.8 5.2 1.5 0.8
August 93.7 83.8 4.5 4.7 0.9 13.6 0.1 57.4 1.5 0.6 8.1 0.8 5.3 1.8 1.1
September 104.3 93.9 4.9 4.7 1.0 14.6 0.1 64.9 2.2 1.0 8.5 0.8 5.5 1.9 1.1
October 118.9 107.8 5.3 4.8 1.0 21.8 0.1 70.7 2.5 1.1 9.0 0.8 5.7 2.1 1.2
November 128.1 116.4 5.5 4.9 1.1 22.7 0.2 77.6 2.7 1.1 9.5 0.8 5.8 2.2 1.2
December 136.4 124.0 5.7 5.1 1.2 23.4 0.2 83.7 2.9 1.3 10.2 0.8 6.0 2.2 1.2
2012 Janar 8.3 7.9 0.5 … 0.1 0.8 … 6.2 0.1 0.1 0.3 … … … …
Source: Statistical Agency of Kosovo and CBK calculations

106 |
Monthly Statistics Bulletin December 2015
Table 34.3. Exports by trading partners - CEFTA
(In millions of euro: Cumulative data during the reference year)
Description
CEFTA
Albania Bosnia and
Herzegovina Croatia Macedonia Montenegro Serbia
2003 18.2 1.9 0.8 1.8 6.9 0.0 6.8
2004 23.5 1.8 1.5 0.5 9.6 0.0 10.1
2005 29.9 5.8 3.4 0.9 10.8 0.7 8.2
2006 51.7 12.6 5.1 1.1 9.7 2.2 20.9
2007 65.1 20.8 4.8 1.8 15.4 2.9 19.3
2008 61.5 21.1 5.9 0.8 20.0 3.8 9.9
2009 November 48.4 24.2 1.0 1.7 16.0 2.8 2.7
December 53.5 26.2 1.2 2.2 17.4 3.1 3.5
2010 January 3.6 1.3 0.4 0.5 1.1 0.1 0.1
February 7.5 2.9 0.7 0.7 2.6 0.3 0.4
March 13.1 5.0 1.1 0.8 4.9 0.5 0.8
April 18.8 7.3 1.4 1.0 7.3 0.8 0.9
May 25.1 9.7 1.5 1.2 10.4 1.2 1.2
June 34.0 15.7 1.6 1.3 12.4 1.5 1.4
July 39.1 18.3 1.6 1.5 14.3 1.7 1.7
August 45.8 21.8 1.7 1.7 16.2 2.2 2.3
September 53.5 25.1 1.8 2.1 19.0 2.8 2.8
October 59.6 27.5 1.8 2.3 21.7 3.2 3.2
November 64.9 29.2 1.8 2.5 24.2 3.5 3.6
December 70.9 32.3 1.9 2.7 26.3 3.9 3.8
2010 January 5.5 2.2 … 0.2 2.6 0.4 0.1
February 11.2 4.4 … 0.5 5.0 0.8 0.6
March 18.0 6.8 … 0.9 7.9 1.2 1.2
April 24.9 9.7 0.2 1.2 10.4 1.6 1.9
May 31.6 12.8 0.2 1.3 13.1 1.9 2.3
June 38.2 15.4 0.2 1.4 16.0 2.4 2.8
July 48.1 19.0 0.3 1.7 18.8 3.9 4.4
August 56.3 22.5 0.3 1.9 21.5 4.5 5.6
September 63.3 25.6 0.5 2.1 23.8 5.1 6.2
October 70.0 28.4 0.5 2.4 25.8 6.0 6.9
November 76.0 30.7 0.5 2.5 28.3 6.4 7.5
December 82.4 33.2 0.6 2.7 30.7 6.9 8.3
2012 January 5.0 2.3 0.1 0.1 1.3 0.5 0.3
Source: Statistical Agency of Kosovo and CBK calculations

| 107
Buletini Mujor Statistikor
December 2015 Monthly Statistics Bulletin
Table 34.4. Exports by trading partners - other European and Non-European countries
(In millions of euro: Cumulative data during the reference year)
Description
Other european countries
of which: Non-european countries
of which:
Turkey Switzerland
(CEFTA) China India
United States
2003 2.0 1.7 0.1 0.5 … … …
2004 15.4 2.9 0.1 1.0 … … …
2005 2.6 1.0 0.7 2.0 … … 0.2
2006 15.4 1.6 7.0 1.3 … … …
2007 22.4 2.7 12.4 8.3 … 3.1 …
2008 15.6 3.0 7.4 27.3 … 24.1 …
2009 November 17.7 5.9 9.5 18.6 1.6 13.1 0.3
December 19.5 6.5 10.5 21.1 1.6 15.5 0.3
2010 January 0.7 0.5 0.1 3.6 0.0 3.6 …
February 1.6 1.0 0.7 5.2 0.2 4.9 …
March 2.9 1.6 1.2 6.8 0.2 6.3 …
April 5.9 2.4 3.0 12.3 0.3 11.4 …
May 11.3 3.4 6.6 18.8 0.7 17.3 …
June 14.4 4.7 8.3 24.7 4.3 19.4 …
July 15.9 5.8 8.6 29.9 7.4 21.3 0.1
August 18.8 6.4 10.9 38.7 7.7 29.8 0.1
September 21.1 6.9 11.7 44.5 8.3 34.9 0.1
October 24.8 7.4 13.6 52.1 10.0 40.6 0.1
November 27.4 8.0 15.4 56.2 12.3 42.3 0.1
2010 31.0 9.3 17.7 60.6 14.8 44.0 0.1
January 0.8 0.6 0.2 4.0 0.2 1.8 …
February 2.0 0.9 1.1 5.9 0.2 1.8 …
March 3.0 1.7 1.3 10.1 0.7 3.4 …
April 7.9 2.1 5.6 14.5 3.6 4.7 0.1
May 11.1 2.8 7.4 23.4 7.3 8.2 0.2
June 19.7 3.6 10.3 28.8 11.1 9.7 0.2
July 25.5 4.1 15.5 33.4 13.5 11.1 0.2
August 27.6 5.0 16.7 39.6 17.4 11.1 0.2
September 29.0 5.8 17.3 45.0 20.2 11.1 0.2
October 30.5 6.5 18.1 49.4 22.5 12.6 0.2
November 32.6 7.0 19.7 54.2 26.5 12.6 0.2
December 35.3 7.8 21.6 58.4 28.2 13.3 0.2
2012 January 2.3 0.5 1.8 4.0 1.0 2.9 …
Source: Statistical Agency of Kosovo and CBK calculations

108 |
Monthly Statistics Bulletin December 2015
Table 34.5. Imports by trading partners
(In millions of euro: Cumulative data during the reference year)
Description
Total imports
Europe
Non-european countries
European union (EU)
CEFTA Other European
countries EU 15 EU 10 EU 2
2001 684.5
2002 854.8
2003 973.1 842.2 276.2 174.0 68.5 33.7 443.6 122.4 130.9
2004 1,063.3 947.1 424.7 284.0 93.4 47.3 368.7 153.6 116.2
2005 1,157.5 1,017.5 439.7 296.3 98.5 44.9 440.4 137.5 139.9
2006 1,305.9 1,153.6 454.3 286.5 104.9 62.9 536.3 163.0 152.3
2007 1,576.2 1,350.4 572.9 382.7 118.0 72.3 579.6 197.9 225.8
2008 1,928.2 1,654.8 702.0 490.4 150.9 60.6 717.8 235.0 273.4
2009 November 1,738.7 1,493.4 676.5 501.8 125.9 48.8 625.7 191.2 245.3
December 1,935.5 1,659.2 755.0 559.8 141.3 54.0 692.5 211.7 276.3
2010 January 103.4 84.6 32.3 22.8 6.6 2.9 38.6 13.8 18.8
February 230.7 191.1 82.5 59.5 17.6 5.4 78.5 30.1 39.6
March 390.0 331.1 148.2 109.3 29.5 9.4 136.5 46.5 58.9
April 570.2 491.6 222.8 164.6 45.5 12.7 204.3 64.5 78.7
May 750.8 649.4 295.2 219.3 59.1 16.8 270.4 83.7 101.5
June 938.7 805.1 363.7 270.1 73.2 20.5 341.1 100.3 133.6
July 1,154.7 995.8 453.4 335.0 88.7 29.7 420.3 122.1 159.0
August 1,361.7 1,173.9 527.2 388.4 104.8 34.1 506.4 140.3 187.8
September 1,553.1 1,339.3 597.9 439.3 119.9 38.6 586.3 155.2 213.7
October 1,749.2 1,508.5 674.7 496.9 134.6 43.2 657.9 175.9 240.7
November 1,936.1 1,668.0 742.4 546.4 148.4 47.5 730.4 195.2 268.1
December 2,144.9 1,839.8 821.3 604.6 164.3 52.3 799.0 219.5 305.1
January 132.7 110.7 44.1 32.0 9.0 3.2 49.1 17.5 22.0
February 281.8 232.6 100.0 73.4 19.1 7.5 97.6 35.0 49.2
March 472.3 389.9 168.3 123.8 31.1 13.3 171.3 50.3 82.4
April 668.2 557.7 237.3 174.2 43.3 19.8 247.2 73.2 110.5
May 880.6 740.8 312.8 230.7 56.3 25.8 330.3 97.8 139.8
June 1,093.5 922.2 389.9 288.7 70.7 30.5 415.4 117.0 171.3
July 1,315.6 1,107.5 477.7 356.3 85.3 36.1 494.5 135.3 208.1
August 1,544.8 1,302.5 570.8 423.8 101.9 45.1 574.6 157.1 242.3
September 1,760.5 1,486.2 657.1 488.2 117.3 51.7 652.5 176.5 274.3
October 2,006.4 1,692.1 754.3 563.4 132.8 58.2 737.5 200.3 314.3
November 2,230.4 1,882.4 840.6 628.9 148.5 63.2 817.0 224.9 348.0
December 2,479.3 2,092.7 941.7 704.2 167.6 69.9 899.5 251.4 386.6
2012 January 131.5 107.6 48.2 37.9 7.8 2.5 42.7 16.6 23.9
Source: Statistical Agency of Kosovo and CBK calculations

| 109
Buletini Mujor Statistikor
December 2015 Monthly Statistics Bulletin
Table 34.6. Imports by trading partners - European Union
(In millions of euro: Cumulative data during the reference year)
Description
European union (EU)
EU 15
of which:
EU 10 of which:
EU 2
Austria France Germany Greece Italy Czech
Republic Poland Hungary Slovakia Slovenia
2003 276.2 174.0 21.5 12.5 38.5 52.2 26.3 68.5 1.5 2.1 17.7 1.3 40.7 33.7
2004 424.7 284.0 27.6 23.1 78.2 68.5 44.5 93.4 3.3 6.3 19.7 4.4 56.9 47.3
2005 439.7 296.3 20.7 20.1 123.8 44.0 49.6 98.5 8.7 14.8 16.2 2.5 55.0 44.9
2006 454.3 286.5 23.5 15.9 122.7 37.6 52.5 104.9 11.5 13.8 20.0 2.4 56.0 62.9
2007 572.9 382.7 26.8 25.0 155.0 63.7 57.7 118.0 11.4 14.1 25.5 3.7 62.4 72.3
2008 702.0 490.4 31.0 37.5 196.6 81.4 74.4 150.9 15.4 22.2 37.7 7.2 66.8 60.6
2009 Nvember 676.5 501.8 35.1 23.6 221.2 71.5 78.9 125.9 14.9 21.7 23.4 4.8 59.5 48.8
December 755.0 559.8 38.9 27.2 246.1 79.1 87.6 141.3 17.1 24.1 26.9 5.2 66.2 54.0
2010 January 32.3 22.8 1.1 1.5 10.3 3.1 3.8 6.6 0.9 1.2 1.5 0.2 2.7 2.9
February 82.5 59.5 3.4 3.1 28.0 8.0 9.9 17.6 2.4 3.8 3.9 0.6 6.8 5.4
March 148.2 109.3 5.7 5.5 47.0 20.7 16.2 29.5 4.0 6.5 6.5 1.0 11.2 9.4
April 222.8 164.6 8.5 7.6 74.2 31.2 23.8 45.5 5.7 9.4 8.4 1.4 20.2 12.7
May 295.2 219.3 11.2 9.2 101.5 40.7 31.1 59.1 7.4 12.3 10.4 1.8 26.7 16.8
June 363.7 270.1 13.7 11.8 123.6 50.4 39.3 73.2 9.0 15.6 12.5 2.3 33.3 20.5
July 453.4 335.0 16.5 14.5 156.0 62.4 47.7 88.7 10.7 20.8 14.7 2.7 39.2 29.7
August 527.2 388.4 19.7 16.3 181.4 70.7 57.4 104.8 12.9 23.4 18.9 3.3 45.5 34.1
September 597.9 439.3 23.2 19.2 202.0 78.5 67.8 119.9 14.1 28.3 21.7 3.8 51.1 38.6
October 674.7 496.9 27.3 21.0 228.5 86.8 79.0 134.6 16.0 32.1 23.8 4.5 57.1 43.2
November 742.4 546.4 29.4 23.3 249.6 94.8 90.2 148.4 17.9 35.8 26.2 5.0 62.3 47.5
December 821.3 604.6 32.7 26.5 275.3 103.7 100.5 164.3 20.5 39.6 28.6 5.7 68.2 52.3
2011 January 44.1 32.0 2.1 1.6 12.8 5.9 5.7 9.0 1.3 2.4 2.0 0.3 2.9 3.2
February 100.0 73.4 4.4 3.0 31.6 12.7 14.7 19.1 3.2 4.0 3.6 0.7 7.4 7.5
March 168.3 123.8 7.4 5.4 51.3 21.2 23.8 31.1 5.0 5.7 5.6 1.0 13.6 13.3
April 237.3 174.2 10.3 8.0 71.4 29.2 34.3 43.3 6.6 7.4 7.7 1.4 19.7 19.8
May 312.8 230.7 12.9 10.8 95.1 37.1 46.5 56.3 8.0 9.9 10.0 1.9 25.7 25.8
June 389.9 288.7 16.6 14.0 119.2 45.8 58.1 70.7 9.3 12.3 13.0 2.5 32.6 30.5
July 477.7 356.3 19.2 17.5 145.5 54.6 75.5 85.3 11.7 15.6 15.4 3.1 38.4 36.1
August 570.8 423.8 22.9 20.2 176.9 64.9 88.8 101.9 13.8 19.0 18.8 3.6 45.4 45.1
September 657.1 488.2 25.8 22.6 204.6 75.6 103.8 117.3 15.1 21.9 23.3 4.1 51.4 51.7
October 754.3 563.4 30.5 25.8 231.9 86.3 126.2 132.8 16.3 25.3 27.2 4.6 57.7 58.2
November 840.6 628.9 33.6 31.0 258.5 94.7 140.9 148.5 17.4 29.2 31.1 5.1 64.0 63.2
December 941.7 704.2 38.6 34.7 292.4 103.0 157.1 167.6 19.3 32.9 34.9 5.7 71.4 69.9
2012 January 48.2 37.9 1.4 1.2 15.2 5.6 10.5 7.8 1.0 1.3 1.5 0.1 3.3 2.5
Source: Statistical Agency of Kosovo and CBK calculations

110 |
Monthly Statistics Bulletin December 2015
Table 34.7. Imports by trading partners - CEFTA
(In millions of euro: Cumulative data during the reference year)
Description
CEFTA
Albania Bosnia and
Herzegovina Croatia Macedonia Montenegro Serbia
2003 443.6 6.1 11.5 23.0 290.9 … 112.0
2004 368.7 20.2 12.8 25.1 149.2 … 161.3
2005 440.4 18.1 18.4 25.0 220.1 6.4 152.3
2006 536.3 23.1 18.5 28.1 257.8 17.8 191.1
2007 579.6 35.3 29.8 39.0 237.9 15.1 222.5
2008 717.8 59.6 38.7 50.0 346.5 13.8 209.0
2009 November 625.7 54.4 53.1 50.1 267.0 12.0 189.0
December 692.5 58.4 59.7 58.5 291.9 13.1 210.9
2010 January 38.6 4.6 3.8 2.7 17.1 0.2 10.2
February 78.5 7.3 7.2 4.9 33.4 0.6 25.3
March 136.5 11.6 14.8 9.8 54.5 1.1 44.6
April 204.3 18.3 25.5 15.2 76.8 1.9 66.5
May 270.4 23.9 32.6 19.7 104.3 3.1 86.9
June 341.1 30.5 40.7 25.0 131.9 4.5 108.5
July 420.3 38.5 46.6 31.4 167.2 5.7 130.9
August 506.4 47.0 55.4 36.4 202.3 7.1 158.2
September 586.3 53.2 64.9 43.2 232.2 8.3 184.5
October 657.9 59.6 70.8 48.0 259.5 9.6 210.3
November 730.4 65.0 78.1 55.0 287.5 10.7 234.0
December 799.0 69.1 83.0 59.3 316.1 11.4 260.1
2011 January 49.1 3.8 6.5 2.2 20.2 0.5 16.0
February 97.6 7.1 9.9 5.1 39.5 0.8 35.1
March 171.3 13.6 16.4 8.5 65.6 1.3 65.6
April 247.2 20.1 23.6 13.7 95.2 2.2 92.0
May 330.3 28.3 30.8 18.1 127.9 3.2 121.7
June 415.4 36.7 39.9 22.3 160.6 4.3 150.9
July 494.5 44.7 46.1 32.2 195.7 5.5 169.7
August 574.6 57.2 54.0 39.6 241.7 6.8 174.6
September 652.5 66.9 61.1 45.4 279.4 8.2 190.7
October 737.5 77.7 67.7 51.5 307.4 9.5 222.4
November 817.0 88.5 72.7 56.7 334.6 10.9 245.9
December 899.5 96.2 79.8 64.0 364.0 12.2 270.9
2012 January 42.7 5.0 2.7 1.8 19.1 0.2 13.9
Source: Statistical Agency of Kosovo and CBK calculations
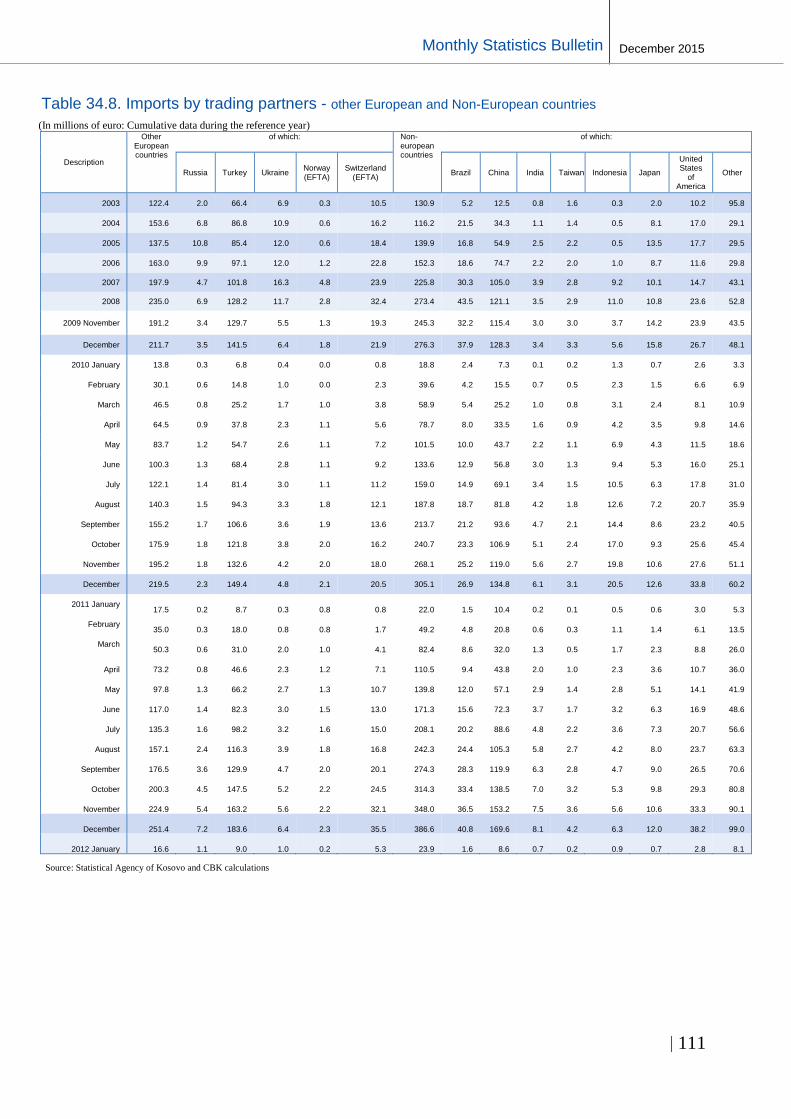
| 111
Buletini Mujor Statistikor
December 2015 Monthly Statistics Bulletin
Table 34.8. Imports by trading partners - other European and Non-European countries
(In millions of euro: Cumulative data during the reference year)
Description
Other European countries
of which: Non-european countries
of which:
Russia Turkey Ukraine Norway (EFTA)
Switzerland (EFTA)
Brazil China India Taiwan Indonesia Japan
United States
of America
Other
2003 122.4 2.0 66.4 6.9 0.3 10.5 130.9 5.2 12.5 0.8 1.6 0.3 2.0 10.2 95.8
2004 153.6 6.8 86.8 10.9 0.6 16.2 116.2 21.5 34.3 1.1 1.4 0.5 8.1 17.0 29.1
2005 137.5 10.8 85.4 12.0 0.6 18.4 139.9 16.8 54.9 2.5 2.2 0.5 13.5 17.7 29.5
2006 163.0 9.9 97.1 12.0 1.2 22.8 152.3 18.6 74.7 2.2 2.0 1.0 8.7 11.6 29.8
2007 197.9 4.7 101.8 16.3 4.8 23.9 225.8 30.3 105.0 3.9 2.8 9.2 10.1 14.7 43.1
2008 235.0 6.9 128.2 11.7 2.8 32.4 273.4 43.5 121.1 3.5 2.9 11.0 10.8 23.6 52.8
2009 November 191.2 3.4 129.7 5.5 1.3 19.3 245.3 32.2 115.4 3.0 3.0 3.7 14.2 23.9 43.5
December 211.7 3.5 141.5 6.4 1.8 21.9 276.3 37.9 128.3 3.4 3.3 5.6 15.8 26.7 48.1
2010 January 13.8 0.3 6.8 0.4 0.0 0.8 18.8 2.4 7.3 0.1 0.2 1.3 0.7 2.6 3.3
February 30.1 0.6 14.8 1.0 0.0 2.3 39.6 4.2 15.5 0.7 0.5 2.3 1.5 6.6 6.9
March 46.5 0.8 25.2 1.7 1.0 3.8 58.9 5.4 25.2 1.0 0.8 3.1 2.4 8.1 10.9
April 64.5 0.9 37.8 2.3 1.1 5.6 78.7 8.0 33.5 1.6 0.9 4.2 3.5 9.8 14.6
May 83.7 1.2 54.7 2.6 1.1 7.2 101.5 10.0 43.7 2.2 1.1 6.9 4.3 11.5 18.6
June 100.3 1.3 68.4 2.8 1.1 9.2 133.6 12.9 56.8 3.0 1.3 9.4 5.3 16.0 25.1
July 122.1 1.4 81.4 3.0 1.1 11.2 159.0 14.9 69.1 3.4 1.5 10.5 6.3 17.8 31.0
August 140.3 1.5 94.3 3.3 1.8 12.1 187.8 18.7 81.8 4.2 1.8 12.6 7.2 20.7 35.9
September 155.2 1.7 106.6 3.6 1.9 13.6 213.7 21.2 93.6 4.7 2.1 14.4 8.6 23.2 40.5
October 175.9 1.8 121.8 3.8 2.0 16.2 240.7 23.3 106.9 5.1 2.4 17.0 9.3 25.6 45.4
November 195.2 1.8 132.6 4.2 2.0 18.0 268.1 25.2 119.0 5.6 2.7 19.8 10.6 27.6 51.1
December 219.5 2.3 149.4 4.8 2.1 20.5 305.1 26.9 134.8 6.1 3.1 20.5 12.6 33.8 60.2
2011 January 17.5 0.2 8.7 0.3 0.8 0.8 22.0 1.5 10.4 0.2 0.1 0.5 0.6 3.0 5.3
February 35.0 0.3 18.0 0.8 0.8 1.7 49.2 4.8 20.8 0.6 0.3 1.1 1.4 6.1 13.5
March 50.3 0.6 31.0 2.0 1.0 4.1 82.4 8.6 32.0 1.3 0.5 1.7 2.3 8.8 26.0
April 73.2 0.8 46.6 2.3 1.2 7.1 110.5 9.4 43.8 2.0 1.0 2.3 3.6 10.7 36.0
May 97.8 1.3 66.2 2.7 1.3 10.7 139.8 12.0 57.1 2.9 1.4 2.8 5.1 14.1 41.9
June 117.0 1.4 82.3 3.0 1.5 13.0 171.3 15.6 72.3 3.7 1.7 3.2 6.3 16.9 48.6
July 135.3 1.6 98.2 3.2 1.6 15.0 208.1 20.2 88.6 4.8 2.2 3.6 7.3 20.7 56.6
August 157.1 2.4 116.3 3.9 1.8 16.8 242.3 24.4 105.3 5.8 2.7 4.2 8.0 23.7 63.3
September 176.5 3.6 129.9 4.7 2.0 20.1 274.3 28.3 119.9 6.3 2.8 4.7 9.0 26.5 70.6
October 200.3 4.5 147.5 5.2 2.2 24.5 314.3 33.4 138.5 7.0 3.2 5.3 9.8 29.3 80.8
November 224.9 5.4 163.2 5.6 2.2 32.1 348.0 36.5 153.2 7.5 3.6 5.6 10.6 33.3 90.1
December 251.4 7.2 183.6 6.4 2.3 35.5 386.6 40.8 169.6 8.1 4.2 6.3 12.0 38.2 99.0
2012 January 16.6 1.1 9.0 1.0 0.2 5.3 23.9 1.6 8.6 0.7 0.2 0.9 0.7 2.8 8.1
Source: Statistical Agency of Kosovo and CBK calculations

112 |
Monthly Statistics Bulletin December 2015
Table 34.9. Exports by commodity group
(In millions of euro: Cumulative data during the reference year)
Description
total exports of which
I. Live animals
and animal products
II. Vegetable products
III. Animal or veg. fats and
oil - edib.
IV. Prepared foodstuffs, bever. and
tob.
V. Mineral products
VI. Products
of the chem. Or
allied industry
VII. Plastics,
rubber an darticles thereof
IX. Wood and
articles of wood
X. Cellulosic material, pap. and articles
XI. Textiles
and textile articles
XIII. Artic. Of stoneplastic,
ceramic, glass
XV. Base metals and articlesof
base metal
XVI. Machinery, appliances,
electrical, etc.
XVII. transport means
2001 10.6 … … … … … … … … … … … … … …
2002 27.6 0.1 2.4 0.1 1.3 0.3 0.3 2.7 0.3 … 0.6 0.6 6.6 3.4 1.9
2003 35.6 … 2.4 … 4.1 0.5 0.5 2.7 0.6 0.4 1.1 0.8 12.0 3.0 1.2
2004 56.5 … 2.6 … 3.8 2.4 1.0 3.7 0.4 0.4 1.4 1.8 19.7 9.2 2.0
2005 56.3 0.5 2.9 … 4.6 3.2 1.2 1.0 0.4 0.4 0.6 0.4 24.8 6.5 2.3
2006 110.8 0.3 5.1 0.1 6.2 18.8 1.2 3.2 0.8 0.7 0.7 0.7 53.1 7.7 1.4
2007 165.1 0.6 9.1 … 8.4 27.3 0.9 6.5 1.7 1.0 1.2 1.2 74.1 21.3 1.5
2008 198.5 1.2 9.0 … 10.6 18.7 1.8 6.5 1.7 1.1 2.5 1.5 124.8 8.8 2.3
2009 November 148.9 1.0 8.7 0.1 8.4 23.0 1.4 6.0 0.8 1.0 4.5 1.2 79.0 6.0 1.5
December 165.3 1.1 9.5 0.1 9.4 25.0 1.5 6.4 0.9 1.0 5.2 1.2 88.4 7.2 1.6
2010 January 15.8 … 0.6 … 0.5 0.3 0.1 0.4 0.1 0.1 0.5 0.1 10.6 1.2 0.3
February 31.4 0.1 1.4 … 1.3 1.3 0.1 0.6 0.1 0.1 0.9 0.1 20.7 2.1 0.4
March 52.6 0.1 2.4 0.1 2.1 3.2 0.2 1.2 0.2 0.2 1.5 0.2 34.3 2.8 0.5
April 78.0 0.2 3.1 0.1 3.0 4.5 0.3 1.8 0.3 0.3 2.1 0.3 51.8 4.7 0.6
May 111.0 0.2 3.9 0.1 4.0 9.9 0.5 2.6 0.4 0.4 2.6 0.5 73.7 5.6 0.8
June 141.7 0.3 4.8 0.1 5.0 16.6 0.6 3.6 0.5 0.5 3.1 0.6 91.5 6.8 1.0
July 162.9 0.4 5.7 0.1 6.1 18.7 0.7 4.4 0.6 0.6 4.0 0.8 104.7 7.6 1.1
August 189.2 0.5 7.6 0.1 7.2 22.7 0.8 5.3 0.7 0.7 4.7 0.9 120.4 8.1 1.1
September 214.3 0.6 9.1 0.1 8.3 26.8 1.0 5.9 0.9 0.8 5.3 1.0 134.8 9.1 1.2
October 242.6 0.7 10.3 0.1 9.2 31.6 1.1 6.7 1.0 0.9 6.2 1.2 152.7 9.6 1.3
November 268.6 0.8 11.0 0.1 10.2 35.4 1.2 7.3 1.1 1.0 6.9 1.3 169.9 10.2 1.4
December 294.0 0.9 12.1 0.1 11.4 38.8 1.3 8.0 1.2 1.0 8.3 1.4 185.2 10.7 1.5
2011 January 22.9 0.1 1.2 … 0.6 0.6 … 0.7 0.1 0.1 0.9 0.1 16.7 0.3 …
February 48.5 0.1 2.2 … 1.2 1.5 0.2 1.7 0.2 0.1 1.7 0.1 35.4 1.3 0.1
March 74.8 0.2 3.1 … 2.2 1.9 0.5 2.8 0.3 0.2 2.8 0.3 54.3 2.1 0.1
April 104.1 0.2 3.9 … 3.3 6.6 0.8 4.0 0.4 0.3 4.2 0.5 71.6 2.7 0.2
May 133.4 0.2 4.4 … 4.3 10.2 0.9 5.0 0.6 0.4 5.2 0.6 91.8 3.3 0.3
June 164.2 0.2 5.1 … 5.6 19.7 1.2 6.1 0.8 0.5 6.1 0.7 106.5 4.3 0.4
July 193.5 0.3 5.8 … 6.9 28.5 1.4 7.4 0.9 0.6 6.9 0.7 120.4 5.2 0.4
August 217.3 0.3 7.8 … 8.1 31.6 1.6 8.2 1.0 0.9 7.6 0.8 134.3 5.6 0.5
September 241.6 0.4 9.1 … 9.2 32.7 1.8 9.4 1.1 1.0 8.5 0.9 150.0 6.9 0.6
October 268.8 0.4 10.3 … 10.4 34.2 1.9 10.4 1.3 1.1 9.2 1.0 163.6 13.7 0.7
November 290.9 0.4 11.4 … 11.6 36.5 2.1 11.3 1.5 1.3 10.1 1.1 177.1 14.3 0.9
December 312.5 0.4 12.6 … 12.8 38.6 2.2 12.4 1.6 1.5 11.1 1.1 190.1 15.1 1.0
2012 January 19.6 … … … 0.8 2.0 … 0.9 0.1 0.1 0.7 … 12.6 0.3 0.1
Source: Statistical Agency of Kosovo and CBK calculations

| 113
Buletini Mujor Statistikor
December 2015 Monthly Statistics Bulletin
Table 34.10. Imports by commodity group
(In millions of euro: Cumulative data during the reference year)
Description
Total imports of which
I. Live animals
and animal
products
II. Vegetable products
III. Animal or veg. fats and
oil - edib.
IV. Prepared foodstuffs, bever. and
tob.
V. Mineral products
VI. Products
of the chem. or
allied industry
VII. Plastics, rubber
and articles thereof
IX. Wood and
articles of wood
X. Cellulosic material, pap. and articles
XI. Textiles
and textile articles
XIII. Artic. of stoneplastic,
ceramic, glass
XV. Base metals
and articlesof
base metal
XVI. Machinery, appliances, electrical,
etc.
XVII. transport means
2001 684.5
2002 854.7 51.0 47.1 7.9 174.8 123.5 52.7 25.3 29.9 9.9 16.4 72.5 53.6 97.5 10.3
2003 973.1 50.4 66.7 8.3 203.5 138.6 70.9 32.7 33.2 16.6 28.8 60.5 58.0 105.5 27.8
2004 1,063.2 52.4 68.1 7.3 165.4 173.1 98.0 42.5 29.9 33.4 31.2 54.9 77.5 116.8 50.2
2005 1,157.5 54.0 57.2 11.0 163.3 207.3 91.1 51.0 30.5 23.5 35.9 51.5 90.3 129.2 104.2
2006 1,305.9 50.5 73.0 15.3 180.6 241.7 107.7 60.7 30.3 27.6 45.1 57.0 122.6 153.3 79.3
2007 1,576.2 61.2 83.4 17.3 222.2 295.3 119.9 72.8 35.4 31.9 53.0 63.0 144.3 203.4 95.9
2008 1,928.2 85.4 103.6 22.7 261.9 378.6 138.8 86.1 41.7 39.0 64.0 67.2 179.6 239.9 131.1
2009 November 1,738.7 73.6 81.8 16.1 210.1 299.4 128.3 87.0 41.6 41.1 62.6 67.9 146.8 248.3 146.0
December 1,935.5 84.6 90.0 18.2 241.6 331.3 142.9 95.7 44.9 45.4 69.1 73.5 159.4 278.7 162.2
2010 January 103.4 6.3 6.6 0.6 10.7 25.7 5.6 4.4 1.7 2.5 2.9 3.4 9.4 10.6 8.2
February 230.9 13.1 14.7 1.9 27.7 50.4 16.5 9.8 3.8 6.1 6.5 6.5 17.8 26.6 18.0
March 390.1 18.9 23.1 3.2 45.0 80.2 30.2 17.2 6.6 9.8 12.0 11.6 33.8 49.3 29.6
April 570.4 26.2 33.0 4.8 64.4 109.8 42.4 25.8 10.5 13.2 17.3 18.8 54.9 79.5 42.5
May 751.0 32.4 42.9 6.3 84.4 143.6 54.4 35.5 15.6 16.8 23.3 27.4 68.8 106.0 55.1
June 938.8 41.4 51.6 7.6 106.0 181.1 67.3 46.8 20.8 21.0 29.6 36.6 83.6 126.7 66.8
July 1,154.8 48.4 60.7 9.3 133.8 228.1 80.0 58.3 26.1 25.6 35.0 46.0 99.9 159.9 80.1
August 1,361.7 57.5 70.8 11.6 165.2 268.1 92.3 68.9 31.6 31.5 40.5 54.7 120.3 183.4 90.8
September 1,553.1 66.1 78.4 13.7 191.0 304.2 105.4 78.5 36.3 35.3 48.4 63.5 138.7 208.0 101.7
October 1,749.3 72.5 88.3 15.1 211.8 342.7 121.0 88.5 41.6 38.4 56.9 71.6 156.5 235.6 113.4
November 1,936.2 79.4 97.0 17.0 234.8 383.4 131.7 97.8 45.6 42.0 64.2 78.8 173.7 258.2 126.5
December 2,144.9 87.0 108.5 19.3 261.7 419.2 146.6 108.1 49.0 49.2 71.7 84.7 190.0 288.2 142.1
2011 January 132.7 7.1 8.5 1.4 16.0 30.7 9.5 5.7 2.0 2.7 4.6 3.6 13.3 11.7 9.7
February 281.8 13.9 19.7 3.1 35.6 61.4 20.0 12.2 4.3 7.3 9.7 8.0 24.1 27.1 20.0
March 472.3 20.6 33.7 4.3 57.7 100.1 36.1 21.1 7.0 16.8 16.6 13.9 40.8 45.4 32.1
April 668.2 27.7 46.2 5.7 80.2 145.9 51.5 32.4 11.2 20.6 23.4 21.2 58.2 64.2 45.0
May 880.6 37.0 59.6 7.7 104.8 190.2 66.4 45.7 16.0 25.8 31.6 31.3 76.8 84.5 57.5
June 1,093.5 45.0 73.1 9.6 130.9 231.1 82.4 59.5 21.7 30.6 39.5 41.8 96.9 105.7 68.9
July 1,315.6 54.1 84.4 11.6 156.4 275.4 96.3 72.4 28.4 34.6 47.1 50.9 118.3 132.6 83.3
August 1,544.8 63.0 92.4 14.8 186.0 327.4 109.4 86.6 34.4 38.9 55.1 59.1 144.6 156.3 96.4
September 1,760.5 70.6 101.7 16.5 214.3 379.1 123.2 100.2 38.9 43.3 62.3 67.2 165.6 178.4 109.6
October 2,006.4 80.2 113.9 17.9 238.1 438.3 142.7 114.0 44.2 47.8 72.5 77.7 188.9 205.4 123.9
November 2,230.4 87.1 124.0 19.6 263.6 493.9 160.5 125.6 49.2 53.2 80.7 85.3 207.3 231.7 137.3
December 2,479.3 97.4 136.8 22.0 303.9 538.1 177.8 137.5 53.8 58.5 88.4 91.2 228.0 267.6 155.3
2012 January 131.5 5.6 9.3 0.7 11.5 36.6 8.8 7.1 1.3 2.4 4.3 3.0 12.7 12.9 8.8
Source: Statistical Agency of Kosovo and CBK calculations

114 |
Monthly Statistics Bulletin December 2015
Tabela 34.11. Imports by trading partners and broad economic categories
(In millions of euro: Cumulative data during the reference year)
Total
As of November 2011
Description
I. Live animals
and animal
products
II. Vegetabke products
III. Animal or veg.
fats and oil - edib.
IV. Prepared foodstuffs,
bever. and tob.
V. Mineral products
VI. Products
of the chem. Or
allied industry
VII. Plastics,
rubber an darticles thereof
XIII. Artic. Of
stoneplastic, ceramic,
glass
XVI. Machinery, appliances, electrical,
etc.
XIX. Weapons
and munition
XX. Miscellaneous
articles
XXI. Art works
Total 131.5 5.6 9.3 0.7 11.5 36.6 8.8 7.1 4.3 3.0 12.9 8.8 2.1
Europe 107.6 3.4 6.8 0.7 9.6 32.3 7.4 5.5 2.6 2.3 9.2 8.3 1.5
European Union (EU) 48.2 2.4 2.6 0.3 3.7 9.8 4.3 3.2 0.5 1.1 4.5 8.4 1.0
BE 15, of which: 37.9 0.8 1.9 0.1 2.2 9.3 3.2 2.1 0.3 0.9 4.2 7.9 1.0
Austria 1.4 0.1 0.0 0.0 0.4 0.0 0.3 0.1 0.0 0.1 0.1 0.0 0.0
France 1.2 0.0 0.0 0.0 0.1 0.0 0.2 0.0 0.0 0.0 0.1 0.6 0.0
Germany 15.2 0.5 0.0 0.0 1.1 0.6 0.9 1.3 0.1 0.2 1.8 6.8 0.6
Greece 5.6 0.0 0.7 0.0 0.2 2.7 0.7 0.1 0.0 0.0 0.2 0.0 0.0
Italy 10.5 0.0 0.6 0.0 0.4 5.8 0.5 0.3 0.1 0.3 1.2 0.2 0.1
Holand 0.8 0.1 0.4 0.0 0.0 0.0 0.1 0.0 0.0 0.0 0.0 0.0 0.0
Spain 1.0 0.0 0.1 0.0 0.0 0.0 0.1 0.0 0.1 0.3 0.3 0.1 0.0
Sweeden 0.6 0.0 0.0 0.0 0.0 0.0 0.0 0.0 0.0 0.0 0.2 0.1 0.0
United Kingdom 0.5 0.0 0.0 0.0 0.1 0.0 0.1 0.0 0.0 0.0 0.1 0.1 0.0
BE 10, of which: 7.8 1.5 0.1 0.0 1.1 0.5 0.9 0.8 0.0 0.0 0.2 0.5 0.0
Check Republic 1.0 0.1 0.0 0.0 0.0 0.0 0.1 0.1 0.0 0.0 0.2 0.2 0.0
Poland 1.3 0.1 0.0 0.0 0.3 0.0 0.1 0.4 0.0 0.0 0.1 0.0 0.0
Hungary 1.5 0.4 0.1 0.0 0.2 0.0 0.1 0.2 0.0 0.0 0.3 0.0 0.0
Sllovenia 3.3 0.8 0.0 0.0 0.6 0.0 0.5 0.2 0.0 0.0 0.3 0.0 0.5
BE 2 2.5 0.1 0.6 0.2 0.4 0.0 0.3 0.2 0.1 0.2 0.0 0.0 0.0
Bullgaria 1.9 0.1 0.6 0.2 0.2 0.0 0.0 0.2 0.1 0.2 0.0 0.0 0.0
Rumania 0.6 0.0 0.0 0.0 0.3 0.0 0.2 0.1 0.0 0.0 0.0 0.0 0.0
Other European countries 16.6 0.0 1.1 0.0 1.5 4.6 1.5 1.1 1.8 0.2 2.6 -0.1 0.5
of which:
Turkey 9.0 0.0 0.4 0.0 1.1 0.3 0.7 0.9 1.7 0.2 1.5 0.1 0.0
Switzerland 5.3 0.0 0.1 0.0 0.0 4.3 0.1 0.1 0.0 0.0 0.4 0.0 0.0
CEFTA 42.7 0.9 3.1 0.4 4.4 17.8 1.6 1.2 0.3 1.0 2.1 0.1 0.0
Albania 5.0 0.1 0.2 0.0 0.1 1.0 0.0 0.0 0.0 0.0 0.2 0.0 0.0
Bosnia and Herz. 2.7 0.2 0.0 0.0 0.3 0.1 0.1 0.0 0.0 0.0 0.1 0.0 0.0
Croatia 1.8 0.1 0.1 0.0 0.3 0.1 0.5 0.0 0.0 0.1 0.5 0.0 0.0
Montenegro 0.2 0.0 0.0 0.0 0.1 0.0 0.0 0.0 0.0 0.0 0.0 0.0 0.0
Macedonia 0.0 0.0 0.0 0.0 0.0 0.0 0.0 0.0 0.0 0.0 0.0 0.0 0.0
Moldavia 19.1 0.1 0.5 0.1 1.2 13.5 0.2 0.4 0.0 0.2 0.8 0.0 0.0
Serbia 13.9 0.4 2.3 0.3 2.4 3.3 0.8 0.7 0.3 0.6 0.6 0.1 0.0
Other Non European countries 23.9 2.2 2.4 0.0 1.9 4.3 1.4 1.6 1.7 0.7 3.7 0.5 0.6
of which:
USA 2.8 0.9 0.0 0.0 0.0 0.0 1.0 0.1 0.0 0.0 0.5 0.0 0.2
China 8.6 0.0 0.2 0.0 0.2 0.0 0.2 0.6 1.4 0.7 2.4 0.0 0.2
Brasil 1.6 0.7 0.2 0.0 0.6 0.0 0.0 0.0 0.0 0.0 0.0 0.0 0.0
Japan 0.7 0.0 0.0 0.0 0.0 0.0 0.0 0.2 0.0 0.0 0.2 0.2 0.1
Other 10.3 0.6 1.9 0.0 1.1 4.2 0.2 0.8 0.2 0.0 0.6 0.2 0.1
Source: Statistical Agency of Kosovo and CBK calculations

| 115
Buletini Mujor Statistikor
December 2015 Monthly Statistics Bulletin
Table 34.12. Imports by broad economic categories (BEC)
(In millions of euro: Cumulative data during the reference year)
Description
Total imports
Capital goods Intermediary goods of which:
Consumption goods of which:
Ommitted goods
Capital goods (Except transport equipment)
Food and beverages,
primary, mainly for industry
Food an d beverages, processed, mainly for industry
Industrial supplies
not elsewhere specified, primary
Food and beverages,
primary, mainly for household
consumption
Food and beverages, processed, mainly for household
consumption
Consumer goods
elsewhere specified,
semidurable
Consumer goods not elsewhere specified,
non-durable
transport equipment, industrial
2005 1,157.5 91.2 74.3 16.9 397.9 11.4 25.3 11.6 382.8 44.0 165.6 41.1 94.9 285.5
2006 1,305.9 96.3 80.1 16.2 491.2 22.4 35.1 13.8 421.9 46.8 169.1 51.6 114.3 296.5
2007 1,576.2 145.4 127.6 17.8 660.6 25.0 44.0 26.8 508.1 52.4 199.7 63.6 131.5 262.0
2008 1,928.1 195.0 163.9 31.0 962.6 42.1 41.8 24.9 631.4 61.2 251.0 89.5 158.3 139.3
2009 1,935.5 250.4 201.8 48.6 785.4 25.7 34.1 27.4 607.5 60.9 255.3 75.9 145.7 292.2
2010 December
230.9 23.5 19.3 4.2 94.4 4.8 3.9 4.5 72.6 9.9 31.1 9.3 16.1 40.5
March 390.1 44.0 36.4 7.6 159.6 6.9 6.2 7.3 118.6 15.3 49.2 15.8 27.7 68.0
April 570.4 65.5 54.0 11.5 241.2 9.1 9.1 11.5 169.4 22.0 70.7 22.1 38.6 94.2
May 751.0 85.1 69.9 15.2 317.9 11.4 11.0 14.9 225.7 30.0 92.9 28.8 49.4 122.3
June 938.8 103.3 85.4 17.9 400.1 13.8 13.3 21.2 284.9 36.9 118.2 35.3 61.4 150.6
July 1,154.8 119.8 99.3 20.5 521.0 16.4 16.4 25.6 348.8 43.3 143.3 42.8 77.8 165.1
August 1,361.7 137.1 114.7 22.5 628.3 21.5 20.2 29.7 417.4 48.7 175.1 51.8 92.3 178.8
September 1,553.1 155.3 131.1 24.2 726.7 25.3 23.2 33.3 480.2 52.8 201.6 62.0 107.5 191.0
October 1,749.3 172.9 146.5 26.4 831.9 29.0 27.5 38.5 538.7 57.3 223.2 73.9 119.5 205.8
November 1,936.2 193.3 162.2 31.2 928.9 32.4 31.2 43.3 597.0 61.8 245.6 84.1 133.3 217.0
December 2,144.9 218.5 184.0 34.5 1,026.4 36.8 35.0 48.9 667.5 68.2 272.9 93.6 150.4 232.5
2011 January 132.7 9.9 8.1 1.8 68.6 3.1 2.3 3.9 42.7 5.2 18.1 6.0 9.9 11.5
February 281.8 23.5 19.2 4.3 141.1 7.1 5.1 10.2 94.3 11.4 38.1 13.7 22.1 22.9
March 472.3 40.7 33.1 7.6 239.3 12.7 7.9 19.6 151.8 18.7 59.1 23.3 36.3 40.6
April 668.2 56.8 45.9 10.9 349.2 16.4 11.9 29.1 209.1 26.2 81.5 31.9 49.4 53.1
May 880.6 72.1 58.7 13.4 464.4 20.6 16.3 33.4 277.2 34.3 107.9 42.6 63.8 66.9
June 1,093.5 88.4 72.7 15.6 581.6 25.3 21.3 38.0 344.4 42.1 134.4 51.4 78.7 79.1
July 1,315.6 110.9 93.4 17.5 696.2 29.8 26.4 42.0 411.9 48.6 160.0 61.2 94.5 96.6
August 1,544.8 126.7 107.5 19.2 824.2 33.5 31.2 45.2 480.2 53.9 189.4 71.8 109.5 113.8
September 1,760.5 141.8 120.3 21.5 946.8 38.7 35.2 49.9 543.6 57.9 214.2 82.1 126.6 128.3
October 2,006.4 160.9 136.9 24.1 1,091.6 45.6 40.2 53.8 611.1 62.5 238.1 96.4 142.5 142.8
November 2,230.4 178.7 152.1 26.6 1,217.4 49.8 44.9 58.6 676.8 67.6 260.4 107.7 161.7 157.5
December 2,479.3 202.6 173.1 29.5 1,334.3 54.3 50.8 63.7 766.9 75.1 296.7 118.1 186.4 175.4
2012 January 131.5 10.3 8.9 1.4 78.1 3.2 3.1 6.3 32.2 5.0 11.9 4.6 6.8 11.0
Source: Statistical Agency of Kosovo and CBK calculations
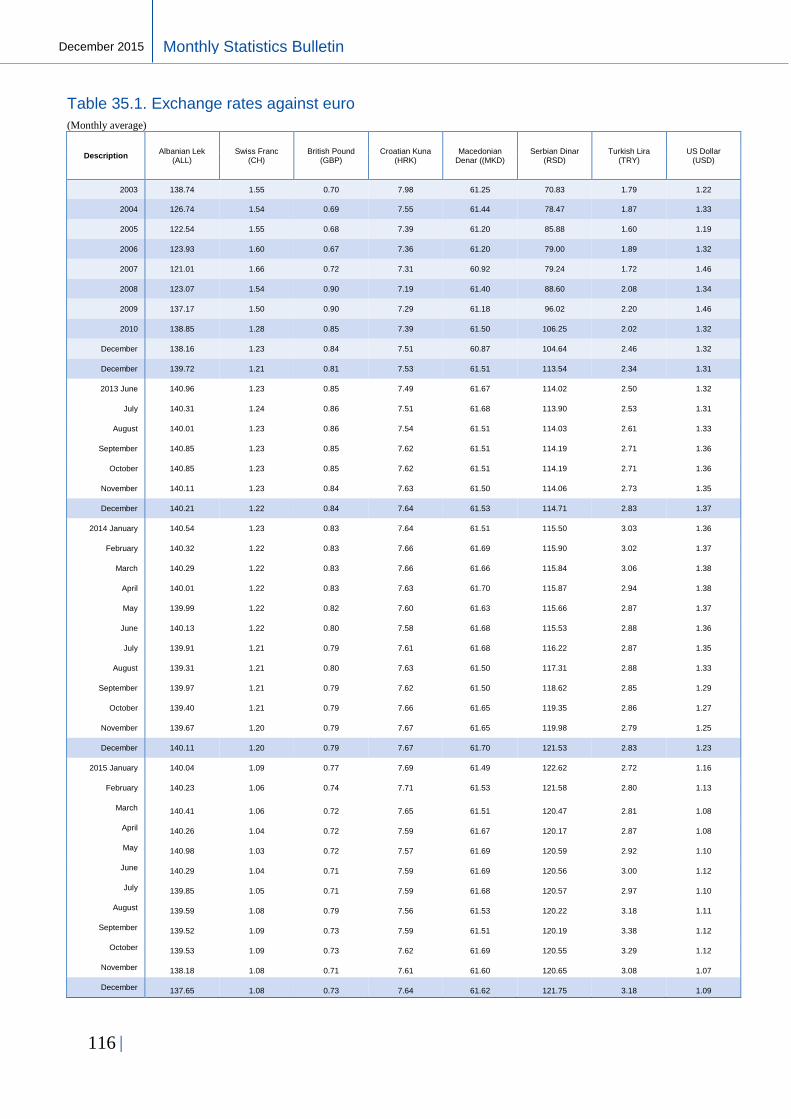
116 |
Monthly Statistics Bulletin December 2015
Table 35.1. Exchange rates against euro
(Monthly average)
Description Albanian Lek
(ALL) Swiss Franc
(CH) British Pound
(GBP) Croatian Kuna
(HRK) Macedonian
Denar ((MKD) Serbian Dinar
(RSD) Turkish Lira
(TRY) US Dollar
(USD)
2003 138.74 1.55 0.70 7.98 61.25 70.83 1.79 1.22
2004 126.74 1.54 0.69 7.55 61.44 78.47 1.87 1.33
2005 122.54 1.55 0.68 7.39 61.20 85.88 1.60 1.19
2006 123.93 1.60 0.67 7.36 61.20 79.00 1.89 1.32
2007 121.01 1.66 0.72 7.31 60.92 79.24 1.72 1.46
2008 123.07 1.54 0.90 7.19 61.40 88.60 2.08 1.34
2009 137.17 1.50 0.90 7.29 61.18 96.02 2.20 1.46
2010 138.85 1.28 0.85 7.39 61.50 106.25 2.02 1.32
December 138.16 1.23 0.84 7.51 60.87 104.64 2.46 1.32
December 139.72 1.21 0.81 7.53 61.51 113.54 2.34 1.31
2013 June 140.96 1.23 0.85 7.49 61.67 114.02 2.50 1.32
July 140.31 1.24 0.86 7.51 61.68 113.90 2.53 1.31
August 140.01 1.23 0.86 7.54 61.51 114.03 2.61 1.33
September 140.85 1.23 0.85 7.62 61.51 114.19 2.71 1.36
October 140.85 1.23 0.85 7.62 61.51 114.19 2.71 1.36
November 140.11 1.23 0.84 7.63 61.50 114.06 2.73 1.35
December 140.21 1.22 0.84 7.64 61.53 114.71 2.83 1.37
2014 January 140.54 1.23 0.83 7.64 61.51 115.50 3.03 1.36
February 140.32 1.22 0.83 7.66 61.69 115.90 3.02 1.37
March 140.29 1.22 0.83 7.66 61.66 115.84 3.06 1.38
April 140.01 1.22 0.83 7.63 61.70 115.87 2.94 1.38
May 139.99 1.22 0.82 7.60 61.63 115.66 2.87 1.37
June 140.13 1.22 0.80 7.58 61.68 115.53 2.88 1.36
July 139.91 1.21 0.79 7.61 61.68 116.22 2.87 1.35
August 139.31 1.21 0.80 7.63 61.50 117.31 2.88 1.33
September 139.97 1.21 0.79 7.62 61.50 118.62 2.85 1.29
October 139.40 1.21 0.79 7.66 61.65 119.35 2.86 1.27
November 139.67 1.20 0.79 7.67 61.65 119.98 2.79 1.25
December 140.11 1.20 0.79 7.67 61.70 121.53 2.83 1.23
2015 January 140.04 1.09 0.77 7.69 61.49 122.62 2.72 1.16
February 140.23 1.06 0.74 7.71 61.53 121.58 2.80 1.13
March 140.41 1.06 0.72 7.65 61.51 120.47 2.81 1.08
April 140.26 1.04 0.72 7.59 61.67 120.17 2.87 1.08
May 140.98 1.03 0.72 7.57 61.69 120.59 2.92 1.10
June 140.29 1.04 0.71 7.59 61.69 120.56 3.00 1.12
July 139.85 1.05 0.71 7.59 61.68 120.57 2.97 1.10
August 139.59 1.08 0.79 7.56 61.53 120.22 3.18 1.11
September 139.52 1.09 0.73 7.59 61.51 120.19 3.38 1.12
October 139.53 1.09 0.73 7.62 61.69 120.55 3.29 1.12
November 138.18 1.08 0.71 7.61 61.60 120.65 3.08 1.07
December 137.65 1.08 0.73 7.64 61.62 121.75 3.18 1.09

| 117
Buletini Mujor Statistikor
December 2015 Monthly Statistics Bulletin
Table 35.2. Nominal and real effective exchange rate
(January 2007=100)
Description
Index
NEER REER REER (CEFTA) REER (EU)
2006 100.1 99.1 99.1 98.8
2007 100.2 105.4 103.8 105.8
2008 102.2 105.1 106.1 103.9
2009 101.6 102.2 101.3 102.6
2010 100.8 104.8 105.8 106.4
December 101.1 105.8 106.6 106.9
December 101.2 106.6 106.9 108.6
2013 May 101.3 105.9 106.6 107.2
June 101.6 106.1 106.5 107.4
July 101.5 106.2 107.1 107.4
August 101.7 105.9 106.3 107.1
September 101.9 105.7 106.2 106.5
October 101.9 106.6 107.2 107.5
November 101.9 107.0 107.7 107.8
December 102.1 107.2 107.7 107.8
2014 January 102.4 108.0 107.9 109.1
February 102.4 107.8 107.6 108.6
March 102.5 107.6 107.5 108.1
April 102.4 106.5 106.6 107.0
May 102.3 106.1 106.3 107.0
June 102.2 106.3 106.8 107.1
July 102.2 106.5 106.8 107.6
August 102.1 106.6 107.2 107.6
September 102.0 106.4 107.3 107.5
October 102.0 106.4 107.5 107.6
November 101.8 106.1 107.4 107.5
December 101.9 106.0 107.4 107.3
2015 January 101.2 106.3 108.2 108.9
February 101.2 106.0 107.9 108.6
March 100.9 105.1 107.3 107.8
April 100.9 103.9 106.1 106.6
May 101.0 104.0 106.2 106.3
June 101.2 104.1 106.2 106.4
July 101.1 104.2 106.2 106.7
August 101.6 104.6 106.0 106.9
September 101.9 104.5 105.5 106.3
October 101.8 104.9 106.3 106.8
November 101.3 104.5 106.3 107.1
December 101.6 104.8 106.4 107.0

118 |
Monthly Statistics Bulletin December 2015
Part III. EXPLANATORY NOTES
Based on the Law No. 03/L-074 on the Central Bank of the Republic of Kosovo, also specified in the
Regulation on Monetary - Financial Statistics and Financial Accounts Statistics and Regulation on
Balance of Payments and International Investments Position Statistics, CBK compiles and publishes
statistics and disseminates information related to statistical methodology. CBK is also producer of official
statistics based on the Law on Official Statistics of the Republic of Kosovo. Statistics that fall under the
scope of CBK responsibilities are monetary and financial statistics, and external sector statistics (balance
of payments statistics, international investments position, and external debt statistics). In addition, CBK
also publishes statistics from other sources such as real and fiscal sector statistics.
Statistics for which CBK is official producer and included in the Monthly Statistics Bulletin are compiled
and published based on international statistical standards of the IMF, ECB, Eurostat, namely: Monetary
and Financial Statistics Manual (IMF 2000), Monetary and Financial Statistics Compilation Guide (IMF
2008), Balance of Payments Manual (IMF 1993), Balance of Payments Compilation Guide (IMF 1995),
Balance of Payments and International Investment Position Manual (IMF 2009) Manual on Monetary
Financial Institutions Interest Rates (ECB 2003), System of National Accounts (SNA 2008), European
System of National and Regional Accounts (ESA 95), etc.
the detailed methodology related to compilation of monetary - financial statistics and balance of payments
statistics can be found in the CBK website (www.bqk-kos.org):
Monetary and Financial Statistics Methodology;
Balance of Payments Statistics Methodology.
This explanatory note is a brief description of methodology, contents, periodicity and the source of graphs
and tables presented in this publication. Explanatory notes contain also information on methodological
breaks and implications for the specific items in this bulletin.

| 119
Buletini Mujor Statistikor
December 2015 Monthly Statistics Bulletin
Part I: GRAPHS
Graph 1. Assets of financial corporations
Description: the financial corporations sector consists of all resident corporations and quasi-corporations
principally engaged in financial intermediation or in related auxiliary financial activities. Data presented
in this graph include CBK, other depository corporations (commercial banks), other financial corporations
(microfinance institutions, insurance companies, pension funds, and financial auxiliaries). Published data
are aggregated.
Periodicity: Quarterly
Source: table 3.1, 4.1, and 5.1
Graph 2. Net foreign assets of financial corporations
Description: Net foreign assets are comprised from claims on nonresidents less liabilities to nonresidents,
and are calculated by deducting the liabilities to nonresidents from claims on nonresidents. In this context
are included CBK net foreign assets, other depository corporations (commercial banks), other financial
corporations (microfinance institutions, insurance companies, pension funds, and financial auxiliaries).
Periodicity: Quarterly
Source: table 3.1, 4.1, and 5.1
Graph 3. Growth of net foreign assets of financial corporations
Description: Growth of financial corporations net foreign assets is calculated on annual basis on the level
of CBK, other depository corporations (commercial banks), other financial corporations (microfinance
institutions, insurance companies, pension funds, and financial auxiliaries). the growth of foreign assets of
other financial corporations is calculated by consolidating the value of assets of financial corporations and
by calculating the annual growth rate.
Periodicity: Quarterly
Source: table 3.1, 4.1, and 5.1
Graph 4. Sectoral breakdown of deposits at CBK
Description: Sectoral classification of deposits is based on international statistical standards. In Kosovo,
other depository corporations are comprised of commercial banks while other financial corporations
include insurance companies, pension funds, microfinance institutions, money transfer agencies and
exchange bureaus. Deposits of Privatization Agency of Kosovo are presented within the deposits of central
government according to the maturity.
Periodicity: Monthly
Source: table 10.2

120 |
Monthly Statistics Bulletin December 2015
Graph 5. Sectoral and currency breakdown of deposits at other depository corporations
Description: Other depository corporations consist of all resident financial corporations (except the central
bank) and quasi-corporations that are mainly engaged in financial intermediation and that issue liabilities
included in the national definition of broad money. In Kosovo, other depository corporations are
commercial banks. Government deposits include central government deposits (e.g. ministries, etc.) and
local government (e.g. municipalities). Other financial corporations include all financial institutions except
the central bank and other depository corporations which are reported separately. Public nonfinancial
corporations include public corporations (e.g. PTK, KEK, etc.), whereas other financial corporations
comprise private nonfinancial companies. Household category comprises all households holding bank
accounts, whereas nonresidents include all nonresidents holding bank account in Kosovo. the share of euro
deposits to total deposits is calculated by dividing deposits in euro currency with total deposits. For more
regarding the sectorial breakdown and residency criteria, see Monetary and Financial Statistics
Methodology.
Periodicity: Monthly
Source: table 12.1 and 12.5
Graph 6. Maturity breakdown of deposits at other depository corporations
Description: Other depository corporations consist of all resident financial corporations (except the central
bank) and quasi-corporations that are mainly engaged in financial intermediation and that issue liabilities
included in the national definition of broad money. In Kosovo, other depository corporations are
commercial banks. Classification of deposits by maturity was made based on criteria of original maturity
(e.g. if in May 2012 there is a deposit of one year maturity, this deposit is reported under the item “up to
one year” until the end of maturity). Since 2010 new breakdown of deposits is applied, namely transferable
deposits, other deposits (time deposits), and saving deposits. Nevertheless, up to 2009, saving deposits
were included within time deposits.
Periodicity: Monthly
Source: table 12.1 and 12.5
Graph 7. Sectoral breakdown of other depository corporations loans
Description: Other depository corporations consists of all resident financial corporations (except the
central bank) and quasi-corporations that are mainly engaged in financial intermediation and that issue
liabilities included in the national definition of broad money. In Kosovo, other depository corporations are
commercial banks. Classification of loans by sector is based on the purpose of loans granted. If the loan
was issued to a company, then the loan is classified as a loan to nonfinancial corporation (public or
private).
Periodicity: Monthly
Source: table 13.1
Graph 8. Sectoral breakdown of other depository corporations new loans
Description: the other depository corporations consists of all resident financial corporations (except the
central bank) and quasi-corporations that are mainly engaged in financial intermediation and that issue
liabilities included in the national definition of broad money. In Kosovo, other depository corporations are
commercial banks. New loans include loans extended only within the referring period and as such are

| 121
Buletini Mujor Statistikor
December 2015 Monthly Statistics Bulletin
classified as flow data (e.g. loans of May 2012 represent only loans issued during that month, not including
loans issued during previous periods, as is the case with outstanding loans).
Periodicity: Monthly
Source: table 13.2
Graph 9. Economic sectors breakdown of other depository corporations loans
Description: the other depository corporations consists of all resident financial corporations (except the
central bank) and quasi-corporations that are mainly engaged in financial intermediation and that issue
liabilities included in the national definition of broad money. In Kosovo, other depository corporations are
commercial banks. the classification of loans by economic sectors was based on NACE classification, which
represents the classification of loans by purpose.1
Periodicity: Monthly
Source: table 13.3
Graph 10. Maturity breakdown of other depository corporations loans
Description: the other depository corporations consists of all resident financial corporations (except the
central bank) and quasi-corporations that are mainly engaged in financial intermediation and that issue
liabilities included in the national definition of broad money. In Kosovo, other depository corporations are
commercial banks. Classification of loans by maturity is based on the original criteria (e.g. if in May 2012
were issued loans of one year maturity, these loans are reported under the item “Up to one year” until the
end of maturity). Starting from 2010 there is a detailed breakdown of loans by maturity. Maturity “above 2
years and up to 5 years” prior to 2010 includes deposits with the original maturity of “above 2 years”.
Description: Monthly
Source: table 13.1
Graph 11. Growth of loans and deposits at other depository corporations
Description: the other depository corporations consists of all resident financial corporations (except the
central bank) and quasi-corporations that are mainly engaged in financial intermediation and that issue
liabilities included in the national definition of broad money. In Kosovo, other depository corporations are
commercial banks. Growth of loans and deposits is performed on annual basis through annual growth
formula. the ratio of loans to deposits includes all loans divided by deposits, excluding interbank deposits
and loans.
Periodicity: Monthly
Source: table 11.1 and 11.2
Graph 12. Interest rates on loans and deposits at other depository corporations
Description: the other depository corporations consists of all resident financial corporations (except the
central bank) and quasi-corporations that are mainly engaged in financial intermediation and that issue
liabilities included in the national definition of broad money. In Kosovo, other depository corporations are
1
For details on NACE classification visit http://epp.eurostat.ec.europa.eu/cache/ITY_OFFPUB/KS-RA-07-015/EN/KS-RA-07-015-EN.PDF
122 |
Monthly Statistics Bulletin December 2015
commercial banks. Interest rate on deposits and loans are calculated by using the effective interest rate
formula based on arithmetic weighted average. the calculation formula of effective interest rate is as
follows:
𝐴𝐴𝑅 = (1 + 𝐴𝐺
𝑛)
𝑛
− 1
where 𝐴𝐴𝑅 stands for annualized agreed rate, 𝐴𝐺 is the nominal agreed rate among the parties, and 𝑛 is
the number of capitalization periods per year, i.e. 𝑛 = 1 for yearly interest payment (12/12), 𝑛 = 2 for
semi-annual interest payment (12/6) , 𝑛 = 4 for quarterly interest payments (12/3) , and 𝑛 = 12 for
monthly interest payments (12/1). Since 2010, there is a detailed breakdown of the banks products in
terms of sectors and maturity. Furthermore, since 2010, loans with special conditions are not included in
the calculation of the weighted average interest rate.
these are flow data that include new contracts during the respective month. For detailed description on
interest rate calculation refer to the Monetary and Financial Statistics Methodology.
Periodicity: Monthly
Source: table 14.1 and 14.2
Graph 13. Other depository corporations income and expenditures
Description: the other depository corporations consists of all resident financial corporations (except the
central bank) and quasi-corporations that are mainly engaged in financial intermediation and that issue
liabilities included in the national definition of broad money. In Kosovo, other depository corporations are
commercial banks. Revenues category include all incomes from the banking activity, as interest income,
non-interest income, etc., whereas within expenditures are included interest expenditures, non-interest
expenditures, administrative expenditures (including expenditures of the bank staff). the data are
aggregated on the level of other depository corporations. the data are cumulative within the calendar year
(e.g. the data of January 2012 include the data only for January 2012, whereas the data as of May 2012
include the data from January 2012 up to May 2012).
Periodicity: Monthly
Source: table 15.1
Graph 14. Growth of income at other depository corporations income and contribution to the growth
Description: Other depository corporations consist of all resident financial corporations (except the central
bank) and quasi-corporations that are mainly engaged in financial intermediation and that issue liabilities
included in the national definition of broad money. In Kosovo, other depository corporations are
commercial banks. the income growth is calculated by using cumulative amounts within the calendar year,
through the growth formula. In order to identify the contribution of each component, the contribution
formula is used (percentage point):
𝑃𝑒𝑟𝑐𝑒𝑛𝑡𝑎𝑔𝑒 𝑝𝑜𝑖𝑛𝑡 = (𝑔0 − 𝑔−1)
𝑧−1
∗ 100

| 123
Buletini Mujor Statistikor
December 2015 Monthly Statistics Bulletin
where the variable g is part of the variable z.
Periodicity: Monthly
Source: table 15.1
Graph 15. Growth of expenditures at other depository corporations expenditures and contributions to
the growth
Description: Other depository corporations consists of all resident financial corporations (except the
central bank) and quasi-corporations that are mainly engaged in financial intermediation and that issue
liabilities included in the national definition of broad money. In Kosovo, other depository corporations are
commercial banks. the expenditure growth is calculated by using cumulative amounts within the calendar
year, through growth formula. In order to identify the contribution of each component, the contribution
formula is used (percentage point):
𝑃𝑒𝑟𝑐𝑒𝑛𝑡𝑎𝑔𝑒 𝑝𝑜𝑖𝑛𝑡 = (𝑔0 − 𝑔−1)
𝑧−1
∗ 100
where the variable g is part of the variable z.
Periodicity: Monthly
Source: table 15.1
Graph 16. Interest rates on loans of other financial intermediaries
Description: Other financial intermediaries consist of resident financial corporations engaged in financial
intermediation expect depository corporations, insurance companies, pension funds, money transfer
agencies and exchange bureaus. In Kosovo other financial intermediaries are microfinance institutions
whose main activity is loan granting. Other financial intermediaries (microfinance institutions) along with
other depository corporations (commercial banks) are licensed institutions for loan granting. Interest rates
are calculated and published based on effective annual rate. Sectors are broken down into nonfinancial
corporations and households, consistent with the international standards. Formula used for calculation of
effective annual rate is shown below:
𝑬𝒇𝒇 =(𝟏 +
𝑨𝑮
𝒏)
𝒏
− 𝟏
𝒇𝒆𝒆 ; 𝒇𝒆𝒆 = 𝟏 − 𝒅𝒊𝒔𝒂𝒈𝒊𝒐
where 𝐸𝑓𝑓 stands for annualized agreed rate, 𝐴𝐺 is the nominal agreed rate among the parties, and 𝑛 is
the number of capitalization periods per year, i.e. 𝑛 = 1 for yearly interest payment (12/12), 𝑛 = 2 for
semi-annual interest payment (12/6) , 𝑛 = 4 for quarterly interest payments (12/3) , and 𝑛 = 12 for
monthly interest payments (12/1). The interest rate reporting to CBK will not include any fee, tax nor any
other cost related to the third parties, like taxes to state, which bank pays for the client. However, costs
manifested as a disagio in case of a loan must be considered as an interest payment. Disagio, defined as
the difference between the nominal amount of the loan and the amount received by customer, shall be
considered as an interest payment at the start of the contract (time 𝑡0) and shall be reflected in the
annualized agreed rate. the disagio is related directly with the loan processing and it is an interest cost for

124 |
Monthly Statistics Bulletin December 2015
specific loan agreement or new contract. Interest rates on loans are flow statistics that includes only new
contracts during the month.
Periodicity: Monthly
Source: table 18.1
Graph 17. Sectoral breakdown of other financial intermediaries new loans
Description: Other financial intermediaries consists of all resident financial corporations except depository
corporations, insurance companies, pension funds, money transfer agencies and exchange bureaus. In
Kosovo, other financial intermediaries are microfinance institutions whose main activity is loan granting.
New loans include loans extended only within the referring period and as such are classified as flow data
(e.g. loans of May 2012 represent only loans issued during that month, not including loans issued during
previous periods, as is the case with outstanding loans).
Periodicity: Monthly
Source: table 17.3
Graph 18. Maturity breakdown of other financial intermediaries loans
Description: Other financial intermediaries consists of all resident financial corporations except depository
corporations, insurance companies, pension funds, money transfer agencies and exchange bureaus. In
Kosovo, other financial intermediaries are microfinance institutions whose main activity is loan granting.
Other financial intermediaries loans by maturity are presented as outstanding amounts. This means that
amounts shown represents active loans i.e. other financial intermediaries claims on respective
institutional and economic sectors. Classification in time buckets is based on international statistical
standards.
Periodicity: Monthly
Source: table 17.1
Graph 19. Sectoral breakdown of other depository corporations loans
Description: Other financial intermediaries consists of all resident financial corporations except depository
corporations, insurance companies, pension funds, money transfer agencies and exchange bureaus. In
Kosovo, other financial intermediaries are microfinance institutions whose main activity is loan granting.
Other financial intermediaries loans by sectoral breakdown are presented as outstanding amounts. This
means that amounts shown represents active loans i.e. other financial intermediaries claims on respective
institutional sectors. Classification of loans by sector is based on the purpose of loans granted while
sectorization is based on international statistical standards of IMF, etc.
Periodicity: Monthly
Source: table 17.1
Graph 20. Economic sectors breakdown of other financial intermediaries loans
Description: Other financial intermediaries consists of all resident financial corporations except depository
corporations, insurance companies, pension funds, money transfer agencies and exchange bureaus. In
Kosovo, other financial intermediaries are microfinance institutions whose main activity is loan granting.
Other financial intermediaries loans by economic sectors are presented as outstanding amounts. this

| 125
Buletini Mujor Statistikor
December 2015 Monthly Statistics Bulletin
means that amounts shown represents active loans i.e. other financial intermediaries claims on respective
institutional sectors. the classification of loans by economic sectors was based on NACE classification,
which represents the classification of loans by purpose.2
Periodicity: Monthly
Source: table 17.2
Graph 21. International transfers through money transfer agencies
Description: Based on international statistical standards, money transfer agencies are treated as financial
auxiliaries, whose primary role is to support financial intermediation. In Kosovo, financial auxiliaries are
money transfer agencies and exchange bureaus. International transfers shown in the graph represent
those transfers carried out through money transfer agencies on behalf of their clients. the data are
cumulative within the calendar year (e.g. the data of January 2012 include the data only for January 2012,
whereas the data as of May 2012 include the data from January 2012 up to May 2012).
Periodicity: Monthly
Source: table 22.1
Graph 22. Kosovo budget
Description: General government exercises legislative, judicial, or executive authority over other
institutional units within a specified area and is comprised from the central government, federal
government, local government and social security funds. In case of Kosovo, there are two levels, central
government and local government. Budget statistics include budget revenues and expenditures. The data
are presented as flow statistics. CBK is not official producer of government statistics.
Periodicity: Monthly
Source: table 26.1 and 26.2
Graph 23. Prices
Description: Statistics on prices are represented based on the annual change. Annual difference is based
on the annual growth formula, using consumer price index. CBK is not official producer of price statistics.
the formula for calculating the annual change and the annual average is shown below:
𝐴𝑛𝑛𝑢𝑎𝑙 𝑐ℎ𝑎𝑛𝑔𝑒 = [(𝐶𝑃𝐼𝑌,𝑚
𝐶𝑃𝐼𝑌−1,𝑚) − 1] ∗ 100
where 𝐶𝑃𝐼𝑌,𝑚 represents Consumer Price Index for the current month (𝑚) of the current year (𝑌), whereas
𝐶𝑃𝐼𝑌−1,𝑚 represents prices index of the current month (𝑚) of the previous year (𝑌−1).
Periodicity: Monthly
Source: table 28.1
2
For details on NACE classification visit http://epp.eurostat.ec.europa.eu/cache/ITY_OFFPUB/KS-RA-07-015/EN/KS-RA-07-015-EN.PDF
126 |
Monthly Statistics Bulletin December 2015
Graph 24. Prices main categories
Description: Main categories of prices are based on the price index structure. The calculated percentages
were calculated using annual change. The classification in categories as food and beverages, alcoholic
drinks, etc., is based on the COICOP (Classification of Individual Consumption by Purpose).3
Periodicity: Monthly
The source of the data: table 28.1
Graph 25. Import and producer prices
Description: Prices of imports comprise the import prices of goods imported based on specific weights,
whereas, producer prices comprise prices of domestically produced goods, using specific weights.
Periodicity: tuarterly
Source: table 28.2
Graph 26. Exchange rate against euro
Description: the exchange rate is compiled based on monthly average exchange rate and includes Albanian
lek, Swiss franc, British pound, Croatian kuna, Macedonian denar, Serbian dinar, Turkish lira and
American dollar.
Periodicity: Monthly
Source: table 35.1
Graph 27. Real effective exchange rate
Description: Real Effective Exchange Rate (REER) is calculated by using Consumer Price Index (CPI) and
Harmonized Consumer Price Index (HICP). Prior to REER calculation, calculate Nominal Effective
Exchange Rate (NEER) is calculated. the formula for calculating NEER is as follows:
NEERt = 100 ∑Eit
Ei0
wi
n
i=1
where 𝑖 represents the individual country currencies, Eit represents the nominal exchange rate of euro
currency against other currencies on monthly basis (t) defined as the number of currency units of the
country (i) for one unit of the domestic currency. Ei0 represents nominal exchange rate of euro currency
against currencies of respective country in the base period, and wi is the weight of the domestic
currency (𝑖).
REER is calculated based on the formula below:
REERt = ∑wiPdt
Pft
NEER𝑡
n
i=1
3
For details on COICOP visit http://unstats.un.org/unsd/cr/registry/regcst.asp?Cl=5

| 127
Buletini Mujor Statistikor
December 2015 Monthly Statistics Bulletin
where Pft represents the index for foreign prices on monthly basis (t) for each countries separately
comparing with the base period, whereas Pdt represents CPI of Kosovo on monthly basis (t) comparing with
the base period.
Periodicity: Quarterly
Source: 35.2
Graph 28. Trade balance
Description: trade balance covers regular imports and exports of goods with all countries. Trade balance is
calculated by deducting imports from export of goods. Data on imports and exports are cumulative within
the calendar year (e.g. the data for January 2012 include the data for January 2012 only, whereas the data
as of May 2012 include the data from January 2012 to June 2012).
Periodicity: Monthly
Source: table 34.1 and 34.5
Graph 29. Export of goods
Description: Exports to EU include all EU countries. CEFTA include countries as Bosnia and Herzegovina,
Croatia, Montenegro, Macedonia, Serbia and Albania. the category of other European countries includes
countries as Switzerland, Russia, Ukraine, Turkey, etc. Whereas, the category of non-European countries
include all the countries which are not in European Continent as USA, China, Japan, India, Egypt, etc.
Periodicity: Monthly
Source: table 34.1
Graph 30. Import of goods
Description: Imports from EU include all EU countries. CEFTA includes countries as Bosnia and
Herzegovina, Croatia, Montenegro, Macedonia, Serbia and Albania. the category of other European
countries includes countries as Switzerland, Russia, Ukraine, Turkey, etc. Whereas, the category of Non-
European countries include all the countries which are not in European Continent as USA, China, Japan,
India, Egypt, etc.
Periodicity: Monthly
Source: table 34.5
Graph 31. Balance of payments of Kosovo
Description: Balance of payments represents key economic information that systematically summarizes
the economic transactions of residents of Kosovo with the outside world (nonresidents) for a specified
period of time. In graph are presented main balance of payments categories, such as: current account,
capital account, financial account, and errors and omissions. Until 2008 data are presented on annual
basis, and since 2009 on a quarterly basis, and are flow data on net basis.
Periodicity: Quarterly
Source: table 29.1

128 |
Monthly Statistics Bulletin December 2015
Graph 32. Current account
Description: the current account is one of the main categories of the balance of payments of Kosovo. The
current account represents the difference between the net exports of goods, services, income inflows and
incoming transfers on the one hand, compared with imports of goods, services, income inflows and
outgoing transfers, on the other hand. Calculation of the current account does not include financial
transactions. In the graph is shown the impact of the categories such as of goods, services, income and
transfers account of Kosovo. Until 2008 data are presented on annual basis, and since 2009 on a quarterly
basis, and are flow data on net basis.
Periodicity: tuarterly
Source: table 29.2
Graph 33. Financial account
Description: the financial account shows Qhe assets and liabilities of Kosovo's economy to nonresidents for
a certain period of time. In graph are presented main categories of financial account that are: direct
investments, portfolio investments, other investments (other than portfolio), and reserve assets. Until
2008 data are presented on annual basis, and since 2009 on a quarterly basis, and are flow data on net
basis.
Periodicity: Quarterly
Source: table 29.9
Graph 34. International investments position
Description: International investments position represents the balance sheet of assets and liabilities of
Kosovo residents with nonresidents at the end of a certain period. Graph shows the relationship between
the assets (Kosovo investments abroad) and liabilities (nonresident investments in Kosovo) and are
presented as outstanding amounts. Until 2011 data are presented on annual basis, and since 2012 on a
quarterly basis, on net basis.
Periodicity: Quarterly
Source: table 30.3
Graph 35. International investments position by sectors
Description: International investments position represents the balance sheet of assets and liabilities of
Kosovo residents with nonresidents at the end of a certain period. Graph shows the relationship between
the assets (Kosovo investments abroad) and liabilities (nonresident investments in Kosovo) by sectors such
as: central government, central bank, commercial banks, and other sectors (including the private sector).
Sectoral classification is based on international statistical standards. Until 2011 data are presented on
annual basis, and since 2012 on a quarterly basis, on net basis.
Periodicity: tuarterly
Source: table 31.2
| 129
Buletini Mujor Statistikor
December 2015 Monthly Statistics Bulletin
Graph 36. Direct investments by main investing countries
Description: Foreign direct investment statistics presented in this graph shows the relationship between
nonresident investments in Kosovo versus Kosovo residents to investment abroad. Graph shows the
geographical distribution of foreign direct investments in Kosovo and vice versa by main investing
countries. Moreover, in the graph are not shown all the countries that have invested in Kosovo, but only
the larger ones, due to the technical aspects of the presentation. the data are presented as outstanding on
net basis.
Periodicity: Quarterly
Source: table 31.1
Graph 37. Reserve assets
Description: Reserve assets are comprised of international assets classified according to international
statistical standards. Data are presented as outstanding amounts.
Periodicity: Quarterly
Source: table 30.4
Graph 38. Gross external debt
Description: Kosovo's external debt represents liabilities of Kosovo residents to nonresidents in a given
period of time. Gross external debt is divided into public and private external debt. Private sector debt
includes private debt that in the case of Kosovo has the largest share to total external debt of Kosovo.
Until 2011 data are presented on an annual basis, and since 2012 on a quarterly basis. the data are
presented as outstanding amounts on gross basis.
Periodicity: Quarterly
Source: table 32.1
Graph 39. Gross external debt by creditors
Description: Kosovo's external debt represents liability of Kosovo residents to nonresidents in a given
period of time. External debt is classified according to Kosovo creditors. the data are presented as
outstanding amounts on gross basis.
Periodicity: Quarterly
Source: Table 32.2
PART II: TABLES 4
table 1. Financial corporations survey
4
Explanatory notes refer to group of tables which have been presented separately in the Monthly Statistics Bulletin (e.g. explanatory notes will be presented on the level of financial corporations
survey including table 1.1. Net Foreign Assets and Domestic Claims, and table 1.2. Liabilities).

130 |
Monthly Statistics Bulletin December 2015
Description: Financial corporations sector consists of all resident corporations and quasi-corporations
engaged in financial intermediation or in related financial activities and are comprised from depository
corporations and other financial corporations. Financial corporations survey represents the consolidated
financial position of the financial corporations with the external sector, fiscal sector and real sector and is
compiled from depository corporations survey (CBK and commercial banks) and other financial
corporations survey (insurance companies, pension funds, microfinance institutions, and assets managers).
In terms of presentation, the survey differs from the balance sheet because in the balance sheet the
priority is given to the instrument, whereas surveys are presented based on the sectoral approach.
Periodicity: Quarterly
Source: CBK, other depository corporations, other financial corporations.
table 2. Depository corporations survey
Description: Depository corporations comprise the central bank and other depository corporations
(commercial banks). Depository corporations survey represents the consolidated financial position of
depository corporations with other financial corporations, external sector, fiscal sector and real sector and
is compiled from CBK and other depository corporations survey. At this level, the consolidation is
performed among CBK and other depository corporations. In terms of presentation, the survey differs from
the balance sheet because in the balance sheet the priority is given to the instrument, whereas the surveys
are presented based on the sectoral approach. the concept on broad money includes only deposits which
are part of broad money excluding currency in circulation. Broad money comprises deposits of other
financial corporations (insurance companies, pension funds, etc.), deposits of nonfinancial corporations,
households, and NPISH. this definition is consistent with European Central Bank definition.
Periodicity: Monthly
Source: CBK, other depository corporations.
table 3. CBK survey
Description: CBK survey is compiled from CBK balance sheet and includes the CBK financial position
with other depository corporations, other financial corporations, external sector, fiscal and real sector. In
terms of presentation, the survey differs from the balance sheet because in the balance sheet the priority is
given to the instrument, whereas surveys are presented based on the sectoral approach.
Periodicity: Monthly
Source: CBK

| 131
Buletini Mujor Statistikor
December 2015 Monthly Statistics Bulletin
table 4. Other depository corporations survey
Description: Other depository corporations consist of all resident financial corporations (except the central
bank) and quasi-corporations that are mainly engaged in financial intermediation and that issue liabilities
included in the national definition of broad money. In Kosovo, other depository corporations are
commercial banks. Other depository corporations survey represents the consolidated financial position of
other depository corporations with CBK, other financial corporations, external sector, fiscal sector and real
sector. Other depository corporation survey is compiled from the other depository corporations balance
sheet. In terms of presentation, the survey differs from the balance sheet because in the balance sheet the
priority is given to the instrument, whereas surveys are presented based on the sectoral approach. there
are some methodological changes within the liabilities of other depository corporations being presented
within the explanatory notes of table 12.
Periodicity: Monthly
Source: Commercial banks.
table 5. Other financial corporations survey
Description: Other financial corporations survey is compiled based on the balance sheet information from
insurance corporations, pension funds, microfinance institutions, and assets managers. Other financial
corporations survey represents the consolidated financial position of other financial corporations with
depository corporations (central bank and commercial banks), external sector, fiscal and real sector. Other
financial corporations survey is calculated based on insurance companies survey, pension funds survey,
microfinance institutions, and assets managers. In terms of presentation, the survey differs from the
balance sheet because in the balance sheet the priority is given to the instrument, whereas surveys are
presented based on the sectoral approach. Up to end-2011, some of the other financial corporations
statistics are compiled on quarterly basis, while starting from January 2012 on monthly basis. this
consists with the implementation of the statistical projects, namely, Statistical Report on Microfinance
Institutions, Interest Rates Report on Microfinance Institutions, and Statistical Report on Money transfer
Agencies.
Periodicity: Quarterly
Source: Other financial intermediaries, insurance companies, pension funds, financial auxiliaries.
table 6. Other financial intermediaries survey
Description: Other financial intermediaries survey is compiled based on the balance sheet information
from microfinance institutions. Other financial intermediaries survey represents the consolidated financial
position of other financial intermediaries with depository corporations (central bank and commercial
banks), insurance companies, pension funds, financial auxiliaries, external sector, fiscal and real sector. In
terms of presentation, the survey differs from the balance sheet because in the balance sheet the priority is
given to the instrument, whereas surveys are presented based on the sectoral approach. Up to end-2011,
other financial intermediaries statistics are compiled on quarterly basis, while starting from January 2012
on monthly basis. this consists with the implementation of the statistical projects, namely, Statistical
Report on Microfinance Institutions, and Interest Rates Report on Microfinance Institutions.
Periodicity: Quarterly
Source: Microfinance institutions.
table 7. Insurance companies survey
132 |
Monthly Statistics Bulletin December 2015
Description: Insurance companies survey is compiled based on the balance sheet information from
insurance companies. Insurance companies survey represents the consolidated financial position of
insurance companies with depository corporations (central bank and commercial banks), other financial
intermediaries, pension funds, financial auxiliaries, external sector, fiscal and real sector. In terms of
presentation, the survey differs from the balance sheet because in the balance sheet the priority is given to
the instrument, whereas surveys are presented based on the sectoral approach.
Periodicity: Quarterly
Source: Insurance companies.
table 8. Pension funds survey
Description: Pension funds survey is compiled based on the balance sheet information from pension funds.
Pension funds survey represents the consolidated financial position of pension funds with depository
corporations (central bank and commercial banks), other financial intermediaries, insurance companies,
financial auxiliaries, external sector, fiscal and real sector. In terms of presentation, the survey differs
from the balance sheet because in the balance sheet the priority is given to the instrument, whereas
surveys are presented based on the sectoral approach.
Periodicity: Quarterly
Source: Pension funds.
table 9. Financial auxiliaries survey
Description: Financial auxiliaries survey is compiled based on the balance sheet information from money
transfer agencies. Financial auxiliaries survey represents the consolidated financial position of money
transfer agencies with depository corporations (central bank and commercial banks), other financial
intermediaries, insurance companies, pension funds, external sector, fiscal and real sector. In terms of
presentation, the survey differs from the balance sheet because in the balance sheet the priority is given to
the instrument, whereas surveys are presented based on the sectoral approach. Up to end-2011, financial
auxiliaries statistics are compiled on quarterly basis, while starting from January 2012 on monthly basis.
this consists with the implementation of the statistical project called Statistical Report on Money transfer
Agencies.
Periodicity: Quarterly
Source: Money transfer agencies.
table 10. CBK balance sheet
Description: CBK balance sheet represents the financial position of CBK. Within other financial
corporations being presented on CBK liabilities side are included deposits of insurance companies and
pension funds. Government deposits include also deposits of Privatization Agency of Kosovo, being
presented separately. Within the government deposits at CBK, is included also IMF quota subscription.
Periodicity: Monthly
Source: CBK

| 133
Buletini Mujor Statistikor
December 2015 Monthly Statistics Bulletin
table 11. Other depository corporations balance sheet
Description: Other depository corporations consists of all resident financial corporations (except the
central bank) and quasi-corporations that are mainly engaged in financial intermediation whose liabilities
are included in the definition of broad money. In Kosovo, other depository corporations are commercial
banks. the balance sheet of other depository corporations represents the aggregated statement of this sub-
sector. Since June 2004 there is a methodological change in the balance sheet of other depository
corporations. this consists with the implementation of statistical project, namely, Statistical Bank Report
and Interest Rate Report. For more regarding the statistical projects are stated above, please follow links:
Statistical Bank Report;
Interest Rate Report.
For detailed description on methodological changes, refer to explanation notes given in table 12. Other
depository corporations deposits.
Periodicity: Monthly
Source: Commercial banks.
table 12. Other depository corporations deposits
Description: Other depository corporations consists of all resident financial corporations (except the
central bank) and quasi-corporations that are mainly engaged in financial intermediation whose liabilities
are included in the definition of broad money. In Kosovo, other depository corporations are commercial
banks. Deposits at other depository corporations are classified by sectors, sub-sectors and currencies.
Until May 2004, the structure of deposits was composed only from households and legal entities. Within
deposits of legal entities are included deposits of all institutions except commercial banks and households.
Moreover, within households deposits, until May 2004, were included also the deposits of NPISH. Since
June 2004 until December 2007, deposits of insurance companies include also deposits of pension funds.
Maturity breakdown deposits was made based on the criteria of original maturity (e.g. if in January 2009
there is a deposit of one year maturity, then this maturity is reported under the item “up to one year” until
the end of maturity). Since 2010, saving deposits are reported as separated, previously included in the
item ”other deposits” by maturities. Also, there is a detailed breakdown in terms of deposits by maturity.
Item “above 2 years and up to 5 years” up to 2009 includes all deposits with the maturity of “above 2
years”.
Periodicity: Monthly
the source data: Commercial banks.
table 13. Other depository corporations loans
Description: Other depository corporations consists of all resident financial corporations (except the
central bank) and quasi-corporations that are mainly engaged in financial intermediation and that issue
liabilities included in the national definition of broad money. In Kosovo, other depository corporations are
commercial banks. Other depository corporations loans are represented as (1) outstanding amounts and as
(2) new loans extended during the month.
Outstanding loans include commercial banks claims towards the respective sectors, such as public
nonfinancial corporations, other nonfinancial corporations, households, classified by maturities. In this

134 |
Monthly Statistics Bulletin December 2015
context is not included interbank activity. Besides sectors and sub-sectors institutional classification, loans
are classified also by purpose. this breakdown is based on NACE classification.5 table on loans by maturity
includes loans in euro and non- euro currency, while table on loans by industry includes loans to resident
sector, excluding households and NPISH.
New loans include new loans extended only during a certain period and as such they are flow data (e.g.
loans of May 2012 represent only loans issued during that month, not including loans issued prior to that
period, as is the case with outstanding loans).
Periodicity: Monthly
Source of the data: Commercial banks.
table 14. Other depository corporations interest rates
Description: Other depository corporations consists of all resident financial corporations (except the
central bank) and quasi-corporations that are mainly engaged in financial intermediation whose liabilities
are included in the definition of broad money. In Kosovo, other depository corporations are commercial
banks. Interest rates are compiled based on annual agreed rate. Sectors are classified as nonfinancial
corporations and households, complying with international statistical standards.
Since January 2008, there is a methodological change, where interest rates on loans include also
administrative fees applied by commercial banks for loans extended, paid by borrowers. Furthermore,
since January 2008 statistics on overdrafts are presented as outstanding and as such are not included in
calculation of weighted average. Since 2010, calculation of weighted interest rate excludes loans with
favorable conditions. Also since this period new breakdown of loans by purpose is applied, consistent with
the NACE nomenclature.
While calculating and publishing interest rates statistics, is used the arithmetic weighted average and
criteria such as standard deviation and minimum observations. Annual agreed rate is calculated as
follows:
𝑨𝑨𝑹 = (𝟏 + 𝑨𝑮
𝒏)
𝒏
− 𝟏
where 𝐴𝐴𝑅 stands for annualized agreed rate, 𝐴𝐺 is the contracted nominal rate agreed among the parties,
and 𝑛 is the number of capitalization periods per year, i.e. 𝑛 = 1 for yearly interest payments (12/12),
𝑛 = 2 for semi-annual interest payments (12/6), 𝑛 = 4 for quarterly interest payments (12/3), and 𝑛 = 12
for monthly interest payments (12/1).
these are flow data, representing new contracts during the month. For detailed description on interest rate
calculation refer to the Interest Rates Report.
Periodicity: Monthly
Source: Commercial banks.
5
For details on NACE classification visit http://epp.eurostat.ec.europa.eu/cache/ITY_OFFPUB/KS-RA-07-015/EN/KS-RA-07-015-EN.PDF
| 135
Buletini Mujor Statistikor
December 2015 Monthly Statistics Bulletin
table 15. Other depository corporations income statement
Description: Other depository corporations consists of all resident financial corporations (except the
central bank) and quasi-corporations that are mainly engaged in financial intermediation and whose
liabilities are included in the definition of broad money. In Kosovo, other depository corporations are
commercial banks. Other depository corporations income statement represents aggregated position of
banks income and expenditures. Income structure is broken down into interest income and non-interest
income. the same criterion is used in expenditure classification. Income statement data are flow data,
being presented as cumulative within the calendar year, (e.g. the data of January 2012 include the data
only for January 2012, whereas the data as of May 2012 include the data from January 2012 up to May
2012).
Periodicity: Monthly
Source: Commercial banks.
table 16. Other financial intermediaries balance sheet
Description: Other financial intermediaries consists of all resident financial corporations except depository
corporations, insurance companies, pension funds, money transfer agencies and exchange bureaus. In
Kosovo, other financial intermediaries are microfinance institutions whose main activity is loan granting.
Balance sheet of other financial intermediaries is presented as aggregated. Since June 2004 and up to
December 2011 statistics on other financial intermediaries are published on quarterly basis, while starting
from January 2012 on monthly basis. this consists with the implementation of the statistical project
named Statistical Report on Microfinance Institutions.
Periodicity: Monthly
Source: Microfinance institutions.
table 17. Other financial intermediaries loans
Description: Other financial intermediaries consists of all resident financial corporations except depository
corporations, insurance companies, pension funds, money transfer agencies and exchange bureaus. In
Kosovo, other financial intermediaries are microfinance institutions whose main activity is loan granting.
Other financial intermediaries loans are represented as (1) outstanding amounts and as (2) new loans
extended during the month.
Outstanding loans include other financial intermediaries claims towards the respective sectors, such as
public nonfinancial corporations, other nonfinancial corporations, households, classified by maturities.
New loans include new loans extended only during a certain period and as such they are flow data (e.g.
loans of May 2012 represent only loans issued during that month, not including loans issued prior to that
period, as is the case with outstanding loans). Besides sectors and sub-sectors institutional classification,
loans are classified also by purpose. this breakdown is based on NACE classification.6
Periodicity: Monthly
Source: Microfinance institutions.
table 18. Other financial intermediaries effective interest rates
6
For details on NACE classification visit http://epp.eurostat.ec.europa.eu/cache/ITY_OFFPUB/KS-RA-07-015/EN/KS-RA-07-015-EN.PDF

136 |
Monthly Statistics Bulletin December 2015
Description: Other financial intermediaries consist of resident financial corporations engaged in financial
intermediation expect depository corporations, insurance companies, pension funds, money transfer
agencies and exchange bureaus. In Kosovo other financial intermediaries are microfinance institutions
whose main activity is loan granting. Other financial intermediaries (microfinance institutions) along with
other depository corporations (commercial banks) are licensed institutions for loan granting.
Interest rates are calculated and published based on effective annual rate. Sectors are broken down into
nonfinancial corporations and households, consistent with the international standards. Formula used for
calculation of effective annual rate is shown below:
𝑬𝒇𝒇 =(𝟏 +
𝑨𝑮
𝒏)
𝒏
− 𝟏
𝒇𝒆𝒆 ; 𝒇𝒆𝒆 = 𝟏 − 𝒅𝒊𝒔𝒂𝒈𝒊𝒐
where 𝐸𝑓𝑓 stands for annualized agreed rate, 𝐴𝐺 is the nominal agreed rate among the parties, and 𝑛 is
the number of capitalization periods per year, i.e. 𝑛 = 1 for yearly interest payment (12/12), 𝑛 = 2 for
semi-annual interest payment (12/6) , 𝑛 = 4 for quarterly interest payments (12/3) , and 𝑛 = 12 for
monthly interest payments (12/1). the interest rate reporting to CBK will not include any fee, tax nor any
other cost related to the third parties, like taxes to state, which bank pays for the client. However, costs
manifested as a disagio in case of a loan must be considered as an interest payment. Disagio, defined as
the difference between the nominal amount of the loan and the amount received by customer, shall be
considered as an interest payment at the start of the contract (time 𝑡0) and shall be reflected in the
annualized agreed rate. the disagio is related directly with the loan processing and it is an interest cost for
specific loan agreement or new contract. Interest rates on loans are flow statistics that includes only new
contracts during the month.
Periodicity: Monthly
Source: Microfinance institutions.
table 19. Other financial intermediaries income statement
Description: Other financial intermediaries consist of resident financial corporations engaged in financial
intermediation expect depository corporations, insurance companies, pension funds, money transfer
agencies and exchange bureaus. In Kosovo other financial intermediaries are microfinance institutions
whose main activity is loan granting. Other financial intermediaries income statement represents
aggregated position of income and expenditures. Income structure is broken down into interest income and
non-interest income. the same criterion is used in expenditure classification. Income statement data are
flow data, being presented as cumulative within the calendar year, (e.g. the data of January 2012 include
the data only for January 2012, whereas the data as of May 2012 include the data from January 2012 up
to May 2012).
Periodicity: Monthly
Source: Microfinance institutions.
table 20. Financial auxiliaries balance sheet
Description: Based on international statistical standards, money transfer agencies are treated as financial
auxiliaries, whose primary role is to support financial intermediation. In Kosovo, financial auxiliaries are
money transfer agencies. Balance sheet of financial auxiliaries is presented as aggregated. Up to
December 2011 statistics on financial auxiliaries are published on quarterly basis, while starting from

| 137
Buletini Mujor Statistikor
December 2015 Monthly Statistics Bulletin
January 2012 on monthly basis. this consists with the implementation of the statistical project named
Statistical Report on Money transfer Agencies.
Periodicity: Monthly
Source: Money transfer agencies.
table 21. Financial auxiliaries income statement
Description: Financial auxiliaries consist of resident financial corporations engaged in supporting financial
intermediation expect depository corporations, insurance companies, pension funds, and exchange
bureaus. In Kosovo, financial auxiliaries are money transfer agencies. Financial auxiliaries income
statement represents aggregated position of income and expenditures. Income structure is broken down
into interest income and non-interest income. the same criterion is used in expenditure classification.
Income statement data are flow data, being presented as cumulative within the calendar year, (e.g. the
data of January 2012 include the data only for January 2012, whereas the data as of May 2012 include the
data from January 2012 up to May 2012).
Periodicity: Monthly
Source: Money transfer agencies.
table 22. International transfers through financial auxiliaries
Description: International transfers include incoming and outgoing transfers carried out through money
transfer agencies. International transfers statistics are flow data, being presented as cumulative within
the calendar year, (e.g. the data of January 2012 include the data only for January 2012, whereas the data
as of May 2012 include the data from January 2012 up to May 2012). International transfers include only
transfers carried out on behalf of its clients.
Periodicity: Monthly
Source: Money transfer agencies.
table 23. Payments system
Description: Interbank payments include statistics referring to the value of overdrafts through Automatic
teller Machines (AtMs), Point of Sales (POSs), e-Banking, etc. Payments system statistics are presented as
cumulative within the calendar year, (e.g. the data of January 2012 include the data only for January
2012, whereas the data as of May 2012 include the data from January 2012 up to May 2012). However,
statistics on number of AtMs, POSs, bank accounts, and e-banking accounts are presented as outstanding
amounts.
Periodicity: Quarterly
Source: CBK.
table 24. Other depository corporations network and staff
Description: Other depository corporations consists of all resident financial corporations (except the
central bank) and quasi-corporations that are mainly engaged in financial intermediation and that issue
liabilities included in the national definition of broad money. In Kosovo, other depository corporations are
commercial banks. Data on other depository corporations (commercial banks) network are presented on
138 |
Monthly Statistics Bulletin December 2015
the level of Kosovo regions. Within the banking units are included head offices, branches, sub-branches,
and all other banking units. the data on banking network and its staff are outstanding.
Periodicity: Monthly
Source: Commercial banks.
table 25. Insurance corporations activity
Description: this subsector includes resident insurance corporations and quasi-corporations whose
principal function is to provide life and non-life insurance. In terms of insurance companies activity are
represented the income from domestic insurance of vehicles (third party liabilities), and other insurances
(property insurance, insurance against fire, and other misfortune insurances). In compliance to this
classification are presented the number of sold insurance policies and insurance companies’ expenditures.
Periodicity: Monthly
Source: CBK
table 26. Kosovo budget
Description: the table on Kosovo budget presents the actual revenues and expenditures. the income is
classified as border and domestic revenues further detailed according to the Ministry of Finance. Budget
expenditures are presented based on the purpose broken down by holders (government levels).
Periodicity: Monthly
Source: Ministry of Finance.
table 27. Gross domestic product
Description: the data on Gross Domestic Product (GDP) are presented according to the Kosovo Agency of
Statistics. Net export comprises export and import of goods (including transport and insurance
expenditures) and export and import of services. GDP statistics are presented on the basis of expenditures
and by economic sectors approach.
Periodicity: Annually
Source: Kosovo Agency of Statistics.
table 28. Prices
Description: Prices statistics are compiled based on COICOP (Classification of Individual Consumption by
Purpose) using specific weights by components and sub-components.7 Statistics on prices are retrieved
from respective regional offices as Ferizaj, Gjakova, Gjilan, Mitrovica, Peja, Prizren and Prishtina.
Statistics on prices are presented based on annual change, based on annual growth formula. the annual
change formula is as follows:
𝐴𝑛𝑛𝑢𝑎𝑙 𝑐ℎ𝑎𝑛𝑔𝑒 = [(𝐶𝑃𝐼𝑌,𝑚
𝐶𝑃𝐼𝑌−1,𝑚) − 1] ∗ 100
7
For details on COICOP visit http://unstats.un.org/unsd/cr/registry/regcst.asp?Cl=5

| 139
Buletini Mujor Statistikor
December 2015 Monthly Statistics Bulletin
where 𝐶𝑃𝐼𝑌,𝑚 represents Consumer Price Index for the current month (𝑚) of the current year (𝑌), whereas
𝐶𝑃𝐼𝑌−1,𝑚 represents prices index of the current month (𝑚) of the previous year (𝑌−1).
Periodicity: Monthly
Source: Kosovo Agency of Statistics.
table 29. Balance of payments
Description: Balance of payments statistics are flow data. Balance of payments statistics are compiled and
published in compliance with international standards, presenting credit and debit side on the level of each
component. Goods category also includes freight and insurance cost. Within current transfers, is included
also UNMIK budget which as an institution, for statistics purposes is treated as nonresident to Kosovo,
whereas its staff, is treated based on the residential criteria (one year period). this treatment is also valid
for EULEX. KFOR is part of balance of payments of Kosovo. For further details on UNMIK, EULEX,
KFOR refer to Balance of Payments Statistics Methodology.
One of the main components within the current account is remittances. Statistics on remittances are
presented by receiving channels and countries of origin. the classification of remittances by receiving
channels is broken down based on institutional channels (commercial banks and money transfer agencies)
and non-institutional channels (cash). these statistics are flow.
Periodicity: tuarterly
Source: CBK, other depository corporations, nonfinancial corporations, government institutions, etc.
table 30. International investments position
Description: International Investment Position Statistics (IIP) are presented as outstanding amounts,
which are compiled and published in international statistical standards. IIP represents the balance sheet
of external financial assets and liabilities of a particular country with other countries at the end of a
certain period. Balance at the end of the period is a result of all transactions and adjustments arising from
exchange rate movements or changes in market prices. IIP consists of (i) net investments in equity (share
capital investments abroad minus foreign investment in domestic companies) and (ii) a country's net
external debt (lending to nonresidents less borrowing from nonresidents). Over the years, Kosovo's
economy has consistently been net creditor to the other countries of the world. A net creditor means that
the net international assets are higher than international liabilities.
table of harmonization between the BOP and IIP represents a close link between IIP and BOP. Financial
account of the BOP represents transactions related to external financial assets and liabilities of Kosovo,
that affects the outstanding amounts on the external financial assets and liabilities presented in the IIP.
Financial transactions can occur because of the increase / decrease in assets / liabilities and profit / loss on
assets / liabilities (e.g. interest from investments or dividend distribution). IIP statistics since 2007 are
published on an annual basis and since 2012 on a quarterly basis.
Periodicity: Quarterly
Source: CBK, other depository corporations, nonfinancial corporations, government institution, etc.
table 31. Direct investments

140 |
Monthly Statistics Bulletin December 2015
Description: Foreign direct investments are composed of nonresidents investments in Kosovo and
investments of Kosovo residents abroad. these statistics are presented by sectors and countries. the
classification of foreign direct investments by economic categories is based on purpose and includes
investments from privatization process and new investments. these statistics are flow data. Foreign
investments include also intercompany loans between resident and nonresident companies.
Periodicity: Quarterly
Source: Other depository corporations, nonfinancial corporations, etc.
table 32. External debt
Description: Kosovo's external debt represents liabilities of Kosovo residents to nonresidents in a given
period of time. Gross external debt include public and private external debt, while net external debt shows
net external position of Kosovo, representing the difference between nonresidents investments in Kosovo
(liability) and investment of Kosovo residents abroad (assets). Private sector debt includes private debt
that in the case of Kosovo has the largest share to total external debt of Kosovo.
Periodicity: Quarterly
Source: table 25.1
table 33. Coordinated portfolio investments survey
Description: Coordinated portfolio investments survey represents investments in equity and debt
securities further divided into short and long term. Portfolio investments are classified also by country, on
gross basis.
Periodicity: Quarterly
Source: CBK, other depository corporations, nonfinancial corporations, etc.
Table 34. Trade balance
Description: Statistics on trade balance are presented by countries and main components. Countries are
grouped in European Union countries, CEFTA, other European countries and Non-European countries.
Exports are presented by destination country, whereas the import of goods was classified by the country
origin. Trade balance is also presented based on goods imported by chapters and by countries.
Periodicity: Monthly
Source: Kosovo Agency of Statistics.
Table 35. Exchange rate
Description: Exchange rate is compiled based on monthly average currencies against euro currency. The
currencies presented belong to countries which represent the main trade partners of Kosovo and other
regional countries. For information purposes, was included also US dollar against euro. Real Effective
Exchange Rate (REER) is calculated using Consumer Price Index (CPI) and Harmonized Consumer Price
Index (HCPI). Prior to calculating REER Nominal Effective Exchange Rate (NEER) is calculated. NEER
calculating formula is as follows:
| 141
Buletini Mujor Statistikor
December 2015 Monthly Statistics Bulletin
NEERt = 100 ∑Eit
Ei0
wi
n
i=1
where 𝑖 represents the individual country currencies, Eit represents the nominal exchange rate of euro
currency against other foreign currencies on monthly basis (t) defined as the number of currency units of
the country (i) for one unit of the domestic currency. Ei0 represents nominal exchange rate of euro currency
against currencies of respective country in the base period, and wi is the weight of the domestic
currency (𝑖).
After that REER is calculated based on the following formula:
REERt = ∑wiPdt
Pft
NEERt
n
i=1
where Pft represents the index for foreign prices on monthly basis (t) for each of the countries separately
comparing with the base period, whereas Pdt represents CPI of Kosovo on monthly basis (t) comparing with
the base period.
Periodicity: Monthly
Source: Kosovo Agency of Statistics, respective agencies for statistics of neighboring countries.

142 |
Monthly Statistics Bulletin December 2015

33 Garibaldi Street, 10000 Prishtina
Republic of Kosovo
Tel: +381 38 222 055; Fax: +381 38 243 763
Web:www.bqk-kos.org