builton service
TRANSCRIPT

BuiltService
on
2009 Annual Report

About DieboldDiebold, Incorporated is a global leader in providing integrated self-service delivery and
security systems and services. The company primarily serves the financial marketplace,
with emerging expertise in the commercial, government and retail markets. The company
is making significant progress with its growth and operational excellence initiatives,
and continues to advance in pursuit of these goals.
In addition, Diebold is committed to serving all of its stakeholders through transparency,
full disclosure and a dedication to the highest standards of corporate governance. For further
information on the strategies and initiatives discussed in this annual report, and for more
background on Diebold, please visit www.diebold.com.
Forward-Looking StatementS
Certain statements in this annual report, particularly the statements made by management and those that are not historical facts, are “forward-looking state-
ments” within the meaning of the Private Securities Litigation Reform Act of 1995. Forward-looking statements give current expectations or forecasts of future
events. They are not guarantees of future performance and are subject to risks and uncertainties, many of which are beyond the control of Diebold. Some of the
risks, uncertainties and other factors that could cause actual results to differ materially from those expressed in or implied by the forward-looking statements are
detailed in the company’s 2009 Annual Report on Form 10-K. A copy of that Form, which is on file with the Securities and Exchange Commission and is available
at www.diebold.com or upon request, is included in this report.
Built on Service reflects both the business strategy that will drive
Diebold’s growth and the solid, 150-year-old foundation upon which we continue to build.
Exceptional service and support have long been among Diebold’s fundamental
strengths. Now more than ever, we have the opportunity to shape our future by leveraging
our global leadership to deliver innovative integrated services solutions that will help
customers succeed.

To Our Fellow Shareholders
2009 marked the 150th anniversary of Diebold. During our long and proud
history, few years have been as challenging and eventful – and fewer still
have provided such fundamental opportunities to test the value we offer to
our customers around the world.
I am proud that we met – and passed – these
tests. We underscored the strength of our services-
driven business strategy and continued to prove
Diebold is indeed “built on service.” We successfully
balanced the need to invest in our growth businesses
with the need to remain competitive and reduce costs.
Our employees joined together and delivered on many
key initiatives, including:
❚ Expanding our Diebold Integrated Services®/
outsourcing business
❚ Capitalizing on the rapid adoption of deposit
automation technology, including solutions
that allow check imaging, cash handling, teller
recycling, and payment and item processing
❚ Continuing our focus on key developing markets
such as Brazil, Russia, India and China
❚ Expanding our security solutions beyond the
financial market
❚ Strengthening our balance sheet with record free
cash flow
❚ Continuing to improve our service gross margins
❚ Further improving our efficiency and decreasing
costs while improving internal controls and
compliance processes
❚ Strengthening our senior management team
❚ Divesting our U.S. election systems business
All of these actions enable us to better focus on
and capture opportunities as we drive for improved
performance across the board in 2010 and future years.
Our confidence in Diebold’s future is demonstrated by
the board of directors’ decision early in 2010 to increase
our cash dividend for the 57th consecutive year.
Thomas W. Swidarski President and Chief Executive Officer

2
2009 RESULTS
During 2009, the economy, fi nancial markets and
banking system endured enormous stresses, more than
I have ever seen across my three decades working for
and with fi nancial institutions. In the United States, large
banks focused on repairing their balance sheets and
consolidating mergers and acquisitions from the previous
year. Regional banks braced for an increase in commercial
loan defaults. Smaller banks bore the brunt of the crisis:
80 percent of the 140 U.S. banks that failed during 2009
had less than $1 billion in assets.
Our strong balance sheet, record 2009 free
cash fl ow and diverse business mix – with more
than half of our revenues tied to services –
allowed us to successfully navigate through this
challenging environment.
OUR STRATEGY: BUILT ON SERVICE AND INNOVATION
The fi nancial crisis of the past two years has only
served to underscore the value of retail banking. Our
opportunity – and our obligation to customers – is
to provide the strategy, management and technical
resources needed to help optimize this value. In an
era of large-bank consolidation, this means providing
state-of-the-art technology and service coverage. It
also means partnering with customers of all sizes to
develop creative solutions that reduce operating costs
and capital spending, and offer attractive returns on
their investments.
Increasingly, this will mean building on our strong
base of maintenance and advanced services to deliver
world-class integrated services. This allows us to provide
virtually all of a fi nancial institution’s non-core self-service
operations, including hardware and software, transaction
processing, governance and security.
Why are integrated services and outsourcing
increasingly attractive for banks around the world?
Because they enable them to focus on their core
business – banking – while improving service,
streamlining processes and managing costs more
effectively. And what does a services-led strategy offer
Diebold? The opportunity to take our relationships with
our customers to a whole different level – to a level that
catapults us from being a traditional seller of automated
teller machines (ATMs) to a trusted partner. It opens
up entirely new avenues of growth that leverage our
innovation, expertise and capabilities.
We continued to see growth in Diebold Integrated
Services during 2009. For example, globally we added
more than 6,000 new sites. Today our customers
range from large global banks to smaller credit unions,
with needs ranging from full information technology
outsourcing – including the self-service channel and
security – to select pieces of the infrastructure, such as
currency management or monitoring.
“This new era in banking – the evolution toward integrated services –
will not play out overnight. We believe it will gain momentum in 2010 and 2011,
aided in part by a recovery in our markets. We will be ready when it does.”

3
This new era in banking – the evolution toward
integrated services – will not play out overnight. We
believe it will gain momentum in 2010 and 2011, aided
in part by a recovery in our markets. We will be ready
when it does. For example:
❚ We are a leader in integrated services, currently
handling some 40,000 ATMs globally.
❚ We were listed as a top-10 outsourcing provider
within the services industry by the International
Association of Outsourcing Professionals®.
❚ We were the highest-ranking ATM solutions provider
in the global FinTech 100, ranking fourth among all
service providers to the fi nancial services industry.
❚ We were named both the global physical security
systems integrator and North American monitoring
provider of the year by Frost & Sullivan.
❚ Our Five-Diamond-rated monitoring center
expanded its reach in the government market
by earning Underwriters Laboratories’ prestigious
2050 certifi cation.
❚ We received a platinum award for excellence in
manufacturing from Frost & Sullivan in association
with The Economic Times at our facility in Goa, India.
DEPOSIT AUTOMATION CONTINUES TO GROW
Deposit automation is one of the fastest-growing
technologies in the banking world, due largely to its
potential to deliver attractive returns on capital and
operating expense savings. To date, Diebold has shipped
more than 50,000 deposit automation modules. Even
in diffi cult times, customers’ return on investment from
this technology is compelling.
During 2009, we took several steps to strengthen
our competitive advantage in deposit automation
technology. Most notable was the launch of our
enhanced note acceptor (ENA), which accepts mixed-
denomination deposits of up to 50 notes without using
an envelope. The ENA, paired with our bulk check
acceptor module, has the ability to process cash and
checks simultaneously, providing consumers with
the fastest, most dependable automated deposit
experience available.

4
0
500
1000
1500
2000
2500
3000
3500
0
10
20
30
40
50
60
70
80
90
100%
61%
39%
58%
42%
51%
49%
51%
49%
48%
52%
49%
51%
U.S.International
2004 2005 2006 2007 2008 2009
International vs. Domestic RevenuePercentage of Total Sales
GLOBAL MARKETS…AND GLOBAL MARKET OPPORTUNITIES
The banking market opportunities vary signifi cantly
by region. The amount of business we are generating
in emerging markets has grown considerably, and we
continue to see signifi cant long-term growth opportuni-
ties. Our challenge is to create an appropriate structure
that allows us to continue to invest in key growth markets
while improving our competitive position in the United
States – particularly in high-priority areas such as deposit
automation and integrated services.
In the United States, a mature market, the oppor-
tunity is to leverage our value-added technology and
services with our customers’ need to reduce costs and
improve capital spending.
In Brazil, which continues to be a growth market
for us, Diebold marked its 10th anniversary in 2009. In
just a decade, Diebold has delivered more than 100,000
ATMs, grown to more than 3,000 associates and has the
largest independent information technology (IT) services
organization in the country. In the fourth quarter of
2009, we were pleased to be awarded a major contract
– valued at about $100 million – to provide 160,000
electronic voting machines to the Superior Electoral
Court of Brazil for delivery in 2010.
Asia, a region that has consistently delivered strong
performance year after year, remains an important
growth market, with China continuing to offer the
most potential for Diebold. We were pleased that we
maintained our revenue and customer base in China
during 2009 despite a tough comparison to 2008, when
the Olympics in Beijing spurred bank modernization
and spending.
Europe, a mature and fragmented market,
continued to present challenges, as weakness in
the banking sector held down capital spending on
technology and services. However, we are beginning to
see more positive trends emerge as banks recover and
look to strengthen their competitive position.
“Diebold continues to enhance its competitive advantage by introducing
innovative ways to make complex business operations simpler for our customers.
Our passion for providing customers with the best services – backed by robust
technologies – will continue to set us apart from competitors.”

5
A SHARPER FOCUS FOR SECURITY
Looking at our security business, the lack of bank
branch construction in North America continues to hit
this segment especially hard. However, we believe the
enterprise security and services portion of the business
– particularly in government and commercial markets –
holds signifi cant long-term growth potential.
During the year, we took action to ensure closer
integration of our security offerings with our fi nancial
self-service business to drive increased penetration
within the existing customer base. We also intensifi ed
our focus on large-scale enterprise security opportunities
in the fi nancial, government, commercial and retail
spaces. And we continue to broaden our offerings by
introducing additional security monitoring services to our
portfolio, including fi re, managed access control, energy
management, remote video management and storage as
well as logical security. These are growing areas where
we have developed a strong competency in handling
complex and integrated security installations that require
advanced technologies and challenging logistics.
Diebold continues to enhance its competitive
advantage by introducing innovative ways to make
complex business operations simpler for our customers.
Our passion for providing customers with the best
services – backed by robust technologies – will continue
to set us apart from competitors.
DELIVERING ON OUR GOALS
During the past year, we continued to make
signifi cant progress on SmartBusiness 200, our business
improvement initiative that calls for cost reductions of
$200 million by the end of 2011. Having hit the $100
million milestone by November 2008, we targeted and
ultimately exceeded our goal of $35 million in 2009.
As part of this effort, the company has worked hard
to reconfi gure our manufacturing capacity and supply
chain to better align with current demand. During 2009,
we ended all remaining Opteva® ATM manufacturing in
our Lexington, N.C., facility, driving more volume and
improving utilization and operating effi ciency in our
Budapest, Hungary, and Shanghai, China, facilities. We
also consolidated warehouse operations and distribution
centers in the United States. And our procurement
team continued to drive supplier management and best
practices across the organization, making our supply
chain a competitive advantage.

6
STRENGTHENING OUR MANAGEMENT TEAM
Successfully competing in today’s marketplace
requires a globally experienced, capable management
team aligned with common goals and values. Toward
that end we are realigning our organization and
resources to better support our global opportunities:
❚ Brad Richardson, who brings a strong background
in fi nance and strategy, joined Diebold as executive
vice president and chief fi nancial offi cer.
❚ Chuck Ducey was appointed executive vice
president, North America operations, heading up
fi nancial self-service and security in the region, as
well as integrated services.
❚ James Chen was appointed executive vice
president, international operations, overseeing
operations in Asia Pacifi c, Europe, Middle East and
Africa, and Latin America.
❚ Frank Natoli was appointed vice president and chief
technology offi cer, creating one team that meshes
Diebold’s global strategic and emerging technology
roadmaps to develop solutions synchronized with
customers’ evolving business needs.
❚ John Deignan was named vice president and chief
marketing offi cer, responsible for all global fi nancial
self-service and security marketing activities, as well
as sales support and business consulting activities.
Finally, during 2009 we signifi cantly strengthened
the company’s fi nancial controls by improving systems,
processes and procedures. These controls help
ensure effi ciency, accuracy and timeliness in our
fi nancial reporting.
KEY GOALS FOR 2010
Looking ahead, there are encouraging signs of
stabilization and growth in each of our major geographic
areas. In the United States, large bank spending on retail
banking technology, including deposit automation, is
holding up well and interest from regional banks is
growing. European banks, whose spending has been
muted in recent years, are in the preliminary stages of
increasing IT spending and capital allocation. Brazil
presents signifi cant growth opportunities, including the
voting machine contract we were awarded late last year.
Asia, and China in particular, look to continue recent
growth trends.
Our focus is on capturing this demand – and on
converting these sales opportunities into longer-term,
services-driven relationships whenever possible. We
also see signifi cant potential for better coordinating
security with our fi nancial self-service business as
well as long-term growth opportunities in enterprise
security. And we will continue to strike an appropriate
balance between reducing costs and investing in our
future growth while staying focused on maintaining
a strong balance sheet and improving our fi nancial
control environment.
That provides a snapshot of 2010. As our markets
stabilize and begin to grow, we too should benefi t. Over
the long term, we believe that a 10 percent operating
profi t margin and 15 percent return on capital employed
are achievable goals for Diebold. With the continued
support of our customers, employees, shareholders and
directors, we will work relentlessly to achieve our goals.
Sincerely,
Thomas W. Swidarski
President and Chief Executive Offi cer

UNITED STATES SECURITIES AND EXCHANGE COMMISSIONWashington, D.C. 20549
F O R M 10 - K
¥ ANNUAL REPORT PURSUANT TO SECTION 13 OR 15(d)
OF THE SECURITIES EXCHANGE ACT OF 1934
For the fiscal year ended December 31, 2009OR
n TRANSITION REPORT PURSUANT TO SECTION 13 OR 15(d)
OF THE SECURITIES EXCHANGE ACT OF 1934
For the transition period from toCommission file number 1-4879
Diebold, Incorporated(Exact name of Registrant as specified in its charter)
Ohio 34-0183970
(State or other jurisdiction ofincorporation or organization)
(IRS Employer Identification Number)
5995 Mayfair Road,
P.O. Box 3077, North Canton, Ohio
(Address of principalexecutive offices)
44720-8077
(Zip Code)
REGISTRANT’S TELEPHONE NUMBER, INCLUDING AREA CODE: (330) 490-4000
SECURITIES REGISTERED PURSUANT TO SECTION 12(b) OF THE ACT:
Title of each class Name of each exchange on which registered:
Common Shares $1.25 Par Value New York Stock Exchange
SECURITIES REGISTERED PURSUANT TO SECTION 12(g) OF THE ACT:
NoneIndicate by check mark if the registrant is a well-known seasoned issuer, as defined in Rule 405 of the Securities Act. Yes n No ¥
Indicate by check mark if the registrant is not required to file reports pursuant to Section 13 or 15(d) of the ExchangeAct. Yes n No ¥
Indicate by check mark whether the registrant (1) has filed all reports required to be filed by Section 13 or 15(d) of the SecuritiesExchange Act of 1934 during the preceding 12 months (or for such shorter period that the Registrant was required to file such reports), and(2) has been subject to such filing requirements for the past 90 days. Yes ¥ No n
Indicate by check mark whether the registrant has submitted electronically and posted on its corporate Web site, if any, everyInteractive Data File required to be submitted and posted pursuant to Rule 405 of Regulation S-T during the preceding 12 months (or forsuch shorter period that the registrant was required to submit and post such files). Yes n No n
Indicate by check mark if disclosure of delinquent filers pursuant to Item 405 of Regulation S-K is not contained herein, and will not becontained, to the best of registrant’s knowledge, in definitive proxy or information statements incorporated by reference in Part III of thisForm 10-K or any amendment to this Form 10-K. n
Indicate by check mark whether the registrant is a large accelerated filer, an accelerated filer, a non-accelerated filer, or a smallerreporting company. See the definitions of “large accelerated filer,” “accelerated filer” and “smaller reporting company” in Rule 12b-2 of theExchange Act. (Check one):Large accelerated filer ¥ Accelerated filer n Non-accelerated filer n Smaller reporting company n
Indicate by check mark whether the registrant is a shell company (as defined in Rule 12b-2 of the Exchange Act). Yes n No ¥
State the aggregate market value of the voting and non-voting common equity held by non-affiliates of the registrant as of June 30,2009, the last business day of the registrant’s most recently completed second fiscal quarter. The aggregate market value was computedby using the closing price on the New York Stock Exchange on June 30, 2009 of $26.36 per share.
Common Shares, Par Value $1.25 per Share $1,725,138,477Indicate the number of shares outstanding of each of the registrant’s classes of common stock, as of the latest practicable date.
Class
Common Shares $1.25 Par ValueOutstanding at February 19, 2010
66,324,254
DOCUMENTS INCORPORATED BY REFERENCE
Listed hereunder are the documents, portions of which are incorporated by reference, and the parts of this Form 10-K into which suchportions are incorporated:
Diebold, Incorporated Proxy Statement for 2010 Annual Meeting of Shareholders to be held on April 29, 2010, portions of which areincorporated by reference into Part III of this Form 10-K.

TABLE OF CONTENTS
PART I
ITEM 1: BUSINESS 3
ITEM 1A: RISK FACTORS 7
ITEM 1B: UNRESOLVED STAFF COMMENTS 14
ITEM 2: PROPERTIES 14
ITEM 3: LEGAL PROCEEDINGS 14
ITEM 4: RESERVED 16
PART II
ITEM 5: MARKET FOR REGISTRANT’S COMMON EQUITY, RELATED STOCKHOLDER MATTERS AND
ISSUER PURCHASES OF EQUITY SECURITIES 16
ITEM 6: SELECTED FINANCIAL DATA 18
ITEM 7: MANAGEMENT’S DISCUSSION AND ANALYSIS OF FINANCIAL CONDITION AND RESULTS OF
OPERATIONS 19
ITEM 7A: QUANTITATIVE AND QUALITATIVE DISCLOSURES ABOUT MARKET RISK 40
ITEM 8: FINANCIAL STATEMENTS AND SUPPLEMENTARY DATA 41
ITEM 9: CHANGES IN AND DISAGREEMENTS WITH ACCOUNTANTS ON ACCOUNTING AND FINANCIAL
DISCLOSURE 92
ITEM 9A: CONTROLS AND PROCEDURES 92
ITEM 9B: OTHER INFORMATION 95
PART III
ITEM 10: DIRECTORS, EXECUTIVE OFFICERS AND CORPORATE GOVERNANCE 95
ITEM 11: EXECUTIVE COMPENSATION 96
ITEM 12: SECURITY OWNERSHIP OF CERTAIN BENEFICIAL OWNERS AND MANAGEMENT AND RELATED
STOCKHOLDER MATTERS 97
ITEM 13: CERTAIN RELATIONSHIPS AND RELATED TRANSACTIONS, AND DIRECTOR INDEPENDENCE 97
ITEM 14: PRINCIPAL ACCOUNTANT FEES AND SERVICES 97
PART IV
ITEM 15: EXHIBITS AND FINANCIAL STATEMENT SCHEDULES 97
SIGNATURES 100
EXHIBIT INDEX 103

PART I
ITEM 1: BUSINESS(Dollars in thousands)
GENERAL
Diebold, Incorporated (collectively with its subsidiaries, the Company) was incorporated under the laws of the state of Ohio in
August 1876, succeeding a proprietorship established in 1859.
The Company is a global leader in providing integrated self-service delivery and security systems and services to primarily the
financial, commercial, government and retail markets. Sales of systems and equipment are made directly to customers by the
Company’s sales personnel, manufacturers’ representatives and distributors globally. The sales and support organizations work
closely with customers and their consultants to analyze and fulfill the customers’ needs.
The Company’s vision is, “To be recognized as the essential partner in creating and implementing ideas that optimize
convenience, efficiency and security.” This vision is the guiding principle behind the Company’s transformation of becoming a
more services-oriented company. Today, services comprise more than 50 percent of the Company’s revenue and the Company
expects that this percentage will grow over time as the Company’s integrated services/outsourcing business continues to gain
traction in the marketplace. Financial institutions are eager to reduce costs and optimize management and productivity of their
automated teller machine (ATM) channels — and as a result they are increasingly exploring outsourced solutions. The Company
remains uniquely positioned to provide the infrastructure necessary to manage all aspects of an ATM network — hardware,
software, maintenance, transaction processing, patch management and cash management — through its integrated product and
service offerings.
PRODUCT AND SERVICE SOLUTIONS
The Company has two core lines of business: Self-Service Solutions and Security Solutions, which the Company can
integrate based on the customers’ needs. Financial information for the product and service solutions can be found in note 19 to the
consolidated financial statements, which is incorporated herein by reference. In 2009, 2008 and 2007, the Company’s sales of
products and services related to its financial self-service and security solutions accounted for the vast majority of the Company’s
revenue.
Self-Service Solutions
One popular example of self-service solutions is the ATM. The Company offers an integrated line of self-service technologies
and services, including comprehensive ATM outsourcing, ATM security and fraud, deposit and payment terminal and software.
The Company is a leading global supplier of ATMs and related services and holds the leading market position in many countries
around the world.
Self-Service Hardware
The Company offers a wide variety of self-service solutions. Self-service products include a full range of ATMs and teller
automation including deposit automation technology such as, check-cashing machines, bulk cash recyclers and bulk check
deposit.
Self-Service Software
The Company offers software solutions consisting of multiple applications that process events and transactions. These
solutions are delivered on the appropriate platform, allowing the Company to meet customer requirements while adding new
functionality in a cost-effective manner.
Self-Service Support and Managed Services
From analysis and consulting to monitoring and repair, the Company provides value and support to its customers every step of
the way. Services include installation and ongoing maintenance of our products, OpteView» remote services, branch
3

transformation and distribution channel consulting. Outsourced and managed services include remote monitoring, trouble-
shooting for self-service customers, transaction processing, currency management, maintenance services and full support
via person to person or online communication.
Security Solutions
From the safes and vaults that the Company first manufactured in 1859 to the full range of advanced security offerings it
provides today, the Company’s integrated security solutions contain best-in-class products and award-winning services for its
customers’ unique needs. The Company provides its customers with the latest technological advances to better protect their
assets, improve their workflow and increase their return on investment. These solutions are backed with experienced sales,
installation and service teams. The Company is a leader in providing physical and electronic security systems as well as facility
transaction products that integrate security, software and assisted-service transactions, providing total security systems solutions
to financial, retail, commercial and government markets.
Physical Security and Facility Products
The Company provides security solutions and facility products, including in-store bank branches, pneumatic tube systems for
drive-up lanes, vaults, safes, depositories, bullet-resistive items and undercounter equipment.
Electronic Security Products
The Company provides a broad range of security products including digital surveillance, access control systems, biometric
technologies, alarms and remote monitoring and diagnostics.
Monitoring and Services
The Company provides security monitoring solutions including fire, managed access control, energy management, remote
video management and storage, as well as logical security.
Integrated Solutions
The Company provides end-to-end outsourcing solutions with a single point of contact to help customers maximize their self
service channel by incorporating new technology, meeting compliance and regulatory mandates, protecting their institution, and
reducing costs all while ensuring a high level of service for their customers. Each unique solution may include hardware, software,
services or a combination of all three components. The Company provides value to its customers by offering a comprehensive
array of integrated services and support. The Company’s service organization provides strategic analysis and planning of new
systems, systems integration, architectural engineering, consulting, and project management that encompass all facets of a
successful financial self-service implementation. The Company also provides design, sales, service, installation, project man-
agement and monitoring electronic security products to financial, government, retail and commercial customers.
Election Systems
The Company, through its wholly-owned subsidiary Procomp Industria Eletronica LTDA (in Brazil), is a provider of voting
equipment and related products and services. The Company provides elections equipment, networking, tabulation and diagnostic
software development, training, support and maintenance.
OPERATIONS
The principal raw materials used by the Company are steel, plastics, and electronic parts and components, which are
purchased from various major suppliers. These materials and components are generally available in ample quantities.
The Company’s operating results and the amount and timing of revenue are affected by numerous factors including
production schedules, customer priorities, sales volume and sales mix. During the past several years, the Company has
dramatically changed the focus of its self-service business to that of a total solutions and integrated services approach. The
value of unfilled orders is not as meaningful an indicator of future revenues due to the significant portion of revenues derived from
4

the Company’s growing service-based business, for which order information is not available. Therefore, the Company believes
that backlog information is not material to an understanding of its business.
The Company carries working capital mainly related to trade receivables and inventories. Inventories generally are only
manufactured as orders are received from customers. The Company’s normal and customary payment terms generally range
from net 30 to 90 days from date of invoice. The Company generally does not offer extended payment terms. Through its wholly-
owned subsidiaries, the Company provides financing arrangements to customers purchasing its products. These financing
arrangements are largely classified and accounted for as sales-type leases. As of December 31, 2009, the Company’s net
investment in sales-type leases was $91,230.
The Company’s sales to government markets represent a small portion of the Company’s business. Domestically, the
Company’s contracts with its government customers do not contain fiscal funding clauses. In the event that such a clause exists,
revenue would not be recognizable until the funding clause was satisfied. Internationally, contracts with Brazil’s government are
subject to a twenty-five percent quantity adjustment prior to purchasing any raw materials under the contracted purchasing
schedule. In general, the Company recognizes revenue for delivered elements only when the fair values of delivered and
undelivered elements are known, uncertainties regarding customer acceptance are resolved and there are no customer-
negotiated refunds or return rights affecting the revenue recognized for the delivered elements.
SEGMENTS AND FINANCIAL INFORMATION ABOUT GEOGRAPHIC AREAS
In the first quarter of 2010, the Company began management of its businesses on a geographic basis only, changing from the
previous model of sales channel segments. This change to the Company’s segment reporting for 2010 and future periods is
further described in note 22 to the consolidated financial statements, Subsequent Events, which is incorporated herein by
reference. For the year ended December 31, 2009 and the prior year periods, the Company’s segments are comprised of its three
main sales channels: Diebold North America (DNA), Diebold International (DI) and Election Systems (ES) & Other. The DNA
segment sells and services financial and retail systems in the United States and Canada. The DI segment sells and services
financial and retail systems over the remainder of the globe through wholly-owned subsidiaries, majority-owned joint ventures and
independent distributors in every major country throughout Europe, the Middle East, Africa, Latin America and in the Asia Pacific
region (excluding Japan and Korea). The ES & Other segment includes the operating results of the voting and lottery related
business in Brazil. Segment financial information can be found in note 19 to the consolidated financial statements, which is
incorporated herein by reference.
Sales to customers outside the United States in relation to total consolidated net sales were $1,383,132 or 50.9 percent in
2009, $1,603,963 or 52.0 percent in 2008 and $1,417,574 or 49.1 percent in 2007.
Property, plant and equipment, at cost, located in the United States totaled $436,227, $437,524 and $424,657 as of
December 31, 2009, 2008 and 2007, respectively, and property, plant and equipment, at cost, located outside the United States
totaled $177,150, $142,427 and $151,139 as of December 31, 2009, 2008 and 2007, respectively.
Additional financial information regarding the Company’s international operations is included in note 19 to the consolidated
financial statements, which is incorporated herein by reference.
The Company’s non-U.S. operations are subject to normal international business risks not generally applicable to domestic
business. These risks include currency fluctuation, new and different legal and regulatory requirements in local jurisdictions,
political and economic changes and disruptions, tariffs or other barriers, potentially adverse tax consequences and difficulties in
staffing and managing foreign operations.
COMPETITION
All phases of the Company’s business are highly competitive. Some of the Company’s products are in competition directly
with similar products and others competing with alternative products having similar uses or producing similar results. The
Company believes, based upon outside independent industry surveys, that it is a leading manufacturer of self-service systems in
5

the United States and is also a market leader internationally. In the area of automated transaction systems, the Company
competes on a global basis primarily with NCR Corporation and Wincor-Nixdorf. On a regional basis, the Company competes with
many other hardware and software companies such as Grg Equipment Co. in Asia Pacific and Itautec and Perto in Latin America. In
serving the security products market for the financial services industry, the Company competes with national, regional and local
security companies. Of these competitors, some compete in only one or two product lines, while others sell a broader spectrum
of products. The unavailability of comparative sales information and the large variety of individual products make it difficult to give
reasonable estimates of the Company’s competitive ranking in or share of the market in its security product fields of activity.
However, the Company is ranked as one of the top integrators in the security market.
The Company provides elections systems product solutions and support to the government in Brazil. Competition in this
market is limited and based upon technology pre-qualification demonstrations to the government. Due to the technology
investment required in elections systems, barriers to entry in this market are high.
RESEARCH, DEVELOPMENT AND ENGINEERING
In order to meet customers’ growing demand for self-service and security technologies faster, the Company is focused on
delivering innovation to its customers by continuing to invest in technology solutions that enable customers to reduce costs and
improve efficiency. Expenditures for research, development and engineering initiatives were $72,026, $73,034 and $67,081 in
2009, 2008 and 2007, respectively. Opteva» ATMs are designed with leading technology to meet our customers’ growing deposit
automation needs and provide maximum value. All full function Opteva ATMs support intelligent check and automated cash
deposits. Key features include check imaging with intelligent depository moduleTM, bulk document intelligent depository modules
and enhanced note acceptor.
PATENTS, TRADEMARKS, LICENSES
The Company owns patents, trademarks and licenses relating to certain products in the United States and internationally.
While the Company regards these as items of importance, it does not deem its business as a whole, or any industry segment, to
be materially dependent upon any one item or group of items.
ENVIRONMENTAL
Compliance with federal, state and local environmental protection laws during 2009 had no material effect upon the
Company’s business, financial condition or results of operations.
EMPLOYEES
At December 31, 2009, the Company employed 16,397 associates globally. The Company’s service staff is one of the
financial industry’s largest, with professionals in more than 600 locations and representation in nearly 90 countries worldwide.
AVAILABLE INFORMATION
The Company uses its Investor Relations web site, www.diebold.com, as a channel for routine distribution of important
information, including news releases, analyst presentations, and financial information. The Company posts filings as soon as
reasonably practicable after they are electronically filed with, or furnished to, the U.S. Securities and Exchange Commission (SEC),
including its annual, quarterly, and current reports on Forms 10-K, 10-Q, and 8-K; its proxy statements; and any amendments to
those reports or statements. All such postings and filings are available on the Company’s Investor Relations web site free of
charge. In addition, this web site allows investors and other interested persons to sign up to automatically receive e-mail alerts
when the Company posts news releases and financial information on its web site. The SEC also maintains a web site,
www.sec.gov, that contains reports, proxy and information statements, and other information regarding issuers that file
electronically with the SEC. The content on any web site referred to in this annual report Form 10-K is not incorporated by
reference into this annual report unless expressly noted.
6

ITEM 1A: RISK FACTORS
The following are certain risk factors that could affect our business, financial condition, operating results and cash flows.
These risk factors should be considered in connection with evaluating the forward-looking statements contained in this annual
report on Form 10-K because they could cause actual results to differ materially from those expressed in any forward-looking
statement. The risk factors highlighted below are not the only ones we face. If any of these events actually occur, our business,
financial condition, operating results or cash flows could be negatively affected.
We caution the reader to keep these risk factors in mind and refrain from attributing undue certainty to any forward-looking
statements, which speak only as of the date of this annual report.
Demand for and supply of our products and services may be adversely affected by numerous factors, some of which we cannot
predict or control. This could adversely affect our operating results.
Numerous factors may affect the demand for and supply of our products and services, including:
• changes in the market acceptance of our products and services;
• customer and competitor consolidation;
• changes in customer preferences;
• declines in general economic conditions;
• changes in environmental regulations that would limit our ability to sell products and services in specific markets; and
• macro-economic factors affecting banks, credit unions and other financial institutions may lead to cost-cutting efforts by
customers, which could cause us to lose current or potential customers or achieve less revenue per customer.
If any of these factors occur, the demand for and supply of our products and services could suffer, and this would adversely
affect our results of operations.
Increased raw material and energy costs could reduce our income.
The primary raw materials in our financial self-service, security and election systems product and service solutions are steel,
plastics and electronic parts and components. The majority of our raw materials are purchased from various local, regional and
global suppliers pursuant to long-term supply contracts. However, the price of these materials can fluctuate under these contracts
in tandem with the pricing of raw materials.
In addition, energy prices, particularly petroleum prices, are cost drivers for our business. In recent years, the price of
petroleum has been highly volatile, particularly due to the unstable political conditions in the Persian Gulf and increasing
international demand from emerging markets. Any increase in the costs of energy would also increase our transportation costs.
Although we attempt to pass on higher raw material and energy costs to our customers, given the competitive markets in which
we operate, it is often not possible to do this.
Our business may be affected by general economic conditions, cyclicality and uncertainty and could be adversely affected during
economic downturns.
Demand for our products is affected by general economic conditions and the business conditions of the industries in which
we sell our products and services. The business of most of our customers, particularly our financial institution customers, is, to
varying degrees, cyclical and has historically experienced periodic downturns. Under difficult economic conditions, customers
may seek to reduce discretionary spending by forgoing purchases of our products and services. This risk is magnified for capital
goods purchases such as ATMs and physical security products. In addition, downturns in our customer’s industries, even during
periods of strong general economic conditions, could adversely affect the demand for our products and services, and our sales and
operating results.
7

In particular, recent economic difficulties in the U.S. credit markets and the global markets have led to an economic recession
in some or all of the markets in which we operate. As a result of these difficulties and other factors, financial institutions have failed
and may continue to fail resulting in a loss of current or potential customers, or deferred or cancelled sales orders, including orders
previously made. Any customer deferrals or cancellations could materially affect our sales and operating results.
Additionally, the unstable political conditions in the Persian Gulf could lead to further financial, economic and political
instability, and this could lead to an additional deterioration in general economic conditions.
We may be unable to achieve, or may be delayed in achieving, our cost-cutting initiatives, and this may adversely affect our oper-
ating results and cash flow.
We have launched a number of cost-cutting initiatives, including restructuring initiatives, to improve operating efficiencies
and reduce operating costs. Although we have achieved a substantial amount of annual cost savings associated with these cost-
cutting initiatives, we may be unable to sustain the cost savings that we have achieved. In addition, if we are unable to achieve, or
have any unexpected delays in achieving additional cost savings, our results of operations and cash flow may be adversely
affected. Even if we meet the goals pursuant to these initiatives, we may not receive the expected financial benefits of these
initiatives.
We face competition that could adversely affect our sales and financial condition.
All phases of our business are highly competitive. Some of our products are in direct competition with similar or alternative
products provided by our competitors. We encounter competition in price, delivery, service, performance, product innovation,
product recognition and quality.
Because of the potential for consolidation in any market, our competitors may become larger, which could make them more
efficient and permit them to be more price-competitive. Increased size could also permit them to operate in wider geographic
areas and enhance their abilities in other areas such as research and development and customer service. As a result, this could
also reduce our profitability.
Our competitors can be expected to continue to develop and introduce new and enhanced products. This could cause a
decline in market acceptance of our products. In addition, our competitors could cause a reduction in the prices for some of our
products as a result of intensified price competition. Also, we may be unable to effectively anticipate and react to new entrants in
the marketplace competing with our products.
Competitive pressures can also result in the loss of major customers. An inability to compete successfully could have an
adverse effect on our operating results, financial condition and cash flows in any given period.
In international markets, we compete with local service providers that may have competitive advantages.
In a number of international markets, especially those in Asia Pacific and Latin America, we face substantial competition from
local service providers that offer competing products and services. Some of these companies may have a dominant market share
in their territories and may be owned by local stakeholders. This could give them a competitive advantage. Local providers of
competing products and services may also have a substantial advantage in attracting customers in their country due to more
established branding in that country, greater knowledge with respect to the tastes and preferences of customers residing in that
country and/or their focus on a single market. Further, the local providers may have greater regulatory and operational flexibility
since we are subject to both U.S. and foreign regulatory requirements.
Because our operations are conducted worldwide, they are affected by risks of doing business abroad.
We generate a significant percentage of revenue from sales and service operations conducted outside the United States.
Revenue from international operations amounted to approximately 50.9 percent in 2009, 52.0 percent in 2008 and 49.1 percent in
2007 of total revenue during these respective years.
8

Accordingly, international operations are subject to the risks of doing business abroad, including the following:
• fluctuations in currency exchange rates;
• transportation delays and interruptions;
• political and economic instability and disruptions;
• restrictions on the transfer of funds;
• the imposition of duties and tariffs;
• import and export controls;
• changes in governmental policies and regulatory environments;
• labor unrest and current and changing regulatory environments;
• the uncertainty of product acceptance by different cultures;
• the risks of divergent business expectations or cultural incompatibility inherent in establishing joint ventures with foreign
partners;
• difficulties in staffing and managing multi-national operations;
• limitations on the ability to enforce legal rights and remedies;
• reduced protection for intellectual property rights in some countries; and
• potentially adverse tax consequences.
Any of these events could have an adverse effect on our international operations by reducing the demand for our products or
decreasing the prices at which we can sell our products, thereby adversely affecting our financial condition or operating results.
We may not be able to continue to operate in compliance with applicable customs, currency exchange control regulations, transfer
pricing regulations or any other laws or regulations to which we may be subject. In addition, these laws or regulations may be
modified in the future, and we may not be able to operate in compliance with those modifications.
Our Venezuelan operations consist of a fifty-percent owned subsidiary which is consolidated. Effective in January 2010, the
Venezuelan government announced the devaluation of its currency, the bolivar fuerte, and the establishment of a two-tier
exchange structure. In connection with the remeasurement of the Venezuela balance sheet, we expect to record a charge in the
first quarter of 2010 to reflect this devaluation. If in the future there are changes to this exchange rate, we may realize additional
gains or losses. The future results of Venezuelan operations may be affected by our ability to mitigate the effect of the devaluation,
further actions by the Venezuelan government, as well as economic conditions in Venezuela such as inflation.
We may expand operations into international markets in which we may have limited experience or rely on business partners.
We continually look to expand our products and services into international markets. We have currently developed, through
joint ventures, strategic investments, subsidiaries and branch offices, sales and service offerings in over 90 countries outside of
the United States. As we expand into new international markets, we will have only limited experience in marketing and operating
products and services in such markets. In other instances, we may rely on the efforts and abilities of foreign business partners in
such markets. Certain international markets may be slower than domestic markets in adopting our products and services, and our
operations in international markets may not develop at a rate that supports our level of investment.
9

Any failure to manage acquisitions, divestitures and other significant transactions successfully could harm our operating results,
business and prospects.
As part of our business strategy, we frequently engage in discussions with third parties regarding possible investments,
acquisitions, strategic alliances, joint ventures, divestitures and outsourcing arrangements, and we enter into agreements relating
to such transactions in order to further our business objectives. In order to pursue this strategy successfully, we must identify
suitable candidates, successfully complete transactions, some of which may be large and complex, and manage post- closing
issues such as the integration of acquired companies or employees. Integration and other risks of these transactions can be more
pronounced in larger and more complicated transactions, or if multiple transactions are pursued simultaneously. If we fail to
identify and successfully complete transactions that further our strategic objectives, we may be required to expend resources to
develop products and technology internally. This may put us at a competitive disadvantage, and we may be adversely affected by
negative market perceptions any of which may have a material adverse effect on our revenue, gross margin and profitability.
Integration issues are complex, time-consuming and expensive and, without proper planning and implementation, could
significantly disrupt our business. The challenges involved in integration include:
• combining product and service offerings and entering into new markets in which we are not experienced;
• convincing customers and distributors that the transaction will not diminish client service standards or business focus,
preventing customers and distributors from deferring purchasing decisions or switching to other suppliers (which could
result in additional obligations to address customer uncertainty), and coordinating sales, marketing and distribution efforts;
• consolidating and rationalizing corporate information technology infrastructure, which may include multiple legacy systems
from various acquisitions and integrating software code;
• minimizing the diversion of management attention from ongoing business concerns;
• persuading employees that business cultures are compatible, maintaining employee morale and retaining key employees,
integrating employees into our company, correctly estimating employee benefit costs and implementing restructuring
programs;
• coordinating and combining administrative, manufacturing, research and development and other operations, subsidiaries,
facilities and relationships with third parties in accordance with local laws and other obligations while maintaining adequate
standards, controls and procedures; and
• achieving savings from supply chain and administration integration.
We evaluate and enter into these types of transactions on an ongoing basis. We may not fully realize all of the anticipated
benefits of any transaction, and the timeframe for achieving benefits of a transaction may depend partially upon the actions of
employees, suppliers or other third parties. In addition, the pricing and other terms of our contracts for these transactions require
us to make estimates and assumptions at the time we enter into these contracts, and, during the course of our due diligence, we
may not identify all of the factors necessary to estimate costs accurately. Any increased or unexpected costs, unanticipated delays
or failure to achieve contractual obligations could make these agreements less profitable or unprofitable.
Managing these types of transactions requires varying levels of management resources, which may divert our attention from
other business operations. These transactions could result in significant costs and expenses and charges to earnings, including
those related to severance pay, early retirement costs, employee benefit costs, asset impairment charges, charges from the
elimination of duplicative facilities and contracts, in-process research and development charges, inventory adjustments, assumed
litigation and other liabilities, legal, accounting and financial advisory fees, and required payments to executive officers and key
employees under retention plans. Moreover, we could incur additional depreciation and amortization expense over the useful lives
of certain assets acquired in connection with these transactions, and, to the extent that the value of goodwill or intangible assets
with indefinite lives acquired in connection with a transaction becomes impaired, we may be required to incur additional material
charges relating to the impairment of those assets. In order to complete an acquisition, we may issue common stock, potentially
creating dilution for existing shareholders, or borrow funds, affecting our financial condition and potentially our credit ratings. Any
10

prior or future downgrades in our credit rating associated with a transaction could adversely affect our ability to borrow and result
in more restrictive borrowing terms. In addition, our effective tax rate on an ongoing basis is uncertain, and such transactions could
impact our effective tax rate. We also may experience risks relating to the challenges and costs of closing a transaction and the risk
that an announced transaction may not close. As a result, any completed, pending or future transactions may contribute to
financial results that differ from the investment community’s expectations.
We have a significant amount of goodwill, and any future goodwill impairment charges could adversely impact our results of
operations.
As of December 31, 2009, we had $450.9 million of goodwill. We test all existing goodwill at least annually for impairment
using the fair value approach on a “reporting unit” basis. The reporting units are defined as Domestic and Canada, Brazil, Latin
America, Asia Pacific, and Europe, Middle East and Africa. The annual goodwill impairment test for 2009, 2008 and 2007 resulted
in no impairment related to income from continuing operations. However, the valuation techniques used in the impairment tests
incorporate a number of estimates and assumptions that are subject to change; although we believe these estimates and
assumptions are reasonable and reflect forecasted market conditions at the assessment date. Any changes to these assumptions
and estimates due to market conditions or otherwise may lead to an outcome where impairment charges would be required in
future periods. In particular, the carrying amount of goodwill in our Brazil reporting unit was $115.4 million as of December 31,
2009, with limited excess fair value over such carrying amount. Because actual results may vary from our forecasts and such
variations may be material and unfavorable, we may need to record future impairment charges with respect to the goodwill
attributed to the Brazil reporting unit or other reporting units, which could adversely impact our results of operations.
System security risks and systems integration issues could disrupt our internal operations or services provided to customers, and
any such disruption could adversely affect revenue, increase costs, and harm our reputation and stock price.
Experienced computer programmers and hackers may be able to penetrate our network security and misappropriate
confidential information or that of third parties, create system disruptions or cause shutdowns. As a result, we could incur
significant expenses in addressing problems created by network security breaches. Moreover, we could lose existing or potential
customers, or incur significant expenses in connection with customers’ system failures. In addition, sophisticated hardware and
operating system software and applications that we produce or procure from third parties may contain defects in design or
manufacture, including “bugs” and other problems that could unexpectedly interfere with the operation of the system. The costs
to eliminate or alleviate security problems, viruses and bugs could be significant, and the efforts to address these problems could
result in interruptions, delays or cessation of service that could impede sales, manufacturing, distribution or other critical
functions.
Portions of our information technology infrastructure also may experience interruptions, delays or cessations of service or
produce errors in connection with systems integration or migration work that takes place from time to time. We may not be
successful in implementing new systems, and transitioning data and other aspects of the process could be expensive, time
consuming, disruptive and resource-intensive. Such disruptions could adversely impact the ability to fulfill orders and interrupt
other processes. Delayed sales, lower margins or lost customers resulting from these disruptions could adversely affect financial
results, stock price and reputation.
Our inability to attract, retain and motivate key employees could harm current and future operations.
In order to be successful, we must attract, retain and motivate executives and other key employees, including those in
managerial, professional, administrative, technical, sales, marketing and information technology support positions. We also must
keep employees focused on our strategies and goals. Hiring and retaining qualified executives, engineers and qualified sales
representatives are critical to our future, and competition for experienced employees in these areas can be intense. The failure to
hire or loss of key employees could have a significant impact on our operations.
11

We may not be able to generate sufficient cash flows to fund our operations and make adequate capital investments.
Our cash flows from operations depend primarily on sales and service margins. To develop new product and service
technologies, support future growth, achieve operating efficiencies and maintain product quality, we must make significant capital
investments in manufacturing technology, facilities and capital equipment, research and development, and product and service
technology. In addition to cash provided from operations, we have from time to time utilized external sources of financing.
Depending upon general market conditions or other factors, we may not be able to generate sufficient cash flows to fund our
operations and make adequate capital investments. In addition, due to the recent economic downturn there has been a tightening
of the credit markets, which may limit our ability to obtain alternative sources of cash to fund our operations.
New product developments may be unsuccessful.
We are constantly looking to develop new products and services that complement or leverage the underlying design or
process technology of our traditional product and service offerings. We make significant investments in product and service
technologies and anticipate expending significant resources for new product development over the next several years. There can
be no assurance that our product development efforts will be successful, that we will be able to cost effectively manufacture
these new products, that we will be able to successfully market these products or that margins generated from sales of these
products will recover costs of development efforts.
An adverse determination that our products or manufacturing processes infringe the intellectual property rights of others could
have a materially adverse effect on our business, operating results or financial condition.
As is common in any high technology industry, others have asserted from time to time, and may also do so in the future, that
our products or manufacturing processes infringe their intellectual property rights. A court determination that our products or
manufacturing processes infringe the intellectual property rights of others could result in significant liability and/or require us to
make material changes to our products and/or manufacturing processes. We are unable to predict the outcome of assertions of
infringement made against us. Any of the foregoing could have a materially adverse effect on our business, operating results or
financial condition.
Anti-takeover provisions could make it more difficult for a third party to acquire us.
Certain provisions of our charter documents, including provisions limiting the ability of shareholders to raise matters at a
meeting of shareholders without giving advance notice and permitting cumulative voting, may make it more difficult for a third
party to gain control of our Board of Directors and may have the effect of delaying or preventing changes in our control or
management. This could have an adverse effect on the market price of our common stock. Additionally, Ohio corporate law
provides that certain notice and informational filings and special shareholder meeting and voting procedures must be followed
prior to consummation of a proposed “control share acquisition,” as defined in the Ohio Revised Code. Assuming compliance with
the prescribed notice and information filings, a proposed control share acquisition may be made only if, at a special meeting of
shareholders, the acquisition is approved by both a majority of our voting power represented at the meeting and a majority of the
voting power remaining after excluding the combined voting power of the “interested shares,” as defined in the Ohio Revised
Code. The application of these provisions of the Ohio Revised Code also could have the effect of delaying or preventing a change
of control.
Any actions or other governmental investigations or proceedings related to or arising from the SEC investigation and Department
of Justice investigation could result in substantial costs to defend enforcement or other related actions that could have a materi-
ally adverse effect on our business, operating results or financial condition.
In 2009, we recorded a $25.0 million charge related to an agreement in principle with the staff of the SEC to settle civil charges
stemming from the staff’s pending enforcement inquiry. The agreement in principle with the staff of the SEC remains subject to
the final approval of the SEC, and there can be no assurance that the SEC will accept the terms of the settlement negotiated with
the staff.
12

We have incurred substantial expenses for legal and accounting services due to the SEC and the U.S. Department of Justice
(DOJ) investigations. We could incur substantial additional costs to defend and resolve litigation or other governmental inves-
tigations or proceedings arising out of, or related to, the completed investigations. In addition, we could be exposed to
enforcement or other actions with respect to these matters by the SEC’s Division of Enforcement or the DOJ.
In addition, these activities have diverted the attention of management from the conduct of our business. The diversion of
resources to address issues arising out of the investigations may harm our business, operating results and financial condition in
the future.
Our ability to maintain effective internal control over financial reporting may be insufficient to allow us to accurately report our
financial results or prevent fraud, and this could cause our financial statements to become materially misleading and adversely
affect the trading price of our common stock.
We require effective internal control over financial reporting in order to provide reasonable assurance with respect to our
financial reports and to effectively prevent fraud. Internal control over financial reporting may not prevent or detect misstatements
because of its inherent limitations, including the possibility of human error, the circumvention or overriding of controls, or fraud.
Therefore, even effective internal controls can provide only reasonable assurance with respect to the preparation and fair
presentation of financial statements. If we cannot provide reasonable assurance with respect to our financial statements and
effectively prevent fraud, our financial statements could become materially misleading which could adversely affect the trading
price of our common stock.
Management identified control deficiencies as of December 31, 2009 that constituted material weaknesses. Throughout
2009, we enhanced, and will continue to enhance, our internal controls over financial reporting. If we fail to establish and maintain
the adequacy of our internal control over financial reporting, including any failure to implement required new or improved controls,
or if we experience difficulties in their implementation, our business, financial condition and operating results could be harmed.
Any material weakness or unsuccessful remediation could affect investor confidence in the accuracy and completeness of
our financial statements. As a result, our ability to obtain any additional financing, or additional financing on favorable terms, could
be materially and adversely affected. This, in turn, could materially and adversely affect our business, financial condition and the
market value of our securities and require us to incur additional costs to improve our internal control systems and procedures. In
addition, perceptions of our company among customers, lenders, investors, securities analysts and others could also be adversely
affected.
We can give no assurances that the measures we have taken to date, or any future measures we may take, will remediate the
material weaknesses identified or that any additional material weaknesses will not arise in the future due to our failure to
implement and maintain adequate internal control over financial reporting. In addition, even if we are successful in strengthening
our controls and procedures, those controls and procedures may not be adequate to prevent or identify irregularities or ensure the
fair presentation of our financial statements included in our periodic reports filed with the SEC.
Low investment performance by our domestic pension plan assets may result in an increase to our net pension liability and
expense, which may require us to fund a portion of our pension obligations and divert funds from other potential uses.
We sponsor several defined benefit pension plans which cover certain eligible employees. Our pension expense and required
contributions to our pension plans are directly affected by the value of plan assets, the projected rate of return on plan assets, the
actual rate of return on plan assets and the actuarial assumptions we use to measure the defined benefit pension plan obligations.
A significant market downturn could occur in future periods resulting in a decline in the funded status of our pension plans and
actual asset returns to be below the assumed rate of return used to determine pension expense. If return on plan assets in future
periods perform below expectations, future pension expense will increase. Further, as a result of the global economic instability,
our pension plan investment portfolio has recently incurred greater volatility.
We establish the discount rate used to determine the present value of the projected and accumulated benefit obligations at
the end of each year based upon the available market rates for high quality, fixed income investments. We match the projected
cash flows of our pension plans against those generated by high-quality corporate bonds. The yield of the resulting bond portfolio
13

provides a basis for the selected discount rate. An increase in the discount rate would reduce the future pension expense and,
conversely, a decrease in the discount rate would increase the future pension expense.
Based on current guidelines, assumptions and estimates, including stock market prices and interest rates, we plan to make
cash contributions totaling approximately $15 million to our pension plans in 2010. Changes in the current assumptions and
estimates could result in contributions in years beyond 2010 that are greater than the projected 2010 contributions required. We
cannot predict whether changing market or economic conditions, regulatory changes or other factors will further increase our
pension expenses or funding obligations, diverting funds we would otherwise apply to other uses.
ITEM 1B: UNRESOLVED STAFF COMMENTSNone.
ITEM 2: PROPERTIESThe Company’s corporate offices are located in North Canton, Ohio. The Company owns manufacturing facilities in Canton,
Ohio, Lynchburg, Virginia, and Lexington, North Carolina. The Company also has manufacturing facilities in Belgium, Brazil, China,
Hungary and India. The Company has selling, service and administrative offices in the following locations: throughout the United
States, and in Australia, Austria, Barbados, Belgium, Belize, Brazil, Canada, Chile, China, Colombia, Costa Rica, Czech Republic,
Dominican Republic, Ecuador, El Salvador, France, Greece, Guatemala, Haiti, Honduras, Hong Kong, Hungary, India, Indonesia,
Italy, Kazakhstan, Malaysia, Mexico, Namibia, Netherlands, Nicaragua, Panama, Paraguay, Peru, Philippines, Portugal, Poland,
Romania, Russia, Singapore, Slovakia, South Africa, Spain, Switzerland, Taiwan, Thailand, Turkey, the United Arab Emirates, the
United Kingdom, Uruguay, Venezuela and Vietnam. The Company leases a majority of the selling, service and administrative
offices under operating lease agreements.
The Company considers that its properties are generally in good condition, are well maintained, and are generally suitable and
adequate to carry on the Company’s business.
ITEM 3: LEGAL PROCEEDINGS(Dollars in thousands)
At December 31, 2009, the Company was a party to several lawsuits that were incurred in the normal course of business,
none of which individually or in the aggregate is considered material by management in relation to the Company’s financial position
or results of operations. In management’s opinion, the Company’s consolidated financial statements would not be materially
affected by the outcome of any present legal proceedings, commitments, or asserted claims.
In addition to the routine legal proceedings noted above, the Company has been served with various lawsuits, filed against it
and certain current and former officers and directors, by shareholders and participants in the Company’s 401(k) savings plan,
alleging violations of the federal securities laws and breaches of fiduciary duties with respect to the 401(k) plan. These complaints
seek compensatory damages in unspecified amounts, fees and expenses related to such lawsuits and the granting of extraor-
dinary equitable and/or injunctive relief. For each of these lawsuits, the date each complaint was filed, the name of the plaintiff and
the federal court in which such lawsuit is pending are as follows:
• Konkol v. Diebold Inc., et al., No. 5:05CV2873 (N.D. Ohio, filed December 13, 2005).
• Ziolkowski v. Diebold Inc., et al., No. 5:05CV2912 (N.D. Ohio, filed December 16, 2005).
• New Jersey Carpenter’s Pension Fund v. Diebold, Inc., No. 5:06CV40 (N.D. Ohio, filed January 6, 2006).
• Rein v. Diebold, Inc., et al., No. 5:06CV296 (N.D. Ohio, filed February 9, 2006).
• Graham v. Diebold, Inc., et al., No. 5:05CV2997 (N.D. Ohio, filed December 30, 2005).
14

• McDermott v. Diebold, Inc., et al., No. 5:06CV170 (N.D. Ohio, filed January 24, 2006).
• Barnett v. Diebold, Inc., et al., No. 5:06CV361 (N.D. Ohio, filed February 15, 2006).
• Farrell v. Diebold, Inc., et al., No. 5:06CV307 (N.D. Ohio, filed February 8, 2006).
• Forbes v. Diebold, Inc., et al., No. 5:06CV324 (N.D. Ohio, filed February 10, 2006).
• Gromek v. Diebold, Inc., et al., No. 5:06CV579 (N.D. Ohio, filed March 14, 2006).
The Konkol, Ziolkowski, New Jersey Carpenter’s Pension Fund, Rein and Graham cases, which allege violations of the federal
securities laws, have been consolidated into a single proceeding. The McDermott, Barnett, Farrell, Forbes and Gromek cases,
which allege breaches of fiduciary duties under the Employee Retirement Income Security Act of 1974 with respect to the 401(k)
plan, likewise have been consolidated into a single proceeding. The Company and the individual defendants deny the allegations
made against them, regard them as without merit, and intend to defend themselves vigorously. On August 22, 2008, the district
court dismissed the consolidated amended complaint in the consolidated securities litigation and entered a judgment in favor of
the defendants. On December 22, 2009, the U.S. Court of Appeals for the Sixth Circuit affirmed the judgment of dismissal. On
February 18, 2010, the U.S. Court of Appeals for the Sixth Circuit denied plaintiffs’ motion for rehearing en banc. In May 2009, the
Company agreed to settle the 401(k) class action litigation for $4,500, to be paid out of the Company’s insurance policies. The
settlement is subject to final documentation and approval of the court.
The Company, including certain of its subsidiaries, filed a lawsuit on May 30, 2008 (Premier Election Solutions, Inc., et al. v.
Board of Elections of Cuyahoga County, et al., Case No. 08-CV-05-7841, (Franklin Cty. Ct Common Pleas)) against the Board of
Elections of Cuyahoga County, Ohio, the Board of County Commissioners of Cuyahoga County, Ohio, (collectively, the County),
and Ohio Secretary of State Jennifer Brunner (Secretary) regarding several Ohio contracts under which the Company provided
voting equipment and related services to the State of Ohio and a number of its counties. The lawsuit was precipitated by the
County’s threats to sue the Company for unspecified damages. The complaint seeks a declaration that the Company met its
contractual obligations. In response, on July 15, 2008, the County filed an answer and counterclaim alleging that the voting system
was defective and seeking declaratory relief and unspecified damages under several theories of recovery. In addition, the County
is trying to pierce the Company’s “corporate veil” and hold Diebold, Incorporated directly liable for acts and omissions alleged to
have been committed by its subsidiaries (even though Diebold, Incorporated is not a party to the contracts). In connection with the
Company’s recent sale of those subsidiaries, it has agreed to indemnify the subsidiaries and their purchaser from any and all
liabilities arising out of the lawsuit. The Secretary has also filed an answer and counterclaim seeking declaratory relief and
unspecified damages under several theories of recovery. The Butler County Board of Elections has joined in, and incorporated by
reference, the Secretary’s counterclaim.
The Company has filed motions to dismiss and for more definite statement of the counterclaims. The motions are fully briefed
and are awaiting a decision by the court. The Secretary has also added ten Ohio counties as additional defendants, claiming that
those counties also experienced problems with the voting systems, but many of those counties have moved for dismissal. In
addition, the Secretary has moved the court for leave to add 37 additional Ohio counties who use the voting system as defendants,
contending that they have an interest in the litigation and must be made parties. The Secretary’s motion remains pending.
Management is unable to determine the financial statement impact, if any, of the County’s and Secretary’s actions as of
December 31, 2009.
The Company was informed during the first quarter of 2006 that the staff of the SEC had begun an informal inquiry relating to
the Company’s revenue recognition policy. In the second quarter of 2006, the Company was informed that the SEC’s inquiry had
been converted to a formal, non-public investigation. In the fourth quarter of 2007, the Company also learned that the DOJ had
begun a parallel investigation. On May 1, 2009, the Company reached an agreement in principle with the staff of the SEC to settle
civil charges stemming from the staff’s pending investigation. In addition, the Company has been informed by the U.S. Attorney’s
Office for the Northern District of Ohio that it will not bring criminal charges against the Company for the transactions and
accounting issues that are the subject of the SEC investigation.
15

Under the terms of the agreement in principle with the staff of the SEC, the Company will neither admit nor deny civil
securities fraud charges, will pay a penalty of $25,000 and will agree to an injunction against committing or causing any violations
or future violations of certain specified provisions of the federal securities laws. The agreement in principle with the staff of the
SEC remains subject to the final approval of the SEC, and there can be no assurance that the SEC will accept the terms of the
settlement negotiated with the staff.
ITEM 4: RESERVED
PART II
ITEM 5: MARKET FOR REGISTRANT’S COMMON EQUITY, RELATED STOCK-HOLDER MATTERS AND ISSUER PURCHASES OF EQUITYSECURITIES
The common shares of the Company are listed on the New York Stock Exchange with a symbol of “DBD.” The price ranges of
common shares of the Company for the periods indicated below are as follows:
High Low High Low High Low
2009 2008 2007
1st Quarter $29.75 $19.04 $39.30 $23.07 $48.42 $42.50
2nd Quarter 27.55 20.77 40.44 35.44 52.70 47.25
3rd Quarter 33.17 24.76 39.81 30.60 54.50 42.49
4th Quarter 33.06 25.04 34.47 22.50 45.90 28.32
Full Year $33.17 $19.04 $40.44 $22.50 $54.50 $28.32
There were approximately 52,732 shareholders at December 31, 2009, which includes an estimated number of shareholders
who have shares held in their accounts by banks, brokers, and trustees for benefit plans and the agent for the dividend
reinvestment plan.
On the basis of amounts paid and declared, the annualized dividends per share were $1.04, $1.00 and $0.94 in 2009, 2008 and
2007, respectively.
Information concerning the Company’s share repurchases made during the fourth quarter of 2009:
Period
Total Numberof Shares
Purchased(1)Average Price Paid
Per Share
Total Number ofShares Purchased as
Part of PubliclyAnnounced Plans
Maximum Number ofShares that May YetBe Purchased Under
the Plans(2)
October 1,174 $31.83 — 2,926,500
November — — — 2,926,500
December 48 25.85 — 2,926,500
Total 1,222 $31.59 — 2,926,500
(1) Includes 1,174 shares in October and 48 shares in December surrendered or deemed surrendered to the Company in connection with the Company’s stock-based
compensation plans.
(2) The total number of shares repurchased as part of the publicly announced share repurchase plan was 9,073,500 as of December 31, 2009. The plan was approved
by the Board of Directors in April 1997 and authorized the repurchase of up to two million shares. The plan was amended in June 2004 to authorize the repurchase of
an additional two million shares, and was further amended in August and December 2005 to authorize the repurchase of an additional six million shares. In February
2007, the Board of Directors approved an increase in the Company’s share repurchase program by authorizing the repurchase of up to an additional two million of
the Company’s outstanding common shares. The Company may purchase shares from time to time in open market purchases or privately negotiated transactions.
The Company may make all or part of the purchases pursuant to accelerated share repurchases or Rule 10b5-1 plans. The plan has no expiration date and may be
suspended or discontinued at any time.
16

PERFORMANCE GRAPH
The following graph compares the cumulative five-year total return provided to shareholders on the Company’s common
stock versus the cumulative total returns of the S&P 500 index, the S&P Midcap 400 index and two customized peer groups of
28 companies and 44 companies respectively, whose individual companies are listed in footnotes 1 and 2 below. An investment of
$100 (with reinvestment of all dividends) is assumed to have been made in the Company’s common stock, in each index and in
each of the peer groups on December 31, 2004 and its relative performance is tracked through December 31, 2009.
COMPARISON OF 5 YEAR CUMULATIVE TOTAL RETURN*
Among Diebold, Inc., The S&P 500 Index, The S&P 400 Index,
an Old Custom Composite Index (28 Stocks) and a New Custom Composite Index (44 Stocks)
$0
$20
$40
$60
$80
$100
$120
$140
$160
12/04 12/05 12/06 12/07 12/08 12/09
Diebold, Inc. S&P 500
S&P Midcap 400 Old Custom Composite Index (28 Stocks)
New Custom Composite Index (44 Stocks)
* $100 invested on 12/31/04 in stock or index, including reinvestment of dividends.
Fiscal year ending December 31.
Copyright˝ 2010 S&P, a division of The McGraw-Hill Companies Inc. All rights reserved.
(1) The 28 companies included in the Company’s Old Custom Composite Index are: Affiliated Computer Services, Inc.; Ametek, Inc.; Benchmark Electronics, Inc.;
Cooper Industries plc; Corning Inc.; Crane Co.; Deluxe Corp.; Donaldson Company, Inc.; Dover Corp.; Fiserv, Inc.; FMC Technologies, Inc.; Harris Corp.; Hubbell Inc.;
International Game Technology; Lennox International Inc.; Mettler-Toledo International Inc.; NCR Corp.; Pall Corp.; PerkinElmer, Inc.; Pitney Bowes Inc.; Rockwell
Automation; Rockwell Collins, Inc.; Sauer-Danfoss Inc.; Teleflex Inc.; Thermo Fisher Scientific Inc.; Thomas & Betts Corp.; Unisys Corp.; and Varian Medical
Systems, Inc.
(2) The 44 companies included in the Company’s New Custom Composite Index are: Actuant Corp.; Affiliated Computer Services, Inc.; Agilent Technologies Inc.;
Ametek, Inc.; Benchmark Electronics, Inc.; Brady Corp.; Cooper Industries plc; Corning Inc.; Crane Co.; Curtiss-Wright Corp.; Deluxe Corp.; Donaldson Company,
Inc.; Dover Corp.; Fiserv, Inc.; Flowserve Corp.; FMC Technologies, Inc.; Goodrich Corp.; Harman International Industries Inc.; Harris Corp.; Hubbell Inc.;
International Game Technology; Itron, Inc.; Lennox International Inc.; ManTech International Corp.; Mettler-Toledo International Inc.; Moog Inc.; NCR Corp.; Pall
Corp.; Pentair, Inc.; PerkinElmer, Inc.; Pitney Bowes Inc.; Rockwell Automation; Rockwell Collins, Inc.; Roper Industries, Inc.; Sauer-Danfoss Inc.; SPX Corp.;
Teledyne Technologies Inc.; Teleflex Inc.; The Brink’s Company; The Timken Company; Thomas & Betts Corp.; Unisys Corp.; Varian Medical Systems, Inc.; and
Waters Corp.
The Custom Composite Index is the same index used by the Compensation Committee of our Board of Directors for purposes
of benchmarking executive pay. Each year the Compensation Committee reviews the index, as companies may merge or be
acquired, liquidated or otherwise disposed of, or may no longer be deemed to adequately represent our peers in the market. The
index was expanded from 28 companies in 2008 to 44 companies in 2009, because the Compensation Committee determined
that the Old Custom Composite Index no longer represented an appropriately sized sampling of peer companies.
17

ITEM 6: SELECTED FINANCIAL DATAThe following table should be read in conjunction with “Part II — Item 7 — Management’s Discussion and Analysis of
Financial Condition and Results of Operations” and “Part II — Item 8 — Financial Statements and Supplementary Data.”
2009 2008 2007 2006 2005
Year ended December 31,
(In millions, except per share data)
Results of operations
Net sales $2,718 $3,082 $2,888 $2,749 $2,437Cost of sales 2,068 2,307 2,212 2,074 1,816
Gross profit 650 775 677 675 621
Income from continuing operations 79 115 105 92 104(Loss) income from discontinued operations, net of tax (47) (19) (58) 19 3
Net income 32 96 47 111 107Less: Net income attributable to noncontrolling interests (6) (7) (7) (6) (5)
Net income attributable to Diebold, Incorporated $ 26 $ 89 $ 40 $ 105 $ 102
Basic earnings per common share:
Income from continuing operations $ 1.10 $ 1.63 $ 1.49 $ 1.29 $ 1.40(Loss) income from discontinued operations (0.71) (0.29) (0.89) 0.28 0.05
Net income $ 0.39 $ 1.34 $ 0.60 $ 1.57 $ 1.45
Diluted earnings per common share:
Income from continuing operations $ 1.09 $ 1.62 $ 1.47 $ 1.27 $ 1.39(Loss) income from discontinued operations (0.70) (0.29) (0.88) 0.28 0.04
Net income $ 0.39 $ 1.33 $ 0.59 $ 1.55 $ 1.43
Number of weighted-average shares outstanding
Basic shares 66 66 66 67 71Diluted shares 67 66 67 67 71Common dividends paid $ 69 $ 67 $ 62 $ 58 $ 58Common dividends paid per share $ 1.04 $ 1.00 $ 0.94 $ 0.86 $ 0.82Consolidated balance sheet data (as of period end)Current assets $1,588 $1,614 $1,594 $1,658 $1,528Current liabilities 743 735 701 746 728Net working capital 845 879 893 912 800Property, plant and equipment, net 205 204 220 208 226Total long-term liabilities 740 838 765 794 550Total assets 2,555 2,538 2,595 2,560 2,341Total equity 1,072 964 1,129 1,020 1,063
18

MANAGEMENT’S DISCUSSION AND ANALYSIS OF FINANCIAL CONDITION AND
RESULTS OF OPERATIONS as of December 31, 2009
(Unaudited)
(dollars in thousands, except per share amounts)
ITEM 7: MANAGEMENT’S DISCUSSION AND ANALYSIS OF FINANCIALCONDITION AND RESULTS OF OPERATIONS
OVERVIEW
The MD&A is provided as a supplement and should be read in conjunction with the consolidated financial statements and
accompanying notes that appear elsewhere in this annual report.
Introduction
Diebold, Incorporated is a global leader in providing integrated self-service delivery and security systems and services
primarily to the financial, commercial, government, and retail markets. Founded in 1859, and celebrating 150 years of innovation in
2009, the Company today has more than 16,000 employees with representation in nearly 90 countries worldwide.
During the past three years, the Company’s management continued to execute against its strategic roadmap developed in
2006 to strengthen operations and build a strong foundation for future success in its two core lines of business: financial self-
service and security solutions. This roadmap was built around five key priorities: increase customer loyalty; improve quality;
strengthen the supply chain; enhance communications and teamwork; and rebuild profitability. Few years have been as
challenging and eventful as 2009 — and fewer still have provided such fundamental opportunities to test the value the Company
offers its customers around the world. During 2009, the economy, financial markets and banking system endured significant
stresses. During this time the Company successfully balanced the need to invest in emerging growth markets with the need to
remain competitive and reduce costs. Looking toward 2010, there are encouraging signs of stabilization and growth in each of the
Company’s major geographic areas. The focus is on capturing this demand and on converting these opportunities into longer-term,
services-driven relationships whenever possible. Also, the Company will continue to focus on remediation of its material
weaknesses related to internal controls over financial reporting. Total costs incurred for remediation efforts were approximately
$3,700 for the year ended December 31, 2009.
Income from continuing operations attributable to Diebold, Incorporated, net of tax, for the year ended December 31, 2009
was $73,102 or $1.09 per share, a decrease of 32 percent and 33 percent, respectively, from the year ended December 31, 2008.
Total revenue for the year ended December 31, 2009 was $2,718,292, a decrease of 12 percent from 2008. Income from
continuing operations attributable to Diebold, Incorporated, net of tax, for the year ended December 31, 2008 was $107,781 or
$1.62 per share, an increase of 10 percent from the year ended December 31, 2007. Total revenue for the year ended
December 31, 2008 was $3,081,838, an increase of 7 percent from 2007.
Vision and strategy
The Company’s vision is, “To be recognized as the essential partner in creating and implementing ideas that optimize
convenience, efficiency and security.” This vision is the guiding principle behind the Company’s transformation to becoming a
more services-oriented company. Today, service comprises more than 50 percent of the Company’s revenue. The Company
expects that this percentage will continue to grow over time as the Company’s integrated services business continues to gain
traction in the marketplace. Financial institutions are eager to reduce costs and optimize management and productivity of their
ATM channels — and they are increasingly exploring outsourced solutions. The Company remains uniquely positioned to provide
the infrastructure necessary to manage all aspects of an ATM network — hardware, software, maintenance, transaction
processing, patch management and cash management — through its integrated product and service offerings. As evidence
of the Company’s success in delivering world-class services for financial institutions’ non-core operations, the Company was
listed among the International Association of Outsourcing ProfessionalsTM 10 best outsourcing providers within the service
industry in the 2009 Global Outsourcing 100TM rankings. In addition to being among the 10 best leaders of outsourcing providers
19

within the service industry, the Company improved its overall position from the 2008 rankings in its third consecutive year on the
list.
Another area of focus within the financial self-service business is broadening the Company’s deposit automation solutions
set, including check imaging, envelope-free currency acceptance, teller automation, and payment and document imaging
solutions. The Company’s ImageWay» check-imaging solution fulfills an industry-wide demand for cutting-edge technologies
that enhance efficiencies. In addition, during 2009 the Company launched its latest innovation in its family of deposit automation
solutions with the newly developed Enhanced Note Acceptor (ENA), a cash accepting device for ATMs. The ENA enables the
deposit of up to 50 mixed-denomination notes in an easy, envelope-free transaction that authenticates and validates deposits,
quickly and accurately. To date, the Company has shipped more than 50,000 deposit automation modules.
Within the security business, the Company is diversifying by expanding and enhancing offerings in its financial, government,
commercial and retail markets. Critical areas of focus include expanding solutions within the financial market beyond traditional
branch equipment and growing integrated/outsourcing services. The Company recently announced an outsourcing agreement
with Delta Community Credit Union, headquartered in Atlanta, Georgia, making the Company the single-source provider for
access control, credential management and monitoring solutions at the credit union. An outsourced security model provides
financial institutions with end-to-end solutions, while reducing costs, improving efficiencies and trimming administrative require-
ments. Additional growth strategies include broadening the Company’s solutions portfolio in fire, energy management, remote
video surveillance, logical security and integrated enterprise systems as well as expanding the distribution model. The Diebold
Advanced Dealer Program was created to engage new distribution channels and will enable leading, pre-certified security dealers
to leverage the Company’s advanced monitoring services. The program will expand the Company’s North American delivery
network at local and regional levels, while enabling select dealers to provide new services to their customers. Authorized dealers
can leverage the Company’s sophisticated monitoring solutions, including Site Sentry» Remote Video Monitoring, Site Sentry»
Remote Video Storage, managed access control and energy management. These solutions will enable end users to enhance
security, reduce workforce demands, increase efficiencies and deliver enterprise-wide return on investment.
During the third quarter of 2009, the Company sold its U.S. election systems business, primarily consisting of its subsidiary
Premier Election Solutions, Inc. (PESI) for $12,147, including $5,000 of cash and contingent consideration with a fair value of
$7,147, which represents 70 percent of any cash collected over a five-year period on the accounts receivable balance of the sold
business as of August 31, 2009. The resulting pre-tax loss on the sale of $50,750 includes $56,566 of net assets of the business,
primarily inventory, and $1,862 of other transactional costs. A few challenges to the sale of the Company’s U.S. election systems
business have arisen. The Company cannot predict the impact, if any, such challenges will have on the sale or the Company’s
results of operations.
Results of operations of the U.S. election systems business are included in loss from discontinued operations, net of tax, in
the Company’s consolidated statements of income. As previously disclosed, the Company closed its enterprise security
operations in the Europe, Middle East and Africa (EMEA) region during the fourth quarter of 2008. Results of operations of
this enterprise security business are also included in loss from discontinued operations, net of tax, in the Company’s consolidated
statements of income. Total loss from discontinued operations, net of tax, for the years ended December 31, 2009, 2008 and 2007
was $47,076, $19,198 and $58,287, respectively.
The focus for 2010 will be to continue striking an appropriate balance between reducing costs and investing in future growth.
The Company will continue to differentiate itself using its total value proposition, particularly as it relates to deposit automation,
enterprise security and services.
20
MANAGEMENT’S DISCUSSION AND ANALYSIS OF FINANCIAL CONDITION AND
RESULTS OF OPERATIONS as of December 31, 2009 (Continued)
(Unaudited)
(dollars in thousands, except per share amounts)

Cost savings initiatives
In 2006, the Company launched the SmartBusiness (SB) 100 initiative to deliver $100,000 in cost savings by the end of 2008.
This key milestone was achieved in November 2008 with significant progress made in areas such as rationalization of product
development, streamlining procurement, realigning the Company’s manufacturing footprint and improving logistics.
In September 2008, the Company announced a new goal to achieve an additional $100,000 in cost savings called SB 200 with
a goal of eliminating $70,000 by the middle of 2010 and the remainder to be eliminated by the end of 2011. In 2009, in the face of a
challenging environment, the Company exceeded its target of $35,000 for 2009 and is on track to deliver on its 2010 savings
target.
Restructuring and other charges
The Company is committed to making the strategic decisions that not only streamline operations, but also enhance its ability
to serve its customers. The Company remains confident in its ability to continue to execute on cost-reduction initiatives, deliver
solutions that help improve customers’ businesses and create shareholder value. In 2009, the Company announced that it is
ending all remaining Opteva ATM manufacturing in its Lexington, North Carolina facility. This will drive more volume and improved
utilization through the Company’s Budapest and Shanghai manufacturing facilities.
Most recently, the Company announced it is realigning the organization and resources to better support opportunities in the
emerging growth markets, resulting in the elimination of approximately 350 full-time jobs from its North America operations and
corporate functions. During the year ended December 31, 2009, the Company incurred restructuring charges of $25,203 or
$0.27 per share. The majority of these charges were related to reductions in the Company’s global workforce, field offices and
warehousing facilities.
Net non-routine expenses of $15,144 or $0.27 per share, $45,145 or $0.54 per share and $7,288 or $0.08 per share impacted
the year ended December 31, 2009, 2008 and 2007, respectively. For the year ended December 31, 2009, the Company incurred
non-routine expenses of $1,467 in legal and other consultation fees related to the government investigations and a $25,000
charge related to an agreement in principle with the staff of the SEC to settle civil charges stemming from the staff’s pending
enforcement inquiry. The agreement in principle with the staff of the SEC remains subject to the final approval of the SEC, and
there can be no assurance that the SEC will accept the terms of the settlement negotiated with the staff. In addition, these
expenses were offset by $11,323 of non-routine income, including $10,616 of reimbursements from the Company’s director and
officer (D&O) insurance carriers related to legal and other expenses incurred as part of the government investigations. The
Company continues to pursue reimbursement of the remaining incurred legal and other expenditures with its D&O insurance
carriers. Non-routine expenses for the year ended December 31, 2008 were primarily from legal, audit and consultation fees
related to the internal review of accounting items, restatement of financial statements, government investigations, as well as
other advisory fees. Non-routine expenses for the year ended December 31, 2007 were primarily related to the internal review of
accounting items related to the 2008 restatement of financial statements.
The following discussion of the Company’s financial condition and results of operations provide information that will assist in
understanding the financial statements and the changes in certain key items in those financial statements.
The business drivers of the Company’s future performance include, but are not limited to:
• timing of a self-service upgrade and/or replacement cycle, including deposit automation in mature markets such as the
United States;
• high levels of deployment growth for new self-service products in emerging markets, such as Asia Pacific;
• demand for new service offerings, including integrated services and outsourcing; and
• demand for security products and services for the financial, commercial, retail and government sectors.
21
MANAGEMENT’S DISCUSSION AND ANALYSIS OF FINANCIAL CONDITION AND
RESULTS OF OPERATIONS as of December 31, 2009 (Continued)
(Unaudited)
(dollars in thousands, except per share amounts)

The table below presents the changes in comparative financial data for the years ended December 31, 2009, 2008 and 2007.
Comments on significant year-to-year fluctuations follow the table. The following discussion should be read in conjunction with
the consolidated financial statements and the accompanying notes that appear elsewhere in this annual report.
Dollars% of
Net Sales%
Change Dollars% of
Net Sales%
Change Dollars% of
Net Sales
2009 2008 2007
Year Ended December 31,
Net sales
Products $1,238,346 45.6 (18.1) $1,511,856 49.1 7.9 $1,401,374 48.5Services 1,479,946 54.4 (5.7) 1,569,982 50.9 5.6 1,486,977 51.5
2,718,292 100.0 (11.8) 3,081,838 100.0 6.7 2,888,351 100.0
Cost of sales
Products 944,090 34.7 (14.1) 1,098,633 35.6 6.4 1,032,264 35.7Services 1,124,202 41.4 (7.0) 1,208,328 39.2 2.5 1,179,267 40.8
2,068,292 76.1 (10.3) 2,306,961 74.9 4.3 2,211,531 76.6
Gross profit 650,000 23.9 (16.1) 774,877 25.1 14.5 676,820 23.4Selling and administrative expenses 424,875 15.6 (17.4) 514,154 16.7 12.6 456,479 15.8Research, development and
engineering expense 72,026 2.6 (1.4) 73,034 2.4 8.9 67,081 2.3Impairment of assets 2,500 0.1 (42.9) 4,376 0.1 N/A — —Loss (gain) on sale of assets, net 7 — (98.3) 403 — N/M (6,392) (0.2)
499,408 18.4 (15.6) 591,967 19.2 14.5 517,168 17.9Operating profit 150,592 5.5 (17.7) 182,910 5.9 14.6 159,652 5.5Other expense, net (26,785) (1.0) 0.7 (26,593) (0.9) 90.0 (13,999) (0.5)
Income from continuing operationsbefore taxes 123,807 4.6 (20.8) 156,317 5.1 7.3 145,653 5.0
Taxes on income 44,477 1.6 7.2 41,496 1.3 2.7 40,414 1.4
Income from continuing operations 79,330 2.9 (30.9) 114,821 3.7 9.1 105,239 3.6Loss from discontinued operations,
net of tax (9,884) (0.4) (48.5) (19,198) (0.6) (67.1) (58,287) (2.0)Loss on sale of discontinued
operations, net of tax (37,192) (1.4) N/A — — N/A — —
Net income 32,254 1.2 (66.3) 95,623 3.1 103.7 46,952 1.6Less: Net income attributable to
noncontrolling interests (6,228) (0.2) (11.5) (7,040) (0.2) (5.0) (7,411) (0.3)
Net income attributable to Diebold,
Incorporated $ 26,026 1.0 (70.6) $ 88,583 2.9 124.0 $ 39,541 1.4
Amounts attributable to Diebold,
Incorporated
Income from continuing operations,net of tax $ 73,102 2.7 $ 107,781 3.5 $ 97,828 3.4
Loss from discontinued operations,net of tax (47,076) (1.7) (19,198) (0.6) (58,287) (2.0)
Net income attributable to Diebold,
Incorporated $ 26,026 1.0 $ 88,583 2.9 $ 39,541 1.4
22
MANAGEMENT’S DISCUSSION AND ANALYSIS OF FINANCIAL CONDITION AND
RESULTS OF OPERATIONS as of December 31, 2009 (Continued)
(Unaudited)
(dollars in thousands, except per share amounts)

RESULTS OF OPERATIONS
2009 comparison with 2008
Net Sales
The following table represents information regarding our net sales:
2009 2008 $ Change % Change
Year endedDecember 31,
Net sales $2,718,292 $3,081,838 $(363,546) (11.8)
Financial self-service sales in 2009 decreased by $171,420 or 7.7 percent compared to 2008. The decrease in financial self-
service sales included a net negative currency impact of $42,668, of which approximately 43 percent and 34 percent related to
European currencies and Brazilian real, respectively. The Americas decreased $58,058 or 4.1 percent largely due to spend
reductions in the U.S. regional bank segment as well as unfavorable currency impact in Brazil. EMEA decreased $123,159 or
26.3 percent from 2008 driven predominantly by decreased volume in the Company’s distributor business as poor economic
conditions persist. Asia Pacific increased $9,797 or 2.8 percent due to strong performance in India, partially offset by a decrease in
China related to 2008 Summer Olympic sales that did not recur in 2009.
Security solutions sales in 2009 decreased by $131,813 or 17.0 percent compared to 2008. The Americas decreased
$107,965 or 14.8 percent due to weakness in the North American banking segment, related to lack of new branch construction.
Market weakness in the commercial and government segments also contributed to the overall decrease in security solutions
sales. Asia Pacific decreased $23,236 or 50.9 percent from 2008 due to projects in Australia in 2008 that did not recur in 2009.
There were no election systems sales in 2009 compared to $61,558 of Brazilian-based sales in 2008. This business has
historically been cyclical, recurring every other year. The Brazilian lottery systems sales increased $1,245 in 2009 compared to
2008.
Gross Profit
The following table represents information regarding our gross profit:
2009 2008$ Change/
% Point Change % Change
Year endedDecember 31,
Gross profit — products 294,256 413,223 (118,967) (28.8)
Gross profit — services 355,744 361,654 (5,910) (1.6)
Total gross profit $650,000 $774,877 $(124,877) (16.1)
Gross profit margin 23.9% 25.1% (1.2)
Product gross margin was 23.8 percent in 2009 compared to 27.3 percent in 2008. Benefits realized from the Company’s cost
savings initiatives in 2009 were more than offset by unfavorable sales mix within North America, sales weakness in Europe and no
Brazilian-based election systems sales in 2009. The unfavorable sales mix within North America was driven by a significant
reduction in U.S. regional bank sales with a smaller deterioration in U.S. national bank sales. Product gross margin was also
adversely affected by the lower volumes in the Company’s distributor business in EMEA, as well as unfavorable absorption in the
23
MANAGEMENT’S DISCUSSION AND ANALYSIS OF FINANCIAL CONDITION AND
RESULTS OF OPERATIONS as of December 31, 2009 (Continued)
(Unaudited)
(dollars in thousands, except per share amounts)

Hungary manufacturing plant due to lower production volume. Additionally, product gross margin included $5,348 and $15,936 of
restructuring charges in 2009 and 2008, respectively, related to manufacturing realignment.
Service gross margin was 24.0 percent in 2009 compared to 23.0 percent in 2008. The year-over-year improvement in service
margin was driven by lower fuel prices and continued productivity gains in the United States as well as increased sales in Asia
Pacific and favorable currency impact in Latin America. These improvements were partially offset by higher scrap expense in
North America. Restructuring charges included in service cost of sales were $7,488 in 2009 and $9,663 in 2008.
Operating Expenses
The following table represents information regarding our operating expenses:
2009 2008 $ Change % Change
Year endedDecember 31,
Selling and administrative expense $424,875 $514,154 $(89,279) (17.4)
Research, development, and engineering expense 72,026 73,034 (1,008) (1.4)
Impairment of assets 2,500 4,376 (1,876) (42.9)
Loss on sale of assets, net 7 403 (396) (98.3)
Total operating expenses $499,408 $591,967 $(92,559) (15.6)
Selling and administrative expense decreased in 2009 due to lower net non-routine expenses and impairment charges, non-
routine income, continued focus on cost reduction initiatives, declines in sales contributing to lower commission and strength-
ening of the U.S. dollar. Selling and administrative expense in 2009 included $11,323 of non-routine income, including $10,616 of
reimbursements from the Company’s D&O insurance carriers related to legal and other expenses incurred as part of the SEC and
DOJ investigations (government investigations) and non-routine expenses of $1,467 which consisted of legal, audit and
consultation fees primarily related to the internal review of other accounting items, restatement of financial statements and
the ongoing government investigations compared to $45,145 of non-routine expenses and impairment charges in 2008. Included
in the non-routine expenses for 2008 was a $13,500 financial advisor fee as a result of the withdrawal of the unsolicited takeover
bid from United Technologies Corp. In addition, selling and administrative expense included $10,276 of restructuring charges in
2009 compared to $11,265 of restructuring charges in 2008.
Research, development, and engineering expense as a percent of net sales in 2009 and 2008 was 2.6 and 2.4 percent,
respectively. The increase as a percent of net sales was due to lower sales volume in 2009. Restructuring charges related to
product development rationalization of $2,091 were included in research, development, and engineering expense for 2009 as
compared to $3,649 of restructuring charges in 2008.
An impairment charge of $2,500 was incurred in 2009 related to the discontinuation of the brand name Firstline, Incorporated.
The Company also incurred a charge of $4,376 in 2008 related to the write-down of intangible assets from the 2004 acquisition of
TFE Technology.
24
MANAGEMENT’S DISCUSSION AND ANALYSIS OF FINANCIAL CONDITION AND
RESULTS OF OPERATIONS as of December 31, 2009 (Continued)
(Unaudited)
(dollars in thousands, except per share amounts)

Operating Profit
The following table represents information regarding our operating profit:
2009 2008
$ Change/% Point Change % Change
Year endedDecember 31,
Operating profit $150,592 $182,910 $(32,318) (17.7)
Operating profit margin 5.5% 5.9% (0.4)
The decrease in operating profit resulted from lower gross profit related to lower product revenue volume and unfavorable
customer sales mix within North America and EMEA. This was partially offset by lower operating expense in 2009 resulting from
lower non-routine expenses, continued focus on cost reduction initiatives, and strengthening of the U.S. dollar.
Other Income (Expense)
The following table represents information regarding our other income (expense):
2009 2008$ Change/
% Point Change % Change
Year endedDecember 31,
Investment income $ 29,016 $ 25,218 $ 3,798 15.1
Interest expense (35,452) (45,367) 9,915 (21.9)
Foreign exchange loss, net (922) (8,785) 7,863 (89.5)
Miscellaneous, net (19,427) 2,341 (21,768) N/M
Other income (expense) $(26,785) $(26,593) $ (192) 0.7
Percentage of net sales (1.0) (0.9) (0.1)
Investment income in 2009 included a gain of $2,225 on assets held in a rabbi trust under a deferred compensation
arrangement. The change in interest expense was due to lower interest rates and a lower overall average debt balance in 2009.
The change in foreign exchange loss, net was primarily due to the Company hedging more of its foreign currency exposure in 2009
compared to 2008. The change in miscellaneous, net between years was due to a charge of $25,000 in 2009 as the Company
reached an agreement in principle with the staff of the SEC to settle the civil charges stemming from the staff’s pending
enforcement inquiry. The agreement in principle with the staff of the SEC remains subject to the final approval of the SEC, and
there can be no assurance that the SEC will accept the terms of the settlement negotiated with the staff.
Income from Continuing Operations
The following table represents information regarding our income from continuing operations:
2009 2008$ Change/
% Point Change % Change
Year endedDecember 31,
Income from continuing operations $79,330 $114,821 $(35,491) (30.9)
Percent of net sales 2.9 3.7 (0.8)
Effective tax rate 35.9% 26.5% 9.4
25
MANAGEMENT’S DISCUSSION AND ANALYSIS OF FINANCIAL CONDITION AND
RESULTS OF OPERATIONS as of December 31, 2009 (Continued)
(Unaudited)
(dollars in thousands, except per share amounts)

The decrease in net income from continuing operations was related to lower gross profit and an unfavorable change in the
effective tax rate, partially offset by lower operating expenses. The 9.4 percent increase in the effective tax rate for 2009 was
primarily attributable to: out-of-period adjustments totaling approximately $9,000, the non-deductible SEC charge and an increase
in a deferred tax asset valuation allowance related to the Company’s operations in Brazil offset by changes in mix of income from
various tax jurisdictions. Refer to Note 1 to the consolidated financial statements for details related to the out-of-period
adjustments which the Company determined were immaterial in all prior interim and annual periods and to 2009 results.
Loss from Discontinued Operations
The following table represents information regarding our loss from discontinued operations:
2009 2008$ Change/
% Point Change % Change
Year endedDecember 31,
Loss from discontinued operations, net of tax $(47,076) $(19,198) $(27,878) N/M
Percent of net sales (1.7) (0.6) (1.1)
The 2009 sale of the U.S. elections systems business resulted in a loss, net of tax, of $37,192. Losses from discontinued
operations, net of tax were $9,884 and $19,198 in 2009 and 2008, respectively. Included in the 2008 discontinued operations was
a non-cash pre-tax asset impairment charge of $16,658 related to the discontinuance of the Company’s EMEA-based enterprise
security business.
Net Income Attributable to Diebold, Incorporated
The following table represents information regarding our net income:
2009 2008$ Change/
% Point Change % Change
Year endedDecember 31,
Net income attributable to Diebold, Incorporated $26,026 $88,583 $(62,557) (70.6)
Percent of net sales 1.0 2.9 (1.9)
Based on the results from continuing and discontinued operations discussed above, the Company reported net income
attributable to Diebold, Incorporated of $26,026 and $88,583 for the years ended December 31, 2009 and 2008, respectively.
Segment Revenue and Operating Profit Summary
DNA net sales of $1,382,461 for 2009 decreased $153,530 or 10.0 percent compared to 2008. The decrease in DNA net sales
was due to decreased volume in the regional product business, as well as security solutions product and service offerings. DI net
sales of $1,330,278 for 2009 decreased by $149,703 or 10.1 percent compared to 2008. The decrease in DI net sales was due to
lower volume across most operating units, led by reductions of $123,771 in EMEA and $22,420 in Latin America. ES & Other net
sales of $5,553 for 2009 decreased $60,313 or 91.6 percent compared to 2008. The decrease was due to a lack of Brazilian voting
revenue in 2009, due to its cyclical nature, compared to $61,558 in 2008. Revenue from lottery systems was $5,553 for 2009, an
increase of $1,245 compared to 2008.
DNA operating profit for 2009 decreased by $24,885 or 28.0 percent compared to 2008. Operating profit was unfavorably
affected by revenue mix between the regional and national accounts within the product business, as well as unfavorable security
performance. This was partially offset by higher service profitability and the company’s ongoing cost reduction efforts. DI
26
MANAGEMENT’S DISCUSSION AND ANALYSIS OF FINANCIAL CONDITION AND
RESULTS OF OPERATIONS as of December 31, 2009 (Continued)
(Unaudited)
(dollars in thousands, except per share amounts)

operating profit for 2009 increased by $3,951 or 4.9 percent compared to 2008. The increase was due to decreases in
restructuring expense and higher service margin performance, partially offset by lower revenue volume. Operating profit for
ES & Other decreased by $11,384 or 85.3 percent compared to 2008 as a result of lower revenue in the Brazilian election systems
business.
Refer to note 19 to the consolidated financial statements for further details of segment revenue and operating profit.
2008 comparison with 2007
Net Sales
The following table represents information regarding our net sales:
2008 2007 $ Change % Change
Year endedDecember 31,
Net sales $3,081,838 $2,888,351 $193,487 6.7
Financial self-service sales in 2008 increased by $169,456 or 8.2 percent compared to 2007. The increase in financial self-
service sales included a net positive currency impact of $47,702, of which approximately 52 and 24 percent related to the Brazilian
real and European currencies, respectively. The Americas increased $125,052 or 9.7 percent due to increased sales in Brazil of
$90,300 related to several large orders and also positive currency impact. EMEA decreased $23,822 or 4.8 percent due to
decreased volume in the Company’s distributor business and France, partially offset by an increase in Belgium. Asia Pacific
increased $68,226 or 23.8 percent due to higher sales volume, with approximately two-thirds of the total growth coming from
China along with additional contributions from India and Thailand.
Security solutions sales in 2008 decreased by $37,262 or 4.6 percent compared to 2007. The Americas decreased $31,164 or
4.1 percent due to weakness in the North American banking segment and reduced spending by major customers in the retail
markets. Government and commercial security businesses, in total, were up slightly in 2008 compared to 2007.
There was $61,558 of Brazilian-based election systems sales in 2008 compared to none in 2007. This business has historically
been cyclical, recurring every other year. The Brazilian lottery systems revenue decreased $265 in 2008 compared to 2007.
Gross Profit
The following table represents information regarding our gross profit:
2008 2007$ Change/
% Point Change % Change
Year endedDecember 31,
Gross profit — products 413,223 369,110 44,113 12.0
Gross profit — services 361,654 307,710 53,944 17.5
Total gross profit $774,877 $676,820 $98,057 14.5
Gross profit margin 25.1% 23.4% 1.7
Product gross margin was 27.3 percent in 2008 compared to 26.3 percent in 2007. Product gross margin included
restructuring charges of $15,936 and $27,349 in 2008 and 2007, respectively. The 2007 restructuring charges were primarily
related to the closure of the manufacturing plant in Cassis, France. In addition, product gross margin in 2008 was positively
affected by the Brazilian election systems business and benefits realized from cost savings initiatives. This favorability was
27
MANAGEMENT’S DISCUSSION AND ANALYSIS OF FINANCIAL CONDITION AND
RESULTS OF OPERATIONS as of December 31, 2009 (Continued)
(Unaudited)
(dollars in thousands, except per share amounts)

partially offset by unfavorable sales mix within North America, higher steel and commodity costs, and price erosion in certain
international markets.
Service gross margin for 2008 was 23.0 percent compared with 20.7 percent for 2007. Service gross margin was adversely
affected by $9,663 of restructuring charges in 2008 and $1,319 in 2007. Despite increased restructuring charges and significant
year-over-year increases in fuel costs, service gross margin reflects savings from our cost savings initiatives, productivity and
efficiency gains, and improved product quality.
Operating Expenses
The following table represents information regarding our operating expenses:
2008 2007 $ Change % Change
Year endedDecember 31,
Selling and administrative expense $514,154 $456,479 $57,675 12.6
Research, development, and engineering expense 73,034 67,081 5,953 8.9
Impairment of assets 4,376 — 4,376 N/A
(Gain) loss on sale of assets, net 403 (6,392) 6,795 N/M
Total operating expenses $591,967 $517,168 $74,799 14.5
Selling and administrative expense was adversely impacted by $11,265 of restructuring charges in 2008 compared to $1,299
of restructuring charges in 2007. In addition, selling and administrative expenses were adversely affected by non-routine
expenses of $45,145 in 2008 and $7,288 in 2007. These non-routine expenses consisted of legal, audit and consultation fees,
primarily related to the internal review of other accounting items, restatement of financial statements and the ongoing
government investigations and related advisory fees. Included in the non-routine expenses for 2008 was a $13,500 financial
advisor fee as a result of the withdrawal of the unsolicited takeover bid from United Technologies Corp. Selling and administrative
expense in 2008 was also unfavorably impacted by a weakening of the U.S. dollar.
Research, development and engineering expense as a percent of net sales in 2008 and 2007 was 2.4 and 2.3 percent,
respectively. Restructuring charges of $63 were included in research, development and engineering expense for 2007 as
compared to $3,649 of restructuring charges in 2008 related to product development rationalization.
In 2008, the Company incurred a charge of $4,376 for the impairment of intangible assets related to the 2004 acquisition of
TFE Technology, a maintenance provider of network and hardware service solutions to federal and state government agencies and
commercial firms.
The gain on sale of assets, net in 2007 was primarily related to a $6,438 gain on the sale of the Company’s manufacturing
facility in Cassis, France, associated with restructuring initiatives.
28
MANAGEMENT’S DISCUSSION AND ANALYSIS OF FINANCIAL CONDITION AND
RESULTS OF OPERATIONS as of December 31, 2009 (Continued)
(Unaudited)
(dollars in thousands, except per share amounts)

Operating Profit
The following table represents information regarding our operating profit:
2008 2007$ Change/
% Point Change % Change
Year endedDecember 31,
Operating profit $182,910 $159,652 $23,258 14.6
Operating profit margin 5.9% 5.5% 0.4
The increase in operating profit resulted from the Brazilian election systems business as well as higher revenue and
profitability in the U.S. and international service markets. This was partially offset by the increase in non-routine expenses as well
as higher restructuring charges.
Other Income (Expense)
The following table represents information regarding our other income (expense):
2008 2007$ Change/
% Point Change % Change
Year endedDecember 31,
Investment income $ 25,218 $ 22,489 $ 2,729 12.1
Interest expense (45,367) (41,320) (4,047) 9.8
Foreign exchange (loss) gain, net (8,785) 1,326 (10,111) N/M
Miscellaneous, net 2,341 3,506 (1,165) (33.2)
Other income (expense) $(26,593) $(13,999) $(12,594) 90.0
Percentage of net sales (0.9) (0.5) (0.4)
The change in other income (expense) between years was due to moving from a foreign exchange gain in 2007 of $1,326 to a
foreign exchange loss in 2008 of $8,785. The change in foreign exchange (loss) gain, net was primarily due to the Company
hedging less of its foreign currency exposure in 2008 compared to 2007.
Income from Continuing Operations
The following table represents information regarding our income from continuing operations:
2008 2007$ Change/
% Point Change % Change
Year endedDecember 31,
Income from continuing operations $114,821 $105,239 $9,582 9.1
Percent of net sales 3.7 3.6 0.1
Effective tax rate 26.5% 27.7% (1.2)
The increase in income from continuing operations was related to the Brazilian election systems business as well as higher
revenue and profitability in the U.S. and international service markets. This was partially offset by the increase in non-routine
29
MANAGEMENT’S DISCUSSION AND ANALYSIS OF FINANCIAL CONDITION AND
RESULTS OF OPERATIONS as of December 31, 2009 (Continued)
(Unaudited)
(dollars in thousands, except per share amounts)

expenses, higher restructuring charges, and an unfavorable change in foreign exchange gain (loss) between years within other
income (expense).
Loss from Discontinued Operations
The following table represents information regarding our loss from discontinued operations:
2008 2007$ Change/
% Point Change % Change
Year endedDecember 31,
Loss from discontinued operations, net of tax $(19,198) $(58,287) $39,089 (67.1)
Percent of net sales (0.6) (2.0) 1.4
Discontinued operations in the EMEA-based enterprise security business negatively impacted net income. This business was
not achieving an acceptable level of profitability and therefore, the operations were closed entirely. Included in the 2008
discontinued operations was a non-cash pre-tax asset impairment charge of $16,658 related to the discontinuance of the
Company’s EMEA-based enterprise security business. As disclosed in September 2009, the company sold its U.S. elections
systems business, which is considered part of discontinued operations and included a pre-tax goodwill impairment for PESI of
$46,319 in 2007.
Net Income Attributable to Diebold, Incorporated
The following table represents information regarding our net income:
2008 2007$ Change/
% Point Change % Change
Year endedDecember 31,
Net income attributable to Diebold, Incorporated $88,583 $39,541 $49,042 124.0
Percent of net sales 2.9 1.4 1.5
Based on the results from continuing and discontinued operations discussed above, the Company reported net income
attributable to Diebold, Incorporated of $88,583 and $39,541 for the years ended December 31, 2008 and 2007.
Segment Revenue and Operating Profit Summary
DNA net sales of $1,535,991 for 2008 decreased $7,059 or 0.5 percent compared to 2007. The decrease in DNA net sales
was due to decreased volume from the security solutions product and service offerings. DI net sales of $1,479,981 for 2008
increased by $139,253 or 10.4 percent compared to 2007. The increase in DI net sales was due to growth across most
international markets, led by $90,300 in Brazil and $62,714 in Asia Pacific. ES & Other net sales of $65,866 for 2008 increased
$61,293 compared to 2007. The increase was due to higher Brazilian voting revenue of $61,558. Revenue from lottery systems
was $4,308 for 2008, a decrease of $265 compared to 2007.
DNA operating profit for 2008 decreased by $21,449 or 19.5 percent compared to 2007. Operating profit was unfavorably
affected by higher non-routine expenses, workforce optimization restructuring charges, and increased commodity costs. This
was partially offset by higher service profitability and benefits realized from the Company’s ongoing cost reduction efforts. DI
operating profit for 2008 increased by $33,550 or 71.0 percent compared to 2007. The increase was due to higher volume in Brazil
and China as a result of several large orders. Operating profit for ES & Other increased by $11,157 moving from operating profit of
$2,189 in 2007 to an operating profit of $13,346 in 2008.
30
MANAGEMENT’S DISCUSSION AND ANALYSIS OF FINANCIAL CONDITION AND
RESULTS OF OPERATIONS as of December 31, 2009 (Continued)
(Unaudited)
(dollars in thousands, except per share amounts)

Refer to note 19 to the consolidated financial statements for further details of segment revenue and operating profit.
LIQUIDITY AND CAPITAL RESOURCES
Capital resources are obtained from income retained in the business, borrowings under the Company’s senior notes,
committed and uncommitted credit facilities, long-term industrial revenue bonds, and operating and capital leasing arrangements.
Refer to notes 10 and 11 to the consolidated financial statements regarding information on outstanding and available credit
facilities, senior notes and bonds. Management expects that the Company’s capital resources will be sufficient to finance planned
working capital needs, research and development activities, investments in facilities or equipment, pension contributions, and the
purchase of the Company’s shares for at least the next 12 months. A substantial portion of cash and cash equivalents and short-
term investments reside in international tax jurisdictions. Repatriation of these funds could be negatively impacted by potential
foreign and domestic taxes. Part of the Company’s growth strategy is to pursue strategic acquisitions. The Company has made
acquisitions in the past and intends to make acquisitions in the future. The Company intends to finance any future acquisitions with
either cash and short-term investments, cash provided from operations, borrowings under available credit facilities, proceeds
from debt or equity offerings and/or the issuance of common shares.
The following table summarizes the results of our consolidated statement of cash flows:
2009 2008 2007
Year ended December 31,
Net cash flow provided (used) by:
Operating activities $ 299,338 $ 284,691 $ 150,260
Investing activities (93,234) (142,484) (80,370)
Financing activities (130,988) (87,689) (135,276)
Effect of exchange rate changes on cash and cash equivalents 11,874 (19,416) 17,752
Net increase (decrease) in cash and cash equivalents $ 86,990 $ 35,102 $ (47,634)
During 2009, the Company generated $299,338 in cash from operating activities, an increase of $14,647 or 5.1 percent from
2008. Cash flows from operating activities are generated primarily from operating income and managing the components of
working capital. Cash flows from operating activities during the year ended December 31, 2009 were positively affected by
changes in trade receivables, inventories, other current assets and deferred revenue partially offset by a $35,491 decrease in
income from continuing operations, changes in accounts payable and certain other assets and liabilities.
Net cash used for investing activities was $93,234 in 2009, a decrease of $49,250 from $142,484 in 2008. The decrease was
primarily due to a $33,171 decrease in net payments for purchases of investments. The Company’s capital expenditures
decreased by $13,645 in 2009 compared to 2008, largely due to investments in information technology systems during 2008
which did not recur at the same level in 2009. In addition, the Company received cash proceeds from sale of discontinued
operations of $9,908 in 2009. These activities were partially offset by an increase of $6,642 in certain other assets, primarily
related to continued investment in software that enables the Company to deliver self-service and security technologies to its
customers.
Net cash used for financing activities was $130,988 in 2009, an increase of $43,299 from $87,689 in 2008. The increase was
primarily due to a $39,146 increase in net repayments of notes payable.
31
MANAGEMENT’S DISCUSSION AND ANALYSIS OF FINANCIAL CONDITION AND
RESULTS OF OPERATIONS as of December 31, 2009 (Continued)
(Unaudited)
(dollars in thousands, except per share amounts)

Dividends
The Company paid dividends of $69,451, $66,563 and $62,442 in the years ended December 31, 2009, 2008 and 2007
respectively. Annualized dividends per share were $1.04, $1.00 and $0.94 for the years ended December 31, 2009, 2008 and
2007, respectively. The Company declared a first-quarter 2010 cash dividend of $0.27 per share. The new cash dividend, which
represents $1.08 per share on an annual basis, is an increase of 3.8 percent over the cash dividend paid in 2009 and marks the
Company’s 57th consecutive annual increase.
Contractual Obligations and Off-Balance Sheet Arrangements
The following table summarizes the Company’s approximate obligations and commitments to make future payments under
contractual obligations as of December 31, 2009:
TotalLess than
1 year 1-3 years 3-5 yearsMore than
5 years
Payment due by period
Operating lease obligations $227,614 $ 56,429 $ 96,330 $ 47,761 $ 27,094
Industrial development revenue bonds 11,900 — — — 11,900
Notes payable 556,915 16,915 240,000 75,000 225,000
Interest on bonds and notes payable(1) 137,510 25,240 51,589 32,204 28,477
Purchase commitments 13,441 12,883 558 — —
$947,380 $111,467 $388,477 $154,965 $292,471
(1) Amounts represent estimated contractual interest payments on outstanding bonds and notes payable. Rates in effect as of December 31, 2009 are used for
variable rate debt.
The Company also has uncertain tax positions of $10,116, for which there is a high degree of uncertainty as to the expected
timing of payments (refer to note 4 to the consolidated financial statements).
The Company expects to contribute $14,767 to its pension plans in the year ending December 31, 2010.
In October 2009, the Company entered into a three-year credit facility, which replaced the existing credit facility. As of
December 31, 2009, the Company had borrowing limits totaling $507,463 ($400,000 and c75,000, translated) under this facility.
Under the terms of the credit facility agreement, the Company has the ability, subject to various approvals, to increase the
borrowing limits by $200,000 and c37,500. Up to $30,000 and c15,000 of the revolving credit facility is available under a swing line
subfacility. The Company incurred $4,539 of fees to its creditors in conjunction with the credit facility which will be amortized as a
component of interest expense over the term of the facility.
In March 2006, the Company issued senior notes in an aggregate principal amount of $300,000 with a weighted-average fixed
interest rate of 5.50 percent. The maturity dates of the senior notes are staggered, with $75,000, $175,000 and $50,000 becoming
due in 2013, 2016 and 2018, respectively. Additionally, the Company entered into a derivative transaction to hedge interest rate
risk on $200,000 of the senior notes, which was treated as a cash flow hedge. This reduced the effective interest rate by 14 basis
points from 5.50 to 5.36 percent.
The Company’s financing agreements contain various restrictive financial covenants, including net debt to capitalization and
net interest coverage ratios. As of December 31, 2009, the Company was in compliance with the financial covenants in its debt
agreements.
The Company does not participate in transactions that facilitate off-balance sheet arrangements.
32
MANAGEMENT’S DISCUSSION AND ANALYSIS OF FINANCIAL CONDITION AND
RESULTS OF OPERATIONS as of December 31, 2009 (Continued)
(Unaudited)
(dollars in thousands, except per share amounts)

CRITICAL ACCOUNTING POLICIES AND ESTIMATES
Management’s discussion and analysis of the Company’s financial condition and results of operations are based upon the
Company’s consolidated financial statements. The consolidated financial statements of the Company are prepared in conformity
with accounting principles generally accepted in the United States of America. The preparation of the accompanying consolidated
financial statements in conformity with accounting principles generally accepted in the United States of America requires
management to make estimates and assumptions about future events. These estimates and the underlying assumptions affect
the amounts of assets and liabilities reported, disclosures about contingent assets and liabilities and reported amounts of
revenues and expenses. Such estimates include the value of purchase consideration, valuation of trade receivables, inventories,
goodwill, intangible assets, other long-lived assets, legal contingencies, guarantee obligations, indemnifications and assumptions
used in the calculation of income taxes, pension and postretirement benefits and customer incentives, among others. These
estimates and assumptions are based on management’s best estimates and judgment. Management evaluates its estimates and
assumptions on an ongoing basis using historical experience and other factors, including the current economic difficulties in the
United States credit markets and the global markets. Management monitors the economic conditions and other factors and will
adjust such estimates and assumptions when facts and circumstances dictate. Illiquid credit markets, volatile foreign currency
and equity, and declines in the global economic environment have combined to increase the uncertainty inherent in such
estimates and assumptions. As future events and their effects cannot be determined with precision, actual results could differ
significantly from these estimates. Changes in those estimates resulting from continuing changes in the economic environment
will be reflected in the financial statements in future periods.
The Company’s significant accounting policies are described in note 1 to the consolidated financial statements. Management
believes that, of its significant accounting policies, its policies concerning revenue recognition, allowances for doubtful accounts,
inventories, goodwill, and pensions and postretirement benefits are the most critical because they are affected significantly by
judgments, assumptions and estimates. Additional information regarding these policies is included below.
Revenue Recognition The Company’s revenue recognition policy is consistent with the requirements of the Financial
Accounting Standards Board (FASB) Accounting Standards Codification (ASC) 985-605, Software — Revenue Recognition
(ASC 985-605) and FASB ASC 605, Revenue Recognition (ASC 605). In general, the Company records revenue when it is
realized, or realizable and earned. The Company considers revenue to be realized, or realizable and earned, when the following
revenue recognition requirements are met: persuasive evidence of an arrangement exists, which is a customer contract; the
products or services have been accepted by the customer via delivery or installation acceptance; the sales price is fixed or
determinable within the contract; and collectability is probable.
For product sales, the Company determines that the earnings process is complete when title, risk of loss and the right to use
equipment has transferred to the customer. Within the North America business segment, this occurs upon customer acceptance.
Where the Company is contractually responsible for installation, customer acceptance occurs upon completion of the installation
of all items at a job site and the Company’s demonstration that the items are in operable condition. Where items are contractually
only delivered to a customer, revenue recognition of these items is upon shipment or delivery to a customer location depending on
the terms in the contract. Within the International business segment, customer acceptance is upon the earlier of delivery or
completion of the installation depending on the terms in the contract with the customer. The Company has the following revenue
streams related to sales to its customers:
Self-Service Product & Service Revenue Self-service products pertain to ATMs. Included within the ATM is software,
which operates the ATM. The related software is considered more than incidental to the equipment as a whole. Revenue is
recognized in accordance with ASC 985-605 the application of which requires judgment, including the determination of whether a
software arrangement includes multiple elements. The Company also provides service contracts on ATMs. Service contracts
33
MANAGEMENT’S DISCUSSION AND ANALYSIS OF FINANCIAL CONDITION AND
RESULTS OF OPERATIONS as of December 31, 2009 (Continued)
(Unaudited)
(dollars in thousands, except per share amounts)

typically cover a 12-month period and can begin at any given month during the year after the standard warranty period expires. The
service provided under warranty is significantly limited as compared to those offered under service contracts. Further, warranty is
not considered a separate element of the sale. The Company’s warranty covers only replacement of parts inclusive of labor.
Service contracts are tailored to meet the individual needs of each customer. Service contracts provide additional services beyond
those covered under the warranty, and usually include preventative maintenance service, cleaning, supplies stocking and cash
handling, all of which are not essential to the functionality of the equipment. For sales of service contracts, where the service
contract is the only element of the sale, revenue is recognized ratably over the life of the contract period. In contracts that involve
multiple-element arrangements, amounts deferred for services are determined based upon vendor specific objective evidence of
the fair value of the elements as prescribed in ASC 985-605. The Company determines fair value of deliverables within a multiple-
element arrangement based on the price charged when each element is sold separately or stated renewal prices. Changes to the
elements in an arrangement that includes software and the ability to establish vendor specific objective evidence could materially
impact the amount of earned or deferred revenue. There have been no material changes to these estimates for the periods
presented and the Company believes that these estimates generally should be not subject to significant changes in the future.
Physical Security & Facility Revenue The Company’s Physical Security and Facility Products division design and man-
ufacture several of the Company’s financial service solutions offerings, including the RemoteTellerTM System (RTS). The business
unit also develops vaults, safe deposit boxes and safes, drive-up banking equipment and a host of other banking facilities products.
Revenue on sales of the products described above is recognized when the four revenue recognition requirements of ASC 605
have been met.
Election Systems Revenue The Company, through its wholly-owned subsidiary, Procomp Industria Eletronica LTDA, offers
elections systems product solutions and support to the government in Brazil. Election systems revenue consists of election
equipment, networking, tabulation and diagnostic software development, training, support and maintenance. The election
equipment components are included in product revenue. The software development, training, support and maintenance
components are included in service revenue. The election systems contracts can contain multiple elements and custom terms
and conditions. In contracts that involve multiple-elements, amounts deferred for services are based upon the fair value of the
elements as prescribed in FASB ASC 605-25 Revenue Recognition — Multiple-Element Arrangements (ASC 605-25), which
requires judgment about as to whether the deliverables can be divided into more than one unit of accounting and whether the
separate units of accounting have value to the customer on a stand-alone basis. Changes to these elements could affect the
timing of revenue recognition. There have been no material changes to these elements for the periods presented.
Integrated Security Solutions Revenue Diebold Integrated Security Solutions provides global sales, service, installation,
project management and monitoring of original equipment manufacturer (OEM) electronic security products to financial,
government, retail and commercial customers. These solutions provide the Company’s customers a single-source solution to
their electronic security needs. Revenue is recognized in accordance with ASC 605. Revenue on sales of the products described
above is recognized upon shipment, installation or customer acceptance of the product as defined in the customer contract. In
contracts that involve multiple-elements, amounts deferred for services are based upon the fair value of the elements as
prescribed in ASC 605-25, which requires judgment about as to whether the deliverables can be divided into more than one unit of
accounting and whether the separate units of accounting have value to the customer on a stand-alone basis. Changes to these
elements could affect the timing of revenue recognition. There have been no material changes to these elements for the periods
presented.
Software Solutions & Service Revenue The Company offers software solutions consisting of multiple applications that
process events and transactions (networking software) along with the related server. Sales of networking software represent
software solutions to customers that allow them to network various different vendors’ ATMs onto one network and revenue is
34
MANAGEMENT’S DISCUSSION AND ANALYSIS OF FINANCIAL CONDITION AND
RESULTS OF OPERATIONS as of December 31, 2009 (Continued)
(Unaudited)
(dollars in thousands, except per share amounts)

recognized in accordance with ASC 985-605. Included within service revenue is revenue from software support agreements,
which are typically 12 months in duration and pertain to networking software. For sales of software support agreements, where
the agreement is the only element of the sale, revenue is recognized ratably over the life of the contract period. In contracts that
involve multiple-elements, amounts deferred for support are based upon vendor specific objective evidence of the fair value of the
elements as prescribed in ASC 985-605, which requires judgment about as to whether the deliverables can be divided into more
than one unit of accounting and whether the separate units of accounting have value to the customer on a stand-alone basis.
Changes to these elements could affect the timing of revenue recognition. There have been no material changes to these
elements for the periods presented.
Allowances for Doubtful Accounts The Company evaluates the collectability of accounts receivable based on (1) a
percentage of sales based on historical loss experience and current trends and (2) periodic adjustments for known events such as
specific customer circumstances and changes in the aging of accounts receivable balances. Since the Company’s receivable
balance is concentrated primarily in the financial and government sectors, an economic downturn in these sectors could result in
higher than expected credit losses.
Inventories The Company primarily values inventories at the lower of cost or market applied on a first-in, first-out (FIFO)
basis, with the notable exception of Brazil that values inventories using the average cost method, which approximates FIFO. At
each reporting period, the Company identifies and writes down its excess and obsolete inventory to its net realizable value based
on forecasted usage, orders and inventory aging. With the development of new products, the Company also rationalizes its
product offerings and will write-down discontinued product to the lower of cost or net realizable value.
Goodwill Goodwill is the cost in excess of the net assets of acquired businesses. The Company tests all existing goodwill at
least annually for impairment using the fair value approach on a “reporting unit” basis in accordance with FASB ASC 350,
Intangibles — Goodwill and Other (ASC 350). The Company’s reporting units are defined as Domestic and Canada, Brazil, Latin
America, Asia Pacific, and EMEA. The Company uses the discounted cash flow method and the guideline company method for
determining the fair value of its reporting units. As required by ASC 350, the determination of implied fair value of the goodwill for a
particular reporting unit is the excess of the fair value of a reporting unit over the amounts assigned to its assets and liabilities in the
same manner as the allocation in a business combination. Implied fair value goodwill is determined as the excess of the fair value
of the reporting unit over the fair value of its assets and liabilities.
The Company uses the most current information available and performs the annual impairment analysis as of November 30
each year. However, actual circumstances could differ significantly from assumptions and estimates made and could result in
future goodwill impairment. The Company tests for impairment between annual tests if an event occurs or circumstances change
that would more likely than not reduce the carrying value of a reporting unit below its reported amount.
Goodwill is reviewed for impairment based on a two-step test. In the first step, the Company compares the fair value of each
reporting unit with its net book value. The fair value is determined based upon discounted estimated future cash flows as well as
the market approach or guideline public company method. The Company’s Step I impairment test of goodwill of a reporting unit is
based upon the fair value of the reporting unit, defined as the price that would be received to sell the net assets or transfer the net
liabilities in an orderly transaction between market participants at the assessment date (November 30). In the event that the net
carrying amount exceeds the fair value, a Step II test must be performed whereby the fair value of the reporting unit’s goodwill
must be estimated to determine if it is less than its net carrying amount.
The valuation techniques used in the Step I impairment test have incorporated a number of assumptions that the Company
believes to be reasonable and to reflect forecasted market conditions at the assessment date. Assumptions in estimating future
cash flows are subject to a high degree of judgment. The Company makes all efforts to forecast future cash flows as accurately as
35
MANAGEMENT’S DISCUSSION AND ANALYSIS OF FINANCIAL CONDITION AND
RESULTS OF OPERATIONS as of December 31, 2009 (Continued)
(Unaudited)
(dollars in thousands, except per share amounts)
possible with the information available at the time a forecast is made. To this end, the Company evaluates the appropriateness of
its assumptions as well as its overall forecasts by comparing projected results of upcoming years with actual results of preceding
years and validating that differences therein are reasonable. Key assumptions relate to price trends, material costs, discount rate,
customer demand, and the long-term growth and foreign exchange rates. A number of benchmarks from independent industry
and other economic publications were also used. Changes in assumptions and estimates after the assessment date may lead to
an outcome where impairment charges would be required in future periods. Specifically, actual results may vary from the
Company’s forecasts and such variations may be material and unfavorable, thereby triggering the need for future impairment tests
where the conclusions may differ in reflection of prevailing market conditions.
The annual goodwill impairment test for 2009, 2008 and 2007 resulted in no impairment related to income from continuing
operations. However, the valuation techniques used in the impairment tests incorporate a number of estimates and assumptions
that are subject to change; although the Company believes these estimates and assumptions are reasonable and reflect
forecasted market conditions at the assessment date. Any changes to these assumptions and estimates due to market conditions
or otherwise, may lead to an outcome where impairment charges would be required in future periods. In particular, the carrying
amount of goodwill in the Company’s Brazil reporting unit was $115,395 as of December 31, 2009, with limited excess fair value
over such carrying amount (refer to Note 9 to the consolidated financial statements). Because actual results may vary from our
forecasts and such variations may be material and unfavorable, the Company may need to record future impairment charges with
respect to the goodwill attributed to the Brazil reporting unit or other reporting units.
Taxes on Income In accordance with FASB ASC 740, Income Taxes (ASC 740), deferred taxes are provided on an asset and
liability method, whereby deferred tax assets are recognized for deductible temporary differences and operating loss carry-
forwards and deferred tax liabilities are recognized for taxable temporary differences. Deferred tax assets are reduced by a
valuation allowance when, in the opinion of management, it is more likely than not that some portion or all of the deferred tax
assets will not be realized. Deferred tax assets and liabilities are adjusted for the effects of changes in tax laws and rates on the
date of enactment.
The Company operates in numerous taxing jurisdictions and is subject to examination by various U.S., Federal, state and
foreign jurisdictions for various tax periods. Additionally, the Company has retained tax liabilities and the rights to tax refunds in
connection with various divestitures of businesses. The Company’s income tax positions are based on research and interpre-
tations of the income tax laws and rulings in each of the jurisdictions in which the Company does business. Due to the subjectivity
of interpretations of laws and rulings in each jurisdiction, the differences and interplay in tax laws between those jurisdictions, as
well as the inherent uncertainty in estimating the final resolution of complex tax audit matters, the Company’s estimates of
income tax liabilities may differ from actual payments or assessments.
The Company regularly assesses its position with regard to tax exposures and records liabilities for these uncertain tax
positions and related interest and penalties, if any, according to the principles of ASC 740. The Company has recorded an accrual
that reflects the recognition and measurement process for the financial statement recognition and measurement of a tax position
taken or expected to be taken on a tax return based upon ASC 740. Additional future income tax expense or benefit may be
recognized once the positions are effectively settled.
At the end of each interim reporting period, the Company estimates the effective tax rate expected to apply to the full fiscal
year. The estimated effective tax rate contemplates the expected jurisdiction where income is earned, as well as tax planning
strategies. Current and projected growth in income in higher tax jurisdictions may result in an increasing effective tax rate over
time. If the actual results differ from estimates, the Company may adjust the effective tax rate in the interim period if such
determination is made.
36
MANAGEMENT’S DISCUSSION AND ANALYSIS OF FINANCIAL CONDITION AND
RESULTS OF OPERATIONS as of December 31, 2009 (Continued)
(Unaudited)
(dollars in thousands, except per share amounts)

Pensions and Postretirement Benefits Annual net periodic expense and benefit liabilities under the Company’s defined
benefit plans are determined on an actuarial basis. Assumptions used in the actuarial calculations have a significant impact on plan
obligations and expense. Annually, management and the Investment Committee of the Board of Directors review the actual
experience compared with the more significant assumptions used and make adjustments to the assumptions, if warranted. The
discount rate is determined by analyzing the average return of high-quality (i.e., AA-rated) fixed-income investments and the
year-over-year comparison of certain widely used benchmark indices as of the measurement date. The expected long-term rate of
return on plan assets is determined using the plans’ current asset allocation and their expected rates of return based on a
geometric averaging over 20 years. The rate of compensation increase assumptions reflects the Company’s long-term actual
experience and future and near-term outlook. Pension benefits are funded through deposits with trustees. Postretirement
benefits are not funded and the Company’s policy is to pay these benefits as they become due.
The following table represents assumed health care cost trend rates at December 31:
2009 2008
Healthcare cost trend rate assumed for next year 8.20% 9.00%
Rate to which the cost trend rate is assumed to decline (the ultimate trend rate) 4.20% 4.20%
Year that rate reaches ultimate trend rate 2099 2099
The healthcare trend rates are reviewed based upon the results of actual claims experience. The Company used healthcare
cost trends of 8.2 and 9.0 percent in 2010 and 2009, respectively, decreasing to an ultimate trend of 4.2 percent in 2099 for both
medical and prescription drug benefits using the Society of Actuaries Long Term Trend Model with assumptions based on the
2008 Medicare Trustees’ projections. Assumed healthcare cost trend rates have a significant effect on the amounts reported for
the healthcare plans. A one-percentage-point change in assumed healthcare cost trend rates would have the following effects:
One-Percentage-Point Increase
One-Percentage-Point Decrease
Effect on total of service and interest cost $ 72 $ (65)
Effect on postretirement benefit obligation $971 $(878)
In accordance with FASB ASC 715, Compensation — Retirement Benefits, the Company recognizes the funded status of
each of its plans in the consolidated balance sheet. Amortization of unrecognized net gain or loss resulting from experience
different from that assumed and from changes in assumptions (excluding asset gains and losses not yet reflected in market-
related value) is included as a component of net periodic benefit cost for a year if, as of the beginning of the year, that unrecognized
net gain or loss exceeds five percent of the greater of the projected benefit obligation or the market-related value of plan assets. If
amortization is required, the amortization is that excess divided by the average remaining service period of participating
employees expected to receive benefits under the plan.
RECENT ACCOUNTING PRONOUNCEMENTS
With the exception of those stated below, there have been no recent accounting pronouncements or changes in accounting
pronouncements during the year ended December 31, 2009, as compared to the recent accounting pronouncements described in
the annual report on Form 10-K as of December 31, 2008 that are of material significance, or have potential material significance.
Refer to the notes to the consolidated financial statements for accounting pronouncements adopted during the year ended
December 31, 2009.
37
MANAGEMENT’S DISCUSSION AND ANALYSIS OF FINANCIAL CONDITION AND
RESULTS OF OPERATIONS as of December 31, 2009 (Continued)
(Unaudited)
(dollars in thousands, except per share amounts)

In February 2010, the FASB issued Accounting Standards Update (ASU) 2010-09, Subsequent Events (ASU 2010-09).
ASU 2010-09 updates FASB ASC 855, Subsequent Events (ASC 855). ASU 2010-09 removes the requirement to disclose the date
through which an entity has evaluated subsequent events. ASU 2010-09 clarifies that an entity that is a conduit bond obligor for
conduit debt securities that are traded in a public market must evaluate subsequent events through the date of issuance of its
financial statements and must disclose such date. ASU 2010-09 is effective for interim annual periods beginning after June 15,
2010. The adoption of ASU 2010-09 is not expected to have a material impact on the financial statements of the Company. As
discussed in note 1 to the consolidated financial statements, the Company adopted previously issued guidance included in
ASC 855 on April 1, 2009.
In January 2010, the FASB issued ASU 2010-06, Fair Value Measurements and Disclosures (ASU 2010-06). ASU 2010-06
updates FASB ASC 820, Fair Value Measurements (ASC 820). ASU 2010-06 requires additional disclosures about fair value
measurements including transfers in and out of Levels 1 and 2 and a higher level of disaggregation for the different types of
financial instruments. For the reconciliation of Level 3 fair value measurements, information about purchases, sales, issuances
and settlements should be presented separately. ASU 2010-06 is effective for interim and annual periods beginning after
December 15, 2010. The adoption of ASU 2010-06 is not expected to have a material impact on the financial statements of the
Company.
In October 2009, the FASB issued ASU 2009-13, Multiple-Deliverable Revenue Arrangements, (amendments to ASC 605)
(ASU 2009-13), and ASU 2009-14, Certain Arrangements That Include Software Elements (amendments to FASB ASC 985,
Software) (ASU 2009-14). ASU 2009-13 requires entities to allocate revenue in an arrangement using estimated selling prices of
deliverables if a vendor does not have vendor-specific objective evidence (VSOE) or third-party evidence of selling price. The
amendments eliminate the residual method of revenue allocation and require revenue to be allocated using the relative selling
price method. ASU 2009-14 removes tangible products from the scope of software revenue guidance and provides guidance on
determining whether software deliverables in an arrangement that includes a tangible product are covered by the scope of the
software revenue guidance. ASU 2009-13 and ASU 2009-14 should be applied on a prospective basis for revenue arrangements
entered into or materially modified in fiscal years beginning on or after June 15, 2010, with early adoption permitted. The Company
elected to early adopt ASU 2009-13 and ASU 2009-14 during the first quarter of fiscal 2010 and there was no material impact on
the Company’s consolidated financial statements.
In June 2009, the FASB issued updated guidance included in FASB ASC 860-10, Transfers and Servicing — Overall. This
guidance requires additional disclosures about the transfer and de-recognition of financial assets and eliminates the concept of
qualifying special-purpose entities. This guidance is effective for fiscal years beginning after November 15, 2009. The adoption of
this guidance is not expected to have an impact on the Company’s consolidated financial statements.
In June 2009, the FASB issued updated guidance included in FASB ASC 810-10, Consolidation — Overall (ASC 810-10),
related to the consolidation of variable interest entities. This guidance will require ongoing reassessments of whether an
enterprise is the primary beneficiary of a variable interest entity. In addition, this updated guidance amends the quantitative
approach previously required for determining the primary beneficiary of a variable interest entity. ASC 810-10 amends certain
guidance for determining whether an entity is a variable interest entity and adds additional reconsideration events for determining
whether an entity is a variable interest entity. Further, this guidance requires enhanced disclosures that will provide users of
financial statements with more transparent information about an enterprise’s involvement in a variable interest entity. This
updated guidance is effective as of the beginning of the first annual reporting period and interim reporting periods that begin after
November 15, 2009. The adoption of this guidance is not expected to have an impact on the Company’s consolidated financial
statements.
38
MANAGEMENT’S DISCUSSION AND ANALYSIS OF FINANCIAL CONDITION AND
RESULTS OF OPERATIONS as of December 31, 2009 (Continued)
(Unaudited)
(dollars in thousands, except per share amounts)

FORWARD-LOOKING STATEMENT DISCLOSURE
In this annual report on Form 10-K, statements that are not reported financial results or other historical information are
“forward-looking statements” within the meaning of the Private Securities Litigation Reform Act of 1995. Forward-looking
statements give current expectations or forecasts of future events and are not guarantees of future performance. These forward-
looking statements relate to, among other things, the Company’s future operating performance, the Company’s share of new and
existing markets, the Company’s short- and long-term revenue and earnings growth rates, the Company’s implementation of cost-
reduction initiatives and measures to improve pricing, including the optimization of the Company’s manufacturing capacity. The
use of the words “will,” “believes,” “anticipates,” “expects,” “intends” and similar expressions is intended to identify forward-
looking statements that have been made and may in the future be made by or on behalf of the Company.
Although the Company believes that these forward-looking statements are based upon reasonable assumptions regarding,
among other things, the economy, its knowledge of its business, and on key performance indicators that impact the Company,
these forward-looking statements involve risks, uncertainties and other factors that may cause actual results to differ materially
from those expressed in or implied by the forward-looking statements. The Company is not obligated to update forward-looking
statements, whether as a result of new information, future events or otherwise.
Readers are cautioned not to place undue reliance on these forward-looking statements, which speak only as of the date
hereof. Some of the risks, uncertainties and other factors that could cause actual results to differ materially from those expressed
in or implied by the forward-looking statements include, but are not limited to:
• ability to reach definitive agreements with the SEC and DOJ regarding their respective investigations;
• competitive pressures, including pricing pressures and technological developments;
• changes in the Company’s relationships with customers, suppliers, distributors and/or partners in its business ventures;
• changes in political, economic or other factors such as currency exchange rates, inflation rates, recessionary or expansive
trends, taxes and regulations and laws affecting the worldwide business in each of the Company’s operations, including
Brazil, where a significant portion of the Company’s revenue is derived;
• the continuing effects of the recent economic downturn and the disruptions in the financial markets, including the
bankruptcies, restructurings or consolidations of financial institutions, which could reduce the Company’s customer base
and/or adversely affect its customers’ ability to make capital expenditures, as well as adversely impact the availability and
cost of credit;
• acceptance of the Company’s product and technology introductions in the marketplace;
• the amount of cash and non-cash charges in connection with the restructuring of the Company’s North America operations
and corporate functions, and the closure of both the Company’s Newark, Ohio facility and its EMEA-based enterprise
security operations;
• unanticipated litigation, claims or assessments;
• variations in consumer demand for financial self-service technologies, products and services;
• potential security violations to the Company’s information technology systems;
• the investment performance of the Company’s pension plan assets, which could require the Company to increase its
pension contributions;
39
MANAGEMENT’S DISCUSSION AND ANALYSIS OF FINANCIAL CONDITION AND
RESULTS OF OPERATIONS as of December 31, 2009 (Continued)
(Unaudited)
(dollars in thousands, except per share amounts)

• the Company’s ability to successfully defend challenges raised to the sale of the U.S. elections business;
• the Company’s ability to achieve benefits from its cost-reduction initiatives and other strategic changes; and
• the risk factors described above under “Item 1A. Risk Factors.”
ITEM 7A: QUANTITATIVE AND QUALITATIVE DISCLOSURES ABOUT MARKETRISK
The Company is exposed to foreign currency exchange rate risk inherent in its international operations denominated in
currencies other than the U.S. dollar. A hypothetical 10 percent movement in the applicable foreign exchange rates would have
resulted in an increase or decrease in 2009 and 2008 year-to-date operating profit of approximately $9,988 and $12,197,
respectively. The sensitivity model assumes an instantaneous, parallel shift in the foreign currency exchange rates. Exchange
rates rarely move in the same direction. The assumption that exchange rates change in an instantaneous or parallel fashion may
overstate the impact of changing exchange rates on amounts denominated in a foreign currency.
The Company’s risk-management strategy uses derivative financial instruments such as forwards to hedge certain foreign
currency exposures. The intent is to offset gains and losses that occur on the underlying exposures, with gains and losses on the
derivative contracts hedging these exposures. The Company does not enter into derivatives for trading purposes. The Company’s
primary exposures to foreign exchange risk are movements in the euro/dollar, pound/dollar and dollar/franc. There were no
significant changes in the Company’s foreign exchange risks in 2009 compared with 2008.
The Company’s Venezuelan operations consist of a fifty-percent owned subsidiary which is consolidated. Effective in January
2010, the Venezuelan government announced the devaluation of its currency, the bolivar fuerte, and the establishment of a two-
tier exchange structure. In connection with the remeasurement of the Venezuela balance sheet, the Company expects to record a
charge in the first quarter of 2010 to reflect this devaluation. If in the future there are changes to this exchange rate, the Company
may realize additional gains or losses. The future results of Venezuelan operations may be affected by the Company’s ability to
mitigate the effect of the devaluation, further actions by the Venezuelan government, as well as economic conditions in Venezuela
such as inflation.
The Company manages interest rate risk with the use of variable rate borrowings under its committed and uncommitted
credit facilities and interest rate swaps. Variable rate borrowings under the credit facilities totaled $268,815 and $306,488 at
December 31, 2009 and 2008, respectively, of which $50,000 was effectively converted to fixed rate using interest rate swaps. A
one percentage point increase or decrease in interest rates would have resulted in an increase or decrease in interest expense of
approximately $2,703 and $3,052 for 2009 and 2008, respectively, including the impact of the swap agreements. The Company’s
primary exposure to interest rate risk is movements in LIBOR, which is consistent with prior periods. As discussed in note 10 to
the consolidated financial statements, the Company hedged $200,000 of the fixed rate borrowings under its private placement
agreement, which was treated as a cash flow hedge. This reduced the effective interest rate by 14 basis points from 5.50 to
5.36 percent.
40
MANAGEMENT’S DISCUSSION AND ANALYSIS OF FINANCIAL CONDITION AND
RESULTS OF OPERATIONS as of December 31, 2009 (Continued)
(Unaudited)
(dollars in thousands, except per share amounts)

ITEM 8: FINANCIAL STATEMENTS AND SUPPLEMENTARY DATA
INDEX TO CONSOLIDATED FINANCIAL STATEMENTS
FINANCIAL STATEMENTS
Reports of Independent Registered Public Accounting Firm 42
Consolidated Balance Sheets as of December 31, 2009 and 2008 45
Consolidated Statements of Income for the years ended December 31, 2009, 2008 and 2007 46
Consolidated Statements of Equity for the years ended December 31, 2009, 2008 and 2007 47
Consolidated Statements of Cash Flows for the years ended December 31, 2009, 2008 and 2007 48
Notes to Consolidated Financial Statements 49
FINANCIAL STATEMENTS SCHEDULES
Schedule II — Valuation of Qualifying Accounts for the years ended December 31, 2009, 2008 and 2007 102
All other schedules are omitted because they are not applicable
41

Report of Independent Registered Public Accounting Firm
The Board of Directors and Shareholders
Diebold, Incorporated:
We have audited the accompanying consolidated balance sheets of Diebold, Incorporated and subsidiaries (the Company) as
of December 31, 2009 and 2008, and the related consolidated statements of income, equity, and cash flows for each of the years
in the three-year period ended December 31, 2009. In connection with our audits of the consolidated financial statements we also
have audited the financial statement schedule, Schedule II “Valuation and Qualifying Accounts.” These consolidated financial
statements and the financial statement schedule are the responsibility of the Company’s management. Our responsibility is to
express an opinion on these consolidated financial statements and the financial statement schedule based on our audits.
We conducted our audits in accordance with the standards of the Public Company Accounting Oversight Board (United
States). Those standards require that we plan and perform the audit to obtain reasonable assurance about whether the financial
statements are free of material misstatement. An audit includes examining, on a test basis, evidence supporting the amounts and
disclosures in the financial statements. An audit also includes assessing the accounting principles used and significant estimates
made by management, as well as evaluating the overall financial statement presentation. We believe that our audits provide a
reasonable basis for our opinion.
In our opinion, the consolidated financial statements referred to above present fairly, in all material respects, the financial
position of Diebold, Incorporated and subsidiaries as of December 31, 2009 and 2008, and the results of their operations and their
cash flows for each of the years in the three-year period ended December 31, 2009, in conformity with U.S. generally accepted
accounting principles. Also, in our opinion, the related financial statement schedule, when considered in relation to the basic
consolidated financial statements taken as a whole, presents fairly, in all material respects, the information set forth therein.
As discussed in Note 1 to the consolidated financial statements, the Company adopted Emerging Issues Task Force (EITF)
Issue No. 06-10, Accounting for Collateral Assignment Split-Dollar Life Insurance, and EITF Issue No. 06-4, Accounting for
Deferred Compensation and Post Retirement Benefit Aspects of Endorsement Split-Dollar Life Insurance Arrangements (included
in Financial Accounting Standards Board (FASB) Accounting Standards Codification (ASC) Topic 715, Compensation — Retire-
ment Benefits) effective January 1, 2008.
As discussed in Note 12 to the consolidated financial statements, the Company adopted the measurement date provisions of
Statement of Financial Accounting Standards No. 158, Employers’ Accounting for Defined Benefit Pension and Other Postre-
tirement Plans (included in FASB ASC Topic 715, Compensation — Retirement Benefits) effective January 1, 2008.
As discussed in Note 18 to the consolidated financial statements, the Company adopted the provisions of Statement of
Financial Accounting Standards No. 157, Fair Value Measurements (included in FASB ASC Topic 820, Fair Value Measurements
and Disclosures), effective January 1, 2008.
We also have audited, in accordance with the standards of the Public Company Accounting Oversight Board (United States),
the Company’s internal control over financial reporting as of December 31, 2009, based on criteria established in Internal
Control — Integrated Framework issued by the Committee of Sponsoring Organizations of the Treadway Commission (COSO),
and our report dated March 1, 2010 expressed an adverse opinion on the effectiveness of the Company’s internal control over
financial reporting.
/s/ KPMG LLP
Cleveland, Ohio
March 1, 2010
42

Report of Independent Registered Public Accounting Firm
The Board of Directors and Shareholders
Diebold, Incorporated:
We have audited Diebold, Incorporated’s (the Company) internal control over financial reporting as of December 31, 2009,
based on criteria established in Internal Control — Integrated Framework issued by the Committee of Sponsoring Organizations
of the Treadway Commission (COSO). The Company’s management is responsible for maintaining effective internal control over
financial reporting and for its assessment of the effectiveness of internal control over financial reporting, included in the
accompanying Management’s Report on Internal Control over Financial Reporting appearing under Item 9A(b) of the Company’s
December 31, 2009 annual report on Form 10-K. Our responsibility is to express an opinion on the Company’s internal control over
financial reporting based on our audit.
We conducted our audit in accordance with the standards of the Public Company Accounting Oversight Board (United
States). Those standards require that we plan and perform the audit to obtain reasonable assurance about whether effective
internal control over financial reporting was maintained in all material respects. Our audit included obtaining an understanding of
internal control over financial reporting, assessing the risk that a material weakness exists, and testing and evaluating the design
and operating effectiveness of internal control based on the assessed risk. Our audit also included performing such other
procedures as we considered necessary in the circumstances. We believe that our audit provides a reasonable basis for our
opinion.
A company’s internal control over financial reporting is a process designed to provide reasonable assurance regarding the
reliability of financial reporting and the preparation of financial statements for external purposes in accordance with generally
accepted accounting principles. A company’s internal control over financial reporting includes those policies and procedures that
(1) pertain to the maintenance of records that, in reasonable detail, accurately and fairly reflect the transactions and dispositions of
the assets of the company; (2) provide reasonable assurance that transactions are recorded as necessary to permit preparation of
financial statements in accordance with generally accepted accounting principles, and that receipts and expenditures of the
company are being made only in accordance with authorizations of management and directors of the company; and (3) provide
reasonable assurance regarding prevention or timely detection of unauthorized acquisition, use, or disposition of the company’s
assets that could have a material effect on the financial statements.
Because of its inherent limitations, internal control over financial reporting may not prevent or detect misstatements. Also,
projections of any evaluation of effectiveness to future periods are subject to the risk that controls may become inadequate
because of changes in conditions, or that the degree of compliance with the policies or procedures may deteriorate.
A material weakness is a deficiency, or a combination of deficiencies, in internal control over financial reporting, such that
there is a reasonable possibility that a material misstatement of the company’s annual or interim financial statements will not be
prevented or detected on a timely basis. Material weaknesses related to the Company’s selection, application and communication
of accounting policies and controls over income taxes have been identified and included in management’s assessment. We also
have audited, in accordance with the standards of the Public Company Accounting Oversight Board (United States), the
consolidated balance sheets of Diebold, Incorporated and subsidiaries as of December 31, 2009 and 2008, and the related
consolidated statements of income, equity, and cash flows for each of the years in the three-year period ended December 31,
2009. These material weaknesses were considered in determining the nature, timing, and extent of audit tests applied in our audit
of the 2009 consolidated financial statements, and this report does not affect our report dated March 1, 2010, which expressed an
unqualified opinion on those consolidated financial statements.
43

In our opinion, because of the effect of the aforementioned material weaknesses on the achievement of the objectives of the
control criteria, the Company has not maintained effective internal control over financial reporting as of December 31, 2009, based
on criteria established in Internal Control — Integrated Framework issued by the Committee of Sponsoring Organizations of the
Treadway Commission.
/s/ KPMG LLP
Cleveland, Ohio
March 1, 2010
44

DIEBOLD, INCORPORATED AND SUBSIDIARIES
CONSOLIDATED BALANCE SHEETS
(dollars in thousands)
2009 2008
December 31,
ASSETS
Current assets
Cash and cash equivalents $ 328,426 $ 241,436Short-term investments 177,442 121,387Trade receivables, less allowances for doubtful accounts of $26,648 and $25,060,
respectively 330,982 447,079Inventories 448,243 540,971Deferred income taxes 84,950 95,086Prepaid expenses 37,370 42,909Refundable income taxes 93,907 26,502Other current assets 86,765 98,748
Total current assets 1,588,085 1,614,118
Securities and other investments 73,989 70,914Property, plant and equipment at cost 613,377 579,951
Less accumulated depreciation and amortization 408,557 376,357
Property, plant and equipment, net 204,820 203,594Goodwill 450,937 408,303Deferred income taxes 32,834 69,698Other assets 204,200 171,309
Total assets $2,554,865 $2,537,936
LIABILITIES AND EQUITY
Current liabilities
Notes payable $ 16,915 $ 10,596Accounts payable 147,496 195,483Deferred revenue 200,778 195,164Payroll and benefits liabilities 77,934 75,215Other current liabilities 299,968 258,939
Total current liabilities 743,091 735,397
Notes payable — long term 540,000 594,588Pensions and other benefits 90,021 131,792Postretirement and other benefits 29,174 32,857Deferred income taxes 45,060 35,307Other long-term liabilities 35,493 43,737Commitments and contingencies — —
Equity
Diebold, Incorporated shareholders’ equityPreferred shares, no par value, 1,000,000 authorized shares, none issued — —Common shares, 125,000,000 authorized shares, 76,093,101 and 75,801,434 issued shares,
66,327,627 and 66,114,560 outstanding shares, respectively 95,116 94,752Additional capital 290,689 278,135Retained earnings 1,011,448 1,054,873Treasury shares, at cost (9,765,474 and 9,686,874 shares, respectively) (410,153) (408,235)Accumulated other comprehensive gain (loss) 59,279 (72,924)
Total Diebold, Incorporated shareholders’ equity 1,046,379 946,601Noncontrolling interests 25,647 17,657
Total equity 1,072,026 964,258
Total liabilities and equity $2,554,865 $2,537,936
See accompanying notes to consolidated financial statements.
45

DIEBOLD, INCORPORATED AND SUBSIDIARIES
CONSOLIDATED STATEMENTS OF INCOME
(in thousands, except per share amounts)
2009 2008 2007
Year Ended December 31,
Net sales
Products $1,238,346 $1,511,856 $1,401,374Services 1,479,946 1,569,982 1,486,977
2,718,292 3,081,838 2,888,351
Cost of sales
Products 944,090 1,098,633 1,032,264Services 1,124,202 1,208,328 1,179,267
2,068,292 2,306,961 2,211,531
Gross profit 650,000 774,877 676,820Selling and administrative expense 424,875 514,154 456,479Research, development and engineering expense 72,026 73,034 67,081Impairment of assets 2,500 4,376 —Loss (gain) on sale of assets, net 7 403 (6,392)
499,408 591,967 517,168
Operating profit 150,592 182,910 159,652Other income (expense)
Investment income 29,016 25,218 22,489Interest expense (35,452) (45,367) (41,320)Foreign exchange (loss) gain, net (922) (8,785) 1,326Miscellaneous, net (19,427) 2,341 3,506
Income from continuing operations before taxes 123,807 156,317 145,653Taxes on income 44,477 41,496 40,414
Income from continuing operations 79,330 114,821 105,239Loss from discontinued operations, net of tax (9,884) (19,198) (58,287)Loss on sale of discontinued operations, net of tax (37,192) — —
Net income 32,254 95,623 46,952Less: Net income attributable to noncontrolling interests (6,228) (7,040) (7,411)
Net income attributable to Diebold, Incorporated $ 26,026 $ 88,583 $ 39,541
Basic weighted-average shares outstanding 66,257 66,081 65,841Diluted weighted-average shares outstanding 66,867 66,492 66,673Basic earnings per share:
Net income from continuing operations $ 1.10 $ 1.63 $ 1.49Loss from discontinued operations (0.71) (0.29) (0.89)
Net income attributable to Diebold, Incorporated $ 0.39 $ 1.34 $ 0.60
Diluted earnings per share:
Net income from continuing operations $ 1.09 $ 1.62 $ 1.47Loss from discontinued operations (0.70) (0.29) (0.88)
Net income attributable to Diebold, Incorporated $ 0.39 $ 1.33 $ 0.59
Amounts attributable to Diebold, Incorporated
Income from continuing operations, net of tax $ 73,102 $ 107,781 $ 97,828Loss from discontinued operations, net of tax (47,076) (19,198) (58,287)
Net income attributable to Diebold, Incorporated $ 26,026 $ 88,583 $ 39,541
See accompanying notes to consolidated financial statements
46

DIEBOLD, INCORPORATED AND SUBSIDIARIES
CONSOLIDATED STATEMENTS OF EQUITY
(dollars in thousands)
Number Par ValueAdditional
CapitalRetainedEarnings
TreasuryShares
ComprehensiveIncome(Loss)
AccumulatedOther
ComprehensiveIncome(Loss)
TotalDiebold,
IncorporatedShareholders’
EquityNoncontrolling
InterestsTotal
Equity
Common Shares
Balance, January 1, 2007 75,145,662 $93,932 $235,242 $1,059,725 $(403,098) $ 12,632 $ 998,433 $ 21,880 $1,020,313Net income 39,541 $ 39,541 39,541 7,411 46,952Foreign currency hedges and
translation 88,508 88,508 2,702 91,210Interest rate hedges (1,962) (1,962) (1,962)Pensions 29,176 29,176 29,176Other comprehensive income 115,722 115,722 —Comprehensive income $ 155,263 —Stock options exercised 241,365 302 8,252 8,554 8,554Restricted shares 8,620 11 295 306 306Restricted stock units issued 84,865 106 (106) — —Performance shares issued 98,725 123 2,500 2,623 2,623Tax benefit from employee stock
plans 1,399 1,399 1,399Share-based compensation expense 13,782 13,782 13,782Dividends declared and paid (62,442) (62,442) (18,236) (80,678)Treasury shares (3,084) (3,084) (3,084)Balance, December 31, 2007 75,579,237 $94,474 $261,364 $1,036,824 $(406,182) $ 128,354 $1,114,834 $ 13,757 $1,128,591
Pension beginning retained earningsadjustment (Note 12) (1,387) (1,387) (1,387)
Split-dollar life insurance beginningretained earnings adjustment(Note 1) (2,584) (2,584) (2,584)
Net income 88,583 $ 88,583 88,583 7,040 95,623Foreign currency hedges and
translation (99,689) (99,689) 383 (99,306)Interest rate hedges (4,910) (4,910) (4,910)Pensions (96,679) (96,679) (96,679)Other comprehensive loss (201,278) (201,278) —Comprehensive loss $(112,695) —Stock options exercised 665 1 16 17 17Restricted shares 121,985 152 5,861 6,013 6,013Restricted stock units issued 49,526 62 (62) — —Performance shares issued 50,021 63 719 782 782Tax expense from employee stock
plans (2,122) (2,122) (2,122)Share-based compensation expense 12,189 12,189 12,189Colombia acquisition earnout 170 230 400 400Dividends declared and paid (66,563) (66,563) (3,523) (70,086)Treasury shares (2,283) (2,283) (2,283)Balance, December 31, 2008 75,801,434 $94,752 $278,135 $1,054,873 $(408,235) $ (72,924) $ 946,601 $ 17,657 $ 964,258
Net income 26,026 $ 26,026 26,026 6,228 32,254Foreign currency hedges and
translation 110,147 110,147 1,759 111,906Interest rate hedges 738 738 738Pensions 21,318 21,318 21,318Other comprehensive income 132,203 132,203 —Comprehensive income $ 158,229 —Stock options exercised 66,400 83 1,442 1,525 1,525Restricted shares 13,328 16 583 599 599Restricted stock units issued 96,300 120 (120) — —Performance shares issued 111,939 140 (96) 44 44Deferred shares 3,700 5 (5) — —Tax expense from employee stock
plans (1,160) (1,160) (1,160)Share-based compensation expense 11,910 11,910 11,910Dividends declared and paid (69,451) (69,451) (539) (69,990)Treasury shares (1,918) (1,918) (1,918)Contribution from noncontrolling
interest holders 542 542Balance, December 31, 2009 76,093,101 $95,116 $290,689 $1,011,448 $(410,153) $ 59,279 $1,046,379 $ 25,647 $1,072,026
See accompanying notes to consolidated financial statements.
47

DIEBOLD, INCORPORATED AND SUBSIDIARIES
CONSOLIDATED STATEMENTS OF CASH FLOWS
(in thousands)
2009 2008 2007
Year Ended December 31,
Cash flow from operating activities:
Net income $ 32,254 $ 95,623 $ 46,952Adjustments to reconcile net income to cash provided by operating activities:
Loss on sale of discontinued operations 37,192 — —Depreciation and amortization 77,693 80,470 69,397Share-based compensation 11,910 12,189 13,782Excess tax benefits from share-based compensation (320) (168) (917)Deferred income taxes 50,379 (22,592) (7,250)Impairment of asset 2,500 21,037 46,319Loss (gain) on sale of assets, net 7 403 (6,392)
Cash provided (used) by changes in certain assets and liabilities:Trade receivables 123,400 10,633 120,949Inventories 76,001 (53,650) 8,955Prepaid expenses 6,354 1,183 (10,256)Other current assets 36,705 (14,706) (20,055)Accounts payable (54,193) 36,480 6,331Deferred revenue 6,322 (49,668) (89,921)Pension and postretirement benefits (11,557) (2,900) (20,802)Certain other assets and liabilities (95,309) 170,357 (6,832)
Net cash provided by operating activities 299,338 284,691 150,260
Cash flow from investing activities:
Proceeds from sale of discontinued operations 9,908 — —Payments for acquisitions, net of cash acquired (5,364) (4,461) (18,122)Proceeds from maturities of investments 221,411 303,410 57,433Payments for purchases of investments (241,921) (357,091) (50,588)Proceeds from sale of fixed assets 113 42 3,242Capital expenditures (44,287) (57,932) (43,259)Increase in certain other assets (33,094) (26,452) (29,076)
Net cash used in investing activities (93,234) (142,484) (80,370)
Cash flow from financing activities:
Dividends paid (69,451) (66,563) (62,442)Debt issuance costs (4,539) — —Notes payable borrowings 326,017 606,269 720,299Notes payable repayments (382,934) (624,040) (784,358)Contribution from (distribution to) noncontrolling interest holders, net 3 (3,523) (18,236)Excess tax benefits from share-based compensation 320 168 917Issuance of common shares 1,514 — 8,544Repurchase of shares for share-based compensation withholding taxes (1,918) — —
Net cash used in financing activities (130,988) (87,689) (135,276)
Effect of exchange rate changes on cash 11,874 (19,416) 17,752Increase (decrease) in cash and cash equivalents 86,990 35,102 (47,634)Cash and cash equivalents at the beginning of the year 241,436 206,334 253,968
Cash and cash equivalents at the end of the year $ 328,426 $ 241,436 $ 206,334
Cash paid for:
Income taxes $ 34,287 $ 42,154 $ 53,176Interest $ 24,486 $ 30,747 $ 32,706
See accompanying notes to consolidated financial statements
48

DIEBOLD INCORPORATED AND SUBSIDIARIES
FORM 10-K as of December 31, 2009
NOTES TO CONSOLIDATED FINANCIAL STATEMENTS
(dollars in thousands, except per share amounts)
NOTE 1: SUMMARY OF SIGNIFICANT ACCOUNTING POLICIES
Principles of Consolidation The consolidated financial statements include the accounts of Diebold, Incorporated and its
wholly- and majority-owned subsidiaries (collectively, the Company). All significant intercompany accounts and transactions have
been eliminated.
Use of Estimates in Preparation of Consolidated Financial Statements The preparation of the accompanying consol-
idated financial statements in conformity with accounting principles generally accepted in the United States of America
(U.S. GAAP) requires management to make estimates and assumptions about future events. These estimates and the underlying
assumptions affect the amounts of assets and liabilities reported, disclosures about contingent assets and liabilities, and reported
amounts of revenues and expenses. Such estimates include the value of purchase consideration, valuation of trade receivables,
inventories, goodwill, intangible assets, and other long-lived assets, legal contingencies, guarantee obligations, indemnifications
and assumptions used in the calculation of income taxes, pension and other postretirement benefits and customer incentives,
among others. These estimates and assumptions are based on management’s best estimates and judgment. Management
evaluates its estimates and assumptions on an ongoing basis using historical experience and other factors, including the current
economic difficulties in the United States credit markets and the global markets. Management monitors the economic condition
and other factors and will adjust such estimates and assumptions when facts and circumstances dictate. Illiquid credit markets,
volatile foreign currency and equity, and declines in the global economic environment have combined to increase the uncertainty
inherent in such estimates and assumptions. As future events and their effects cannot be determined with precision, actual
results could differ significantly from these estimates. Changes in those estimates resulting from continuing changes in the
economic environment will be reflected in the financial statements in future periods.
International Operations The financial statements of the Company’s international operations are measured using local
currencies as their functional currencies, with the exception of Venezuela, which is measured using the U.S. dollar as its functional
currency because its economy is considered highly inflationary.
The Company translates the assets and liabilities of its non-U.S. subsidiaries at the exchange rates in effect at year end and
the results of operations at the average rate throughout the year. The translation adjustments are recorded directly as a separate
component of shareholders’ equity, while transaction gains (losses) are included in net income. Sales to customers outside the
United States approximated 50.9 percent in 2009, 52.0 percent in 2008 and 49.1 percent of net sales in 2007.
Reclassifications The Company has reclassified the presentation of certain prior-year information to conform to the current
presentation.
Out-of-Period Adjustments In the fourth quarter of 2009 and 2008, the Company recorded adjustments to increase income
tax expense on continuing operations by approximately $9,000 and $5,300, respectively relating to immaterial errors originating in
prior years (refer to note 4).
Revenue Recognition The Company’s revenue recognition policy is consistent with the requirements of the Financial
Accounting Standards Board (FASB) Accounting Standards Codification (ASC) 985-605, Software — Revenue Recognition (ASC
985-605) and FASB ASC 605, Revenue Recognition (ASC 605). In general, the Company records revenue when it is realized, or
realizable and earned. The Company considers revenue to be realized, or realizable and earned, when the following revenue
recognition requirements are met: persuasive evidence of an arrangement exists, which is a customer contract; the products or
services have been accepted by the customer via delivery or installation acceptance; the sales price is fixed or determinable within
the contract; and collectability is probable. For product sales, the Company determines that the earnings process is complete
when title, risk of loss and the right to use equipment has transferred to the customer. Within the Diebold North America (DNA)
49

business segment, this occurs upon customer acceptance. Where the Company is contractually responsible for installation,
customer acceptance occurs upon completion of the installation of all items at a job site and the Company’s demonstration that
the items are in operable condition. Where items are contractually only delivered to a customer, revenue recognition of these
items is upon shipment or delivery to a customer location depending on the terms in the contract. Within the Diebold International
(DI) business segment, customer acceptance is upon the earlier of delivery or completion of the installation depending on the
terms in the contract with the customer.
The Company has the following revenue streams related to sales to its customers:
Self-Service Product & Service Revenue Self-service products pertain to Automated Teller Machines (ATMs). Included
within the ATM is software, which operates the ATM. The related software is considered more than incidental to the equipment as
a whole. Revenue is recognized in accordance with ASC 985-605. The Company also provides service contracts on ATMs. Service
contracts typically cover a 12-month period and can begin at any given month during the year after the standard warranty period
expires. The service provided under warranty is significantly limited as compared to those offered under service contracts.
Further, warranty is not considered a separate element of the sale. The Company’s warranty covers only replacement of parts
inclusive of labor. Service contracts are tailored to meet the individual needs of each customer. Service contracts provide
additional services beyond those covered under the warranty, and usually include preventative maintenance service, cleaning,
supplies stocking and cash handling, all of which are not essential to the functionality of the equipment. For sales of service
contracts, where the service contract is the only element of the sale, revenue is recognized ratably over the life of the contract
period. In contracts that involve multiple-element arrangements, amounts deferred for services are determined based upon
vendor specific objective evidence of the fair value of the elements as prescribed in ASC 985-605. The Company determines fair
value of deliverables within a multiple-element arrangement based on the price charged when each element is sold separately or
stated renewal prices.
Physical Security & Facility Revenue The Company’s Physical Security and Facility Products division designs and
manufactures several of the Company’s financial service solutions offerings, including the RemoteTellerTM System (RTS). The
business unit also develops vaults, safe deposit boxes and safes, drive-up banking equipment and a host of other banking facilities
products. Revenue on sales of the products described above is recognized when the four revenue recognition requirements of
ASC 605 have been met.
Election Systems Revenue The Company, through its wholly-owned subsidiary, Procomp Industria Eletronica LTDA, offers
elections systems product solutions and support to the government in Brazil. Election systems revenue consists of election
equipment, networking, tabulation and diagnostic software development, training, support and maintenance. The election
equipment components are included in product revenue. The software development, training, support and maintenance
components are included in service revenue. The election systems contracts can contain multiple elements and custom terms
and conditions. In contracts that involve multiple-elements, amounts deferred for services are based upon the fair value of the
elements as prescribed in FASB ASC 605-25 Revenue Recognition — Multiple-Element Arrangements (ASC 605-25).
Integrated Security Solutions Revenue Diebold Integrated Security Solutions provides global sales, service, installation,
project management and monitoring of original equipment manufacturer (OEM) electronic security products to financial,
government, retail and commercial customers. These solutions provide the Company’s customers a single-source solution to
their electronic security needs. Revenue is recognized in accordance with ASC 605. Revenue on sales of the products described
above is recognized upon shipment, installation or customer acceptance of the product as defined in the customer contract. In
contracts that involve multiple-elements, amounts deferred for services are based upon the fair value of the elements as
prescribed in ASC 605-25.
50
DIEBOLD INCORPORATED AND SUBSIDIARIES
FORM 10-K as of December 31, 2009
NOTES TO CONSOLIDATED FINANCIAL STATEMENTS (Continued)
(dollars in thousands, except per share amounts)

Software Solutions & Service Revenue The Company offers software solutions consisting of multiple applications that
process events and transactions (networking software) along with the related server. Sales of networking software represent
software solutions to customers that allow them to network various different vendors’ ATMs onto one network and revenue is
recognized in accordance with ASC 985-605. Included within service revenue is revenue from software support agreements,
which are typically 12 months in duration and pertain to networking software. For sales of software support agreements, where
the agreement is the only element of the sale, revenue is recognized ratably over the life of the contract period. In contracts that
involve multiple-element arrangements, amounts deferred for support are determined based upon vendor specific objective
evidence of the fair value of the elements as prescribed in ASC 985-605.
Depreciation and Amortization Depreciation of property, plant and equipment is computed using the straight-line method
for financial statement purposes. Accelerated methods of depreciation are used for federal income tax purposes. Amortization of
leasehold improvements is based upon the shorter of original terms of the lease or life of the improvement. Repairs and
maintenance are expensed as incurred. Amortization of the Company’s other long-term assets such as its amortizable intangible
assets and capitalized computer software is computed using the straight-line method over the life of the asset.
Advertising Costs Advertising costs are expensed as incurred and were $8,890, $14,417 and $15,232 in 2009, 2008 and
2007, respectively.
Shipping and Handling Costs The Company recognizes shipping and handling fees billed when products are shipped or
delivered to a customer, and includes such amounts in net sales. Third-party freight payments are recorded in cost of sales.
Taxes on Income In accordance with FASB ASC 740, Income Taxes, deferred taxes are provided on an asset and liability
method, whereby deferred tax assets are recognized for deductible temporary differences and operating loss carry-forwards and
deferred tax liabilities are recognized for taxable temporary differences. Deferred tax assets are reduced by a valuation allowance
when, in the opinion of management, it is more likely than not that some portion or all of the deferred tax assets will not be
realized. Deferred tax assets and liabilities are adjusted for the effects of changes in tax laws and rates on the date of enactment.
Sales Tax The Company collects sales taxes from customers and accounts for sales taxes on a net basis, in accordance with
ASC 605.
Cash Equivalents The Company considers highly liquid investments with original maturities of three months or less at the
time of purchase to be cash equivalents.
Financial Instruments The carrying amount of cash and cash equivalents, trade receivables and accounts payable,
approximated their fair value because of the relatively short maturity of these instruments. The Company’s risk-management
strategy uses derivative financial instruments such as forwards to hedge certain foreign currency exposures and interest rate
swaps to manage interest rate risk. The intent is to offset gains and losses that occur on the underlying exposures, with gains and
losses on the derivative contracts hedging these exposures. The Company does not enter into derivatives for trading purposes
and accounts for its derivative financial instruments in accordance with FASB ASC 815, Derivatives and Hedging (ASC 815). The
Company recognizes all derivatives on the balance sheet at fair value. Changes in the fair values of derivatives that are not
designated as hedges are recognized in earnings. If the derivative is designated and qualifies as a hedge, depending on the nature
of the hedge, changes in the fair value of the derivatives are either offset against the change in the hedged assets or liabilities
through earnings or recognized in other comprehensive income until the hedged item is recognized in earnings.
Allowances for Doubtful Accounts The concentration of credit risk in the Company’s trade receivables with respect to
financial and government customers is largely mitigated by the Company’s credit evaluation process and the geographical
dispersion of sales transactions from a large number of individual customers. The Company maintains allowances for potential
51
DIEBOLD INCORPORATED AND SUBSIDIARIES
FORM 10-K as of December 31, 2009
NOTES TO CONSOLIDATED FINANCIAL STATEMENTS (Continued)
(dollars in thousands, except per share amounts)

credit losses, and such losses have been minimal and within management’s expectations. Since the Company’s receivable
balance is concentrated primarily in the financial and government sectors, an economic downturn in these sectors could result in
higher than expected credit losses. The Company evaluates the collectability of accounts receivable based on (1) a percentage of
sales based on historical loss experience and current trends and (2) periodic adjustments for known events such as specific
customer circumstances and changes in the aging of accounts receivable balances.
Inventories The Company primarily values inventories at the lower of cost or market applied on a first-in, first-out (FIFO)
basis, with the notable exception of Brazil that values inventories using the average cost method, which approximates FIFO. At
each reporting period, the Company identifies and writes down its excess and obsolete inventory to its net realizable value based
on forecasted usage, orders and inventory aging. With the development of new products, the Company also rationalizes its
product offerings and will write-down discontinued product to the lower of cost or net realizable value.
Deferred Revenue Deferred revenue is recorded for any services that are billed to customers prior to revenue being
realizable related to the service being provided. In addition, deferred revenue is recorded for any goods that are billed to and
collected from customers prior to revenue being recognized.
Split-Dollar Life Insurance On January 1, 2008, the Company adopted updated guidance included in FASB ASC 715,
Compensation — Retirement Benefits, which applies to entities that participate in collateral assignment split-dollar life insurance
arrangements that extend into an employee’s retirement period (often referred to as “key person” life insurance) and life
insurance arrangements that provide an employee with a specified benefit that is not limited to the employee’s active service
period. This updated guidance requires employers to recognize a liability for the postretirement obligation associated with a
collateral assignment arrangement if, based on an agreement with an employee, the employer has agreed to maintain a life
insurance policy during the postretirement period or to provide a death benefit. In addition, this updated guidance requires
employers to recognize a liability and related compensation costs for future benefits that extend to postretirement periods. The
adoption of this guidance had a cumulative effect to beginning retained earnings of a reduction of $2,584.
Goodwill On January 1, 2009, the Company adopted updated guidance included in FASB ASC 805 Business Combinations
(ASC 805). This guidance establishes principles and requirements for how the acquirer in a business combination recognizes and
measures in its financial statements the identifiable assets acquired, the liabilities assumed and any noncontrolling interest in the
acquiree. This guidance also provides guidance for recognizing and measuring the goodwill acquired in the business combination
and determines what information to disclose to enable users of the financial statements to evaluate the nature and financial
effects of the business combination. This guidance also requires acquisition-related transaction and restructuring costs to be
expensed rather than treated as a capitalized cost of acquisition. The adoption of this guidance did not have a material impact on
the Company’s consolidated financial statements.
Goodwill is the cost in excess of the net assets of acquired businesses. The Company tests all existing goodwill at least
annually for impairment using the fair value approach on a “reporting unit” basis in accordance with FASB ASC 350, Intangibles —
Goodwill and Other. The Company’s reporting units are defined as Domestic and Canada, Brazil, Latin America, Asia Pacific, and
Europe, Middle East and Africa (EMEA). The Company uses the discounted cash flow method and the guideline company method
for determining the fair value of its reporting units. The determination of implied fair value of the goodwill for a particular reporting
unit is the excess of the fair value of a reporting unit over the amounts assigned to its assets and liabilities in the same manner as
the allocation in a business combination. Implied fair value goodwill is determined as the excess of the fair value of the reporting
unit over the fair value of its assets and liabilities. The Company’s fair value model uses inputs such as estimated future segment
performance. The Company uses the most current information available and performs the annual impairment analysis as of
November 30 each year. However, actual circumstances could differ significantly from assumptions and estimates made and
52
DIEBOLD INCORPORATED AND SUBSIDIARIES
FORM 10-K as of December 31, 2009
NOTES TO CONSOLIDATED FINANCIAL STATEMENTS (Continued)
(dollars in thousands, except per share amounts)

could result in future goodwill impairment. The Company tests for impairment between annual tests if an event occurs or
circumstances change that would more likely than not reduce the carrying value of a reporting unit below its reported amount
(refer to note 9).
Pensions and Postretirement Benefits Annual net periodic expense and benefit liabilities under the Company’s defined
benefit plans are determined on an actuarial basis. Assumptions used in the actuarial calculations have a significant impact on plan
obligations and expense. Annually, management and the Investment Committee of the Board of Directors review the actual
experience compared with the more significant assumptions used and make adjustments to the assumptions, if warranted. The
healthcare trend rates are reviewed based upon the results of actual claims experience. The discount rate is determined by
analyzing the average return of high-quality (i.e., AA-rated) fixed-income investments and the year-over-year comparison of certain
widely used benchmark indices as of the measurement date. The expected long-term rate of return on plan assets is determined
using the plans’ current asset allocation and their expected rates of return based on a geometric averaging over 20 years. The rate
of compensation increase assumptions reflects the Company’s long-term actual experience and future and near-term outlook.
Pension benefits are funded through deposits with trustees. Postretirement benefits are not funded and the Company’s policy is
to pay these benefits as they become due.
In accordance with ASC 715, the Company recognizes the funded status of each of its plans in the consolidated balance
sheet. Amortization of unrecognized net gain or loss resulting from experience different from that assumed and from changes in
assumptions (excluding asset gains and losses not yet reflected in market-related value) is included as a component of net periodic
benefit cost for a year if, as of the beginning of the year, that unrecognized net gain or loss exceeds five percent of the greater of
the projected benefit obligation or the market-related value of plan assets. If amortization is required, the amortization is that
excess divided by the average remaining service period of participating employees expected to receive benefits under the plan.
Comprehensive Income (Loss) The Company displays comprehensive income (loss) in the consolidated statements of
equity and accumulated other comprehensive income (loss) separately from retained earnings and additional capital in the
consolidated balance sheets and statements of equity. Items considered to be other comprehensive income (loss) include
adjustments made for foreign currency translation under FASB ASC 830, Foreign Currency Matters (ASC 830), pension
adjustments, net of tax under ASC 715 and hedging activities under ASC 815.
Accumulated other comprehensive income (loss) consists of the following:
2009 2008 2007
Year Ended December 31,
Foreign currency hedges and translation $153,495 $ 38,319 $138,008
Interest rate hedges (952) (2,877) 2,033
Pensions and other postretirement benefits (35,244) (43,793) (5,474)
117,299 (8,351) 134,567
Income tax benefit (58,020) (64,573) (6,213)
Total accumulated other comprehensive income (loss) $ 59,279 $(72,924) $128,354
Foreign currency translation adjustments are not booked net of tax. Those adjustments are accounted for under the indefinite
reversal criterion of FASB ASC 740-30, Income Taxes — Other Considerations or Special Areas.
53
DIEBOLD INCORPORATED AND SUBSIDIARIES
FORM 10-K as of December 31, 2009
NOTES TO CONSOLIDATED FINANCIAL STATEMENTS (Continued)
(dollars in thousands, except per share amounts)

Recently Adopted Accounting Guidance In December 2009, the Company adopted FASB Accounting Standards Update
(ASU) 2010-02, Consolidation (Topic 810): Accounting and Reporting for Decreases in Ownership of a Subsidiary (ASU 2010-02).
ASU 2010-02 provides amendments to FASB ASC 810-10, Consolidation — Overall (ASC 810-10) and related guidance within
U.S. GAAP to clarify the scope of the decrease in ownership provisions of the Subtopic and related guidance. The amendments in
this update also clarify that the decrease in ownership guidance does not apply to certain transactions even if they involve
businesses. This update is effective for fiscal years ending on or after December 15, 2009 and is only applicable to companies that
have previously adopted guidance included in ASC 810-10, which the Company adopted on January 1, 2009. ASC 810-10 applies
to all entities that have an outstanding noncontrolling interest in one or more subsidiaries or that deconsolidate a subsidiary.
Noncontrolling interests in a subsidiary that were historically recorded within “mezzanine” (or temporary) equity or as a liability are
now included in the equity section of the balance sheet. In addition, this guidance requires expanded disclosures in the financial
statements that clearly identify and distinguish between the interests of the parent’s owners and the interest of the noncontrolling
owners of the subsidiary. The adoption of this guidance did not have a material impact on the Company’s consolidated financial
statements; however, as a result of the adoption of this guidance, the consolidated financial statements for prior periods are
reclassified to report noncontrolling interests.
In December 2009, the Company adopted updated guidance included in FASB ASC 715-20, Compensation — Retirement
Benefits — Defined Benefit Plans — General (ASC 715-20). ASC 715-20 provides guidance on an employer’s disclosures about
plan assets of a defined benefit pension or other postretirement plan. It requires companies to disclose more information about
how investment allocation decisions are made; major categories of plan assets, including concentrations of risk and fair value
measurements and the fair value techniques and inputs used to measure plan assets. The adoption of this guidance did not have a
material impact on the Company’s consolidated financial statements; however, the Company provided additional disclosure as
required by ASC 715-20 in Note 12.
On July 1, 2009, the Company adopted FASB ASU 2009-01, The FASB Accounting Standards Codification and the Hierarchy
of Generally Accepted Accounting Principles (ASU 2009-01), which is included in FASB ASC 105, Generally Accepted Accounting
Principles. ASU 2009-01 establishes the FASB Accounting Standards Codification (the Codification) as the source of authoritative
accounting principles recognized by the FASB to be applied by nongovernmental entities in the preparation of financial statements
in conformity with U.S. GAAP. Rules and interpretive releases of the U.S. Securities and Exchange Commission (SEC) under
authority of federal securities laws are also sources of authoritative U.S. GAAP for SEC registrants. All guidance contained in the
Codification carries an equal level of authority. The Codification superseded all existing non-SEC accounting and reporting
standards. All other non-grandfathered, non-SEC accounting literature not included in the Codification is non-authoritative. The
FASB will not issue new standards in the form of Statements, FASB Staff Positions or Emerging Issues Task Force Abstracts.
Instead, it will issue Accounting Standards Updates (ASUs). The FASB will not consider ASUs as authoritative in their own right.
ASUs will serve only to update the Codification, provide background information about the guidance and provide the basis for
conclusions on the change(s) in the Codification. References made to FASB guidance throughout this annual report on Form 10-K
have been updated for the Codification.
On April 1, 2009, the Company adopted updated guidance included in FASB ASC 855, Subsequent Events (ASC 855), which
establishes general standards of accounting for and disclosure of events that occur after the balance sheet date but before
financial statements are issued or are available to be issued. This guidance sets forth the circumstances under which an entity
should recognize events or transactions occurring after the balance sheet date in its financial statements. This guidance also
requires the disclosure of the date through which an entity has evaluated subsequent events and the basis for that date — that is,
whether that date represents the date the financial statements were issued or were available to be issued. The adoption of this
54
DIEBOLD INCORPORATED AND SUBSIDIARIES
FORM 10-K as of December 31, 2009
NOTES TO CONSOLIDATED FINANCIAL STATEMENTS (Continued)
(dollars in thousands, except per share amounts)

guidance did not have a material impact on the Company’s consolidated financial statements; however, the Company provided
additional disclosure as required by ASC 855 in Note 22.
On January 1, 2009, the Company adopted updated guidance included in ASC 815. This guidance applies to all entities and
requires specified disclosures for derivative instruments and related hedged items. This guidance requires additional disclosure to
provide financial statement users with a better understanding of how and why an entity uses derivatives, how derivative
instruments and related hedged items are accounted for, and how derivative instruments and related hedged items affect an
entity’s financial position, financial performance and cash flows. The adoption of this guidance did not have a material impact on
the Company’s consolidated financial statements; however, the Company provided additional disclosure as required by ASC 815
in note 16.
On January 1, 2009, the Company adopted updated guidance included in ASC 805. This guidance amends and clarifies the
initial recognition and measurement, subsequent measurement and accounting and related disclosures of assets and liabilities
arising from contingencies in a business combination. The adoption of this guidance had no impact on the Company’s consolidated
financial statements.
Recently Issued Accounting Guidance In February 2010, the FASB issued ASU 2010-09, Subsequent Events
(ASU 2010-09), which updates ASC 855. ASU 2010-09 removes the requirement to disclose the date through which an entity
has evaluated subsequent events. ASU 2010-09 clarifies that an entity that is a conduit bond obligor for conduit debt securities that
are traded in a public market must evaluate subsequent events through the date of issuance of its financial statements and must
disclose such date. ASU 2010-09 is effective for interim annual periods beginning after June 15, 2010. The adoption of
ASU 2010-09 is not expected to have a material impact on the financial statements of the Company.
In January 2010, the FASB issued ASU 2010-06, Fair Value Measurements and Disclosures (ASU 2010-06). ASU 2010-06
updates FASB ASC 820, Fair Value Measurements (ASC 820). ASU 2010-06 requires additional disclosures about fair value
measurements including transfers in and out of Levels 1 and 2 and a higher level of disaggregation for the different types of
financial instruments. For the reconciliation of Level 3 fair value measurements, information about purchases, sales, issuances
and settlements should be presented separately. ASU 2010-06 is effective for interim and annual periods beginning after
December 15, 2010. The adoption of ASU 2010-06 is not expected to have a material impact on the financial statements of the
Company.
In October 2009, the FASB issued ASU 2009-13, Multiple-Deliverable Revenue Arrangements, (amendments to ASC 605)
(ASU 2009-13), and ASU 2009-14, Certain Arrangements That Include Software Elements (amendments to FASB ASC 985,
Software) (ASU 2009-14). ASU 2009-13 requires entities to allocate revenue in an arrangement using estimated selling prices of
deliverables if a vendor does not have vendor-specific objective evidence (VSOE) or third-party evidence of selling price. The
amendments eliminate the residual method of revenue allocation and require revenue to be allocated using the relative selling
price method. ASU 2009-14 removes tangible products from the scope of software revenue guidance and provides guidance on
determining whether software deliverables in an arrangement that includes a tangible product are covered by the scope of the
software revenue guidance. ASU 2009-13 and ASU 2009-14 should be applied on a prospective basis for revenue arrangements
entered into or materially modified in fiscal years beginning on or after June 15, 2010, with early adoption permitted. The Company
elected to early adopt ASU 2009-13 and ASU 2009-14 during the first quarter of fiscal 2010 and there was no material impact on
the Company’s consolidated financial statements.
In June 2009, the FASB issued updated guidance included in FASB ASC 860-10, Transfers and Servicing — Overall. This
guidance requires additional disclosures about the transfer and de-recognition of financial assets and eliminates the concept of
55
DIEBOLD INCORPORATED AND SUBSIDIARIES
FORM 10-K as of December 31, 2009
NOTES TO CONSOLIDATED FINANCIAL STATEMENTS (Continued)
(dollars in thousands, except per share amounts)

qualifying special-purpose entities. This guidance is effective for fiscal years beginning after November 15, 2009. The adoption of
this guidance is not expected to have an impact on the Company’s consolidated financial statements.
In June 2009, the FASB issued updated guidance included in FASB ASC 810-10, related to the consolidation of variable
interest entities. This guidance will require ongoing reassessments of whether an enterprise is the primary beneficiary of a
variable interest entity. In addition, this updated guidance amends the quantitative approach for determining the primary
beneficiary of a variable interest entity. ASC 810-10 amends certain guidance for determining whether an entity is a variable
interest entity and adds additional reconsideration events for determining whether an entity is a variable interest entity. Further,
this guidance requires enhanced disclosures that will provide users of financial statements with more transparent information
about an enterprise’s involvement in a variable interest entity. This updated guidance is effective as of the beginning of the first
annual reporting period and interim reporting periods that begin after November 15, 2009. The adoption of this guidance is not
expected to have an impact on the Company’s consolidated financial statements.
NOTE 2: EARNINGS PER SHARE
Basic and diluted earnings per share are calculated in accordance with FASB ASC 260, Earnings Per Share. Under this
guidance, unvested share-based payment awards that contain rights to receive non-forfeitable dividends are considered
participating securities and the two-class method of computing earnings per share is required for all periods presented.
The Company’s participating securities include restricted stock units, deferred shares and shares that were vested but
deferred by the employee. The Company has calculated basic and diluted earnings per share under both the treasury stock
method and the two-class method. For the years ended December 31, 2009, 2008 and 2007, there was no impact in the per share
amounts calculated under the two methods. Accordingly, the treasury stock method continues to be disclosed below.
56
DIEBOLD INCORPORATED AND SUBSIDIARIES
FORM 10-K as of December 31, 2009
NOTES TO CONSOLIDATED FINANCIAL STATEMENTS (Continued)
(dollars in thousands, except per share amounts)

The following data show the amounts used in computing earnings per share and the effect on the weighted-average number
of shares of dilutive potential common stock:
2009 2008 2007
December 31,
Numerator:
Income used in basic and diluted earnings per share:
Income from continuing operations, net of tax $ 73,102 $107,781 $ 97,828
Loss from discontinued operations, net of tax (47,076) (19,198) (58,287)
Net income $ 26,026 $ 88,583 $ 39,541
Denominator:
Weighted-average number of common shares used in basic earnings per share 66,257 66,081 65,841
Effect of dilutive shares 610 411 832
Weighted-average number of shares used in diluted earnings per share 66,867 66,492 66,673
Basic earnings per share:
Income from continuing operations, net of tax $ 1.10 $ 1.63 $ 1.49
Loss from discontinued operations, net of tax (0.71) (0.29) (0.89)
Net income $ 0.39 $ 1.34 $ 0.60
Diluted earnings per share:
Income from continuing operations, net of tax $ 1.09 $ 1.62 $ 1.47
Loss from discontinued operations, net of tax (0.70) (0.29) (0.88)
Net income $ 0.39 $ 1.33 $ 0.59
Anti-dilutive shares not used in calculating diluted weighted-average shares 2,360 2,469 1,141
NOTE 3: SHARE-BASED COMPENSATION AND EQUITY
Dividends On the basis of amounts declared and paid, the annualized dividends per share were $1.04, $1.00 and $0.94 for
the years ended December 31, 2009, 2008 and 2007, respectively.
Share-Based Compensation Cost The Company recognizes costs resulting from all share-based payment transactions
based on the fair market value of the award as of the grant date. The Company uses the modified prospective application method
to record compensation cost related to stock awards that were unvested as of December 31, 2005 by recognizing the
unamortized grant date fair value over the remaining requisite periods of those awards. Awards granted after December 31,
2005 are valued at fair value in accordance with provisions of ASC 718 and compensation cost is recognized on a straight-line basis
over the requisite periods of each award. The Company estimated forfeiture rates for the year ended December 31, 2009 based on
historical experience. The number of common shares that may be issued pursuant to the Amended and Restated 1991 Equity and
Performance Incentive Plan (as amended and restated as of April 13, 2009) (1991 Plan) was 8,355,362, of which 4,523,719 shares
were available for issuance at December 31, 2009.
57
DIEBOLD INCORPORATED AND SUBSIDIARIES
FORM 10-K as of December 31, 2009
NOTES TO CONSOLIDATED FINANCIAL STATEMENTS (Continued)
(dollars in thousands, except per share amounts)
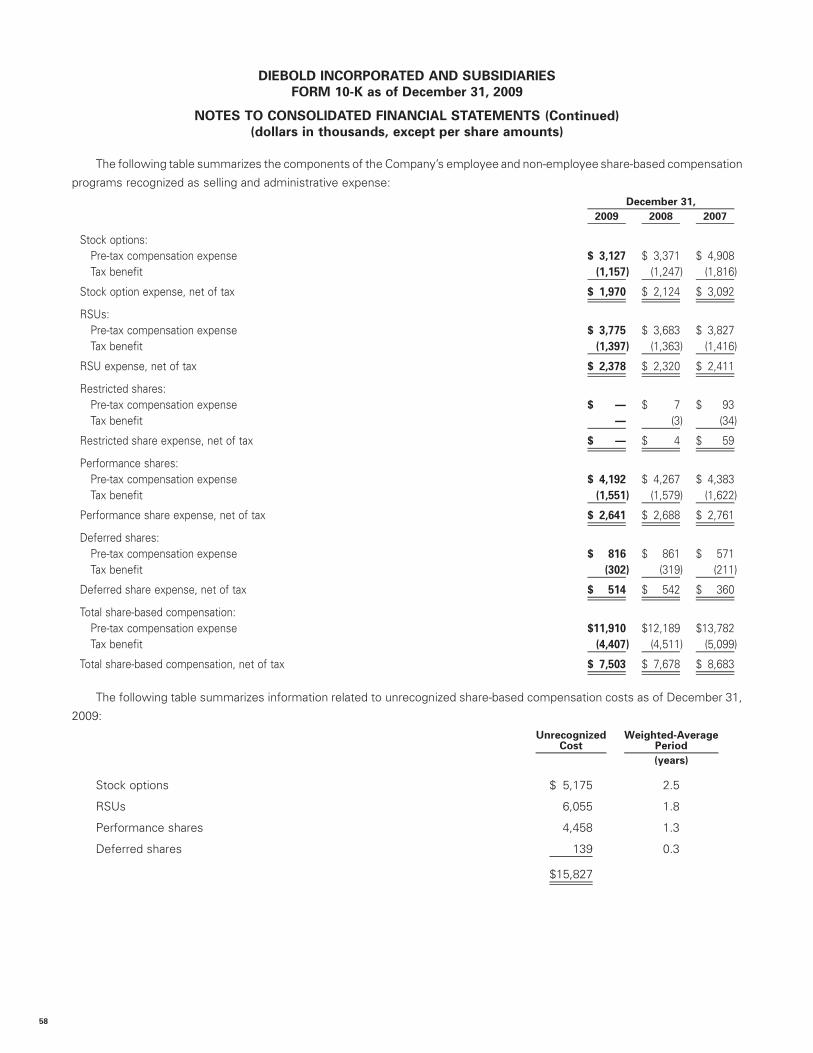
The following table summarizes the components of the Company’s employee and non-employee share-based compensation
programs recognized as selling and administrative expense:
2009 2008 2007
December 31,
Stock options:Pre-tax compensation expense $ 3,127 $ 3,371 $ 4,908Tax benefit (1,157) (1,247) (1,816)
Stock option expense, net of tax $ 1,970 $ 2,124 $ 3,092
RSUs:Pre-tax compensation expense $ 3,775 $ 3,683 $ 3,827Tax benefit (1,397) (1,363) (1,416)
RSU expense, net of tax $ 2,378 $ 2,320 $ 2,411
Restricted shares:Pre-tax compensation expense $ — $ 7 $ 93Tax benefit — (3) (34)
Restricted share expense, net of tax $ — $ 4 $ 59
Performance shares:Pre-tax compensation expense $ 4,192 $ 4,267 $ 4,383Tax benefit (1,551) (1,579) (1,622)
Performance share expense, net of tax $ 2,641 $ 2,688 $ 2,761
Deferred shares:Pre-tax compensation expense $ 816 $ 861 $ 571Tax benefit (302) (319) (211)
Deferred share expense, net of tax $ 514 $ 542 $ 360
Total share-based compensation:Pre-tax compensation expense $11,910 $12,189 $13,782Tax benefit (4,407) (4,511) (5,099)
Total share-based compensation, net of tax $ 7,503 $ 7,678 $ 8,683
The following table summarizes information related to unrecognized share-based compensation costs as of December 31,
2009:
UnrecognizedCost
Weighted-AveragePeriod
(years)
Stock options $ 5,175 2.5
RSUs 6,055 1.8
Performance shares 4,458 1.3
Deferred shares 139 0.3
$15,827
58
DIEBOLD INCORPORATED AND SUBSIDIARIES
FORM 10-K as of December 31, 2009
NOTES TO CONSOLIDATED FINANCIAL STATEMENTS (Continued)
(dollars in thousands, except per share amounts)

EMPLOYEE SHARE-BASED COMPENSATION AWARDS
Stock options, restricted stock units (RSUs), restricted shares and performance shares have been issued to officers and other
management employees under the Company’s 1991 Plan.
Stock Options
Stock options generally vest over a four- or five-year period and have a maturity of ten years from the issuance date. Option
exercise prices equal the closing price of the Company’s common stock on the date of grant. The estimated fair value of the
options granted was calculated using a Black-Scholes option pricing model using these assumptions:
2009 2008 2007
December 31,
Expected life (in years) 5-6 5-7 6
Weighted-average volatility 40% 27% 28%
Risk-free interest rate 1.76 – 2.55% 2.71 – 3.14% 3.64 – 4.72%
Expected dividend yield 2.23 – 2.43% 1.97 – 1.86% 1.63%
The Company uses historical data to estimate option exercise timing within the valuation model. Employees with similar
historical exercise behavior with regard to timing and forfeiture rates are considered separately for valuation and attribution
purposes. Expected volatility is based on historical volatility of the price of the Company’s common stock. The risk-free rate of
interest is based on a zero-coupon U.S. government instrument over the expected life of the equity instrument. The expected
dividend yield is based on actual dividends paid per share and the price of the Company’s common stock.
Options outstanding and exercisable as of December 31, 2009 and changes during the year ended were as follows:
Number of SharesWeighted-Average
Exercise Price
Weighted-AverageRemaining
Contractual TermAggregate Intrinsic
Value(1)
(per share) (in years)
Outstanding at
January 1, 2009 2,928,967 $39.43
Options expired or forfeited (226,837) 36.01
Options exercised (65,975) 29.35
Options granted 467,000 24.89
Outstanding at
December 31, 2009 3,103,155 $37.84 5 $2,761
Options exercisable at
December 31, 2009 2,140,422 $41.49 4 $ 398
(1) The aggregate intrinsic value represents the total pre-tax intrinsic value (the difference between the Company’s closing stock price on the last trading day of the year
in 2009 and the exercise price, multiplied by the number of “in-the-money” options) that would have been received by the option holders had all option holders
exercised their options on December 31, 2009. The amount of aggregate intrinsic value will change based on the fair market value of the Company’s common stock.
The aggregate intrinsic value of options exercised for the years ended December 31, 2009, 2008 and 2007 was $422, $0 and
$3,475, respectively. The weighted-average grant-date fair value of stock options granted for the years ended December 31, 2009,
2008 and 2007 was $7.85, $6.61 and $14.06, respectively. Total fair value of stock options vested for the years ended
59
DIEBOLD INCORPORATED AND SUBSIDIARIES
FORM 10-K as of December 31, 2009
NOTES TO CONSOLIDATED FINANCIAL STATEMENTS (Continued)
(dollars in thousands, except per share amounts)

December 31, 2009, 2008 and 2007 was $27,979, $27,954 and $27,243, respectively. Exercise of options during the year ended
December 31, 2009, 2008 and 2007 resulted in cash receipts of $1,514, $0 and $8,544, respectively. The tax (expense)/benefit
during the years ended December 31, 2009, 2008 and 2007 related to the exercise of employee stock options were $(1,160),
$(2,122) and $311, respectively.
Restricted Stock Units
RSUs provide for the issuance of a share of the Company’s common stock at no cost to the holder and generally vest after
three to seven years. During the vesting period, employees are paid the cash equivalent of dividends on RSUs. Unvested RSUs are
forfeited upon termination unless the Board of Directors determines otherwise. Unvested RSUs outstanding as of December 31,
2009 and changes during the year ended were as follows:
Number of Shares
Weighted-AverageGrant-Date Fair
Value
Unvested at January 1, 2009 388,576 $38.36Forfeited (20,492) 33.51Vested (96,300) 39.77Granted 198,655 24.99
Unvested at December 31, 2009 470,439 $32.64
The weighted-average grant-date fair value of RSUs granted for the years ended December 31, 2009, 2008 and 2007 was
$24.99, $28.13 and $47.17, respectively. The aggregate intrinsic value of RSUs vested during the years ended December 31,
2009, 2008 and 2007 was $3,830, $2,627 and $3,998, respectively.
Performance Shares
Performance shares are granted based on certain management objectives, as determined by the Board of Directors each
year. Each performance share earned entitles the holder to one common share. The performance share objectives are generally
calculated over a three-year period and no shares are granted unless certain management threshold objectives are met. To cover
the exercise and/or vesting of its share-based payments, the Company generally issues new shares from its authorized, unissued
share pool. Unvested performance shares outstanding as of December 31, 2009 and changes during the year ended were as
follows:
Number of Shares
Weighted-AverageGrant-Date Fair
Value
Unvested at January 1, 2009 604,942 $44.31Forfeited (97,043) 46.30Vested (110,271) 48.31Granted 321,000 29.25
Unvested at December 31, 2009 718,628 $36.70
Unvested performance shares are based on a maximum potential payout. Actual shares granted at the end of the
performance period may be less than the maximum potential payout level depending on achievement of performance share
objectives. The weighted-average grant-date fair value of performance shares granted for the years ended December 31, 2009,
2008 and 2007 was $29.25, $28.91 and $58.65, respectively. The aggregate intrinsic value of performance shares vested during
the years ended December 31, 2009, 2008 and 2007 was $5,327, $857 and $2,545, respectively.
60
DIEBOLD INCORPORATED AND SUBSIDIARIES
FORM 10-K as of December 31, 2009
NOTES TO CONSOLIDATED FINANCIAL STATEMENTS (Continued)
(dollars in thousands, except per share amounts)

NON-EMPLOYEE SHARE BASED COMPENSATION AWARDS
Director Deferred Shares
Deferred shares have been issued to non-employee directors under the Company’s 1991 Plan. Deferred shares provide for
the issuance of a share of the Company’s common stock at no cost to the holder. Deferred shares vest in either a six- or twelve-
month period and are issued at the end of the deferral period. During the vesting period and until the common shares are issued,
non-employee directors are paid the cash equivalent of dividends on deferred shares.
Deferred shares outstanding as of December 31, 2009 and changes during the year ended were as follows:
Number of Shares
Weighted-AverageGrant-Date Fair
Value
Outstanding at January 1, 2009 37,500 $42.24Released (3,700) 42.71Granted 31,500 25.52
Outstanding at December 31, 2009 65,300 $34.15
The weighted-average grant-date fair value of deferred shares granted for the years ended December 31, 2009, 2008 and
2007 was $25.52, $38.52 and $48.21, respectively. The aggregate intrinsic value of deferred shares vested during the years ended
December 31, 2009, 2008 and 2007 was $158, $0 and $0, respectively.
Other Non-employee Share-Based Compensation
In connection with the acquisition of Diebold Colombia, S.A. in December 2006, the Company issued 6,652 restricted shares
with a grant-date fair value of $46.00 per share. These restricted shares vest in December 2011. The Company also issued
warrants to purchase 34,789 common shares with an exercise price of $46.00 per share and grant-date fair value of $14.66 per
share. The grant-date fair value of the warrants was valued using the Black-Scholes option pricing model with the following
assumptions: risk-free interest rate of 4.45 percent, dividend yield of 1.63 percent, expected volatility of 30 percent, and
contractual life of six years. The warrants vest 20 percent per year for five years and will expire in December 2016.
NOTE 4: INCOME TAXES
The components of income (loss) from continuing operations before income taxes were as follows:
2009 2008 2007
Year Ended December 31,
Domestic $ (16,108) $ 4,105 $ 35,136Foreign 139,915 152,212 110,517
Total $123,807 $156,317 $145,653
61
DIEBOLD INCORPORATED AND SUBSIDIARIES
FORM 10-K as of December 31, 2009
NOTES TO CONSOLIDATED FINANCIAL STATEMENTS (Continued)
(dollars in thousands, except per share amounts)

Income tax expense (benefit) from continuing operations is comprised of the following components:
2009 2008 2007
Year Ended December 31,
Current:U.S. Federal $(24,688) $ 18,440 $10,036Foreign 47,044 40,336 32,052State and local 3,849 4,620 2,060
Total current 26,205 63,396 44,148Deferred:
U.S. Federal 26,972 (21,354) (8,081)Foreign (6,267) (477) 2,061State and local (2,433) (69) 2,286
Total deferred 18,272 (21,900) (3,734)
Total income tax expense $ 44,477 $ 41,496 $40,414
In addition to the income tax expenses listed above for the years ended December 31, 2009, 2008, and 2007, income tax
expense (benefit) allocated directly to equity for the same periods were $8,066, $(55,782), and $16,144, respectively.
Income tax benefit allocated to discontinued operations for the years ended December 31, 2009, 2008, and 2007 were
$(7,374), $(12,744), and $(3,664), respectively. Income tax benefit allocated to the loss on sale of discontinued operations for the
year ended December 31, 2009 was $(13,558).
A reconciliation of the U.S. statutory tax rate and the effective tax rate for continuing operations is as follows:
2009 2008 2007
Year Ended December 31,
Statutory tax rate 35.0% 35.0% 35.0%State and local income taxes, net of federal tax benefit 0.7 1.9 1.9Foreign income taxes (9.6) (8.6) (0.8)U.S. taxed foreign income 0.8 (2.4) (2.5)Subsidiary losses (2.9) (1.0) (6.1)Life insurance (2.1) (0.9) (0.7)SEC charge 7.1 — —Out-of-period adjustments 7.1 3.4 —Other (0.2) (0.9) 0.9
Effective tax rate 35.9% 26.5% 27.7%
In the fourth quarter of 2009, the Company recorded adjustments to increase income tax expense on continuing operations
by approximately $9,000 relating to immaterial errors originating in prior years. The adjustments were composed primarily of four
items: (1) a decrease to income tax expense of $1,029 due to an overstatement of income tax expense in 2004 relating to the
reconciliation of the book basis to the tax basis of the Company’s finance receivables; (2) a net increase to income tax expense of
$1,994 due to overstatements and understatements of income tax expense in the years 1999 through 2008 relating to the income
taxes on the Company’s equity investment income; (3) an increase to income tax expense of $5,197 due to an understatement of
income tax expense in the years 2003 through 2008 relating to corporate income taxes on the Company’s foreign subsidiaries’
passive investment income; and (4) an increase to income tax expense of $2,604 due to an understatement of income tax
62
DIEBOLD INCORPORATED AND SUBSIDIARIES
FORM 10-K as of December 31, 2009
NOTES TO CONSOLIDATED FINANCIAL STATEMENTS (Continued)
(dollars in thousands, except per share amounts)
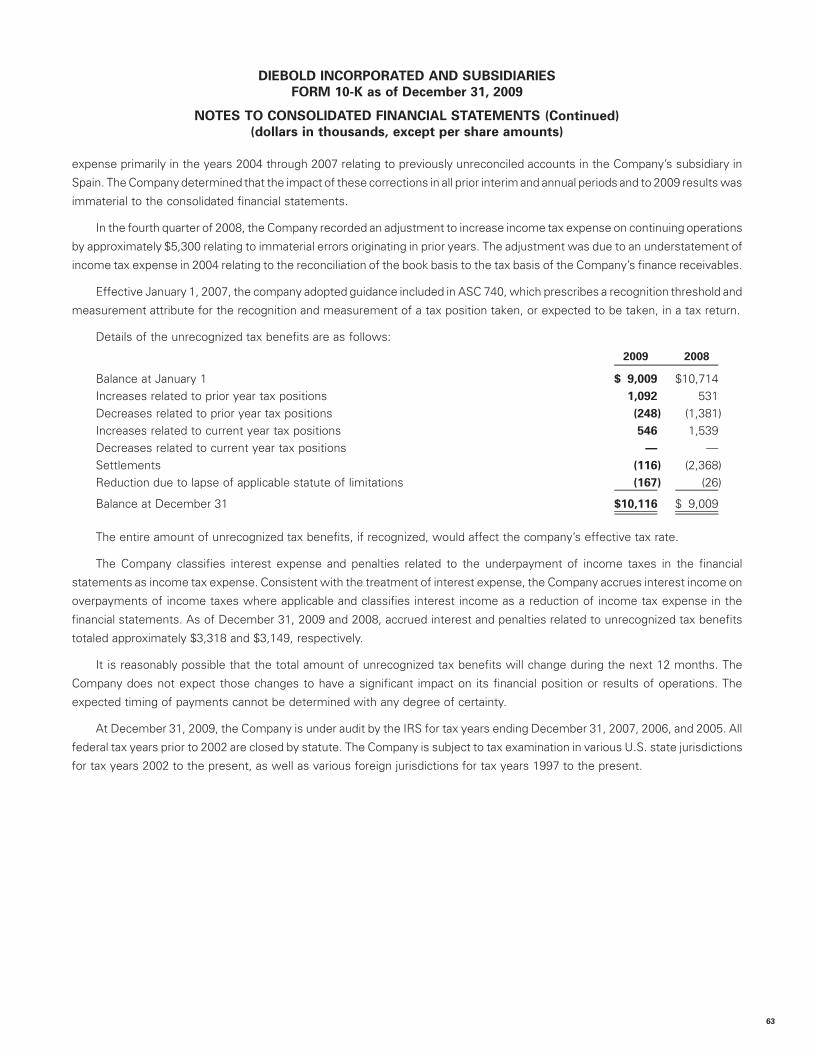
expense primarily in the years 2004 through 2007 relating to previously unreconciled accounts in the Company’s subsidiary in
Spain. The Company determined that the impact of these corrections in all prior interim and annual periods and to 2009 results was
immaterial to the consolidated financial statements.
In the fourth quarter of 2008, the Company recorded an adjustment to increase income tax expense on continuing operations
by approximately $5,300 relating to immaterial errors originating in prior years. The adjustment was due to an understatement of
income tax expense in 2004 relating to the reconciliation of the book basis to the tax basis of the Company’s finance receivables.
Effective January 1, 2007, the company adopted guidance included in ASC 740, which prescribes a recognition threshold and
measurement attribute for the recognition and measurement of a tax position taken, or expected to be taken, in a tax return.
Details of the unrecognized tax benefits are as follows:
2009 2008
Balance at January 1 $ 9,009 $10,714Increases related to prior year tax positions 1,092 531Decreases related to prior year tax positions (248) (1,381)Increases related to current year tax positions 546 1,539Decreases related to current year tax positions — —Settlements (116) (2,368)Reduction due to lapse of applicable statute of limitations (167) (26)
Balance at December 31 $10,116 $ 9,009
The entire amount of unrecognized tax benefits, if recognized, would affect the company’s effective tax rate.
The Company classifies interest expense and penalties related to the underpayment of income taxes in the financial
statements as income tax expense. Consistent with the treatment of interest expense, the Company accrues interest income on
overpayments of income taxes where applicable and classifies interest income as a reduction of income tax expense in the
financial statements. As of December 31, 2009 and 2008, accrued interest and penalties related to unrecognized tax benefits
totaled approximately $3,318 and $3,149, respectively.
It is reasonably possible that the total amount of unrecognized tax benefits will change during the next 12 months. The
Company does not expect those changes to have a significant impact on its financial position or results of operations. The
expected timing of payments cannot be determined with any degree of certainty.
At December 31, 2009, the Company is under audit by the IRS for tax years ending December 31, 2007, 2006, and 2005. All
federal tax years prior to 2002 are closed by statute. The Company is subject to tax examination in various U.S. state jurisdictions
for tax years 2002 to the present, as well as various foreign jurisdictions for tax years 1997 to the present.
63
DIEBOLD INCORPORATED AND SUBSIDIARIES
FORM 10-K as of December 31, 2009
NOTES TO CONSOLIDATED FINANCIAL STATEMENTS (Continued)
(dollars in thousands, except per share amounts)

Deferred income taxes reflect the net tax effects of temporary differences between the carrying amount of assets and
liabilities for financial reporting purposes and the amounts used for income tax purposes. Significant components of the
Company’s deferred tax assets and liabilities are as follows:
2009 2008
December 31,
Deferred tax assets:
Postretirement benefits $ 6,948 $ 7,799Accrued expenses 44,304 35,873Warranty accrual 18,394 12,012Deferred compensation 16,936 16,984Bad debts 6,926 7,916Inventory 15,922 19,443Deferred revenue 6,095 19,144Pension 27,067 41,935Research and development credit 6,228 3,170Foreign tax credit 36,722 20,550Net loss carryforward 95,606 115,002Capital losses 4,323 —State deferred taxes 5,613 12,329Other 7,581 4,723
298,665 316,880Valuation allowance (112,839) (97,188)
Net deferred tax assets $ 185,826 $219,692
Deferred tax liabilities:
Property, plant and equipment $ 21,707 $ 15,287Goodwill 58,620 47,193Finance receivables 8,110 6,660Software capitalized 325 4,310Partnership income 19,486 15,445Undistributed earnings 2,512 —Other 2,342 1,320
Net deferred tax liabilities 113,102 90,215
Net deferred tax asset $ 72,724 $129,477
At December 31, 2009, the Company’s domestic and international subsidiaries had deferred tax assets relating to net
operating loss (NOL) carryforwards of $95,606. Of these NOL carryforwards, $37,753 expires at various times between 2010 and
2029. The remaining NOL carryforwards of approximately $57,853 do not expire. The Company has a valuation allowance to
reflect the estimated amount of deferred tax assets that, more likely than not, will not be realized. The valuation allowance relates
primarily to certain international and state NOLs. The net change in total valuation allowance for the years ended December 31,
2009 and 2008 was an increase of $15,651 and $11,759, respectively. The 2009 increase is primarily attributable to the change in
valuation allowances related to deferred tax assets in foreign jurisdictions and to capital losses domestically.
A determination of the unrecognized deferred tax liability on undistributed earnings of non-U.S. subsidiaries is not practicable.
However, no liability for U.S. income taxes on such undistributed earnings of these subsidiaries has been provided because it is
64
DIEBOLD INCORPORATED AND SUBSIDIARIES
FORM 10-K as of December 31, 2009
NOTES TO CONSOLIDATED FINANCIAL STATEMENTS (Continued)
(dollars in thousands, except per share amounts)

the Company’s policy to reinvest these earnings indefinitely in operations outside the United States. The Company has recorded,
however, a tax provision in the amount of $2,512 for an investment in a foreign unconsolidated affiliate related to the portion of
undistributed earnings that are not considered to be permanently reinvested.
NOTE 5: INVESTMENTS
The Company’s investments, primarily in Brazil, consist of certificates of deposit and U.S. dollar indexed bond funds are
classified as available-for-sale and stated at fair value based upon quoted market prices and net asset values, respectively.
Deposits with banks and money market funds classified as short-term investments include accrued interest. Marketable
securities within the Company’s rabbi trust (refer to note 12) are recorded at fair value based on quoted market prices. Realized
and unrealized gains and losses on marketable securities in the rabbi trust are recognized in investment income.
The Company’s investments, excluding cash surrender value of insurance contracts of $65,489 and $62,934 as of Decem-
ber 31, 2009 and 2008, respectively, consist of the following:
Cost BasisUnrealizedGain/(Loss) Fair Value
As of December 31, 2009
Short-term investments:Certificates of deposit $157,216 $ — $157,216U.S. dollar indexed bond funds 20,226 — 20,226
$177,442 $ — $177,442
Long-term investments:Assets held in a rabbi trust $ 9,400 $ (900) $ 8,500
As of December 31, 2008
Short-term investments:Certificates of deposit and other $121,387 $ — $121,387
Long-term investments:Assets held in a rabbi trust $ 10,926 $(2,942) $ 7,984
65
DIEBOLD INCORPORATED AND SUBSIDIARIES
FORM 10-K as of December 31, 2009
NOTES TO CONSOLIDATED FINANCIAL STATEMENTS (Continued)
(dollars in thousands, except per share amounts)

NOTE 6: FINANCE RECEIVABLES
Through its wholly-owned subsidiaries, the Company provides financing arrangements to customers purchasing its products.
These financing arrangements are largely classified and accounted for as sales-type leases in accordance with FASB ASC 840,
Leases. As of December 31, 2009, the Company’s net investment in sales-type leases included $40,856 related to a customer
financing arrangement in Brazil. The components of finance receivables for the Company’s net investment in sales-type leases are
as follows:
2009 2008
December 31,
Total minimum lease receivable $105,080 $47,885Estimated unguaranteed residual values 5,274 4,558
110,354 52,443Less:
Unearned interest income (17,942) (5,164)Unearned residuals (1,182) (1,133)
(19,124) (6,297)
Total $ 91,230 $46,146
Future minimum payments due from customers under sales-type leases as of December 31, 2009 are as follows:
2010 $ 38,0482011 28,3282012 24,7812013 10,4052014 2,543Thereafter 975
$105,080
The Company provides an allowance for credit losses related to finance receivables representing amounts reserved for
estimated uncollectible balances. This allowance related to finance receivables is calculated based on (1) reserves for specific
customer accounts based on unique circumstances, changes in credit risk, payment patterns and changes in the aging of accounts
receivable balances, and (2) a percentage of aged customer balances which is based on historical loss experience and current
trends.
NOTE 7: INVENTORIES
Major classes of inventories are summarized as follows:
2009 2008
December 31,
Finished goods $196,110 $276,439Service parts 145,719 144,742Work in process 56,492 54,752Raw materials 49,922 65,038
Total inventories $448,243 $540,971
66
DIEBOLD INCORPORATED AND SUBSIDIARIES
FORM 10-K as of December 31, 2009
NOTES TO CONSOLIDATED FINANCIAL STATEMENTS (Continued)
(dollars in thousands, except per share amounts)

NOTE 8: PROPERTY, PLANT AND EQUIPMENT
The following is a summary of property, plant and equipment, at cost less accumulated depreciation and amortization:
EstimatedUseful Life
(years) 2009 2008
December 31,
Land and land improvements 0-15 $ 6,292 $ 6,178Buildings and building equipment 15 61,403 59,230Machinery, tools and equipment 5-12 119,378 107,918Leasehold improvements(1) 10 23,607 20,811Computer equipment 3-5 80,274 75,869Computer software 5-10 158,303 150,387Furniture and fixtures 5-8 74,446 72,486Tooling 3-5 76,834 76,228Construction in progress 12,840 10,844
Total property plant and equipment 613,377 579,951Less accumulated depreciation and amortization 408,557 376,357
Total property plant and equipment, net $204,820 $203,594
(1) The estimated useful life for leasehold improvements is the lesser of 10 years or the term of the lease.
During 2009, 2008 and 2007, depreciation expense, computed on a straight-line basis over the estimated useful lives of the
related assets, was $50,085, $55,295 and $45,549, respectively.
NOTE 9: GOODWILL AND OTHER ASSETS
The changes in carrying amounts of goodwill are summarized as follows:
DNA DI Total
Goodwill $111,799 $392,544 $504,343Accumulated impairment losses — (38,859) (38,859)
Balance at January 1, 2008 111,799 353,685 465,484
Goodwill acquired 4,320 758 5,078Impairment loss (13,171) — (13,171)Currency translation adjustment (6,583) (42,505) (49,088)
Goodwill 109,536 350,797 460,333Accumulated impairment losses (13,171) (38,859) (52,030)
Balance at December 31, 2008 96,365 311,938 408,303
Goodwill acquired 2,326 55 2,381Currency translation adjustment 258 39,995 40,253
Goodwill 112,120 390,847 502,967Accumulated impairment losses (13,171) (38,859) (52,030)
Balance at December 31, 2009 $ 98,949 $351,988 $450,937
67
DIEBOLD INCORPORATED AND SUBSIDIARIES
FORM 10-K as of December 31, 2009
NOTES TO CONSOLIDATED FINANCIAL STATEMENTS (Continued)
(dollars in thousands, except per share amounts)

The Company uses the most current information available and performs the annual impairment analysis as of November 30
each year. However, actual circumstances could differ significantly from assumptions and estimates made and could result in
future goodwill impairment. The Company tests for impairment between annual tests if an event occurs or circumstances change
that would more likely than not reduce the carrying value of a reporting unit below its reported amount.
Goodwill is reviewed for impairment based on a two-step test. In the first step, the Company compares the fair value of each
reporting unit with its net book value. The fair value is determined based upon discounted estimated future cash flows as well as
the market approach or guideline public company method. The Company’s Step I impairment test of goodwill of a reporting unit is
based upon the fair value of the reporting unit, defined as the price that would be received to sell the net assets or transfer the net
liabilities in an orderly transaction between market participants at the assessment date (November 30). In the event that the net
carrying amount exceeds the fair value, a Step II test must be performed whereby the fair value of the reporting unit’s goodwill
must be estimated to determine if it is less than its net carrying amount.
The valuation techniques used in the Step I impairment test have incorporated a number of assumptions that the Company
believes to be reasonable and to reflect forecasted market conditions at the assessment date. Assumptions in estimating future
cash flows are subject to a high degree of judgment. The Company makes all efforts to forecast future cash flows as accurately as
possible with the information available at the time a forecast is made. To this end, the Company evaluates the appropriateness of
its assumptions as well as its overall forecasts by comparing projected results of upcoming years with actual results of preceding
years and validating that differences therein are reasonable. Key assumptions, all of which are Level 3 inputs (refer to note 18),
relate to price trends, material costs, discount rate, customer demand, and the long-term growth and foreign exchange rates. A
number of benchmarks from independent industry and other economic publications were also used. Changes in assumptions and
estimates after the assessment date may lead to an outcome where impairment charges would be required in future periods.
Specifically, actual results may vary from the Company’s forecasts and such variations may be material and unfavorable, thereby
triggering the need for future impairment tests where the conclusions may differ in reflection of prevailing market conditions.
The annual goodwill impairment test for 2009, 2008 and 2007 resulted in no impairment related to income from continuing
operations. In the 2009 Step I impairment test, the Company concluded the Brazil reporting unit had limited excess fair value of
approximately $27,000 or 6.5 percent when compared to its carrying amount. The carrying amount of goodwill in the Company’s
Brazil reporting unit was $115,395 as of December 31, 2009.
In addition, the Company’s fourth quarter 2008 decision to close its security business in the EMEA region resulted in an
impairment of $13,171 to the Domestic and Canada reporting unit goodwill. This impairment charge is reflected in loss from
discontinued operations for the year ended December 31, 2008. Upon initial acquisition, the goodwill related to the EMEA security
business was classified within the Company’s Domestic and Canada reporting unit for goodwill impairment testing. The annual
goodwill impairment test for 2007 resulted in an impairment charge of $46,319 related to the Elections Systems reporting unit
goodwill and represented the carrying value of Premier Election Solutions Inc. (PESI) goodwill, which is reflected in loss from
discontinued operations for the year ended December 31, 2007.
Other Assets On January 1, 2009, the Company adopted updated guidance included in FASB ASC 350-30-35, General
Intangibles Other than Goodwill — Subsequent Measurement, which provides a list of factors an entity should consider in
developing renewal or extension assumptions used in determining the useful life of recognized intangible assets. The guidance
applies to intangible assets that are acquired individually or with a group of other assets and both intangible assets acquired in
business combinations and asset acquisitions. The adoption of this guidance did not have a material impact on the Company’s
consolidated financial statements.
68
DIEBOLD INCORPORATED AND SUBSIDIARIES
FORM 10-K as of December 31, 2009
NOTES TO CONSOLIDATED FINANCIAL STATEMENTS (Continued)
(dollars in thousands, except per share amounts)

Included in other assets are net capitalized computer software development costs of $57,143 and $52,668 as of Decem-
ber 31, 2009 and 2008, respectively. Amortization expense on capitalized software of $16,768, $14,332 and $11,556 was included
in product cost of sales for 2009, 2008 and 2007, respectively. Other long-term assets also consist of patents, trademarks and
other intangible assets. Where applicable, other assets are stated at cost and, if applicable, are amortized ratably over the relevant
contract period or the estimated life of the assets. Fees to renew or extend the term of the Company’s intangible assets are
expensed when incurred. Impairment of long-lived assets is recognized when events or changes in circumstances indicate that
the carrying amount of the asset may not be recoverable. If the expected future undiscounted cash flows are less than the carrying
amount of the asset, an impairment loss is recognized at that time to reduce the asset to the lower of its fair value or its net book
value in accordance with FASB ASC 360, Property, Plant and Equipment. For the year ended December 31, 2009, the Company
impaired $2,500 related to the tradename Firstline, Incorporated in the DNA segment. For the year ended December 31, 2008, the
Company impaired $4,376 of intangible assets in continuing operations of the DNA segment and $3,487 of intangible assets
within loss from discontinued operations.
Investment in Affiliate Investment in the Company’s non-consolidated affiliate is accounted for under the equity method
and consisted of a 50 percent ownership in Shanghai Diebold King Safe Company, Ltd. The balance of this investment as of
December 31, 2009 and 2008 was $11,308 and $11,461, respectively, and fluctuated based on equity earnings and receipt of
dividends. Equity earnings from the non-consolidated affiliate are included in other expense (income), net in the consolidated
statements of income and were $2,456, $2,470, and $2,172 for the years ended December 31, 2009, 2008 and 2007, respectively.
NOTE 10: NOTES PAYABLE
Outstanding notes payable balances were as follows:
2009 2008
December 31,
Notes payable — current:Uncommitted lines of credit $ 16,915 $ 10,596
Notes payable — long term:Credit facility $240,000 $294,588Senior notes 300,000 300,000
$540,000 $594,588
As of December 31, 2009, the Company had various international short-term uncommitted lines of credit with borrowing
limits of $44,039. The weighted-average interest rate on outstanding borrowings on these lines of credit as of December 31, 2009
and 2008 was 9.15 and 13.48 percent, respectively. Short term uncommitted lines mature in less than one year.
In October 2009, the Company entered into a three-year credit facility, which replaced the existing credit facility. As of
December 31, 2009, the Company had borrowing limits under this facility totaling $507,463 ($400,000 and c75,000, translated).
Under the terms of the credit facility agreement, the Company has the ability, subject to various approvals, to increase the
borrowing limits by $200,000 and c37,500. Up to $30,000 and c15,000 of the revolving credit facility is available under a swing line
subfacility. The weighted-average interest rate on outstanding credit facility borrowings as of December 31, 2009 and 2008 was
2.63 and 3.44 percent, respectively, which is variable based on the London Interbank Offered Rate (LIBOR). The Company
incurred $4,539 of fees to its creditors in conjunction with the credit facility which will be amortized as a component of interest
expense over the term of the facility.
69
DIEBOLD INCORPORATED AND SUBSIDIARIES
FORM 10-K as of December 31, 2009
NOTES TO CONSOLIDATED FINANCIAL STATEMENTS (Continued)
(dollars in thousands, except per share amounts)

In March 2006, the Company issued senior notes in an aggregate principal amount of $300,000 with a weighted-average fixed
interest rate of 5.50 percent. The maturity dates of the senior notes are staggered, with $75,000, $175,000 and $50,000 becoming
due in 2013, 2016 and 2018, respectively. Additionally, the Company entered into a derivative transaction to hedge interest rate
risk on $200,000 of the senior notes, which was treated as a cash flow hedge. This reduced the effective interest rate by 14 basis
points from 5.50 to 5.36 percent.
The amount available under the credit facility and short-term uncommitted lines at December 31, 2009 was $267,463 and
$27,124 respectively. Maturities of notes payable as of December 31, 2009 are as follows: $16,915 in 2010, $240,000 in 2012,
$75,000 in 2013 and $225,000 thereafter. Interest charged to expense for the Company’s notes payable for the years ended
December 31, 2009, 2008 and 2007 was $23,796, $32,748 and $34,546, respectively.
The Company’s financing agreements contain various restrictive financial covenants, including net debt to capitalization and
net interest coverage ratios. As of December 31, 2009, the Company was in compliance with the financial covenants in its debt
agreements.
NOTE 11: OTHER LONG-TERM LIABILITIES
Included in other long-term liabilities are bonds payable, which consist of the following:
2009 2008
December 31,
Industrial development revenue bond due January 1, 2017 $ 4,400 $ 4,400
Industrial development revenue bond due June 1, 2017 7,500 7,500
Total long-term bonds payable $11,900 $11,900
In 1997, industrial development revenue bonds were issued on behalf of the Company. The proceeds from the bond
issuances were used to construct new manufacturing facilities in the United States. The Company guaranteed the payments of
principal and interest on the bonds by obtaining letters of credit. Each industrial development revenue bond carries a variable
interest rate, which is reset weekly by the remarketing agents. The weighted-average interest rate on the bonds was 0.8 percent
and 1.8 percent as of December 31, 2009 and 2008, respectively. Interest on the bonds charged to expense for the years ended
December 31, 2009, 2008 and 2007 was $122, $329 and $446, respectively. As of December 31, 2009, the Company was in
compliance with the financial covenants of its loan agreements and believes the financial covenants will not restrict its future
operations.
NOTE 12: BENEFIT PLANS
Qualified Pension Benefits Plans that cover salaried employees provide pension benefits based on the employee’s
compensation during the ten years before retirement. The Company’s funding policy for salaried plans is to contribute annually
based on actuarial projections and applicable regulations. Plans covering hourly employees and union members generally provide
benefits of stated amounts for each year of service. The Company’s funding policy for hourly plans is to make at least the minimum
annual contributions required by applicable regulations. Employees of the Company’s operations in countries outside of the United
States participate to varying degrees in local pension plans, which in the aggregate are not significant. In addition to these plans,
union employees in one of the Company’s U.S. manufacturing facilities participate in the International Union of Electronic,
Electrical, Salaried, Machine and Furniture Workers-Communications Workers of America (IUE-CWA) multi-employer pension
fund. Pension expense related to the multi-employer pension plan was $11, $202 and $214 for the years ended December 31,
70
DIEBOLD INCORPORATED AND SUBSIDIARIES
FORM 10-K as of December 31, 2009
NOTES TO CONSOLIDATED FINANCIAL STATEMENTS (Continued)
(dollars in thousands, except per share amounts)

2009, 2008 and 2007, respectively. The Company recorded a withdrawal liability in 2008 from the pension fund of approximately
$5,800 within postretirement and other benefits due to the closure of this facility.
Supplemental Executive Retirement Benefits The Company has non-qualified pension plans to provide supplemental
retirement benefits to certain officers. Benefits are payable at retirement based upon a percentage of the participant’s com-
pensation, as defined.
Other Benefits In addition to providing pension benefits, the Company provides postretirement healthcare and life insurance
benefits (referred to as other benefits) for certain retired employees. Eligible employees may be entitled to these benefits based
upon years of service with the Company, age at retirement and collective bargaining agreements. Currently, the Company has
made no commitments to increase these benefits for existing retirees or for employees who may become eligible for these
benefits in the future. Currently there are no plan assets and the Company funds the benefits as the claims are paid. The
postretirement benefit obligation was determined by application of the terms of medical and life insurance plans together with
relevant actuarial assumptions and healthcare cost trend rates.
Prior to 2008, the Company used a September 30 measurement date to report its pension and other benefits at fiscal year-
end. In accordance with ASC 715, the Company remeasured its plan assets and benefit obligations on January 1, 2008 in order to
transition to a fiscal year-end measurement date. This resulted in a cumulative beginning of year adjustment to retained earnings
at January 1, 2008 of $1,092 for pension benefits and $295 for other benefits.
The following tables set forth the change in benefit obligation, change in plan assets, funded status, consolidated balance
sheet presentation and net periodic benefit cost for the Company’s defined benefit pension plans and other benefits at
December 31:
2009 2008 2009 2008
Pension Benefits Other Benefits
Change in benefit obligation
Benefit obligation at beginning of year $461,131 $ 435,070 $ 18,571 $ 19,972Service cost 10,902 12,335 1 3Interest cost 28,947 35,046 1,127 1,526Actuarial loss (gain) 9,178 937 (1,369) (46)Plan participants’ contributions — — 96 159Medicare retiree drug subsidy reimbursement — — 240 —Benefits paid (19,637) (22,185) (2,081) (3,278)Curtailments — (39) — —Other 23 (33) — 235
Benefit obligation at end of year $490,544 $ 461,131 $ 16,585 $ 18,571
Change in plan assets
Fair value of plan assets at beginning of year $327,333 $ 453,085 $ — $ —Actual return on plan assets 75,307 (111,040) — —Employer contribution 15,654 7,473 1,985 3,119Plan participant contributions — — 96 159Benefits paid (19,637) (22,185) (2,081) (3,278)
Fair value of plan assets at end of year $398,657 $ 327,333 $ — $ —
71
DIEBOLD INCORPORATED AND SUBSIDIARIES
FORM 10-K as of December 31, 2009
NOTES TO CONSOLIDATED FINANCIAL STATEMENTS (Continued)
(dollars in thousands, except per share amounts)

2009 2008 2009 2008
Pension Benefits Other Benefits
Funded status
Funded status $ (91,887) $(133,798) $(16,585) $(18,571)Unrecognized net actuarial loss(1) 135,723 168,246 3,969 5,779Unrecognized prior service cost (benefit)(1) 1,645 1,915 (2,484) (3,001)
Prepaid (accrued) pension cost $ 45,481 $ 36,363 $(15,100) $(15,793)
Amounts recognized in balance sheets
Current liabilities $ (2,684) $ (2,725) $ (1,742) $ (1,931)Noncurrent liabilities(2) (89,203) (131,073) (14,843) (16,640)Accumulated other comprehensive income 137,368 170,161 1,485 2,778
Net amount recognized $ 45,481 $ 36,363 $(15,100) $(15,793)
Change in accumulated othercomprehensive income
Balance at beginning of year $170,161 $ 17,435 $ 2,778 $ 2,381Prior service cost recognized during the year (271) (381) 517 517Net actuarial losses recognized during the year (3,345) (804) (442) (432)Net actuarial (losses) gains occurring during
the year (29,178) 153,911 (1,368) 312
Balance at end of year $137,367 $ 170,161 $ 1,485 $ 2,778
(1) Represents amounts in accumulated other comprehensive income that have not yet been recognized as components of net periodic benefit costs.
(2) Included in the consolidated balance sheets in pensions and other benefits and postretirement and other benefits are international and multi-employer plan benefit
liabilities.
2009 2008 2007 2009 2008 2007
Pension Benefits Other Benefits
Components of net periodic benefit cost
Service cost $ 10,902 $ 9,839 $ 11,429 $ 1 $ 2 $ 6Interest cost 28,947 28,046 25,592 1,127 1,221 1,358Expected return on plan assets (36,973) (35,747) (33,008) — — —Amortization of prior service cost(1) 271 381 614 (517) (517) (516)Recognized net actuarial loss 3,345 804 4,033 442 432 731Curtailment gain — (52) (489) — — —
Net periodic pension benefit cost $ 6,492 $ 3,271 $ 8,171 $1,053 $1,138 $1,579
(1) The annual amortization of pension benefits prior service costs is determined as the increase in projected benefit obligation due to the plan change divided by the
average remaining service period of participating employees expected to receive benefits under the plan.
72
DIEBOLD INCORPORATED AND SUBSIDIARIES
FORM 10-K as of December 31, 2009
NOTES TO CONSOLIDATED FINANCIAL STATEMENTS (Continued)
(dollars in thousands, except per share amounts)

The following table represents information for pension plans with an accumulated benefit obligation in excess of plan assets
for the years ended December 31:
2009 2008
Projected benefit obligation $490,544 $461,131Accumulated benefit obligation 449,034 415,648Fair value of plan assets 398,657 327,333
The following table represents the weighted-average assumptions used to determine benefit obligations at December 31:
2009 2008 2009 2008
Pension Benefits Other Benefits
Discount rate 6.33% 6.41% 6.33% 6.41%Rate of compensation increase 3.25% 3.25%
The following table represents the weighted-average assumptions used to determine periodic benefit cost at December 31:
2009 2008 2009 2008
Pension Benefits Other Benefits
Discount rate 6.41% 6.63% 6.41% 6.63%Expected long-term return on plan assets 8.50% 8.50%Rate of compensation increase 3.25% 3.50%
The discount rate is determined by analyzing the average return of high-quality (i.e., AA-rated) fixed-income investments and
the year-over-year comparison of certain widely used benchmark indices as of the measurement date. The expected long-term
rate of return on plan assets is primarily determined using the plan’s current asset allocation and its expected rates of return based
on a geometric averaging over 20 years. The Company also considers information provided by its investment consultant, a survey
of other companies using a December 31 measurement date and the Company’s historical asset performance in determining the
expected long-term rate of return. The rate of compensation increase assumptions reflects the Company’s long-term actual
experience and future and near-term outlook.
The following table represents assumed health care cost trend rates at December 31:
2009 2008
Healthcare cost trend rate assumed for next year 8.20% 9.00%Rate to which the cost trend rate is assumed to decline (the ultimate trend rate) 4.20% 4.20%Year that rate reaches ultimate trend rate 2099 2099
The healthcare trend rates are reviewed based upon the results of actual claims experience. The Company used healthcare
cost trends of 8.2 and 9.0 percent in 2010 and 2009, respectively, decreasing to an ultimate trend of 4.2 percent in 2099 for both
medical and prescription drug benefits using the Society of Actuaries Long Term Trend Model with assumptions based on the
2008 Medicare Trustees’ projections. Assumed healthcare cost trend rates have a significant effect on the amounts reported for
the healthcare plans.
A one-percentage-point change in assumed healthcare cost trend rates would have the following effects:
One-Percentage-Point Increase
One-Percentage-Point Decrease
Effect on total of service and interest cost $ 72 $ (65)Effect on postretirement benefit obligation $971 $(878)
73
DIEBOLD INCORPORATED AND SUBSIDIARIES
FORM 10-K as of December 31, 2009
NOTES TO CONSOLIDATED FINANCIAL STATEMENTS (Continued)
(dollars in thousands, except per share amounts)

The Company has adopted a pension investment policy designed to achieve an adequate funding status based on expected
benefit payouts and to establish an asset allocation that will meet or exceed the return assumption while maintaining a prudent
level of risk. The Company utilizes the services of an outside consultant in performing asset / liability modeling, setting appropriate
asset allocation targets along with selecting and monitoring professional investment managers. The plan assets are invested in
equity and fixed income securities, alternative assets and cash.
Within the equities asset class, the investment policy provides for investments in a broad range of publicly-traded securities
including both domestic and international stocks diversified by value, growth and cap size. Within the fixed income asset class, the
investment policy provides for investments in a broad range of publicly-traded debt securities with a substantial portion allocated
to a long duration strategy in order to partially offset interest rate risk relative to the plan’s liabilities. The alternative asset class
allows for investments in diversified strategies with a stable and proven track record and low correlation to the U.S. stock market.
The following table summarizes the Company’s target mixes for these asset classes in 2010, which are readjusted at least
quarterly within a defined range, and the Company’s pension plan asset allocation as of December 31, 2009 and 2008:
2010 2009 2008
TargetAllocationPercentage
Percentage of PensionPlan Assets at December 31,
Equity securities 45 48 42Debt securities 40 42 47Real estate 5 — —Other 10 10 11
Total 100 100 100
Assets are categorized into three levels based upon the assumptions (inputs) used to value the assets in accordance with the
fair value hierarchy included in FASB ASC 820 (refer to note 18). The following table summarizes the fair value of the Company’s
plan assets as of December 31:
2009 2008
Level 1Mutual funds $ 21,803 $ 15,619Corporate stocks, common and preferred 146,263 107,374Short-term investments 4,213 7,177Other 2,024 1,706
Level 2United States government and agency securities 312 603Corporate debt and foreign government securities 64,476 49,504Common and collective trusts 123,093 110,275
Level 3Partnership/joint venture 36,473 35,075
Fair value of plan assets at end of year $398,657 $327,333
Fair value of investments categorized as level 1 are determined based on period end closing prices in active markets. Fair
value of investments categorized as level 2 are determined based on the latest available ask price or latest trade price if listed. The
fair value of unlisted securities is established by fund managers using the latest reported information for comparable securities
and financial analysis. If the manager believes the fund is not capable of immediately realizing the fair value otherwise determined,
74
DIEBOLD INCORPORATED AND SUBSIDIARIES
FORM 10-K as of December 31, 2009
NOTES TO CONSOLIDATED FINANCIAL STATEMENTS (Continued)
(dollars in thousands, except per share amounts)

the manager has the discretion to determine an appropriate value. Fair value of investments categorized as Level 3, represent the
Plan’s interest in private equity and hedge funds. The fair value for these assets is determined based on the net asset value (NAV),
which is the practical expedient for fair value, as reported by the underlying investment managers.
The following table summarizes the changes in fair value of level 3 assets for the year ended December 31:
2009
Balance, beginning of year $35,075
Acquisitions (dispositions), net 2,537
Realized and unrealized (losses) gains, net (1,139)
Balance, end of year $36,473
The following table represents the amortization amounts expected to be recognized during 2010:
Pension Benefits Other Benefits
Amount of net prior service cost/(credit) $ 194 $(517)Amount of net loss 5,244 284
The Company contributed $15,654 to its pension plans, including contributions to the nonqualified plan, and $1,984 to its
other postretirement benefit plan in the year ended December 31, 2009. Also, the Company expects to contribute $14,767 to its
pension plans, including the nonqualified plan, and $1,797 to its other postretirement benefit plan in the year ended December 31,
2010. The following benefit payments, which reflect expected future service, are expected to be paid:
PensionBenefits
Other Benefitsbefore MedicarePart D Subsidy
Other Benefitsafter MedicarePart D Subsidy
2010 $ 21,162 $2,039 $1,7972011 22,277 2,035 1,7952012 23,923 1,997 1,7582013 25,514 1,946 1,7142014 27,278 1,880 1,6572015 — 2019 164,596 8,196 7,237
Retirement Savings Plan The Company offers an employee 401(k) savings plan (Savings Plan) to encourage eligible
employees to save on a regular basis by payroll deductions. Effective July 1, 2003, a new enhanced benefit to the Savings Plan
became effective. All new salaried employees hired on or after July 1, 2003 were provided with an employer basic matching
contribution in the amount of 100 percent of the first three percent of eligible pay and 60 percent of the next three percent of
eligible pay. This new enhanced benefit is in lieu of participation in the pension plan for salaried employees. For employees hired
prior to July 1, 2003, the Company matched 60 percent of participating employees’ first three percent of contributions and
40 percent of participating employees’ next three percent of contributions. Effective April 1, 2009, the Company match for the
Savings Plan was reduced and suspended. If a participant was hired before July 1, 2003 and participates in the Diebold pension
plan, the match was suspended. If a participant was hired after July 1, 2003 and does not participate in the Diebold pension plan,
the Company reduced the match to 30 cents for every dollar up to six percent of income. The Company match is determined by the
Board of Directors and evaluated at least annually. Total Company match was $5,077, $12,510 and $11,608 for the years ended
December 31, 2009, 2008 and 2007, respectively.
Deferred Compensation Plans The Company has deferred compensation plans that enable certain employees to defer
receipt of a portion of their cash or share-based compensation and non-employee directors to defer receipt of director fees at the
participants’ discretion. For deferred cash-based compensation, the Company established a rabbi trust which is recorded at fair
75
DIEBOLD INCORPORATED AND SUBSIDIARIES
FORM 10-K as of December 31, 2009
NOTES TO CONSOLIDATED FINANCIAL STATEMENTS (Continued)
(dollars in thousands, except per share amounts)

value of the underlying securities within securities and other investments. The related deferred compensation liability is recorded
at fair value within other long-term liabilities. Realized and unrealized gains and losses on marketable securities in the rabbi trust
are recognized in investment income with corresponding changes in the Company’s deferred compensation obligation recorded
as compensation cost within selling and administrative expense.
NOTE 13: LEASES
The Company’s future minimum lease payments due under non-cancellable operating leases for real estate, vehicles and
other equipment at December 31, 2009 are as follows:
Total Real Estate Equipment
2010 $ 56,429 $ 21,914 $ 34,5152011 52,602 18,228 34,3742012 43,728 16,101 27,6272013 29,196 14,164 15,0322014 18,565 12,037 6,528Thereafter 27,094 23,263 3,831
$227,614 $105,707 $121,907
Under lease agreements that contain escalating rent provisions, lease expense is recorded on a straight-line basis over the
lease term. Rental expense under all lease agreements amounted to approximately $74,914, $84,708 and $83,588 for the years
ended December 31, 2009, 2008 and 2007, respectively.
NOTE 14: GUARANTEES AND PRODUCT WARRANTIES
In September 2009, the Company sold its U.S. election systems business. The related sale agreement contained shared
liability clauses pursuant to which the Company agreed to indemnify the purchaser for 70 percent of any adverse consequences to
the purchaser arising out of certain defined potential litigation or obligations. As of December 31, 2009, there were no material
adverse consequences related to these shared liability indemnifications. The Company’s maximum exposure under the shared
liability indemnifications is $8,000.
In 1997, industrial development revenue bonds were issued on behalf of the Company. The proceeds from the bond
issuances were used to construct new manufacturing facilities in the United States. The Company guaranteed repayment of
principal and interest on variable-rate industrial development revenue bonds by obtaining letters of credit. The bonds were issued
with a 20-year original term and are scheduled to mature in 2017.
The Company provides its global operations guarantees and standby letters of credit through various financial institutions to
suppliers, regulatory agencies and insurance providers. If the Company is not able to make payment, the suppliers, regulatory
agencies and insurance providers may draw on the pertinent bank. At December 31, 2009, the maximum future payment
obligations relative to these various guarantees totaled $67,226, of which $22,628 represented standby letters of credit to
insurance providers, and no associated liability was recorded. At December 31, 2008, the maximum future payment obligations
relative to these various guarantees totaled $61,615, of which $19,528 represented standby letters of credit to insurance
providers, and no associated liability was recorded.
The Company provides its customers a standard manufacturer’s warranty and records, at the time of the sale, a corre-
sponding estimated liability for potential warranty costs. Estimated future obligations due to warranty claims are based upon
76
DIEBOLD INCORPORATED AND SUBSIDIARIES
FORM 10-K as of December 31, 2009
NOTES TO CONSOLIDATED FINANCIAL STATEMENTS (Continued)
(dollars in thousands, except per share amounts)

historical factors such as labor rates, average repair time, travel time, number of service calls per machine and cost of replacement
parts. Changes in the Company’s warranty liability balance are illustrated in the following table:
2009 2008
Balance at January 1 $ 43,009 $ 26,494Current period accruals 67,316 49,689Current period settlements (47,652) (33,174)
Balance at December 31 $ 62,673 $ 43,009
NOTE 15: COMMITMENTS AND CONTINGENCIES
At December 31, 2009, the Company had purchase commitments for materials through contract manufacturing agreements
at negotiated prices totaling $13,441. The Company’s approximate future payments under these purchase commitments are
$12,883, $267 and $291 in 2010, 2011 and 2012, respectively. The amounts purchased under these obligations totaled $12,026,
$14,293 and $2,572 in 2009, 2008 and 2007, respectively.
At December 31, 2009, the Company was a party to several lawsuits that were incurred in the normal course of business,
none of which individually or in the aggregate is considered material by management in relation to the Company’s financial position
or results of operations. In management’s opinion, the consolidated financial statements would not be materially affected by the
outcome of any present legal proceedings, commitments or asserted claims.
In addition to the routine legal proceedings noted above, the Company has been served with various lawsuits, filed against it
and certain current and former officers and directors, by shareholders and participants in the Company’s 401(k) Plan, alleging
violations of the federal securities laws and breaches of fiduciary duties with respect to the 401(k) plan. These complaints seek
compensatory damages in an unspecific amount, fees and expenses related to such lawsuits and the granting of extraordinary
equitable and/or injunctive relief. The cases alleging violations of the federal securities laws have been consolidated into a single
proceeding. The cases alleging breaches of fiduciary duties under the Employee Retirement Income Security Act of 1974 with
respect to the 401(k) plan likewise have been consolidated into a single proceeding. The Company and the individual defendants
deny the allegations made against them, regard them as without merit, and intend to defend themselves vigorously. On
August 22, 2008, the district court dismissed the consolidated amended complaint in the consolidated securities litigation and
entered a judgment in favor of the defendants. On December 22, 2009, the U.S. Court of Appeals for the Sixth Circuit affirmed the
judgment of dismissal. On February 18, 2010 the U.S. Court of Appeals for the Sixth Circuit denied plaintiffs’ motion for rehearing
en banc. In May 2009, the Company agreed to settle the 401(k) class action litigation for $4,500, to be paid out of the Company’s
insurance policies. The settlement is subject to final documentation and approval of the court.
The Company, including certain of its subsidiaries, filed a lawsuit on May 30, 2008 against the Board of Elections of Cuyahoga
County, Ohio, the Board of County Commissioners of Cuyahoga County, Ohio, (collectively, the County), and Ohio Secretary of
State Jennifer Brunner (Secretary) regarding several Ohio contracts under which the Company provided electronic voting systems
and related services to the State of Ohio and a number of its counties. The complaint seeks a declaration that the Company met its
contractual obligations. In response, both the County and the Secretary have filed answers and counterclaims seeking declaratory
relief and unspecified damages under several theories of recovery. The Butler County Board of Elections has joined in, and
incorporated by reference, the Secretary’s counterclaim. The Secretary has also added ten Ohio counties as additional defen-
dants, claiming that those counties also experienced problems with the voting systems, but many of those counties have moved
for dismissal.
77
DIEBOLD INCORPORATED AND SUBSIDIARIES
FORM 10-K as of December 31, 2009
NOTES TO CONSOLIDATED FINANCIAL STATEMENTS (Continued)
(dollars in thousands, except per share amounts)

Management is unable to determine the financial statement impact, if any, of the County’s and Secretary’s actions as of
December 31, 2009.
The Company was informed during the first quarter of 2006 that the staff of the SEC had begun an informal inquiry relating to
the Company’s revenue recognition policy. In the second quarter of 2006, the Company was informed that the SEC’s inquiry had
been converted to a formal, non-public investigation. In the fourth quarter of 2007, the Company also learned that the Department
of Justice (DOJ) had begun a parallel investigation. On May 1, 2009, the Company reached an agreement in principle with the staff
of the SEC to settle civil charges stemming from the staff’s pending investigation. In addition, the Company has been informed by
the U.S. Attorney’s Office for the Northern District of Ohio that it will not bring criminal charges against the Company for the
transactions and accounting issues that are the subject of the SEC investigation.
Under the terms of the agreement in principle with the staff of the SEC, the Company will neither admit nor deny civil
securities fraud charges, will pay a penalty of $25,000 and will agree to an injunction against committing or causing any violations
or future violations of certain specified provisions of the federal securities laws. The agreement in principle with the staff of the
SEC remains subject to the final approval of the SEC, and there can be no assurance that the SEC will accept the terms of the
settlement negotiated with the staff.
NOTE 16: DERIVATIVE INSTRUMENTS AND HEDGING ACTIVITIES
The Company uses derivatives to mitigate the negative economic consequences associated with the fluctuations in
currencies and interest rates. The Company records all derivative instruments on the balance sheet at fair value and the changes
in the fair value are recognized in earnings unless specific hedge accounting criteria are met. Special accounting for qualifying
hedges allows derivative gains and losses to be reflected in the statement of operations or other comprehensive income together
with the hedged exposure, and requires that the Company formally document, designate and assess the effectiveness of
transactions that receive hedge accounting treatment. Gains or losses associated with ineffectiveness must be reported currently
in earnings. The Company does not enter into any speculative positions with regard to derivative instruments.
The Company periodically evaluates its monetary asset and liability positions denominated in foreign currencies. The impact
of the Company and the counterparties’ credit risk on the fair value of the contracts is considered as well as the ability of each party
to execute its obligations under the contract. The Company uses investment grade financial counterparties in these transactions
and believes that the resulting credit risk under these hedging strategies is not significant.
FOREIGN EXCHANGE
Non-Designated Hedges A substantial portion of the Company’s operations and revenues are international. As a result,
changes in foreign exchange rates can create substantial foreign exchange gains and losses from the revaluation of non-functional
currency monetary assets and liabilities. The Company’s policy allows the use of foreign exchange forward contracts with
maturities of up to 24 months to mitigate the impact of currency fluctuations on those foreign currency asset and liability balances.
The Company elected not to apply hedge accounting to its foreign exchange forward contracts. Thus, spot-based gains/losses
offset revaluation gains/losses within foreign exchange (loss) gain, net and forward-based gains/losses represent interest
expense. For the year ended December 31, 2009, there were 953 non-designated foreign exchange contracts that settled.
As of December 31, 2009, there were 54 non-designated foreign exchange contracts outstanding, primarily euro, British pound
and Swiss franc, totaling $525,727, which represents the absolute value of notional amounts.
Net Investment Hedges The Company has international subsidiaries with assets in excess of liabilities that generate
cumulative translation adjustments within other comprehensive income. During 2009, the Company used derivatives to manage
78
DIEBOLD INCORPORATED AND SUBSIDIARIES
FORM 10-K as of December 31, 2009
NOTES TO CONSOLIDATED FINANCIAL STATEMENTS (Continued)
(dollars in thousands, except per share amounts)

potential adverse changes in value of its net investments in Brazil. The Company uses the forward to forward method for its
quarterly retrospective and prospective assessments of hedge effectiveness. No ineffectiveness results if the notional amount of
the derivative matches the portion of the net investment designated as being hedged because the Company uses derivative
instruments with underlying exchange rates consistent with its functional currency and the functional currency of the hedged net
investment. Changes in value that are deemed effective are accumulated in other comprehensive income where they will remain
until they are reclassified to income together with the gain or loss on the entire investment upon substantial liquidation of the
subsidiary. There was no ineffectiveness during the year ended December 31, 2009. For the year ended December 31, 2009,
there were 15 net investment hedge contracts that settled. As of December 31, 2009, there were no net investment hedge
contracts outstanding.
INTEREST RATE
Cash Flow Hedges The Company has variable rate debt and is subject to fluctuations in interest related cash flows due to
changes in market interest rates. The Company’s policy allows derivative instruments designated as cash flow hedges which fix a
portion of future variable-rate interest expense. The Company has executed two pay-fixed receive-variable interest rate swaps,
with a total notional amount of $50,000, to hedge against changes in the LIBOR benchmark interest rate on a portion of the
Company’s LIBOR-based borrowings. In October 2009, the Company used borrowings of approximately $205,000 and c50,300
under its new credit facility agreement to repay all amounts outstanding under (and terminated) the prior loan agreement. While
the LIBOR-based cash flows designated in the original hedge relationships remain probable of occurring, the Company elected to
de-designate the original cash flow hedging relationships and designated new hedging relationships in conjunction with entering
into its new credit facility.
The Company’s monthly retrospective assessment of hedge effectiveness to determine whether the hedging relationship
continues to qualify for hedge accounting is performed using regression analysis. The Company’s monthly prospective assess-
ment of hedge effectiveness to measure the extent to which exact offset is not achieved is performed by comparing the
cumulative change in the fair value of the interest rate swaps to the cumulative change in the fair value of the hypothetical interest
rate swaps with critical terms that match the LIBOR-based borrowings. When computing cumulative changes in fair values,the
Company computes the difference between the current fair value and the sum of all future discounted cash flows projected at
designation that are not yet paid or accrued as of the current valuation date in order to isolate changes in fair value primarily
attributable to changes in interest rates. Changes in value that are deemed effective are accumulated in other comprehensive
income and reclassified to interest expense when the hedged interest is accrued. For the year ended December 31, 2009, the
Company recognized a $39 gain representing the change in fair value of the interest rate swap that was deemed ineffective. To the
extent that it becomes probable that the Company’s variable rate borrowings will not occur, the gains or losses on the related cash
flow hedges will be reclassified from other comprehensive income to interest expense.
In December 2005 and January 2006, the Company executed cash flow hedges by entering into receive-variable and pay-
fixed interest rate swaps, with a total notional amount of $200,000, related to the senior notes issuance in March 2006. Amounts
previously recorded in other comprehensive income related to the pre-issuance cash flow hedges will continue to be reclassified
to income on a straight-line basis through February 2016.
79
DIEBOLD INCORPORATED AND SUBSIDIARIES
FORM 10-K as of December 31, 2009
NOTES TO CONSOLIDATED FINANCIAL STATEMENTS (Continued)
(dollars in thousands, except per share amounts)

The following table summarizes the fair value of derivative instruments designated and not designated as hedging instru-
ments and their respective balance sheet location as of December 31, 2009:
Fair Value Balance Sheet Location(1)
Derivatives designated as hedging instruments
Liability derivatives:Interest rate contracts (2,122) Other current liabilitiesInterest rate contracts (1,277) Other long-term liabilities
Total liability derivatives (3,399)
Total hedging instruments $(3,399)
Derivatives not designated as hedging instruments
Asset derivatives:Foreign exchange contracts $ 1,047 Other current assetsForeign exchange contracts 399 Other current liabilities
Total asset derivatives 1,446Liability derivatives:
Foreign exchange contracts (560) Other current assetsForeign exchange contracts (2,171) Other current liabilities
Total liability derivatives (2,731)
Total derivatives not designated $(1,285)
Total derivatives $(4,684)
(1) The balance sheet location noted above represents the balance sheet line item where the respective contract types are reported using a net basis due to master
netting agreements with counterparties. However, the asset derivative and liability derivative categories noted above represent the Company’s derivative positions
on a gross contract by contract basis.
The following table summarizes the impact of derivative instruments included in other comprehensive income (loss) (OCI),
pre-tax for the year ended December 31, 2009:
Gain (Loss)Recognized in OCI(Effective Portion)
Gain Reclassified FromAccumulated OCI(Effective Portion)
Income StatementLocation
Gain Recognized inIncome
(IneffectivePortion)
Foreign exchange contracts $(10,129) $ — N/A $—Interest rate contracts 602 136 Interest expense 39
Total $ (9,527) $136 $39
The Company anticipates reclassifying $1,793 from other comprehensive income to interest expense within the next
12 months.
80
DIEBOLD INCORPORATED AND SUBSIDIARIES
FORM 10-K as of December 31, 2009
NOTES TO CONSOLIDATED FINANCIAL STATEMENTS (Continued)
(dollars in thousands, except per share amounts)

The following table summarizes the gain (loss) recognized on non-designated derivative instruments:
Year EndedDecember 31,
2009 Income Statement Location
Foreign exchange contracts $ (8,913) Interest expenseForeign exchange contracts (18,140) Foreign exchange (loss) gain, net
Total $(27,053)
NOTE 17: RESTRUCTURING AND OTHER CHARGES
The following table summarizes the impact of Company’s restructuring charges on the statements of income:
2009 2008 2007
Year Ended December 31,
Cost of sales — products $ 5,348 $15,936 $27,349Cost of sales — services 7,488 9,663 1,319Selling and administrative expense 10,276 11,265 1,299Research, development and engineering expense 2,091 3,649 63Impairment of assets — 435 —Gain on sale of assets, net — — (6,438)
$25,203 $40,948 $23,592
Restructuring charges of $624 related to the Election Systems (ES) & Other segment for the year ended December 31, 2008
are reflected in loss from discontinued operations.
The following table summarizes the Company’s restructuring charges within continuing operations by reporting segment:
2009 2008 2007
Year Ended December 31,
DNASeverance $14,376 $ 5,623 $ —Other(1) 3,397 10,083 —
DISeverance 6,815 17,672 18,288Other(2) 615 7,570 11,742Gain on sale of building — — (6,438)
Total $25,203 $40,948 $23,592
(1) Other costs included in the DNA segment include pension obligation, legal and professional fees, travel, training, asset movement and facility costs.
(2) Other costs included in the DI segment include legal and professional fees, contract termination fees, penalties, asset impairment costs and costs to transfer
usable inventory.
Restructuring charges of $17,232 and $20,598 for the years ended December 31, 2009 and 2008, respectively, related to
reductions in the Company’s global workforce, including realignment of the organization and resources to better support
opportunities in emerging growth markets and consolidation of certain international facilities in efforts to optimize overall
operational performance. In December 2009, the company began to implement a workforce reduction of 350 employees, which
primarily affects the Company’s Canton, Ohio area facilities. The Company expects to complete this workforce reduction no later
81
DIEBOLD INCORPORATED AND SUBSIDIARIES
FORM 10-K as of December 31, 2009
NOTES TO CONSOLIDATED FINANCIAL STATEMENTS (Continued)
(dollars in thousands, except per share amounts)

than the end of 2010. As a result of the workforce reduction plans, the Company currently anticipates approximately $5,000 of
remaining charges to be incurred primarily in the first half of 2010.
Restructuring charges of $4,440, $12,372 and $19,977 for the years ended December 31, 2009, 2008 and 2007, respectively,
related to the Company’s strategic global manufacturing realignment plans. The Company began to close its manufacturing
facilities in Newark, Ohio and Cassis, France in 2008 and 2006, respectively. The Company believes the closure of the Newark and
Cassis facilities will be substantially complete by the end of 2010 with additional expected costs of approximately $1,300. In
addition, during the third quarter of 2009, the Company began to move Opteva product manufacturing out of Lexington, North
Carolina into other facilities and believes the move to be complete by the end of the first quarter 2010 with additional expected
costs of approximately $1,000. Security manufacturing operations will continue in the Lexington facility.
Restructuring charges of $31, $6,024 and $3,224 for the years ended December 31, 2009, 2008 and 2007, respectively,
related to the Company’s plans to downsize and then to close its operations in Germany which are substantially complete as of
December 31, 2009. Other restructuring charges of $3,500 for the year ended December 31, 2009 primarily related to employee
severance costs in connection with the Company’s sale of certain assets and liabilities in Argentina, as well as consolidation of
warehouse operations and distribution centers in the U.S.
The following table summarizes the Company’s restructuring accrual balances and related activity:
Severance Other Total
Balance January 1, 2007 $ — $ — $ —Liabilities incurred 18,288 11,742 30,030Liabilities paid/settled (15,773) (8,840) (24,613)
Balance December 31, 2007 $ 2,515 $ 2,902 $ 5,417Liabilities incurred 23,295 17,653 40,948Liabilities paid/settled (17,503) (11,838) (29,341)
Balance December 31, 2008 $ 8,307 $ 8,717 $ 17,024Liabilities incurred 21,191 4,012 25,203Liabilities paid/settled (14,303) (6,007) (20,310)
Balance December 31, 2009 $ 15,195 $ 6,722 $ 21,917
Other Charges
Other charges consist of items which the Company determines are non-routine in nature and are not expected to recur in
future operations. Non-routine expenses, net of $15,144, $45,145 and $7,288 impacted the year ended December 31, 2009, 2008
and 2007, respectively. For the year ended December 31, 2009, the Company incurred non-routine expenses of $1,467 in legal and
other consultation fees recorded in selling and administrative expense related to the government investigations and a $25,000
charge, recorded in miscellaneous net, related to an agreement in principle with the staff of the U.S. Securities and Exchange
Commission (SEC) to settle civil charges stemming from the staff’s pending enforcement inquiry. The agreement in principle with
the staff of the SEC remains subject to the final approval of the SEC, and there can be no assurance that the SEC will accept the
terms of the settlement negotiated with the staff. In addition, in 2009 selling and administrative expense was offset by $11,323 of
non-routine income, including $10,616 of reimbursements from the Company’s director and officer (D&O) insurance carriers
related to legal and other expenses incurred as part of the government investigations. The Company continues to pursue
reimbursement of the remaining incurred legal and other expenditures with its D&O insurance carriers. Non-routine expenses for
the year ended December 31, 2008 were primarily from legal, audit and consultation fees related to the internal review of
82
DIEBOLD INCORPORATED AND SUBSIDIARIES
FORM 10-K as of December 31, 2009
NOTES TO CONSOLIDATED FINANCIAL STATEMENTS (Continued)
(dollars in thousands, except per share amounts)

accounting items, restatement of financial statements, government investigations and other advisory fees. Non-routine expenses
for the year ended December 31, 2007 were primarily related to the internal review of accounting items related to the 2008
restatement of financial statements.
NOTE 18: FAIR VALUE OF ASSETS AND LIABILITIES
In January 2008, the Company adopted updated guidance included in ASC 820, for its financial assets and liabilities, as
required. The updated guidance established a common definition for fair value to be applied to U.S. GAAP requiring the use of fair
value, established a framework for measuring fair value, and expanded disclosure requirements about such fair value measure-
ments. The guidance did not require any new fair value measurements, but rather applied to all other accounting pronouncements
that require or permit fair value measurements. In January 2009, the Company adopted updated guidance included in ASC 820
with respect to non-financial assets and liabilities that are measured at fair value. The adoption of this updated guidance had no
impact on the consolidated financial statements.
In April 2009, the Company adopted updated guidance included in ASC 820, FASB ASC 320, Investments Debt and Securities
and FASB ASC 825, Financial Instruments. This updated guidance clarifies measuring fair-value in inactive markets, modifying the
recognition and measurement of other-than-temporary impairments of debt securities, and requiring public companies to disclose
the fair values of financial instruments in interim periods. The adoption of this updated guidance did not have a material impact on
the Company’s consolidated financial statements.
In December 2009, the Company adopted FASB ASU 2009-05, Fair Value Measurements and Disclosures (ASC 820) Mea-
suring Liabilities at Fair Value (ASU 2009-05) and FASB ASU 2009-12, Investments in Certain Entities That Calculate Net Asset
Value per Share (or Its Equivalent) (ASU 2009-12). ASU 2009-05 amends ASC 820 and allows companies determining the fair value
of a liability to use the perspective of an investor that holds the related obligation as an asset. ASU 2009-05 provides clarification
that in circumstances in which a quoted price in an active market for the identical liability is not available, a reporting entity is
required to measure fair value using certain techniques. ASU 2009-05 also clarifies that when estimating the fair value of a liability,
a reporting entity is not required to include a separate input or adjustment to other inputs relating to the existence of a restriction
that prevents the transfer of a liability. ASU 2009-05 also clarifies that both a quoted price in an active market for the identical
liability at the measurement date and the quoted price for the identical liability when traded as an asset in an active market when no
adjustments to the quoted price of the asset are required are Level 1 fair value measurements. ASU 2009-12 amends ASC 820 to
provide guidance on measuring the fair value of certain alternative investments such as hedge funds, private equity funds and
venture capital funds. The ASU indicates that, under certain circumstances, the fair value of such investments may be determined
using NAV as a practical expedient, unless it is probable the investment will be sold at something other than NAV. In those
situations, the practical expedient cannot be used and disclosure of the remaining actions necessary to complete the sale is
required. ASU 2009-12 also requires additional disclosures of the attributes of all investments within the scope of the new
guidance, regardless of whether an entity used the practical expedient to measure the fair value of any of its investments.
83
DIEBOLD INCORPORATED AND SUBSIDIARIES
FORM 10-K as of December 31, 2009
NOTES TO CONSOLIDATED FINANCIAL STATEMENTS (Continued)
(dollars in thousands, except per share amounts)

The hierarchy that prioritizes the inputs to valuation techniques used to measure fair value is divided into three levels:
• Level 1 — Unadjusted quoted prices in active markets for identical assets or liabilities.
• Level 2 — Unadjusted quoted prices in active markets for similar assets or liabilities, unadjusted quoted prices for identical
or similar assets or liabilities in markets that are not active or inputs, other than quoted prices in active markets, that are
observable either directly or indirectly.
• Level 3 — Unobservable inputs for which there is little or no market data.
The Company measures its financial assets and liabilities using one or more of the following three valuation techniques:
• Market approach — Prices and other relevant information generated by market transactions involving identical or com-
parable assets or liabilities.
• Cost approach — Amount that would be required to replace the service capacity of an asset (replacement cost).
• Income approach — Techniques to convert future amounts to a single present amount based upon market expectations.
Summary of Assets and Liabilities Recorded at Fair Market Value
Assets and liabilities subject to fair value measurement are as follows:
Fair Value as ofDecember 31,
2009
Quoted Prices inActive Markets
for IdenticalAssets
(Level 1)
SignificantOther
ObservableInputs
(Level 2)
UnobservableInputs
(Level 3)
Fair Value Measurements Using
Assets
Short-term investments:
Certificates of deposit $157,216 $157,216 $ — $ —
U.S. dollar indexed bond funds 20,226 — 20,226 —
Assets held in a rabbi trust 8,500 8,500 — —
Contingent consideration on sale of business 2,386 — — 2,386
Foreign exchange forward contracts 487 — 487 —
Total $188,815 $165,716 $20,713 $2,386
Liabilities
Foreign exchange forward contracts $ 1,772 $ — $ 1,772 $ —
Interest rate swaps 3,399 — 3,399 —
Total $ 5,171 $ — $ 5,171 $ —
Short-Term Investments The Company has investments in certificates of deposit and U.S. dollar indexed bond funds that
are classified as available-for-sale and stated at fair value. U.S. dollar indexed bond funds are reported at NAV, which is the practical
expedient for fair value as determined by banks where funds are held.
Assets Held in a Rabbi Trust The fair value of the assets held in a rabbi trust (refer to note 12) is derived from investments in
a mix of money market, fixed income and equity funds managed by Vanguard.
84
DIEBOLD INCORPORATED AND SUBSIDIARIES
FORM 10-K as of December 31, 2009
NOTES TO CONSOLIDATED FINANCIAL STATEMENTS (Continued)
(dollars in thousands, except per share amounts)

Foreign Exchange Forward Contracts A substantial portion of the Company’s operations and revenues are international. As
a result, changes in foreign exchange rates can create substantial foreign exchange gains and losses from the revaluation of non-
functional currency monetary assets and liabilities. The foreign exchange contracts are valued using the market approach based
on observable market transactions of forward rates.
Contingent Consideration on Sale of Business The Company’s September 2009 sale of the U.S. elections systems
business included contingent consideration related to 70 percent of any cash collected over a five-year period on the accounts
receivable balance of the sold business as of August 31, 2009. The fair value of the contingent consideration was determined
based on recent collections on the accounts receivable as well as the probability of future anticipated collections (Level 3 inputs)
and was recorded at the net present value of the future anticipated cash flows. The following table summarizes the changes in fair
value of the Company’s level 3 assets:
Balance, August 31, 2009 $ —
Contingent consideration on sale of business 7,147
Cash collections (5,004)
Fair value adjustment 243
Balance, December 31, 2009 $ 2,386
Interest Rate Swaps The Company has variable rate debt and is subject to fluctuations in interest related cash flows due to
changes in market interest rates. The Company’s policy allows it to periodically enter into derivative instruments designated as
cash flow hedges to fix some portion of future variable rate based interest expense. The Company has executed two pay-fixed
receive-variable interest rate swaps to hedge against changes in the LIBOR benchmark interest rate on a portion of the Company’s
LIBOR- based borrowings. The fair value of the swap is determined using the income approach and is calculated based on LIBOR
rates at the reporting date.
Summary of Assets and Liabilities Recorded at Carrying Value
The fair value of the Company’s cash and cash equivalents, trade receivables and accounts payable, approximates the
carrying value due to the relative short maturity of these instruments. The fair value and carrying value of the Company’s debt
instruments are summarized as follows:
Fair Value Carrying Value
December 31, 2009
Industrial development revenue bonds due 2017 $ 11,900 $ 11,900
Notes payable — current 16,915 16,915
Notes payable — long term 537,246 540,000
Total debt instruments $566,061 $568,815
The fair value of the Company’s industrial development revenue bonds are measured using unadjusted quoted prices in active
markets for identical assets categorized as Level 1 inputs. The fair value of the Company’s current and long-term credit facility debt
instruments approximates the carrying value due to the relative short maturity of the revolving borrowings under these
instruments. The fair values of the Company’s long term senior notes was estimated using market observable inputs for the
Company’s comparable peers with public debt, including quoted prices in active markets, market indices and interest rate
measurements, considered Level 2 inputs.
85
DIEBOLD INCORPORATED AND SUBSIDIARIES
FORM 10-K as of December 31, 2009
NOTES TO CONSOLIDATED FINANCIAL STATEMENTS (Continued)
(dollars in thousands, except per share amounts)

NOTE 19: SEGMENT INFORMATION
The Company’s segments are comprised of its three main sales channels: DNA, DI and ES & Other. These sales channels are
evaluated based on revenue from customers and operating profit contribution to the total corporation. The reconciliation between
segment information and the consolidated financial statements is disclosed. Revenue summaries by geographic area and product
and service solutions are also disclosed. All income and expense items below operating profit are not allocated to the segments
and are not disclosed.
The DNA segment sells and services financial and retail systems in the United States and Canada. The DI segment sells and
services financial and retail systems over the remainder of the globe. The ES & Other segment includes the operating results of
the voting and lottery related business in Brazil. Each of the sales channels buys the goods it sells from the Company’s
manufacturing plants or through external suppliers. Intercompany sales between legal entities are eliminated in consolidation and
intersegment revenue is not significant. Each year, intercompany pricing is agreed upon which drives sales channel operating
profit contribution. Certain information not routinely used in the management of these segments, information not allocated back
to the segments or information that is impractical to report is not shown. Items not allocated are as follows: interest income,
interest expense, equity in the net income of investees accounted for by the equity method, income tax expense or benefit, and
other non-current assets.
Upon classification of the U.S. election systems business as discontinued operations, certain corporate overhead expenses
previously allocated to ES & Other were reallocated to DNA and DI and were $6,102 and $6,762 for the years ended December 31,
2008 and 2007, respectively.
86
DIEBOLD INCORPORATED AND SUBSIDIARIES
FORM 10-K as of December 31, 2009
NOTES TO CONSOLIDATED FINANCIAL STATEMENTS (Continued)
(dollars in thousands, except per share amounts)

The following table represents information regarding the Company’s segment information for the years ended December 31,
2009, 2008 and 2007:
SEGMENT INFORMATION BY CHANNEL
DNA DI ES & Other Total
2009
Customer revenues $1,382,461 $1,330,278 $ 5,553 $2,718,292
Operating profit 63,866 84,764 1,962 150,592
Capital expenditures 28,338 15,387 562 44,287
Depreciation 25,728 22,726 1,631 50,085
Property, plant and equipment, at cost 445,749 167,628 — 613,377
Total assets 1,132,011 1,422,854 — 2,554,865
2008
Customer revenues $1,535,991 $1,479,981 $65,866 $3,081,838
Operating profit (loss) 88,751 80,813 13,346 182,910
Capital expenditures 23,232 33,126 1,574 57,932
Depreciation 23,768 28,445 3,082 55,295
Property, plant and equipment, at cost 426,818 139,142 13,991 579,951
Total assets 1,197,572 1,258,206 82,158 2,537,936
2007
Customer revenues $1,543,050 $1,340,728 $ 4,573 $2,888,351
Operating profit 110,200 47,263 2,189 159,652
Capital expenditures 13,569 26,348 3,342 43,259
Depreciation 26,612 18,015 922 45,549
Property, plant and equipment, at cost 415,798 147,141 12,857 575,796
Total assets 1,167,782 1,333,815 93,127 2,594,724
87
DIEBOLD INCORPORATED AND SUBSIDIARIES
FORM 10-K as of December 31, 2009
NOTES TO CONSOLIDATED FINANCIAL STATEMENTS (Continued)
(dollars in thousands, except per share amounts)

The following table represents information regarding the Company’s revenue by geographic region and by product and
service solution for the years ended December 31, 2009, 2008 and 2007:
2009 2008 2007
December 31,
Revenue summary by geographic area
The Americas $1,985,010 $2,211,346 $2,056,163Asia Pacific 387,119 400,558 337,844Europe, Middle East and Africa 346,163 469,934 494,344
Total revenue $2,718,292 $3,081,838 $2,888,351
Total revenue domestic vs. international
Domestic $1,335,160 $1,477,875 $1,470,777Percentage of total revenue 49.1% 48.0% 50.9%International 1,383,132 1,603,963 1,417,574Percentage of total revenue 50.9% 52.0% 49.1%
Total revenue $2,718,292 $3,081,838 $2,888,351
Revenue summary by product and service solution
Financial self-service:Products $ 985,275 $1,127,120 $1,050,960Services 1,083,875 1,113,450 1,020,154
Total financial self-service 2,069,150 2,240,570 2,071,114Security:
Products 247,518 319,493 345,841Services 396,071 455,909 466,823
Total security 643,589 775,402 812,664
Total financial self-service & security 2,712,739 3,015,972 2,883,778Brazil election systems:
Products — 60,935 —Services — 623 —
Total Brazil election systems — 61,558 —Brazil lottery systems 5,553 4,308 4,573
Total revenue $2,718,292 $3,081,838 $2,888,351
The Company had no customers that accounted for more than 10 percent of total net sales in 2009, 2008 and 2007.
88
DIEBOLD INCORPORATED AND SUBSIDIARIES
FORM 10-K as of December 31, 2009
NOTES TO CONSOLIDATED FINANCIAL STATEMENTS (Continued)
(dollars in thousands, except per share amounts)

NOTE 20: DISCONTINUED OPERATIONS
During the third quarter of 2009, the Company sold its U.S. election systems business, primarily consisting of its subsidiary
PESI, for $12,147, including $5,000 of cash and contingent consideration with a fair value of $7,147, which represents 70 percent
of any cash collected over a five-year period on the accounts receivable balance of the sold business as of August 31, 2009. The
resulting pre-tax loss on the sale of $50,750 includes $1,862 of other transaction costs and $56,566 of net assets of the business
sold. The following table represents major classes of U.S. election systems business assets and liabilities sold:
August 31, 2009 December 31, 2008
Inventories $44,090 $ 45,916Trade receivables, net 15,365 24,279Property, plant and equipment, net 5,976 7,546Other, net (8,865) (11,369)
Total net assets $56,566 $ 66,372
The sale agreement contained indemnification clauses pursuant to which the Company agreed to indemnify the purchaser for
any and all adverse consequences relating to certain existing liabilities. In addition, the sale agreement contained shared liability
clauses pursuant to which the Company agreed to indemnify the purchaser for 70 percent of any adverse consequences to the
purchaser arising out of certain defined potential litigation or obligations. As of December 31, 2009, there were no material
adverse consequences related to these shared liability indemnifications. The Company’s maximum exposure under the shared
liability indemnifications is $8,000. The carrying value of the indemnified and shared liabilities related to the PESI sale was $6,541
as of December 31, 2009.
A few challenges to the sale of the Company’s U.S. election systems business have arisen. The Company cannot predict the
impact, if any, such challenges will have on the sale or the Company’s results of operations.
During the fourth quarter of 2008, the Company decided to discontinue its enterprise security operations in the EMEA region.
The Company does not anticipate incurring additional material charges associated with this closure.
Summarized financial information for discontinued operations is as follows:
2009 2008 2007
Year EndedDecember 31,
Total revenue $ 23,209 $103,900 $ 76,487
Loss from discontinued operations (17,258) (31,942) (61,951)Loss on sale of discontinued operations (50,750) — —Income tax benefit 20,932 12,744 3,664
Loss from discontinued operations, net of tax $(47,076) $ (19,198) $(58,287)
Loss from discontinued operations in 2008 included goodwill and other intangible asset impairment charges of $16,658
related to the closure of the Company’s EMEA enterprise security operations. Loss from discontinued operations in 2007 included
a goodwill impairment charge of $46,319, which represented the carrying value of PESI’s goodwill.
89
DIEBOLD INCORPORATED AND SUBSIDIARIES
FORM 10-K as of December 31, 2009
NOTES TO CONSOLIDATED FINANCIAL STATEMENTS (Continued)
(dollars in thousands, except per share amounts)

NOTE 21: QUARTERLY FINANCIAL INFORMATION (UNAUDITED)
The following table presents selected unaudited consolidated statements of income data:
2009 2008 2009 2008 2009 2008 2009 2008
First Quarter Second Quarter Third Quarter Fourth Quarter
Year Ended December 31,
Net sales $657,251 $677,212 $690,896 $744,390 $645,222 $869,089 $724,923 $791,147Gross profit 152,327 169,024 168,910 184,271 152,209 227,942 176,554 193,640Income from continuing
operations 10,838 17,011 33,272 28,769 25,237 49,962 9,983 19,079Loss from discontinued
operations, net of tax (7,081) (1,478) (1,558) (277) (203) (1,098) (1,042) (16,345)Loss on sale of discontinued
operations, net of tax — — — — (31,438) — (5,754) —
Net income (loss) 3,757 15,533 31,714 28,492 (6,404) 48,864 3,187 2,734Less: Net income attributable to
noncontrolling interests (2,109) (1,738) (1,284) (1,278) (751) (2,348) (2,084) (1,676)
Net income (loss) attributable toDiebold, Incorporated $ 1,648 $ 13,795 $ 30,430 $ 27,214 $ (7,155) $ 46,516 $ 1,103 $ 1,058
Basic earnings per share:Income from continuing
operations 0.13 0.23 0.48 0.41 0.37 0.72 0.12 0.27Loss from discontinued
operations (0.11) (0.02) (0.02) — (0.48) (0.02) (0.10) (0.25)
Net income (loss) $ 0.02 $ 0.21 $ 0.46 $ 0.41 $ (0.11) $ 0.70 $ 0.02 $ 0.02
Diluted earnings per share:Income from continuing
operations $ 0.13 $ 0.23 $ 0.48 $ 0.41 $ 0.37 $ 0.72 $ 0.12 $ 0.26Loss from discontinued
operations (0.11) (0.02) (0.02) — (0.48) (0.02) (0.10) (0.25)
Net income (loss) $ 0.02 $ 0.21 $ 0.46 $ 0.41 $ (0.11) $ 0.70 $ 0.02 $ 0.01
Basic weighted-average sharesoutstanding 66,176 66,018 66,252 66,101 66,279 66,101 66,318 66,106
Diluted weighted-average sharesoutstanding 66,586 66,306 66,786 66,765 66,951 66,758 67,057 66,651
Included in the fourth quarter 2009 and 2008 income from continuing operations are prior period adjustments of approx-
imately $9,000 and $5,300, respectively, related to the Company’s income tax expense (refer to note 4).
NOTE 22: SUBSEQUENT EVENTS
The Company assessed events occurring subsequent to December 31, 2009 through March 1, 2010 for potential recognition
and disclosure in the consolidated financial statements. There was one event described below which occurred that requires
disclosure in the consolidated financial statements. Other than the event described below, there were no events that have
occurred that would require adjustment to or disclosure in the consolidated financial statements, which were issued on March 1,
2010.
90
DIEBOLD INCORPORATED AND SUBSIDIARIES
FORM 10-K as of December 31, 2009
NOTES TO CONSOLIDATED FINANCIAL STATEMENTS (Continued)
(dollars in thousands, except per share amounts)

Geographic Organization Model In the first quarter of 2010, the Company began management of its businesses on a
geographic basis only, changing from the previous model of sales channel-based business. Aligning to this new management
structure and in accordance with ASC 280, Segment Reporting, the Company expects to report its results for geographic
segments beginning in the first quarter of 2010. The new organization model is part of the Company’s commitment to execute
against its strategic roadmap developed in 2006 to strengthen operations and build a strong foundation for future success. This
roadmap was built around five key priorities: increase customer loyalty; improve quality; strengthen the supply chain; enhance
communications and teamwork; and rebuild profitability. The new organization model is expected to deliver more productivity and
efficiency by reducing overall operating costs.
91
DIEBOLD INCORPORATED AND SUBSIDIARIES
FORM 10-K as of December 31, 2009
NOTES TO CONSOLIDATED FINANCIAL STATEMENTS (Continued)
(dollars in thousands, except per share amounts)

ITEM 9: CHANGES IN AND DISAGREEMENTS WITH ACCOUNTANTS ONACCOUNTING AND FINANCIAL DISCLOSURE
Not applicable.
ITEM 9A: CONTROLS AND PROCEDURESThis annual report includes the certifications of our chief executive officer (CEO) and chief financial officer (CFO) required by
Rule 13a-14 of the Exchange Act. See Exhibits 31.1 and 31.2. This Item 9A includes information concerning the controls and
control evaluations referred to in those certifications.
(A) DISCLOSURE CONTROLS AND PROCEDURES
Disclosure controls and procedures (as defined in Rules 13a-15(e) and 15d-15(e) promulgated under the Exchange Act) are
designed to ensure that information required to be disclosed in the reports filed or submitted under the Exchange Act is recorded,
processed, summarized and reported within the time periods specified in the SEC’s rules and forms and that such information is
accumulated and communicated to management, including the CEO and CFO as appropriate, to allow timely decisions regarding
required disclosures.
In connection with the preparation of this annual report, Diebold’s management, under the supervision and with the
participation of the CEO and CFO, conducted an evaluation of disclosure controls and procedures as of the end of the period
covered by this report. Based on this evaluation, the CEO and CFO have concluded that, as of December 31, 2009, and through the
filing of this annual report, our disclosure controls and procedures were not effective due to material weaknesses in our internal
control over financial reporting, as discussed in detail below.
Nevertheless, based on the performance of additional procedures by management designed to ensure the reliability of
financial reporting, the Company’s management believes that the consolidated financial statements fairly present, in all material
respects, the Company’s financial position, results of operations and cash flows as of the dates, and for the periods presented, in
conformity with U.S. GAAP.
(B) MANAGEMENT’S REPORT ON INTERNAL CONTROL OVER FINANCIAL REPORTING
Management, under the supervision of the CEO and CFO, is responsible for establishing and maintaining adequate internal
control over financial reporting. Internal control over financial reporting, as defined in Rules 13a-15(f) and 15d-15(f) promulgated
under the Exchange Act, is a process designed by, or under the supervision of, the CEO and CFO and effected by the Board of
Directors, management and other personnel to provide reasonable assurance regarding the reliability of financial reporting and the
preparation of financial statements for external reporting purposes in accordance with U.S. GAAP. Internal control over financial
reporting includes those policies and procedures that:
• pertain to the maintenance of records that, in reasonable detail, accurately and fairly reflect the transactions and
dispositions of the assets of the Company;
• provide reasonable assurance that transactions are recorded as necessary to permit preparation of financial statements in
accordance with U.S. GAAP;
• provide reasonable assurance that receipts and expenditures of the Company are being made only in accordance with
appropriate authorization of management and the Board of Directors; and
• provide reasonable assurance regarding prevention or timely detection of unauthorized acquisition, use or disposition of the
Company’s assets that could have a material effect on the financial statements.
Internal control over financial reporting has inherent limitations. Internal control over financial reporting is a process that
involves human diligence and compliance and is subject to lapses in judgment and breakdowns resulting from human failures.
92

Internal control over financial reporting can also be circumvented by collusion or improper override. Because of such limitations,
there is a risk that material misstatements will not be prevented or detected on a timely basis by internal control over financial
reporting. However, these inherent limitations are known features of the financial reporting process. Therefore, it is possible to
design into the process safeguards to reduce, though not eliminate, the risk.
A material weakness in internal control over financial reporting is defined by the Public Company Accounting Oversight Board
as being a deficiency, or a combination of deficiencies, in internal control over financial reporting, such that there is a reasonable
possibility that a material misstatement of the Company’s annual or interim financial statements will not be prevented or detected
on a timely basis.
As stated above in connection with the preparation of this annual report, management, under the supervision and with the
participation of our CEO and CFO, conducted an evaluation of the effectiveness of our internal control over financial reporting as of
December 31, 2009 based on the criteria established in the Committee of Sponsoring Organizations of the Treadway Commission
(COSO). As a result of that evaluation, management identified control deficiencies as of December 31, 2009 that constituted
material weaknesses, and accordingly, the CEO and CFO concluded that the Company did not maintain effective internal control
over financial reporting as of December 31, 2009.
Management notes that the following identified control deficiencies constitute material weaknesses as of December 31,
2009:
Selection, Application and Communication of Accounting Policies: The previously reported material weakness relating to
application of accounting policies is not considered remediated as the Company did not appropriately apply the revenue
recognition policy for training and maintenance services in certain international entities. Based on a review of an accrued liability
account that is used to record the commitment to provide these services, it was noted that the services were not properly
identified and accounted for as separate elements in multiple-element arrangements at inception. This misapplication of the
revenue recognition policy is a result of insufficient knowledge of U.S. GAAP to properly identify and account for multiple-element
arrangements. This control deficiency resulted in errors that were noted during the execution of account reconciliation control
procedures. Although none of these errors were material, either individually or in the aggregate, and these errors did not result in
adjustments to the financial statements, management has concluded that the related control deficiency constitutes a material
weakness since it is reasonably possible that these errors could have been material.
Controls over Income Taxes: During 2009, management determined that control procedures were not effective related to
providing adequate review and oversight of the calculation of the income tax provision. These control deficiencies resulted in
errors that required out-of-period adjustments in the Company’s 2009 tax provision. Although none of these errors were material,
either individually or in the aggregate, management has concluded that the related control deficiencies constitute a material
weakness since it is reasonably possible that these errors could have been material.
KPMG LLP, the Company’s independent registered public accounting firm, has issued an auditor’s report on management’s
assessment of the effectiveness of the Company’s internal control over financial reporting as of December 31, 2009. This report is
included on pages 43 and 44 of this annual report and is incorporated by reference in this Item 9A.
(C) CHANGES IN INTERNAL CONTROL OVER FINANCIAL REPORTING
As previously reported under “Item 4 — Controls and Procedures” in our quarterly report on Form 10-Q for the quarter ended
September 30, 2009, management concluded that our internal control over financial reporting was not effective based on the
material weaknesses identified. Management has continued to work on remediation efforts since the filing of that report.
During the quarter ended December 31, 2009, changes in our internal control over financial reporting occurred related to the
three previously reported material weaknesses as follows:
Selection, Application and Communication of Accounting Policies: As of December 31, 2009, management has completed
training on its global accounting policies relating to: 1) Financial Statement Analytical Reviews; 2) Non-Routine Contractual
Agreements; 3) Trade Receivables and Allowance for Doubtful Accounts; 4) Inventory and Related Reserves; 5) Prepaid Expenses
93

and Other Current Assets; and 6) Accrued Liabilities, Commitments and Contingencies, to clarify requirements related to the
appropriate accounting in each of these areas to facilitate global compliance with U.S. GAAP. In addition, management has
validated and monitored the consistent application of these accounting policies by its global operations.
Manual Journal Entries: As of December 31, 2009, the Company’s management has concluded that the previously reported
material weakness relating to manual journal entry controls has been fully remediated. Management continued to enforce policies
and procedures to monitor compliance with its journal entry accounting policy, which governs requirements for support, review
and approval of manual journal entries throughout the quarter ended December 31, 2009. The Company has deployed application
control functionality to systematically enforce the Company’s policy, and to prevent or detect the posting of manual journal entries
not approved in accordance with the policy. The system functionality includes attaching the supporting documentation of the
manual journal entry and requires managerial approval prior to posting an entry to the entities’ general ledger. In addition, as part of
the 2009 period-end financial closing procedures, management utilized the monitoring process to conduct reviews of manual
journal entries recorded to assure compliance with the Company’s policy. Based on these reviews, which are part of the control
process, the manual journal entry controls are deemed to be operating effectively.
Account Reconciliations: As of December 31, 2009, the Company’s management has concluded that the previously reported
material weakness relating to account reconciliation controls has been fully remediated. Management continued to enforce
policies and procedures to monitor compliance with its account reconciliation policy, which governs requirements for content,
format, and review and approval of balance sheet account reconciliations throughout the quarter ended December 31, 2009. The
Company completed the planned deployment of an account reconciliation database and compliance monitoring tool to standardize
its processes, procedures and documentation. In addition, as part of the 2009 period-end financial closing procedures, man-
agement utilized a monthly monitoring process, in which each division is required to provide a report to corporate accounting that
documents timely completion with proper managerial reviews and approvals of the completeness, accuracy, and appropriateness
of the account reconciliations for the entity. Based on these reviews, which are part of the control process, the account
reconciliation controls are deemed to be operating effectively.
(D) REMEDIATION STEPS TO ADDRESS MATERIAL WEAKNESSES
Management is committed to remediating its remaining material weaknesses in a timely fashion. Management’s Sarbanes-
Oxley compliance function is responsible for helping to monitor short-term and long-term remediation plans. In addition, the
Company has an executive owner to direct the necessary remedial changes to the overall design of its internal control over
financial reporting and to address the root causes of the material weaknesses. The leadership team is committed to achieving and
maintaining a strong control environment, high ethical standards and financial reporting integrity. This commitment will continue to
be communicated to and reinforced with all associates.
The remediation efforts, outlined below, are intended to address the identified material weaknesses in internal control over
financial reporting.
Selection, Application and Communication of Accounting Policies: To address the issues associated with the misapplication
of the Company’s revenue recognition policy related to multiple element arrangements, management plans to:
1) Enhance the documentation relating to the application of the revenue recognition policy to multiple-element arrange-
ments, for use by the operational finance teams;
2) Provide training to the operational associates responsible for the application of the revenue recognition policy and
procedures related to multiple-element arrangements to enhance and augment the depth of knowledge of the associates and
reduce the risk of future accounting errors; and
3) Involve corporate accounting more in the oversight and monitoring of recording and reporting of complex multiple-element
arrangements during future periods.
At this time, the Company anticipates the remediation efforts related to this material weakness will be fully implemented by
the end of 2010.
94

Controls over Income Taxes: To address the issues associated with controls over income taxes, management plans to:
1) Utilize specialized third-party consultants to assist with assessing review and oversight controls relating to the calculation
of the income tax provision; and
2) Based on the findings of the third-party consultants, implement control procedures to enhance the review and oversight
control process and to reduce the risk of future errors related to the calculation of the tax provision.
At this time, the Company anticipates the remediation efforts related to this material weakness will be fully implemented by
the end of 2010.
The Company’s management believes the remediation measures described above will remediate the identified control
deficiencies and strengthen the Company’s internal control over financial reporting. As management continues to evaluate and
work to improve its internal control over financial reporting, it may be determined that additional measures must be taken to
address control deficiencies or it may be determined that the Company needs to modify, or in appropriate circumstances not to
complete, certain of the remediation measures. Total costs incurred for remediation efforts were approximately $3.7 million for
the year ended December 31, 2009.
ITEM 9B: OTHER INFORMATIONNone.
PART III
ITEM 10: DIRECTORS, EXECUTIVE OFFICERS AND CORPORATEGOVERNANCE
Information with respect to directors of the Company, including the audit committee and the designated audit committee
financial experts, is included in the Company’s proxy statement for the 2010 Annual Meeting of Shareholders (“2010 Annual
Meeting”) and is incorporated herein by reference. Information with respect to any material changes to the procedures by which
security holders may recommend nominees to the Company’s board of directors is included in the Company’s proxy statement for
the 2010 Annual Meeting and is incorporated herein by reference. The following table summarizes information regarding
executive officers of the Company:
Name, Age, Title and Year Elected to Present Office Other Positions Held Last Five Years
Thomas W. Swidarski — 51President and Chief Executive OfficerYear elected: 2005
Oct-Dec 2005: President and Chief Operating Officer; 2001-2005: Senior Vice President, Financial Self-Service Group
Bradley C. Richardson — 51Executive Vice President and Chief Financial OfficerYear elected: 2009
2003-2009; Executive Vice President, Corporate Strategy andChief Financial Officer, Modine Manufacturing Company(auto, heavy-duty parts and specialty heating and airconditioning manufacturer)
George S. Mayes, Jr. — 51Executive Vice President, Global OperationsYear elected: 2008
2006-2008: Senior Vice President, Supply ChainManagement; 2005-2006: Vice President, Global SupplyChain Management
David Bucci — 58Senior Vice President, Customer Solutions GroupYear elected: 2001
James L. M. Chen — 49Executive Vice President, International OperationsYear elected: 2010
2007-2010: Senior Vice President, EMEA/AP Divisions; 2006-2007: Vice President, EMEA/AP Divisions; 1998-2006: VicePresident and Managing Director, Asia/Pacific
Charles E. Ducey, Jr. — 54Executive Vice President, North America OperationsYear elected: 2009
2006-2009: Senior Vice President, Global Development andServices; 2005-2006: Vice President, Global Developmentand Services; 2001-2005: Vice President, Customer ServiceSolutions Diebold North America
95

Name, Age, Title and Year Elected to Present Office Other Positions Held Last Five Years
Warren W. Dettinger — 56Vice President, General Counsel and Assistant SecretaryYear elected: 2009
2008-2009: Vice President and General Counsel; 2004-2008:Vice President, General Counsel and Secretary
Chad F. Hesse — 37Senior Corporate Counsel and SecretaryYear elected: 2008
2004-2008: Corporate Counsel and Assistant Secretary
M. Scott Hunter — 48Vice President, Chief Tax OfficerYear elected: 2006
2004: Vice President, Tax; 2003-2004: Senior Tax Director
John D. Kristoff — 42Vice President, Chief Communications OfficerYear elected: 2006
2005-2006: Vice President, Corporate Communications andInvestor Relations; 2004-2005: Vice President, InvestorRelations
Miguel A. Mateo — 59Vice President, Latin America DivisionYear elected: 2004
Timothy J. McDannold — 47Vice President and TreasurerYear elected: 2007
2000-2007: Vice President and Assistant Treasurer
Leslie A. Pierce — 46Vice President and Corporate ControllerYear elected: 2007
Mar-Nov 2009: Vice President, Interim Chief Financial Officerand Corporate Controller; 2006-2007: Vice President,Accounting, Compliance and External Reporting; 1999-2006:Manager, Special Projects
Sheila M. Rutt — 41Vice President, Chief Human Resources OfficerYear elected: 2005
2002-2005: Vice President, Global Human Resources
Bradley J. Stephenson — 57Vice President, Security DivisionYear elected: 2009
2005-2009: Vice President, Physical Security Group
Robert J. Warren — 63Vice President, Corporate Development and FinanceYear elected: 2007
1990-2007: Vice President and Treasurer
There is no family relationship, either by blood, marriage or adoption, between any of the executive officers of the Company.
CODE OF ETHICS
All of the directors, executive officers and employees of the Company are required to comply with certain policies and
protocols concerning business ethics and conduct, which we refer to as our Business Ethics Policy. The Business Ethics Policy
applies not only to the Company, but also to all of those domestic and international companies in which the Company owns or
controls a majority interest. The Business Ethics Policy describes certain responsibilities that the directors, executive officers and
employees have to the Company, to each other and to the Company’s global partners and communities including, but not limited
to, compliance with laws, conflicts of interest, intellectual property and the protection of confidential information. The Business
Ethics Policy is available on the Company’s web site at www.diebold.com or by written request to the Corporate Secretary.
SECTION 16(A) BENEFICIAL OWNERSHIP REPORTING COMPLIANCE
Information with respect to Section 16(a) Beneficial Ownership Reporting Compliance is included in the Company’s proxy
statement for the 2010 Annual Meeting and is incorporated herein by reference.
ITEM 11: EXECUTIVE COMPENSATIONInformation with respect to executive officer and director’s compensation is included in the Company’s proxy statement for
the 2010 Annual Meeting and is incorporated herein by reference. Information with respect to compensation committee
interlocks and insider participation and the compensation committee report is included in the Company’s proxy statement for
the 2010 Annual Meeting and is incorporated herein by reference.
96

ITEM 12: SECURITY OWNERSHIP OF CERTAIN BENEFICIAL OWNERS ANDMANAGEMENT AND RELATED STOCKHOLDER MATTERS
Information with respect to security ownership of certain beneficial owners and management and equity compensation plan
information is included in the Company’s proxy statement for the 2010 Annual Meeting and is incorporated herein by reference.
ITEM 13: CERTAIN RELATIONSHIPS AND RELATED TRANSACTIONS, ANDDIRECTOR INDEPENDENCE
Information with respect to certain relationships and related transactions and director independence is included in the
Company’s proxy statement for the 2010 Annual Meeting and is incorporated herein by reference.
ITEM 14: PRINCIPAL ACCOUNTANT FEES AND SERVICESInformation with respect to principal accountant fees and services is included in the Company’s proxy statement for the 2010
Annual Meeting and is incorporated herein by reference.
PART IV
ITEM 15: EXHIBITS AND FINANCIAL STATEMENT SCHEDULES(a) 1. Documents filed as a part of this annual report.
• Consolidated Balance Sheets at December 31, 2009 and 2008
• Consolidated Statements of Income for the Years Ended December 31, 2009, 2008 and 2007
• Consolidated Statements of Equity for the Years Ended December 31, 2009, 2008 and 2007
• Consolidated Statements of Cash Flows for the Years Ended December 31, 2009, 2008 and 2007
• Notes to Consolidated Financial Statements
• Reports of Independent Registered Public Accounting Firm
(a) 2. Financial statement schedule
The following report and schedule are included in this Part IV, and are found in this annual report:
• Report of Independent Registered Public Accounting Firm, and
• Valuation and Qualifying Accounts.
All other schedules are omitted, as the required information is inapplicable or the information is presented in the Consolidated
Financial Statements or related notes.
(a) 3. Exhibits
3.1(i) Amended and Restated Articles of Incorporation of Diebold, Incorporated — incorporated by reference to Exhibit 3.1(i)to Registrant’s Annual Report on Form 10-K for the year ended December 31, 1994 (Commission File No. 1-4879)
3.1(ii) Amended and Restated Code of Regulations — incorporated by reference to Exhibit 3.1(ii) to Registrant’s QuarterlyReport on Form 10-Q for the quarter ended March 31, 2007 (Commission File No. 1-4879)
3.2 Certificate of Amendment by Shareholders to Amended Articles of Incorporation of Diebold, Incorporated —incorporated by reference to Exhibit 3.2 to Registrant’s Form 10-Q for the quarter ended March 31, 1996(Commission File No. 1-4879)
97
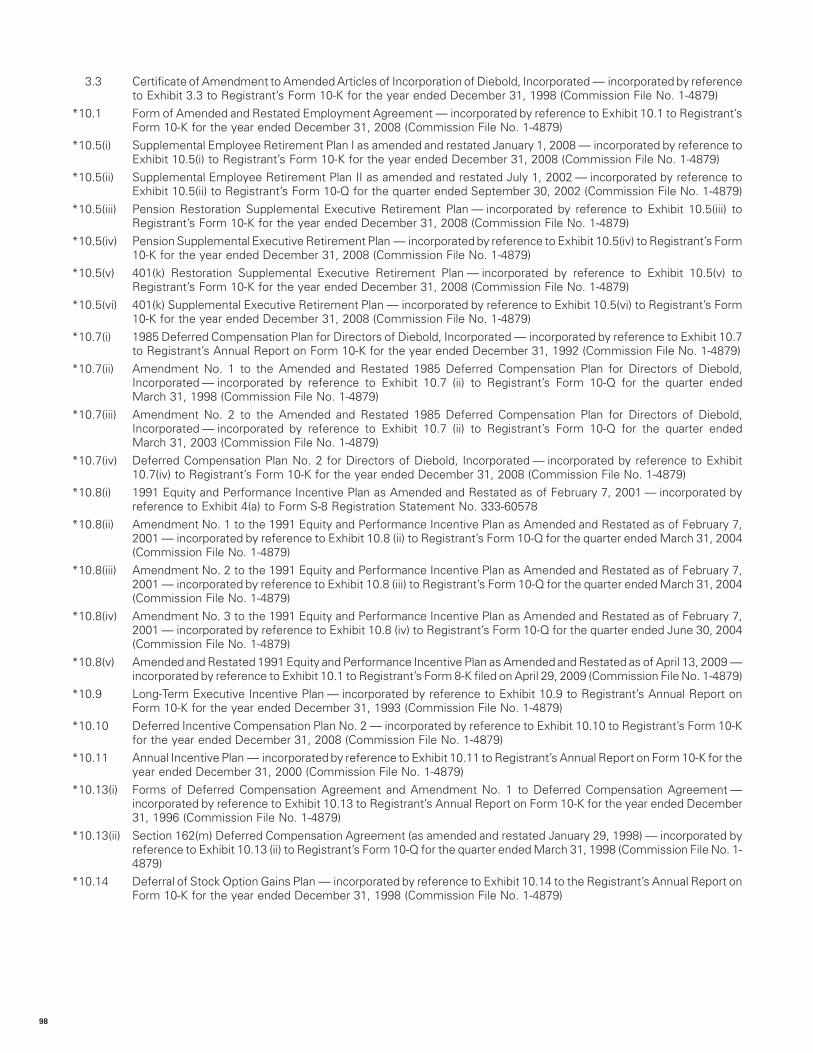
3.3 Certificate of Amendment to Amended Articles of Incorporation of Diebold, Incorporated — incorporated by referenceto Exhibit 3.3 to Registrant’s Form 10-K for the year ended December 31, 1998 (Commission File No. 1-4879)
*10.1 Form of Amended and Restated Employment Agreement — incorporated by reference to Exhibit 10.1 to Registrant’sForm 10-K for the year ended December 31, 2008 (Commission File No. 1-4879)
*10.5(i) Supplemental Employee Retirement Plan I as amended and restated January 1, 2008 — incorporated by reference toExhibit 10.5(i) to Registrant’s Form 10-K for the year ended December 31, 2008 (Commission File No. 1-4879)
*10.5(ii) Supplemental Employee Retirement Plan II as amended and restated July 1, 2002 — incorporated by reference toExhibit 10.5(ii) to Registrant’s Form 10-Q for the quarter ended September 30, 2002 (Commission File No. 1-4879)
*10.5(iii) Pension Restoration Supplemental Executive Retirement Plan — incorporated by reference to Exhibit 10.5(iii) toRegistrant’s Form 10-K for the year ended December 31, 2008 (Commission File No. 1-4879)
*10.5(iv) Pension Supplemental Executive Retirement Plan — incorporated by reference to Exhibit 10.5(iv) to Registrant’s Form10-K for the year ended December 31, 2008 (Commission File No. 1-4879)
*10.5(v) 401(k) Restoration Supplemental Executive Retirement Plan — incorporated by reference to Exhibit 10.5(v) toRegistrant’s Form 10-K for the year ended December 31, 2008 (Commission File No. 1-4879)
*10.5(vi) 401(k) Supplemental Executive Retirement Plan — incorporated by reference to Exhibit 10.5(vi) to Registrant’s Form10-K for the year ended December 31, 2008 (Commission File No. 1-4879)
*10.7(i) 1985 Deferred Compensation Plan for Directors of Diebold, Incorporated — incorporated by reference to Exhibit 10.7to Registrant’s Annual Report on Form 10-K for the year ended December 31, 1992 (Commission File No. 1-4879)
*10.7(ii) Amendment No. 1 to the Amended and Restated 1985 Deferred Compensation Plan for Directors of Diebold,Incorporated — incorporated by reference to Exhibit 10.7 (ii) to Registrant’s Form 10-Q for the quarter endedMarch 31, 1998 (Commission File No. 1-4879)
*10.7(iii) Amendment No. 2 to the Amended and Restated 1985 Deferred Compensation Plan for Directors of Diebold,Incorporated — incorporated by reference to Exhibit 10.7 (ii) to Registrant’s Form 10-Q for the quarter endedMarch 31, 2003 (Commission File No. 1-4879)
*10.7(iv) Deferred Compensation Plan No. 2 for Directors of Diebold, Incorporated — incorporated by reference to Exhibit10.7(iv) to Registrant’s Form 10-K for the year ended December 31, 2008 (Commission File No. 1-4879)
*10.8(i) 1991 Equity and Performance Incentive Plan as Amended and Restated as of February 7, 2001 — incorporated byreference to Exhibit 4(a) to Form S-8 Registration Statement No. 333-60578
*10.8(ii) Amendment No. 1 to the 1991 Equity and Performance Incentive Plan as Amended and Restated as of February 7,2001 — incorporated by reference to Exhibit 10.8 (ii) to Registrant’s Form 10-Q for the quarter ended March 31, 2004(Commission File No. 1-4879)
*10.8(iii) Amendment No. 2 to the 1991 Equity and Performance Incentive Plan as Amended and Restated as of February 7,2001 — incorporated by reference to Exhibit 10.8 (iii) to Registrant’s Form 10-Q for the quarter ended March 31, 2004(Commission File No. 1-4879)
*10.8(iv) Amendment No. 3 to the 1991 Equity and Performance Incentive Plan as Amended and Restated as of February 7,2001 — incorporated by reference to Exhibit 10.8 (iv) to Registrant’s Form 10-Q for the quarter ended June 30, 2004(Commission File No. 1-4879)
*10.8(v) Amended and Restated 1991 Equity and Performance Incentive Plan as Amended and Restated as of April 13, 2009 —incorporated by reference to Exhibit 10.1 to Registrant’s Form 8-K filed on April 29, 2009 (Commission File No. 1-4879)
*10.9 Long-Term Executive Incentive Plan — incorporated by reference to Exhibit 10.9 to Registrant’s Annual Report onForm 10-K for the year ended December 31, 1993 (Commission File No. 1-4879)
*10.10 Deferred Incentive Compensation Plan No. 2 — incorporated by reference to Exhibit 10.10 to Registrant’s Form 10-Kfor the year ended December 31, 2008 (Commission File No. 1-4879)
*10.11 Annual Incentive Plan — incorporated by reference to Exhibit 10.11 to Registrant’s Annual Report on Form 10-K for theyear ended December 31, 2000 (Commission File No. 1-4879)
*10.13(i) Forms of Deferred Compensation Agreement and Amendment No. 1 to Deferred Compensation Agreement —incorporated by reference to Exhibit 10.13 to Registrant’s Annual Report on Form 10-K for the year ended December31, 1996 (Commission File No. 1-4879)
*10.13(ii) Section 162(m) Deferred Compensation Agreement (as amended and restated January 29, 1998) — incorporated byreference to Exhibit 10.13 (ii) to Registrant’s Form 10-Q for the quarter ended March 31, 1998 (Commission File No. 1-4879)
*10.14 Deferral of Stock Option Gains Plan — incorporated by reference to Exhibit 10.14 to the Registrant’s Annual Report onForm 10-K for the year ended December 31, 1998 (Commission File No. 1-4879)
98

10.17 Credit Agreement, dated as of October 19, 2009, by and among the Company, the Subsidiary Borrowers (as definedtherein) party thereto, JPMorgan Chase Bank, N.A., as administrative agent and a lender, and the other lenders partythereto — incorporated by reference to Exhibit 10.1 to Registrant’s Form 8-K filed on October 23, 2009 (CommissionFile No. 1-4879)
10.20(i) Transfer and Administration Agreement, dated as of March 30, 2001 by and among DCC Funding LLC, Diebold CreditCorporation, Diebold, Incorporated, Receivables Capital Corporation and Bank of America, National Association andthe financial institutions from time to time parties thereto — incorporated by reference to Exhibit 10.20(i) toRegistrant’s Form 10-Q for the quarter ended March 31, 2001 (Commission File No. 1-4879)
10.20(ii) Amendment No. 1 to the Transfer and Administration Agreement, dated as of May 2001, by and among DCC FundingLLC, Diebold Credit Corporation, Diebold, Incorporated, Receivables Capital Corporation and Bank of America,National Association and the financial institutions from time to time parties thereto — incorporated by referenceto Exhibit 10.20 (ii) to Registrant’s Form 10-Q for the quarter ended March, 31, 2001 (Commission File No. 1-4879)
*10.22 Form of Non-Qualified Stock Option Agreement — incorporated by reference to Exhibit 10.1 to Registrant’s Form 8-Kfiled on September 21, 2009 (Commission File No. 1-4879)
*10.23 Form of Restricted Share Agreement — incorporated by reference to Exhibit 10.2 to Registrant’s Form 8-K filed onSeptember 21, 2009 (Commission File No. 1-4879)
*10.24 Form of RSU Agreement — incorporated by reference to Exhibit 10.3 to Registrant’s Form 8-K filed on September 21,2009 (Commission File No. 1-4879)
*10.25 Form of Performance Share Agreement — incorporated by reference to Exhibit 10.4 to Registrant’s Form 8-K filed onSeptember 21, 2009 (Commission File No. 1-4879)
*10.26 Diebold, Incorporated Annual Cash Bonus Plan — incorporated by reference to Exhibit A to Registrant’s ProxyStatement on Schedule 14A filed on March 16, 2005 (Commission File No. 1-4879)
10.27 Form of Note Purchase Agreement — incorporated by reference to Exhibit 10.1 to Registrant’s Form 8-K filed onMarch 8, 2006 (Commission File No. 1-4879)
*10.28 Amended and Restated Employment Agreement between Diebold, Incorporated and Thomas W. Swidarski, asamended as of December 29, 2008 — incorporated by reference to Exhibit 10.28 to Registrant’s Form 10-K for theyear ended December 31, 2008 (Commission File No. 1-4879)
*10.29 Amended and Restated Employment [Change in Control] Agreement between Diebold, Incorporated and Thomas W.Swidarski, as amended as of December 29, 2008 — incorporated by reference to Exhibit 10.29 to Registrant’s Form10-K for the year ended December 31, 2008 (Commission File No. 1-4879)
*10.30 Form of Deferred Shares Agreement — incorporated by reference to Exhibit 10.5 to Registrant’s Form 8-K filed onSeptember 21, 2009 (Commission File No. 1-4879)
21.1 Subsidiaries of the Registrant as of December 31, 200923.1 Consent of Independent Registered Public Accounting Firm24.1 Power of Attorney31.1 Certification of Chief Executive Officer Pursuant to Section 302 of the Sarbanes-Oxley Act of 200231.2 Certification of Chief Financial Officer Pursuant to Section 302 of the Sarbanes-Oxley Act of 200232.1 Certification of Principal Executive Officer Pursuant to Section 906 of the Sarbanes-Oxley Act of 2002, 18 U.S.C.
Section 135032.2 Certification of Principal Financial Officer Pursuant to Section 906 of the Sarbanes-Oxley Act of 2002, 18 U.S.C.
Section 1350
* Reflects management contract or other compensatory arrangement required to be filed as an exhibit pursuant to Item 15(b) of
this annual report.
(b) Refer to this Form 10-K for an index of exhibits.
99

SIGNATURES
Pursuant to the requirements of Section 13 or 15(d) of the Securities Exchange Act of 1934, the Registrant has duly caused
this report to be signed on its behalf by the undersigned, thereunto duly authorized.
DIEBOLD, INCORPORATED
Date: March 1, 2010 By: /s/ THOMAS W. SWIDARSKI
Thomas W. SwidarskiPresident and Chief Executive Officer
Pursuant to the requirements of the Securities Exchange Act of 1934, this report has been signed below by the following
persons on behalf of the Registrant and in the capacities and on the dates indicated.
Signature Title Date
/s/ THOMAS W. SWIDARSKI
Thomas W. SwidarskiPresident, Chief Executive Officer and Director(Principal Executive Officer)
March 1, 2010
/s/ BRADLEY C. RICHARDSON
Bradley C. RichardsonExecutive Vice President and Chief FinancialOfficer (Principal Financial Officer)
March 1, 2010
/s/ LESLIE A. PIERCE
Leslie A. PierceVice President and Corporate Controller (PrincipalAccounting Officer)
March 1, 2010
/s/ MEI-WEI CHENG
Mei-Wei ChengDirector March 1, 2010
*Phillip R. Cox
Director March 1, 2010
/s/ RICHARD L. CRANDALL
Richard L. CrandallDirector March 1, 2010
*Gale S. Fitzgerald
Director March 1, 2010
/s/ PHILLIP B. LASSITER
Phillip B. LassiterDirector March 1, 2010
*John N. Lauer
Director March 1, 2010
*Eric J. Roorda
Director March 1, 2010
/s/ HENRY D.G. WALLACE
Henry D.G. WallaceDirector March 1, 2010
100

Signature Title Date
/s/ ALAN J. WEBER
Alan J. WeberDirector March 1, 2010
* The undersigned, by signing his name hereto, does sign and execute this Annual Report on Form 10-K pursuant tothe Powers of Attorney executed by the above-named officers and directors of the Registrant and filed with theSecurities and Exchange Commission on behalf of such officers and directors.
Date: March 1, 2010 *By: /s/ BRADLEY C. RICHARDSON
Bradley C. Richardson, Attorney-in-Fact
101

DIEBOLD, INCORPORATED AND SUBSIDIARIES
SCHEDULE II — VALUATION AND QUALIFYING ACCOUNTS
YEARS ENDED DECEMBER 31, 2009, 2008 AND 2007
(In thousands)
Balance atbeginning of
year Additions DeductionsBalance atend of year
Year Ended December 31, 2009
Allowance for doubtful accounts . . . . . . . . . . . . . . . . . . . $25,060 16,727 15,139 $26,648
Year ended December 31, 2008
Allowance for doubtful accounts . . . . . . . . . . . . . . . . . . . $33,707 16,336 24,983 $25,060
Year ended December 31, 2007
Allowance for doubtful accounts . . . . . . . . . . . . . . . . . . . $32,104 22,425 20,822 $33,707
102

EXHIBIT INDEX
EXHIBIT NO. DOCUMENT DESCRIPTION
21.1 Significant Subsidiaries of the Registrant
23.1 Consent of Independent Registered Public Accounting Firm
24.1 Power of Attorney
31.1 Certification of Chief Executive Officer Pursuant to Section 302 of the Sarbanes-Oxley Act of 2002
31.2 Certification of Chief Financial Officer Pursuant to Section 302 of the Sarbanes-Oxley Act of 2002
32.1 Certification of Chief Executive Officer Pursuant to Section 906 of the Sarbanes-Oxley Act of 2002, 18 U.S.C.
Section 1350
32.2 Certification of Chief Financial Officer Pursuant to Section 906 of the Sarbanes-Oxley Act of 2002, 18 U.S.C.
Section 1350
103

EXHIBIT 21.1LIST OF SIGNIFICANT SUBSIDIARIES
The following are the subsidiaries of the Registrant included in the Registrant’s consolidated financial statements at
December 31, 2009. Other subsidiaries are not listed because such subsidiaries are inactive. Subsidiaries are listed alphabetically
under either the domestic or international categories.
DomesticJurisdiction underwhich organized
Percent of voting securitiesowned by Registrant
DBD Investment Management Company Delaware 100%
Diebold Actcom Security Systems, Inc. Delaware 100%
Diebold Australia Holding Company, Inc. Delaware 100%
Diebold Enterprise Security Systems, Inc. New York 100%
Diebold Eras, Incorporated Ohio 100%
Diebold Finance Company, Inc. Delaware 100%(1)
Diebold Fire Services, Inc. Delaware 100%
Diebold Fire Services (Virginia), Inc. Virginia 100%
Diebold Global Finance Corporation Delaware 100%
Diebold Holding Company, Inc. Delaware 100%
Diebold Information and Security Systems, LLC Delaware 100%
Diebold Investment Company Delaware 100%
Diebold Latin America Holding Company, LLC Delaware 100%
Diebold Mexico Holding Company, Inc. Delaware 100%
Diebold Midwest Manufacturing, Inc. Delaware 100%
Diebold Self-Service Systems New York 100%(2)
Diebold Southeast Manufacturing, Inc. Delaware 100%(3)
Diebold SST Holding Company, Inc. Delaware 100%
FirstLine, Inc. California 100%
Maintenance Acquisition Company No. 1, LLC Delaware 100%
Diebold Software Solutions, Inc. Delaware 100%
VDM Holding Company, Inc. Delaware 100%
Verdi & Associates, Inc. New York 100%
InternationalJurisdiction underwhich organized
Percent of voting securitiesowned by Registrant
Bitelco Diebold Chile Limitada Chile 100%(23)
C.R. Panama, Inc. Panama 100%(13)
Cable Print N.V. Belgium 100%
Caribbean Self Service and Security LTD. Barbados 50%(12)
Central de Alarmas Adler, S.A. de C.V. Mexico 100%(22)
D&G ATMS y Seguridad de Costa Rica Ltda. Costa Rica 99.99%(40)
D&G Centroamerica y GBM Nicaragua 99%(38)

InternationalJurisdiction underwhich organized
Percent of voting securitiesowned by Registrant
D&G Centroamerica, S. de R.L. Panama 51%(36)
D&G Dominicana S.A. Dominican Republic 99.85%(39)
D&G Honduras S. de R.L. Honduras 99%(38)
D&G Panama S. de R.L. Panama 99.99%(40)
DB & GB de El Salvador Limitada El Salvador 99%(38)
DB&G ATMs Seguridad de Guatemala, Limitada Guatemala 99%(38)
DCHC, S.A. Panama 100%(13)
Diebold (Thailand) Company Limited Thailand 100%
Diebold Africa (Pty) Ltd. South Africa 100%(20)
Diebold Africa Investment Holdings Pty. Ltd. South Africa 100%(33)
Diebold Argentina, S.A. Argentina 100%(13)
Diebold ATM Cihazlari Sanayi Ve Ticaret A.S. Turkey 100%(18)
Diebold Australia Pty. Ltd. Australia 100%(6)
Diebold Belgium B.V.B.A Belgium 100%(19)
Diebold Bolivia S.R. L. Bolivia 100%(37)
Diebold Brasil LTDA Brazil 100%(13)
Diebold Canada Holding Company Inc. Canada 100%
Diebold Cassis Manufacturing S.A. France 100%
Diebold Colombia S.A. Colombia 100%(16)
Diebold Czech Republic s.r.o Czech Republic 100%(7)
Diebold Ecuador SA Ecuador 100%(21)
Diebold EMEA Processing Centre Limited United Kingdom 100%
Diebold Enterprise Security Systems Holdings UK Limited United Kingdom 100%(26)
Diebold Enterprise Security Systems UK Limited United Kingdom 100%(27)
Diebold Enterprise Security Systems, Benelux B.V. Netherlands 100%(28)
Diebold Enterprise Security Systems, Ireland Ltd. Ireland 100%(28)
Diebold Financial Equipment Company (China), Ltd. Peoples Republic of China 85%(31)
Diebold France SARL France 100%(7)
Diebold Hungary Ltd. Hungary 100%(7)
Diebold Hungary Self-Service Solutions, Ltd. Hungary 100%
Diebold India Private Limited India 100%(34)
Diebold International Limited United Kingdom 100%(7)
Diebold Italia S.p.A. Italy 100%(15)
Diebold Kazakhstan LLP Kazakhstan 100%(7)
Diebold Mexico, S.A. de C.V. Mexico 100%(4)

InternationalJurisdiction underwhich organized
Percent of voting securitiesowned by Registrant
Diebold Netherlands B.V. Netherlands 100%(7)
Diebold OLTP Systems, C.A. Venezuela 50%(12)
Diebold Osterreich Selbstbedienungssysteme GmbH Austria 100%(7)
Diebold Pacific, Limited Hong Kong 100%
Diebold Panama, Inc. Panama 100%(13)
Diebold Paraguay S.A. Paraguay 100%(23)
Diebold Peru S.r.l Peru 100%(13)
Diebold Philippines, Inc. Philippines 100%(35)
Diebold Physical Security Pty. Ltd. Australia 100%(9)
Diebold Poland S.p. z.o.o. Poland 100%(7)
Diebold Portugal — Solucoes de Automatizacao, Limitada Portugal 100%(7)
Diebold Security Systems Limited United Kingdom 100%(25)
Diebold Selbstbedienyngssysteme (Schweiz) GmbH Switzerland 100%(7)
Diebold Self Service Solutions Limited Liability Company Switzerland 100%(17)
Diebold Self-Service Ltd. Russia 100%(7)
Diebold Singapore Pte. Ltd. Singapore 100%
Diebold Slovakia s.r.o. Slovakia 100%(7)
Diebold Software Services Private Limited India 100%(10)
Diebold Software Solutions UK Ltd. United Kingdom 100%(11)
Diebold South Africa (Pty) Ltd. South Africa 75%(32)
Diebold Spain, S.L. Spain 100%(24)
Diebold Switzerland Holding Company, LLC Switzerland 100%(17)
Diebold Systems Private Limited India 100%
Diebold Uruguay S.A. Uruguay 100%(13)
Diebold — Corp Systems Sdn. Bhd. Malaysia 100%
J.J.F. Panama, Inc. Panama 100%(13)
P.T. Diebold Indonesia Indonesia 100%(8)
Procomp Amazonia Industria Eletronica S.A. Brazil 100%(14)
Procomp Industria Eletronica LTDA Brazil 100%(30)
SIAB (HK) Limited Hong Kong 100%(5)
The Diebold Company of Canada, Ltd. Canada 100%(41)
(1) 100 percent of voting securities are owned by Diebold Investment Company, which is 100 percent owned byRegistrant.
(2) 70 percent of partnership interest is owned by Diebold Holding Company, Inc., which is 100 percent owned byRegistrant, while the remaining 30 percent partnership interest is owned by Diebold SST Holding Company, Inc.,which is 100 percent owned by Registrant.

(3) 100 percent of voting securities are owned by Diebold Midwest Manufacturing, Inc., which is 100 percentowned by Registrant.
(4) 100 percent of voting securities are owned by Diebold Mexico Holding Company, Inc., which is 100 percentowned by Registrant.
(5) 100 percent of voting securities are owned by Diebold Self-Service Systems, which is 70 percent owned byDiebold Holding Company, Inc. and 30 percent owned by Diebold SST Holding Company, Inc., both of which are100 percent owned by Registrant.
(6) 100 percent of voting securities are owned by Diebold Australia Holding Company, Inc., which is 100 percentowned by Registrant.
(7) 100 percent of voting securities are owned by Diebold Self-Service Solutions Limited Liability Company, whichis 95 percent owned by Registrant and 5 percent owned by Diebold Holding Company, Inc., which is 100 percentowned by Registrant.
(8) 88.89 percent of voting securities are owned by Registrant, and 11.11 percent of voting securities are owned byDiebold Pacific, Limited, which is 100 percent owned by Registrant.
(9) 100 percent of voting securities are owned by Diebold Australia Pty. Ltd., which is 100 percent owned byDiebold Australia Holding Company, Inc., which is 100 percent owned by Registrant.
(10) 99.99 percent of voting securities are owned by Diebold Self-Service Solutions Limited Liability Company, whichis 95 percent owned by Registrant and 5 percent owned by Diebold Holding Company, Inc., which is 100 percentowned by Registrant, while the remaining .01 percent of voting securities is owned by Registrant.
(11) 100 percent of voting securities are owned by Diebold Software Solutions, Inc., which is 100 percent owned byRegistrant.
(12) 50 percent of voting securities are owned by Diebold Latin America Holding Company, LLC, which is 100 percentowned by Registrant.
(13) 100 percent of voting securities are owned by Diebold Latin America Holding Company, LLC, which is100 percent owned by Registrant.
(14) 100 percent of voting securities are owned by Diebold Brasil LTDA, which is 100 percent owned by Diebold LatinAmerica Holding Company, LLC, which is 100 percent owned by Registrant.
(15) 100 percent of voting securities are owned by Diebold International Limited, which is 100 percent owned byDiebold Self-Service Solutions Limited Liability Company, which is 95 percent owned by Registrant and5 percent owned by Diebold Holding Company, Inc., which is 100 percent owned by Registrant.
(16) 21.44 percent of voting securities are owned by Diebold Latin America Holding Company, LLC, which is100 percent owned by Registrant; 16.78 percent of voting securities are owned by Diebold Panama, Inc., whichis 100 percent owned by Diebold Latin America Holding Company, Inc., which is 100 percent owned byRegistrant; 16.78 percent of voting securities are owned by DCHC SA, which is 100 percent owned by DieboldLatin America Holding Company, LLC, which is 100 percent owned by Registrant; 13.5 percent of votingsecurities are owned by J.J.F. Panama, Inc, which is 100 percent owned by Diebold Latin America HoldingCompany, LLC, which is 100 percent owned by Registrant; and the remaining 31.5 percent of voting securitiesare owned by C.R. Panama, Inc., which is 100 percent owned by Diebold Latin America Holding Company, LLC,which is 100 percent owned by Registrant.
(17) 95 percent of voting securities are owned by Registrant, while 5 percent of voting securities are owned byDiebold Holding Company, Inc., which is 100 percent owned by Registrant.
(18) 50 percent of voting securities are owned by Diebold Netherlands B.V., which is 100 percent owned by DieboldSelf-Service Solutions Limited Liability Company, while the remaining 50 percent of voting securities are ownedby Diebold Self-Service Solutions Limited Liability Company, which is 95 percent owned by Registrant and5 percent owned by Diebold Holding Company, Inc., which is 100 percent owned by Registrant.
(19) 10 percent of voting securities are owned by Diebold Selbstbedienungssysteme GmbH, which is 100 percentowned by Diebold Self Service Solutions Limited Liability Company, while the remaining 90 percent of votingsecurities are owned by Diebold Self -Service Solutions Limited Liability Company, which is 95 percent ownedby Registrant and 5 percent owned by Diebold Holding Company, Inc., which is 100 percent owned byRegistrant.

(20) 100 percent of voting securities are owned by Diebold Africa Investment Holdings Pty. Ltd., which is 100 percentowned by Diebold Switzerland Holding Company, LLC (refer to 17 for ownership).
(21) 99.99 percent of voting securities are owned by Diebold Colombia SA (refer to 16 for ownership), while theremaining 0.01 percent of voting securities are owned by Diebold Latin America Holding Company, Inc., which is100 percent owned by Registrant.
(22) .01 percent of voting securities are owned by Registrant, while 99.99 percent of voting securities are owned byImpexa LLC, which is 100 percent owned by Diebold Mexico Holding Company, Inc., which is 100 percentowned by Registrant.
(23) 1 percent of voting securities are owned by Registrant, while 99 percent of voting securities are owned byDiebold Latin America Holding Company, LLC, which is 100 percent owned by Registrant.
(24) 100 percent of voting securities are owned by VDM Holding Company, Inc., which is 100 percent owned byRegistrant.
(25) 100 percent of voting securities are owned by Diebold Enterprise Security Systems, Inc., which is 100 percentowned by Registrant.
(26) 100 percent of voting securities are owned by Diebold Security Systems Limited, which is 100 percent ownedby Diebold Enterprise Security Systems, Inc., which is 100 percent owned by Registrant.
(27) 100 percent of voting securities are owned by Diebold Enterprise Security Systems Holdings UK Limited, whichis 100 percent owned by Diebold Security Systems Limited, which is 100 percent owned by Diebold EnterpriseSecurity Systems, Inc., which is 100 percent owned by Registrant.
(28) 100 percent of voting securities are owned by Diebold Enterprise Security Systems UK Limited (refer to 27 forownership).
(29) 100 percent of voting securities are owned by Diebold Brazil Services Holding Company ULC, which is100 percent owned by Registrant.
(30) 100 percent of voting securities are owned by Diebold Brazil Servicios e Participacoes Limitada, which is100 percent owned by Diebold Brazil Services Holding Company ULC, which is 100 percent owned byRegistrant.
(31) 85 percent of voting securities are owned by Diebold Switzerland Holding Company, LLC (refer to 17 forownership).
(32) 75 percent of voting securities are owned by Diebold Africa Investment Holdings Pty. Ltd., which is 100 percentowned by Diebold Switzerland Holding Company, LLC (refer to 17 for ownership).
(33) 100 percent of voting securities are owned by Diebold Switzerland Holding Company, LLC (refer to 17 forownership).
(34) 95.45 percent of voting securities are owned by Registrant, while 4.55 percent of voting securities are owned byDiebold Holding Company Inc., which is 100 percent owned by Registrant.
(35) 100 percent of voting securities are owned by Diebold (Thailand) Company Limited, which is 100 percent ownedby Registrant.
(36) 51 percent of voting securities are owned by Diebold Latin America Holding Company, Inc., which is 100 percentowned by Registrant.
(37) 60 percent of voting securities are owned by Diebold Columbia, S.A. (refer to 16 for ownership) and 40 percentowned by Diebold Peru, S.r.L. (refer to 13 for ownership).
(38) 99 percent of voting securities are owned by D&G Centroamerica, S. de R. L. (refer to 36 for ownership).
(39) 99.85 percent of voting securities are owned by D&G Centroamerica, S. de R. L. (refer to 36 for ownership).
(40) 99.99 percent of voting securities are owned by D&G Centroamerica, S. de R. L. (refer to 36 for ownership).
(41) 100 percent of voting securities are owned by Diebold Canada Holding Company Inc., which is 100 percentowned by Registrant.

Exhibit 23.1
Consent of Independent Registered Public Accounting Firm
The Board of Directors
Diebold, Incorporated:
We consent to the incorporation by reference in the registration statements (Nos. 33-32960, 33-39988, 33-55452, 33-54677,
33-54675, 333-32187, 333-60578, 333-162036, 333-162037, and 333-162049) on Form S-8 of Diebold, Incorporated and
subsidiaries, of our reports dated March 1, 2010, with respect to the consolidated balance sheets of Diebold, Incorporated
and subsidiaries as of December 31, 2009 and 2008, and the related consolidated statements of income, equity, and cash flows
for each of the years in the three-year period ended December 31, 2009, and the related financial statement schedule, and the
effectiveness of internal control over financial reporting as of December 31, 2009, which reports appear in the December 31, 2009
annual report on Form 10-K of Diebold, Incorporated and subsidiaries.
Our report on the consolidated financial statements refers to the adoption of the provisions of Emerging Issues Task Force
(EITF) Issue No. 06-10, Accounting for Collateral Assignment Split-Dollar Life Insurance, and EITF Issue No. 06-4, Accounting for
Deferred Compensation and Post Retirement Benefit Aspects of Endorsement Split-Dollar Life Insurance Arrangements (included
in Financial Accounting Standards Board (FASB) Accounting Standards Codification (ASC) Topic 715, Compensation-Retirement
Benefits), Statement of Financial Accounting Standards No. 158, Employers’ Accounting for Defined Benefit Pension and Other
Postretirement Plans (included in FASB ASC Topic 715, Compensation-Retirement Benefits), effective January 1, 2008, and
Statement of Financial Accounting Standards No. 157, Fair Value Measurements (included in FASB ASC Topic 820, Fair Value
Measurements and Disclosures), effective January 1, 2008.
Our report dated March 1, 2010, on the effectiveness of internal control over financial reporting as of December 31, 2009,
expresses our opinion that Diebold, Incorporated did not maintain effective internal control over financial reporting as of
December 31, 2009, because of the effects of material weaknesses on the achievement of the objectives of the control criteria
and contains an explanatory paragraph that states material weaknesses related to Diebold, Incorporated’s selection, application
and communication of accounting policies and controls over income taxes have been identified and included in Management’s
Report on Internal Control over Financial Reporting appearing under Item 9A(b) of Diebold, Incorporated and subsidiaries’
December 31, 2009 annual report on Form 10-K.
/s/ KPMG LLP
Cleveland, Ohio
March 1, 2010

EXHIBIT 31.1
DIEBOLD, INCORPORATED AND SUBSIDIARIES
CERTIFICATION OF THE CHIEF EXECUTIVE OFFICER
PURSUANT TO SECTION 302 OF THE SARBANES-OXLEY ACT OF 2002
I, Thomas W. Swidarski, certify that:
1) I have reviewed this annual report on Form 10-K of Diebold, Incorporated;
2) Based on my knowledge, this report does not contain any untrue statement of a material fact or omit to state a materialfact necessary to make the statements made, in light of the circumstances under which such statements were made, notmisleading with respect to the period covered by this report;
3) Based on my knowledge, the financial statements, and other financial information included in this report, fairly present inall material respects the financial condition, results of operations and cash flows of the registrant as of, and for, the periodspresented in this report;
4) The registrant’s other certifying officer and I are responsible for establishing and maintaining disclosure controls andprocedures (as defined in Exchange Act Rules 13a-15(e) and 15d-15(e)) and internal control over financial reporting (asdefined in Exchange Act Rules 13a-15(f) and 15d-15(f)) for the registrant and have:
a) designed such disclosure controls and procedures, or caused such disclosure controls and procedures to be designedunder our supervision, to ensure that material information relating to the registrant, including its consolidatedsubsidiaries, is made known to us by others within those entities, particularly during the period in which this reportis being prepared;
b) designed such internal control over financial reporting, or caused such internal control over financial reporting to bedesigned under our supervision, to provide reasonable assurance regarding the reliability of financial reporting and thepreparation of financial statements for external purposes in accordance with generally accepted accounting principles;
c) evaluated the effectiveness of the registrant’s disclosure controls and procedures and presented in this report ourconclusions about the effectiveness of the disclosure controls and procedures, as of the end of the period covered bythis report based on such evaluation; and
d) disclosed in this report any change in the registrant’s internal control over financial reporting that occurred during theregistrant’s most recent fiscal quarter (the registrant’s fourth fiscal quarter in the case of an annual report) that hasmaterially affected, or is reasonably likely to materially affect, the registrant’s internal control over financialreporting; and
5) The registrant’s other certifying officer and I have disclosed, based on our most recent evaluation of internal control overfinancial reporting, to the registrant’s auditors and the audit committee of registrant’s board of directors (or personsperforming the equivalent functions):
a) all significant deficiencies and material weaknesses in the design or operation of internal control over financialreporting which are reasonably likely to adversely affect the registrant’s ability to record, process, summarize andreport financial information; and
b) any fraud, whether or not material, that involves management or other employees who have a significant role in theregistrant’s internal control over financial reporting.
Date: March 1, 2010
By: /s/ THOMAS W. SWIDARSKI
Thomas W. SwidarskiPresident and Chief Executive Officer(Principal Executive Officer)

EXHIBIT 31.2
DIEBOLD, INCORPORATED AND SUBSIDIARIES
CERTIFICATION OF THE CHIEF FINANCIAL OFFICER
PURSUANT TO SECTION 302 OF THE SARBANES-OXLEY ACT OF 2002
I, Bradley C. Richardson, certify that:
1) I have reviewed this annual report on Form 10-K of Diebold, Incorporated;
2) Based on my knowledge, this report does not contain any untrue statement of a material fact or omit to state a materialfact necessary to make the statements made, in light of the circumstances under which such statements were made, notmisleading with respect to the period covered by this report;
3) Based on my knowledge, the financial statements, and other financial information included in this report, fairly present inall material respects the financial condition, results of operations and cash flows of the registrant as of, and for, the periodspresented in this report;
4) The registrant’s other certifying officer and I are responsible for establishing and maintaining disclosure controls andprocedures (as defined in Exchange Act Rules 13a-15(e) and 15d-15(e)) and internal control over financial reporting (asdefined in Exchange Act Rules 13a-15(f) and 15d-15(f)) for the registrant and have:
a) designed such disclosure controls and procedures, or caused such disclosure controls and procedures to be designedunder our supervision, to ensure that material information relating to the registrant, including its consolidatedsubsidiaries, is made known to us by others within those entities, particularly during the period in which this reportis being prepared;
b) designed such internal control over financial reporting, or caused such internal control over financial reporting to bedesigned under our supervision, to provide reasonable assurance regarding the reliability of financial reporting and thepreparation of financial statements for external purposes in accordance with generally accepted accounting principles;
c) evaluated the effectiveness of the registrant’s disclosure controls and procedures and presented in this report ourconclusions about the effectiveness of the disclosure controls and procedures, as of the end of the period covered bythis report based on such evaluation; and
d) disclosed in this report any change in the registrant’s internal control over financial reporting that occurred during theregistrant’s most recent fiscal quarter (the registrant’s fourth fiscal quarter in the case of an annual report) that hasmaterially affected, or is reasonably likely to materially affect, the registrant’s internal control over financialreporting; and
5) The registrant’s other certifying officer and I have disclosed, based on our most recent evaluation of internal control overfinancial reporting, to the registrant’s auditors and the audit committee of registrant’s board of directors (or personsperforming the equivalent functions):
a) all significant deficiencies and material weaknesses in the design or operation of internal control over financialreporting which are reasonably likely to adversely affect the registrant’s ability to record, process, summarize andreport financial information; and
b) any fraud, whether or not material, that involves management or other employees who have a significant role in theregistrant’s internal control over financial reporting.
Date: March 1, 2010
By: /s/ BRADLEY C. RICHARDSON
Bradley C. RichardsonExecutive Vice President and Chief Financial Officer(Principal Financial Officer)

EXHIBIT 32.1
DIEBOLD, INCORPORATED AND SUBSIDIARIES
CERTIFICATION OF THE CHIEF EXECUTIVE OFFICER PURSUANT TO SECTION 906 OF THE
SARBANES-OXLEY ACT OF 2002, 18 U.S.C. SECTION 1350
In connection with the Annual Report on Form 10-K of Diebold, Incorporated and subsidiaries (the Company) for the year ended
December 31, 2009 as filed with the Securities and Exchange Commission on the date hereof (the Report), I, Thomas W.
Swidarski, President and Chief Executive Officer of the Company, certify, pursuant to Section 906 of the Sarbanes-Oxley Act of
2002, 18 U.S.C. Section 1350, that, to my knowledge:
1) The Report fully complies with the requirements of Section 13(a) or 15(d) of the Securities Exchange Act of 1934; and
2) The information contained in the Report fairly presents, in all material respects, the financial condition and results of
operations of the Company as of the dates and for the periods expressed in the Report.
/s/ THOMAS W. SWIDARSKI
Thomas W. Swidarski
President and Chief Executive Officer
(Principal Executive Officer)
March 1, 2010
EXHIBIT 32.2
DIEBOLD, INCORPORATED AND SUBSIDIARIES
CERTIFICATION OF THE CHIEF FINANCIAL OFFICER PURSUANT TO SECTION 906 OF THE
SARBANES-OXLEY ACT OF 2002, 18 U.S.C. SECTION 1350
In connection with the Annual Report on Form 10-K of Diebold, Incorporated and subsidiaries (the Company) for the year ended
December 31, 2009 as filed with the Securities and Exchange Commission on the date hereof (the Report), I, Bradley C.
Richardson, Executive Vice President and Chief Financial Officer of the Company, certify, pursuant to Section 906 of the Sarbanes-
Oxley Act of 2002, 18 U.S.C. Section 1350, that, to my knowledge:
1) The Report fully complies with the requirements of Section 13(a) or 15(d) of the Securities Exchange Act of 1934; and
2) The information contained in the Report fairly presents, in all material respects, the financial condition and results of
operations of the Company as of the dates and for the periods expressed in the Report.
/s/ BRADLEY C. RICHARDSON
Bradley C. Richardson
Executive Vice President and Chief Financial Officer
(Principal Financial Officer)
March 1, 2010


OTHER INFORMATION
The Company has included as Exhibit 31 to its Annual Report on Form 10-K for fiscal year 2009 filed with the
Securities and Exchange Commission certificates of the Chief Executive Officer and Chief Financial Officer of
the Company certifying the quality of the Company’s public disclosure, and the Company has submitted to
the New York Stock Exchange a certificate of the Chief Executive Officer of the Company certifying that he is
not aware of any violation by the Company of New York Stock Exchange corporate governance standards.

DIREcTORs
Mei-Wei Cheng 2
Retired Group Vice President and Executive Chairman, Ford Motor (China) Shanghai, China (Automotive Industry) Director since 2009
Phillip R. Cox 1,4
President and Chief Executive Officer, Cox Financial Corporation Cincinnati, Ohio (Financial Planning and Wealth Management Services) Director since 2005
Richard L. Crandall 2,4
Non-executive Chairman of the Board, Novell, Inc. Waltham, Massachusetts (Information Technology Management Software) Director since 1996
Gale S. Fitzgerald 1,3
Retired President and Director, TranSpend, Inc. Bernardsville, New Jersey (Total Spend Optimization) Director since 1999
Phillip B. Lassiter 2,3
Retired Chairman of the Board and Chief Executive Officer, Ambac Financial Group, Inc. New York, New York (Financial Guarantee Insurance Holding Company) Director since 1995
John N. Lauer 1,3
Non-executive Chairman of the Board, Diebold, Incorporated Canton, Ohio Retired Chairman of the Board, Oglebay Norton Co. Cleveland, Ohio (Industrial Minerals) Director since 1992
Eric J. Roorda 1,3
Former Chairman, Procomp Amazônia Indústria Eletronica, S.A. São Paulo, Brazil (Banking and Electoral Automation; subsidiary of Diebold) Director since 2001
Thomas W. SwidarskiPresident and Chief Executive Officer, Diebold, Incorporated Canton, Ohio Director since 2005
Henry D.G. Wallace 2,4
Former Group Vice President and Chief Financial Officer, Ford Motor Company Detroit, Michigan (Automotive Industry) Director since 2003
Alan J. Weber 2,4
Chief Executive Officer, Weber Group LLC Greenwich, Connecticut (Investment Consulting)Director since 2005
1 Member of the Compensation Committee2 Member of the Audit Committee3 Member of the Board Governance Committee4 Member of the Investment Committee
OFFIcERs
Thomas W. SwidarskiPresident and Chief Executive Officer
Bradley C. RichardsonExecutive Vice President and Chief Financial Officer
James L. M. ChenExecutive Vice President, International Operations
Charles E. Ducey, Jr.Executive Vice President, North America Operations
George S. Mayes, Jr.Executive Vice President, Global Operations
David BucciSenior Vice President, Customer Solutions Group
Warren W. DettingerVice President, General Counsel and Assistant Secretary
Chad F. HesseSenior Corporate Counsel and Secretary
M. Scott HunterVice President, Chief Tax Officer
John D. KristoffVice President, Chief Communications Officer
Miguel A. MateoVice President, Latin America Division
Timothy J. McDannoldVice President and Treasurer
Leslie A. PierceVice President and Corporate Controller
Sheila M. RuttVice President, Chief Human Resources Officer
Bradley J. StephensonVice President, Security Division
Robert J. WarrenVice President, Corporate Development and Finance
Directors and Officers

Corporate offiCes
Diebold, Incorporated5995 Mayfair RoadP.O. Box 3077North Canton, Ohio, USA 44720-8077+1 330-490-4000www.diebold.com
stoCk exChange
The company’s common shares are listed under the symbol DBD on the New York Stock Exchange.
transfer agent and registrar
BNY Mellon Shareowner Services866-242-7752 or +1 201-680-6685E-mail: [email protected] site: www.bnymellon.com/shareowner/isd
General Correspondence:P.O. Box 358015Pittsburgh, PA, USA 15252-8015
Or Overnight Delivery:500 Ross Street, 6th FloorPittsburgh, PA, USA 15262
Dividend Reinvestment/Optional Cash:Dividend Reinvestment DepartmentP.O. Box 358035Pittsburgh, PA, USA 15252-8035
publiCations
Our annual report on Form 10-K, quarterly reports on Form 10-Q, current reports on Form 8-K and all amendments to those reports are available, free of charge, on or through the Web site, www.diebold.com, as soon as reasonably practicable after such material is electronically filed with or furnished to the Securities and Exchange Commission. Additionally, these reports can be furnished free of charge to shareholders upon written request to Diebold Corporate Communications and Investor Relations at the corporate address, or call +1 330-490-3790 or 800-766-5859.
information sourCes
Communications concerning share transfer, lost certificates or dividends should be directed to the transfer agent. Investors, financial analysts and media may contact the following at the corporate address:
Christopher J. Bast, CPA, CTPDirector, Investor Relations+1 330-490-6908E-mail: [email protected]
Michael JacobsenSr. Director, Corporate Communications+1 330-490-3796E-mail: [email protected]
direCt purChase, sale anddividend reinvestment plan
BuyDIRECTSM, a direct stock purchase and sale plan administered by BNY Mellon Shareowner Services, offers current and prospective shareholders a convenient alter-native for buying and selling Diebold shares. Once enrolled in the plan, shareholders may elect to make optional cash investments.
For first-time share purchase by nonregistered holders, the minimum initial investment amount is $500. The minimum amount for subsequent investments is $50. The maximum investment is $10,000 per month.
Shareholders may also choose to reinvest the dividends paid on shares of Diebold Common Stock through the plan.
Some fees may apply. For more information, contact BNY Mellon Shareowner Services (see addresses in opposite column) or visit Diebold’s Web site at www.diebold.com.
annual meeting
The next meeting of shareholders will take place at 10:00 a.m. ET on April 29, 2010, at the Sheraton Suites, 1989 Front Street, Cuyahoga Falls, Ohio 44221. A proxy statement and form of proxy is available for shareholders to review on or about March 15. The company’s independent auditors will be in attendance to respond to appropriate questions.
priCe ranges of Common shares
2009 2008 2007 HIGH LOW HIGH LOW HIGH LOW
First Quarter $29.75 $19.04 $39.30 $23.07 $48.42 $42.50Second Quarter 27.55 20.77 40.44 35.44 52.70 47.25Third Quarter 33.17 24.76 39.81 30.60 54.50 42.49Fourth Quarter 33.06 25.04 34.47 22.50 45.90 28.32Full Year 33.17 19.04 40.44 22.50 54.50 28.32
Shareholder Information

dieboLd, incorporated ❚ 5995 mayFair road ❚ p.o. box 3077 ❚ north canton, ohio 44720-8077 ❚ USa
www.diebold.com/150