building quÉbec’s first diamond...
TRANSCRIPT
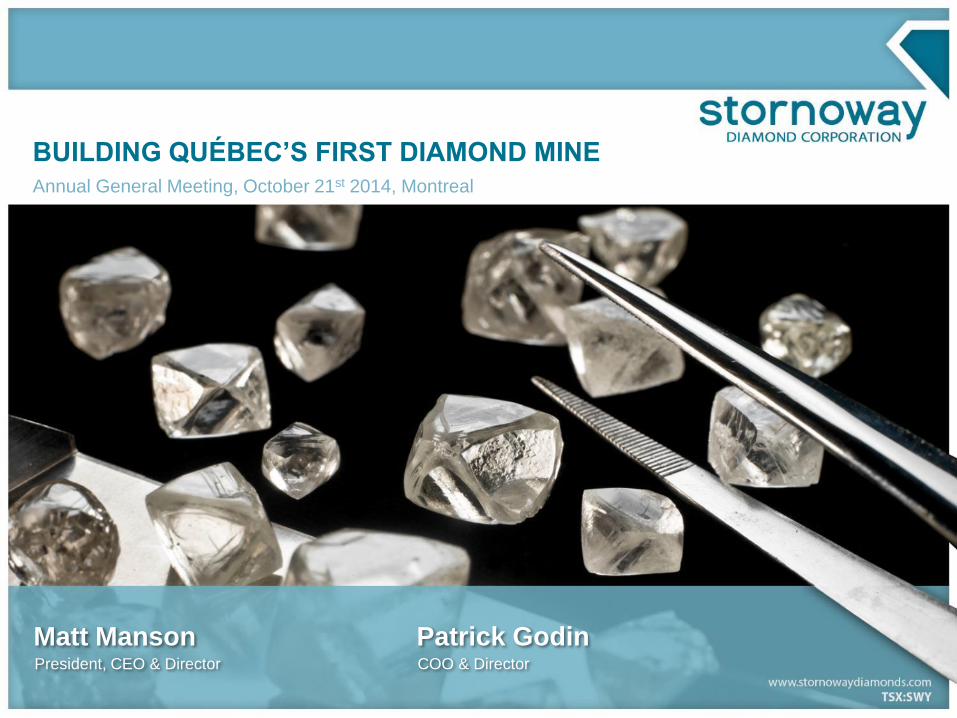
BUILDING QUÉBEC’S FIRST DIAMOND MINEAnnual General Meeting, October 21st 2014, Montreal
Matt Manson Patrick GodinPresident, CEO & Director COO & Director
2
Forward-Looking Information
This presentation contains "forward-looking information" within the meaning of Canadian securities legislation and “forward-looking statements” within the meaning
of the United States Private Securities Litigation Reform Act of 1995. This information and these statements, referred to herein as “forward-looking statements”,
are made as of the date of this presentation and the Company does not intend, and does not assume any obligation, to update these forward-looking statements,
except as required by law.
Forward-looking statements relate to future events or future performance and reflect current expectations or beliefs regarding future events and include, but are not
limited to, statements with respect to: (i) the amount of mineral resources and exploration targets; (ii) the amount of future production over any period; (iii) net
present value and internal rates of return of the mining operation; (iv) assumptions relating to recovered grade, average ore recovery, internal dilution, mining
dilution and other mining parameters set out in the Feasibility Study or Optimization Study; (v) assumptions relating to gross revenues, operating cash flow and
other revenue metrics set out in the Feasibility Study or Optimization Study; (vi) mine expansion potential and expected mine life; (vii) expected time frames for
completion of permitting and regulatory approvals and making a production decision; (viii) future exploration plans; (ix) future market prices for rough diamonds;
and (x) sources of and anticipated financing requirements. Any statements that express or involve discussions with respect to predictions, expectations, beliefs,
plans, projections, objectives, assumptions or future events or performance (often, but not always, using words or phrases such as “expects”, “anticipates”, “plans”,
“projects”, “estimates”, “assumes”, “intends”, “strategy”, “goals”, “objectives” or variations thereof or stating that certain actions, events or results “may”, “could”,
“would”, “might” or “will” be taken, occur or be achieved, or the negative of any of these terms and similar expressions) are not statements of historical fact and
may be forward-looking statements.
Forward-looking statements are made based upon certain assumptions and other important factors that, if untrue, could cause the actual results, performances or
achievements of Stornoway to be materially different from future results, performances or achievements expressed or implied by such statements. Such
statements and information are based on numerous assumptions regarding present and future business strategies and the environment in which Stornoway will
operate in the future, including the price of diamonds, anticipated costs and Stornoway’s ability to achieve its goals. Certain important factors that could cause
actual results, performances or achievements to differ materially from those in the forward-looking statements include, but are not limited to: (i) required capital
investment and estimated workforce requirements; (ii) estimates of net present value and internal rates of return; (iii) receipt of regulatory approvals on acceptable
terms within commonly experienced time frames; (iv) anticipated timelines for the commencement of mine production; (v) market prices for rough diamonds and
the potential impact on the Renard Project’s value; and (vi) future exploration plans and objectives. Additional risks are described in Stornoway's most recently
filed Annual Information Form, annual and interim MD&As, and other disclosure documents available under the Company’s profile at: www.sedar.com.
When relying on our forward-looking statements to make decisions with respect to Stornoway, investors and others should carefully consider the foregoing factors
and other uncertainties and potential events. Stornoway does not undertake to update any forward-looking statement, whether written or oral, that may be made
from time to time by Stornoway or on our behalf, except as required by law.
Readers are referred to the technical report dated as of February 28th, 2013 entitled “The Renard Diamond Project, Québec, Canada, Feasibility Study Update, NI
43-101 Technical Report, February 28, 2013” in respect of the January 2013 Optimization Study, and the press release dated July 23, 2013 in respect of the July
2013 Mineral Resource estimate for further details and assumptions relating to the project. The Qualified Persons that prepared the technical reports and press
releases that form the basis for the presentation are listed in the Company’s AIF dated July 29, 2014. Disclosure of a scientific or technical nature in this
presentation has been reviewed and approved by Robin Hopkins, P.Geol. (NT/NU), Vice President, Exploration, a “qualified person” under NI 43-101.

3
Hume Kyle
Independent
Zara Boldt
CFO and VP
Finance
Pat Godin
COO & Director
Matt Manson
President, CEO
& Director
John LeBoutillier
Independent/
IQ Designate
Monique Mercier
Independent/
IQ DesignatePeter Nixon
Independent
Ebe Scherkus
Independent/
Board Chairman
Executive Officers
Non-Executive Directors
Key Managers
Head Office: Longueuil, Québec
Exploration Office: North Vancouver, BC
Community Offices: Mistissini & Chibougamau Québec
Stornoway’s Board and Management Team
Serge Vézina
Independent
Yves PerronVP Engineering
& Construction
Ghislain
PoirierVP Public Affairs
Brian Glover VP Asset
Protection
Martin BoucherVP Sustainable
Development
Robin
Hopkins VP Exploration
Orin
BaranowskyDirector, IR
Guy BourqueChief Mining
Engineer
Douglas Silver
Orion Designate
Ian HollVP Processing
Helene
RobitailleDirector, HR
Mario
CourchesneConstruct. Manager
Jean-Charles
DumontCorporate Controller
Freddie
MianscumIBA Implem. Officer
Gaston Morin
Independent/
IQ Designate

4
From the 2013 AGM…
43
Québec’s First Diamond Mine is Ready to Build
Project Green-lighted: Authorizations Issued
Community Agreements in Place
Stornoway Operating Team in Place
Access Road Opened
Resource Growing
Project Design Fully Optimized
Favourable Cost Environment
Stornoway is Fully Focused on the
Timely Completion of Final Project
Financing

5
Project Financing Announced April 9th, 2014, Closed July 8th 2014
The C$946m Project Financing Transaction for the Renard
Diamond Project was the Single Largest Project Financing
Transaction for a Publicly Listed Diamond Company
Highlights of the Transaction:
One-shot financing of all project costs, contingencies,
working capital requirements and financing costs.
Fully funds the project through to production.
Careful balance of stream, debt and equity to
maximize shareholder value growth from project
development.
Sponsors:
• Orion Mine Finance
• Investissement Québec/Ressources Québec
• Caisse de dépôt et placement du Québec

6
Renard Project Financing Structure
TypeAmount
(% of Total)Description
Common Equity C$374M (40%)• C$132M marketed public equity offering of subscription receipts
• C$242M private placement to Orion (US$110M), RQ (C$100M) and Caisse (C$22M)
Diamond Stream US$250M (29%) • 20% diamond stream (Orion 16%, Caisse 4%) with ~US$56/ct(1) ongoing payment
Convertible Debentures US$81M (9%)• Provided by Orion; 7 year, 6.25% coupon, 35% conversion premium to equity issue
price
Senior Debt C$120M (11%) • Provided by IQ; 7 year amortizing payment, Fixed (QC Bond)+5.75% or Prime +4.75%
Equipment Financing US$35M (4%) • Provided by Caterpillar
Cost Overrun Facility C$48M (5%)• C$20M provided by IQ (same terms as senior debt)
• C$28M provided by Caisse (unsecured, 7 year term, 10% coupon)
Total C$946M (100%)
Assumes US$1.00 = C$1.10
1. Includes reimbursement of marketing expenses
Counter-PartyAmount
(% of Total)
Orion Mine Finance C$367M (39%)
Investissement Québec/
Ressources QuébecC$240M (25%)
Caisse de dépôt et
placement du QuébecC$105M (11%)
Caterpillar Financial C$39M (4%)
Public C$195M (21%)
Total C$946M (100%)
C$77M
C$811M
C$946M
C$70M
C$67M
Financing Funding Requirements
New
Financing
Existing
Financing
C$48M COF &
C$27M Working
Capital
Financing
Costs &
Interest During
Construction
Renard Mine
Road
Initial Capex &
Escalation
Allowance

7
0%
10%
20%
30%
40%
50%
60%
70%
80%
90%
100%
2006 2007 2008 2009 2010 2011 2012 2013 2014YTD
Metals/Mining Oil/Gas Industrial/Consumer
Financials Real Estate/REIT Biotech/Health
Tech/Telecom Other
$12.9
$7.9
$19.9
$12.1
$8.2$6.9
$5.5 $4.3
255
110188
303261
148 129 113
2007 2008 2009 2010 2011 2012 2013 2014 YTD
Total Mining Issuance (C$Bn) Total Mining Issuance (#)
Recent Equity Issue Activity in the Mining Sector
Equity Issuance by Sector (excl. Prefs) Mining Issuance: 2014 YTD
CommentaryTotal Mining Issuance
• In 2013, C$5.5 billion was raised in the mining sector
through a total of 129 transactions
• The vast majority was within the gold sector, followed
by the base metals and silver sectors
• The focus of 2014-YTD has been gold, representing
55.6% of mining dollars raised and 49.3% of mining
volume issued
• Diamonds financings in 2014-YTD have been a larger
proportion of new equity issuances over 2013
Source: Dundee Equity Capital Markets and FP Infomart.
Sub-Sector # Deals C$MM
Gold 53 $2,085.8
Copper 5 $862.8
Uranium 12 $164.7
Silver 5 $127.3
Rare Earth 4 $37.8
Zinc 1 $15.8
Coal 0 $0.0
Molybdenum 0 $0.0
Nickel 1 $5.8
Total 113 $4,334
2014 YTDMining Sector Breakdown
Diamonds 8 $396.5
Diversified 20 $599.3
Lithium 3 $35.0
Iron Ore 1 $3.0
Sub-Sector # Deals C$MM
Gold 58 $4,454.2
Diversified 18 $425.1
Uranium 20 $186.6
Copper 5 $104.6
Lithium 6 $79.6
Silver 4 $54.3
Rare Earth 5 $33.7
Coal 1 $7.7
Molybdenum 0 $0.0
Nickel 0 $0.0
Total 129 $5,497
2013Mining Sector Breakdown
Zinc 4 $65.9
Iron Ore 2 $31.1
Diamonds 6 $54.8
8
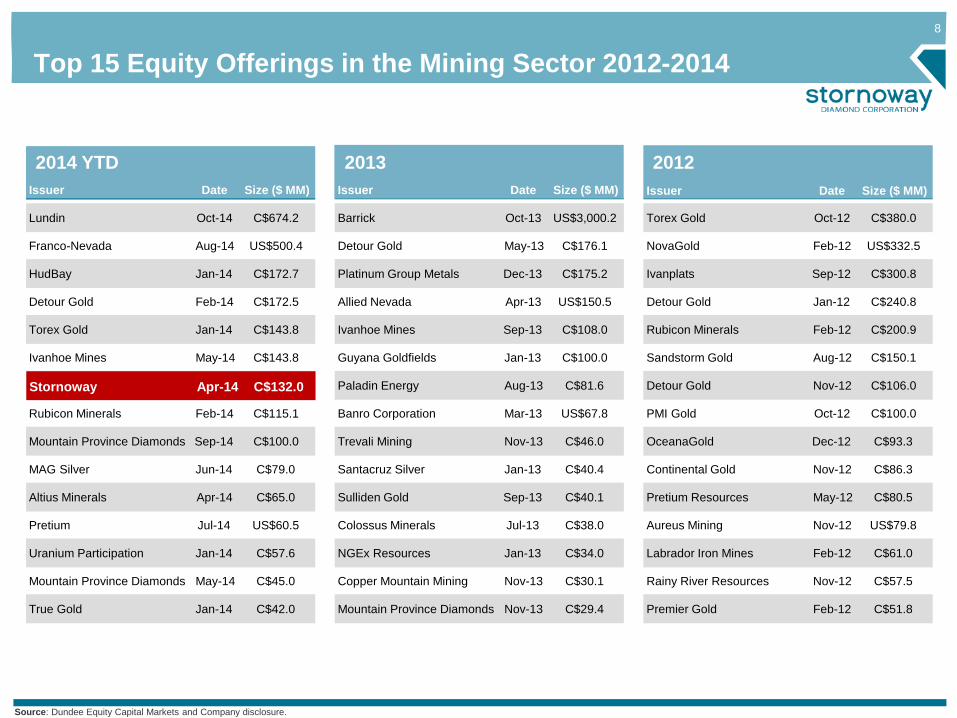
Stornoway Apr-14 C$132.0Stornoway Apr-14 C$132.0
Top 15 Equity Offerings in the Mining Sector 2012-2014
2014 YTD 2013 2012
Source: Dundee Equity Capital Markets and Company disclosure.
Issuer Date Size ($ MM)
Lundin Oct-14 C$674.2
Franco-Nevada Aug-14 US$500.4
HudBay Jan-14 C$172.7
Detour Gold Feb-14 C$172.5
Torex Gold Jan-14 C$143.8
Ivanhoe Mines May-14 C$143.8
Rubicon Minerals Feb-14 C$115.1
Mountain Province Diamonds Sep-14 C$100.0
MAG Silver Jun-14 C$79.0
Altius Minerals Apr-14 C$65.0
Pretium Jul-14 US$60.5
Uranium Participation Jan-14 C$57.6
Mountain Province Diamonds May-14 C$45.0
True Gold Jan-14 C$42.0
Issuer Date Size ($ MM)
Barrick Oct-13 US$3,000.2
Detour Gold May-13 C$176.1
Platinum Group Metals Dec-13 C$175.2
Allied Nevada Apr-13 US$150.5
Ivanhoe Mines Sep-13 C$108.0
Guyana Goldfields Jan-13 C$100.0
Paladin Energy Aug-13 C$81.6
Banro Corporation Mar-13 US$67.8
Trevali Mining Nov-13 C$46.0
Santacruz Silver Jan-13 C$40.4
Sulliden Gold Sep-13 C$40.1
Colossus Minerals Jul-13 C$38.0
NGEx Resources Jan-13 C$34.0
Copper Mountain Mining Nov-13 C$30.1
Mountain Province Diamonds Nov-13 C$29.4
Issuer Date Size ($ MM)
Torex Gold Oct-12 C$380.0
NovaGold Feb-12 US$332.5
Ivanplats Sep-12 C$300.8
Detour Gold Jan-12 C$240.8
Rubicon Minerals Feb-12 C$200.9
Sandstorm Gold Aug-12 C$150.1
Detour Gold Nov-12 C$106.0
PMI Gold Oct-12 C$100.0
OceanaGold Dec-12 C$93.3
Continental Gold Nov-12 C$86.3
Pretium Resources May-12 C$80.5
Aureus Mining Nov-12 US$79.8
Labrador Iron Mines Feb-12 C$61.0
Rainy River Resources Nov-12 C$57.5
Premier Gold Feb-12 C$51.8
9
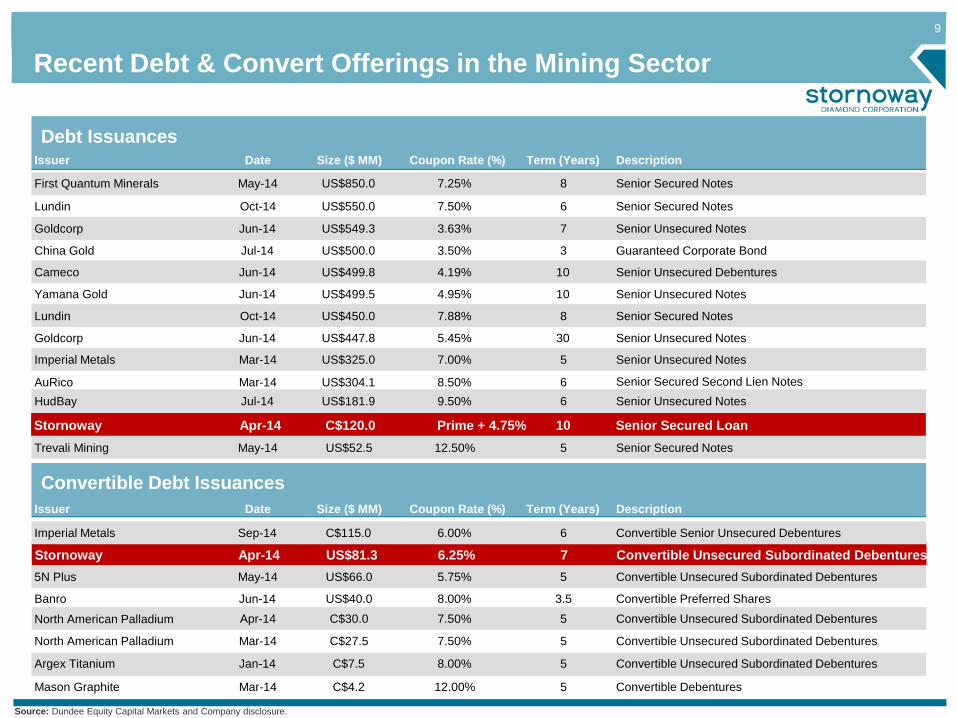
Stornoway Apr-14 C$120.0 Prime + 4.75% 10 Senior Secured Loan
Stornoway Apr-14 US$81.3 6.25% 7 Convertible Unsecured Subordinated DebenturesStornoway Apr-14 US$81.3 6.25% 7 Convertible Unsecured Subordinated Debentures
Stornoway Apr-14 C$120.0 Prime + 4.75% 10 Senior Secured Loan
Recent Debt & Convert Offerings in the Mining Sector
Debt Issuances
Convertible Debt Issuances
Source: Dundee Equity Capital Markets and Company disclosure.
Issuer Date Size ($ MM) Coupon Rate (%) Term (Years) Description
Lundin Oct-14 US$550.0 7.50% 6 Senior Secured Notes
Lundin Oct-14 US$450.0 7.88% 8 Senior Secured Notes
Yamana Gold Jun-14 US$499.5 4.95% 10 Senior Unsecured Notes
Cameco Jun-14 US$499.8 4.19% 10 Senior Unsecured Debentures
Goldcorp Jun-14 US$447.8 5.45% 30 Senior Unsecured Notes
Trevali Mining May-14 US$52.5 12.50% 5 Senior Secured Notes
AuRico Mar-14 US$304.1 8.50% 6 Senior Secured Second Lien Notes
Issuer Date Size ($ MM) Coupon Rate (%) Term (Years) Description
Imperial Metals Sep-14 C$115.0 6.00% 6 Convertible Senior Unsecured Debentures
5N Plus May-14 US$66.0 5.75% 5 Convertible Unsecured Subordinated Debentures
Banro Jun-14 US$40.0 8.00% 3.5 Convertible Preferred Shares
First Quantum Minerals May-14 US$850.0 7.25% 8 Senior Secured Notes
China Gold Jul-14 US$500.0 3.50% 3 Guaranteed Corporate Bond
Goldcorp Jun-14 US$549.3 3.63% 7 Senior Unsecured Notes
Imperial Metals Mar-14 US$325.0 7.00% 5 Senior Unsecured Notes
HudBay Jul-14 US$181.9 9.50% 6 Senior Unsecured Notes
Argex Titanium Jan-14 C$7.5 8.00% 5 Convertible Unsecured Subordinated Debentures
Mason Graphite Mar-14 C$4.2 12.00% 5 Convertible Debentures
North American Palladium Mar-14 C$27.5 7.50% 5 Convertible Unsecured Subordinated Debentures
North American Palladium Apr-14 C$30.0 7.50% 5 Convertible Unsecured Subordinated Debentures

10
Orion Mine Finance & Caisse de dépôt -
Stornoway
Apr-14 US$250 Stream agreement for 20% interest on run of mine diamond production from certain kimberlite bodies from
The Renard Project. Investors to pay the Issuer in 3 deposits.
Orion Mine Finance & Caisse de dépôt -
Stornoway
Apr-14 US$250 Stream agreement for 20% interest on run of mine diamond production from certain kimberlite bodies from
The Renard Project. Investors to pay the Issuer in 3 deposits.
Recent Alternative Finance Agreements in the Mining Sector
Source: Dundee Equity Capital Markets and Company disclosure.
Investor - Issuer Date Size ($ MM) Description
Quintana - Arian Silver Oct-14 US$16 Quintana to receive 78.2% of Zn and Pb from San José until 32MMlbs and 38MMlbs, respectively, are delievered,
and 27.4% thereafter for 50 years. Issuer can buy 50% of stream for US$11MM before 2017. Investor also
acquires US$16MM of senior secured convertible notes to be restructured into new notes (8% interest).
Franco-Nevada - Lundin Oct-14 US$648 Franco-Nevada to receive 68% of payable Au and Ag production until 720k oz Au and 12MM oz Ag are delivered
from 100% of Candelaria; thereafter reduces to 40% of LOM payable metals from 100% of the mine. Acquisition
financing package also consists of C$50MM private placement exclusive of stream value.
JMET - Santacruz Silver Sep-14 US$28 5-year pre-paid forward silver purchase agreement. JMET to receive 4.6MM oz Ag through August 2019 with no
ounces delivered over the first 12 months. Ongoing payments of spot Ag less an undisclosed fixed discount.
Orion Mine Finance - Aldridge Aug-14 US$40 Consists of US$5MM private placement and US$35MM 2-year bridge loan facility. Bridge loan bears interest at
9% plus the greater of 3 month USD LIBOR and 1%. Aldridge also entered into offtake agreements with Orion for
~20% of Pb & ~50% of Au production over the first 10 years of the mine plan.
Gold Holding - Banro Aug-14 US$121 Streams on Banro's Twangiza and Namoya mines for US$41MM and US$80MM, respectively. Investor to receive
40k oz Au from Twangiza mine over 4 years. Investor to also receive 10% LOM Au production from Namoya
including Au processed at the site from other mines within 20 km; maximum deliverable Au of 12k oz per annum.
Franco-Nevada & Sandstorm - True Gold Aug-14 Up to US$120 Franco-Nevada (75%) & Sandstorm (25%) to receive 100k oz Au over 5 years, and 6.5% LOM Au production
from True Gold's Karma Project thereafter. True Gold holds an 18 month option to increase funding by US$20MM
for an additional 30k oz Au. Ongoing payments of 20% of spot Au.
BlackRock - Avanco Jul-14 US$12 2.0% NSR royalty on Cu; 25.0% NSR royalty on Au and 2.0% NSR royalty on all other metals produced from the
Issuer's Antas North and Pedra Branca licensed areas. Additionally, BlackRock to receive a 2% NSR Royalty on
other discoveries within Avanco's current licence portfolio.
Sprott - Veris Gold Apr-14 US$8 0.5% NSR royalty on Veris Gold's Jerritt Canyon mines and processing plant.
Orion Mine Finance - Claude Mar-14 US$12 3.0% NSR royalty on Claude's Seabee Gold Operation. The NSR provides Claude with the option to repurchase
half of the NSR for US$12MM until December 31, 2016.
Franco-Nevada - Klondex Feb-14 US$35 Franco-Nevada to receive 38k oz Au by December 31, 2018, and a 2.5% NSR royalty on Klondex's Fire Creek
and Midas properties commencing 2019. Gold financing package provided to support Klondex's acquisition of the
Midas Mine and Mill Complex from Newmont.
Royal Gold - Rubicon Feb-14 US$75 Royal Gold to receive 6.3% of Au production from Rubicon's Phoenix Project until 135k oz have been delivered
and 3.15% LOM Au production thereafter. Ongoing payments of 25% spot Au. Advance deposit payments from
Royal Gold payable in 5 installments.

11
Shareholding
Share Price (TSX-SWY):October 17, 2014
C$ $0.53
52 week High-Low C$ $0.50–$1.22
Average Daily Volume:2014 YTD
605,302
Average Daily Volume:Since July 8th 2014
1,013,138
Market Capitalization: C$ 387 million
Total Shares Outstanding: 731 million
Total Options & Warrants Outstanding:(25.3m Options $0.40-$5.36; 123.8m
warrants $0.90-$1.21)
149 million
Consolidated Cash1: (as of July 31, 2014)
C$ 438 million
Consolidated Debt1:
(as of July 31, 2014)C$ 182 million
Undrawn Financing Commitments2: (Subject to Financing Agreement CPs)
C$ 462 million
Balance Sheet
Post-Financing Balance Sheet and Capital Structure
Notes
1. Unaudited
2. Assuming a C$:US$ conversion rate of C$1.10
Investissement Québec 28.7% 22.5%
Orion Mine Finance 24.8% 22.0%
CDPQ 6.1% 6.3%
Float 40.4% 49.2%
DilutedBasic
0
1,000
2,000
3,000
4,000
5,000
6,000
7,000
8,000
$0.00
$0.20
$0.40
$0.60
$0.80
$1.00
$1.20
$1.40
Vo
lum
e (
00
0s)
Pri
ce

12
Renard’s Cash Flow Potential – Base Case Economics
Renard is Expected to Generate Substantial Cash Flow
over its first 11 years of Mining
After Tax, After Stream Operating Cash Flow of between
$150 and $250 million, or $0.20 to $0.30 per share
Assumptions
Mineral reserve case only
Capital and operating cost parameters as established in the January 2013 Optimization Study
and October 2013 LNG FS
Base case diamond pricing from March 2014; No “special” diamonds.
2.5% annual real diamond price escalation
C$:US$ conversion rate of C$1.10
Based on terms of Financing Transaction closed on July 8th 2014
Assumes full conversion to equity of US$81million of Convertible
Debentures giving 825 million shares outstanding.
13
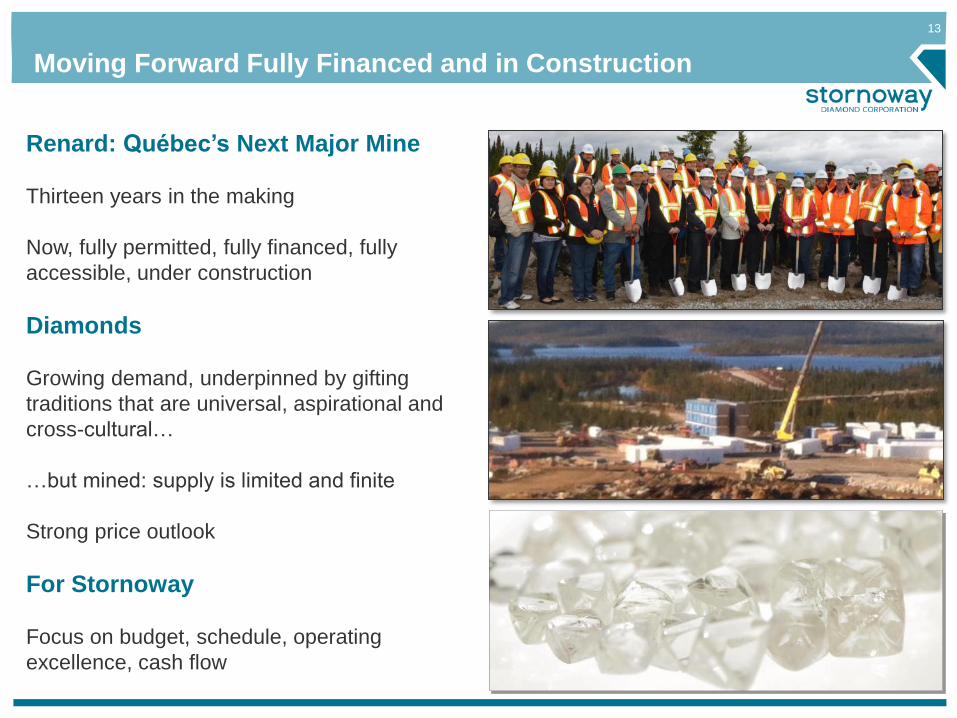
Renard: Québec’s Next Major Mine
Thirteen years in the making
Now, fully permitted, fully financed, fully
accessible, under construction
Diamonds
Growing demand, underpinned by gifting
traditions that are universal, aspirational and
cross-cultural…
…but mined: supply is limited and finite
Strong price outlook
For Stornoway
Focus on budget, schedule, operating
excellence, cash flow
Moving Forward Fully Financed and in Construction

1414
Construction Report (Patrick Godin)

15
Lynx
R10
N
R7
R1Hibou
R4
R9R2
R3
R65
R8
Kimberlite Bodies with
Measured and Indicated
Resources
Hibou
Lynx
R4
R9R2
R3
R65
Kimberlite Bodies with
Resource Potential
R1Hibou
Lynx
Legend
Stornoway Properties
Hydro-Québec Facility
Renard Kimberlites
Kimberlitic Dyke
Regional Kimberlites
Hydro-Québec
Powerlines
Route 167 Extension/
Renard Mine Road
Road
Exploration/ Mining
Projects
LEGEND:
0 1 2
Kilometers
60 0 60 120
Kilometers
Renard
LG3LG2LG4
Laforge 1
Laforge 2
Brisay
Foxtrot Property
Strateco
Eastmain MineWestern Troy
Troilus Mine
Eleonore
Temiscamie
Mistissini
ChibougamauMatagami
Wemindji
Renard Kimberlite Bodies
Kimberlite Bodies with
Inferred Resources
16
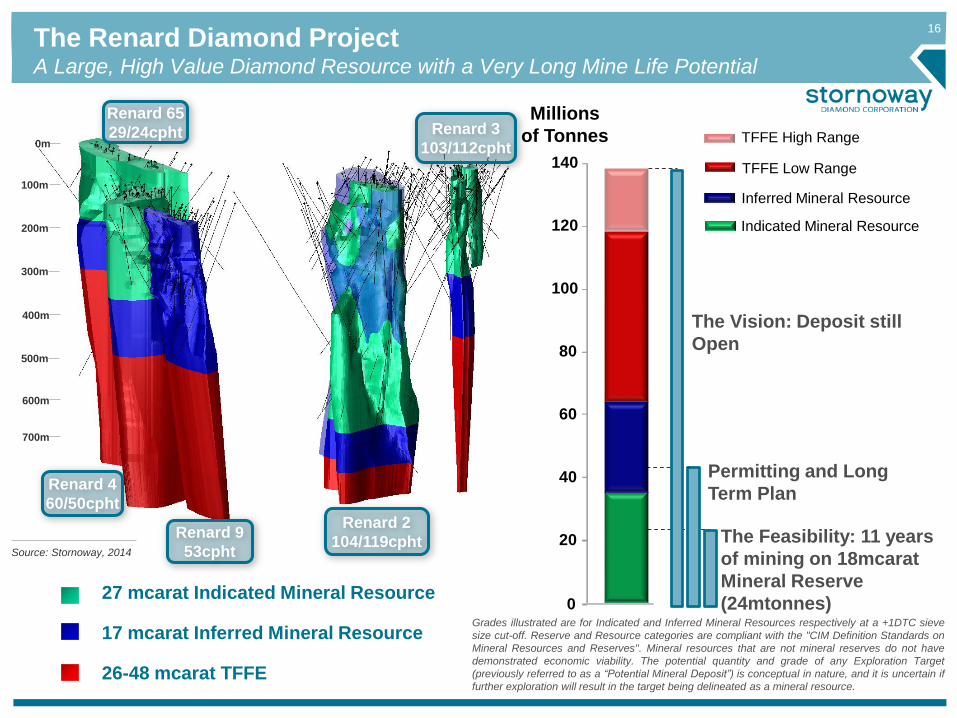
The Feasibility: 11 years
of mining on 18mcarat
Mineral Reserve
(24mtonnes)
Permitting and Long
Term Plan
The Vision: Deposit still
Open
40
60
80
100
120
140
Millions
of Tonnes
20
0
TFFE High Range
Inferred Mineral Resource
TFFE Low Range
Indicated Mineral Resource
The Renard Diamond ProjectA Large, High Value Diamond Resource with a Very Long Mine Life Potential
0m
100m
200m
400m
600m
700m
500m
300m
Renard 65
29/24cpht Renard 3
103/112cpht
Renard 2
104/119cphtRenard 9
53cpht
Renard 4
60/50cpht
27 mcarat Indicated Mineral Resource
17 mcarat Inferred Mineral Resource
26-48 mcarat TFFE
Source: Stornoway, 2014
Grades illustrated are for Indicated and Inferred Mineral Resources respectively at a +1DTC sieve
size cut-off. Reserve and Resource categories are compliant with the "CIM Definition Standards on
Mineral Resources and Reserves". Mineral resources that are not mineral reserves do not have
demonstrated economic viability. The potential quantity and grade of any Exploration Target
(previously referred to as a “Potential Mineral Deposit”) is conceptual in nature, and it is uncertain if
further exploration will result in the target being delineated as a mineral resource.

Renard Mine Plan and Key Operating AssumptionsA Combined Open Pit and Underground Operation
0m
100m
200m
400m
600m
700m
500m
300m
Notes
1. Key Assumptions:C$1=US$1, Oil US$95/barrel, 2.5% real terms diamond price growth,
82.9% ore recovery, 23.8% mining and internal dilution, 0cpht dilution grade.
2. Expressed in May 2011 terms. Average price US$190/carat in March 2014 terms.
3. Expressed in October 2012 terms, as adjusted in October 2013 LNG FS. Includes
C$754m of costs and contingencies and C$57m of escalation allowance.
4. Expressed in October 2012 terms. Operating costs C$54/tonne in October 2013 LNG
FS terms. Excludes capitalized preproduction costs.
5. Before stream
Reserve and Resource categories are compliant with the "CIM Definition Standards on Mineral
Resources and Reserves". Mineral resources that are not mineral reserves do not have
demonstrated economic viability. The potential quantity and grade of any Exploration Target is
conceptual in nature, and it is uncertain if further exploration will result in the target being
delineated as a mineral resource.
Reserve Based Mine Plan1
(Jan 2013 FS Optimization and October 2013 LNG
Option FS)
Mine Life 11 years
Mineral Reserve 17.9 mcarats
Ave. Diamond Price2 $180/carat
Production Rate 2.2 mtonnes/yr
Ave. Diamond Production 1.6 mcarats/yr
Gross Revenue (C$M)2 $4,268
Initial Capital Costs3 $811m
Operating Cost4 $58/t ($76/carat)
Operating Margin5 67%
Payback 4.8 years
Resource Based Mine Plan(Basis of December 2012 ESIA and Mine Permitting. Not
public disclosure consistent with NI 43-101)
Includes the mining of 2.3mcarats of Indicated
Resources within a Renard 65 open pit,
additional Inferred Resources in Renard 2, 3, 4
and 9, and an increased annual processing
capacity up to 2.5mtonnes/yr.
Increased project valuation and mine life.
Renard 65Renard 2 Renard 3
Renard 4
Renard 9
17

18
Project Well Prepared for Execution
Project Site July 2014
Site Layout under Construction
Access Infrastructure in Place
Renard Mine Road opened to traffic on Aug. 30th 2013.
Renard Aerodrome opened to landings Nov. 5th 2013.
Owner’s Team and EPCM in Place
Owner’s construction team located in Longueuil. EPCM
contract negotiated with SNC-Lavalin, DRA & AMEC.
Authorizations and Social Licence
Mecheshoo Agreement signed with Crees in March
2012, partnership agreements with Chibougamau and
Chapais in July 2012, Quebec and Federal
Authorisations in Dec. 2012 and July 2013 respectively.
Favourable Construction Environment
Competitive cost environment and good contractor/
labour availability in Québec.
LNG Power
LNG power option selected to utilize all-season road
and commercial LNG distribution network in Québec.
R65 Borrow Pit
Exploration Camp
Lac Lagopede

19
Kick Off: Ground Breaking Ceremony, July 10th 2014
20
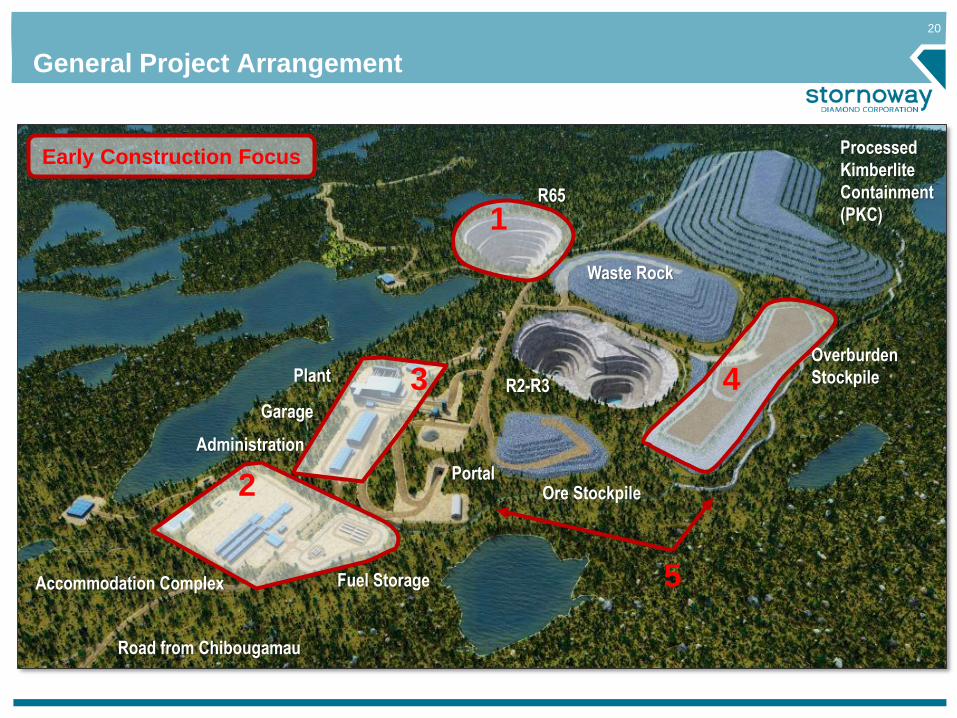
Waste Rock
Processed
Kimberlite
Containment
(PKC)
Overburden
StockpileR2-R3
Ore Stockpile
R65
Accommodation Complex
Plant
Road from Chibougamau
Garage
Administration
Portal
General Project Arrangement
Fuel Storage
2
3 4
5
1
Early Construction Focus

21
Site ProgressSite Overview by Week 10
Project Site September 23rd, 2014
Construction
Camp
1: R65 Borrow Pit
and Pre-strip
3: Major Facilities Pads
(Plant, Garage, Admin)
2: Permanent Camp Construction
Pad and Box-
Cut for Decline
Portal
Future R2-R3 Pit
Location
5: Water
Management
Ditches
4: Overburden
Storage

22
Site ProgressBorrow Pit and Pre-Strip at Renard 65
Construction Camp
R65 Sample Pit
Borrow Pit
R65 Borrow Pit, August 2014

23
Site ProgressCivil Works at Permanent Camp
Permanent Camp Pad, August 2014 Module Foundations, September 23rd 2014
Site Overview, September 23rd 2014First Dorm Wing, October 3rd 2014 Three Wings In, October 11th 2014

24
Site ProgressCivil Works at Plant, Garage and Admin Office Sites
Site Overview, September 23rd 2014
Permanent Camp Construction Plant Site Preparation
Site Overview, October 11th 2014
Permanent Camp
DormitoriesAdministration (Mine
Dry) and Garage Pads
Process Plant and
Crusher Pads
25
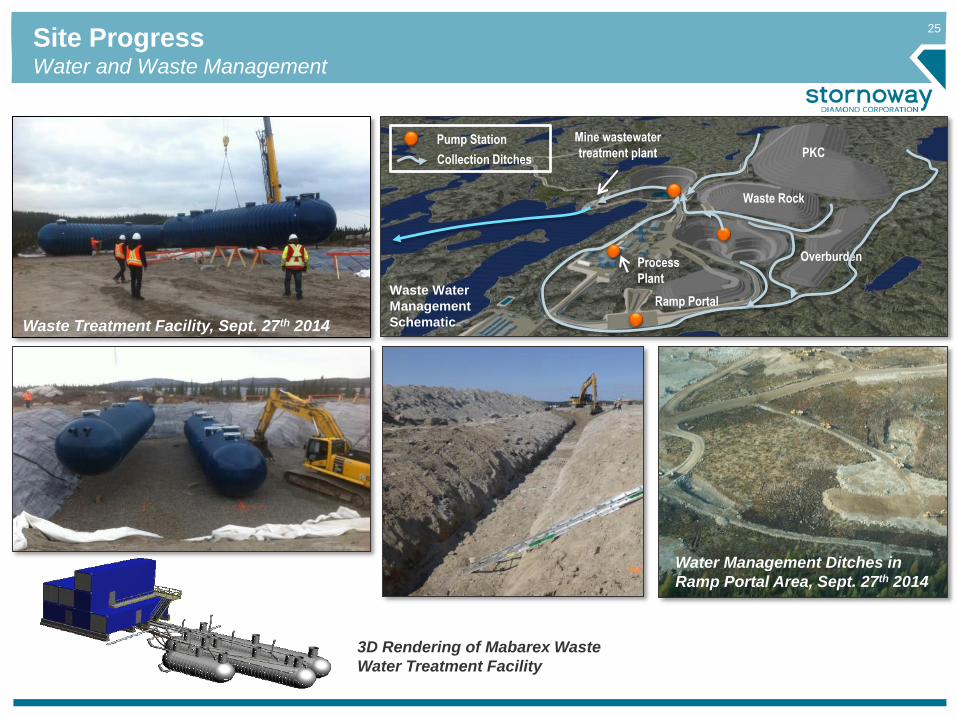
PKC
Waste Rock
Overburden
Ramp Portal
Process
PlantWaste Water
Management
Schematic
Mine wastewater
treatment plantCollection Ditches
Pump Station
Site ProgressWater and Waste Management
Waste Treatment Facility, Sept. 27th 2014
Water Management Ditches in
Ramp Portal Area, Sept. 27th 2014
3D Rendering of Mabarex Waste
Water Treatment Facility

26
Airstrip, July 2014
Nov 2013
Airstrip, August 2014
1,497m Airstrip Designed for Q400 Planes
Site ProgressRenard Airstrip (“FCX5”)
Airstrip Facilities, October 2014

27
Views of the Route 167 Extension/Renard Mine RoadOpened for Construction Traffic since August 2013
KM 237
KM 155
Eastmain River Bridge KM 184

28
17 Bridges on the Renard Mine Road Constructed by StornowayThe Eastmain River Bridge by Chantier Chibougamau - Engineered Wood Construction

29
Process Plant at 6,000tpd (2.2Mtonnes per
annum) nameplate capacity, expandable to
7,000tpd (2.6Mtonnes per annum)
Optimization by DRA Americas Inc. has
allowed addition of Large Diamond
Recovery (“LDR”) capacity to the flow sheet
for no additional capital.
Flow sheet:
• Primary jaw crushing to < 230mm
• Twin DMS circuits at +1mm -19mm
• LDR circuit at +19mm -45mm, scalable
to -60mm
• Oversize +45mm to secondary cone
crusher
• LDR and DMS tails +6mm -19mm to
tertiary High Pressure Grinding Rolls
Cap-ex (Direct Costs, without Capitalized Op-ex)
• Jan 2013 Cap-ex without LDR: $162.7m
• Optimized Cap-ex with LDR: $147.1m
Thickening and centrifugal treatment of
fines and tails to create a truckable product
for dry-stack disposal.
Diamond Processing PlantIn Detailed Design Stage
Crushed ore stockpile
Scrubbing and
Screening
DMSCentrifugeCone crushing
HPGR
Water
30
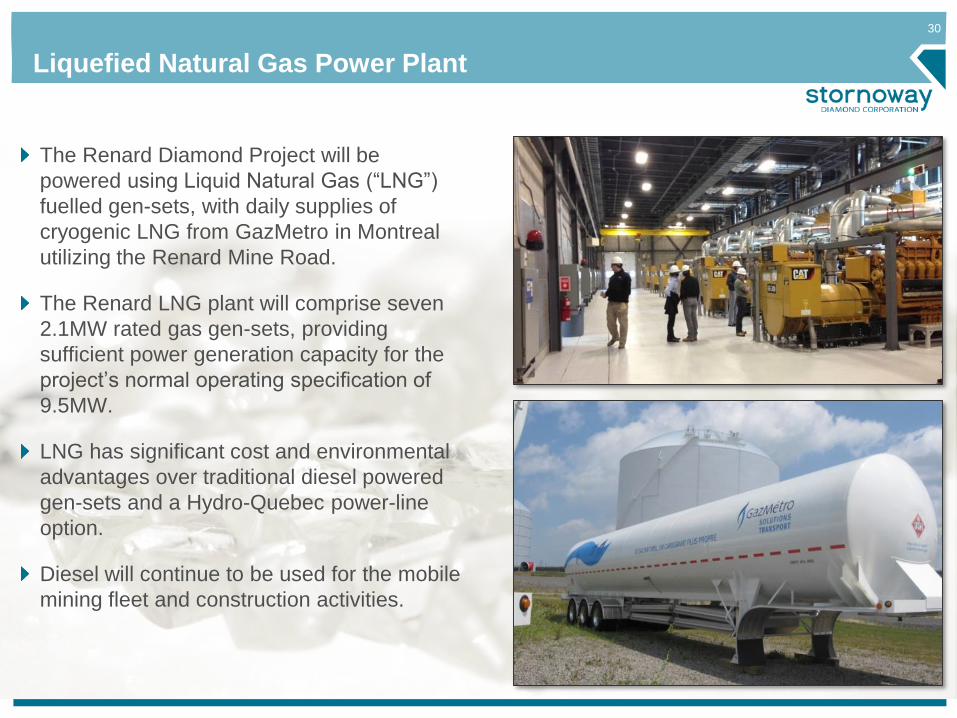
Liquefied Natural Gas Power Plant
The Renard Diamond Project will be
powered using Liquid Natural Gas (“LNG”)
fuelled gen-sets, with daily supplies of
cryogenic LNG from GazMetro in Montreal
utilizing the Renard Mine Road.
The Renard LNG plant will comprise seven
2.1MW rated gas gen-sets, providing
sufficient power generation capacity for the
project’s normal operating specification of
9.5MW.
LNG has significant cost and environmental
advantages over traditional diesel powered
gen-sets and a Hydro-Quebec power-line
option.
Diesel will continue to be used for the mobile
mining fleet and construction activities.

31
The Project is a temporary user of land that will be
returned to its traditional users at the end of mine
life. Project design has therefore prioritized
minimal environmental footprint and progressive
rehabilitation.
The Renard Project occupies just 3.1km2 within a
single watershed.
All water in contact with mining materials will be
collected and treated prior to release.
Geochemical characterisation of Processed
Kimberlite and country rock waste indicates
minimal metal leach potential and no acid
generation.
Buildings have been designed and materials
selected to facilitate dismantling, recycling and re-
vegetation at the end of the mine life.
First part of $15.2 financial guarantee for site
rehabilitation and closure costs provided to the
Ministre de l’Énergie et des Ressources naturelles
on August 29th 2014.
Environmental Impact and Rehabilitation Plan
Mine Site Post Reclamation

32
In March 2012 Stornoway concluded the “Mecheshoo Agreement”
with the Cree Nation of Mistissini and the Grand Council of the
Crees (EI).
The “Mecheshoo Agreement” provides for employment and
business opportunities, the Crees, fosters cultural, environmental
and social protection, and provides for the Crees’ participation in
the project’s long term financial success.
In July 2012 Stornoway concluded a “Declaration of Partnership”
with the communities of Chapais and Chibougamau.
The Declaration of Partnership provides a framework to address
issues of mutual interest such as communication, employment and
economic diversification.
Signing the Mecheshoo Agreement, March 2012
Renard’s Social LicenceLocal and Regional Participation in the Project
Signing Partnership Agreements with
Chibougamau and Chapais, July 2012
September 2014 Onsite Contractors
Blasteck Makaahikan Sodexo Forchemex
Entreprise Maltais MY Surveying Forages Rouillier Foresterie Nordic
ESG Const. Tanguay Groupe Qualitas Recyclage Ungava
Eskan RCM Modulaire Plomberie Chibou. Brulé Murray
Jos Ste-Croix Swallow-Fournier Petroles RL Barette et fils
Kiskinshiish Tessier Equipement JVC ASDR Environnem.
Telesignal SPI Santé/Sécurité Installation AC Gardium/Shecapio

33
September 2014 Employment Statistics261 People Employed in Stornoway or at the Renard Project at End of September
Longueuil43%
Lagopede34%
Vancouver9%
Toronto8%
Chibougamau and Missitini
6%
Stornoway Employees
Total: 68
Crees58%
Non-Crees42%
Contractor Employees at Site
Total: 193

34
Project ScheduleBased on Construction Mobilization July 10th 2014
Feasibility Study (Complete)
ESIA (Complete)
Public Hearings (Complete)
Reg. Authorizations (Complete)
Specific Operating Permits (50)
Road Construction (Complete)
Project Financing (Complete)
Detailed Engineering
Site Construction
Commissioning and Ramp-up
Commercial Production
2012
2H 2H 2H 2H2H 1H 1H 1H1H
2013 2014 2015 2016
2H1H
2017
Based on the Renard Diamond Project Construction Schedule, Plant
Commissioning is Planned for H2 2016 and Commercial Production in Q2 2017.
October 2014
First Vehicle Access

3535
Renard’s Potential (Matt Manson)

36
The Challenge of Finding and Developing New Diamond Mines
“Tier 1” defined as mines with Ultimate reserves greater than US$20B: Jwaneng, Orapa, Mir,
Udachnya, Venetia, Catoca, Premier
Kimberlite Discoveries Since 1870
6,800
1,000
65
7
875
420
20
1
10
100
1,000
10,000
KimberlitesDiscovered
Diamondiferous Economic Tier 1*
Recent Diamond Mines
Source: De Beers/SWY
Economic kimberlites represent just 1% of all
discoveries made since 1870 (1.7% in Canada)
Time from Discovery to First Production
Ekati (1998, BHPB, now Dominion) 7 years
Diavik (2002, Rio Tinto/Dominion) 9 years
Victor (2008, De Beers) 20 years
Snap Lake (2008, De Beers) 11 years
Karowe (2012, Lucara) 10 years
Grib (2013, Lukoil) 18 years
Ghaghoo (2014, Gem) 23 years
Renard (2017, Stornoway) 16 years
Gahcho Kué (2017, DeBeers/MPV) 21 years
Bunder (2019, Rio Tinto) 15 Years
Projects are taking longer to develop

37
Major Diamond Mines and Development Projects WorldwideFew Enough Mines to Fit on One Map
South Africa
• Venetia (De Beers)
• Finsch, Premier (Petra Diamonds)
• Lace (DiamondCorp)
Tanzania
• Williamson (Petra Diamonds)
Russia
• Arkhangelsk District (Alrosa)
• Yakutia District (Alrosa)
• Grib (LUKOIL)
India
• Bunder (Rio Tinto)
Australia
• Argyle (Rio Tinto)
• Ellendale (Kimberly Diamonds)
Canada
• Ekati (Dominion)
• Diavik (Rio Tinto/Dominion)
• Victor, Snap Lake, Gahcho Kué (De Beers)
• Renard (Stornoway)
• Fort a la Corne (Shore Gold/Newmont)
Botswana
• Jwaneng, Orapa (De Beers)
• Ghaghoo (Gem Diamonds)
• Karowe (Lucara Diamonds)
Angola
• Catoca (Alrosa)
Democratic Republic of Congo
• Mbuyi-Mayi
Sierra Leone
• Koidu, (Steinmetz Group)
Lesotho
• Letseng (Gem Diamonds)
• Kao (Namakwa Diamonds)
• Liqhobong (Firestone)
• Mothae (Lucara)

38
A Snapshot of Rough Diamond Supply
Industry Supply Themes
146mcarats produced in 2013
(US$18b)
No return to peak diamond production
of 176mcarats achieved in 2005
Maximum 20mcarats new production
on deck assuming all new projects
meet proponents published production
and schedule estimates
Consensus forecast of 2% supply
CAGR (in carat terms) to 2018,
declining thereafter
Potential or Actual New Projects
Rough Diamond Supply
Sources
The Global Diamond Report, September 2013: Bain & Co/Antwerp World Diamond Centre
The Diamond Insight Report, September 2014: McKinsey/De Beers

39
A Snapshot of Rough Diamond Demand
Rough Diamond Demand
Supply and Demand
Industry Demand Themes
Diamond jewelry/polished diamond demand
growth tied to GDP growth in principal
markets
Diamond jewelry sales strongly correlated to
market demographics (age, gender, wealth)
US still dominant polished diamond market
(40% in 2013, 2% CAGR 2008-13) with
China the growth market (15% in 2013, 20%
CAGR 2008-13)
Consensus forecast of c.5% rough demand
CAGR (in dollar terms) over next 10 years
Consensus forecasts of 2-4% real rough
diamond price CAGR over next 10 years
given supply/demand imbalance
Sources
The Global Diamond Report, September 2013: Bain & Co/Antwerp World Diamond Centre
The Diamond Insight Report, September 2014: McKinsey/De Beers

40
Rough Diamond Pricing 2009-2014
A tracking of the diamond market since the publication of the November 2011 FS and January 2013 Opt.
FS indicates rough diamond prices have generally remained within the bounds of sensitivities contained
within the FS financial model (May 2011 spot prices and a 2.5% real terms annual price escalator).
50
100
150
200
250
300
350
1-Jan-09 1-Jan-10 1-Jan-11 1-Jan-12 1-Jan-13 1-Jan-14 1-Jan-15
Ind
ex
to
20
09
=1
00
The May 2011 diamond
valuation utilized in the FS
was 10% below the WWW
rough index price
FS 2.5% Price Model
(Nominal, adjusted
for CPI) with +/- 10%
Sensitivity
WWW Rough
Diamond Price
Index
COMEX Gold
May 2011 FS
Diamond Valuation
41
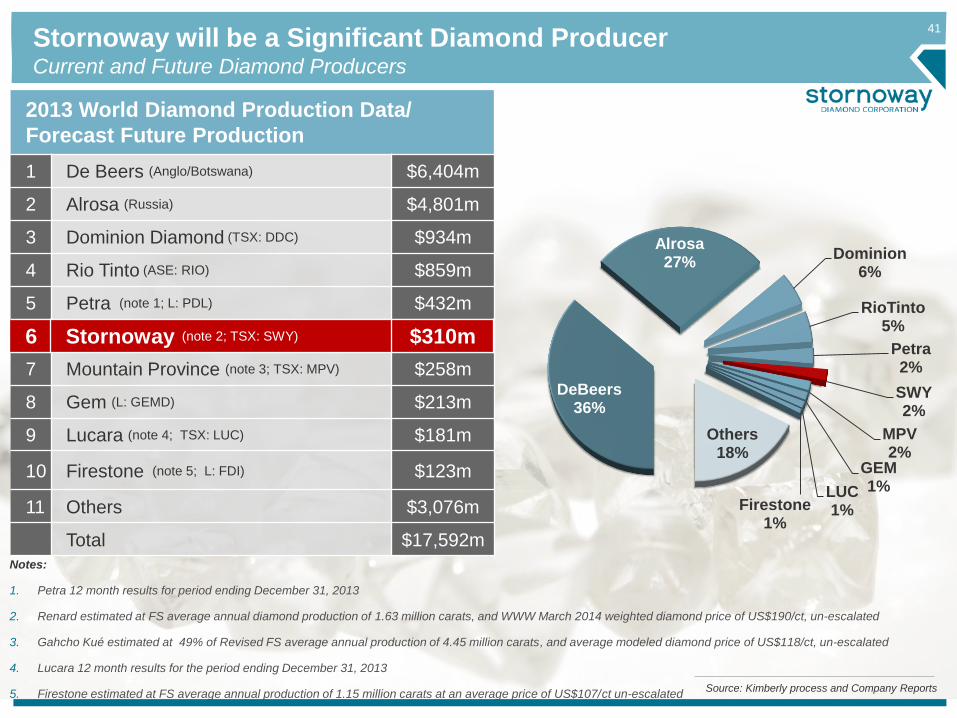
Stornoway will be a Significant Diamond ProducerCurrent and Future Diamond Producers
Source: Kimberly process and Company Reports
2013 World Diamond Production Data/
Forecast Future Production
1 De Beers (Anglo/Botswana) $6,404m
2 Alrosa (Russia) $4,801m
3 Dominion Diamond (TSX: DDC) $934m
4 Rio Tinto (ASE: RIO) $859m
5 Petra (note 1; L: PDL) $432m
6 Stornoway (note 2; TSX: SWY) $310m
7 Mountain Province (note 3; TSX: MPV) $258m
8 Gem (L: GEMD) $213m
9 Lucara (note 4; TSX: LUC) $181m
10 Firestone (note 5; L: FDI) $123m
11 Others $3,076m
Total $17,592m
DeBeers36%
Alrosa27%
Dominion6%
RioTinto5%
Petra2%
SWY2%
MPV2%
GEM1%LUC
1%Firestone1%
Others18%
Notes:
1. Petra 12 month results for period ending December 31, 2013
2. Renard estimated at FS average annual diamond production of 1.63 million carats, and WWW March 2014 weighted diamond price of US$190/ct, un-escalated
3. Gahcho Kué estimated at 49% of Revised FS average annual production of 4.45 million carats, and average modeled diamond price of US$118/ct, un-escalated
4. Lucara 12 month results for the period ending December 31, 2013
5. Firestone estimated at FS average annual production of 1.15 million carats at an average price of US$107/ct un-escalated
6 Stornoway (note 2; TSX: SWY) $310m

42
Renard’s DiamondsLarge Diamond Potential Not Included in Base Case Diamond Valuation Models
March 2014 Diamond Valuations (WWW International Diamond Consultants Ltd.)
Kimberlite
Body
Size of
Valuation
Sample(carats)
WWW March
2014 Sample
Price(US$/carat)1
WWW March
2014 Base Case
Price Model(US$/carat)1
Sensitivities(Minimum to High)
Renard 2 1,580 $187 $197 $178 to $222
Renard 3 2,753 $179 $157 $146 to $192
Renard 4 2,674 $101 $106 ($155)2 $100 to $174
Renard 65 997 $262 $187 $175 to $211
Notes
1. All prices in US$/carat. Samples utilizing a +1 DTC sieve size cut-off.
2. Should the Renard 4 diamond population prove to have a diamond population with a size distribution
equal to the average of Renard 2 and 3, WWW have estimated that a base case diamond price model
of $155 per carat based on March 2014 pricing. Source: WWW March 2014 Valuation Update
Three Renard 65
diamonds: 9.78 ct and
6.41 ct diamonds
recovered from bulk
sampling and a 4 carat
stone discovered in
drillcore in 2003
Base Case Diamond Valuation
Estimates Using on Best
Practice Methodology
Average diamond price estimate in
March 2014 for the Mineral Reserves
at US$190/ct (un-escalated)
compared to US$180/ct in the January
2013 Optimization Study.
High Quality Production with
Large Stone Potential
The Renard kimberlites have similar,
but marginally different diamond
populations exhibiting a high
incidence of large white gems.
Coarse Size Distribution in Renard 2
predicts three to six 50-100ct stones
and one to two +100ct stones every
100,000 carats (two weeks).
Substantial revenue potential from
large diamonds not accounted for in
the base case cash-flow model.
43
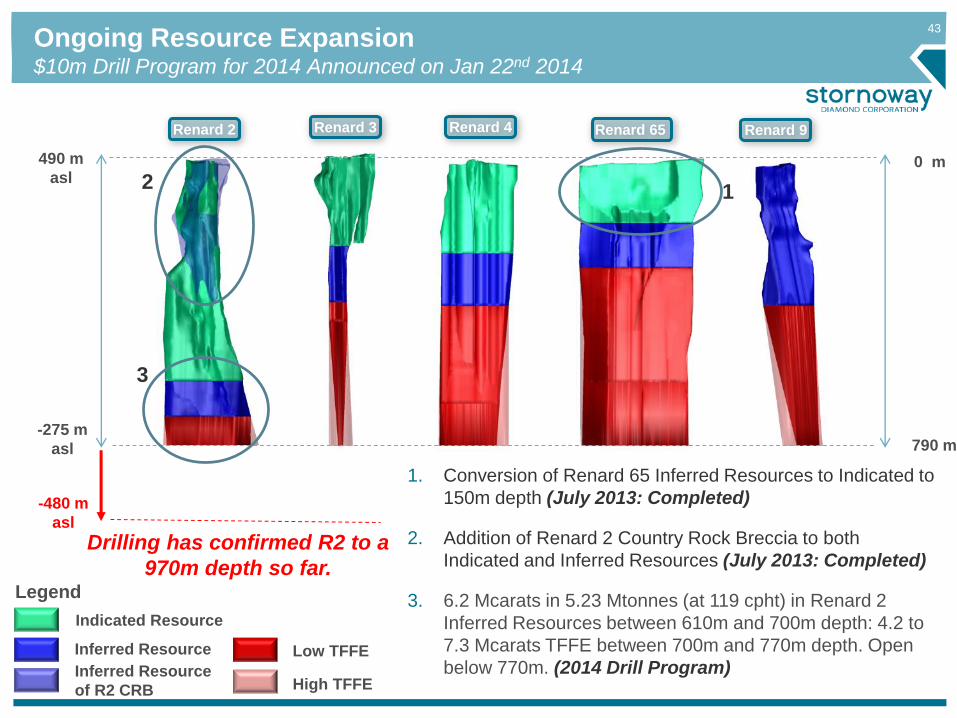
490 m
asl
-275 m
asl
0 m
790 m
Indicated Resource
Legend
Inferred Resource
Inferred Resource
of R2 CRB
Low TFFE
High TFFE
Ongoing Resource Expansion$10m Drill Program for 2014 Announced on Jan 22nd 2014
Renard 2 Renard 3 Renard 4 Renard 65 Renard 9
1. Conversion of Renard 65 Inferred Resources to Indicated to
150m depth (July 2013: Completed)
2. Addition of Renard 2 Country Rock Breccia to both
Indicated and Inferred Resources (July 2013: Completed)
3. 6.2 Mcarats in 5.23 Mtonnes (at 119 cpht) in Renard 2
Inferred Resources between 610m and 700m depth: 4.2 to
7.3 Mcarats TFFE between 700m and 770m depth. Open
below 770m. (2014 Drill Program)
12
3
Drilling has confirmed R2 to a
970m depth so far.
-480 m
asl

44
Notable Exploration Properties and Joint Ventures
Reserve and Resource categories are compliant with the "CIM Definition
Standards on Mineral Resources and Reserves". Mineral resources that are
not mineral reserves do not have demonstrated economic viability. The
potential quantity and grade of any Exploration Target is conceptual in
nature, and it is uncertain if further exploration will result in the target being
delineated as a mineral resource.
Renard (100%)
Aviat (90%)
Qilalugaq (100%)
Pikoo (20%)
Aviat – 90% SWY, 10% Hunter Exploration Group
Kimberlite sheet and blow system on 197k Ha property located on
Melville Peninsula in eastern Nunavut.
TFFE estimated at 12.4 to 16.0mtonnes of kimberlite containing
24.1mcarats to 40.3mcarats.
Pikoo – 80% North Arrow (NAR-V), 20% SWY
2 New Kimberlites discovered in 2013 on 33k Ha property in east
central Saskatchewan.
209kg sample of PK150 kimberlite returned 745 diamonds larger
than 0.106mm
Till sampling underway during summer 2014 under an 80/20 JV
with North Arrow, pursuant to 2012 Option Agreement.
Qilalugaq – 100% SWY (Subject to NAR Option)
8 Kimberlites on 7k Ha property in eastern Nunavut.
Q1-4 pipe has an Inferred Resource of 48.8mtonnes with total
diamond content of 26.1mcarats to 205m.
C$3.7m sampling program underway to recover 500 carat parcel
for diamond valuation, pursuant to 2012 Option agreement with
NAR to earn an 80% interest, subject to a one time back in right
of SWY’s to increase its interest to 40%.

4545
Moving Forward

46
Stornoway Diamond Corporation TSX:SWYOur Priorities
www.stornowaydiamonds.com
Solid project execution
Budget, schedule and operating
excellence
Disciplined management of cash and
expenditures
Strong balance sheet
Delivering on project’s strong margin
and cash flow potential
Then…
Retain exposure to pipeline exploration
assets through JVs
With successful construction and
commissioning behind us, look to the
future

4747
Questions