building models of product development processes: an...
TRANSCRIPT

Building Models of Product Development Processes: An Integrative Approach to Managing
Organizational Knowledge
Tyson R. Browning Neeley School of Business Texas Christian University
TCU Box 298530 Fort Worth, TX 76129 USA
This is a preprint of a paper forthcoming in 2018 in Systems Engineering
_______________________ The concepts in this paper have developed over the past 20 years with the benefit of many interactions with colleagues in industry and academia. I am also grateful for research support from a Neeley School of Business Research Excellence Award. As this work relates to many of my prior publications, please forgive the unusually large number of self-citations.

1
Building Models of Product Development Processes: An Integrative Approach to Managing
Organizational Knowledge
The process for designing and developing complex system products—all of the activities performed
and the information and other work products produced—is essential to innovative and competitive
enterprises. This process is dynamic, complex, and complicated, and the people who understand it best are
in short supply and may not be around for the next project. For a variety of reasons, models of this process
are important to systems engineers and managers. A 2006 paper in this journal discussed key concepts in
modeling product development (PD) processes. This paper follows by presenting a general approach to
building PD process models, integrative process modeling (IPM), that support a wide variety of purposes,
such as providing evidence for external certifications, planning projects and programs, and more—but
especially serving as a salient repository for crucial organizational information. Although a centralized team
of modeling experts leads the overall IPM endeavor, distributed agents define various processes and
activities, thereby capturing PD information across very large organizations. The paper discusses
management of the model-building project and subsequent operations, as well as software tool support and
model storage. A collection of helpful heuristics guides IPM to help organizations improve the long-term
value provided by PD process modeling.
Keywords: Process modeling, product development, knowledge management, system design, engineering
management, project management, program management
1. Introduction According to management guru Peter Drucker, “Knowledge is the only meaningful resource today. The
traditional ‘factors of production’ have not disappeared, but they have become secondary” [Drucker, 1993,
p. 42]. However, “although an organization’s knowledge base may be its single most important asset, its
very intangibility makes it difficult to manage systematically” [Bohn, 1994, p. 61]. A crucial set of
knowledge in enterprises is what work to do and how to do it in order to get desired results. Over the past
several decades, engineers, managers, researchers, and others have sought to model how various business
processes transpire [e.g., Recker and Mendling, 2016; Wynn and Clarkson, 2017]. The concerns motivating
such efforts have varied. In the areas of engineering design, systems engineering (SE), and product
development (PD), needs for external certifications, process improvement, project planning, or knowledge
management have provided an impetus for practitioners to invest resources in process modeling [Browning
2
and Ramasesh, 2007]. Many enterprises have described, prescribed, defined, mapped, or modeled processes
to satisfy customers, assessors, auditors, and executives. Some enterprises have realized that, with so much
expertise retiring or leaving, it is imperative to capture information about how complex systems of PD work
lead to desired outcomes. Digitizing and “mapping the genome” of PD work holds great potential for
improving our understanding and management of it, especially when the “DNA” of previous, effective
projects and programs is highly instructive and in danger of being lost. Practitioner terminology such as
“process assets” and “process capital” reveals the imputed value of organizational process information [e.g.,
Matthies, 2014]. However, many investments in such efforts fail to provide the desired returns: many
process modeling and knowledge management efforts seem to fizzle out without much long-term benefit
or impact. Perhaps we need better approaches, because processes continue play a key role in contemporary
SE research and practice, and the right kind of organized, process information—that captures the interfaces
or “white space” between better-known activities—provides huge leverage for improving project outcomes.
A previous article in this journal [Browning et al., 2006]—strongly recommended as background read-
ing—illuminated several essential concepts and motivations for modeling processes in the realm of systems
design and development, or, more generally, product (and service) development. It differentiated PD pro-
cesses from other business processes while distinguishing (but not addressing) three further areas of im-
portance: building, representing, and using PD process models. The present paper stands on that foundation
to advance best and next practices for the first of these topics—building PD process models that more fully
support the gamut of uses, purposes, and concerns. The proposed methodology synthesizes industrial
practices—influenced especially by the aerospace, automotive, construction, and naval ship design
industries—with systems-oriented approaches from the literature. Although building a useful PD process
model remains partly an art, this paper contributes a structured, systematic methodology that overcomes
many lurking pitfalls and problems. The approach, integrative process modeling (IPM), stands a much
better chance of providing long-term value to organizations. The main point of the resulting models is not
to satisfy customers or auditors (although they can certainly do so) but rather to capture, organize, adapt,
and evolve valuable, hard-earned information about what work to do and how to do it when developing a
complex system—vital knowledge that is otherwise spread thinly across many people in a large enterprise.
2. Background A process is “an organized group of related activities that work together to create a result of value”
[Hammer, 2001]. A model is an abstract representation of reality—built, verified, analyzed, and
manipulated for a particular purpose [Steiger, 1998]. An enormous literature exists on process modeling.
The majority of this literature addresses “business process modeling” within the larger literature on business
process management (BPM) [e.g., Malone et al., 2003; Aguilar-Savén, 2004; Marjanovic and Freeze, 2012;
Recker and Mendling, 2016; Klun and Trkman, 2017]. Although this literature is highly detailed and

3
insightful, it largely ignores the distinct characteristics of PD processes that call for particular approaches
to process modeling.
A second stream of literature has focused on engineering design and PD, where researchers have
developed numerous models that treat the PD process as a network of activities (work packages, analyses,
decisions, events, etc.) with input-output relationships (deliverables, work products, information, data,
documents, estimates, prototypes, materials, etc.). Browning and Ramasesh [2007] reviewed PD process
models in this area; Wynn and Clarkson [2017] provided another a recent review. These models account
for key differences between PD and general business processes, such as: (1) the intent to do something new,
once (e.g., design a product) rather than the same thing repeatedly (e.g., take an order, assemble a product,
provide a service); (2) the primacy of information as the basis for activity dependencies; (3) the highly
cross-functional and transdisciplinary nature of integrated PD; (4) the greater propensity for parallel,
overlapping activities (concurrent engineering); (5) the conditions of higher uncertainty and ambiguity; and
(6) the need for greater flexibility and agility in process planning and execution [Reinertsen, 1997;
O’Donovan et al., 2005; Browning et al., 2006]. Although the PD process modeling literature still has much
to learn from the general BPM literature (and vice versa), the distinct characteristics of PD processes argue
for basing an approach to building PD process models mainly on this second stream.
Browning et al. [2006] addressed some foundational issues in PD process modeling, tackling questions
such as the following. Why build PD process models? What is the basis of PD process modeling theory? Is
it even reasonable to attempt to model a creative process like PD? Why treat processes as a kind of system?
What are the main frameworks available for building PD process models? Why is it essential that a process
model account for both activities and their relationships (i.e., information flow, deliverables, and work
products)? What are the general requirements and objectives for any PD process model? What are the
differences between: (1) descriptive and prescriptive models, (2) standard and deployed processes, (3) “as-
is” and “to-be” process models, and (4) centralized and decentralized process modeling? How should we
deal with multi-phase or multi-stage processes—e.g., conceptual design, preliminary design, and detailed
design? How can we address unknown unknowns—i.e., tasks and relationships we cannot foresee? How
should we handle cynicism and resistance to process modeling among some workers? What is the basis for
a generalized framework for PD process models? Their answers to these questions set the stage for the
model-building approach presented in this paper.
Informed by systems theory, design theory, and coordination theory, the generalized approach to
process modeling is based on activities (actions) and their interfaces (interactions)—an instantiation of the
general approach to modeling the structure of any system of elements and relationships [Malone et al.,
1999; Pall, 1999; Park and Cutkosky, 1999; Browning, 2002; Browning et al., 2006; Panchal et al., 2009].
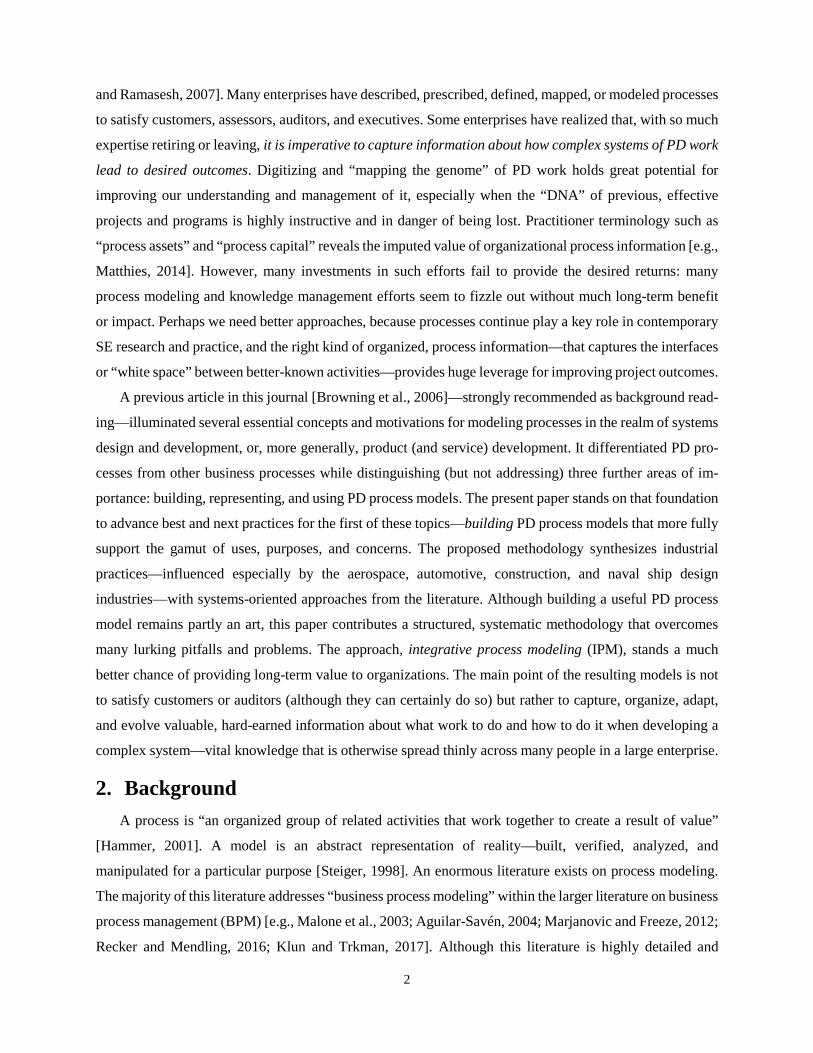
To represent these, the generalized framework uses two basic objects, process elements (PEs) and

4
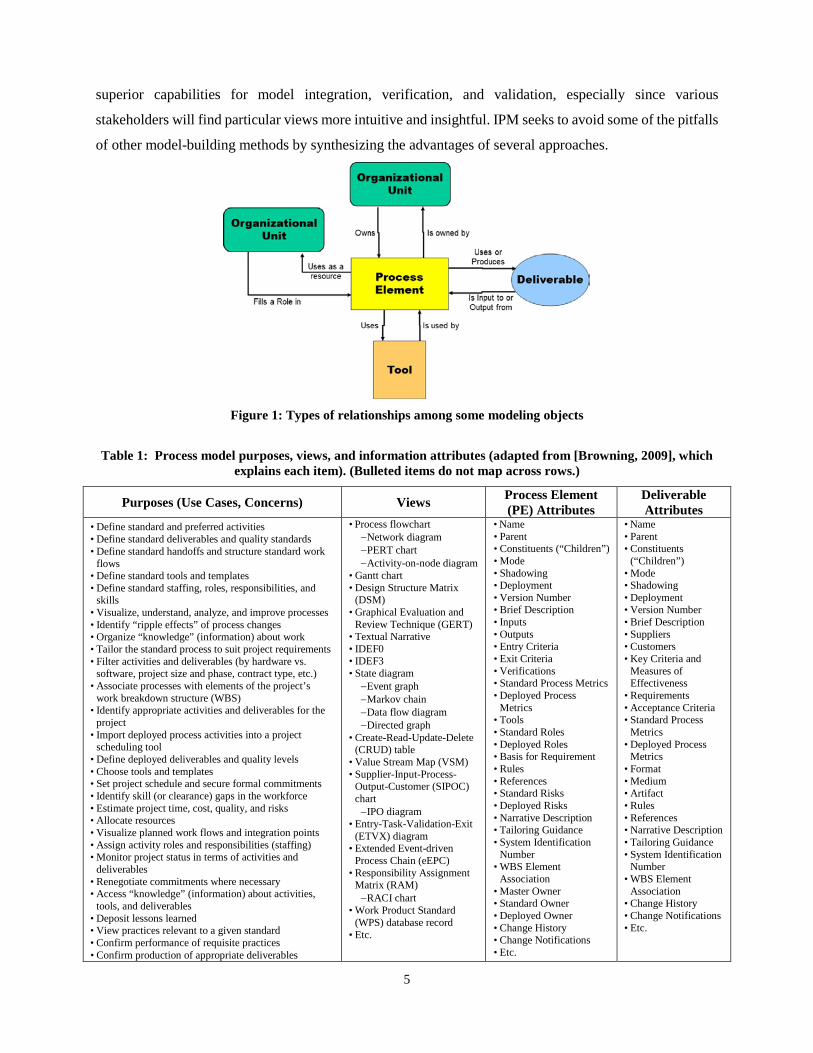
deliverables.1 Figure 1 shows the types of relationships between these two objects, each of which can have
many attributes or properties (e.g., columns three and four of Table 1). Modelers may add further objects,
such as tools and organizational units, as well as further attributes for each object.2 Rather than jumping
directly to a particular modeling framework or representation format (e.g., those listed in the second column
of Table 1), the generalized framework guides development of a rich model that sits in the background and
from which can be drawn the data needed to populate any desired view—a process architecture framework
(PAF) approach [Browning, 2009, 2010, 2013]. Crucially, the PAF approach overcomes the typical tradeoff
between model simplicity and completeness by building and using a rich model through simpler views. The
IPM approach presented in this paper builds a generalized model, symbiotic with the PAF and renderable
in other frameworks, formats, languages, or views for users with various use cases, purposes, or concerns.
IPM takes a system-of-systems view of the PD process and enables the process model to adapt and co-
evolve with the actual process. IPM objects and attributes may be modeled with business process modeling
notation (BPMN), unified modeling language (UML [e.g., Bock, 2006]), systems modeling language
(SysML [e.g., Friedenthal et al., 2014]), object-process methodology (OPM [Dori, 2002]), or other object-
oriented frameworks, although using one of these languages is not a requirement (and this paper deliberately
avoids diving into the formalisms of notation, class diagrams, etc.). Grounded in a solid theoretical
foundation, this paper emphasizes practical guidance for building rich, flexible, configurable, tailorable,
adaptable, and extendable models. We could say much more about representing and using process models,
once built, but these two important areas lie outside the scope of the present paper.
It is important to reiterate that a process model should be distinct from, and need not depend on, any
particular view of it, such as a flowchart. While a modeler’s preferred view provides a medium for model
building, any view so employed cannot be allowed to constrain the model by inappropriately anchoring and
constraining the modeler’s perspective. Each view has limitations that threaten to do so. For example,
flowcharting conventions underemphasize the arrows (deliverables) among the boxes (activities), failing to
compel even naming them. The desire for neatness in flowcharts tends to curtail accounting for activities’
copious inputs and outputs, guiding modelers to settle for a single input to and output from each box,
whereas PD processes realistically entail a complex web of interactions [Browning, 2002]. Thus,
developing a process model through a variety of lenses—transitioning among several views—provides
1 The terms “process” and “activity” are essentially interchangeable from a system perspective: any activity is a process, and vice versa. This paper will use the terms either as synonyms or relatively to each other—e.g., a process decomposed into activities. As this approach sometimes causes confusion, the generic term PE [e.g., Curtis et al., 1992] is used for any process, activity, sub-process, work package, task, step, etc. 2 The generalized process model captures tools and organizational units as they map to PE and deliverable objects. An extended, project or capability model uses separate objects (with attributes) for tools and organizational units and replaces their appearances in PE and deliverable attributes with links to these objects. Such a model may also add still other objects (each with attributes) such as events, users, issues, resources, and goals.
5
superior capabilities for model integration, verification, and validation, especially since various
stakeholders will find particular views more intuitive and insightful. IPM seeks to avoid some of the pitfalls
of other model-building methods by synthesizing the advantages of several approaches.
Figure 1: Types of relationships among some modeling objects
Table 1: Process model purposes, views, and information attributes (adapted from [Browning, 2009], which explains each item). (Bulleted items do not map across rows.)
Purposes (Use Cases, Concerns) Views Process Element (PE) Attributes
Deliverable Attributes
• Define standard and preferred activities • Define standard deliverables and quality standards • Define standard handoffs and structure standard work
flows • Define standard tools and templates • Define standard staffing, roles, responsibilities, and
skills • Visualize, understand, analyze, and improve processes • Identify “ripple effects” of process changes • Organize “knowledge” (information) about work • Tailor the standard process to suit project requirements • Filter activities and deliverables (by hardware vs.
software, project size and phase, contract type, etc.) • Associate processes with elements of the project’s
work breakdown structure (WBS) • Identify appropriate activities and deliverables for the
project • Import deployed process activities into a project
scheduling tool • Define deployed deliverables and quality levels • Choose tools and templates • Set project schedule and secure formal commitments • Identify skill (or clearance) gaps in the workforce • Estimate project time, cost, quality, and risks • Allocate resources • Visualize planned work flows and integration points • Assign activity roles and responsibilities (staffing) • Monitor project status in terms of activities and
deliverables • Renegotiate commitments where necessary • Access “knowledge” (information) about activities,
tools, and deliverables • Deposit lessons learned • View practices relevant to a given standard • Confirm performance of requisite practices • Confirm production of appropriate deliverables
• Process flowchart − Network diagram − PERT chart − Activity-on-node diagram
• Gantt chart • Design Structure Matrix
(DSM) • Graphical Evaluation and
Review Technique (GERT) • Textual Narrative • IDEF0 • IDEF3 • State diagram
− Event graph − Markov chain − Data flow diagram − Directed graph
• Create-Read-Update-Delete (CRUD) table
• Value Stream Map (VSM) • Supplier-Input-Process-
Output-Customer (SIPOC) chart − IPO diagram
• Entry-Task-Validation-Exit (ETVX) diagram
• Extended Event-driven Process Chain (eEPC)
• Responsibility Assignment Matrix (RAM) − RACI chart
• Work Product Standard (WPS) database record
• Etc.
• Name • Parent • Constituents (“Children”) • Mode • Shadowing • Deployment • Version Number • Brief Description • Inputs • Outputs • Entry Criteria • Exit Criteria • Verifications • Standard Process Metrics • Deployed Process
Metrics • Tools • Standard Roles • Deployed Roles • Basis for Requirement • Rules • References • Standard Risks • Deployed Risks • Narrative Description • Tailoring Guidance • System Identification
Number • WBS Element
Association • Master Owner • Standard Owner • Deployed Owner • Change History • Change Notifications • Etc.
• Name • Parent • Constituents
(“Children”) • Mode • Shadowing • Deployment • Version Number • Brief Description • Suppliers • Customers • Key Criteria and
Measures of Effectiveness
• Requirements • Acceptance Criteria • Standard Process
Metrics • Deployed Process
Metrics • Format • Medium • Artifact • Rules • References • Narrative Description • Tailoring Guidance • System Identification
Number • WBS Element
Association • Change History • Change Notifications • Etc.
6
3. Building the Integrative Process Model W. Edwards Deming famously stated, “If you can’t define what you do as a process, you don’t know
what your job is.” Yet, no single individual could well describe all of the detailed tasks required to design
and develop today’s complex systems. That is part of the challenge of modeling PD processes, but it is also
one of the main reasons for doing so. Because no one person knows everything about all of the work (and
even if they did, could not efficiently do or document all of it), it is important to capture and integrate the
“system-level” knowledge3 of many individuals into a single map of PE work. Hence, capturing,
organizing, enriching, verifying, and validating process information form the essential backbone of the
model-building process.
IPM describes an existing, “as-is” process. It does not (initially) prescribe a desired, “to-be” process.
As Browning et al. [2006] explained, a descriptive process model, built inductively, captures information
from tacit knowledge about how work actually occurs, whereas a prescriptive process model, built
deductively, tells people what work to do. Prescriptive models become appropriate only once a process is
well understood as a holistic system. After sufficient enrichment, integration, synchronization, verification,
and validation, descriptive process models eventually become useful for generating (partial) prescriptions
for future work. Ultimately, the model must be interactive and dynamic, and it must co-evolve with the
organization and its projects.4 While this paper provides the basis for approaching a high level of process
model capability and maturity, its scope does not include important topics pertaining to the later usage of
process models, once built.
In consultation with key stakeholders, a core modeling team (CMT) will direct the IPM process,
although they should ultimately perform only a minority of the overall modeling work. Rather, they will
distribute IPM work throughout the PD organization. Distributing IPM enables a much larger portion of the
organization to achieve a shared interpretation of PD work and its description. It draws on the knowledge
of the many rather than the few.
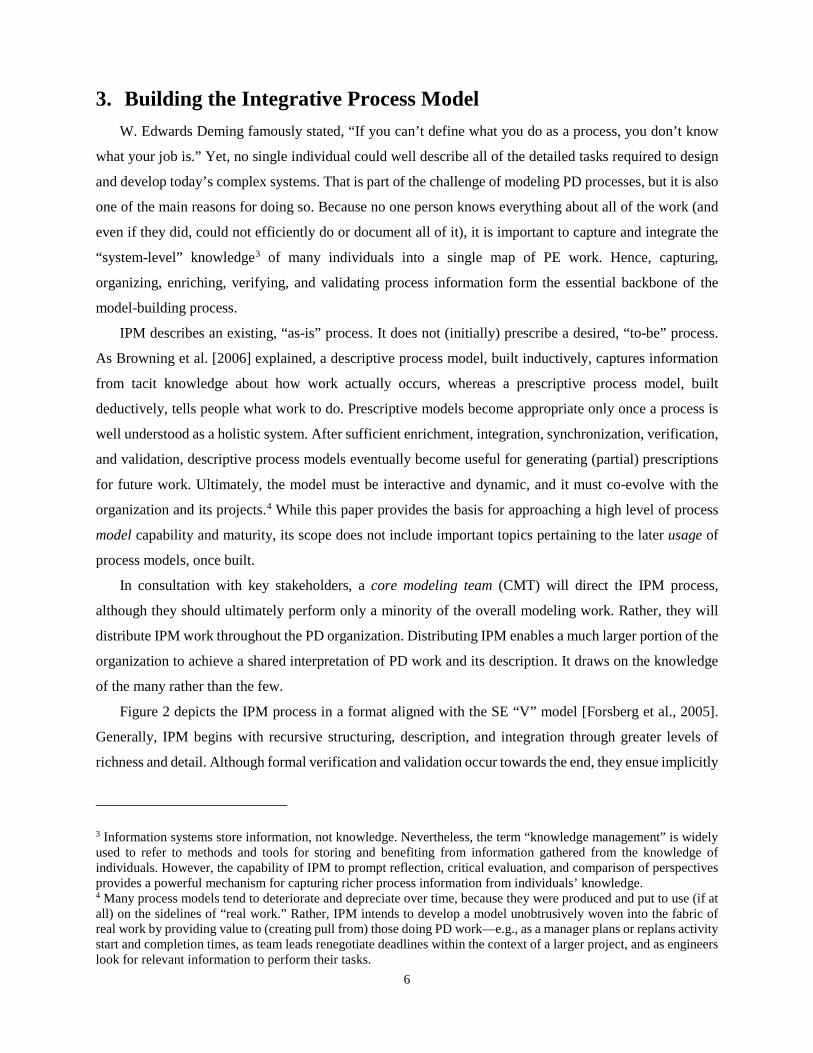
Figure 2 depicts the IPM process in a format aligned with the SE “V” model [Forsberg et al., 2005].
Generally, IPM begins with recursive structuring, description, and integration through greater levels of
richness and detail. Although formal verification and validation occur towards the end, they ensue implicitly
3 Information systems store information, not knowledge. Nevertheless, the term “knowledge management” is widely used to refer to methods and tools for storing and benefiting from information gathered from the knowledge of individuals. However, the capability of IPM to prompt reflection, critical evaluation, and comparison of perspectives provides a powerful mechanism for capturing richer process information from individuals’ knowledge. 4 Many process models tend to deteriorate and depreciate over time, because they were produced and put to use (if at all) on the sidelines of “real work.” Rather, IPM intends to develop a model unobtrusively woven into the fabric of real work by providing value to (creating pull from) those doing PD work—e.g., as a manager plans or replans activity start and completion times, as team leads renegotiate deadlines within the context of a larger project, and as engineers look for relevant information to perform their tasks.
7
throughout. Moreover, although the diagram depicts a linear process, IPM, like PD, is actually highly
recursive and iterative. The following subsections describe the steps along with helpful heuristics. Before
beginning the IPM process, the CMT and an appropriate IPM information system (IPMIS) tool (see section
5) should be in place.
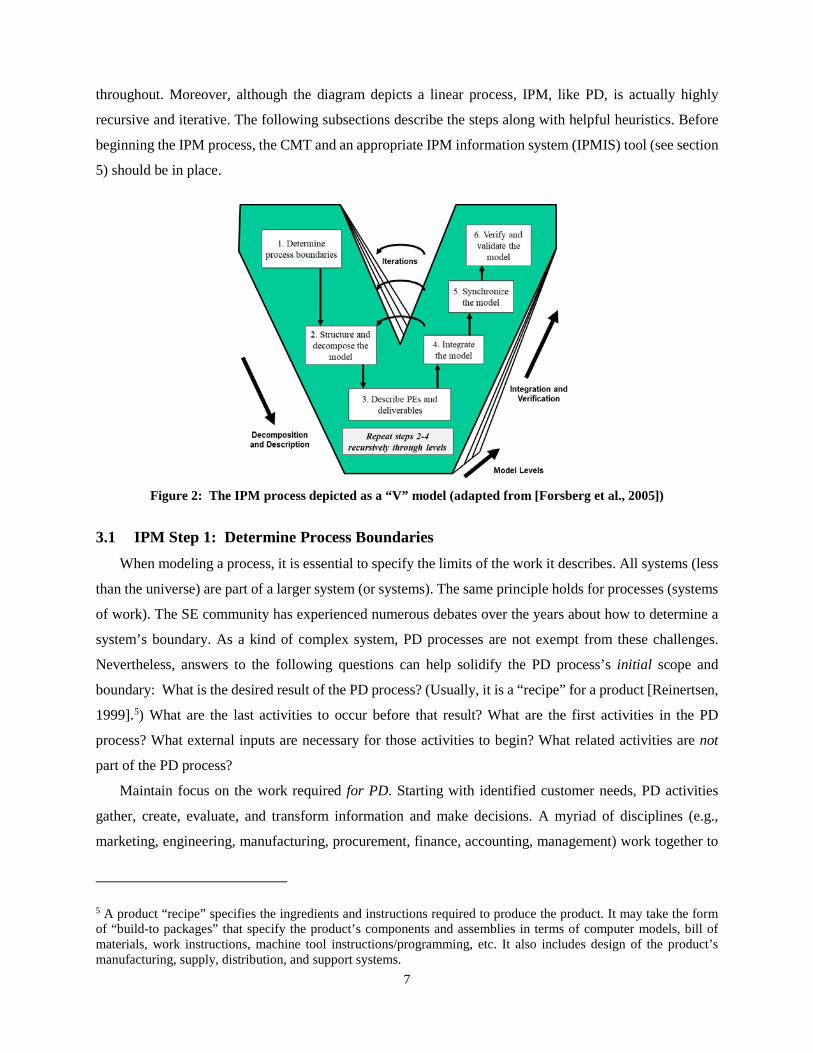
Figure 2: The IPM process depicted as a “V” model (adapted from [Forsberg et al., 2005])
3.1 IPM Step 1: Determine Process Boundaries
When modeling a process, it is essential to specify the limits of the work it describes. All systems (less
than the universe) are part of a larger system (or systems). The same principle holds for processes (systems
of work). The SE community has experienced numerous debates over the years about how to determine a
system’s boundary. As a kind of complex system, PD processes are not exempt from these challenges.
Nevertheless, answers to the following questions can help solidify the PD process’s initial scope and
boundary: What is the desired result of the PD process? (Usually, it is a “recipe” for a product [Reinertsen,
1999].5) What are the last activities to occur before that result? What are the first activities in the PD
process? What external inputs are necessary for those activities to begin? What related activities are not
part of the PD process?
Maintain focus on the work required for PD. Starting with identified customer needs, PD activities
gather, create, evaluate, and transform information and make decisions. A myriad of disciplines (e.g.,
marketing, engineering, manufacturing, procurement, finance, accounting, management) work together to
5 A product “recipe” specifies the ingredients and instructions required to produce the product. It may take the form of “build-to packages” that specify the product’s components and assemblies in terms of computer models, bill of materials, work instructions, machine tool instructions/programming, etc. It also includes design of the product’s manufacturing, supply, distribution, and support systems.
8
deliver the recipe. However, the organizations and people involved in PD also do other work. These other
activities should not be confused with PD work nor included in the PD process model. General
infrastructure activities—such as those providing human resources, information technologies, capital
equipment, and other enablers to all enterprise operations—are best left as external to PD, despite its
reliance upon them.
Boundaries depend on many variables, so bounding remains somewhat of an art. Good heuristics can
be helpful here, including those useful for bounding product systems [q.v., Rechtin, 1991]. Stakeholder
agreement on a tentative boundary definition is desirable. An initial boundary must be set to get on with
the modeling, but this boundary must remain malleable during IPM, which should repeatedly stress test the
boundary definition. No model is perfect, so modelers and their sponsors must fight the temptation to over-
analyze at this point. The output of this first IPM step is an initial definition of the root PE “Develop
Product.” Some of its attributes (see Table 2) may wait for later definition (as a roll-up of lower-level PEs),
but for now it is essential to capture the PD process’s scope and boundary (in the Brief Description attribute)
as well as its external inputs and outputs.
3.2 IPM Step 2: Structure and Decompose (Architect) the Model 3.2.1 Decompose (Enrich) the Model
We now turn from the external boundaries of the PD process to its internal structure. To understand
and model the PD work, we begin by decomposing the root PE into smaller PEs. A PE describes a piece of
work done to produce a result. When describing a PE, it is critical to keep its desired result (why it exists)
in mind. Figure 3 illustrates the concept of describing work at abstract and detailed levels in terms of PEs.
At level x, the model describes a large scope of work holistically, in general terms, whereas level x+1
describes the same work in greater richness by parsing it into several pieces, each of narrower scope and
greater specificity. The higher the level number, the greater the detail.6 Crucially, each (complete) level of
decomposition should holistically describe the entire process. The PEs at each level should collectively
describe all of the work done to get the result. The (complete) levels differ in abstraction and richness of
description, not scope. Despite the decreasing size of each box (PE) in Figure 3 with increasing level
number, each PE should contain approximately the same amount of information. Thus, the total information
content at each (complete) successive level will increase geometrically. Decomposition may continue
through as many levels as needed; section 3.5 will discuss appropriate limits.7 Some parts of the process
may require deeper decomposition (richer definition) than others. In Figure 3, for example, PE 1.2 requires
6 Confusingly, convention dictates that lower levels of decomposition have higher level numbers—notwithstanding that a “level 1” (root) process is often referred to as a “high level” process. Some have therefore suggested inverting the scheme by using “level x” for the most detailed processes and “level 10” [or whatever] for the highest, root node. The problem here is that the top level is fixed while the bottom level, as we will discuss later, may vary. 7 For general guidance on decomposing complex systems, see [Courtois, 1985; Simon, 1996; Bahill et al., 2005].

9
further breakdown, whereas the other PEs at its level do not. (Hence, level x+2 is not complete.) However,
selective decomposition decisions typically do not become an issue until several levels below the top (root)
level.
Figure 3: Describing work at abstract and detailed levels through decomposition into PEs
Modelers should consider alternative avenues for decomposition. Should the PD process be broken
down temporally, into phases or stages? Alternatively, should it be parsed into parallel “swim lanes” or
threads, each flowing from beginning to end? A hybrid approach works well: decompose first into temporal
stages (such as conceptual design, preliminary design, and detailed design), then into parallel, discipline-
oriented threads, and then again temporally. Because the model seeks to describe the “as-is” state, existing
work breakdown structure (WBS) documentation could provide a useful input. Be sure to account for
important decision gates and milestones.
The intent of process decomposition is not to promote reductionist thinking. IPM does not treat each
PE in isolation; it emphasizes integration and verification, and the emergence and validation of holistic
process behavior. Decomposition provides a “structural model” [Hubbard, 2009] of the process
architecture [Browning and Eppinger, 2002], “the structure of a process—embodied in its activities and
their interactions with each other and the process environment—and the principles guiding its design and
evolution” [Eppinger and Browning, 2012]. As with setting process boundaries, effective process
architecting and decomposition remain somewhat of an art. Decomposition choices reflect assumptions
about the structure of the work at the next-lower level; subsequent integration will force reconsideration of
such assumptions.
Heuristic 1: Each decomposed, “parent” PE should contain 2-20 “children,” typically between 8-12.
(The terms “parent” and “child” refer to relatively higher- and lower-level PEs in the decomposition,
respectively.) Two is the minimum number of children for decomposition, whereas 20 is a rough upper
bound on a manageable group of elements—e.g., the number of flowchart boxes fitting on a typical page
or screen. If more than 20 children seem necessary, look for ways to consolidate into groups while
anticipating further decomposition later (which would describe the 2-20 children as 4-400 “grandchildren”).

10
We will consider further decomposition in section 3.5, but, in this initial decomposition, we seek to define
just the immediate next level, usually about 8-12 PEs constituting the overall process.
Heuristic 2: At each level of decomposition, define PEs of similar size (at least within an order of
magnitude) in terms of required work. For example, avoid decomposing into ten children if five require
1,000 labor hours each and five require 100,000 labor hours each. At high levels of the model, many PEs
may culminate in milestone events, which may not require much direct work in themselves; hence, they
might not be listed as distinct PEs until lower levels of the model. For example, a high-level PE called
“Create Preliminary Design” could reasonably include a preliminary design review event.
Heuristic 3: PD consists of definable actions, decisions, and interactions. Wherever possible,
decompose PEs into discrete activities with clear results. Avoid defining ongoing, “level of effort” PEs that
span the PD project. Seek to punctuate ongoing work such as stakeholder engagement, SE, and project
management into discrete PEs that produce specific results at various points in the PD process. This
guidance becomes more essential at deeper levels of decomposition.
Heuristic 4: Many SE and project management activities occur throughout the PD process, so they
should not be withdrawn into a separate SE PE. For example, if activities such as defining requirements,
planning and managing technical effort and performance, trade studies, and verification, validation, and
testing (VVT) occur as part of every subsystem and component design process, then that is where they
should reside. Rather than exist as a stand-alone, parallel PE, infuse SE activities into all appropriate PEs.
3.2.2 Assign PE Owners
After decomposing the overall process into 2-20 children, the CMT must designate the owner of each.
This owner should be the executive or high-level manager responsible for the work performed within the
PE. Formal, preassigned organizational responsibility for the work will usually facilitate this determination.
If the process decomposition does not align with the organization’s existing structure, however, the CMT
may have to arrange new ownership. For now, it is important to establish a point of contact for the
delegation of further process definition. Ideally, a functional/core representative responsible for the
“standard” work should own a PE. While leading the modeling work for their PE, functional owners should
consult with those actually doing the work on any ongoing projects.
Heuristic 5: As much as possible, (1) assign each PE at a given model level to a different owner, and
(2) assign ownership at the lowest possible organizational level with purview over the work. For example,
if a single director oversees several same-level PEs, assign each of them to a different senior manager
(reporting to the director) rather than just assigning all of them to the director.
The reason for assigning PE owners during this early step is to facilitate decentralized, distributed
process modeling [Browning et al., 2006]. PD process models quickly become complex and complicated
[Ramasesh and Browning, 2014]. The amount of information to gather and manage will simply overwhelm
the CMT (and the overall organization may not “buy in” to its result). It is therefore better to have many
11
people (those closest to the actual work) each contributing a little to the model, with the CMT providing a
leadership and integration role. Expecting the CMT alone to model the entire PD process of a large, complex
organization creates an enormous bottleneck of effort and expertise, resulting in shallow models. In
addition, cascading responsibility for PEs throughout the organization enables faster updating and
maintenance—the further capture of new information as it becomes available. Distributing the IPM work
throughout the organization helps overcome some of the main reasons why many PD process modeling
initiatives have provided very limited long-term value.
3.2.3 Summary of Step 2
For the initial completion of IPM step 2, the CMT should have as its output a set of 2-20 (probably 8-
12) Level 2 PEs that represent the entire PD process. Each PE should have an assigned owner who will
further define it in step 3. (Section 3.5 will discuss further decomposition into lower levels.)
3.3 IPM Step 3: Describe the PEs and Deliverables 3.3.1 Step 3.1: Describe PEs’ Basic Attributes
In this IPM step, each PE owner begins to capture and describe attributes of the work. In most cases,
especially for high-level PEs (level numbers less than five), this owner will act more as a leader who
assembles his or her own small team of modelers, which will need some of the process modeling skills
epitomized in the CMT. For this reason, the CMT should have qualified PD process modeling consultants
available to assist each PE owner and serve as a facilitator for his or her modeling team.
The third column of Table 1 lists many PE attributes, but not all of these require initial capture. Table
2 provides guidance for capturing the foundational ones. To decompose a PE (break down its work) and
gather the relevant information, the PE owner’s modeling team may need to call upon additional subject
matter experts (SMEs). As this work proceeds, the CMT must guide PE owners to ensure consistency within
their PE attributes—e.g., between typical role and resource amounts and Duration measures.
Experienced modelers of processes will recognize that this sub-step involves creating a supplier-input-
process-output-customer (SIPOC) chart for each level 2 PE. PE owners may indeed use such a format if
they desire. However, it is imperative that they not allow the information to reside only on electronic paper,
slides, or spreadsheets: it must go into the IPMIS.
3.3.2 Step 3.2: Describe Deliverables’ Basic Attributes
Next, the PE owner’s team begins to capture and describe the attributes of the work products, the
deliverables flowing to and from the PEs (the “arrows” among the “boxes”). Unfortunately, deliverables
are underrepresented in most process models, especially those based on flowcharts [Browning, 2002]. As
an essential part of any systems-oriented process model [Parris, 1996; Howard, 1998; Lykins et al., 1998;
Halpern, 1999], however, the deliverables (the process system’s “interfaces”) provide the basis for the
architectural patterns of workflow and overall process behaviors. For each of the PE’s inputs and outputs
identified in Step 3.1, collect the basic attributes in Table 3. Each deliverable has one or more key criteria
12
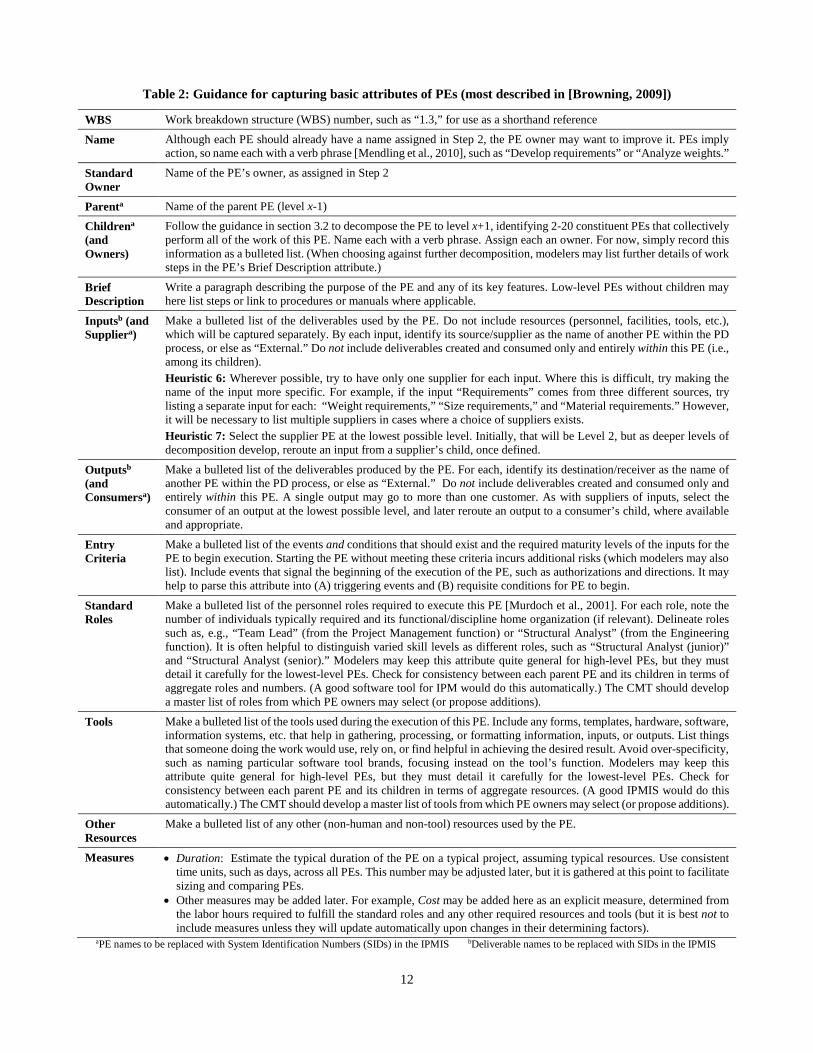
Table 2: Guidance for capturing basic attributes of PEs (most described in [Browning, 2009])
WBS Work breakdown structure (WBS) number, such as “1.3,” for use as a shorthand reference
Name Although each PE should already have a name assigned in Step 2, the PE owner may want to improve it. PEs imply action, so name each with a verb phrase [Mendling et al., 2010], such as “Develop requirements” or “Analyze weights.”
Standard Owner
Name of the PE’s owner, as assigned in Step 2
Parenta Name of the parent PE (level x-1)
Childrena (and Owners)
Follow the guidance in section 3.2 to decompose the PE to level x+1, identifying 2-20 constituent PEs that collectively perform all of the work of this PE. Name each with a verb phrase. Assign each an owner. For now, simply record this information as a bulleted list. (When choosing against further decomposition, modelers may list further details of work steps in the PE’s Brief Description attribute.)
Brief Description
Write a paragraph describing the purpose of the PE and any of its key features. Low-level PEs without children may here list steps or link to procedures or manuals where applicable.
Inputsb (and Suppliera)
Make a bulleted list of the deliverables used by the PE. Do not include resources (personnel, facilities, tools, etc.), which will be captured separately. By each input, identify its source/supplier as the name of another PE within the PD process, or else as “External.” Do not include deliverables created and consumed only and entirely within this PE (i.e., among its children). Heuristic 6: Wherever possible, try to have only one supplier for each input. Where this is difficult, try making the name of the input more specific. For example, if the input “Requirements” comes from three different sources, try listing a separate input for each: “Weight requirements,” “Size requirements,” and “Material requirements.” However, it will be necessary to list multiple suppliers in cases where a choice of suppliers exists. Heuristic 7: Select the supplier PE at the lowest possible level. Initially, that will be Level 2, but as deeper levels of decomposition develop, reroute an input from a supplier’s child, once defined.
Outputsb (and Consumersa)
Make a bulleted list of the deliverables produced by the PE. For each, identify its destination/receiver as the name of another PE within the PD process, or else as “External.” Do not include deliverables created and consumed only and entirely within this PE. A single output may go to more than one customer. As with suppliers of inputs, select the consumer of an output at the lowest possible level, and later reroute an output to a consumer’s child, where available and appropriate.
Entry Criteria
Make a bulleted list of the events and conditions that should exist and the required maturity levels of the inputs for the PE to begin execution. Starting the PE without meeting these criteria incurs additional risks (which modelers may also list). Include events that signal the beginning of the execution of the PE, such as authorizations and directions. It may help to parse this attribute into (A) triggering events and (B) requisite conditions for PE to begin.
Standard Roles
Make a bulleted list of the personnel roles required to execute this PE [Murdoch et al., 2001]. For each role, note the number of individuals typically required and its functional/discipline home organization (if relevant). Delineate roles such as, e.g., “Team Lead” (from the Project Management function) or “Structural Analyst” (from the Engineering function). It is often helpful to distinguish varied skill levels as different roles, such as “Structural Analyst (junior)” and “Structural Analyst (senior).” Modelers may keep this attribute quite general for high-level PEs, but they must detail it carefully for the lowest-level PEs. Check for consistency between each parent PE and its children in terms of aggregate roles and numbers. (A good software tool for IPM would do this automatically.) The CMT should develop a master list of roles from which PE owners may select (or propose additions).
Tools Make a bulleted list of the tools used during the execution of this PE. Include any forms, templates, hardware, software, information systems, etc. that help in gathering, processing, or formatting information, inputs, or outputs. List things that someone doing the work would use, rely on, or find helpful in achieving the desired result. Avoid over-specificity, such as naming particular software tool brands, focusing instead on the tool’s function. Modelers may keep this attribute quite general for high-level PEs, but they must detail it carefully for the lowest-level PEs. Check for consistency between each parent PE and its children in terms of aggregate resources. (A good IPMIS would do this automatically.) The CMT should develop a master list of tools from which PE owners may select (or propose additions).
Other Resources
Make a bulleted list of any other (non-human and non-tool) resources used by the PE.
Measures • Duration: Estimate the typical duration of the PE on a typical project, assuming typical resources. Use consistent time units, such as days, across all PEs. This number may be adjusted later, but it is gathered at this point to facilitate sizing and comparing PEs.
• Other measures may be added later. For example, Cost may be added here as an explicit measure, determined from the labor hours required to fulfill the standard roles and any other required resources and tools (but it is best not to include measures unless they will update automatically upon changes in their determining factors).
aPE names to be replaced with System Identification Numbers (SIDs) in the IPMIS bDeliverable names to be replaced with SIDs in the IPMIS

13
(KCs) that characterize its value to recipient(s)—i.e., customer value [Browning, 2003]. If needed for the
purpose at hand, modelers may also capture any of the other attributes in the last column of Table 1.
Table 3: Guidance for capturing basic attributes of deliverables (most described in [Browning, 2009])
Name Check the name given to each deliverable in Step 3.1 to ensure it is a noun phrase, such as “Size requirements” or “Weight estimates.” It may be helpful to preface the name with a hierarchical identification number, such as “D2,” for use as a shorthand reference. In some situations, it may be necessary to capture more than one name for a deliverable (“also known as”), although it is best to agree and standardize on one name.
Suppliera Name of the deliverable’s producer/source/supplier (already available from Step 3.1); use the name of another PE in the PD process, or else write “External—xxx,” where “xxx” names a source outside the PD process, such as the final customer, a corporate office, an advanced research group, marketing, etc.
Consumersa Name(s) of the deliverable’s destination/receiver (already available from Step 3.1) ; use the name of another PE in the PD process, or else write “External—xxx,” where “xxx” names a consumer outside the PD process, such as the final customer, a corporate office, the production process, etc.
Key Criteria (KCs) and Measures of Effectiveness (MoEs)
Make a bulleted list of the criteria by which the customers judge the effectiveness, quality, and usability of the deliverable—e.g., “Size,” “Weight,” etc. Always include “Availability,” the time in the PD project when the deliverable becomes available, as a KC. KCs are similar to, and sometimes known as, critical-to-quality (CTQ) characteristics or key performance indicators (KPIs). One to five KCs typically suffice. For each KC, make a bulleted list of one or more ways to measure its performance—e.g., days for Availability, centimeters for Size, kilograms for Weight, etc. Each KC may also have associated estimates of its “Accuracy,” “Precision,” “Maturity,” “Completeness,” “Confidence” [e.g., Shapiro et al., 2016], etc.
aPE names to be replaced with System Identification Numbers (SIDs) in the IPMIS
This IPM step decomposes the overall PD process to Level 3, describing it in terms of 4-400 PEs. The
owner of each of the 2-20 PEs at Level 2 will now have defined their PE in terms of the attributes in Table
2 and their PE’s input and output deliverables in terms of the attributes in Table 3.
3.4 IPM Step 4: Integrate the Model IPM step 2 distinguished the “puzzle pieces” that depict the PD process at Level 2, and step 3 then
defined the content and shape of each piece. Now it is time to put the Level 2 puzzle together, making sure
the pieces fit. However, many potential disconnects among the PEs make process integration non-trivial.
Figure 4 gives an example of two PEs, each with defined input and output deliverables. At the integration
step, the two PE owners realize (perhaps via prompting from the IPM software tool or the CMT) that the
output “Preliminary Concept” is really the same thing as the input called “Initial Concept.” This conclusion
causes the two deliverables to become one, whose owners must negotiate its name and attributes (Table 3)
[Scherr, 1993]. Different names for deliverables are only one of many potential problems encountered at
this step. Orphan deliverables (no agreed supplier or customer) are also common. See [Browning, 2002,
2014] for an extensive list of integration challenges and further examples. Ideally, the IPMIS will have
basic AI to flag obvious integration issues (such as where input-output lists among suppliers and customers
do not match).

14
Figure 4: Example of process integration between two PEs [Adapted from Negele et al., 1999]
Many process modeling efforts tend to bog down at this step, because making time for discussions and
negotiations among the PE owners is cumbersome. This is time well spent, however, and it is where IPM
starts to pay dividends in the organization [Pall, 1999]. IPM serves as an integrative mechanism for
streamlining coordination in future projects and helps instill a customer-value perspective throughout the
PD process. It also unearths latent information in the organization about the process as a system—how PEs
(which may be well described in themselves) work together to produce overall results—the “white space”
interfaces ignored by many other modeling approaches. Nevertheless, managers can reduce the required
efforts: they can approach integration discussions in various ways, some less effort-intensive than others.
Heuristic 8: Begin with minimal-effort, asynchronous tools such as e-mail prompts and web portals,
which alert PE owners to integration issues and allow them to make obvious corrections and enhancements.
Save effort-intensive, synchronous tools such as face-to-face meetings only for difficult issues, and ensure
that such meetings proceed efficiently.
The process architecture emerges as the co-product of the decomposition in IPM step 2 and the
integration in step 4. It now becomes possible to identify architectural patterns such as those formed by
dependent, independent, and interdependent PEs. (We will discuss interdependent PEs further in IPM step
5.) Visualizing such patterns becomes easier with representations such as a design structure matrix (DSM)
[Eppinger and Browning, 2012]. The DSM also provides an advantageous format for highlighting
integration status (e.g., red or green shadings in the off-diagonal cells). PE and deliverable attributes may
also spawn conditional or contingent relationships, such as when an input may come from one supplier or
another, or when an output may go to one receiver or another. The Inputs, Outputs, and Entry Criteria
attributes of PEs should note these situations.
Typically, process integration will reveal problems with previous definitions of PEs and deliverables.
Where needed, adjust both accordingly, and/or add new ones. Clearly, changes to the process model will
occur and eventually require formal control. An appropriate IPMIS is essential for automating simple
updates, catching disconnects caused by changes, and alerting affected PE owners.
Upon completion of IPM step 4, each deliverable among the Level 2 PEs should be confirmed by its
suppliers and consumers. Both should agree on its name and other attributes (Table 3).
15
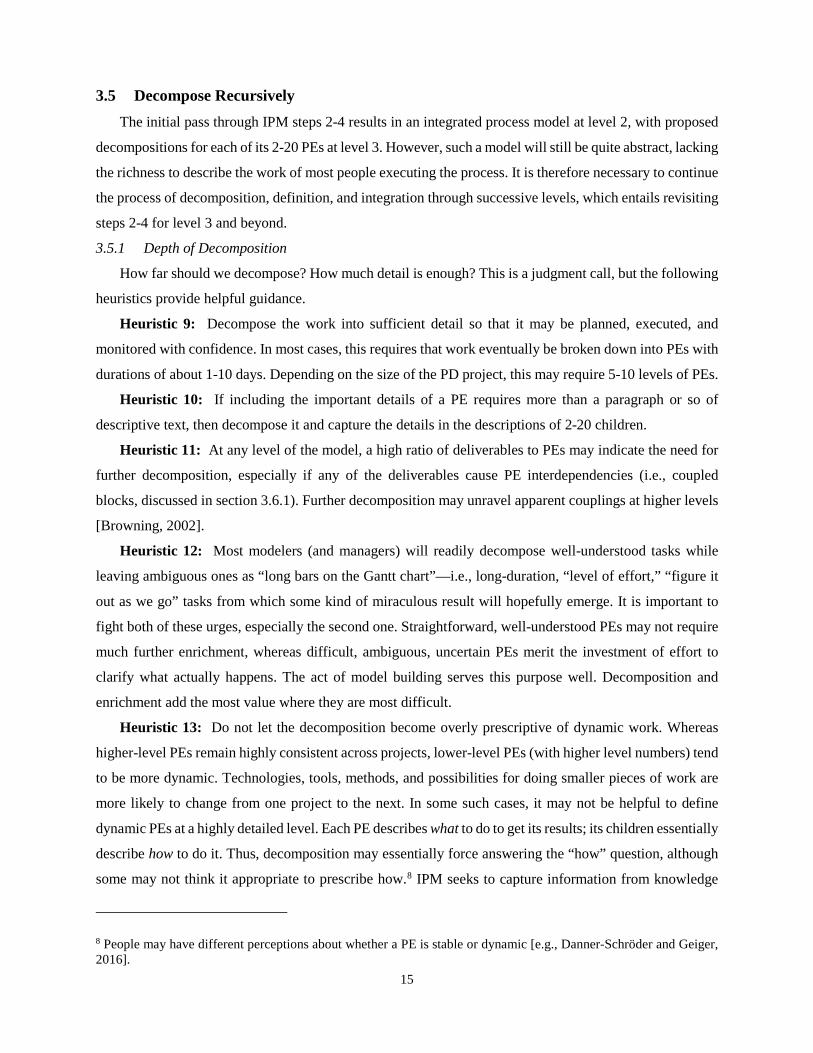
3.5 Decompose Recursively The initial pass through IPM steps 2-4 results in an integrated process model at level 2, with proposed
decompositions for each of its 2-20 PEs at level 3. However, such a model will still be quite abstract, lacking
the richness to describe the work of most people executing the process. It is therefore necessary to continue
the process of decomposition, definition, and integration through successive levels, which entails revisiting
steps 2-4 for level 3 and beyond.
3.5.1 Depth of Decomposition
How far should we decompose? How much detail is enough? This is a judgment call, but the following
heuristics provide helpful guidance.
Heuristic 9: Decompose the work into sufficient detail so that it may be planned, executed, and
monitored with confidence. In most cases, this requires that work eventually be broken down into PEs with
durations of about 1-10 days. Depending on the size of the PD project, this may require 5-10 levels of PEs.
Heuristic 10: If including the important details of a PE requires more than a paragraph or so of
descriptive text, then decompose it and capture the details in the descriptions of 2-20 children.
Heuristic 11: At any level of the model, a high ratio of deliverables to PEs may indicate the need for
further decomposition, especially if any of the deliverables cause PE interdependencies (i.e., coupled
blocks, discussed in section 3.6.1). Further decomposition may unravel apparent couplings at higher levels
[Browning, 2002].
Heuristic 12: Most modelers (and managers) will readily decompose well-understood tasks while
leaving ambiguous ones as “long bars on the Gantt chart”—i.e., long-duration, “level of effort,” “figure it
out as we go” tasks from which some kind of miraculous result will hopefully emerge. It is important to
fight both of these urges, especially the second one. Straightforward, well-understood PEs may not require
much further enrichment, whereas difficult, ambiguous, uncertain PEs merit the investment of effort to
clarify what actually happens. The act of model building serves this purpose well. Decomposition and
enrichment add the most value where they are most difficult.
Heuristic 13: Do not let the decomposition become overly prescriptive of dynamic work. Whereas
higher-level PEs remain highly consistent across projects, lower-level PEs (with higher level numbers) tend
to be more dynamic. Technologies, tools, methods, and possibilities for doing smaller pieces of work are
more likely to change from one project to the next. In some such cases, it may not be helpful to define
dynamic PEs at a highly detailed level. Each PE describes what to do to get its results; its children essentially
describe how to do it. Thus, decomposition may essentially force answering the “how” question, although
some may not think it appropriate to prescribe how.8 IPM seeks to capture information from knowledge
8 People may have different perceptions about whether a PE is stable or dynamic [e.g., Danner-Schröder and Geiger, 2016].
16
about PD work, but some of its smaller details may be worth it. As this heuristic may conflict with the
previous one, however, modelers should not invoke it lightly, merely for the sake of avoiding work. Usually
it is still important to know how work currently occurs, even in the face of impending changes.
Heuristic 14: When it seems like time to stop decomposing, go one level deeper to prove it. Most
process models end decomposition prematurely. Having even an unofficial description of the next-lower
level of work helps to understand the higher level better.
Heuristic 15: Any portion of work specified by a formal standard, regulation, directive, or policy
usually merits distinction from other work.
As the modeling reaches deeper levels, process modelers will rely less on general knowledge and
existing process documentation and more on interviews, real-time observations, recorded event logs [e.g.,
van der Aalst, 2010], and parameterized product models [e.g., Black et al., 1990]. Go to where people are
actually doing the work. Hess et al. [2012] discussed some techniques for helping “end users” articulate
their activities. Ask them “what,” “how,” and “why” questions. Look at the interfaces among the designed
product components and their implications for design decisions and problem solving. Identify activities for
defining, analyzing, evaluating, selecting, assessing, and reporting designs. Remind everyone to focus on
describing the “as-is” process (while noting their great ideas for improving the process as a separate PE
attribute—see section 4.5). Descriptive process modeling is discovery-driven. At this stage in the modeling,
it is fine to use innovative ways to discover information about how work is done, but not to jump to trying
to innovate better ways of doing it.
Heuristic 16: Seek to distinguish “subroutine” PEs—i.e., sub-processes or activities which occur in
more than one time or place in the PD process. For example, several parts of the PD process may have their
own requirements gathering, design review, configuration management, or risk management activities.
Keep these instances separate in the model while noting their potential commonality, because defining each
such PE distinctly within its area facilitates later opportunities for consolidation. Subroutine PEs do not
tend to become prevalent until lower levels of decomposition, however.
Each complete level in the PE holarchy9 is actually a full system model, describing the entire PD
process in a particular amount of detail. Therefore, while a WBS or PE directory tree may depict the mere
hierarchical decomposition, observers should not get the wrong impression from such a partial view. As
noted with respect to Figure 3, not all PEs require equal amounts of enrichment; deeper levels of the PD
process decomposition may be incomplete. For example, level 5 might be complete, with only selected PEs
9 The PEs described in the generalized modeling framework share many properties of holons. “A holon is a system that is an evolving self-organizing dissipative structure, composed of other holons, whose structures exist at a balance point between chaos and order.” A holarchy is “a hierarchy of self-regulating holons that function first as autonomous wholes in supra-ordination to their parts, secondly as dependent parts in sub-ordination to controls on higher levels, and thirdly in coordination with their local environment.” (Wikipedia)
17
further defined at levels 6, 7, or below. It is also possible to work with a hierarchy of deliverables, as large
deliverables break into sections, such as in the requirements example mentioned in Heuristic 5 (Table 2).
3.5.2 Deliverable “Pull Down”
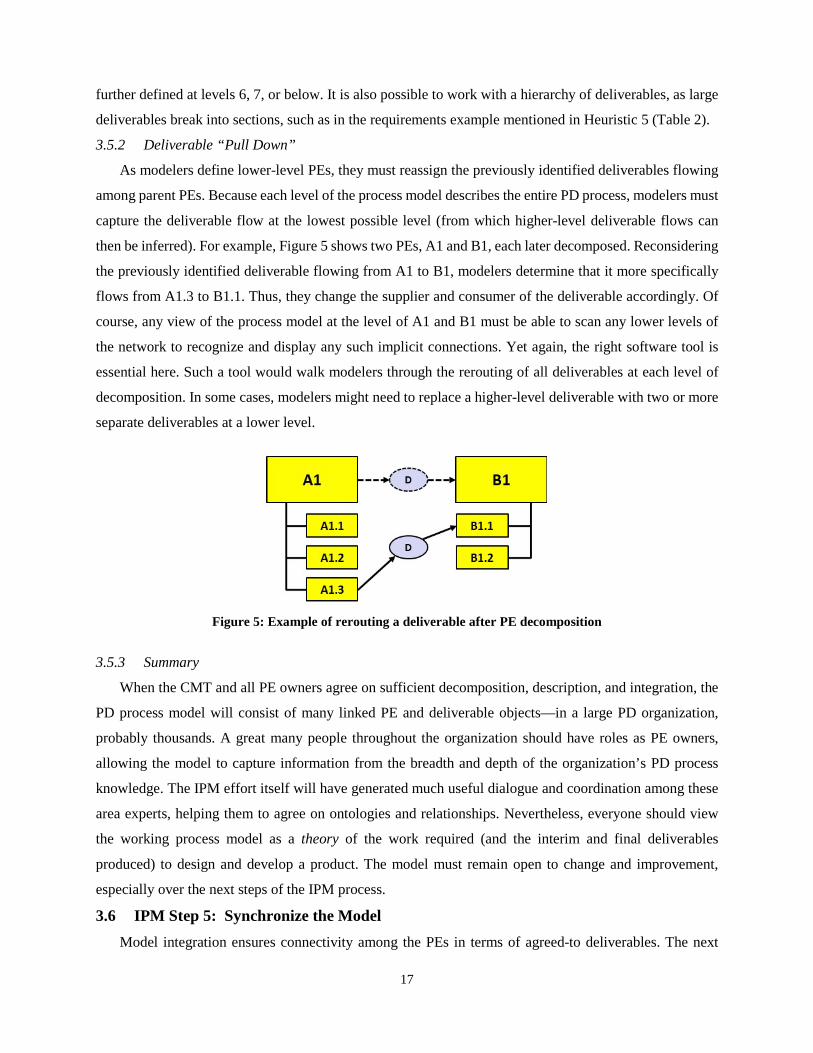
As modelers define lower-level PEs, they must reassign the previously identified deliverables flowing
among parent PEs. Because each level of the process model describes the entire PD process, modelers must
capture the deliverable flow at the lowest possible level (from which higher-level deliverable flows can
then be inferred). For example, Figure 5 shows two PEs, A1 and B1, each later decomposed. Reconsidering
the previously identified deliverable flowing from A1 to B1, modelers determine that it more specifically
flows from A1.3 to B1.1. Thus, they change the supplier and consumer of the deliverable accordingly. Of
course, any view of the process model at the level of A1 and B1 must be able to scan any lower levels of
the network to recognize and display any such implicit connections. Yet again, the right software tool is
essential here. Such a tool would walk modelers through the rerouting of all deliverables at each level of
decomposition. In some cases, modelers might need to replace a higher-level deliverable with two or more
separate deliverables at a lower level.
Figure 5: Example of rerouting a deliverable after PE decomposition
3.5.3 Summary
When the CMT and all PE owners agree on sufficient decomposition, description, and integration, the
PD process model will consist of many linked PE and deliverable objects—in a large PD organization,
probably thousands. A great many people throughout the organization should have roles as PE owners,
allowing the model to capture information from the breadth and depth of the organization’s PD process
knowledge. The IPM effort itself will have generated much useful dialogue and coordination among these
area experts, helping them to agree on ontologies and relationships. Nevertheless, everyone should view
the working process model as a theory of the work required (and the interim and final deliverables
produced) to design and develop a product. The model must remain open to change and improvement,
especially over the next steps of the IPM process.
3.6 IPM Step 5: Synchronize the Model Model integration ensures connectivity among the PEs in terms of agreed-to deliverables. The next

18
IPM step, process model synchronization, sorts out groups of interdependent PEs and works out temporal
disconnects among the PEs, both horizontally (within levels) and vertically (across levels) in the process
architecture. It requires gathering temporal attributes of each PE and deliverable, and analyzing and
adjusting them as needed. It moves the PD process model another step closer to reality, making it useful
for helping plan and manage future PD projects. It also helps verify and validate the model—causes further
advanced in later IPM steps.
3.6.1 Dealing with Iterations and Rework
PD processes contain both planned and unplanned iterations of PEs. Eckert [2006] distinguished (1)
repeating a PE to accomplish a different purpose from (2) repeating it to refine a design and from (3)
reworking it to fix a problem. Planned iterations include design cycles or spiral development, where
successive passes through similar activities enhance and refine the product design. However, all such work
actually occurs in linear time, so modelers frequently ask if and how they should “unroll” planned iterations.
This becomes especially challenging when the number of iterations is not predetermined. There are
arguments for and against unrolling the iterations—i.e., attempting to distinguish each iteration temporally,
as separate PEs (each of which may consist of several PE children). Unrolling becomes more helpful when
the iterations are more substantially different from each other, and when the number of iterations is easier
to predict. Unrolling is recommended at higher levels of the model—e.g., major design phases or sub-
phases—to facilitate joint reviews and design integration activities. Leaving iterations as coupled groups
of interdependent PEs [Eppinger and Browning, 2012] becomes more necessary, however, when iterations
are poorly understood and breaking them down would require further, specific investments in process
understanding and improvement. Estimating the duration of a group of coupled PEs becomes much more
difficult, however.
Unplanned iterations and rework occur due to several reasons, such as: poor PE sequencing (creating
deliverables later than other PEs need them); not supplying all of the needed deliverables; not transmitting
a deliverable clearly, promptly, or appropriately; later changes to PE inputs; and, of course, mistakes
(inadvertently creating defective deliverables) [Lévárdy and Browning, 2009]. Many characteristics of PD
processes make iteration and rework inevitable. The IPM model makes it possible to account for feedback
relationships (cycles or loops in the network structure), desirable or not, although these complicate the
determination of temporal attributes. Although some modelers resist including rework for fear of somehow
legitimizing it, the point of a descriptive model is to capture such situations as they currently exist and set
the stage for later improvements. (Making such improvements, one of the many uses of a process model, is
a topic for elsewhere.)
Heuristic 17: Inasmuch as possible, do not allow planned iterations to show in the top levels of the
model. That is, do not cross major PD phases or stages with feedback loops. Modelers may need to revisit
the choice of decomposition in step 2 to address some instances.
19
3.6.2 Applying the Critical Path Method (CPM)
IPM step 3.1 collected PE duration as a “Measures” attribute (Table 2). Now we add five more
Measures to each PE: Earliest Start Time (EST), Earliest Finish Time (EFT), Latest Start Time (LST),
Latest Finish Time (LFT), and Slack Time. We also use a KC, Availability, for each deliverable. We express
all of these in “PD project time” with identical units (e.g., days). The project begins at time zero, with
various PEs starting and ending and various (internal) deliverables becoming available thereafter. Starting
with only the lowest complete level of the process model,10 apply the CPM (preferably automated by the
IPM software):
1. Estimate the Availability of all “External” input deliverables to the PD process in terms of time after
process start. External inputs required to start the PD process have Availability = 0.
2. For each PE with Availability defined for all input deliverables, set EST equal to the maximum
Availability among its inputs. At least one PE should have EST = 0.
3. For each PE with EST defined, set EFT = EST + Duration, and set the Availability of each of its
output deliverables to its EFT. (Ideally, a software tool would automatically update the Availability
of any deliverable output to equal the EFT of its supplying PE, although modelers could override
this.)
4. Repeat steps 2-3 until all PEs have EST and EFT defined, and all deliverables have Availability
defined.
The maximum EFT among all PEs sets the overall PD project duration. Store this as the Duration Measure
of the root (highest level) PE. Then, to determine LST, LFT, and Slack Time for each PE in the lowest
complete level of the process model, do a backwards pass through the network:
1. For each PE with only “External” consumers of its outputs, set LFT = overall PD project duration.
2. For each PE with LFT defined, set LST = LFT – Duration, and set Slack = LFT – EFT.
3. For each PE with LST defined for all of its successor PEs, set LFT equal to the minimum of the
LSTs of its successors, set LST = LFT – Duration, and set Slack = LFT – EFT.
4. Repeat step 3 until all PEs have EST, LST, and Slack defined.
All PEs with Slack = 0 are defined as critical activities in the network. At least one thread of critical
activities, called the critical path, will run through the network from beginning to end.
3.6.3 Ensuring Vertical and Horizontal Consistency
We now have six temporal measures defined as attributes of each PE at the lowest complete level of
10 To apply the CPM properly at the lowest complete level of the process model, one must account for any implicit deliverables rerouted to lower levels of decomposition. For example, in Figure 4, to implement the CPM at the level of the two parent PEs, one must account for the implicit deliverable between them (explicit among their children) for purposes of calculating availabilities. Note also that the CPM cannot handle feedback loops in the network, so we ignore these temporarily.
20
the process model. At any lower levels, modelers may carefully apply a slightly modified version of the
CPM to subsets of the overall process, bounded by the temporal attributes of the adjacent PEs. At the level
immediately above the lowest complete level, confirm that the Duration of each parent PE equals the
difference between the maximum EFT and minimum EST of its children.11 Update and adjust as needed
for consistency. A useful IPM software tool would automate such consistency checks and flag
discrepancies.
PE owners will likely disagree about many deliverable Availabilities. The CMT must direct
negotiations and adjustments. Drawing upon the example in Figure 4, suppose the owner of the Validate
Concept PE needs the Initial Concept deliverable by day 100, but its Availability = 150 days. These two
PE owners (and probably other affected owners as well) must negotiate the timing. Many possibiliites exist
for working this out, including PE overlapping and crashing (see section 4). These negotiations will
naturally include discussions about roles and resources, which may greatly affect PE durations. However,
at this point, the PEs’ temporal attributes remain somewhat conceptual: actual beginning and end times for
each PE will be set later, when a deployed instance of the process becomes prescriptive. For now, process
synchnonization serves as a reality and feasibility check for the model. Ultimately, actual situations and
historical data provide the best basis for the attributes of the “as-is” PEs and deliverables.
3.6.4 Summary of Step 5
At the end of this IPM step, each PE and deliverable in the PD process model should have realistic
temporal attributes with consistency across the PE holarchy.
3.7 IPM Step 6: Verify and Validate the Model Throughout the process of building a hierarchical and networked model, many checks for accuracy,
consistency, and correctness must occur. The IPM process prompts such confirmations at many points along
the way. Thus, verification is largely an ongoing activity, constantly running in parallel with the previous
steps. Significant validation also occurs as the many PE owners enrich the model with negotiated inputs
and crosscheck the model against their own perceptions (mental models). As workers become accustomed
to the model, their mental models begin to align with it over time. While they may not clearly articulate
information about PE and deliverable attributes when the model is first built, they will be able to contribute
improved information over time, making the model increasingly accurate. Again, the point for now is to
ensure that the model sufficiently matches the reality of the “as-is” situation, while capturing opportunities
for improvement as a separate PE attribute. Further validation will occur later, as the model is used.
Therefore, this step formally involves only asking each PE owner to confirm their PE’s attributes and
11 The CPM ignores feedback loops, so its duration calculations do not account for iterations and rework, which require more advanced estimating methods (see, e.g., [Browning and Eppinger, 2002]). At this point in the IPM process, modelers must make their best estimates of higher-level PE durations, using actual and historical data as well as CPM analyses of lower-level PE networks.
21
confirming that the IPM software tool does not flag any problematic situations (inconsistencies or
disconnects) in the architecture. At the conclusion of this IPM step, the initial PD process model, and the
PD process modeling project, are finished. Process modeling now ceases to be a finite project and gets
added or absorbed into the ongoing operations of the firm. The process model will continue to evolve and
improve, supported by full-time modeling experts who may act as change advisors and approvers,
especially as the model is actively used. Many possibilities exist for using this process model, but these lie
outside the scope of this paper.
4. Advanced Topics The previous section sought to present the IPM steps concisely. However, most complex PD processes
require additional modeling capabilities to capture and represent important characteristics. The IPM
approach accommodates such needs. This section addresses how to deal with several advanced topics.
4.1 Multiple Versions of the Same Basic Activity—PE Modes For several reasons, modelers may need to define alternative ways of accomplishing particular
activities, such as a quick, low-fidelity version and a longer, high-fidelity version, or versions employing
different tools, versions with different resources or roles, versions for different types of customers or
contracts, versions with different inputs or outputs, etc. PE modes provide this capability. Each mode of a
PE has a similar purpose, in general, but different attributes. For example, each of several ways to conduct
a product test—evaluating a simulation model, testing a quickly fabricated prototype, or testing an actual
piece of hardware—may have different inputs, entry criteria, roles, cost, duration, outputs, etc. Hence, a
PE’s mode of execution influences all of its other attributes. A PE may also have one or more specific
iteration or rework modes, which may vary depending on what triggered the rework (i.e., different inputs).
PE modes also provide a way to capture distinct scenarios for “crashing” (faster execution at varied
expense), the use of alternative technologies and tools, and PE versions contingent on varied inputs. For an
example application of PE modes, see [Lévárdy and Browning, 2009].
The Mode attribute distinguishes each version of a PE by providing a distinctive suffix to its name.
Any PE with more than one mode must designate one of them (in this attribute) as the “chief” mode. By
default, all other modes inherit the attributes of the chief mode (and any later changes thereto) except where
overridden. Once a mode’s attribute diverges from its chief, all future changes to that attribute must be
considered across all modes (i.e., they cannot update automatically). To facilitate mode consistency, all of
a PE’s modes should have the same owner. Sometimes it is difficult to decide whether to add a mode to a
PE or rather to define a separate PE, especially in situations of iteration (section 3.6.1). As with many
modeling decisions, modelers may have to revise them later as part of model improvement.
4.2 Conditional or Contingent PEs Modes provide a way to handle many situations with conditional or contingent relationships among

22
PEs, such as when the output of one PE goes to either of two others depending on specified criteria
(sometimes categorized as “or” or “exclusive or” relationships). However, whether employing modes or
not, such situations usually require the use of another PE attribute, “Exit Criteria” (Table 4), to specify the
conditions. Conditional relationships among PEs also characterize many process variants. Methods exist
[e.g., La Rosa et al., 2011] for consolidating as much of the common portion as possible.
4.3 Process Failure Modes and Effects Analysis (FMEA) Process FMEA entails systematically querying each PE—especially PEs providing evaluations, tests,
or reviews—about the consequences of any problematic results. For example, in Figure 5, the output of PE
A1.3 normally flows to B1.1. But what if A1.3 has a problem and cannot produce the normal result? What
will happen if it discovers a flaw in earlier work? Suppose that the effect of such a failure in the process
would be to go back and rework A1.1, in which case the PE owner adds another (conditional) output
deliverable (with A1.1 as its receiver) to represent the undesired rework path. A single PE may have
multiple failure modes, depending on the type of problem it encounters. See [Eppinger and Browning, 2012]
for a discussion of FMEA in the microprocessor design process at Intel. Modelers may capture PE failure
modes explicitly in the attribute, “Potential Traps and Failure Modes” (Table 4).
4.4 Master and Shadow PEs As mentioned in Heuristic 16 (section 3.5), some PEs occur in several places in the PD process—not
even counting iterations, rework, or multiple modes. For example, each of several design areas may have
PEs such as “Manage configuration” or “Manage risk.” Initially, different PE owners and their designees
will define each of these PEs separately. Later, however, the CMT may scan the overall process architecture
to identify similar PEs as candidates for some amount of more centralized management.
A master PE provides the baseline description for all other (shadow) instances of the PE. It includes
reference(s) to any shadow PEs. Only one master PE may exist, although it may have several modes.
Whereas modes distinguish versions of a PE at a particular location in the process architecture, a shadow
PE resides in a separate location in the process architecture. A shadow PE inherits the attributes of the
master PE by default, only capturing the differences from the master PE (e.g., different suppliers and con-
sumers). A shadow PE may have its own modes. Multiple PEs may shadow one master. Whenever a master
or one of its shadow PEs changes, it should trigger a review to see if the changes should propagate to each.
For instance, if a shadow proposes a change, the change might also apply to the master and any other
shadows. The owners of the master and shadow PEs should jointly approve all exceptions and changes.
4.5 Overlapping Activities Natural overlapping (or concurrency) occurs when two or more independent PEs work concurrently;
artificial overlapping occurs when two or more dependent or interdependent PEs do so. This subsection
addresses how to deal with both in the model.

23
So far, we have assumed that deliverables are not available until the completion of its supplying PE,
and that a PE must have all of its input deliverables to start work. Although such assumptions should not
be problematic at lower levels of the model, at higher levels they are too constraining. A PE may not require
some inputs until after its start time, and it may produce some outputs prior to its finish time. Many of these
situations fall into the category of natural overlapping, which modelers may handle by adjusting PE Inputs
and Outputs and deliverable Availability. Where needed, add a sub-attribute to each PE Input, “When
Needed”—the time when the deliverable is needed by the PE, expressed as a percentage of the PE’s
completion (e.g., 0% indicates an input needed to begin the PE, whereas 50% indicates an input needed
only for the second half of the PE). Set all PE Input “When Needed” attributes to 0% by default. Also where
needed, add a sub-attribute to each PE output, “When Ready”—the time when each output is ready,
expressed as a percentage of the PE completed (e.g., 50% indicates an output available after the first half
of the PE, whereas 100% indicates an output available only when the PE is finished). All PE Output “When
Ready” attributes set to 100% by default. Finally, update PE EST, LST, EFT, and LFT measures and
deliverable Availabilities accordingly (a good IPM software tool would do this automatically).
Multilevel modeling greatly helps to address such situations. Just because two PEs overlap at one level
does not imply that all of their children PEs need do so. For example, see Figure 6 and suppose two PEs, A
and B, overlap because A provides a deliverable to B when A is 80% complete and B is 20% complete.
Suppose we decompose each PE into two parts, prior and subsequent to this deliverable. Then, A1 provides
to A2 and B2, but not to B1; B2 depends on A1 and B1, but not A2; artificial overlapping becomes natural
instead. Another example in [Browning, 2002] shows three overlapping PEs whose children may be
executed largely sequentially, demonstrating that decomposition provides a general and preferred way to
handle many situations of overlapping. Modelers may parse deliverables as well as PEs where helpful.
(a) Artificial overlapping (b) Natural overlapping
Figure 6: Changing artificial to natural overlapping ones through further decomposition
4.6 Proceeding “At Risk”
In cases of purely informational inputs (which, in a PD process, is most of them), a PE may often begin
without all of its inputs by making assumptions instead—a degree of freedom that may be helpful or
problematic depending on the situation [Denker et al., 2001; Loch and Terwiesch, 2005]. Starting with
assumptions in lieu of actual inputs causes artificial overlapping, potential rework, and thus risk [Browning

24
and Eppinger, 2002; Meier et al., 2015]. In a descriptive model, it is important to identify situations where
assumptions may serve as proxies, as evinced by dependent PEs proceeding before the actual availabilities
of their input deliverables. Such situations may account for some of the discrepancies between the reported
process and historical data about actual PE start and stop times.
One way to model these effects is to capture an estimate of how easy or difficult it is to make a good
assumption in each case. Modelers should consider factors such as the strength of the PE’s dependency on
the input, the difficulty of estimating the input’s characteristics, and the typical likelihood of the input to
change over time in the PD project [Austin et al., 1996]. As any of these factors increase, so will the risk of
proceeding based on an assumption in lieu of the official input. Comparing the resulting tradeoffs requires
advanced techniques [Browning and Eppinger, 2002; Meier et al., 2015], but this can be saved for later. For
now, add a further description to each of a PE’s Inputs, noting its probability of causing rework if assumed
prematurely.
4.7 Additional PE and Deliverable Attributes Modelers may also enlist other attributes of PEs and deliverables from Table 1. See the guidance in
Table 4 and Table 5. Modelers may choose to add these attributes later, after establishing the base model.
We already mentioned some of these attributes earlier. The footnotes to Tables 2-3 and 4-5 indicate that the
IPMIS will actually capture PE or deliverable System Identification Numbers (SIDs). That is, rather than
listing the names of these objects as the attributes of other objects, the attributes will simply contain the
other objects’ unique (SIDs), which act as pointers to those objects. When the names change, the SIDs will
continue to provide stable links among the objects. The IPM software tool would replace the SIDs with the
latest PE and deliverable names for viewing purposes.
4.8 Formalizing Other Project Domains with Additional Modeling Objects PEs and deliverables form the essential foundation of a process model, and these objects’ attributes link
them to other project domains such as the product/result, organization, tool, and requirement/goal
subsystems [Browning et al., 2006]. However, modelers may want to formalize objects in these other
domains, in which case modelers would replace their names in the PE and deliverable attributes with
pointers/links to these objects. Figure 1 shows a few examples, and Table 6 suggests attributes for each of
seven additional objects (still more could be added). Extending the model in this way makes it much more
than a basic process model and more of a multidomain, project architecture model [Eppinger and
Browning, 2012]. However, the process model provides a solid foundation for managing “organizational
knowledge” about what, how, and when work is done—a foundation upon which many other aspects of a
project may build.
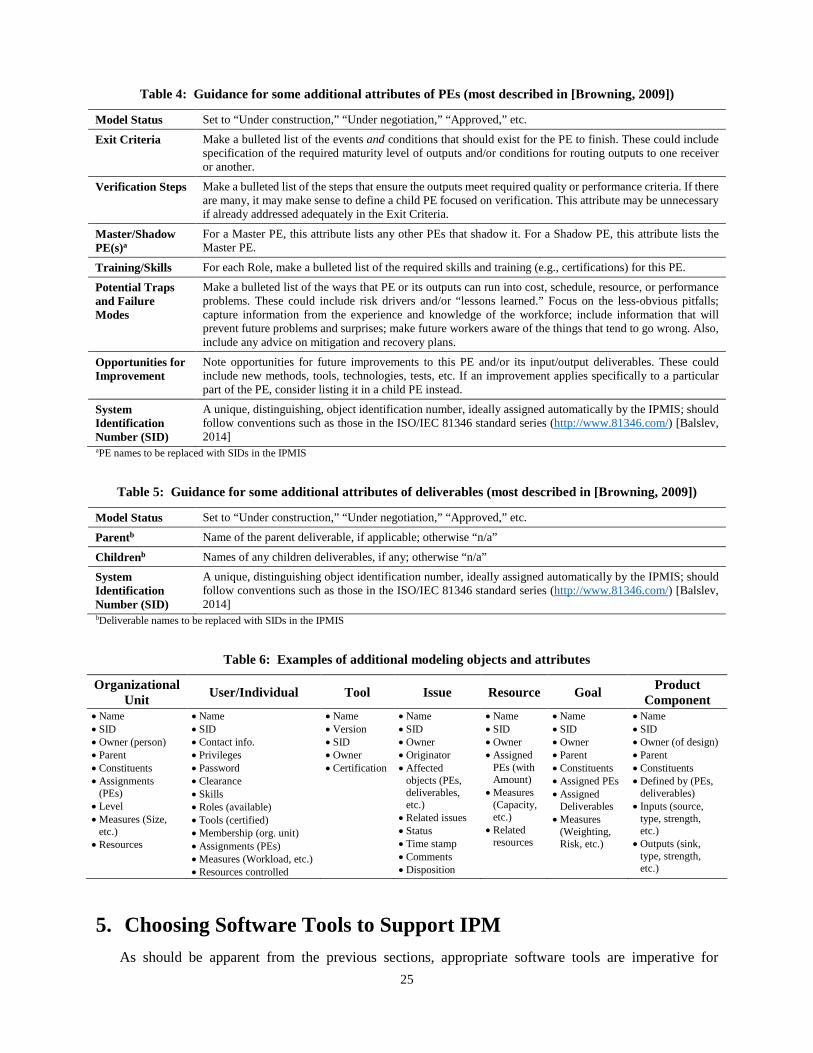
25
Table 4: Guidance for some additional attributes of PEs (most described in [Browning, 2009])
Model Status Set to “Under construction,” “Under negotiation,” “Approved,” etc.
Exit Criteria Make a bulleted list of the events and conditions that should exist for the PE to finish. These could include specification of the required maturity level of outputs and/or conditions for routing outputs to one receiver or another.
Verification Steps Make a bulleted list of the steps that ensure the outputs meet required quality or performance criteria. If there are many, it may make sense to define a child PE focused on verification. This attribute may be unnecessary if already addressed adequately in the Exit Criteria.
Master/Shadow PE(s)a
For a Master PE, this attribute lists any other PEs that shadow it. For a Shadow PE, this attribute lists the Master PE.
Training/Skills For each Role, make a bulleted list of the required skills and training (e.g., certifications) for this PE.
Potential Traps and Failure Modes
Make a bulleted list of the ways that PE or its outputs can run into cost, schedule, resource, or performance problems. These could include risk drivers and/or “lessons learned.” Focus on the less-obvious pitfalls; capture information from the experience and knowledge of the workforce; include information that will prevent future problems and surprises; make future workers aware of the things that tend to go wrong. Also, include any advice on mitigation and recovery plans.
Opportunities for Improvement
Note opportunities for future improvements to this PE and/or its input/output deliverables. These could include new methods, tools, technologies, tests, etc. If an improvement applies specifically to a particular part of the PE, consider listing it in a child PE instead.
System Identification Number (SID)
A unique, distinguishing, object identification number, ideally assigned automatically by the IPMIS; should follow conventions such as those in the ISO/IEC 81346 standard series (http://www.81346.com/) [Balslev, 2014]
aPE names to be replaced with SIDs in the IPMIS
Table 5: Guidance for some additional attributes of deliverables (most described in [Browning, 2009])
Model Status Set to “Under construction,” “Under negotiation,” “Approved,” etc.
Parentb Name of the parent deliverable, if applicable; otherwise “n/a”
Childrenb Names of any children deliverables, if any; otherwise “n/a”
System Identification Number (SID)
A unique, distinguishing object identification number, ideally assigned automatically by the IPMIS; should follow conventions such as those in the ISO/IEC 81346 standard series (http://www.81346.com/) [Balslev, 2014]
bDeliverable names to be replaced with SIDs in the IPMIS
Table 6: Examples of additional modeling objects and attributes
Organizational Unit User/Individual Tool Issue Resource Goal Product
Component • Name • SID • Owner (person) • Parent • Constituents • Assignments
(PEs) • Level • Measures (Size,
etc.) • Resources
• Name • SID • Contact info. • Privileges • Password • Clearance • Skills • Roles (available) • Tools (certified) • Membership (org. unit) • Assignments (PEs) • Measures (Workload, etc.) • Resources controlled
• Name • Version • SID • Owner • Certification
• Name • SID • Owner • Originator • Affected
objects (PEs, deliverables, etc.)
• Related issues • Status • Time stamp • Comments • Disposition
• Name • SID • Owner • Assigned
PEs (with Amount)
• Measures (Capacity, etc.)
• Related resources
• Name • SID • Owner • Parent • Constituents • Assigned PEs • Assigned
Deliverables • Measures
(Weighting, Risk, etc.)
• Name • SID • Owner (of design) • Parent • Constituents • Defined by (PEs,
deliverables) • Inputs (source,
type, strength, etc.)
• Outputs (sink, type, strength, etc.)
5. Choosing Software Tools to Support IPM As should be apparent from the previous sections, appropriate software tools are imperative for
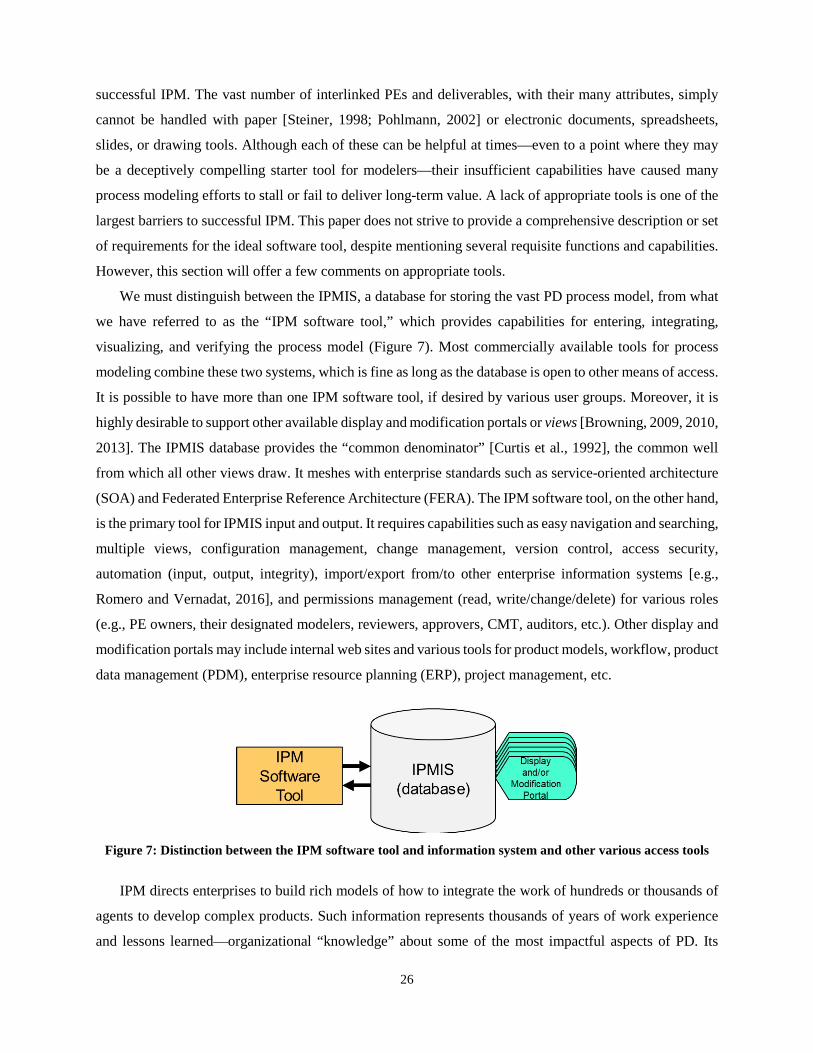
26
successful IPM. The vast number of interlinked PEs and deliverables, with their many attributes, simply
cannot be handled with paper [Steiner, 1998; Pohlmann, 2002] or electronic documents, spreadsheets,
slides, or drawing tools. Although each of these can be helpful at times—even to a point where they may
be a deceptively compelling starter tool for modelers—their insufficient capabilities have caused many
process modeling efforts to stall or fail to deliver long-term value. A lack of appropriate tools is one of the
largest barriers to successful IPM. This paper does not strive to provide a comprehensive description or set
of requirements for the ideal software tool, despite mentioning several requisite functions and capabilities.
However, this section will offer a few comments on appropriate tools.
We must distinguish between the IPMIS, a database for storing the vast PD process model, from what
we have referred to as the “IPM software tool,” which provides capabilities for entering, integrating,
visualizing, and verifying the process model (Figure 7). Most commercially available tools for process
modeling combine these two systems, which is fine as long as the database is open to other means of access.
It is possible to have more than one IPM software tool, if desired by various user groups. Moreover, it is
highly desirable to support other available display and modification portals or views [Browning, 2009, 2010,
2013]. The IPMIS database provides the “common denominator” [Curtis et al., 1992], the common well
from which all other views draw. It meshes with enterprise standards such as service-oriented architecture
(SOA) and Federated Enterprise Reference Architecture (FERA). The IPM software tool, on the other hand,
is the primary tool for IPMIS input and output. It requires capabilities such as easy navigation and searching,
multiple views, configuration management, change management, version control, access security,
automation (input, output, integrity), import/export from/to other enterprise information systems [e.g.,
Romero and Vernadat, 2016], and permissions management (read, write/change/delete) for various roles
(e.g., PE owners, their designated modelers, reviewers, approvers, CMT, auditors, etc.). Other display and
modification portals may include internal web sites and various tools for product models, workflow, product
data management (PDM), enterprise resource planning (ERP), project management, etc.
Figure 7: Distinction between the IPM software tool and information system and other various access tools
IPM directs enterprises to build rich models of how to integrate the work of hundreds or thousands of
agents to develop complex products. Such information represents thousands of years of work experience
and lessons learned—organizational “knowledge” about some of the most impactful aspects of PD. Its

27
enormous value cannot be overstated. Once digitized, it becomes even more valuable to the enterprise as a
basis for better planning, management, further learning, and continuous improvement. It also becomes
easier to steal. Hence, it is imperative that the IPM software tool, IPMIS, and any other viewing tools have
strong access control and other security safeguards, as befitting a business-critical technology. However,
information protection must be balanced with usability: users must be able to find and get what they need
quickly and easily, and model changes must be fast and simple.
6. Guiding and Managing the IPM Project Once initially completed, the process model will be maintained indefinitely within the enterprise as part
of normal operations. However, reaching that point of initial completion requires an appropriately managed
project. Process modeling endeavors are prompted by a particular urge, so it makes sense to understand
well the stakeholders, their preferences, the business case, the available resources, requirements, objectives,
purposes, etc.—the conventional ingredients for chartering the IPM project. The IPM project must be well
planned, in terms of activities, resources, responsibilities, schedules, milestones, reviews, etc. Managers
may use agile practices, such as organizing the IPM steps into sprints. Expert resources must be available
to adjudicate technical issues, such as depth of decomposition. The IPM project should include
implementation activities such as training various users and serving as the new basis for proposal
preparation and project planning. Of course, it is essential to report status, advertise the results and value
added by project, and manage stakeholder expectations. Key status elements may include model levels
completed, PEs defined, interfaces confirmed (integration status), etc.
Francis Bacon famously stated that knowledge is power. Anytime an enterprise seeks to gather tacit
knowledge from its workforce, some power shifts. Workers fear that their knowledge is the only thing that
makes them valuable to the organization. That is a separate debate, yet the IPM project must anticipate the
likelihood that not everyone will cheerfully comply with its endeavors. Political capital will also be
necessary to drive interface negotiations and ensure the IPM work occurs along with so-called “real” work.
Seek allies among groups that benefit from the integration of disparate knowledge, such as systems
engineers, functional “home” organizations, the project management office (PMO), and executives. As
soon as possible, enterprise leadership must clearly demonstrate its commitment to the IPM work and
communicate the message that it is not just the IPM project’s job but, henceforth, an ongoing part of
everyone’s job, a new way of doing business. The IPM project must provide some value quickly—e.g., by
giving people enhanced connectivity along the critical, problematic information flow paths in PD projects.
7. Conclusion Developing complex products requires enormous amounts of skills, and vast amounts of foresight and
experience make the process as efficient and effective as possible. People with the right knowledge are hard
28
to come by, as they retire or leave an enterprise for other opportunities. It is possible to capture and manage
much more of this knowledge using advanced techniques for IPM. Although PD is never performed exactly
the same way twice, most design activities are consistent [Austin et al., 2000; Louis-Sidney et al., 2016]
and may be reused [Davies et al., 2009] across projects. Despite the appeal of agile approaches in many
situations, it is wasteful and dangerous to “muddle through” and “reinvent the wheel” on each PD project.
Increased process standardization can increase value [Browning, 2014] and even improve innovation [Mir
et al., 2016]. PEs are building blocks for the rapid construction of agile processes with prequalified
deliverables [Gonzalez-Perez and Henderson-Sellers, 2008]; they can enable (rather than impede) fast
change and the absorption of better practices.
A previous paper [Browning et al., 2006] laid out key motivations and considerations for PD process
modeling. This paper has followed with detailed guidance for building integrated models that capture and
help manage PD process information. Approaches used for more repetitive business processes are
informative but insufficient to this purpose. Users seek support from process models for various purposes,
use cases, or concerns. Browning [2009] identified and described 28 such purposes (column one of Table
1) across five user groups (process owners; project planners and schedulers; project managers and team
leaders; engineers, designers, and other team members; and process auditors, assessors, and appraisers).
Although IPM can lead to a process model that addresses any of these purposes, it has a knowledge
management (technically, information management) emphasis, accentuating model richness, effectiveness,
versatility, and reusability over sheer model-building efficiency. IPM leads to an integrated, object-
oriented, distributed, flexible, and dynamic model. It helps establish alignment and accountability
throughout the organization. Each PE is a gene in the PD process genome, the essential code describing
what work is done, with what effort, when, and how it connects to other work to culminate in a product
recipe. Its integrated nature supports improved managerial decision making from a systems perspective.
Developing and maintaining this information, in a way that serves all of its users, provides a source of
competitive advantage. The PD process model is the nexus of the people and tools that together provide an
enterprise with the capability [Henderson-Sellers and Ralyté, 2010] to develop products. Its formulation
and ongoing improvement is worthy of the full-time attention of a group in the core organization.
With its focus on IPM, this paper says little explicitly about how to use the resulting model. That is a
topic for future work, whose topics include process-model-based management; rapid project planning and
estimation (scheduling, budgeting, resource loading, staffing, etc.); process analysis, roadmapping,
standardization, tailoring, scaling, and improvement; and process model improvement.
8. References R. Aguilar-Savén, Business Process Modelling: Review and Framework, Int J of Prod Econ 90 (2004), 129-149. S. Austin, A. Baldwin, and A. Newton, A Data Flow Model to Plan and Manage the Building Design Process, Journal
of Engineering Design 7 (1996), 3-25.

29
S. Austin, A. Baldwin, B. Li, and P. Waskett, Integrating Design in the Project Process, Proceedings of the ICE: Civil Engineering 138 (2000), 177-182.
T. Bahill, R. Botta, E. Smith, What Are Levels?, 15th Annual Int Symp of INCOSE, Rochester, NY, Jul 10-14, 2005. H. Balslev, Reference Designation System for Coding System Objects, INCOSE Insight 17 (2014), 28-30. T. Black, C. Fine, and E. Sachs, "A Method for Systems Design Using Precedence Relationships: An Application to
Automotive Brake Systems," MIT Sloan School of Management, Working Paper no.3208, Cambridge, MA, 1990. C. Bock, SysML and UML 2 Support for Activity Modeling, Systems Engineering 9 (2006), 160-186. R.E. Bohn, Measuring and Managing Technological Knowledge, Sloan Management Review 36 (1994), 61-73. T.R. Browning, Process Integration Using the Design Structure Matrix, Systems Engineering 5 (2002), 180-193. T.R. Browning, and S.D. Eppinger, Modeling Impacts of Process Architecture on Cost and Schedule Risk in Product
Development, IEEE Transactions on Engineering Management 49 (2002), 428-442. T.R. Browning, On Customer Value and Improvement in Product Development Processes, Sys Eng 6 (2003), 49-61. T.R. Browning, E. Fricke, and H. Negele, Key Concepts in Modeling Product Development Processes, Systems
Engineering 9 (2006), 104-128. T.R. Browning, and R.V. Ramasesh, A Survey of Activity Network-Based Process Models for Managing Product
Development Projects, Production & Operations Management 16 (2007), 217-240. T.R. Browning, The Many Views of a Process: Towards a Process Architecture Framework for Product Development
Processes, Systems Engineering 12 (2009), 69-90. T.R. Browning, On the Alignment of the Purposes and Views of Process Models in Project Management, Journal of
Operations Management 28 (2010), 316-332. T.R. Browning, Managing Complex Project Process Models with a Process Architecture Framework, International
Journal of Project Management 32 (2013), 229-241. T.R. Browning, A Role-Playing Game for Teaching about Enterprise Process Integration, Journal of Enterprise
Transformation 4 (2014), 226-250. T.R. Browning, Program Agility and Adaptability, INCOSE Insight 17 (2014), 18-22. P.-J. Courtois, On Time and Space Decomposition of Complex Structures, Communications of the Association for
Computing Machinery 28 (1985), 590-603. B. Curtis, M.I. Kellner, and J. Over, Process Modeling, Communications of the ACM 35 (1992), 75-90. A. Danner-Schröder, and D. Geiger, Unravelling the Motor of Patterning Work: Toward an Understanding of the
Microlevel Dynamics of Standardization and Flexibility, Organization Science 27 (2016), 633-658. A. Davies, D. Gann, and T. Douglas, Innovation in Megaprojects: Systems Integration at London Heathrow Terminal
5, California Management Review 51 (2009), 101-126. S. Denker, D.V. Steward, and T.R. Browning, Planning Concurrency and Managing Iteration in Projects, Project
Management Journal 32 (2001), 31-38. D. Dori, Object Process Methodology, Springer, New York, 2002. P. Drucker, Post-Capitalist Society, Harper Business, New York, 1993. C. Eckert, Generic and Specific Process Models: Lessons From Modelling the Knitwear Design Process, Tools and
Methods of Competitive Engineering (TMCE) Conference, Ljubljana, Slovenia, Apr 18-22, 2006. S. Eppinger, and T. Browning, Design Structure Matrix Methods and Applications, MIT Press, Cambridge, MA, 2012. K. Forsberg, H. Mooz, and H. Cotterman, Visualizing Project Management, Wiley, Hoboken, NJ, 2005. S. Friedenthal, A. Moore, F. Steiner, A Practical Guide to SysML, Elsevier/Morgan Kaufmann, Waltham, MA, 2014. C. Gonzalez-Perez, and B. Henderson-Sellers, A Work Product Pool Approach to Methodology Specification and
Enactment, Journal of Systems and Software 81 (2008), 1288-1305. M. Halpern, Cracking Complexity in Project Management, Computer-Aided Engineering 18 (1999), 56-57. M. Hammer, Seven Insights About Processes, conference The Strategic Power of Process: From Ensuring Survival
to Creating Competitive Advantage, Boston, Mar. 5-6, 2001. B. Henderson-Sellers, and J. Ralyté, Situational Method Engineering: State-of-the-Art Review, Journal of Universal
Computer Science 16 (2010), 424-478. J. Hess, C. Reuter, V. Pipek, and V. Wulff, Supporting End-User Articulations in Evolving Business Processes: A
Case Study to Explore Intuitive Notations and Interaction Designs, Int J of Cooperative Information Systems 21 (2012), 263-296.
P.A. Howard, Deliverable-Oriented Project Management, Project World '98, 1998. D.W. Hubbard, The Failure of Risk Management, Wiley, New York, NY, 2009. M. Klun, P. Trkman, Business Process Management - At the Crossroads, Business Process Management J 24 (2017). M. La Rosa, M. Dumas, A.H.M. ter Hofstede, and J. Mendling, Configurable Multi-perspective Business Process
Models, Information Systems 36 (2011), 313-340.

30
V. Lévárdy, and T.R. Browning, An Adaptive Process Model to Support Product Development Project Management, IEEE Transactions on Engineering Management 56 (2009), 600-620.
C.H. Loch, and C. Terwiesch, Rush and Be Wrong or Wait and Be Late? A Model of Information in Collaborative Processes, Production & Operations Management 14 (2005), 331-343.
L. Louis-Sidney, V. Cheutet, and S. Lamouri, Proposal for a Process Oriented Knowledge Management System (PKMS), International Journal of Product Development 21 (2016), 267-287.
H. Lykins, S. Rose, and P.C. Scott, An Information Model for Integrating Product Development Processes, 8th Annual International Symposium of INCOSE, Vancouver, BC, July 26-30, 1998.
T. Malone, K. Crowston, J. Lee, B. Pentland, C. Dellarocas, G. Wyner, J. Quimby, C. Osborn, A. Bernstein, G. Herman, M. Klein, and E. O'Donnell, Tools for Inventing Organizations: Toward a Handbook of Organizational Processes, Management Sci. 45 (1999), 425-443.
T. Malone, K. Crowston, and G. Herman (Eds.), Organizing Business Knowledge, MIT Press, Cambridge, MA, 2003. O. Marjanovic, and R. Freeze, Knowledge-Intensive Business Process: Deriving a Sustainable Competitive Advantage
through Business Process Management and Knowledge Management Integration, Knowledge & Process Management 19 (2012), 180-188.
B. Matthies, Process Capital: A Synthesis of Research and Future Prospects, Knowledge and Process Management 21 (2014), 91-102.
C. Meier, T.R. Browning, A.A. Yassine, and U. Walter, The Cost of Speed: Work Policies for Crashing and Overlapping in Product Development Projects, IEEE Trans on Engineering Management 62 (2015), 237-255.
J. Mendling, H.A. Reijers, and J. Recker, Activity Labeling in Process Modelling: Empirical Insights and Recommendations, Information Systems 35 (2010), 467-482.
M. Mir, M. Casadesús, and L. Petnji, The Impact of Standardized Innovation Management Systems on Innovation Capability and Business Performance: An Empirical Study, J of Eng and Tech Management 41 (2016), 26-44.
J. Murdoch, J.A. McDermid, and P. Wilkinson, Process Tailoring in Iterative Development, 11th Annual International Symposium of INCOSE, Melbourne, Australia, July 1-5, 2001.
H. Negele, E. Fricke, L. Schrepfer, and N. Härtlein, Modeling of Integrated Product Development Processes, 9th Annual International Symposium of INCOSE, Brighton, UK, June 6-11, 1999, pp. 1253-1261.
B. O’Donovan, T.R. Browning, C.M. Eckert, and P.J. Clarkson, "Design Planning and Modelling," in P.J. Clarkson, and C.M. Eckert (Eds.), Design Process Improvement: A Review of Current Practice, Springer, 2005, pp. 60-87.
G.A. Pall, The Process-Centered Enterprise, St. Lucie Press, New York, 1999. J.H. Panchal, M.G. Fernandez, C.J.J. Paredis, J.K. Allen, and F. Mistree, A Modular Decision-centric Approach for
Reusable Design Processes, Concurrent Engineering 17 (2009), 5-19. H. Park, and M.R. Cutkosky, Framework for Modeling Dependencies in Collaborative Engineering Processes,
Research in Engineering Design 11 (1999), 84-102. K. Parris, Implementing Accountability [in Software Development], IEEE Software 13 (1996), 83-93. L.D. Pohlmann, Web-based Process Documentation – Getting Over the “Paper Mentality” Hurdle, 12th Annual
International Symposium of INCOSE, Las Vegas, NV, 2002. R.V. Ramasesh, and T.R. Browning, A Conceptual Framework for Tackling Knowable Unknown Unknowns in
Project Management, Journal of Operations Management 32 (2014), 190-204. E. Rechtin, Systems Architecting, PTR Prentice Hall, Englewood Cliffs, NJ, 1991. J. Recker, and J. Mendling, The State of the Art of Business Process Management Research as Published in the BPM
Conference: Recommendations for Progressing the Field, Business Info Systems Engineering 58 (2016), 55-72. D. Reinertsen, Lean Thinking Isn't So Simple, Electronic Design 47 (1999), 48. D.G. Reinertsen, Managing the Design Factory, The Free Press, New York, 1997. D. Romero, and F. Vernadat, Enterprise Information Systems State of the Art: Past, Present and Future Trends,
Computers in Industry 79 (2016), 3-13. A.L. Scherr, A New Approach to Business Processes, IBM Systems Journal 32 (1993), 80-98. D. Shapiro, M.D. Curren, and P.J. Clarkson, DPCM: A Method for Modelling and Analysing Design Process Changes
Based on the Applied Signposting Model, Journal of Engineering Design 27 (2016), 785-816. H.A. Simon, The Sciences of the Artificial, MIT Press, Cambridge, MA, 1996. D.M. Steiger, Enhancing User Understanding in a Decision Support System: A Theoretical Basis and Framework,
Journal of Management Information Systems 15 (1998), 199-220. R. Steiner, Process Management for Skeptics (or The Case for Process Management in Modern Naval System
Development), 8th Annual International Symposium of INCOSE, Vancouver, BC, Jul. 26-30, 1998, pp. 897-900. W.M.P. van der Aalst, Process Discovery: Capturing the Invisible, IEEE Computational Intelligence Magazine 5
(2010), 28-41. D.C. Wynn, and P.J. Clarkson, Process Models in Design and Development, Research in Engineering Design (2017).