building envelope in airport regions
TRANSCRIPT

BUILDING ENVELOPE IN AIRPORT REGIONSSustainable Design Graduation Studio: ‘Make some noise Schiphol’
Patrattakorn Wannasawang (Thai) Student number: 4892380
Supervisor by: Dr. ir. Martin Tenpierikir. Arie Bergsma

Chapter 1: Introduction 1
1.1 Research background 2
1.2 Relevance of the research 6
1.2.1 Health relevance 6
1.2.2 Architectural relevance: Urban expansion 7
1.2.3 Economic relevance: Lang usage, value, and sustainability 7
1.3 Problem statement 8
1.4 Research objectives 8
1.5 Research questions 8
1.6 General methodology 8
Chapter 2: Sound, noise, and annoyance 11
2.1 Sound and noise 12
2.1.1 Reflection, absorption, and transmission 12
2.1.2 Traffic noise 13
2.1.3 Aircraft noise 13
2.2 Aircraft noise metrics 14
2.2.1 A and C-weighted sound pressure level 15
2.2.2 Average energy level 16
2.2.3 Average level and time of day 17
2.3 Sound frequency 18
2.3.1 Characteristic of low-frequency noise 18
2.4 Hearing threshold and acceptability limit 19
2.5 Chapter 2 summary 20
Chapter 3: Current aircraft abatement strategies 21
3.1 Aircraft noise reduction policies 22
3.2 Natural means of noise reduction 24
3.3 Artificial means of noise reduction 25
3.3.1 Building orientation 25
Table of content
ii

3.3.2 Urban canyon and building height 25
3.3.3 Roof and facade geometry and ornaments 26
3.3.4 Sound insulation technique 27
3.4 Chapter 3 summary 28
Chapter 4: Introduction to case studies 29
4.1 On-site situation 30
4.1.1 Rijsenhout 30
4.1.2 Bangkok 34
4.2 Chapter 4 summary 38
Chapter 5: Design variations and simulation 39
5.1 Methodology 40
5.1.1 Software and simulation setup 40
5.1.2 Initial result and program reliability 45
5.1.3 First baseline simulation set-up and analysis 45
5.2 Design variations and integral design solution 46
5.2.1 Solid noise barrier 47
5.2.2 Buffer zone and sound insulation 49
5.2.3 Materiality 51
5.3 First simulation result and variations culling 53
5.4 Second simulation 59
5.4.1 Second baseline: simulation set-up 59
5.4.2 Second baseline: results 61
5.4.3 Solid noise barrier: horizontal noise barrier 62
5.4.4 Solid noise barrier: vertical noise barrier 66
5.4.5 Solid noise barrier: slanted noise barrier 71
5.4.6 Buffer zone: winter garden 74
5.4.7 Buffer zone: canopy 75
5.4.8 Materiality: surface treatment 76
5.5 Chapter 5 Summary 78
iii

Chapter 6: Design guideline and cases 80
6.1 General urban guideline 81
6.2 Design cases 83
6.2.1 Rijsenhout design case 83
6.2.2 Bangkok design case 86
6.3 Design strategy in airport region 89
Chapter 7: Conclusion 91
7.1 Conclusion 92
7.2 Limitation of the reserach 93
7.3 Reflection 94
Reference and citation 96
Appendix A: Matric of current abatement strategies and research 99
Appendix B: Detailing for Rijsenhout case 2 104
Appendix C: Detailing for Bangkok case 4 106
iv
Figure 1 Environmental and social impact caused by aviation activities 2
Figure 2 Schematic diagram show the different between propagation path of aircraft and traffic noise in urban area
3
Figure 3a Complaints on aircraft noise annoyance around Schiphol Airport (source: Clo, 2010)
4
Figure 3b The development of aircraft noise emission (source: www.bdl.aero, accessed on 13th Jan., 2020)
4
Figure 4 The transformation of Schiphol AIrport noise contour from 1990 to 2017 (source: Kruize, Driessen, Glasbergen, van Egmond, & Dassen, 2007; Boucsein et al., 2017)
5
Figure 5 Comparing decible scale to the recommend maximum sound pressure for each building activty and the negative healt effect of sound
6
Figure 6a Flowchart of the first simulatioin 9
Figure 6b Flwochart of the second simulation 10
Figure 7 General outline of the research paper 10
Figure 8 The aircraft noise before taking-off (left) when the aircraft is not moving and (right) when the aircraft move at Mach 0.25 (source: Arntzen, 2014)
13
Figure 9 Comparison between A and C-weighted aircraft noise during take-off (source: More, 2011; Sharp et al., 2001)
16
Figure 10 Noise contours of Schiphol Airport 22
Figure 11 The Federation Aviation Administration (FAA) land use noise sensitive matrix (source: The Federal Aviation Administration’s (FAA) Southern Region Airports, 2000)
23
Figure 12 Luchtavenindelingsbesluit (LIB), or the airport allocation law (source: Boucsein et al., 2017)
23
Figure 13 DIfferent in sound intensity during different aircraft event around the building (source: Flore et al., 2017)
25
Figure 14 The influence of builidng height of the propagation path of aircraft noise (source: Lugten, 2018)
26
Figure 15 Influcen of different roof geometries on the propagation of traffic noise to quiet facade (source: Van Renterghem & Botteldooren, 2010)
27
Figure 16 Aerial view of Schiphol airport and Rijsenhout with an imaginary boundary line (source: Google Map, accesed on 19th April, 2020)
31
Figure 17 Noise contour of Schiphol airport in relation to Rijsenhout (source: Boucsein et al., 2017)
31
List of Figures
v

Figure 18 Flight path leaving from Kaagbaan runway 32
Figure 19 Street view at Rijsenhout and the approximate dimension of the housing and canyon size (source: Google Map)
33
Figure 20 General surface materials found in Rijsenhout 33
Figure 21 Aerial view photograph showing the construction of Suvarnabhumi Airport (source: Google Map)
34
Figure 22 Aerial view showing the boundary of Suvarnabhumi Airport and the area most effected by aircraft noise, Lat Krabang district (source: Google Map)
34
Figure 23 Aerial view showing the noise contour of Suvarnabhumi Airport in relation to Lat Krabang district (source: Department of Environmental Quality Promotion, 2011)
35
Figure 24 Diagram showing the statistic of flight movement for each runway at Suvarnabhumi Airport (source: Department of Environmental Quality Promotion, 2011)
35
Figure 25 Showing the location of Chunlamat village and the distance between the flight path approaching the airport from the North
36
Figure 26 The existing condition of Chanlamat village and building typology with rough dimension (source: Google Map)
37
Figure 27 Common material surface found in the Chanlamat neighborhood 37
Figure 28 Initial 3D setup for checking the reliability of the software 41
Figure 29 Location of on-site measurement according to Lugten’s research (source: Google Map)
42
Figure 30 Simplify section of on-site measurement and the locations of the receivers
43
Figure 31 The simulation algorithm used throughout the research 44
Figure 32 The first baseline simulation set-up for the different design variable of the building.
46
Figure 33 Section drawing of variation A0 with receiver location 53
Figure 34 Section drawing of variation D1-1 with receiver location 57
Figure 35 The second baseline simulation set-up, with various canyons dimension
59
Figure 36 Panel dimension of each design variation with rough façade surface 60
Figure 37 Location of each receivers with label of baseline scenarion variation A0
61
Figure 38 Different shielding effect, or shadow zone, created by the building with source at different position
62
vi

Figure 39 The ΔLAmax between different roof geometries in comparison to the baseline scenario, A0
63-64
Figure 40 Conceptual sound propagation path to the receiver on exposed and quiet facade
65
Figure 41 The Conceptual sound propagation path of source at different position and angle of incidence
65
Figure 42a The ΔLAmax between different façade geometries in comparison to the baseline scenario, A1
66
Figure 42b The ΔLAmax between different façade geometries in comparison to the baseline scenario, A1
67
Figure 42c The ΔLAmax between different façade geometries in comparison to the baseline scenario, A1
68
Figure 43 Conceptual sound propagation path and scattering effect cause by the extrusion and protrusion on the facade
69
Figure 44 Conceptual sound propagation path between variation A1 and variation B3-1a at two source positions
70
Figure 45 Conceptual sound propagation path showing the scattering effect of façade on aircraft source at overhead position
70
Figure 46 The ΔLAmax between variation C1-1a to A0 and other variation of type C to C1-1a
71-72
Figure 47 The additional subvariant of variation C1-1a 72
Figure 48 Conceptual sound propagation path showing the scattering effect of slanted barrier of variation C2-1
73
Figure 49 Diagram showing the shadow created by variation D1-1 74
Figure 50 The ΔLAmax at each receiver positions between variation D1-1 and A0 74
Figure 51 The ΔLAmax at each receiver positions between variation E1 and A0 75
Figure 52 Diagram showing the shadow created by variation E1 76
Figure 53 Chart showing the average sound reduction when different surface materials were used for aircraft position of Rijsenhout
76
Figure 54 Chart showing the average sound reduction when different surface materials were used for aircraft position of Bangkok
77
Figure 55 Chart showing the different in sound reduction when surface materials were applied at different location for both Rijsenhout and Bangkok cases
78
Figure 56 General guideline for urban planning according to different angle of incidence (source position) and the shape of the canyon.
82
vii

Figure 57 Variations that are effective in reducing aircraft noise propagations in both Rijsenhout and Bangkok cases
83
Figure 58 Sketch design proposals for Rijsenhout case 84
Figure 59 Winter garden proposal with different integral design solution for housing at Rijsenhout
84
Figure 60 Double skin facade proposal with different integral design solution for housing at Rijsenhout
85
Figure 61 Extended canopy proposal with possible integral design solution for housing at Rijsenhout
85
Figure 62 Sketch design proposals for Bangkok case 86
Figure 63 Possible integral design solution for large overhang structure 86
Figure 64 Possible integral design solution for semi-enclosed balcony 87
Figure 65 Front canopy/overhang proposal with possible integral design solution for housing at Bangkok
88
Figure 66 Recommended steps in order to create good design in airport regions
89
viii

Table 1 Hearing threshold and acceptable limit of low frequency sound by Nakamura and Tokiita (1981) (source: More, 2011)
19
Table 2a The absorption coefficient of the basic surface materials used in the simulation, extracted from the book ‘Acoustic Absorbers and Diffusors: Theory, design, and application (Cox, D’Antonio, & Schroeder, 2005)
42
Table 2b Scattering coefficient of the default setting in Catt-Acoustic software for initial simulation, source: (Cox et al., 2005)
42
Table 3 The vertical and horizontal distance of aircraft noise source from the first receiver (R1), and the diagonal distance between the source and all receivers.
43
Table 4 The result of the simulation with different source setting in comparison to the on-site measurement.
45
Table 5 Vertical noise barrier on building façade with possible integral design solution and construction materials
47
Table 6 Horizontal noise barrier on building roof with possible integral design solution and construction materials
48
Table 7 Slanted noise barrier as building facade with possible integral design solution and construction materials
49
Table 8 Buffer zone as winter garden with possible integral design solution and construction materials
50
Table 9 Canopy as buffer zone with possible integral design solution and construction materials
50
Table 10 Surface materials and their absorption coefficient per different frequency in octave band
51
Table 11 Sound reduction index (R) of each material based on random angle of incidence
52
Table 12 Transmission coefficient of different materials 52
Table 13 The different in LAmax of different roof geometries in comparison to the baseline scenario A0
53
Table 14 The different in LAmax of different facade geometries in comparison to the baseline scenario A1
54-55
Table 15a The different in LAmax of between design variation C1-1 and A0 56
Table 15b The different in LAmax of between design variation of type C and C1-1 56
Table 16 The SPL at different receiver positions in design variation D1-1 57
Table 17 The different in LAmax of between design variation of type D and D1-1 58
List of tables
ix

Table 18 The different in LAmax of between design variation type E and A0 59
Table 19 Scattering coefficient used for geometry with different panel width within this research, source: (Cox et al., 2005)
60
Table 20 The result of baseline scenario at Rijsenhout all receiver positions at two source positions
61
Table 21 The result of baseline scenario at Bangkok all receiver positions at two source positions
61
Table 22 The effect of different angle of incidence on the sound reduction index of each material
75
Table 23 Comapring the pros and cons between each design interventions of Rijsenhout case
88
Table 24 Comapring the pros and cons between each design interventions of Bangkok case
89
x

Abstract
xi
Airport and aviation activities, after it first appearance in 1900s, have elevated the transportation industry to a new height. They are both the country biggest economic engine and connection hotspot, as well as biggest source of environmental and social impact—including noise, CO2 emission, territorial disruption and depreciation of local property. Though, noise is by far the most problematic issues, due to its large area of impact that is closely relate to the health, the urban development and the economics of the surrounding neighborhoods. During the past decades, many researches were conducted on the influence of building on the propagation of various noise source; however, very few are related to annoyance cause by aircraft. Hence, this research aims to explore the extent of influence of building envelop on the propagation of aircraft noise toward both outdoor and indoor area of the residential building. Prior to the main research, the brief literature on the properties of sound, the characteristic of the aircraft noise in comparison to other noise sources, the current aircraft noise abatement policies, and finally, the influence of buildings and urban planning on the propagation of aircraft noise were conducted and briefly explained.
The core experiment of this research focused on the influence of different variations of building envelops—these include the roof geometry, façade geometry, construction systems, and materiality—on the propagation of aircraft noise. Several design variations were proposed and simulation for their effectiveness and ineffectiveness to attenuate aircraft noise propagation in an urban area. Two case studies, in Rijsenhout and in Bangkok, were used as a base for the simulation for each variation. Finally, a set of general urban guideline for urban planning will be proposed, as well as a strategy for design a healthier urban environment in the airport regions. Additionally, several sketch designs will be proposed for the two case studies.

xii
This page is intentionally left blank

1
Chapter 1INTRODUCTION

Chapter 1: Introduction
2
1.1 Research background
After its introduction during the early twentieth century, air transportation has forever accelerated the way people movement in space to an unparallel rate. In the past century—since the first breakthrough at Kitty Hawk in 1903 by Wright Brothers—the aviation industry was widely accepted as a new mode of transportation after its predecessors, railway and automobile, and went through a rapid development which brings forth unprecedented opportunities and challenges (Rodrigue, Comtois, & Slack, 2017).
Airports, as a large infrastructure with high international connectivity, are widely accepted as an important economic engine of their respected region. They generate both direct (income generated directly form aviation activities) and indirect (income generated by the chain of suppliers that are related to aviation goods and services) impact on the economics that greatly improve the condition of the metropolitan areas around them (ACI Europe, 2004). In addition, several studies have found that there is a positive correlation between the growth of the airports and the number of population and employment rate in the metropolitan area. However, during the past decades, many studies started to question the liability of these effects. They argued that the increased in transportation systems might be a result of growth rather than a cause. In fact, there is an on-going debate between the regional economic benefits of airport operation, and the environmental and social disadvantages, felt mostly by the local. These include aircraft noise, CO2 emission, air pollution, territorial disruption and depreciation of local property value as shows in Figure 1. Noise is by far the most problematic issue, as its effects fundamentally alter conditions on the ground far beyond the airport fence, both directly through experience and indirectly through laws, rules and regulation (Boucsein, Christiaanse, Kasioumi, & Salewski, 2017; Brueckner, 2003).
Figure 1: Environmental and social impact caused by aviation activities

3
The issue may pale in comparison to the numbers of population affected by roads and railways; however, they merit attention due to several reasons. First, the scientific evidence found that for the same equivalent continuous sound pressure level, aircraft noise is by far the most annoying when compare to other sources, especially at moderate to high levels (ISO, 2003). In addition, while traffic noise mainly effect its immediate canyon as most of it sound is being contained by the building, aircraft noise arrives from above and harder to avoid (EASA, 2019), as shows in Figure 2. This is mainly due to the low-frequency components of the aircraft noise which has the ability to propagate through most building structure and travel at a great distance.
Second, the problems are widespread as they happen in every airport region around the world. The people who are affected by this type noise are constantly struggle, as they strongly depend on the type of measurement applied. These measurements vary depending on the circumstances, the communities around airports, and agency in charge of the matter. In addition, there are studies that suggest that the number of people who suffer from aircraft noise are higher than the number provided by the national government to EU (Whitelegg & Williams, 2000). The matter is even more serious in developing countries where the problem is poorly documented.
Bangkok for instance, the environmental impact of aviation was recently brought into spotlight with the establishment of its new international airport, Suvrnabhumi Airport (SVB) in 2006 (Cheramakara, Bristow, Budd, & Zanni, 2014). Research has shown the drop in quality of life in many communities around the airport and the increased in psychiatric problem (Ekpanyaskul et al., 2011). Due to the lack of coordination among responsible authorities, with the understanding and concern on the effect of aircraft noise and various health effects, the matter is worsen; even though, the environmental impacts of the airport was addressed prior to its construction and several mitigative measures were proposed—such as the location of the airport, land use restriction and population limitation in the surrounding area (Chalermpong, 2010). In addition, many locals are still struggled as they are waiting for the compensation for insulating their home from the related agencies (isaranews, 2018).
Figure 2: Schematic diagram show the different between propagation path of aircraft and traffic noise in urban area

4
Lastly, noise related issues are persistence and hard to solve. For example, railway traffic noise has existed for more than 150 years, despite technological advances the issue still remains unresolved. While it is true that the source levels of noise have progressively diminished due to the technological advancement of aircraft, the growth and spread of air traffic in space and time and the development of leisure activities and tourism largely offset the effect of these improvements. Aircraft noise will likely remain an important issue, and more people are likely to be exposed to the aircraft noise at a more frequent rate, as the airport continue to grow in respond to the increasing demand for air traffic, while the urban areas around airports have not been designed to mitigate aircraft noise. This is true in case of Schiphol airport when comparing the reduction of aircraft noise emission (Figure 3b) and the statistic on the number of complaints on aircraft noise annoyance (Figure 3a) especially in 2005 where the number of complaints increase dramatically. In addition, this problem can be observed through the transformation of the noise zone as the airport expand, as shows in Figure 4.
Figure 3a (top): Complaints on aircraft noise annoyance around Schiphol Airport (source: Clo, 2010); Figure 3b (bottom): the development of aircraft noise emission (source: www.bdl.aero, accessed on 13th Jan., 2020)

5
Figure 4: The transformation of Schiphol AIrport noise contour from 1990 to 2017 (source: Kruize, Driessen, Glasbergen, van
Egmond, & Dassen, 2007; Boucsein et al., 2017)
6
1.2 Relevance of the research
1.2.1 Health relevance
Aircraft noise is a major environment issues concern to people living close to airport. Several thousand houses are situated on the land near Schiphol airport which is considered unsuiTable for the development of new residential due to high aircraft noise exposure. Environmental noise features among the top environmental risk, second highest after air pollution, that has negative impact on human health and well-being. It has become one of the growing concern among both the general public and policy-maker in Europe (Brown & van Kamp, 2018).
It has been scientifically proven that excessive exposure to noise lead to a large number of health problem. These health effects can be both auditory and nonauditory (Basner et al., 2014). Many studies found that exposure to noise from transport sources and industry of around 50 dB(A) can cause insomnia, stress and mental disorders, heart and blood circulation problems and cardiac disease. Exposure to higher noise level may leads to direct injury to the auditory system and results in hearing impairment and tinnitus (Whitelegg & Williams, 2000). A field survey on the impact of environmental noise on neural hearing conducted in Bangkok, Thailand, has indicated that one-fifth of the population suffers from hearing loss due to excessive noise level (Boucsein et al., 2017; Yu, 2008). Furthermore, a number of studies found that many people who have difficulty falling asleep during night-time, due to noise, trend to resort to sedative or sleeping pills. The excessive consumption of these pills likely to decrease the quality of sleep and posed negative impact on overall health of the users (Yu, 2008).
The reports done by World Health Organization (WHO) have found that excessive exposure to loud noise has a detrimental impact on children’s education. The infants and pre-school children in noisy environments trend to have cognitive development problem, as they learn the read and write more slowly (WHO, 2000). In addition, there is an evidence found that children living in areas around airport trend to ‘had poorer long-term memory recall and reading comprehension than those living in a comparable urban environment unaffected by aircraft noise’ (Whitelegg & Williams, 2000).
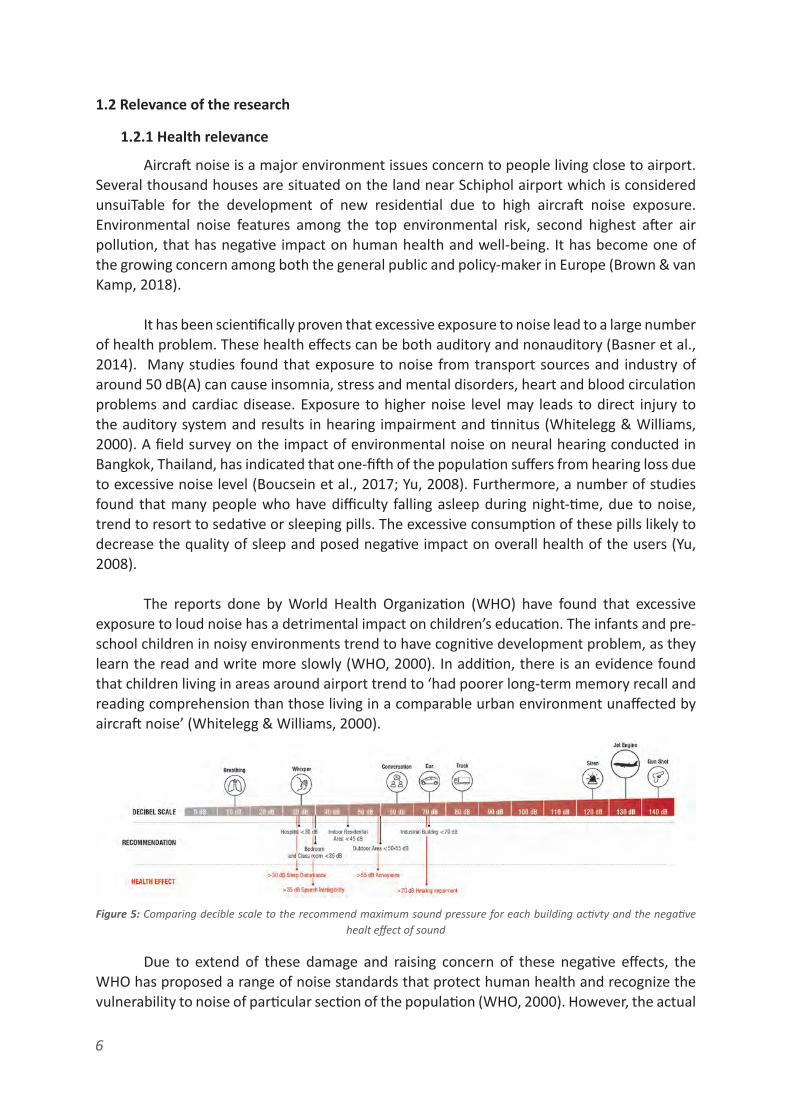
Due to extend of these damage and raising concern of these negative effects, the WHO has proposed a range of noise standards that protect human health and recognize the vulnerability to noise of particular section of the population (WHO, 2000). However, the actual
Figure 5: Comparing decible scale to the recommend maximum sound pressure for each building activty and the negative healt effect of sound

7
1.2.2 Architectural relevance: Urban expansion
1.2.3 Economic relevance: Land usage, value, and sustainability
The conflict about urban noise and attempts to revolve them are a recurrent issue. It was never expected to happen by any modern urban designer, rather it occurred by chance as the consequences of the expansion of the urban area, the airport and the accompanying traffic infrastructure. The noise pollutions in the airport region also trend to be more intense when compared to other places, due to the accumulation of infrastructures, such as motorways and railways that connect the airport to other regions. This usually cause a conflict between the local residents and the airports, where neither party cannot expand nor develop their surroundings, due to the restriction for health reason and political resistance. Furthermore, there is also a general understanding that public spaces near the airports are not the same quality as public spaces elsewhere. There is an observation done at Hounslow, a small town around Heathrow Airport, suggested that many residents in the neighborhoods tend to travel by car to a certain distance to access open space for recreation activities (Boucsein et al., 2017).
While a significant amount of efforts has been made to come up with the solution for building in relation to strong noise source, however, most of them only provide solution for a specific urban setting or small part of the noise problem. They are not suitable for the current and on-going developments of the urban situation where two or more noise sources are presented around the site (Krimm, 2018). In addition, most of the solution also give priority to the interior space while neglecting the outdoor sound quality of the urban environment.
noise situation often exceeds these limits as there are no government or industry plans that offer a realistic long-term solution for reducing aircraft noise to the safe level (Whitelegg & Williams, 2000). Figure 5 show the decibel scale, sources, recommended maximum sound pressure for each activity, and related health effect.
As mention previously, the airports are undeniable as the important economic asset of their respective regions. The Airport Council International (ACI) has classified economic effects of the airport into four main categories: direct, indirect, induced and catalytic effect (ACI Europe, 2004). The most obvious example, Schiphol airport directly employed approximately 65,000 people and around 30,000 jobs in the region around the airport are estimated to be attributable to the airport’s indirect effect. In addition, airports as a globally connection point are attractive to tremendously save time and cost of achieving face-to-face between business collaborators and promote clustering of organizational head office and relating business service in the area (Brueckner, 2003).
However, those effects are one-sided. Whitelegg and Williamns (2000) mentioned in their report on the effect of aircraft on economic always produces winners as well as losers in its metropolitan region. In this case the losers do not limit only to the small business owner who suffers from the increased in competition, but also the residents, real estate investors and certain governments sector. Due to their environmental noise and land use policy, abundance land around airports are left empty or occupied with low-value programs that are space consuming but low in density—such as valet parking and storage space—the existing lands and properties are devaluated due to their unattractive environment, and billions of euro

8
1.3 Problem statement
1.4 Research objectives
1.5 Research questions
Aircraft noise is a major environmental issue that does not concern only to the people living close to the airport, but also the urban development and the economical aspect of the region. While the aircraft noise has gradually diminished over the past decades, the aviation activities and airports continue to grow due to the increasing demand for air traffic; hence, more neighborhoods are being exposed to aircraft noise at more frequent rate. In addition, these neighborhoods were not designed to mitigate the aircraft noise. Several regulations and restrictions were adopted as the solutions to the problem; however, they are limited in their effectiveness. The problem is expected to grow further, if a realistic solution cannot be developed. A proper understanding on the influence building and urban morphology on noise in different situations may provide a long-term solution to the problem, or in any case part of the solution.
• General objective: Develop an understanding of how building geometry and their envelops influence the exposure to environmental noise and put together a series of design guideline for both the architects, policy makers and city planners for creating a healthier sound environment
• Sub-objective: Understand how the geometry of the building envelops—the roofs and the façade—of the residential building can effectively reduce the environmental noise in an urban area caused by the air-borne aircraft.
• Sub-objective: Understand how the geometry and materialization of the building envelop could enhance, reducing the reflection, the acoustic environment in urban canyon in airport region.
• Research question: To what extent can building geometry and their envelops influence the propagation of noise causes by the aircraft within an urban area?
• Sub-research question: To what extent can a building envelop and their construction materials, of residential building, can reduce the propagation of aircraft noise in an urban area?
• Sub-research question: To what extend can the geometry and materialization of the building envelop influence the reflection of aircraft noise in an urban canyon?
1.6 General methodology
The research is divided into six main parts. Two chapters focusing on the literature reviews, three chapters are the core research of the project focusing on the research through design method, and the last chapter is the conclusion of the finding and results.
In chapter 2, a brief literature review was conducted, focusing on different aspect of sound to provide the basic understanding on the mechanism of sound. These aspects include: the transmission, reflection, and absorption of sound; the different component of sound; the
were spend to compensate these negative effects (Boucsein et al., 2017). These effects are likely to grow ever further in the near future if the issue is left uncheck and without a proper solution.

Facade Geometry Variation withPositive Results
Variation withSimilar Results
Variation withNegative Results
Roof Geometry
Materiality
Building Height
Design VariationsSelect one variation
Resu
lt fr
om C
hapt
er 3
Simulation Phase 1 SimulationPhase 2
First Baseline Scenario
9
contrast between aircraft noise and other noise sources, such as motor mobile and railway; and the causes of annoyance in general. In addition, the common noise metrics used for aircraft measurement will be briefly explained.
The literature review in chapter 3 will be focused on the current urban acoustic situation and noise abatement strategies. These include brief discussion on aircraft noise reduction policies, such as the noise contour, flight path restriction and the ban of flights during specific time of the day; the natural means of noise reduction; and the artificial means of noise reduction, such as building geometry, sound insulation and absorption method. The matrix of existing research on noise attunement strategies will be developed for further assessment and comparison between each method.
The case studies will be introduced in chapter 4. Two case studies will be chosen one from Rijnsenhout, a small town under noise scape of the Schiphol airport, and another from a neighborhood near Suvrnabhumi Airport. The current situation in both cases will be briefly discussed. The specific location of the cases will be selected based on the analysis of the flight path, urban context and zoning. The information such as materiality of the building, living condition, source position and general urban context extracted from this chapter will be used to further develop the baseline scenario to assess the effectiveness of building geometry and their envelops against aircraft noise.
In chapter 5, a brief research on existing project will be conducted. Several design variations on building envelop, based on the finding with positive result on noise reduction in Chapter 3 and the research done in this chapter, will be proposed and tested under similar context to assess their influence on the propagation of aircraft noise toward both the outdoor and indoor area. CATT-acoustic v9.0c and TUCT v1.1a will be used as a main simulation software within this research. As the software is mainly used for room acoustic, prior to any experiment, anany on-site measurement according to Lugten’s dissertation (2018) will be re-simulated to check the liability of the programs and their results. The assessment of each design variations will be divided into two parts each with different baseline scenarios. The first baseline scenario is quick and simple, focusing on culling out ineffective design variations in order to keep the simulation phase within the limited time frame of this project. The second baseline scenario will be focused on detail analysis of each design variations under two different contexts according to the flight path from Rijsenhout and Bangkok in different canyons dimension. The effectiveness of each design variations will be assessed by comparing their results to the baseline scenario results. Figure 6a and 6b shows the general idea of the simulation setup and process for both first and second simulations, repectively.
Figure 6a: Flowchart of the first simulatioin

Matrix of Effectiveness of each variation
BaselineResults
Com
pare
d th
e ch
ange
s in
diff
eren
t fr
eque
ncie
s (1
25 H
z - 4
000
Hz)
Variation AResults
Variation nResults
Second Baseline Scenario
Variation A
Variation #n
Phase 1Results
Simulation Part 2
10
Chapter 6 focused on the development of design proposal. Several design alternatives for building envelop will be developed by combining several methods, based on the finding in chapter 4 and 5. The effectiveness of these alternatives will be evaluated not only their acoustical effects but also other criteria—including affordability, sustainability, and performance (thermal insulation and day-lighting) based on building regulation of the respected cases. Finally, results are discussed in chapter 7, along with the reflection and limitation of the research. In addition, the recommendation for future research will also be discussed. The general outline of the project can be seen in Figure 7.
Figure 6b: Flwochart of the second simulation
Figure 7: General outline of the research paper

11
Chapter 2SOUND, NOISE, & ANNOYANCE

12
Chapter 2: Sound, noise, and annoyance
2.1 Sound and noise
In this chapter, the concepts behind aircraft noise and annoyance are introduced and discussed. The chapter is divided into three sections. First, the basic theory of sound, indoor and outdoor sound propagation mechanism are introduced. Second, the concept behind aircraft noise and its unique characteristics are discussed. This also include the discussion on different acoustic metrics used in aircraft noise measurement. Finally, the third section will be elaborated on the causes of aircraft noise annoyance and the acceptable limit of noise.
2.1.1 Reflection, absorption, and transmission
In acoustics, sound energy is usually expressed in frequency and amplitude. Frequency is the number of sound wave or vibration in a given time, measured in Hertz (Hz), while amplitude, measured in pascal (Pa), is the maximum displacement of each particle from its equilibrium position— in short it represents the loudness of the sound. The most commonly used indicator for noise is though the decibel (dB), which is based on the ratio of the effective pressure squared to the lowest pressure squared that can be perceived by human ear (Berglund, Hassmén, & Job, 1996; Boucsein et al., 2017). In general, human ear can perceived only certain range of frequencies, between approximately 20 Hz to 20000 Hz. This hearing range shrink overtime with an increasing age (Ermann, 2015; Lugten, 2018).
Sound travels though the medium in a form of vibration, called sound waves. ‘The vibration destabilizes the equilibrium of the energy which keeps particles in place, resulting in wave-like density different’ (Lugten, 2018, p.17). Sound can move through any object, as long as there are particles to bounces off of.
When a sound wave encounters with an obstacle or surface, as it can be transmitted, absorbed or reflected. These often influence direction and intensity of sound. The transmission happened when the sound wave moves through object, such as when the exterior noise propagate into the interior of building. The amount of sound transmission can be reduced by the mass and stiffness of the construction materials. Absorption occurred when the sound energy is trapped by the object and partially convert into heat through the friction in the pores of the material. The level of absorption can be expressed by three metrics: the absorption coefficient, the impedance and the flow resistivity. The absorption coefficient is the most common metric for assessing sound absorption properties of the materials; while the impedance and flow resistivity are more complex, but they can describe the acoustic properties more precisely. The level of absorption and transmission also depend on the angle of incidence, the materials and frequency. When the sound wave hit a surface, part of its energy is reflected into the surrounding. In combination with the direct sound wave, the indirect sound wave, or the reflected sound, has the tendency to amplify or cancel the sound level that reaches a receiver (Long, 2014; Lugten, 2018). In general, this means that the surface materials, shape and orientation of the obstacle, in the case of this project is the building, does have an important role in influencing the propagation of aircraft noise to the indoor area of the building.

13
In contrast to the indoor acoustic, the outdoor sound environment is less stable and homogenous. This is due to the fluctuations in the propagation medium, the different layers of atmosphere, that vary in temperature and wind speed. This is important especially for aircraft noise, because the meteorology play an important role in sound transmission. It refracts the direction of sound; the wind velocity and direction also decreased or accelerate the propagation speed of sound…. For aircraft noise, literature shows that atmospheric turbulence can lead to spectral broadening (Lugten, 2018).
2.1.2 Traffic noise
2.1.3 Aircraft noise
The World Health Organization (2000) has categorized environmental into four main groups. Three of which are related to traffic—road traffic, rails and aircraft—and one to industrial infrastructure, the wind turbine. However, only the traffic noise will be discussed, as they are related to the topic.
The motorized sound sources are composed of various individual elements that vibrate and produce sound, such as the roaring sound produced by the engine and the higher, creaking, pitches sound from the rubbing between the tires and the pavement. Moving vehicle also creating sound as it moves due to the friction between its surface and the surrounding air column. The sound level and the spectrum of the moving source depend on the speed of the source as it increased with the velocity of the source. In addition, the sound can be a result of vibration cause by the moving vehicle, such as trains and trams (Lugten, 2018).
Similar to other motorized noise sources, aircraft noise is generated primarily from two major sources. First is the low-frequency rumbling noise behind the aircraft which is generated by the hot exhaust gases emitted from jet engine mixing with the surrounding air, and second is medium and high-frequencies noise radiated to the front and the rear of the aircraft generated by the internal engine, mainly the rotating compressor and turbine blades (Sharp, Gurovich, & Albee, 2001). Figure 8 shows the different components of aircraft noise and their intensity. However, when compared to other traffic sources, aircraft noise has three distinct features.
Figure 8: The aircraft noise before taking-off (left) when the aircraft is not moving and (right) when the aircraft move at Mach 0.25 (source: Arntzen, 2014)
14
First, aircraft contain more low frequency noise than other form of transportations due to its aerodynamic nature, size of the engines and rotor speed. However, the most striking difference between aircraft and other traffic sources is the source directivity and the position of aircraft (Lugten, 2018). Second, is the position as the source is elevated and the distance from the source to the receiver is larger than that of traffic noise (Flores, Gagliardi, Asensio, & Licitra, 2017; Lugten, 2018). Finally, is the source directivity. The general directivity of aircraft noise, resulted from jet exhaust noise, has a lobe-like shape that extend approximately 45 degree to the rear of the aircraft and mainly composed of low-frequency (Sharp et al., 2001). In general, aircraft noises are more difficult to confined and predicted. Noise emitted by a source near the ground and surrounded by walls cannot expand as freely as sound wave dispersed from overhead source. The noise level of the aircraft is less stable. It changes rapidly with the orientation of the engine both horizontally (as aircraft move along the runway) and vertically (as aircraft climb the elevation). This means that flight with different altitudes trajectories and distance will have different sound level (Flores et al., 2017; Sharp et al., 2001). Additionally, the refraction cause by the atmosphere will further influence the angle at which sound wave will hit a surface (Lugten, 2018).
According to Whitelegg and Williams (2000) ‘measuring the level of noise pollution from aircraft is a controversial area’. While there is a significant amount of research effort directed to determine the adequate measures of community responses to noise, there is an unsettled debate—between different parties: the local residents, the aviation industry and the government—on what are the most suitable noise metrics for quantifying aircraft noise induced annoyance. These metrics can be classified into six different categories, as follow:
Similar to how each individual people have different noise sensitivity and reaction, these noise ratings were developed to accurately predicts human responses to noise in different situations. Different occasions led to slightly different rating in each case (More, 2011). In the Netherlands, during the 1960s, the noise pollution around civilian airports is calculated in accordance with the model proposed by the Schiphol Noise Pollution Advisory Committee. The Kosten eenheid, or Ke—named after its creator, C.W. Kosten. It expresses the noise load in a number by measuring number of landing and ascending aircraft over the 24 hours period, and can be calculated with the following function:
2.2 Aircraft noise metric
1. Weighted Sound Pressure Level based rating: such as A and C-weighted Sound Pressure Level
2. Computed loudness and annoyance-based ratings: such as Loudness level, Perceived Level (PL), and Perceived Noise Level (PNL)
3. Statistical percentile-based rating: such as L90, L50, and L104. Noise level and events-based ratings: such as Noise and Number Index (NNI), and
Annoyance Index (AI)5. Energy average level-based rating: such as Average Sound Level (Leq and LA)6. Criterion curve-based ratings: such as Composite Noise Rating (CNR)

15
where B is the noise load from aircraft, expressed in Ke. N is the number of aircraft per year. LAi is the maximum A-weighted noise level in dB and ni is the night penalty factor (Martin, 2008). In general, 35 Ke corresponds with approximately 60 dB (Osborne, 2006). However, in 2003, it was replaced by new measuring system in accordance to the European standard (Deventer van, 2014; Huijs, 2011). In the next section, the more recent and widely used metrics for evaluating aircraft noise will be briefly described.
2.2.1 A and C-weighted sound pressure level
A. A-weighted sound pressure level
B. C-weighted sound pressure level (LC)
While different level of sound can be easily described in the decibel scale, human ear perceives sound in a more complex manner. For instance, it has been proved that human ear can perceived a low frequency sound with higher decibel and high frequency sound with lower decibel as equal loudness. This is even more relevant around airport, as aircraft noise has strong low-frequency component. To mathematically readjusted these differences on the decibel scale and produced the sound that is closer to what was heard by human’s ear, the weighting filters were established (Boucsein et al., 2017).
One type of the such weighting filter is the A-Filter, or A-weighting (LA). It is the most universally accepted and commonly used for community noise measurement. Most noises around airport measured and reported in dB(A) (Boucsein et al., 2017). However, during the past decades, many researchers have questioned its inadequate in assessing aircraft noise impact on the community.
One major drawback of A-weighted sound pressure level is that it de-emphasizes frequencies below 400 Hz and frequencies above 4000 Hz, while amplifying the mid-frequencies (Berglund et al., 1996; More, 2011). This is in accordance with the human ears as they are less sensitive to the noise of the lower frequency (Sharp et al., 2001). It has been proven that in case of sound source with substantial low-frequency component the sound will be 9 dB lower than its actual loudness. This is true in case of the aircraft as most of its noise energy is in the low frequency range, between 10 – 250 Hz (Leventhall, Pelmear, & Benton, 2003).
Many researchers deemed C-weighting (Lc) as a more appropriate weighting for assessing aircraft noise as it covers, while not all, a larger range of frequencies and only de-emphasizes only those below 63 Hz (Sharp et al., 2001). The different between A-weighting and C-weighting can be seen in the Figure 9.
The study on low-frequency noise emitted during aircraft take-off at Baltimore Washington International Airport, or BWI, has indicated that the C-weighting were more highly correlated to aircraft noise impact in communities than A-weighted metrics (More, 2011). In addition, C-weighting can easily be measured by most sound level meters,

16
2.2.2 Average energy level
A. A-weighted equivalent sound pressure level (LAeq)
It is a well-known fact that noise around traffic infrastructures is not constant, it has peaks and lows, due to the constantly changing distance between the moving noise source and the receiver. Over the past decades, several techniques were to effective study the noise these moving vehicles. The most commonly used techniques for measuring noise levels are called equivalent sound pressure level (Leq) and maximum sound pressure level (Lmax) (Whitelegg & Williams, 2000).
The equivalent continuous sound pressure level (Leq) measured in dB, is average noise level of a noise event over a given period. It is usually represented by single number values obtained by averaging the sound intensity of any event to an exposure time of one second. This value also known as sound exposure level, or SEL. Through this system the loudness of two noise events can be effectively compared in the decibel scale (Boucsein et al., 2017). The value needs to then be adjusted with an A-weighted filter to reproduce a sound value that is closer to what perceived by human’s ears, called A-weighted equivalent sound pressure level (LAeq). It can be calculated by using:
and it is used as the most appropriated metric for assessing sonic boom and blast noise which majority of the sound energy consisted of low frequency noise (Sharp et al., 2001).
where Li is sound level in dB(A), τi represents the duration of time that the value Li is present, T is an averaging time typically taken to be 15 hour for day-time and 9 hour for night-time (More, 2011). Theoretically Leq can be calculated for any duration of time; however, if it is calculated with 24 hours with penalties for evening and night, then it is often called Lden. In addition, this type of measurement techniques is most commonly used by the aviation industry (Whitelegg & Williams, 2000). The regulation and land-use restructure round the airport are based LAeq value of the aviation activities over the span of 24-hour time period.
Figure 9: Comparison between A and C-weighted aircraft noise during take-off (source: More, 2011; Sharp et al., 2001)

17
B. A-weighted maximum sound pressure level (LAmax)
2.2.3 Average level and time of day
A. Day-night average sound level (Ldn) and Day-evening-night average sound level (Lden)
The maximum sound pressure level (Lmax) measured in in dB, is the highest sound pressure level at a specific point of time in the given period. Similarly, an A-weighted filter need to be applied to the values to increase its reliability. The value then is called A-weighted maximum sound pressure level (LAmax). In general, LAmax technique is favored by the residents, as it can identify serous noise problems arising from short-lived single noise events, which are not picked up by Leq (Whitelegg & Williams, 2000). Several studies have also found that it has better correlation between annoyance ratings than LAeq (More, 2011).
The Average long-term exposure to environment noise can be predicted by using the metric which are based on the average level of noise of the particular time period, such as the day-night average sound level (Ldn) and the day-evening-night average sound level (Lden). In addition, these measurements take into account the different noise level that occurred during different time of the day. A certain amount of penalty is added to noise event that occurred during certain time of day, such as at evening and night-time (More, 2011).
The day-night average sound level (Ldn) is an equivalent continuous A-weighted sound pressure level over a 24-hour period with an additional +10 dB penalty during night-time (from 22:00 to 7:00). This night-time penalty reflects the fact that people are more sensitive to noise during the night. In general, the night flight is more noticeable due to the fact that background noise is lower. It can be calculated by:
where Ld is the average A-weighted sound pressure level measured during daytime (7:00 to 22:00) and Ln is the average A-weighted sound pressure level measured during night-time (22:00 to 7:00).
The day-evening-night average sound level (Lden) is similar to Ldn, only it has an additional weighting for evening-time with additional +5 dB penalty. It is also more widely used in European Union. It can be defined by:
where Ld, Le, and Ln are the average A-weighted sound pressure level during daytime (7:00 to 19:00), evening-time (19:00 to 22:00) and night-time (22:00 to 7:00) respectively. Note that the time frame for the evening and night-time may vary depending on the standard of different country. For instance the night-time in Spain starts from 22:00 while in Sweden it starts from 23:00 (More, 2011).

18
The Ldn and Lden have been selected by many governments and agencies—such as the Environmental Protection Agency (EPA), the Federal Aviation Administration (FAA), and European Union—as the most appropriate method to assess environmental noise around airports (Sharp et al., 2001). It is also based on these value measurements that most noise related regulation and restriction are developed. However, there are some critics on the method, mainly on how these values which only measured over 24 hours are assumed to be what experienced by the locals over the whole year (Boucsein et al., 2017).
2.3 Sound frequency
2.3.1 Characteristic of low frequency noise
As previously mentioned, human ears can register sounds between approximately 20 Hz to 20000 Hz. In general, the range of sound wave can be divided into three categories: low, mid and high frequencies. The mid frequency sounds referred to sound between the 500 and 2000 Hz, which is the clearest to human hearing. Any sounds higher than 2000 Hz are high frequency sound (“The Difference Between High, Middle and Low-Frequency Noise”, 2019). On the other hand, the upper limit of low frequency sound is still unclear, but commonly referred to sound below 250 Hz and above 20 Hz. Any sounds below (<20 Hz) or above (>20000 Hz) human hearing range are called ‘infrasound’ and ‘ultrasound’, respectively. While the infrasound falls outside human hearing range, it can still be perceived by human as vibration, if the sound is loud enough (Berglund et al., 1996).
Low frequency noise is a common component of occupational and residential noise. Sources for low frequency noise can be either natural—such as turbulence, thunder, ocean waves, volcanic eruption, and earthquakes—or artificial such as vehicles, heating and ventilation system, machinery and loudspeaker system. The research by Berglund and Hassmen (1996) described low frequency noise as ‘the superpower of the frequency range’ as it has a unique characteristic when compared to the noise of mid and high frequencies. These characteristics are:
• ‘It is attenuated less by wall and other structure• It can rattle walls and objects• It masks higher frequencies more than it is masked by them• It crosses great distances with little energy loss due to atmospheric and ground
attenuation• Ear protection devices are much less effective against it• It is able to produce resonance in the human body• It causes great subjective reactions (in laboratory and in the community studies) and
to some extent physiological reactions in human than mid- and high frequencies.’
As the low frequency noise are more difficult to attenuate, the sound field in a shield area of the building is typically low frequent (Timothy Van Renterghem, Hornikx, Forssen, & Botteldooren, 2013). While there are many researches on noise abatement technique, most of them are more effective against higher frequency (>250 Hz). These different techniques will be discussed in the next chapter.
Frequency [Hz]
Detection [dB]
Annoying [dB]
Displeasing [dB]
Oppressive/ Detect
Vibration [dB]
Very Annoying / Displeasing
[dB]
Very Oppressive / Obvious
Vibration [dB]
5.0 104.0 112.5 118.4 118.4 129.9 136.8
6.3 101.0 109.0 114.6 114.6 124.9 131.6
8.0 97.9 105.4 110.8 110.8 119.8 126.2
10.0 95.0 102.0 107.1 107.1 115.0 121.3
12.5 90.5 97.3 102.3 102.3 110.2 116.3
16.0 85.5 92.2 96.9 96.9 104.9 110.7
20.0 81.0 87.5 92.1 92.1 100.1 105.8
25.0 71.5 81.1 86.5 86.5 95.5 101.4
31.5 67.7 74.4 80.6 80.6 90.8 96.9
40.0 51.5 67.5 74.6 74.6 85.9 92.3
50.0 44.4 63.0 71.3 72.7 85.0 92.2
63.0 37.1 58.3 66.7 71.8 84.1 92.2
80.0 29.5 53.5 62.0 70.9 83.2 92.1
100.0 - 49.3 62.1 70.9 82.7 92.1
125.0 - 45.1 62.2 70.9 82.3 92.0
160.0 - 41.8 92.1 71.8 83.3 92.6
200.0 - 41.3 61.8 74.4 84.1 94.1
250.0 - 40.8 61.5 77.0 84.9 95.5
315.0 - 40.2 61.1 79.7 85.7 97.1
400.0 - 39.2 60.1 80.9 86.3 97.6
500.0 - 37.9 58.7 80.9 86.8 97.2
630.0 - 36.6 57.2 80.9 87.3 96.9
800.0 - 35.2 55.6 80.9 87.8 96.6
1000.0 - 34.0 54.2 80.9 88.2 96.2
19
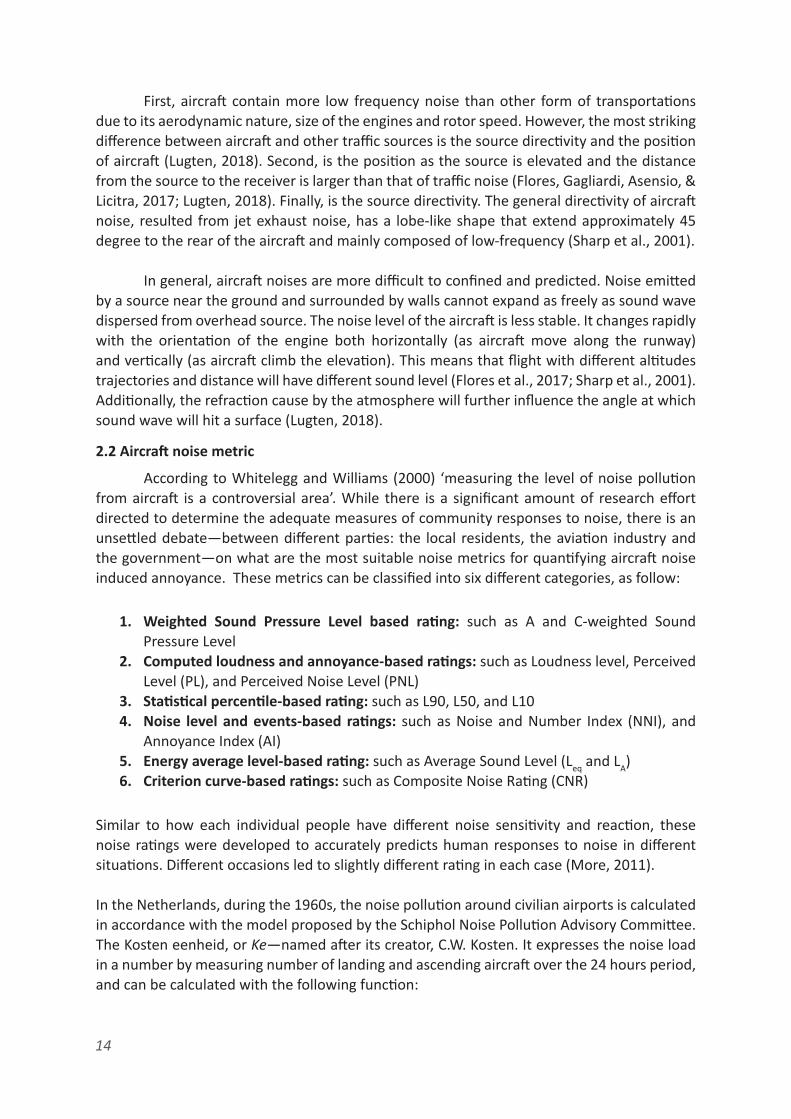
2.4 Hearing thresholds and acceptability limit
While ultimately, whether a sound is perceived as negative or not is also due to subjective and personal factors, many experiments were performed to identify the acceptability limits of different noise frequency. One exWample of these studies is the research by Nakamura and Tokita (1981) on low frequency noise thresholds, as shows in Table 1.
Table 1: Hearing threshold and acceptable limit of low frequency sound by Nakamura and Tokiita (1981) (source: More, 2011)

20
2.5 Chapter 2 summary
• Surface materials, shape and orientation of the obstacle of the building can reduce the propagation of aircraft noise.
• Aircraft noise, unlike other traffic noise, is mainly composed of low frequency sound with a distinct position (height) and directivity.
• While A-weighted filter is commonly used for aircraft noise assessment, it lacks precision when dealing with sound with substantial low frequency component. The literature shows that C-weighted filter is a better technique in assessing the impact of aircraft noise.
• Average sound exposure (Lden) and maximum sound exposure (Lmax) are example of acoustic factor used for assessing aircraft noise impact.
• The low frequency sound is more difficult to attenuate, when compare to mid and high frequencies.

21
Chapter 3
CURRENT AIRCRAFTABATEMENT STRATEGIES

22
Chapter 3: Current aircraft noise abatement strategies To protect the citizen from aircraft noise annoyance and exposure, the urban area near airports is regulated by a variety of rules and restrictions. The International Civil Aviation Organization (ICAO) with its balanced approach proposes guidelines with different level of action for mitigating aircraft noise (Flores et al., 2017). This approach consists of four following categories (Boucsein et al., 2017; Lugten, 2018):
The first category deal with the advancement of aircraft technology. The second with the urban planning and land-use restriction, which is developed based on the noise contour. This is the most common method was adopted by many countries. The third and fourth categories, only favored by some countries, are related to the aircraft operational regulation, such as noise tax and ban of night-time flight (Boucsein et al., 2017; Lugten, 2018). Additionally, many studies on natural mean (vegetation) and artificial mean (building and barrier) the influence of building geometry, street canyon typology and construction materials on aircraft noise to further improve the soundscape of the urban area near the airports.
1. Reduction of noise source2. Land-use planning and management3. Noise abatement operational procedures4. Operating restriction
3.1 Aircraft noise reduction policies
Figure 10: Noise contours of Schiphol Airport

23
In order to protect people from excessive noise exposure, several policies and regulation were adopted. Noise contours are one of the commonly used policy instruments, see Figure 10. It is relevant to the urban development (Boucsein et al., 2017). It defines the area near the airports into multiple zones depending on the level of environmental sound pressure. The Federal Aviation Administration (FFA, 1998) have proposed a land use noise sensitive matrix base this technique, which later adopted by many countries, Figure 11. The matrix is adapted according to situation in the respected countries, Figure 12. For example, the Luchtavenindelingsbesluit (LIB), or the airport allocation law, divided areas around Schiphol airport into four zones: LIB1 the ‘sound zone’ with sound pressure level above 70 dB(A; LIB2 the ‘safety demolition zone’ with sound pressure level between 65 to 70 dB(A); LIB3 the ‘external security zone’ at sound pressure level between 60 to 65 dB(A); and LIB4 the noise restriction zone’ with sound pressure level below 60 dB(A) but higher than 55 dB(A). The land-use regulation stated than only individuals who rightfully owned a house before 2003 are allowed to live in LIB1 and LIB2 area. If individuals are to leave the house, it will be demolished. In LIB3 and LIB4, residential project is generally not allowed, but can be built under certain exceptions such as apartment for employee and extension of existing house along with the submission of a ‘statement of no complaints.
Figure 11: The Federation Aviation Administration (FAA) land use noise sensitive matrix (source: The Federal Aviation Administration’s (FAA) Southern Region Airports, 2000)
Figure 12: Luchtavenindelingsbesluit (LIB), or the airport allocation law (source: Boucsein et al., 2017)

24
However, the contours are predictions have little relevance to the disturbance of individuals by aircraft noise. The noise contour is developed based on the measured weighted equivalent sound levels (Lden and Lnight) of the aviation activities and the shortest distance between sources and receivers without taking into consideration of the building shape and urban context (Flores et al., 2017; Lugten, 2018). This resulted in an inaccuracy of the method and actual urban situation may be 50 percent better or worse than the calculated results (Boucsein et al., 2017).
The other group of noise regulations are related to the restriction of the flight movement during specific time of the day, early morning and nighttime, and the flight path of the aircraft. For instance, at Heathrow Airport in UK and Schiphol airport in Netherland, while the night flights are not entirely banned, they are tightly controlled. Limits number of aircraft are permitted to take-off or land at the airports between 11 pm and 6 am. The flight control also takes into account the relative level of noise emits by different type of aircraft; thus, a quitter aircraft is allowed to operate during these hours. In some case, such as at Zurich airport in Switzerland, the flight path and usage of runway are strictly controlled to minimize the spread of aircraft noise. In some countries, the aviation service providers are charged with special tax, called noise tax. For example, at Paris Orly airport and Paris Charles de Gaulle airport in France, the service providers are bound with Plan de Gene Sonore’ (PGS), or plan of sound discomfort, where every take-off is taxed depending on the noise level of the aircraft. This tax is then used as a subsidy for the residents to soundproof their homes (Boucsein et al., 2017).
A number of studies found that vegetation can reduce sound. The acoustic abatement of vegetation was resulted from three mechanism: sound absorption and reflection when sound wave come into contact with the leaves; and the reduction of sound level when the sound wave is transmitted to the layers of vegetation. Different species of plant with various shape of leaves also play an important role in the effectiveness of vegetation noise reduction (Yu, 2008). Bucur (2006) suggested that by using multiple specie of plant together the effectiveness of sound reduction is likely to more effective than using single species. In addition, plant closer to noise source has the potential to reduce noise up to 10 dB. However, there is still no precise method to assess the effect of vegetation on sound distribution. In addition, the porosity cause by tree roots on the ground surface has the potential to enhance the reduction of low frequency noise (Yu, 2008).
While the effectiveness of vegetation remains unclear, it has the ability to mask the noise source and distract the receivers from the negative environmental noise (Lugten, 2018). Additionally, vegetation provides more benefit to the urban environment than sound mitigation. These benefits include: improve the aesthetic of the urban environment, improve the air quality, reduction of urban heat island effect, improve the thermal insulation on building façade, act as the buffer for storm water and other benefit related to sustainable urban environment (Van Renterghem et al., 2013; Yu, 2008).
It is clear that when planning the use of green areas in the urban environment, it is imperative to consider the denseness of plants, the size of the planting zone, the presence of mixed plant, the use of original plants and so on (Yu, 2008).
3.2 Natural means of noise reduction

25
Studies have found that the design of buildings and cities can reduce or amplify the sound level of urban environmental noise. These studies include the orientation of the building, the height of the building, the geometry of the façade and the roof, the dimension of the urban canyon, and the surface materials of the building. The comparison between all the techniques found in this chapter can be seen in the table in Appendix A.
3.3 Artificial means of noise reduction
3.3.1 Building orientation
3.3.2 Urban canyon and building height
The study shows that position of the façade in relation to the flight trajectory, or the line of sight (LOS) have great influence of the different level of sound intensity around the building, Figure 13. This different in noise exposure are most prominent between the expose and non-expose façade of the building, or quite façade (Flores et al., 2017). According to the literature, the quite façade of the building refers to the side of the building which has 10 dB lesser than the façade that is directly exposed to the noise source (Lugten, 2018). However, in case of the aircraft noise the different between the exposed and quiet façade are difficult to define, due to the overhead position of the source. In addition, the exposed and un-exposed façade can be inverted if the building is located in between the turning path of an aircraft.
Building can act as barriers and can be effectively used to reduce community noise (Sharp et al., 2001). While the height of the building may seem irrelevant to the acoustic properties of the building, in fact, it does greatly influence the sound pressure level near the façade, especially on the façades which are not directly exposed to the sound source, as well as the sound in the street. In general, the study found that taller building has stronger noise reduction effect on the back façade, due to the increase in distance between the source and the receiver, as shows in Figure 14 (Lugten, 2018).
Figure 13: DIfferent in sound intensity during different aircraft event around the building (source: Flore et al., 2017)

26
3.3.3 Roof and facades geometry/ornament
The geometry of the building envelops, façade, façade ornament and roof included, that are directly exposed to the sound source can influence the both the sound level near building façade and exterior sound environment. The study by Lee et al. (2007) suggested that sound level on the façade depends on the incidence angle of sound, as well as the shape and ornament of the façade. In the research, common C-section balcony of an apartment is being adjusted and the results are compared to check the effectiveness of each balcony scheme. The results showed that the reduction of noise on the façade can be improved by adding solid vertical element, such as parapet, which prevent or reduce the direct sound exposure on the rear wall of the balcony. On the other hand, an elongated and tilt balcony floor or ceiling have less reduction effect and, in some case, amplify the sound level on the façade, as they increase the reflection of noise. However, the reflections of noise can be reduced with the use of sound absorbing surface materials.
Literature also shows that façade ornaments, balconies, and roofs do have influence on the sound field around the building. While a tilted façade seems to be effective against aircraft noise, as it is likely to reflect the noise back into the atmosphere, the research by Lugten (2018) show otherwise. This negative impact of the tilt façade may result from change in reflection angle of sound are directed inward rather than outward from the street canyon. Similarly, the shape of the roof influences the propagation of sound and sound level within street canyon. Evident shows that, when compare to flat roof, many roof shapes such as
Other feature such as the typology of street and its width also contribute to the modification of aircraft noise levels, while the effect might be minor than the height (Ismail & Oldham, 2002). The study by Flores et al. (2017), considering two urban scenarios, the L-typology (street with building on one side) and the U-typology (street with building on both side), found that in case of the U-typology has the potential to amplify the sound level of aircraft due to the induced reflection and diffraction of the façade of the building which generate overall higher sound pressure. The research by Lugten (2018) also suggested that building height in combination with the dimension of urban canyon has the potential to both reduce and amplify the aircraft noise. This potential depends of the street-width-to-building-height ratio. Narrow street with high building is likely to increase the exterior sound pressure as it prevents sound from escaping from the canyon, while wider street with shorter building is likely to reduce the overall sound pressure.
FIgure 14: The influence of builidng height of the propagation path of aircraft noise (source: Lugten, 2018)

27
symmetric saddle-back, slant roof and roof with overhang are less effective in noise reduction. On the other hand, the saw-tooth, curve roof and roof with multiple angle are more effective than flat roof, Figure 15, (Van Renterghem & Botteldooren, 2010). In addition, effectiveness of the roof shape also depends of the dimension of the urban canyon. For instance, the combination of narrow street and overhang roof is likely to have negative impact on exterior noise level as the reflected sounds are reflected back into the canyon due to overhang surface of the roof (Lugten, 2018).
3.3.4 Sound insulation technique
The sound insulation of the building depends greatly on the properties of the construction materials of the walls and roofs. These properties include: the mass, the thickness and the stiffness of the materials. The installing of acoustical windows and doors, adding a layer of insulation in the attic space, and applying interior wall treatments are standard techniques for sealing up or baffling any open paths of noise transmission on the building envelops and improved overall sound insulation property of the building. Through a proper treatment, the sound reduction of the building can be improved by at least 5 dB. Similar to many other techniques, these methods work better for mid and high frequencies. Literature show than through careful selection of mass and spacing of wall and roof the reduction of low frequency noise can be achieved. In fact, there are several existing facilities—such as recording studios and certain test facilities such as anechoic chamber— that were built with structures that can effectively reduce low-frequencies noise. However, these are fairly massive and expensive structure that are not suiTable form residential housing (Sharp et al., 2001) .
Nevertheless, there is alternative solution such as the use of common building materials with good noise reduction property, such as double-glaze window. An experiment on the sound insulation property of double glaze window found the potential to reducing low frequency noise though the use of different type of glass panels for first and second glass panel of the system (Miskinis, Dikavicius, Bliudzius, & Banionis, 2015). Furthermore, the experiments on the new double glazed windows system where the noise-damping ventilation
Figure 15: Influcen of different roof geometries on the propagation of traffic noise to quiet facade (source: Van Renterghem
& Botteldooren, 2010)

28
system is integrated into the design has shown that it is possible to improve the noise reduction index of the system by an extra of 20 dB, total of 40 dB noise reduction, over the standard assembly of the system (Boucsein et al., 2017).
3.4 Chapter 3 summary
• Many restriction and regulation in an urban area near the airport was made to protect the citizen from excessive aircraft noise. However, the effectiveness of these restrictions is limited.
• In general, the design of the building and urban planning can effective reduce the environmental noise.
• The width of the street and the height of the building can reduce or amplify the environmental noise depending on their ratio.
• When dealing with the urban environmental noise, the urban context such as shape and with of the street need to be taken into consideration. Some noise abatement method can influence the negative impact of sound, if they are used in a wrong context. For example, overhang roof in a narrow street.
• (Refer to the result in Appendix A) Most of the techniques found in this chapter are more effective at mid- and high frequency. It is also difficult to compare the effectiveness of different technique as they are simulated in different context and set up.

29
Chapter4INTRODUCTION TO CASE STUDIES

30
Chapter 4: Introduction to case studies It been proved that the variation of building envelops (façade and roof) due to their geometry, position, dimension, and reflections properties in combination with multiple noise sources and urban landscape can influence the spreading of noise in both positive and negative manners (Krimm, 2018). However, based on the research presented in Chapter 3, the effectiveness of these variations against aircraft noise is rather difficult to access as the experiments were done based on more common source such as traffic noise. There are few existing researches on the influence of building and urban typology on aircraft noise mitigation; however, these researches were often conducted in well developed country with substantial understanding of nuisance caused by aircraft noise, strict control policies, and with certain level of measurements to limit the problem were already in action. Hence, most of the aircrafts in these researches are often located at a large distance, horizontally, from the receiver. However, this is not the case in many developing countries where the issue is of less concern when compared to the profit generated by the airport operation in combination with the lax policies against aircraft noise. In many cases, the expansion of urban fabric, including the construction of new residential building, around airport are still happening and the distance between the aircraft and the receivers, surrounding communities, is much closer than anyone could imagine.
In the course of this research which aims to provide a standard guideline for designing the building within or closed-by an airport region, two locations with different urban context, sources position, and flight trajectory were selected as a case study. The information, such as sources postions, extracted from these two cases will be used as standard testing parameter to test the effectiveness of each design variation of the building envelop. The first case study is a neighborhood within Schiphol Airport region named Rijsenhout, while the second case study is a small gated community located closed to runway right under one the landing path of Suvarnabhumi Airport in the metropolitan of Bangkok.
Rijsenhout is a town in the Dutch province of North Holland and part of the municipality of Haarlemmermeer. It is a small neighborhood located to the southwest of Schiphol Airport, close to the Kaagbaan (04/22), Figure 16. The neighborhood was suffered from the nuisance caused by aircraft noise since 1960s when the runway first was constructed (Schiphol.nl, 2020). According to the data provide by Schiphol in 2019, majority of the departing flights were distributed to Kaagbaan to the southwest direction. During the peak hour, the neighborhood is likely to experience one aircraft event every three minutes. Furthermore, this specific runway is one of the two runways, apart from Polderbaan (18R/36L) located to the northwest of Schiphol Airport, which allow to be used during night-time, with the exception between 12:00 am to 6:00 am. (Schiphol, noiselab.casper.aero, 2019).
In addition to the annoyance, the effect of the aircraft noises also has indirect effect on the expansion of urban fabric of the neighborhood, as it is located within the noise contour as shows in Figure 17. Several activities and building typologies are being restricted from
4.1 On-site situation
4.1.1 Rijsenhout

31
Figure 16: Aerial view of Schiphol airport and Rijsenhout with an imaginary boundary line (source: Google Map, accesed on 19th April, 2020)
Figure 17: Noise contour of Schiphol airport in relation to Rijsenhout (source: Boucsein et al., 2017)

32
construciton, especially residential building, according to the Luchtavenindelingsbesluit (LIB) in order to protect its citizen from negative health impact caused by long exposure to loud noise. While the restriction was established with good intention, it leads to two problems. First, the scarcity of housing for younger generation due to limited number of existing residential building and the aging society within the area. Second, loss of opportunity and land value within the neighborhood. This example can be seem when the local municipal proposal to replace large number of existing abandon greenhouses with new housing units in response to the increasing demand was rejected by the government due to the fact that the land lies within the noise zone of Schiphol (Municipal of Haarlemmer,haarlemmermeergemeente.nl , 2019). In addition, the issue with noise annoyance caused by aircraft is likely to increase further in the future as there is a chance that Schiphol airport is going to expand further with the construction of its seventh runway which will be running in parallel to Kaagban (Sajet, rijsenhout.info ,2020).
The general flight path of the aircraft departed for Kaagbaan runway can be observed in Figure 18. Majority of the flights leaving from the runway approach the neighborhood from the northeast. The estimated distance between the noise sources along their flight path and the city center, estimated from position P1 (Figure 18) ranges from 850 to 1200 meters and the altitude ranges from 625 to 800 meters depending on the type of aircraft. After this estimated position P1, the flight paths then break into three directions: continue toward southwest, turn toward the north, or turn toward south and the east depending on the destination. The aircraft turning events, especially when the aircraft turn toward the south and east, make the problem with aircraft noise even more complicated as the shielding effect of the building against aircraft noise is greatly influence by the position of the source. In some case the
Figure 18: Flight path leaving from Kaagbaan runway

33
buildings may not provide any shielding effect at all, this is especially true when the direction of sound is parallel to the street and building envelop (Lugten, 2018). The estimated distance at location P2 is approximately ranges from 1000 to 2800 meters and the flight altitude ranges from 900 to 1500 meters. The approximate angle of incidence of sound is 32° for a receiver, person, standing 1.5 meters in front of the exposed building façade. The average measured ambient sound pressure level was reported to be between 48.8 to 55.7 dB(A) and increased to during the aircraft event was between 59 to 73.3 dB(A) (Lugten, 2018).
Several building typologies existed within the city; however, the research focus on the residential building as they are the majority who are affected by the aircraft noise. The most common hosing typology within the site was selected as a case study. In this case the typical Dutch row house, Figure 19, with approximate height of 12.4 meters by 9.3 meters depth with gable roof. The dimension of the canyon varies depending on the location, but ranges from 10 to 20 meters. The housing was constructed with typical construction materials, such as brick wall, ceramic roof tile and double-glazing window. The general surface materials that can be found on site are presented in Figure 20.
Figure 19: Street view at Rijsenhout and the approximate dimension of the housing and canyon size (source: Google Map)
Figure 20: General surface materials found in Rijsenhout

34
Suvarnabhumi Airport, located in Bang Phli district within the province of Samut Prakan near Bangkok, was constructed in 2006, Figure 21. While the airport was reported to be built far away from the city center, it has greatly impacted the life quality of the pre-existing nearby communities and neighborhood within Bang Phli district. According to the report by the Pollution Control Department and Department of Environmetnal Quality Promotion (2006), the most affected area is to the north and to the south of the airport. This can be observed in noise contour map of Suvarnabhumi, Figure 23. It can be seen that the noise contour stretched in vertical direction due to the layout of the parallel runways.
4.1.2 Bangkok
Figure 21: Aerial view photograph showing the construction of Suvarnabhumi Airport (source: Google Map)
Figure 22: Aerial view showing the boundary of Suvarnabhumi Airport and the area most effected by aircraft noise, Lat Krabang district (source: Google Map)

35
Figure 24: Diagram showing the statistic of flight movement for each runway at Suvarnabhumi Airport (source: Department of Environmental Quality Promotion, 2011)
Figure 23: Aerial view showing the noise contour of Suvarnabhumi Airport in relation to Lat Krabang district (source: Department of Environmental Quality Promotion, 2011)

36
While the neighborhoods to the east are also effected by the aircraft noise, the area effected is much lesser when compared to the neighborhood on the north and south of the airport. In addtion, the environmental assessment on Suvarnabhumi noise annoyance shows that multiple complaints were filed from the neighborhood around the airport, but the majority was done by the residents in Lat Krabang district located to the north of the airport, Figure 22 (Department of Environmental Quality Promotion, 2011).
Through closer inspection of the noise contour of Suvarnabhumi Airport, it can be seen that part of communities in Lat Krabang district fall under Noise Exposure Forcast (NEF) >40, which is equivalence to an area with sound pressure level of 80 dB(A) and higher (NEF <30 = <65 dB(A), NEF 30-35 = 65-75 dB(A), and NEF 35-40 = 75-80 dB(A)) (Department of Environmental Quality Promotion, 2011).
Flight statistic shown that majority of the movement happen at east runway, where 98% of the flight departed toward the south, while 95% of the flight approach the airport from the north toward the west runway, Figure 24. The report also shows that during the aircraft event the SPL on the surrounding neighborhood can range from 76.6 dB(A) up to 99.7 dB(A) depending on the location of measurement (Department of Environmental Quality Promotion, 2011). Chunlamat Village, located to the north of the airport, was selected as a case study for this project. The village suffers an extreme noise situation as it situated under NEF >40 noise zone, which have average SPL equal to 80 dB(A) or higher. The buildings within the village located on the open field and directly exposed to the aircraft noise source. The estimates distance between the exposed façade of the residential building is approximately 185 meters, Figure 25. The average flight altitude of the passing aircrafts ranges from 550 to 800 meters. Additionally, the village also located right next to highway leading to Suvarnabhumi Airport. The angle of incidence was estimated to be roughly 73° on the receiver in front of the exposed façade.
Figure 25: Showing the location of Chunlamat village and the distance between the flight path approaching the airport from the North

37
Figure 26 shows the existing housing condition within the community along with the dimension of the building. The village consists of a row of two stories building with a total height of 7.5 meters height with large courtyard, approximately 5 by 8 meters, in front of the residential unit. The houses situate opposite to a large field of plantation with 4.5 meters wide street run in between. The building was constructed mainly of concrete structure with masonry wall with plaster finishing, while the roof usually has either wood or steel structure with ceramic tile. Unlike the Dutch residential building, the residential building in tropical country such as Thailand usually has thinner wall, approximately 10 cm thick, and roof structure. This is due to its hot and humid climate year-round; hence, an insulation layers inside the wall and rood are not required. This indicates that the sound reduction index of the building façade is lower than the building in the Netherland. Figure 27 presents the overall building materials on the site, observed through the available online source.
Figure 27: Common material surface found in the Chanlamat neighborhood
Figure 26: The existing condition of Chanlamat village and building typology with rough dimension (source: Google Map)

38
According to the brief site analysis done on both aircraft event at Rijsenhout and Bangkok, it can be seen that the existing condition of both case studies are quite different. These differences can be categorized into two main points. First, the most obvious and important for this research different, is the position of the noise source. The aircraft in case of Rijsenhout located at longer distance between the receiver, while the source located at overhead position in Bangkok case. This cause the angle of incidence of sound to be extremely different, 32° at Rijsenhout and 73° at Bangkok. The second difference is the different in construction system due to different climate and context of both cases. Due to tropical climate all year round, the building in Bangkok are commonly built with thinner wall as insulation layers are unnecessary in this hot and humid climate, in compared to wet and colder climate of the Netherlands. The different in the thickness in façade and roof construction also mean that the buildings are likely to have lower acoustic insulation to the outdoor noise. Hence, in order to improve indoor acoustic comfort in Thailand, the construction system of the building envelop must be taken into consideration.
4.2 Chapter 4 summary

39
Chapter 5DESIGN SIMULATION AND VARIATIONS

40
Chapter 5: Design simulation and variations5.1 Methodology
The acoustic simulations in this research project were conducted with CATT-acoustic v9.0c and TUCT v1.1a, a geometrical acoustic modeling software. The software was chosen based on its availability, gradual learning curve when compared to the allowable time frame of the project, and the author’s familiarity with the program. While the program is mainly used for room and theater simulations, with certain tweaks in the material setting, it is possible for the program to be used to simulate outdoor situation. In order to ensure the reliability of the software, the initial simulation results will be compared to on-site measurements, extracted from Lugten (2018) research.
While it is possible for the software to simulate outdoor environment of the aircraft noise event, the software comes with several limitations that may deviate the simulation results from the actual reality. For example, it is impossible to include any weather effects, such as wind, into the simulation and the refraction of sound due to these effects. Depending on the direction and speed of the wind, it is possible for more sound wave to be refracted towards the receiver if the sound and wind are traveling in the same direction and the opposite if sound is traveling against the wind (Kai-chung, n.d.). Another limitation to the software is the simplification of the analysis which represents sound wave as a particle that move in linear path in the form of rays. However, in reality the propagation of sound wave is not limited to straight lines. This limitation is related to an acoustical phenomenon of diffraction and scattering which occurred when sound wave strikes an object and part of its energy is being reflected. Due to the representation of sound as ray instead of a wavefront, a geometrical acoustics software such as CATT cannot completely simulated the result of the diffraction and only mathematically approximating its effects (Honeycutt, 2015). In addition, the scattering effect of overall geometry of the building is not included and limited only via scattering coefficient for each plane segment of the building. Both these limitations, the different in representation of soundwave and the exclude of certain factors (weather effects and overall geometrical scattering), may result in different results between the simulation and actual reality on the site.
5.1.1 Software and simulation set-up
The initial simulation was a replicate of an on-site measurement. A 1-to-1 scale, 3D model was created with Rhinoceros 6, a 3D modeling software. The building shapes were modelled based on the section drawing of the site, extracted from Lugten (2018) dissertation, at Rijsenhout a small neighborhood near Schiphol Airport, as shown in Figure 28. The 3D model was then converted to a compatible file type (.GEO) with DXF2GEO software and imported into Catt-Acoustic for further adjustment in term of the acoustic property of each surface material.

41
As the software is normally used for room acoustic, five extra plains were created in addition to the ground plain to simulate a closed room situation. Four plains on each side, representing the walls, and one on top which represent the ceiling of the room. In order to replicate an outdoor environment from the closed room situation, the surface property of these five plains were set to have an absorption coefficient of 0.99 (99%) to imitate the atmospheric boundaries with indefinite depth. Though this may not be perfectly accurate, it generates a situation that closely resemble to what actually occurred in reality in which these imaginary boundaries don’t exist and the aircraft noise that direct toward these boundaries would travel indefinitely through the atmospheric layers. In case the simulation, 99% of the collided sound energy will be absorbed, while the reflected sound energy (1%) is negligible as it is too small to have any significant impact on the result. The surface properties of other materials were selected and extracted from Acoustic Absorbers and Diffusers: Theory, Design, and Application by Cox and D’Antonio (2005), by an observation through site image via online sources, such as Google map: street view, as shown in Figure 29. In this initial simulation, the scattering coefficient of each surface was left to be at default value of 10% for all octave band, between 125 Hz to 4000 Hz, in consideration of the possible roughness on the building envelop due to the existence of small façade ornament, protrusion, and texture of the surface material. Table 2a and 2b listed all of the absorption coefficient and scattering coefficient of all surface materials used in the initial simulation. In addition, the simulation was set to take into consideration the present of air absorption. The property of air was set to have average temperature of 20°C with 50% humidity and the density of 1.20 kg/m3.
Figure 28: Initial 3D setup for checking the reliability of the software

No. Surface descriptionAbsorption coefficient (α) per frequency
125 250 500 1000 2000 4000
1 Wall: Brick, unglazed façade and rough concrete 0.03 0.03 0.03 0.04 0.05 0.07
2 Roof: Ceramic glazed tile 0.01 0.01 0.01 0.01 0.02 0.02
3Exterior floor/Street surface: Smooth unpainted concrete with asphalt layer/ Concrete block
0.01 0.01 0.02 0.02 0.02 0.05
4 Boundary: Atmospheric layer 0.99 0.99 0.99 0.99 0.99 0.99
No. Surface descriptionScattering coefficient (s) per frequency
125 250 500 1000 2000 4000
- Scattering Coefficient for all materials in initials simulation 0.1 0.1 0.1 0.1 0.1 0.1
42
The position of the receivers is similar to on-site measurement, one in front of and behind every building in the simulation at 1.5 meters above the ground plains and 1.5 meters from the façade as show in Figure 30. The total of six receivers were presented in both the simulation and on-site measurement. In addition, the head direction of all receivers in the simulation was set to be paralleled to the façade of the building to imitate moving person along the street canyon.
Figure 29: Location of on-site measurement according to Lugten’s research (source: Google Map)
Table 2a: The absorption coefficient of the basic surface materials used in the simulation, extracted from the book ‘Acoustic Absorbers and Diffusors: Theory, design, and application (Cox, D’Antonio, & Schroeder, 2005)
Table 2b: Scattering coefficient of the default setting in Catt-Acoustic software for initial simulation, source: (Cox et al., 2005)

Simulation No.
Vertical distance (H)
[m]
Horizontal distance (d) from R1 [m]
Diagonal distance between SxR [m]
R1 R2 R3 R4 R5 R6
1 625 1000 1177.18 1227.14 1253.07 1283.11 1300.66 1315.27
2 312 500 587.61 637.94 664.29 694396 712.93 727.93
43
The position of the source, in this case the aircraft, was determined by the value extracted from Casper Flight tracking, a flight tracking software where the type of aircraft, destination of the flight and the altitude of the aircraft can be observed in real-time. The information was extracted on 28th February 2020, based on the flight path of Boeing 737 which is the most common aircraft model use for commercial flight. The horizontal distance of the aircraft from the first receiver, R1, and altitude of the flight were measured when the aircraft it is directly in front and perpendicular to the façade of building where receiver R1 is located. The estimated distance between the source and the first receiver are 1000 meters, while the altitude of the flight is 625 meters from the ground. Table 3 show the summary of the distance between the source and all receivers. In addition, half of the actual distance between the source and receiver R1 is also given and will be discussed in further in detail later in this section.
Aircraft, as a source with unique position and directivity, from a ground perspective can be perceived as a point source with an omni direction sound emission; thus, a moving aircraft can be represented by multiple point source along the flight trajectory. The sound pressure level (SPL) of the source, on the other hand, is more complicate to identify as different research have reported different values. For example, in case of Boeing 737, the International Civil Aviation Organization (ICAO, 2006) reported to have sound level between the range of 89.9 to 95.8 ENPdB, while other researches show that aircraft noise can ranges from 110 to 140 dB (Arntzen, 2014; Ozcan & Nemlioglu, 2006). These different SPL of the source may also result from the differences in distance of the measurements in each report. However, a standard range of sound power of source can be extracted. In order to acquire the most accurate result, several simulations were conducted each with different SPL at 1-meter distance, ranges from 110 dB to 140 dB.
The simulation was then done with TUCT v1.1a, a built-in acoustic prediction software based on geometrical acoustic which offers better prediction of an open cases, such as outdoor arena, than preceding version of Catt-acoustic. Due to the experimental nature of the project, which required serval trial and error to find the best solution, the simulation algorithm was kept as basic calculation for minimal simulation time. Figure 31 shows standard setting used
Figure 30: Simplify section of on-site measurement and the locations of the receivers
Table 3: The vertical and horizontal distance of aircraft noise source from the first receiver (R1), and the diagonal distance between the source and all receivers.

44
throughout the research. The algorithm used in this simulation is ‘Closed room: (1) short calculation, basic auralization’ with maximum split-order of 0. While the second (2) and third (3) algorithm may provide more accurate result, the time required for each simulation increased significantly and is not suitable of the nature this research through design. The calculation parameters tab is used to determine the number of rays and duration of echogram/impulse response that will be presented during the simulation. The higher number of rays and the longer response time will result in the increase in the calculation time required for each simulation. In this research, the length of echogram/impulse response was left at default value, at 1000 millisecond (ms), as it related to the reverberation time in a closed room environment which is not relevant in this research. On the other hand, the number of rays required for the simulation depending on the volume of the simulated space and directly related to the accuracy of the result. The larger volume means higher number of rays and time are required to finish single simulation. The initial recommendation number of rays for the 1-to-1 scale with approximate volume of 59 million m3 was 310 million rays and took roughly 10 minutes to calculate. While the calculation time is acceptable, it is only the case for simple geometry where each side of the building can be represented by single plane. The calculation can be expected to increase significantly when building geometry become more complex and more planes are needed for single building facade. Hence, both the number of rays and volume of the simulation were optimized for shorter simulation time. The idea was to cut the distance between the source and the first receiver by half and decreasing the SPL of the source by 6 dB which will greatly reduce the volume of the simulated space to 19 million m3 and number of rays to roughly 10 million rays. In addition, several simulations with different number of rays setting were performed in order to compare the different in accuracy of the results. The results of this trial and error shown that the number of rays can be reduced further to 7.5 million rays, with only ±0.3 to ±0.5 dB(A) in the results. Through this optimization the calculation time for the simulation have been significantly reduced to roughly 1-minute form initially 10 minutes.
Figure 31: The simulation algorithm used throughout the research

Simulation of actual distance between source and exposed facade
Source SPL at 1m distance [dB]
Maximum SPL [dB(A)]
R1 R2 R3 R4 R5 R6
On-site measurement (Lugten, 2018)
72.1 67.8 73.3 59.0 69.9 58.9
140 83.07 68.15 82.58 68.66 81.92 64.05
130 73.12 58.38 72.66 58.15 71.88 54.02
120 62.56 48.49 62.49 48.39 61.17 44
Simulation of the half distance between source and exposed facade
124 75.8 59.43 74.73 60.48 73.86 53.04
120 71.93 55.35 70.41 55.78 69.19 49.09
45
5.1.2 Initial result and program reliability
Through multiple simulation, each with different source SPL at 1-meter distance, the results show that the source with sound pressure level of 130 dB provides the closest results to the on-site measurements. Both results shown a similar trend where the receivers on the quiet side façade will have a drop of approximately of 4 to 14.3 dB(A). The optimized scheme, with the distance between source and receiver cut in half and smaller simulation volume, also shown similar trend to that of 1-to-1 scale. Table 4 summarize the results of the initial simulation of a 1-to-1 scale and optimized version in comparison to the on-site measurement.
It can be observed in the results that not all frequencies are perfectly match with the actual measurements. This is due to the inconsistence between the simulation and reality. In actual situation, the source does not have a flat spectrum, meaning that for every frequency the SPL will be slightly different. Hence, in order to come toward a good calibrated model, with more accurate result, the SPL per frequency band needs to be vary. However, in case of this research this is not the most important part, as the differences between SPL at the receivers of each design variations are more relevant. Additionally, the differences between the simulation and measurements may also resulted from the absence of wind and other weather effect, the difference in absorption value between reality and simulation, and the oversimplification of the building geometry and representation of the sound as mentioned in the beginning of this chapter. However, the results proved that it is possible to use room acoustic software to simulate an outdoor situation. The standard parameters (receiver setting, source setting, and simulation algorithm) used in this initial simulation will be used as a standard setting for all simulation in this research.
5.1.3 First baseline scenario set-up and analysis
In order to make an effective comparison between different design variations, each variation will be simulated under the same baseline scenario and setting. However, due to the experimental nature of this research and number of variations tested, two baseline scenarios were proposed. First is the scenario with basic setting which will be used for quick
Table 4: The result of the simulation with different source setting in comparison to the on-site measurement.

46
and rough simulation in order to cull out ineffective design variations and to limit amount of time that will be spend on the various types of simulation. The design variations with positive results will then be re-simulated in the second baseline scenario where more variables are tested and further analyze their impact against aircraft noise in more detail. The setup of the first baseline scenario will be discussed in this section, while the set-up for the second baseline will be later explained in latter section of this chapter.
The first baseline scenario consisted of two rows of residential buildings with gable roof, with the height of 12.4 m and 10 m depth. The two rows of housing are separate by 20 m street canyon. The distance between the first receiver and the source, the properties of the surface materials, and the sound pressure level of the source were adopted from the previous section. The number of the receivers range from 4 to 8 receivers depending on the type of the variations used in the simulation. Total of three sources were placed along the flight path to mimic the movement of the moving aircraft. The interval between each source is approximately 50 meters which equal to the displacement of the flying aircraft within 1 second (s). Figure 32 show the graphical setup of the first baseline scenario.
The effectiveness of each design variable will be assessed by observing the change in the sound pressure level (LAeq) and maximum sound pressure level (LAmax) in front of the exposed façade and quiet façade by comparing the results of each design variation to the results of the baseline scenario.
5.2 Design variations and integral design solution
In addition to the research on the current noise abatement strategies in Chapter 3, further research on existing built projects were conducted and used as an inspiration for difference design variations. From this additional research, it can be concluded that the three most common approaches to noise reduction design are: solid noise barrier, sound insulation or buffer zone, and surface treatment or materiality. In this section of the research, multiple design variations based on the previous researches will be proposed and simulated for their impact against aircraft noise. The design proposal will be categorized into the three approaches mentioned previously.
Figure 32: The first baseline simulation set-up for the different design variable of the building.

47
In addition to their possible influence on noise, each design variable was proposed base on an idea of an integral design solution. Many existing guidelines on sound attenuation, prior to this research, have solely focused on the isolation and sealing of the interior space from the exterior environment to achieve the maximum sound reduction. While the method is effective, it is likely to reduce the comfort of the users and increase the energy consumption of the building as it becomes more dependent on artificial HVAC, due to the decrease in natural ventilation and lighting of the building. Hence, an integrate design between acoustic performance and sustainable technology, such as PV cell or passive ventilation system, could be one of the solutions in which could improve both the acoustic performance of the building and living condition of the residence at the same time.
5.2.1 Solid noise barrier
A solid noise barrier is the most common approach used in traffic noise reduction. This example can often be seen in the form of a huge wall structure the span along the length of the highway. However, this type of approach normally works best against sources that located on the ground, such as traffic or railway noise as it creates a blockage between the source and the receiver on the opposite site of the wall. However, unlike traffic and railway noise, an aircraft noise arriving from the top can easily propagate over these barriers to reach the receiver. One solution to this problem is to integrate the noise barrier as part of the building in the form of facade. Table 5 shows several proposals for the building façade, or the vertical solid noise barrier, with different geometries.
Table 5: Vertical noise barrier on building façade with possible integral design solution and construction materials

48
However, building façade is not the only part of the building that is being exposed to an aircraft noise. Due to its unique source position and directivity of the aircraft that located far above the building, it is possible for aircraft noise to propagate through the roof of the building as it is directly exposed to the to the source. Alternatively, the solid barrier can be applied horizontally as part of the roof over the building. Several proposals of different roof geometries, or horizontal noise barrier, were proposed as show in Table 6.
Some research also shows that by slightly tilting the barrier the noise reduction effect of the solid noise barrier can be improved, as it alters the reflection path of the sound. It can be either reflected back into the atmosphere or trapped within a certain location. Hence, idea of tilted or slanted solid noise barrier is being explored in this research. Table 7 shows several tilted building façades with different geometry. However, all these design variations for the solid noise barrier are likely to solely impact noise attenuation toward the outdoors environment, while the noises attenuation towards the indoors are more related to the construction system and materiality used in combination with these design variations.
Table 6: Horizontal noise barrier on building roof with possible integral design solution and construction materials

49
5.2.2 Buffer zone
The second approach commonly used for noise reduction is to create a buffer space between the source from the receivers. This design variations, unlike that of the previous category, are likely to have impact on noise attenuation towards the indoor environment rather than the outdoor environment, as they create an extra insulated layer and air gap between the exposed façade and the noise source. The standard techniques are to create structure isolation to limit the sound transmission though the vibration of structure or to create a buffer space on the building envelop, such as double skin façade system. This approach can also be applied to the residential building in the form of winter garden, which creates a semi-outdoor space that will act as a buffer area between the building (façade) and the outdoor area. Additionally, this design variations would also provide an extra usage area for the residences and at the same time act as passive solar heating during winter. Table 8 show several proposals for winter garden geometries and existing built projects.
Table 7: Slanted noise barrier as building facade with possible integral design solution and construction materials

50
Alternately, the buffer zone can come in the form of an urban canopy as shows in Table 9. This variation would provide not only sound insulation for the building but also the outdoor space, such as the street canyon. The obvious advantage of these design interventions over other variation is that it has potential to shield the receiver from every possible overhead noise source.
Table 8: Buffer zone as winter garden with possible integral design solution and construction materials
Table 9: Canopy as buffer zone with possible integral design solution and construction materials

Surface materialMass
[kg/m2]
Absorption coefficient (α) per frequency
125 250 500 1000 2000 4000
Glazing: Double glazing, 2-3 mm thk glass, 10 mm air gap
- 0.20 0.15 0.10 0.07 0.05 0.05
Metal sheet: perforated steel deck, 0.75 mm thk
6.03 0.30 0.09 0.09 0.09 0.11 0.11
Wood: Plywood board, 10 mm thk 6.80 0.14 0.10 0.06 0.08 0.10 0.10
Membrane: Latex membrane, 0.58 mm thk, with 15 mm air gap (Hamdan, Zainulabidin, Kasron, Ismail, & Kassim, 2018)
0.64 0.00 0.00 0.09 0.86 0.27 0.16
Textile: Polyester cloth, 3.5 mm thk with 15 mm air gap (Na, Lancaster, & Cho, 2007)
0.22 0.04 0.08 0.12 0.19 0.21 0.29
Vegetation: Green wall module system, total thk = 120 mm (Azkorra et al., 2015)
- 0.51 0.42 0.36 0.37 0.44 0.52
51
5.2.3 Materiality
The third approach commonly used for noise reduction is the surface material or surface treatment of the building. Different building materials have different acoustic behavior and properties. The acoustic property of each material depends on the stiffness, mass, and thickness of the materials. Several materials with potential to reduce noise propagation were selected according to various literature research and will be used in the simulation. Table 10 show a list of all the materials as well as their absorption coefficient per frequency, between 125 to 4000 Hz, used in this research.
These materials will be used in the simulation for two experiments in this research. The first is the experiment their influence on the reflection of noise toward an outdoor environment when the noise hit the surface of the building envelope. The second experiment is related to the influence these materials have on the transmission of the noise toward indoor space in case of the design variation of the second category, the buffer zone. In order to simulate the transmission property of these materials, the transmission coefficients of each material per each octave, between 125 to 4000 Hz, are required to be input into Catt-Acoustic. While the transmission coefficient for some materials can be found in some research and online database, many are still missing. However, an estimated value can be calculated by using the air-borne sound insulation equation:
where R is the sound reduction index in dB and t is the transmission coefficient of the materials. In order to calculate the transmission coefficient of that specific material this equation can be rewritten as:
Table 10: Surface materials and their absorption coefficient per different frequency in octave band

Surface materialSound reduction index (R)
125 250 500 1000 2000 4000
Glazing: Double glazing, 2-3 mm thk glass, 10 mm air gap*
22 24 28 38 45 50
Metal sheet: perforated steel deck, 0.75 mm thk 15.3 21.2 27.2 33.2 39.2 45.2
Wood: Plywood board, 10 mm thk 16.3 22.2 28.2 34.2 40.3 46.3
Membrane: Latex membrane, 0.58 mm thk with 15 mm air gap
1.4 3.9 8.3 13.9 19.7 25.7
Textile: Polyester cloth, 3.5 mm thk with 15 mm air gap
0.2 0.7 2.3 5.8 10.8 16.6
Vegetation: Green wall module system, total thk = 120 mm**
13.3 14.6 16.4 14.7 13.5 14.8
Surface materialTransmission coefficient in %
125 250 500 1000 2000 4000
Glazing: Double glazing, 2-3 mm thk glass, 10 mm air gap
0.63 0.40 0.16 0.02 0.00 0.00
Metal sheet: perforated steel deck, 0.75 mm thk 2.14 1.91 0.50 0.56 0.18 0.06
Wood: Plywood board, 10 mm thk 2.36 0.60 0.15 0.04 0.01 0.00
Membrane: Latex membrane, 0.58 mm thk with 15 mm air gap
73.29 40.69 14.64 4.11 1.06 0.27
Textile: Polyester cloth, 3.5 mm thk with 15 mm air gap
95.85 85.23 59.06 26.50 8.27 2.20
Vegetation: Green wall module system, total thk = 120 mm
4.68 3.47 2.29 3.39 4.47 3.31
52
where the transmission coefficient of the material can be calculated from its sound reduction index (R). Similar to every other value used within this experiment, the sound reduction index of each material can be found on an online database. However, if it is not available, it can be estimated by using simple mass law as follow:
Where ω is equal to 2π times frequency (f), m is the mass of the materials in kg/m2, Ɵ is the angle of incidence of sound, ρair is the density of air which is roughly 1.21 kg/m3 at 20°C , and cair is the speed of sound in air which is approximately 343 m/s at 20°C. Table 11 and Table 12 show the sound reduction index and the transmission coefficient of each material used within this reserach.
Table 11: Sound reduction index (R) of each material based on random angle of incidence
Table 12: Transmission coefficient of different materials

Simulation No.ΔLAmax when compared to A0 [dB(A)]
R1 R2 R3 R4
+0.8 +19.2 -1.1 -9.7
+0.8 +9.2 -1.1 -10.4
+0.8 +10.0 +2.4 -10.4
+0.8 +19.2 -1.1 -6.5
+0.8 +14.4 +1.0 -16.0
+0.8 +19.2 -1.1 -10.4
+0.8 +9.8 +1.4 -15.1
R1 R2 R3 R4
A1
R1 R2 R3 R4
A2-1
R1 R2 R3 R4
A2-2
R1 R2 R3 R4
A2-3
R1 R2 R3 R4
A3
R1 R2 R3 R4
A4
R1 R2 R3 R4
A5
53
5.3 First simulation result and design variations culling
Due to sheer amount design variation and simulation, the first set of simulation were designed to be as quick and simple as possible. The focused of this initial simulation was to cull out ineffective variations or variations with similar effect. The first analysis focused on the impact of horizontal noise barrier or the roof geometries against the propagation of aircraft noise. The results of different roof geometries were compared to the results of baseline
Figure 33 (top): Section drawing of variation A0 with receiver location; Table 13 (bottom): The different in LAmax of different roof geometries in comparison to the baseline scenario A0

Simulation No.ΔLAmax when compared to A1 [dB(A)]
R1 R2 R3 R4
0.0 -1.6 0.0 0.0
0.0 -1.7 -0.7 0.0
+0.7 -6.6 +0.8 0.0
0.0 -3.6 +3.1 0.0
-1.7 -9.6 -1.7 -3.7
-1.1 -7.1 -1.7 -3.5
R1 R2 R3 R4
B1-1
R1 R2 R3 R4
B1-2
R1 R2 R3 R4
B2-1
R1 R2 R3 R4
B2-2
R1 R2 R3 R4
B3-1
R1 R2 R3 R4
B3-2
54
scenario (A0). Table 13 shows the ΔLAmax at different receiver positions located in front of exposed and quiet facades of the two rows of housing, while Figure 33 shows the positions of the receivers. The results show that all design variation, in general, performed worse than baseline scenario. As there is an increase in sound level at position R2, ranges from 9.8 dB(A) to 19.2 dB(A), while there is some improvement in sound level at position R3 depending on the roof geometries. Note that this huge different between the SPL on exposed and quiet façade is the result when only the aircraft source is presented without taking into consideration of other noise source and other environmental factors that may existed in reality—such as the ambient noise, traffic noise, and the wind. While the different in results at position R1 between all design variations and baseline scenario are expected to be 0, the slight increase of 0.8 dB(A) may resulted more noise are being reflected toward the receivers due to the increase in surface area of the exposed façade. The major drop in sound level at position R4 occurred due to the setup of the simulation. In order for the sound to reach receiver R4, it needed to reflect on the atmosphere boundaries with at least once and as these boundaries were set to have 99% absorption coefficient, majority of the sound energy was absorbed; hence the significant decrease in sound pressure level. As this phenomenon doesn’t occurred in reality the results from position R4 can be ignored. However, it can be observed that the results of variations A1, A2-3 and A4 show similar trend and variation A2-2 has higher potential to amplify the sound level within the canyon compared to other variation of the same geometry. Only variations A0, A1, A2-1, A3 and A5 will be further analyzed in more detail.
Table 14: The different in LAmax of different facade geometries in comparison to the baseline scenario A1
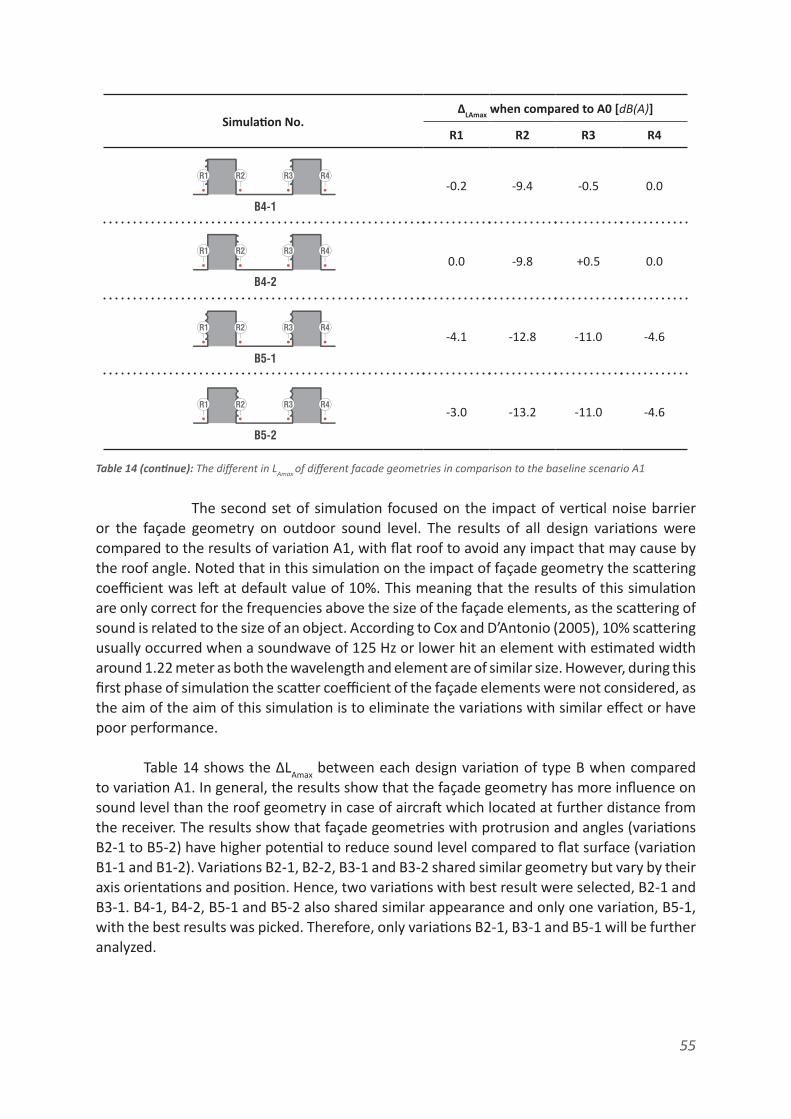
Simulation No.ΔLAmax when compared to A0 [dB(A)]
R1 R2 R3 R4
-0.2 -9.4 -0.5 0.0
0.0 -9.8 +0.5 0.0
-4.1 -12.8 -11.0 -4.6
-3.0 -13.2 -11.0 -4.6
R1 R2 R3 R4
B4-1
R1 R2 R3 R4
B4-2
R1 R2 R3 R4
B5-2
R1 R2 R3 R4
B5-1
55
The second set of simulation focused on the impact of vertical noise barrier or the façade geometry on outdoor sound level. The results of all design variations were compared to the results of variation A1, with flat roof to avoid any impact that may cause by the roof angle. Noted that in this simulation on the impact of façade geometry the scattering coefficient was left at default value of 10%. This meaning that the results of this simulation are only correct for the frequencies above the size of the façade elements, as the scattering of sound is related to the size of an object. According to Cox and D’Antonio (2005), 10% scattering usually occurred when a soundwave of 125 Hz or lower hit an element with estimated width around 1.22 meter as both the wavelength and element are of similar size. However, during this first phase of simulation the scatter coefficient of the façade elements were not considered, as the aim of the aim of this simulation is to eliminate the variations with similar effect or have poor performance.
Table 14 shows the ΔLAmax between each design variation of type B when compared to variation A1. In general, the results show that the façade geometry has more influence on sound level than the roof geometry in case of aircraft which located at further distance from the receiver. The results show that façade geometries with protrusion and angles (variations B2-1 to B5-2) have higher potential to reduce sound level compared to flat surface (variation B1-1 and B1-2). Variations B2-1, B2-2, B3-1 and B3-2 shared similar geometry but vary by their axis orientations and position. Hence, two variations with best result were selected, B2-1 and B3-1. B4-1, B4-2, B5-1 and B5-2 also shared similar appearance and only one variation, B5-1, with the best results was picked. Therefore, only variations B2-1, B3-1 and B5-1 will be further analyzed.
Table 14 (continue): The different in LAmax of different facade geometries in comparison to the baseline scenario A1

Simulation No.ΔLAmax when compared to A0 [dB(A)]
R1 R2 R3 R4
-1.8 -4.1 -3.9 -26.2
ΔLAmax when compared to C1-1 [dB(A)]
-0.3 +11.3 0.0 0.0
-1.6 -10.3 -7.1 0.0
-0.3 +8.2 -9.8 0.0
0.0 -0.5 0.0 0.0
-0.3 +11.1 -0.5 0.0
0.0 0.0 0.0 0.0
-0.3 +11.3 -0.1 0.0
0.0 +8.5 +0.1 0.0
-0.3 +17.6 +0.1 0.0
0.0 0.0 0.0 0.0
R1 R2 R3 R4
C1-1
R1 R2 R3 R4
C1-2
R1 R2 R3 R4
C2-1
R1 R2 R3 R4
C2-2
R1 R2 R3 R4
C3-1
R1 R2 R3 R4
C3-2
R1 R2 R3 R4
C4-1
R1 R2 R3 R4
C4-2
R1 R2 R3 R4
C5-1
R1 R2 R3 R4
C5-2
R1 R2 R3 R4
C6
56
Table 15a (top): The different in LAmax of between design variation C1-1 and A0; Table 15b (bottom): The different in LAmax of between design variation of type C and C1-1

Receiver Position
SPL per frequency [dB] A-w [dB(A)]125 250 500 1000 2000 4000
R1 70.2 70.9 70.0 69.1 65.5 53.2 73.0
R1a 52.5 47.7 43.6 39.2 32.5 16.1 45.3
R2 56.9 54.3 51.0 47.2 40.6 24.0 52.5
R3 68.1 67.3 66.5 65.4 61.7 49.3 69.3
R3a 51.9 47.1 42.9 38.5 31.7 15.0 44.7
R4 35.3 34.7 33.6 32.2 27.7 16.0 36.1
57
Table 15a shows the ΔLAmax for each design intervention of type C which is the slanted noise barrier typology. The design intervention C1-1 was first compared to the baseline scenario A0. The results show that the increase in slanted surface of the building do indeed has a significant impact in reducing the sound level cause by aircraft source, as the sound level at all position were minimized, including on the exposed facade. The results of C1-1 was then used as a baseline and compared to the results of other type C variations, C1-2 to C6. Table 15b shows ΔLAmax for each design variations in comparison to C1-1. The results show that most design variation of type C in compared to C1-1 trend to amplify noise level on the quiet façade, at position R2, or don’t show any significant different results from variation C1-1. In addition, the overhang added in variation C6 don’t proved any shielding effect in case of aircraft at long horizontal distance. Only variations C2-1 and C3-1 that show slight improvement and will be analyzed further.
The design intervention type D focused on influence of buffer zone crated by different winter garden geometry on both the outdoor and indoor sound pressure level. Double glazing window panel was used as a standard surface material for the winter garden, its absorption and transmission coefficient were as mentioned in Table 10 and Table 12. In addition, in this simulation two additional receivers, R1a and R3a, were added. The two new receivers are placed inside the buffer zone, in this case the winter garden, to compare the different in SPL between the outdoor space and the noise reduction impact of the design variations. Figure 34 show the section of variations D1-1 with all six receivers.
The results of variations D1-1 was shown in Table 16. According to the results, an estimate 24.6 to 27.7 dB(A) reduction can be expected between the outside and inside of
Figure 34 : Section drawing of variation D1-1 with receiver location
Table 16: The SPL at different receiver positions in design variation D1-1

Simulation No.ΔLAmax when compared to D1-1 [dB(A)]
R1 R1a R2 R3 R3a R4
0.0 - -17.8 0.0 0.0 0.0
0.0 - +26.9 -1.8 - 0.0
0.0 - +29.6 -1.8 - 0.0
0.0 - +26.7 -1.8 - 0.0
0.0 - +29.5 -32.2 - 0.0
0.0 - +14.9 -32.4 - +0.1
R1 R2R1a R3aR3 R4
D1-2
R1 R2R1a R3aR3 R4
D2-1
R1 R2R1a R3aR3 R4
D2-2
R1 R2R1a R3aR3 R4
D3-1
R1 R2R1a R3aR3 R4
D3-2
R1 R2R1a R1a R3a R3aR3 R4
D4
58
the winter garden. The results of other design variations of type D with different geometries were then compared to D1-1. Table 17 shows ΔLAmax between the variation D1-1 and other variations in type D with different geometries. There are no different in sound level at position R1 and R4 in all variation. The increase and decrease in sound level mainly occurred within the canyon. In general, the amplification of the sound level within the canyon outweigh the minimization of noise in most variations. In addition, the limitation of the simulation program can be observed through these results, as the sound pressure level at receivers within the winter garden, positions R1a and R3a, cannot be calculated. This may result from the small gap between the roof of the building and the winter garden top surface in variation D2-1 to D4, which is difficult for the program to analyze. However, in practical the reduction in sound level between the exterior and interior space of the winter garden are expected to be similar to simulation D1-1 as the construction materials and layer remain the same. As most results of different variation apart from D1-1 yielded negative outcome, only variation D1-1 will be analyzed further.
Table 17: The different in LAmax of between design variation of type D and D1-1

Simulation No.ΔLAmax when compared to A0 [dB(A)]
R1 R2 R3 R4
-2.1 -0.7 -28.4 -26.2
-2.1 - - -26.2
0.9 -0.6 -28.5 -26.2
R1 R2 R3 R4
E1
R1 R2 R3 R4
E2
R1 R2 R3 R4
E3
59
Table 18 shows ΔLAmax between the variation of type E, the canopy variation, in comparison to the results of the baseline scenario A0. The material used for the canopy is glass, similar to what was used for type D in the previous section. The results show no significant different between all variations, meaning the geometries of the canopy do not have major influence on the transmission of noise into the area behind the canopy. Though, the different in SPL at positions R2 are expected to be bigger than what have been obtained. The major decrease of SPL at position R4 is again relates to the reflection of sound on the atmospheric boundary in the simulation setup. Hence, only variation E1 will be further analyzed in more detail simulation.
5.4 Second baseline simulation
5.4.1 Second Simulation Set-up
Table 18: The different in LAmax of between design variation type E and A0
Figure 35: The second baseline simulation set-up, with various canyons dimension

Surface Width [m]
Angle of Incidence
[°]
Frequency [Hz]
125 250 500 1000 2000 4000
1.22 m
56.9°
0.12 0.43 0.93 0.81 0.89 0.94
1.90 m* 0.16 0.39 0.94 0.79 0.88 0.95
2.44 m 0.19 0.36 0.96 0.77 0.88 0.95
2.80 m* 0.20 0.30 0.96 0.76 0.88 0.96
3.66 m 0.20 0.24 0.97 0.75 0.87 0.97
4.20 m* 0.18 0.20 0.97 0.75 0.88 0.95
7.32 m 0.15 0.12 0.97 0.74 0.90 0.93
60
The second analysis focused on the impact of each design variation in different canyon types. The set-up was similar to the first baseline scenario with few adjustments. In this second part of simulation, the geometry of the buildings remains the same, while the numbers of canyon increased from one to three, each with different dimension. The three have different width which are 10 meters, 20 meters and 35 meters. In addition, the flight trajectory at long horizontal distance from the receivers, used in the first scenario, a second overhead flight trajectory based on the case study in Bangkok was introduced. The second flight trajectory located 185 meters horizontally and 600 meters vertically form the first receiver at 1:1 scale; however, similar to the case at Rijsenhout, half distance method were used. To compensate for the increase in simulation time the numbers of source were reduced from three on each trajectory to two. In addition, the results of S0 and S9 are the same, as the distance between the sources and receivers are identical. Figure 35 show the overall appearance of the second baseline scenario.
In addition to the standard setting mentioned in section 5.1.1 for the first simulation and baseline scenario, scattering coefficients of each design geometries were included in this second simulation to obtain more accurate results. Table 19 presented the scattering coefficients for different size of shapes or elements on the façade, ranges from 1.22 meters to 7.32 meters, between 125 Hz to 4000 Hz frequencies. Certain values within the Table, namely 1.90, 2.80, and 4.20 meters were estimated value according to the trend, where the larger the surface the more effective the geometry work against low frequency noise.
The scattering coefficient will be added only to certain design variations, including variations: A3, B2-1, B3-1 and B5. The scattering coefficient for the mentioned design variation was selected base on the width of one panel of façade geometries, as shown in Figure 36.
Table 19: Scattering coefficient used for geometry with different panel width within this research, source: (Cox et al., 2005)
Figure 36: Panel dimension of each design variation with rough façade surface

Source Position
Receiver Position
SPL per Frequency [dB]A-w [dB(A)]
125 250 500 1000 2000 4000
S0
R1 69.7 70.4 69.4 68.4 64.5 51.1 72.2
R2 63.9 65.1 65.5 63.9 58.2 45.2 67.5
R3 51.6 46.8 42.7 38.3 31.5 14.8 44.4
R4 56.7 54.3 51.3 47.4 40.7 23.7 52.6
R5 68.8 67.8 67.1 66.3 62.1 47.5 70.0
R6 52.0 47.7 43.5 39.0 31.8 12.3 45.1
R7 67.8 70.9 68.5 67.2 62.6 47.9 71.1
R8 34.6 33.9 32.7 31.2 26.4 10.4 35.1
S5
R1 70.4 71.3 70.1 69.0 65.3 53.0 73.0
R2 64.6 65.8 66.3 64.4 59.4 46.8 68.2
R3 52.0 47.1 43.0 38.7 32.0 15.7 44.8
R4 57.2 54.7 51.6 47.8 41.1 24.1 53.0
R5 68..9 68.3 67.8 67.1 63.0 49.2 70.7
R6 52.3 48.1 44.1 39.9 33.2 15.7 45.8
R7 68.5 71.3 69.1 67.8 63.4 49.4 71.7
R8 34.9 34.3 33.2 31.7 27.1 11.7 35.6
61
5.4.2 Second simulation: baseline scenario results
Figure 37: Location of each receivers with label of baseline scenarion variation A0
Table 20: The result of baseline scenario at Rijsenhout all receiver positions at two source positions
Table 21: The result of baseline scenario at Bangkok all receiver positions at two source positions

62
Table 20 and Table 21 show sound pressure level (SPL) of two different flight trajectories, one according to Rijsenhout and the other to Bangkok, at each receiver position in the second baseline scenario with three different street canyons width in octave band, ranges from 125 Hz to 4000 Hz. The position of each receiver can be seen in Figure 37. The higher SPL in Bangkok case was to be expected, as the distance between the source and receivers are much closer. In addition, due to higher position of the source and higher angle of incidence the shielding effect of the building was reduced. This occurrence can be observed at receivers R4, R6 and R8 where there is a significant increase in SPL. It can also be observed that the shielding effect of the building is greater at higher frequency, >1000 Hz, this is probably related to the diffraction of sound over the rooftops which is more pronounced for lower frequencies. When comparing all the results, one interesting thing to notice is there is large gap between the two receivers within the same canyon space, for example between R2 and R3. This large difference between two receivers is presumably related to simplification of software which represents sound as rays that move along linear path in which reflected and concentrated at certain location, while in actual reality sound propagate in a form of wave which likely to fill up the space more evenly and may result in smaller different between the two receivers. Figure 28 presents the general concept of the decrease in building shielding effect due to the increase in angle of incidence of sound in aircraft event. Note that Figure 38 is a schematic representation of the event without taking into consideration of the diffraction of sound due to roof edge and the shielding effect might be higher or lower than what is being represented.
5.4.3 Solid barrier: horizontal noise barrier
Figure 39 presents the ΔLAmax between the results of different roof geometries, or variations of type A, in comparison to the baseline scenario. The results are presented for both Rijsenhout, long horizontal distance flight path, and Bangkok, overhead flight path, at two source positions along each flight trajectory (position S0 and position S5, as mentioned in section 5.1.4, Figure 25). However, the results of both source positions show similar trend with negligible difference.
Figure 38: Different shielding effect, or shadow zone, created by the building with source at different position

63
Figure 39: The ΔLAmax between different roof geometries in comparison to the baseline scenario, A0

64
In accordance with the research presented in Chapter 3, the variations in building geometries can have both positive and negative impact on the SPL within the street canyon. These amplification and minimization of noise within the canyon are more prominent and vary in case of flight at long distance when compared to the overhead flight. For example, the increase in the height of the roof edge in variation A1, A2-1, and A5 trends to greater impact in case of smaller canyon (10 meters wide) at receiver R2, R3 and R5. The decrease in SPL at receiver R2 and R5 are likely to occur due to larger shadow zone due to the increase in overall building height due to roof geometries which indirectly increase the distance between the source and receiver behind the building, while at the same time this also mean the increase in reflecting surface. This mean that more noise is being trapped and reflected into the canyon; hence, the increase in SPL at receiver R3. However, the shielding effect of shadow zone depends on the building height-to-canyon width ratio, this phenomenon can be observed in section drawings presented in Figure 39 under each graph, where the current building height used in the simulation does not have any significant impact on 35 meters canyon, mainly at receiver R7.
The different in SPL at receiver R4 and R6 of different design variations show that the geometry of the roof does indeed have influence on propagation of aircraft noise. The building with slanted roof element facing toward the noise source tends to perform better than the building with flat surface as sound is being reflected back into the atmosphere or diffracted to other direction as shows in Figure 40. The different in SPL ranges from 0.7 to 12.1 dB(A) depending on the size of the slanted surface. Larger surface area means more sound is being reflected or diffracted away and lower the SPL within the canyon. Example can be seen in case of variation A2-1 and A5 in the 20 meters canyon, or at receiver R4 and R5. The different in SPL at receiver R4 and R6 of each design variation also suggests that there might be a correlation between the angle of the roof and the width of the canyon; however, more research is required to verify it validity for this argument and it is not relevant to main objective of this research.
On the other hand, the roof geometries have lesser influence on the propagation of aircraft noise when the aircraft is located at overhead position. While the results of most variations
Figure 39 (continue): The ΔLAmax between different roof geometries in comparison to the baseline scenario, A0

65
show a decrease in SPL, it is limited only to the quiet side façade, or at receiver R2, R4, R6 and R8, and mainly due to the larger shadow zone caused by the increase in overall building height due to the position of roof edge as shows in the section drawings in Figure 39. It can be observed in the results that there only small different between in noise reduction between most variations—A1, A2-1 and A3—approximately between 0.7 dB(A) to 2.1 dB(A) difference. While in variation A5, due to lower roof edge the shadow zone on the quiet façade becomes smaller and significantly increase the SPL at the receivers. The ineffectiveness of roof geometries against overhead aircraft is also due to steep angle of incidence, Figure 41, which make sound more difficult to be shielded by the building and roof geometries.
According to the results in this section, it can be concluded that the shape of the roof does indeed has influence on the propagation of the aircraft noise. The level of manipulation of the roof geometry is greater when the aircraft is located at longer horizontal distance with lesser angle of incidence and become less effective as the angle of incidence increase with the altitude of the aircraft. The results suggest that in case of aircraft flyover, the position and shape of the roof edge may have a greater impact that the overall shape of the roof. For example, an overhang is likely to provide larger noise shadow zone in case of aircraft at overhead position.
Figure 40: Conceptual sound propagation path to the receiver on exposed and quiet facade
Figure 41: The Conceptual sound propagation path of source at different position and angle of incidence

66
5.4.4 Solid barrier: vertical noise barrier
Figure 42a: The ΔLAmax between different façade geometries in comparison to the baseline scenario, A1

67
Figure 42b: The ΔLAmax between different façade geometries in comparison to the baseline scenario, A1

68
Similar to the simulation in the first phase, the results of the façade variations were compared to variation A1 with flat roof instead of A0 with gable roof to avoid any influence from the roof geometry. Figure 42a, Figure 42b, and Figure 42c show the ΔLAmax between each façade variations in comparison to variation A1. Note that three subvariants are being introduced to variation B2-1 and one subvariant was added to variation B3-1 and B5-1 each. Variation B2-1a, B3-1a and B5-1a are original scheme adopted directly from section 5.3. In variations B2-1b the depth of the folded façade was increased from 0.5 meter to 1 meter, while in variation B2-1c, B2-1d, B3-1b and B5-1b the façade intervention was applied to both exposed and quiet façade side of the building, as shows in the sections in Figure 42a, 42b and 42c.
Like the simulation on roof geometries, the results show that shape of the façade does indeed have influence on the propagation of aircraft noise and likewise the effect is greater for the aircraft that located at further horizontal distance than aircraft at overhead position. This occurrence is to be expected when consider the different in angle of incidence between the two case, where more reflections are occurring on the vertical surface of the building when the aircraft is located at larger horizontal distance.
Figure 42c: The ΔLAmax between different façade geometries in comparison to the baseline scenario, A1

69
In general, the results show that each façade variation with extrude triangle elements (variation B2-1a to B3-1b) and protrusion elements (B5-1a and B5-1b) has potential to minimize the SPL in front of the exposed façade when the aircraft is located at further distance. This reduction in SPL range from 0.6 dB(A) to 8.0 dB(A), at position R1, R5 and R7, depending on the façade shape and canyon type. The decrease in SPL happened due to the scattering and dispersion of sound on the folded surface, Figure 43, which reduce the reflection problem and minimized the sound at street level. The larger the extruded element the greater the impact it has on sound reduction, as larger range of frequencies are being affected, especially in that of the lower frequencies range, <250 Hz. It can also be observed in the Table 19, presented previously in section 5.4, that the scattering coefficient of low frequency noise is proportional to the width of the surface as there is a relationship between the size of the plane and the size of the wavelength.
However, these façade variations must be used with caution as in some specific situation they have the potential to amplify noise at street level, especially when they are applied in a smaller canyon. The results show that there is significant increase in SPL at receiver R2 and R3 located in 10 meters canyon when most design variation of type B with extrusion elements were used. The reason for this increase in noise level within in the canyon is probably due to the sound is being trapped and reflected back and forth within the canyon by the protrusion elements on the façade. This mean that it is more difficult for sound to escape out of the canyon; hence, an overall increase in SPL. In addition, the design variations also have the potential to manipulate reflection of sound and amplify the sound level at specific position on the street. This example can be observed at receiver R6 in variation B2-1a to B2-1d, B5-1a, and B5-1b where there is an increase in SPL.
While the results between two source positions, S0 and S5, of most variations show similar trend with slight increase in SPL when the aircraft is closet to receiver at position S5, variation B3-1a and B3-1b show otherwise. In these two variations the position of the source along its trajectory line become more important where more sound is being reflected toward the receiver when the aircraft is located at specific location, for example when it is located directly in front and perpendicular to the exposed façade. Figure 44 shows the schematic diagram of sound in variation B3-1a in comparison to variation A1 from the top view.
Figure 43: Conceptual sound propagation path and scattering effect cause by the extrusion and protrusion on the facade

70
By comparing variation B2-1a to its subvariant B2-1b, the results show that the angle of the folded façade and the size of the plane do indeed have influence on the propagation of aircraft noise. Variation B2-1b with the folded façade slanted more toward the sky (at 76°) shows better result than variation B2-1a (at 54°) as more sound is being reflected back into the atmosphere. On the other hand, the simulations with design variation to both exposed and quiet facade—variation B2-1c, B2-1d, B3-1b and B5-1b—do not show any significant different in SPL when compared simulations with the variations only applied to the exposed façade. This is understandable since most reflections occurred on the exposed façade rather than the quiet façade.
Like aircraft at further horizontal distance, these façade variations also have the potential to improve the SPL on the exposed façade in aircraft flyover event. This reduction in SPL can range from 0.9 dB(A) to 1.8 dB(A) if the designs were applied only to exposed façade. Unlike source at larger distance, the effect can increased further, between 0.3 dB(A) to as high as 11.7 dB(A), if the interventions were also applied to quiet façade, as most reflection in case of aircraft flyover occurred on the ground or horizontal plane, which located closed to the quiet façade, as show in Figure 45. Note that the results of receiver R8 are not taken into consideration, as the decrease in SPL is related to the reflection of sound from the atmospheric boundary with 99% absorption coefficient.
Figure 44: Conceptual sound propagation path between variation A1 and variation B3-1a at two source positions
Figure 45: Conceptual sound propagation path showing the scattering effect of façade on aircraft source at overhead position

71
5.4.5 Solid barrier: slanted noise barrier
Figure 46: The ΔLAmax between variation C1-1a to A0 and other variation of type C to C1-1a

72
Figure 46 show the ΔLAmax between variation C1-1a and A0, and other variation of type C in comparison to variation C1-1a. Similar to the previous simulation on façade geometry, two subvariants of intervention C1-1a were introduced. One with lesser steep slope at 30° (C1-1b) and the other with steeper slope at 45°, while the original scheme has the slope of 35.75°, Figure 47.
The analyses show that variation C1-1a, in case of aircraft located further away from the receiver, has better performance in comparison to the baseline scenario A0, as there is a decrease in SPL in most receivers, expect at R1 and R7, as the sound is being reflected away
Figure 46 (continue): The ΔLAmax between variation C1-1a to A0 and other variation of type C to C1-1a
Figure 47: The additional subvariant of variation C1-1a

73
from the canyon by the slanted surface. This is similar for both aircraft at larger horizontal distance and aircraft at overhead position. The simulations on the subvariants of variation C1-1a also show that the angle of the slanted barrier doesn’t have significant influence on the propagation of sound, observed from receiver R1. The major increase and decrease in SPL in subvariants C1-1b and C1-1c of Rijsenhout case were mainly resulted from the change in canyon width and receivers’ position which in some case relocated to be under the shadow zone of the building as shows in the section drawing in Figure 38. The major drop in SPL at receiver R2 and R3 in variation C1-1a in comparison to A0 is also expected to have the same reason.
The results of variation C3-1 also show that geometry of the slant barrier doesn’t have influence on the propagation of the noise as there is not any significant different in SPL between variation C3-1 and C1-1a. However, the increase in size of the slanted surface does improved the SPL on the exposed façade as show in the results of variation C2-1 at receiver R1, R5 and R7. On the other hand, it has potential to amplify SPL at the receivers in front of exposed façade, when aircraft source is located at overhead position, due to the manipulation of reflecting angle of sound as show in Figure 48.
Figure 48: Conceptual sound propagation path showing the scattering effect of slanted barrier of variation C2-1

74
5.4.6 Buffer zone: winter garden
The analyses in this section focused on impact of buffer zone design variations on propagation of aircraft noise on both outdoor and indoor space in three different canyons size. Glass was used as a surface material for the winter garden. The acoustic property of glass can be seen in Table 10 presented in section 5.2.3. Figure 50 shows the ΔLAmax at each receiver positions between variation D1-1 and baseline scenario, variation A0. The analyses show that an addition of winter garden to the existing building doesn’t have any influence on the propagation of aircraft noise toward outdoor area for both case studies. These results are as expected, as the overall geometry of the building is similar to the simulation of variation type C1-1 of the slanted barrier geometry. The drop in SPL at position R2 and R3 is likely to be due to the relocation of the receivers behind the shadow zone of the building as show in Figure 49.
In order to test the influence of the winter garden scheme, or variation D1-1, on noise attenuation toward the indoor, alternative materials were used as wall material for the winter garden. These materials include perforated metal sheet, 10 mm thick plywood board, polyester cloth with 15 mm air gap behind the textile surface and green wall module system of 120 mm thickness. The acoustic properties of these materials are presented in Table 10 and Table 12. Unfortunately, the results of these simulations show exactly same noise reduction rate at receiver R1a, R3a, R5a and R7a (Figure 43) for all materials. This problem may result from the human error during the set-up of the programs, however, due to limited time frame an alternative estimation method was proposed. Alternatively, the effectiveness of each material
Figure 49: Diagram showing the shadow created by variation D1-1
Figure 50: The ΔLAmax at each receiver positions between variation D1-1 and A0

Surface material Angle of incidence (°)Sound reduction index (R)
125 250 500 1000 2000 4000
Metal sheet: perforated steel deck, 0.75 mm thk
Random 15.3 21.2 27.2 33.2 39.2 45.2
32° 13.9 19.8 25.8 31.8 37.8 43.8
73° 5.8 10.8 16.6 22.5 28.5 34.6
Wood: Plywood board, 10 mm thk
Random 16.3 22.2 28.2 34.2 40.3 46.3
32° 14.9 20.8 26.8 32.8 38.8 44.8
73° 6.6 11.8 17.6 23.6 29.6 35.6
Membrane: Latex membrane, 0.58 mm thk with 15 mm air gap
Random 1.4 3.9 8.3 13.9 19.7 25.7
32° 1.0 3.1 7.2 12.5 18.3 24.3
73° 0.0 0.0 0.0 0.0 0.0 0.0
Textile: Polyester cloth, 3.5 mm thk with 15 mm air gap
Random 0.2 0.7 2.3 5.8 10.8 16.6
32° 0.1 0.5 1.8 4.8 9.5 15.2
73° 0.0 0.0 0.0 0.0 0.0 0.0
75
5.4.7 Buffer zone: canopy
can be observed through their noise reduction index (R) in Table 13, which was calculated using mass law, note that the information presented are calculated based on random angle of incidence. According to the theory on sound reduction the acoustic property of the material is expected to become less effective against aircraft noise due to higher angle of incidence of sound. Table 22 show the sound reduction index of some materials used in this research with angle of incidence of aircraft source at Rijsenhout (32°) and at Bangkok (73°). The results are as expected that the material with higher mass and thickness will performed better than material with lower mass and thickness.
Figure 51: The ΔLAmax at each receiver positions between variation E1 and A0
Table 22: The effect of different angle of incidence on the sound reduction index of each material

76
Figure 51 show the analyses on ΔLAmax between variation E1, the canopy scheme, and the baseline scenario A0. The results are as expected that there is a significant improvement in SPL mainly at the receivers which normally directly exposed to noise source in the baseline scenario, position R5 and R7, as the receivers are now behind the shadow zone of the design intervention, Figure 52. The same result can be expected in case of Bangkok, if the dimension of the canopy is larger than what is used within the simulation of located over the receiver.
5.4.7 Materiality: surface treatment
Figure 52: Diagram showing the shadow created by variation E1
Figure 53: Chart showing the average sound reduction when different surface materials were used for aircraft position of Rijsenhout

77
Building materials with different mass, thickness, stiffness and surface roughness tends to have different acoutic behavior, as they have different absorption coefficient, noise reduction index, and transmission coefficient. The absorption and transmission coefficient of each materials used in this research can be observed in the Tables presented previously in section 5.2.
The last analysis on the materiality of the building surface focused exploring the acoutic properties of the materials and their influence on the propogration of aircraft noise in an outdoor area. Figure 53 and Figure 54 show the change in SPL when different surface materials were used on the exposed facade in comparison to traditional brick façade for both case studies with different source positons. The results are show in different frequency, range from 125Hz to 4000Hz. The analyses show that in case of Rijsenhout, most hard and smooth materials—including glass, perforated metal, and wood—have similar performance as a brick wall. Though, glass and metal perform slightly better at low frequency, at 125 Hz, when compare to wood and brick. On the hand, soft materials with high porosity such as ployester cloth and plantation with soil substrate have higher sound reduction in all frequency range, especailly at lower frequencies, <250 Hz, as the sound energy are being absorpted and
Figure 54: Chart showing the average sound reduction when different surface materials were used for aircraft position of Bangkok

78
converted into heat energy due to the friction within the pore of the materials. In addition, the analyses also show that by using porous or soft materials as a surface materials will also help in reducing the reflection of low frequency noise occurred at street level. This can be observed from the sound reduction chart on quiet façade in Rijsenhout case at 125 Hz and 250 Hz.
The results on building surface materiality in case of Bangkok, where the source is located overhead ,suggested that the absoption properties of the materials are greatly influence by the angle of incidence of sound. The results can be seen in Figure 54 where the changes in SPL are much lower than that of Rijsenhout, and in lower frequency certain materials may even lost their sound reduction property.
These results indicate that the absorbing effect of each surface materials greatly depends on the location in which the materials are applied on in combination with the position of the source. Additional simulations were conducted to prove the argument. Figure 55 shows an analysis where plantation was applied to two different surfaces, one on the façade and the other on the horizonal plane. The simulations were done under similar setup with any other simulation done within this research and for two case studies. The results show that the location of the absorbing materials and position of the source do indeed have influence of the absorption property of the materials. The analyses show that the decrease in SPL at street level is greater in case of Rijsenhout, where most reflection occurred on the façade, when the materials were applied on the façade and vice versa in case of Bangkok.
The analyses in this chapter show that geometries of the building envelope do indeed have impact on the propagation of aircraft noise; though limited to the outdoor area. The extent of influence of each different variations, both the roof and the façade, depend on two factors. First is the position of the noise source. The higher and steeper the angle of incidence of sound becomes the lower the influence of building geometries have on attenuating the
5.5 Chapter 5 Summary
Figure 55: Chart showing the different in sound reduction when surface materials were applied at different location for both Rijsenhout and Bangkok cases

79
aircraft noise, as sound become more difficult to block by the building and receivers within the canyon are directly exposed to the noise source. Overhang structure or canopy structure is be one of solution to attenuate the propagation of aircraft noise in an outdoor area. The second factor is the condition of the surrounding context, mainly the dimension of the canyon in front of the building envelop. The relationship between each design intervention and the width of the canyon needs be taken into consideration when designing building envelop in the airport regions. As in some case, for example a small canyon in combination with façade with protrusion can amplify the SPL at street level rather than minimize it. The attenuation effect of building envelops have greater impact of higher sound frequency, >1000 Hz, when comparing the different in SPL on the exposed and quite façade.
The attenuation of aircraft noise toward indoor space mainly depend on the construction material of the envelop rather than its geometry. In accordance to most preceding researches and to the experiment done in this research, the results suggest that the higher the mass, thickness and stiffness the materials have the better sound reduction index they have and better at dealing with low frequency noise. On the other hand, the results show otherwise for the surface material for the building envelop. The lighter and more porous materials work better in minimizing the propagation of aircraft noise. The most effective materials are polyester cloth with 25 mm air gap behind and the green wall system. However, acoustic property of the materials is greatly influence by the angle of incidence of sound. The steeper the angle of incidence the less effective the materials become. Hence, the location and angle at which the materials are applied is also relevant to the overall influence of the building envelop on the mitigation of aircraft noise both toward the outdoor and indoor.

80
Chapter 6DESIGN GUIDELINE AND CASES

81
Chapter 6: Design guideline and cases This chapter focused on the development of design proposal and recommendation based on the outcome of the researches and simulations. The analyses done in Chapter 5 revealed that the geometry and materiality of the building envelop has a strong influence on the propagation of aircraft on the outdoor, while the properties of the materials—mass, thickness and stiffness—on the attenuation of noise toward the indoor, as well as the outdoor noise levels for materials with good absorption. The degree of effect of each geometry can varies depend on the source position and the surrounding urban context. In this chapter several design recommendations for Rijsenhout and Bangkok will be proposed based on the finding of the previous chapters.
According to the results from Chapter 5, general guidelines for urban planning can be drawn. The aim of these guidelines is to serve as a starting for an architect, urban planner, and related government agencies to use to a based for developing a healthier urban environment within the airport regions or other locations which are affected by environmental noise caused by aircraft. The recommendation of each design variations per each urban case is depending on the angle of incidence (position of source) and on the shape of the canyon as these two factors have the most influence on the effectiveness of each variations.
In general, urban canyon shape can be categorized in to two main shape. The L-shape canyon with open field one side and building on the other side, and the U-shape canyon with buildings on both side of the street. On the other hand, the angle of incidence can vary greatly between different locations, depending on the position of the source and receiver and the height of the building; however, in these guidelines the angle of incidences are divided into two main group which are the angles with direct transmission and the angles with indirect transmission toward the receiver.
Figure 56 shows the general urban planning guideline according to the results obtained from previous researches. Five general urban cases were presented:
For each case the best variations for roof geometry, façade geometry, buffer zone, and materiality were proposed as a recommendation for an architect and urban planner to consider during the design phase. For example, in case of U-Shape canyon of 10-meter-wide or lesser where there is a direct transmission between the source and receiver the roof geometry has
6.1 General guideline for urban planning
1. L-shape canyon 2. U-shape canyon of 10 meters and lesser with indirect transmission between the source
and receiver3. U-shape canyon of10 meters and lesser with direct transmission between the source
and receiver4. U-shape canyon of 20 meters and larger with indirect transmission, and finally 5. U-shape canyon of 20 meters and larger with direct transmission between the source
and receiver

82
Figu
re 5
6: G
ener
al g
uide
line
for u
rban
pla
nnin
g ac
cord
ing
to d
iffer
ent a
ngle
of i
ncid
ence
(sou
rce
positi
on) a
nd th
e sh
ape
of th
e ca
nyon
.

LANDSACPE
SLANTEDBARRIER
WINTERGARDEN
HORIZONTALFOLDED
VERTICALFOLDED
20° PITCH ROOF
WAVE FACADE
RIJSENHOUT POTENTIAL VARIATIONS
WINTERGARDEN
COVER PATH
HORIZONTALFOLDED
20° PITCH ROOF
SLANTEDBARRIER
WAVE FACADE
BANGKOK POTENTIAL VARIATIONS
83
minimal influence on the propagation on aircraft noise on the street level, hence it is not recommended. On the other hand, the use of protrusion element on the both façade side within the canyon can reduce overall SPL at street level due to the scattering effect due to the uneven surface; the use of urban canopy can also help in reducing the SPL by creating a barrier over the street. In term of materiality, adding small shrub and plantation on the street will help reducing the reflection caused by the hard ground surface and reduce the overall SPL within the canyon.
According to the general guideline and the simulations results, several design proposals for the two case studies, Rijsenhout and Bangkok, can be developed. These proposals were developed based on the effective geometries and variations that are effective against aircraft noise propagation as shows in Figure 57.
Most residential buildings at Rijsenhout are typical Dutch row house of similar height with an approximately 20 meters wide canyon in between each row. This mean that majority of the building surfaces, both the façade and roof, are being directly exposed to the aircraft noise with almost no shielding effect from the nearby building. The only existing shadow zone extended only few meters right behind each building. The simulations show that several geometries show in Figure 57, have potential to influence the propagation of aircraft noise on the exposed facade on the outdoor environment. These geometries can then be used in combination with variation D1-1, the winter garden, to attenuate the transmission of sound to the indoor area. Figure 58 shows three sketch designs were developed according to this idea. These suggested idea were then evelatuated based on their possible pros and cons in term of acoustic performance and sustainable posssibility.
6.2 Design cases
6.2.1 Rijsenhout design case
Figure 57: Variations that are effective in reducing aircraft noise propagations in both Rijsenhout and Bangkok cases

84
The first proposal is to add a winter garden on the exposed side of the residential building, Figure 59, to create a noise buffer between the exterior noise and the actual building facade. The transmission of noise toward the interior space of the building can be expected to decrease by at least 24.6 to 27.7 dB(A) if the winter garden is to be built with typical double glaze panel. In additional to the acoustic improvement toward the indoor area, this design intervention can be used to preheat incoming ventilation in winter. Other sustainable technology can also be added this intervention to make the design more sustainable. For example, green roof system can be applied to the extra roof space provide by the winter garden to help reducing urban heat island effect, while also lower the interior temperature during the summer. Alternatively, a transparent solar panel can be installed to the roof surface of the winter garden to make the residential building more self-sustain; though this intervention will be most effective for the residential building which have an exposed façade facing toward the south or west. The downside to this solution is that while it likely to have impact on the attenuation of noise toward the interior space, it has very less impact against the propagation of noise toward outdoor area. In addition, the space need to be opened in summer to get rid of the heat which may greatly reduce the acoustic insulation of the space.
Alternative to the first proposal which required considerable area for construction, a more space efficient solution such as double skin façade can also be used as shows in Figure 60. The idea of this design is similar to the previous one, as to create the buffer space in front
A. Design case 1: Winter garden
B. Design case 2: Double skin façade
Figure 58: Sketch design proposals for Rijsenhout case
Figure 59: Winter garden proposal with different integral design solution for housing at Rijsenhout

85
of the building to prevent the façade from directly expose of aircraft noise. Certain geometry such as protrusion element can be incorporated into the design to help disperse the reflection of aircraft noise and lower the SPL at the street level in front of the façade. In term of materiality, glass and green walls system can be used as the surface material for the double skin façade. The glass for daylighting of the building and solar heat gain to heat up interior air during winter. The vegetation surface would provide extra layer of thermal insulation during summer as well as increasing sound absorption surface and reduce the overall SPL in an outdoor area caused by the reflection. According to the results from previous chapter, a reduction of 1.3 to 2.3 can be expected. Additionally, the hot air can be ventilated through the gap between the new and old façade to cool down the building in summer. Alternatively, a transparent solar panel can be used instead of normal glass panel to increase building performance in term of sustainability. The downside of this design is the opening for the ventilation, as the acoustic insulation property of the facade depends greatly on the side of this opening.
The last design proposal for Rijsenhout is an extended canopy, Figure 61. The idea is to create an outdoor urban canopy as extension to the existing building. The extended roof together with the building will then make a large noise barrier against aircraft noise that would not only benefit the resident of the building but also to the passerby in front of the building. While the canopy acts as the barrier, preventing the building from directly exposed to aircraft noise, it can also shelter during rain especially in the Dutch weather. Green roof can also be applied to this large slanted surface to reduce urban heat island effect. However, the performance toward indoor noise attenuation is likely to be lesser in comparison to the previous designs and the affordability of this design due to its size is still a problem.
C. Design case 3: Extended canopy
Figure 60: Double skin facade proposal with different integral design solution for housing at Rijsenhout
Figure 61: Extended canopy proposal with possible integral design solution for housing at Rijsenhout

86
Unlike Rijsenhout, the position of the noise source in Bangkok is located must closed and almost directly above the residential unit. The shielding effect of the building, or the shadow zone, is limited only of few meters in front of the quiet façade, highlighted in gray, as show in Figure 62. The results of the previous chapter show that aircraft at overhead position is more difficult to deal with when compared to aircraft which located further away from the receivers, as the mitigation effect of each design variations become less effective. The analyses show that the optimal method in shielding the receiver form overhead noise source is likely to make use of the overhang structure, such as the overhang roof or urban canopy to block the direct sound path between the source and the receiver. Similar to the design case in Rijsenhout, three sketch designs were made for Bangkok case as shows in Figure 62.
The first design idea for housing units around Suvarnabhumi airport is to redesign an existing roof into a large overhang structure over that building. This large overhang will benefit not only the residents, but also the passerby on the street as it creates large shadow zone that extended also into the public space. Layer of green surface can be added on top of this structure to improve sound insulation property of the roof as well as reducing the heat transmission through the roof To make the most out of this large roof surface PV cell and rainwater collecting system can be added to the design to make the housing more sustainable in term of resource consumption, as shows in Figure 63. However, the most important drawback of this design intervention is the affordability of the design due to the size of the structure and amount of the materials required to stabilize the structure. Additionally, the canopy needed to be applied for all house in the row for it to work properly.
6.2.2 Bangkok design case
A Design case 4: Large overhang structure
Figure 62: Sketch design proposals for Bangkok case
Figure 63: Possible integral design solution for large overhang structure

87
The more cost-effective solution might be to renovate part of the roof structure of the existing building and creating an enclosed balcony on the exposed side of the building. The idea is to create a buffer zone between noise source and the old building facade to reduce the transmission of noise toward the indoor. Similar to previous proposal, to improve the sound insulation property of the roof a layer of green roof can be added to the existing building roof. Alternatively, for new building the roof can be built with concrete, which is high in density and has better sound insulation property.
Three design schemes were proposed for the semi-enclosed balcony as show in Figure 64. The first option is a double skin façade with glass sliding door on the interior side and perforated metal louver for the exterior. The louver can be adjusted according to the angle of incidence to maximize the scattering effect of aircraft sound, while the perforated metal will also act as a shading system for the building. As the space maybe relied on mechanical ventilation system, PV-cell can be added to cover up the higher energy consumption of the building. In the second option, the PV-cell can be replaced with green roof system to enhance both acoustic and thermal insulation of the roof. In the third option, the semi-enclosed balcony façade can be constructed with green wall system. The system will benefit the building both in term of acoustic and thermal comfort, as the extra layer of plantation substrate will work as a sound insulation, while the moisture content within the system will cool down the building. The disadvantage of this design idea is the size of the opening of the façade, if large openings is required for ventilation, more noise will still penetrate into the balcony.
This variation is likely the most economical of all proposed solutions. It is the most common adjustment most resident made on their property as a mean to provide shading on the courtyard and reducing heat, as seen in Figure 26 in Chapter 4. This design variation aims to improve the sound insulation and reducing the reflection on the surface of the front canopy. One solution is to apply the green roof system on top of the overhang as show in Figure 65. This will increase the overall thickness of the overhang layer and improve the sound insulation property of the overhang, while the rough plantation surface and porous substrate layer will disperse the reflection of sound and reduce the over SPL on the façade.
B. Design case 5: Semi-enclosed balcony
C. Design case 6: Front canopy/overhang
Figure 64: Possible integral design solution for semi-enclosed balcony

Rijsenhout case
Design case Advantages Disadvantages
Case 1: Winter garden
• Impoved soundi insulation on exposed facade
• Preheating incooming ventilation in winter
• Integrate with green roof system to reduce urban heat island effect
• Integrate with PV cell to generate energy
• Extra semi-outdoor space for residents
• Possibility of overheat during summer
• Required opening for ventilation during summer, which may reduce the sound proof effect of the space
• Required certain amount of floor area to build
Case 2: Double skin facade
• Improved sound insulation on exposed facade
• Reduce outdoor noise due to scattering effect
• Preheating incoming ventilation during winter
• Ventilate hot air out of the building during summer
• Intergrate with PV-cell• Required lesser space to build
• Possibility of overheat during summer
• Required opening for ventilation during summer, which may reduce the sound proof effect of the space
Case 3: Extended canopy
• Improved sound impact on both outdoor and indoor
• Integrate with green roof to reduce urban heat island
• Intergrate with rain water collection system
• Provide shelter during rain
• Less effecting in reducing indoor noise
• Affordability of the design
88
This green roof system can also act as a rainwater collection system during the wet season to be used during the dry season of the year. However, this design intervention will of course be less effective for reducing indoor noise levels in the entire house when compare to other design interventions.
Table 23 and 24 below summarized and compared the advantages and the disadvantages between each design cases for both Rijsenhout and Bangkok. By listing out their pros and cons, the decision can be made for the most suitable design for each case and further developed in term of construction details and materiality of the design. In case of this research, one design case for each location was selected, case 1 and case 4, and a primary construction details was drawn and presented in Appendix B.
Figure 65: Front canopy/overhang proposal with possible integral design solution for housing at Bangkok
Table 23:Comapring the pros and cons between each design interventions of Rijsenhout case

2 Final designSTEP 8Refine the design
[optional]
STEP 7On-site testingand documentation
STEP 6
Design developmentSTEP 5
Design simulationSTEP 4
Preliminary designSTEP 3
Determine therequirement
STEP 2Site investigation andon-site measurement
STEP 1Located the site of interest
STEP 0
Bangkok case
Design case Advantages Disadvantages
Case 4: Large overhang
• Improved both sound insulation of the builiding and partly act as outdoor noise barrier
• Provide outdoor shading• Possibility to integrate with green
roof, PV cell, and rain water collection system
• Affordability of the design• The design must be applied to all
the house in the row for it to work properly
Case 5: Semi-enclosed balcony
• Improved sound insulation on the exposed facade
• Depend on facade geometry: possible to reduce outdoor noise
• Provide extra semi-outdoor space• Can intergrae with PV cell, green
envelop system, and rain water collection
• Sound proof effect of the design depend on the size of the opening
Case 6: Front canopy
• Reduce teh reflection of sound in outdoor area
• Provide outdoor shading• Can integrate with green roof
system and rainwater collection system
• Less effective for indoor noise reduction
Step 0: Prior to the first step, the specific target location to be improve or design needed to be determined. Usually this is given by either the client who which to improve their building or specific by the government agencies if the scope of the project is of larger scale (urban scale).
89
6.3 Design strategy in airport region
Based on the procedure of this research a set of strategy, or steps, for designing a good urban area within airport regions can be developed. Figure 65 show eight steps, which an architect, urban planners, and governments agencies that are relate to the topic, could use as a basic guideline when designing or improving the urban areas that are affected by aircraft noise. These nine steps are:
Table 24:Comapring the pros and cons between each design interventions of Bangkok case
Figure 66:Recommended steps in order to create good design in airport regions

Step 1: During the first step of designing a good urban environment in the airport regions an investigation on site must be conducted. In this investigation the general situation of the urban space must be documented. These include the shape of the canyon, the shape of the building, the height of the building, different noise sources in the site, and the positions of the aircraft noise source. An on-site acoustic measurement, both when the aircraft is present and absent, must be conducted to get to know the extent of the problem.
Step 2: After the data of the site was obtained. The set of requirement or design boundary can be listed out. These set of requirements include the minimum requirement in term of acoustic, thermal, and daylighting performance, as well as the aesthetic, of the new building or new envelope
Step 3: During the third step, the primary sketch design can be developed based on the set of requirements in combination with general urban planning guideline presented in the section 6.1.
Step 4: The preliminary sketch designs are then transformed into 3D digital model to simulate in acoustic simulation software for their acoustic performance. Prior to the simulation, the software must be checked for its reliability by re-simulate an on-site measurement done Step 2 and the comparison between the two results must be made. In addition, it is good to identify the limitation of the software prior to any actual simulation to prevent any unexpected outcome or error.
Step 5: The design is further developed in term of its materiality and geometry according to the result of the simulation and the its performance requirement.
Step 6: This is one of the most important steps in this set of strategy and is missing form this research due to time constraint and affordability. After the design has been refined according to the set of required parameters, a mockup of 1-to-1 scale is to be built and placed on site to test it actual performance in real situation. The performance of the design is to be documented.
Step 7: This step is optional, depending on the outcome of the previous step. If any possible flaw of the design was noticed during an on-site experiment, then the design needs to be re-adjusted to prevent any long-term problem that may occurred.
Step 8: Finally, the last step of this design strategy is to finalize the design and developed into a final technical drawing for it to be built and used.
90

91
Chapter 7CONCLUSION
92
Chapter 7: Conclusion and reflection
Airport and aviation activities, after it first appearance in 1900s, have elevated the transportation industry to a new height. They are both the country biggest economic engine and connection hotspot, as well as biggest source of environmental and social impact—including noise, CO2 emission, territorial disruption and depreciation of local property. Though, noise is by far the most problematic issues, due to its large area of impact that is closely relate to the health, the urban development and the economics of the surrounding neighborhoods.
Up to this point, many researches were conducted on the influence of building on the propagation of various noise source; however, very few are related to annoyance cause by aircraft. Hence, this research aims to explore the extent of influence of building envelop on the propagation of aircraft noise toward both outdoor and indoor area of the residential building. In order to effectively assess each building, envelope variation, based on the research on different noise abatement technique in Chapter 2 and Chapter 3, two case studies with different source positions and contexts were adopted, one at Rijsenhout and the other at Bangkok.
The outcomes of the research show that the building envelope though its geometries, construction system and surface material do indeed has influence on the propagation of aircraft noise. The geometries of the building envelop mainly have an impact on the attenuation of outdoor noise. The degree of influence can range from 0.1 dB(A) to as high as 17.2 dB(A) depending on the geometries of the envelope, the size of the canyons and most important to position of the sources. The closer the source is to the overhead position the lesser impact the building geometries have on the attenuation of aircraft noise. The result also show that the shape of the building has greater effect on noise at higher frequency, >1000 Hz, than noise at lower frequency, <250 Hz, mainly due to the diffraction occurred when the noise collided with the building edge or surface.
The construction materials of the building envelope mainly deal with the transmission of noise toward the interior space of the building. The thicker and heavier the material the better it works against low-frequency noise emits by aircraft. Alternatively to a massive wall or roof construction, the improvement on the transmission of sound toward indoor space can be applied in a form of buffer zone, such as winter garden or double skin façade with thinner materials and air space in between the actual building facade, thought the noise reduction effect still depend greatly on the mass of the exposed material.
On the other hand, the surface material of the façade can influence both the propagation of aircraft noise toward both the outdoor and indoor. The results show that soft and porous materials work best at minimizing the reflection of aircraft noise toward the outdoor environment as the sound energy is being absorbed and converted into heat energy due to friction within the hole of the material. The most effective materials in case of this research are polyester cloth with 25 mm air gap behind and the green wall system. However, for a cloth material a heavy structure is needed behind otherwise the noise can easily enter the building.
7.1 Conclusion

93
Additionally, it must be noted that both the sound reduction and absorption properties of the materials are greatly influence by the angle of incidence of sound. In order to achieve the maximum sound reduction and absorption it is recommends that the applied surface need to be angled against the noise source to create a reflection angle that is close to 0° as possible.
In the final chapter of this research, several design proposals were made, in accordance to the results of the simulations, as a solution to improve the living condition of the residents in Rijsenhout and Bangkok. However, many questions remain especially on the actual performance of the design solutions in actual situation and the feasibility and affordability of the design. It must also be noted that in order each design solution to achieve the maximum effect in mitigating annoyance cause by the aircraft, the design must be applied in a community scale. The improvement of single building may be too small to have any significant impact at all. Hence, in order to successfully dealing with aircraft annoyance a collaboration between residents and different related parties are required.
Though the course of this research several limitations were noticed. The first limitation relates to the simulation software. While it is possible to use CATT-acoustic v9.0c—a room acoustic simulation software—to simulate outdoor situation during an aircraft event, the software come with several constraints which deviate its results from the actual reality and in many case time is required to spend on interpreting the outcome of these result and come up with a logical conclusion. One example of this constraint is the large decrease in SPL at the receivers which are position close to the boundary of the simulation caused by the reflection on the atmospheric boundaries. Due to the nature of the simulation software aims for simulating indoor environment, it is impossible to include any weather effect, especially the wind, and any refraction of sound caused by these events into the simulation. Depending on the speed and direction of the wind, the results of each variations may change drastically. In addition, CATT-acoustic doesn’t include the scattering effect based on the geometry of the model and only consider the scattering effect of the surface through scattering coefficient. This mean the results in term of scattering effect of the building is only a mathematical approximation of its effects without taking into consideration the geometry of the façade element or the reflection angle which may occurred due to that specific shape.
Another limitation to the research deal with the availability of the information on the acoustic property of construction materials. Throughout the research, the author finds that it is quite difficult to find a good source for acoustic property of each materials used in this research. These properties include: the absorption coefficient, transmission coefficient, scatter coefficient, and sound reduction index. Some unavailable values need to be hand calculated and prone to human error. On the other hand, the values that are available come from various sources and under different experiment method which are difficult to assess their validity. However, it is in valid to say that the results presented in this research are inaccurate; though, it must be used with caution and understanding of what might be different when these results were used in the actual situation.
7.2 Limitation of the reserach

94
Throughout the research and design progress of this project, I have come to an understanding that while many researches on acoustic behavior of the building have been conducted, very few are related to the noise pollution cause by aviation activities. This lack in awareness of the impact of the annoyance cause by the aircraft seem to be the result in different in the amount population effected by the aircraft in comparison to other noise sources, such as traffic and industrial machine. This lack of awareness can be seen in the lack of proper instrument (software) to assessing and aiding the problem For example, an urban acoustic simulation software often lack a proper noise database for aircraft, while an aircraft noise simulation often lack the ability to properly assess the ground condition of the flight path. Hence, throughout the research there are many uncertainties in the outcome of the research due to the lack of proper tool.
CATT-acoustic, a room geometry-based simulation, was chosen as the main simulation software for the project. While the software was mainly used for indoor space, it was chosen due to its availability and its gradual learning curve. While in doubt, with the help of the mentors, it possible to simulate an outdoor situation in a close room environment with a tweak in acoustic properties of the room boundaries. In addition, the results are surprisingly accurate when compared to the actual on-site measurement. While there are slightly different in the values per frequency, it is understandable, due to the absence of the certain element—such as wind and ambient noise—and due to the varies of spectrum of aircraft noise. As the program was used in an unconventional method, several limitation and error were found along the research progress, especially when dealing with small canyon and gap between old and new building façade, or when dealing with semi-transparent material, which give no result to an output of the simulation. Due to limited time frame, the actual problem of these error or limitation were still unidentified and less accurate methods were used for these specific cases. Further, investigation into the setting is required to identify the actual problem in this case.The results of the initial experiments shown that aircraft is a very tricky noise source, when compared to other sources, due to its unique source position and directivity. Many design solutions which are effective against traffic noise show an opposite result when dealing with aircraft noise. For example, a flat roof which has better performance than gable roof in case of traffic noise shows an opposite effect in case of aircraft noise as more sound are being trap within the canyon. In addition, effectiveness of each design variation greatly depends on the position of the source and the surrounding context of the target building.
In addition to the acoustic aspect of the building, several feedbacks of the mentors are concerning the sustainability of the design and comfortability of the users. Furthermore, many acoustic guidelines seem to be emphasized on sealing technique and chucky construction system to exchange with reduction of natural ventilation and lighting to achieve highest noise reduction value. This current approach is likely to decrease the comfort of the users while increase the energy consumption of the building, as it depends more on mechanical HVAC system to keep the building comforTable. Hence, an integral design approaches is incorporate into the aim of this project to create a more sustainable and comforTable building system for the user.
7.3 Reflection

95
While many proposed shapes of building geometry shown a positive result in reducing outdoor noise pollution cause by the passing aircraft. Several questions regarding the actual application of each intervention remain. One, is the actual performance of the design on the real situation where wind and other noise sources are presented. As the proper simulation tool is still lacking, it is difficult to assess the actual performance of the design intervention within digital environment. The second question is regarding the affordability of each design solution. This is especially true in case of developing country which lack proper agencies who are assessing this problem seriously. Most of the people who live around airport and are affected by the aircraft noise are people with low-income who settle in this particular neighborhood due to the drop-in land value. The research also shows that it is quite difficult to find a universal solution to the annoyance cause by an aviation activity, as the problems occur all around the world under in different location with different context. This can be seen in case of Amsterdam and Bangkok. Two countries with same problem for all neighborhood within the airport region, however, under differences level in noise exposure, climate and living condition. Some solution, such as the winter garden that provide to be effective in the Dutch context may cause more problem in the tropical climate of Bangkok due to excessive sunlight. In addition, when dealing with aircraft noise annoyance a cumulative effort between different parties are required—these may include the residents, architects, urban planner and related government agencies. It is still difficult for many countries to come up with a proper solution, especially in the case of developing countries where proper coordination between different parties and knowledge on the issue are lacking. However, I do believe that in order to solve these problems more research is still required and hope this research project would act as a basic guideline and raise awareness of this growing issue.

96
ACI Europe. (2004). The social and economic impact of Airports in Europe. Airports Council International, (January), 353–354.
Arntzen, M. (2014). Aircraft noise calculation and synthesis in a non-standard atmosphere. https://doi.org/10.4233/uuid:c56e213c-82db-423d-a5bd-503554653413
Azkorra, Z., Pérez, G., Coma, J., Cabeza, L. F., Bures, S., Álvaro, J. E., … Urrestarazu, M. (2015). Evaluation of green walls as a passive acoustic insulation system for buildings. Applied Acoustics, 89, 46–56. https://doi.org/10.1016/j.apacoust.2014.09.010
Basner, M., Babisch, W., Davis, A., Brink, M., Clark, C., Janssen, S., & Stansfeld, S. (2014). Auditory and non-auditory effects of noise on health. The Lancet. https://doi. org/10.1016/S0140-6736(13)61613-X
Berglund, B., Hassmén, P., & Job, R. F. S. (1996). Sources and effects of low-frequency noise Sources and effects of low-frequency noise. 2985(1996), 2985–3002.
Boucsein, B., Christiaanse, K., Kasioumi, E., & Salewski, C. (2017). Noise Landscape: A Spatial Exploration of Airport and Cities. Rotterdam: nai010 publisher.
Brown, A. L., & van Kamp, I. (2018). WHO environmental noise guidelines for the European region: A systematic review of transport noise interventions and their impacts on health. International Journal of Environmental Research and Public Health, 14(8). https://doi.org/10.3390/ijerph14080873
Brueckner, J. K. (2003). Airline traffic and urban economic development. Urban Studies. https://doi.org/10.1080/0042098032000094388
Chalermpong, S. (2010). Impact of airport noise on property values: Case of Suvarnabhumi international airport, Bangkok, Thailand. Transportation Research Record. https://doi. org/10.3141/2177-01
Cheramakara, N., Bristow, A., Budd, L., & Zanni, A. (2014). Stated choice valuation of aircraft noise and other environmental externalities at Bangkok Suvarnabhumi Airport. INTERNOISE 2014 - 43rd International Congress on Noise Control Engineering: Improving the World Through Noise Control.
Cox, T. J., D’Antonio, P., & Schroeder, M. (2005). Acoustic Absorbers and Diffusers, Theory, design and application. The Journal of the Acoustical Society of America. https://doi. org/10.1121/1.1928891
Department of Environmental Quality Promotion. (2011). Report on the management of Noise Annyoance from Suvarnabhumi Airpart. Retrieved from http://www.pcd.go.th/ info_serv/File/10.research.pdf
Deventer van, F. W. J. (2014). Handboek basiskennis vliegtuiggeluid. 76.
EASA. (2019). European Aviation Environmental Report 2019. In Ege Üniv. Ziraat Fak. Derg. (Vol. 40). https://doi.org/10.2822/309946
Reference and citation
97
Ekpanyaskul, C., Padungtod, C., Monlang, N., Nuchpongsai, P., Matsui, T., & Hiramatsu, K. (2011). The effect of aircraft noise exposure on quality of life and psychiatric problem: A report of the Bangkok Airport Study. Proceedings of the Institute of Acoustics.
Ermann, M. (2015). Architectural acoustics illustrated. The Journal of the Acoustical Society of America. https://doi.org/10.1121/1.4920562
Flores, R., Gagliardi, P., Asensio, C., & Licitra, G. (2017). A Case Study of the Influence of Urban Morphology on Aircraft Noise. Acoustics Australia. https://doi.org/10.1007/s40857- 017-0102-y
Hamdan, N. I., Zainulabidin, M. H., Kasron, M. Z., Ismail, A. E., & Kassim, A. S. (2018). Effect of perforation size on sound absorption characteristics of membrane absorber. International Journal of Integrated Engineering, 10(4), 27–34. https://doi. org/10.30880/ijie.2018.10.04.005
Huijs, M. (2011). Building Castles in the Dutch Air: Understanding the Policy Deadlock of Amsterdam Airport Schiphol 1989-2009 (Delft University of Technology). https:// doi.org/10.1161/circulationaha.118.034583
Honeycutt, R. (2015). Understanding acoustical scattering. Retrieved June 21, 2020, from https://www.prosoundtraining.com/2015/04/03/acoustical-scattering
Ismail, M. R., & Oldham, D. J. (2002). The effect of the urban street canyon on the noise from low flying aircraft. Building Acoustics. https://doi.org/10.1260/135101002320815693
ISO. (2003). Acoustics - Description, measurement and assessment of environmental noise. Part 1: Basic quantities and assessment procedures (ISO 1996-1:2003) (p. 32). p. 32.
Kai-chung, C. (n.d.). Why can a distant sound be heard easier when it travels with the wind? Why does it become weaker if it travels against the wind? (J. Leung, Trans.). Retrieved June 21, 2020, from http://www.hk-phy.org/iq/sound_wind/sound_wind_e. html#:~:text=Surprisingly, this phenomenon is related,it is with the wind.&text=Sound wave will be refracted towards the region with a,can be transmitted farther away.
Krimm, J. (2018). Acoustically effective facade (Deflt University of Technology). https://doi. org/10.7480/abe.2018.16
Kruize, H., Driessen, P. P. J., Glasbergen, P., van Egmond, K., & Dassen, T. (2007). Environmental equity in the vicinity of Amsterdam Airport: The interplay between market forces and government policy. Journal of Environmental Planning and Management, 50(6), 699–726. https://doi.org/10.1080/09640560701608382
Leventhall, G., Pelmear, P., & Benton, S. (2003). A Review of Published Research on Low Frequency Noise and its Effects. (January 2003).
Long, M. (2014). Architectural Acoustics: Second Edition. In Architectural Acoustics: Second Edition. https://doi.org/10.1016/C2009-0-64452-4
Lugten, M. (2018). Tranquillity by design. (December).
Martin, H. . (2008). Stedenbouwfysica Geluid. 115.

98
Miskinis, K., Dikavicius, V., Bliudzius, R., & Banionis, K. (2015). Comparison of sound insulation of windows with double glass units. Applied Acoustics. https://doi. org/10.1016/j.apacoust.2015.01.007
More, S. R. (2011). Aircraft Noise Characteristics and Metrics. Theses and Dissertations Available from ProQuest, (July), 400. Retrieved from http://web.mit.edu/aeroastro/ partner/reports/proj24/noisethesis.pdf
Na, Y., Lancaster, J., & Cho, G. (2007). Sound Absorption Coefficients of Micro-fiber Fabrics by Reverberation Room Method. Textile Research Journal, 77(5), 330–335. https:// doi.org/10.1177/0040517507078743
Osborne, S. P. (2006). The New Public Governance: Emerging Perspectives on the Theory and Practice of Public Governance. In Public Management Review (Vol. 8). https://doi. org/10.1080/14719030600853022
Ozcan, H. K., & Nemlioglu, S. (2006). In-cabin noise levels during commercial aircraft flights. Canadian Acoustics - Acoustique Canadienne, 34(4), 31–35.
Pollution Control Department and Department of Environmetnal Quality Promotion. (2006). Suvarnabhumi Airport: Noise Situation and Management. Retrieved from http:// infofile.pcd.go.th/air/SUWANBUMI.pdf
Rodrigue, J. P., Comtois, C., & Slack, B. (2017). The geography of transport systems. In The Geography of Transport Systems (4th Edition). https://doi.org/10.4324/9781315618159
Sharp, B. H., Gurovich, Y. a, & Albee, W. W. (2001). Status of Low-Frequency Aircraft Noise Research and Mitigation. (Wyle Acoustics Group), 36.
The Federal Aviation Administration’s (FAA) Southern Region Airports. (2000). Land use compatibility and airports. North.
Van Renterghem, T., & Botteldooren, D. (2010). The importance of roof shape for road traffic noise shielding in the urban environment. Journal of Sound and Vibration. https://doi. org/10.1016/j.jsv.2009.11.011
Van Renterghem, Timothy, Hornikx, M., Forssen, J., & Botteldooren, D. (2013). The potential of building envelope greening to achieve quietness. Building and Environment. https:// doi.org/10.1016/j.buildenv.2012.12.001
Whitelegg, J., & Williams, N. (2000). The Plane Truth: Aviation and the Environment. The Ashden Trust, 44.
WHO. (2000). WHO: Guidelines for Community Noise. Noise & Vibration Worldwide, 31(4), 24–29. https://doi.org/10.1260/0957456001497535
Yu, C. J. (2008). Environmentally sustainable acoustics in urban residential areas. (May), 255. Retrieved from http://etheses.whiterose.ac.uk/14922/1/489063.pdf

Ground Take-off/Landing n Air-borne 16 31.5 63 100 125 250 500 1000 2000 4000
Orienta�on: Quite side façade #AThe building located 700 m horizontally from the flight path. It has five stories, with total height of 18 m. It is part of an office park.
- x (Take-off) - 125 to 250 Outdoor on quiet side façade - 4 10 - 10.5 11 10.8 11.3 11.5 9.5 8 to 16 16
Orienta�on: Quite side façade #BThe building located 300 m horizontally from the flight path. It has two stories, with total height of 8 m. It is part of a logis�c park.
- x (Landing) - 125 to 250 Outdoor on quiet side façade - 5.9 3 - 10 10 11.9 7.9 8.8 11.3 9 to 16 16
The angle of incident on the façade: at 0° (Front façade) - x (Landing) - - Outdoor on façade --- - - - - - - - 0.8 -
The angle of incident on the façade: at 20° - x (Landing) - - Outdoor on façade --- - - - - - - - 0.6 -
The angle of incident on the façade: at 45° - x (Landing) - - Outdoor on façade --- - - - - - - - -0.3 -
The angle of incident on the façade: at 60° - x (Landing) - - Outdoor on façade --- - - - - - - - -0.3 -
The angle of incident on the façade: at 90° - x (Landing) - - Outdoor on façade --- - - - - - - - 0.1 -
The angle of incident on the façade: at 120° - x (Landing) - - Outdoor on façade --- - - - - - - - -0.2 -
The angle of incident on the façade: at 180° (Back façade) - x (Landing) - - Outdoor on façade --- - - - - - - - -0.4 -
Urban morphology: (L-Typology urban canyon)The street typology with building on one side, while the other was le� open.
- x (Landing) - 500m, 700 to 1400m Outdoor on façade --- - - - - - - - 0.1 -
Urban morphology: (U-Typology urban canyon) The street typology with buildings on both side of street. - x (Landing) - 500m, 700 to 1400m Outdoor on façade --- - - - - - - - -0.3 -
Normal glass (4mm) - Air gap (Argon gas, 18 mm) - Normal glass (6 mm)
x - - - Indoor - - - 22.5 22 27 35 39.5 40 42.5 - -
Normal glass (4mm) - Air gap (Argon gas, 24 mm) - Normal glass (6 mm)
x - - - Indoor - - - 23.5 21.5 28.5 37.5 40 40.5 42 - -
Normal glass (4mm) - Air gap (Argon gas, 24 mm) - Normal glass (8 mm)
x - - - Indoor - - - 23 20 27 37 40 41.5 42 - -
Normal glass (4mm) - Air gap (Argon gas, 24 mm) - Normal glass (12 mm)
x - - - Indoor - - - 24 18 31 38 38.5 44.5 45 - -
Laminate glass (8mm) - Air gap (Argon gas, 24 mm) - Normal glass (6 mm)
x - - - Indoor - - - 25 21.5 33.5 37.5 37 40 48.5 - -
Laminate glass (8mm) - Air gap (Argon gas, 24 mm) - Normal glass (8 mm)
x - - - Indoor - - - 28.5 26.5 35 39 43 41 48 - -
Laminate glass (8mm) - Air gap (Argon gas, 27 mm) - Normal glass (6 mm)
x - - - Indoor - - - 25.5 21.5 34.5 39 42.5 41 49 - -
Laminate glass (8mm) - Air gap (Argon gas, 24 mm) - Normal glass (12 mm)
x - - - Indoor - - - 23 33 39 38 41 43 50.5 - -
Laminate glass (13mm) - Air gap (Argon gas, 27 mm) - Laminateglass (8 mm)
x - - - Indoor - - - 36 35 39 39 41.5 46 51 - -
Laminate glass (13mm) - Air gap (Argon gas, 27 mm) - Laminateglass (7 mm)
x - - - Indoor - - - 22 35.5 39 39 41.5 46 51 - -
Laminate glass (13mm) - Air gap (Argon gas, 27 mm) - Laminateglass (10 mm)
x - - - Indoor - - - 17.5 34.5 38 39 41 45 51 - -
Laminate glass (13mm) - Air gap (Argon gas, 27 mm) - Laminateglass (10 mm)
x - - - Indoor - - - 23.5 36 38 40.5 43 49 52 - -
Loca�on of Aircra�Design tnemirepxEnoitnevretnI Descrip�on
Aircra�/Source height [m]
Target areaNoise Reduc�on per Frequency [dB]
LAeq [dB(A)] LAmax [dB(A)]Experiment set-up
Orienta�on: Façade angle and LOS (Line of Sight)
Sound insula�on: Double glazed window
dimension of window (1480 m x 1230 m) include frame (1500 m x 1250 m)
Appendix A: Matrix of current abatement strategies and research
99

Ground Air-borne 16 31.5 63 100 125 250 500 1000 2000 4000
17.7 37.7 50.8 59.3 64.9 68.9 71.8 74.1
x - - - Outdoor on façade (50cm lintel) 2.4 0.8 -0.5 -2.7 -2 -2 1.5 5.1 - - - 5.1
x - - - Outdoor on façade (100cm lintel) -2.9 -2.9 -6.4 -3.7 -4.2 -0.7 1 4 - - - 4
x - - - Outdoor on façade (50cm parapet) 0.3 3.2 -1.5 0.1 -0.5 1 1.3 1.5 - - - 4.2
x - - - Outdoor on façade (100cm parapet) 0.4 3.3 -1.4 0.2 -0.3 4.7 4.7 2.5 - - - 5.5
x - - - Outdoor on facade - - - - --5 to 10.5*
-4 to 5.5*
-4.8 to 8.8*
- - -5 to 9.4* 8.5
x - - -Outdoor in courtyard (building
complex)- - - - -
-4.5 to 1.5*
-4 to 1.2*
-5.5 to 3.5*
- - -5.2 to 3.5* 3.5
x - - - Outdoor on facade - - - - --1.5 to
16*-2 to 11*
-1.5 to 11.6*
- - 4 to 14* 9
x - - -Outdoor in courtyard (building
complex)- - - - - 0.5 to 7* -3 to 5* -7 to 6* - - -4 to 6*
x - - - Outdoor on facade - - - - - -5 to 11*-0.5 to
11*5.6 to 14.9*
- - 10 to 20* 7
x - - -Outdoor in courtyard (building
complex)- - - - - 0 to 7.5* 0 to 8.5*
-2 to 6.5*
- - -1 to 7*
x - - - Outdoor on facade - - - - - -3 to 15* 3 to 14*5.5 to 15.7*
- - 14 to 25* 23
x - - -Outdoor in courtyard (building
complex)- - - - -
-0.5 to 6.5*
2.5 to 7* 0 to 10* - - 0.5 to 9.5* 10
Roof shape: Flat roof
2D wave simula�on on different geometry of roof. In case of flat roof the dimension of the building is 10 x 10 m (height x width) with the canyon width of 10 m.
*Assuming the traffic noise at 50 dB, which more than 70% of Dutch residences are exposed to during day �me.
x - - - - - - - - - - - - - - - -
Roof shape: Saw tooth shape roof2D wave simula�on on different geometry of roof. Shielding performance for unexposed façade compared to flat roof.
x - - - Outdoor on quiet side façade - - - - - - - - - - 4.8 to 5.1 -
Roof shape: 1/4 curved roof2D wave simula�on on different geometry of roof. Shielding performance for unexposed façade compared to flat roof.
x - - - Outdoor on quiet side façade - - - - - - - - - - 4.4 to 4.7 -
Roof shape: Varia�on of straight line room2D wave simula�on on different geometry of roof. Shielding performance for unexposed façade compared to flat roof.
x - - - Outdoor on quiet side façade - - - - - - - - - - 3.1 to 3.3 -
Roof shape: Symmetric varia�on of straight line room2D wave simula�on on different geometry of roof. Shielding performance for unexposed façade compared to flat roof.
x - - - Outdoor on quiet side façade - - - - - - - - - - 1.9 to 2.4 -
Roof shape: Semi-circle curved roof2D wave simula�on on different geometry of roof. Shielding performance for unexposed façade compared to flat roof.
x - - - Outdoor on quiet side façade - - - - - - - - - - 2.1 -
Loca�on of Aircra�Design tnemirepxEnoitnevretnI Descrip�on
Aircra�/Source height
[m]
Target areaNoise Reduc�on per Frequency [dB]
LAeq [dB(A)] LAmax [dB(A)]Experiment set-up
1:50 scale model measurement for the effect of apartment balcony on traffic noise (assuming as ground source) with Lintel of 50-100 cm a�ach to the common balcony.
*Note: a dense polystyrere (3mm thk) was used for simula�ng asphalt roads and ver�cal walls of the building.
Façade shape: Balcony with lintel
Façade shape: Balcony with parapet
Noise reduc�on per Angle of incident [dB] - Odd No. floor-
1:50 scale model measurement for the effect of apartment balcony on traffic noise (assuming as ground source) with Parapet of 50-100 cm a�ach to the common balcony.
1:50 scale model measurement for the effect of apartment balcony on traffic noise (assuming as ground source) with inclined ceiling panel and 100 cm parapet with absorbing surface material.
Façade shape: Balcony with inclined ceiling and parapet with absorbing materials
1:50 scale model measurement for the effect of apartment balcony on traffic noise (assuming as ground source) with inclined ceiling panel.
Façade shape: Balcony with inclined ceiling
Façade shape: Balcony with inclined ceiling with absorbing material
1:50 scale model measurement for the effect of apartment balcony on traffic noise (assuming as ground source) with inclined ceiling panel and absorbing surface material.
*Note: 2mm thk velour was used as the absorbing material.
1:50 scale model measurement for the effect of apartment balcony on traffic noise (assuming as ground source) with inclined ceiling panel and absorbing surface material and 100 cm parapet.
Façade shape: Balcony with inclined ceiling with absorbing material and parapet
100
Take-off/Landing

Ground Air-borne 16 31.5 63 100 125 250 500 1000 2000 4000
Roof shape: Slanted roof2D wave simula�on on different geometry of roof. Shielding performance for unexposed façade compared to flat roof.
x - - - Outdoor on quiet side façade - - - - - - - - - - -0.1 to 0.2 -
Roof shape: Flat roof2D wave simula�on on different geometry of roof. Shielding performance for unexposed façade compared to flat roof.
x - - - Outdoor on quiet side façade - - - - - - - - - - -0.6 to 0.1 -
Roof shape: Hanging roof2D wave simula�on on different geometry of roof. Shielding performance for unexposed façade compared to flat roof.
x - - - Outdoor on quiet side façade - - - - - - - - - - -2.4 to -1.9 -
Roof shape: Symmetric saddle-backed roof2D wave simula�on on different geometry of roof. Shielding performance for unexposed façade compared to flat roof.
x - - - Outdoor on quiet side façade - - - - - - - - - - -0.6 to -0.4 -
Roof shape: Discon�nous roof in the center2D wave simula�on on different geometry of roof. Shielding performance for unexposed façade compared to flat roof.
x - - - Outdoor on quiet side façade - - - - - - - - - - -2.5 -
Baseline Scenario
Baseline scenario with 3 urban canyon dimension: 15, 30 and 55 m. The building in the simula�on is two-stories with the dimension of 10 m by 11 m (depth and height). Wall height is 7 m and top of the roof is 11 m. The roof of the building is symmetric saddle-backed.
*Use loca�on B as reference: it locates close to Rijsenhout
- x - 152 Outdoor on quiet side façade - - - - - - - - - - - -
LAmax - - 2 - 3 3 -3 -4 - - - -
LAeq - - 0 - 1 -1 -5 -6 - - - -
LAmax - - 6 - 9 11 8 14 - - - -
LAeq - - 2 - 4 3 5 6 - - - -
LAmax - - 4 - 5 9 11 12 - - - -
LAeq - - -5 - -2 -1 3 2 - - - -
LAmax - - 5 - 4 6 6 8 - - - -
LAeq - - 0 - 1 -1 -5 -6 - - - -
LAmax - - 5 - 4 6 6 8 - - - -
LAeq - - 2 - 3 3 4 2 - - - -
LAmax - - 2 - 6 12 15 18 - - - -
LAeq - - -2 - 0 2 7 9 - - - -
Outdoor on quiet side façade
Outdoor on quiet side façade
Outdoor on quiet side façade
Outdoor on quiet side façade
Outdoor on quiet side façade
x -
- x -
152
152
152
152
Building Height + Urban Morphology
Increase building height by 6 m. Total building height is 17 m. The result is compared to the baseline scenario.
Canyon with 55 m
Increase building height by 12 m. Total building height is 22 m. The result is compared to the baseline scenario.
Canyon with 15 m
Increase building height by 12 m. Total building height is 22 m. The result is compared to the baseline scenario.
Canyon with 30 m
Increase building height by 12 m. Total building height is 22 m. The result is compared to the baseline scenario.
Canyon with 55 m
Outdoor on quiet side façade
Increase building height by 6 m. Total building height is 17 m. The result is compared to the baseline scenario.
Canyon with 15 m
Increase building height by 6 m. Total building height is 17 m. The result is compared to the baseline scenario.
Canyon with 30 m
- x - 152
- x - 152
- x -
- x -
-
Loca�on of Aircra�Design tnemirepxEnoitnevretnI Descrip�on
Aircra�/Source height [m]
Target areaNoise Reduc�on per Frequency [dB]
LAeq [dB(A)] LAmax [dB(A)]Experiment set-up
101
Take-off/Landing

Ground Air-borne 16 31.5 63 100 125 250 500 1000 2000 4000
LAmax - - 2 - -1 -3 -1 0 - - - -
LAeq - - 0 - 0 0 -1 -1 - - - -
LAmax - - 2 - 1 3 4 3 - - - -
LAeq - - -2 - -2 -3 0 -1 - - - -
LAmax - - 3 - 3 2 1 1 - - - -
LAeq - - -2 - -4 -2 -1 -3 - - - -
LAmax - - 0 - 0 0 -1 -1 - - - -
LAeq - - 1 - 0 1 2 -1 - - - -
LAmax - - -1 - -1 1 -1 -3 - - - -
LAeq - - -2 - -2 -2 -1 -2 - - - -
LAmax - - -1 - 0 0 -2 -3 - - - -
LAeq - - -4 - -5 -2 -1 -3 - - - -
LAmax - - 2 - 3 3 3 11 - - - -
LAeq - - -6 - -3 -1 3 4 - - - -
LAmax - - -2 - 6 6 8 15 - - - -
LAeq - - -6 - -1 -1 1 4 - - - -
LAmax - - 10 - 14 16 16 24 - - - -
LAeq - - 1 - 5 9 10 16 - - - -
Façade Shape: Reference model
The 1:50 scale model measurement was conducted in the sound lab at the Del� University of Technology, Faculty of Applied Sciences, Departmetn of Imaging Physics. (Dimension of experiment space with controlled rail is 2.5 to 3.0 m x 2 m height)
The result of the measurement was compared to the result of the field measurement for r
- - x ? Outdoor reflec�on - - - - - - - - - - - -
Façade Shape: 0.75 m x 0.5 m horizontal profile with 1.5 m gap
Horizontal orienta�on of façade profile, with 0.75 m depth x 0.5 m thickness, with a gap of 1.5 m
The result is compared to the reference model.The data use for this chart was obtained from measurement on-axis loca�on.
- - x ? Outdoor reflec�on - - - 0 -0.3 -0.3 1 - - - - -
152 Outdoor on quiet side façade
- 152 Outdoor on quiet side façade
Adding overhang roof and bays to the façade and roof
Canyon with 30 m- x - 152 Outdoor on quiet side façadeFaçade Shape + Urban Morphology
Adding overhang roof and bays to the façade and roof
Canyon with 15 m- x
Adding overhang roof and bays to the façade and roof
Canyon with 55 m- x
-
Façade Orienta�on + Urban Morphology
x
-
Exposed façade �lt 39 degree.
Canyon with 15 m- x
Exposed façade �lt 39 degree.
Canyon with 55 m-
152 Outdoor on quiet side façade
Exposed façade �lt 58 degree.
Canyon with 55 m- x - 152 Outdoor on quiet side façade
Exposed façade �lt 58 degree.
Canyon with 30 m- x
- 152 Outdoor on quiet side façade
Exposed façade �lt 58 degree.
Canyon with 15 m- x - 152 Outdoor on quiet side façade
- 152 Outdoor on quiet side façade
Exposed façade �lt 39 degree.
Canyon with 30 m- x - 152 Outdoor on quiet side façade
Loca�on of Aircra�Design tnemirepxEnoitnevretnI Descrip�on
Aircra�/Source height [m]
Target areaNoise Reduc�on per Frequency [dB]
LAeq [dB(A)] LAmax [dB(A)]Experiment set-up
102
Take-off/Landing

Ground Air-borne 16 31.5 63 100 125 250 500 1000 2000 4000
Façade Shape: 0.75 m x 0.25 m horizontal profile with 2.25 m gap
Horizontal orienta�on of façade profile, with 0.75 m depth x 0.25 m thickness, with a gap of 2.25 m
The result is compared to the reference modelThe data use for this chart was obtained from measurement on-axis loca�on.
- - x ? Outdoor reflec�on - - - 0.6 0.2 0.2 0.2 - - - - -
Façade Shape: 0.75 m x 0.5 m veritcal profile with 2.25 m gap
Ver�cal orienta�on of façade profile, with 0.75 m depth x 0.5 m thickness, with a gap of 2.25 m
The result is compared to the reference modelThe data use for this chart was obtained from measurement on-axis loca�on.
- - x ? Outdoor reflec�on - - - 0 -0.2 -0.2 -0.3 - - - - -
Façade Shape: 0.75 m x 0.5 m horizontal profile with 2.5 m gap
Horizontal orienta�on of façade profile, with 0.75 m depth x 0.5 m thickness, with a gap of 2.5 m
The result is compared to the reference modelThe data use for this chart was obtained from measurement on-axis loca�on (perpendicular to the facade).
- - x ? Outdoor reflec�on - -0.1 0 -0.1 0.7 0.2 0.4 - - - - -
Façade Shape: 0.75 m x 0.5 m horizontal profile with 1 m gap
Horizontal orienta�on of façade profile, with 0.75 m depth x 0.5 m thickness, with a gap of 1 m
The result is compared to the reference modelThe data use for this chart was obtained from measurement on-axis loca�on (perpendicular to the facade).
- - x ? Outdoor reflec�on - 0.2 0.4 -0.2 -0.7 0.2 0.3 - - - - -
Façade Shape: 0.75 m x 0.5 m horizontal profile with 0.25 m gap
Horizontal orienta�on of façade profile, with 0.75 m depth x 0.5 m thickness, with a gap of 0.25 m
The result is compared to the reference modelThe data use for this chart was obtained from measurement on-axis loca�on (perpendicular to the facade).
- - x ? Outdoor reflec�on - -0.3 0.8 -0.1 0.3 1.2 1.8 - - - - -
Façade Shape: 0.90 m x 0.05 m horizontal profile with 1.45 m gap
Horizontal orienta�on of façade profile, with 0.90 m depth x 0.05 m thickness, with a gap of 1.45 m
The result is compared to the reference modelThe data use for this chart was obtained from measurement on-axis loca�on (perpendicular to the facade).
- - x ? Outdoor reflec�on - 0.3 0.3 -0.2 0.4 0.1 1.6 - - - - -
Façade Shape: 0.90 m x 0.05 m horizontal profile with 0.7 m gap
Horizontal orienta�on of façade profile, with 0.90 m depth x 0.05 m thickness, with a gap of 0.7 m
The result is compared to the reference modelThe data use for this chart was obtained from measurement on-axis loca�on (perpendicular to the facade).
- - x ? Outdoor reflec�on - 0.4 0 -0.1 0.6 0.7 3.4 - - - - -
Façade Shape: 0.75 m x 0.5 m veritcal profile with 2 m gap
Ver�cal orienta�on of façade profile, with 0.75m depth x 0.5 m thickness, with a gap of 2 m
The result is compared to the reference modelThe data use for this chart was obtained from measurement on-axis loca�on (perpendicular to the facade).
- - x ? Outdoor reflec�on - 0.3 -0.6 -0.7 -0.4 0.1 1.5 - - - - -
Loca�on of Aircra�Design tnemirepxEnoitnevretnI Descrip�on
Aircra�/Source height [m]
Target areaNoise Reduc�on per Frequency [dB]
LAeq [dB(A)] LAmax [dB(A)]Experiment set-up
103
Take-off/Landing

104
Appendix B: Detailing of Rijsenhout case 2

105

106
Appendix C: Detialing of Bangkok case 4

107
This page is intentionally left blank