building energy access markets - beam exchange
TRANSCRIPT

Building Energy Access Markets A Value Chain Analysis of Key Energy Market Systems

Building Energy Access Markets A Value Chain Analysis of Key Energy Market Systems

Published byEuropean Union Energy Initiative Partnership Dialogue Facility (EUEI PDF)
c/o Deutsche Gesellschaft fürInternationale Zusammenarbeit (GIZ)P.O. Box 5180 · 65726 Eschborn, [email protected] · www.euei-pdf.org
The Partnership Dialogue Facility (EUEI PDF) is an instrument of the EU Energy Initiative (EUEI). It is currently funded by Austria, the European Commission, Finland, France, Germany, The Netherlands, and Sweden.
Place and date of publicationEschborn, February 2015
AuthorsMichael Franz (Editor), Ina de Visser (EUEI PDF), Alexander Huppertz (EUEI PDF), Dr Ewan Bloomfield (Practical Action Consulting), Drew Corbyn (Practical Action Consulting) and Luis E. Osorio-Cortes (Practical Action Consulting)
ContributorsSpecial thanks go to the following people and organisationsthat provided critical advice to help ensure the applicabilityand usefulness of the assessment: Bozhil Kondev (GIZ), Lucas Black (UNDP-GEF ), Mirka Bodenbender (EUEI PDF), Nana Asamoah-Manu (IFC), Steven Hunt (DfID), Stephanie Valdez (Global Alliance for Clean Cookstoves (GACC)), Venkat Ramana (World Bank), Wim Van Nes (SNV), Yasemin Erboy (UN Foundation)
Layout and DesignSchumacher. Visuelle Kommunikation,Darmstadt, Germanywww.schumacher-visuell.de
Photos© GIZ, Ollivier Girard (cover) © Practical Action (pp. 3, 15, 19, 21, 22, 23, 24, 29, 41,
46, 47, 51, 52, 54, 61, 62, 69, 72, 75, 76, 79 right, 81, 85, 88, 89, 95, 106, 120, 121, 124, 125, 126, 127, 129, 136, 142)
© GIZ (pp. 9, 27, 32, 55, 64, 79 left, 100, 101, 108, 111, 132, 138, 148, 151)
© EUEI PDF (pp. 13, 36, 39)© EnDev (pp. 38, 45, 112)© FUNAE (pp. 92, 93, 98)© FRES (pp. 114, 115)© Inensus (pp. 94, 97, 103)
This study has been produced by EUEI PDF to present a new framework for systematically assessing each energy market system. Furthermore, it outlines specific interventions required to overcome critical barriers within each market system.

Contents
Executive Summary ���������������������������������������������������������������������������������������������������������������������������������� 8
Chapter 1Introduction to the Energy Market System Assessment Framework ������������������������������������ 10
1. What is it? 12
2. What is it not? 13
3. Who is it for? 13
4. How was it developed? 14
Chapter 2Energy Market System Analytical Framework ����������������������������������������������������������������������������� 18
Stage 1: Mapping the Energy Market System 19
Level 1: Market chain 21
Level 2: Inputs, services and finance 22
Level 3: Enabling environment factors 23
Development of energy service market system maps 26
Energy market system case studies 28
Stage 2: Design of Supporting Interventions 30
Identification of supporting interventions 30
Categorisation of interventions 32
Chapter 3Energy Market System 1: Mini-Grid Electricity �������������������������������������������������������������������������� 34
Chapter 4Energy Market System 2: Solar PV Lanterns ���������������������������������������������������������������������������������� 48

Chapter 5Energy Market System 3: Solar PV Home Systems (SHS) ��������������������������������������������������������� 58
Chapter 6 Energy Market System 4: Biomass Improved Cookstoves ��������������������������������������������������������� 70
Chapter 7Energy Market System Model 5: LPG Fuel and Stoves �������������������������������������������������������������� 82
Chapter 8Energy Market System Case Studies ������������������������������������������������������������������������������������������������ 90
Case Study 1: FUNAE Solar PV Community Mini-Grids, Mozambique 94
Case Study 2: Inensus Hybrid Mini-Grids, Senegal 101
Case Study 3: SolarAid Pico Solar, Malawi 107
Case Study 4: FRES Solar Home Systems and Hybrid Mini-grids, Mali 113
Case Study 5: M-KOPA Solar PV Home System (SHS), Kenya 119
Case Study 6: Restio Imported ICS, South Africa 127
Case Study 7: Toyola Centralised ICS, Ghana 135
Case Study 8: Ugastove Centralised ICS, Uganda 141
Case Study 9: Local Manufacturers Decentralised ICS, Rwanda 147
Case Study 10: LPG Stoves and Fuel, Senegal 157
Annex 1
Energy Market System Reference Publications 163
Annex 2 Literature Review Outline 164

BoP Bottom of PyramidCBO Community Based OrganisationDfID Department for International DevelopmentEASE Enabling Access to Sustainable EnergyESMAP Energy Sector Management Assistance ProgrammeEUEI PDF European Union Energy Initiative – Partnership Dialogue FacilityFA Financial AssistanceFRES Foundation for Rural Energy ServicesFUNAE Fundo de Energia (Energy Agency in Mozambique)GACC Global Alliance for Clean CookstovesIEA International Energy AgencyIFC International Finance CorporationLDC Least Developed CountriesLED Light Emitting DiodeLPG Liquefied Petroleum GasMFI Micro Finance InstitutionNGO Non-Governmental OrganisationO&M Operation and MaintenancePAC Practical Action ConsultingPISCES Policy Innovation Systems for
Clean Energy SecurityPMSD Participatory Market System DevelopmentPV PhotovoltaicR&D Research and DevelopmentSACCO Savings and Credit CooperativeSE4ALL Sustainable Energy for AllSHS Solar Home SystemsTA Technical AssistanceUNDP United Nations Development ProgrammeVAT Valued Added TaxWBCSD World Business Council for Sustainable
Development
Acronyms and Abbreviations
List of Figures
Figure 1 Intended focus of framework 13Figure 2 Simplified summary of energy market
system including three levels 20Figure 3 Illustrative market chain for public-
private mini-grid electricity model 39Figure 4 Mini-grid electricity market map 40Figure 5 Illustrative market chain for
distribution dealer model 50Figure 6 Illustrative market chain for
integrated supply chain model 51Figure 7 Solar PV lantern market map 53Figure 8 Illustrative market chain for
integrated supply chain model 60Figure 9 Illustrative market chain for
distribution dealer model 61Figure 10 Illustrative market chain for
fee-for-service business model 62Figure 11 Solar PV home system (SHS)
market map 65Figure 12 Illustrative market chain for
inter nationally manufactured stove model 73
Figure 13 Illustrative market chain for locally and centrally manufactured stove model 73
Figure 14 Illustrative market chain for locally and decentrally manufactured stove model 74
Figure 15 Biomass improved cookstove market map 77
Figure 16 LPG fuel and stoves market map 86Figure 17 FUNAE Mini-Grid Market
System Model 98

Figure 18 Inensus hybrid mini-grids market map 104Figure 19 SolarAid Pico Solar Malawi
market map 110Figure 20 FRES-Yeelen Kura Solar PV Home
System (SHS) and Mini-Grid supporting interventions 116
Figure 21 M-Kopa Solar PV home system (SHS) market map 123
Figure 22 Restio imported ICS market map 131Figure 23 Toyola Centralised ICS market map 137Figure 24 Ugastove Centralised ICS market map 144Figure 25 Rwanda Local Manufacturers
Decentralised ICS market map 152Figure 26 Senegal LPG fuel and stove
market map 158 Figure 27 Analytical framework used to study
companies operating in the energy access market 164
Figure 28 Mali Folkcentre's Electricity Supply Business Model by EASE in Mali 165
Figure 29 Challenges and Innovations within Hystra's Solar Home System Value Chain Model 166
Figure 30 Business model innovations for BoP energy markets 167
Figure 31 Prakti Design Models 169Figure 32 Schematic Overview of EnDeva's
Business Model Generator 170Figure 33 Practical Action's Participatory Market
System Development (PMSD) Roadmap Steps 171
Figure 34 Typical Market Map from the Senegal Chardust Briquettes’ case study 172
Figure 35 Practical Action Energy Delivery Model for Grameen Shakti Solar PV Bangladesh 174
Table 1 Summary of supporting interventions 18Table 2 Mini-grid electricity supporting
interventions 24Table 3 Solar PV lantern supporting
interventions 33Table 4 Solar PV home system (SHS)
supporting interventions 40Table 5 Biomass improved cookstove
supporting interventions 48Table 6 LPG fuel and stoves supporting
interventions 54Table 7 Specific Market System Barriers and
Interventions 99Table 8 Inensus hybrid mini-grids supporting
interventions 105Table 9 SolarAid Pico Solar Malawi supporting
interventions 111Table 10 FRES-Yeelen Kura Solar PV Home
System (SHS) and Mini-Grid supporting interventions 117
Table 11 M-Kopa Solar PV supporting interventions 125
Table 12 Restio imported ICS supporting interventions 133
Table 13 Toyola Centralised ICS supporting interventions 139
Table 14 Ugastove Centralised ICS supporting interventions 145
Table 15 Rwanda Local Manufacturers Decen tral- ised ICS supporting interventions 153
Table 16 Senegal LPG fuel and stove supporting interventions 159
List of Tables

8
Executive Summary
This publication presents a new framework developed by EUEI PDF and Practical Action Consulting (PAC) to systematically and comprehensively analyse and assess energy market systems, with an initial focus on decentralised energy service markets. It is aimed at development professionals at policy and practitioner level, as well as the interested public, to improve their understanding of how these markets operate and how they can be effectively promoted and supported.
The document presents a new methodology that allows development practitioners to analyse energy market systems and develop effective interventions for supporting energy market development. Thus, the framework not only improves the understanding of how energy market systems function, but also provides tailored guidance on how to improve energy markets in order to increase energy access, investment and growth in a sustainable and efficient manner. In addition, the presented approach aims to help relevant stakeholders improve the coordination of their efforts, particularly with regards to the Sustainable Energy for All (SE4ALL) initiative’s goal of providing universal energy access for all by 2030.
The framework structures energy market systems into three main levels: The first level is the energy market or value chain which is in the centre of the framework. It is divided into four or five functions in which the market actors operate, from the project development through to the end-users of the energy services and technologies. Below the market chain is level two which includes all the secondary value chains that support and “feed into” the main value chain. These secondary value chains comprise inputs, services, and finance. The third level encompasses the enabling environment which provides the conditions under which the market chain operates. It includes political and regulatory, social and cultural, as well as financial and economic factors.
The framework was applied to a number of energy market sectors such as electricity mini-grids, solar PV lanterns, solar PV home systems, biomass cook stoves and fuels and LPG stoves and fuels1, mapping all relevant elements and their linkages in each of the three levels. Key barriers were then identified in each of the energy market systems, as well as the specific interventions required to overcome each barrier.
1) Due to practical constraints this framework was limited to these five energy service technologies but could be expanded to
include other energy services such as mechanical power devices including wind-powered pumps as well as biogas systems.
2) This includes other innovative financing mechanisms such as reducing investment risks, interest rates and payback periods.

9
These interventions were broadly divided into technical and financial assistance, with technical support being categorised into business development, technical, policy, advocacy and awareness-raising support, and financial support comprising the provision of direct grants, loan financing, equity and complementary2 financial support. In addition to the description of each barrier and inter-vention, an indicative responsible actor was provisionally identified, although this depends on the specific energy market being analysed and local country context.

10
Chapter 1 Introduction to the Energy Market System Assessment Framework

11

12
1� What is it?This report presents a common framework to systematically analyse a range of existing, and potentially future, energy market systems, which aim to deliver the full range of energy services required by households, community services and businesses, from electricity for lighting and productive uses to space and food heating.
The state of energy market development differs by market segment (here: market system) and country. Numerous actors are involved (or intend to be) in supporting the uptake of energy markets, e.g. the pico-PV market in Zambia. This framework has been designed to help all those actors, including decision-makers from government departments or bilateral and multilateral development partners, in the following ways:
f Increase their understanding of all the critical components of each energy market system, including how these components operate and interact.
f Identify the main differences and similarities, as well as the comparative strengths and weaknesses of each energy market system.
f Identify the main obstacles and drivers that exist within each energy market system.
f Help design the critical interventions required to support each market system and allow it to grow.
f Allow better coordination of development interventions active in the same energy market system.
Besides providing practical and specific guidance to help development partners and domestic decision makers identify the support interventions needed to overcome barriers within energy market systems and catalyse their development, this framework allows the development of a common understanding of energy market systems. This will aid in designing future interventions that support the development of sustainable markets rather than creating potentially damaging market distortions, and complementing each other rather than creating unintended conflicts.
By analysing the energy market systems in their entirety, it is hoped that decision makers will be able to develop appropriate support programmes, leading to improved energy access for poor, marginalised and vulnerable people. While the framework is intended to be applicable to developing countries in general, it is particularly focused on energy markets in Sub-Saharan Africa due to their very low rates of access to critical energy services.
Chapter 1
Introduction
13
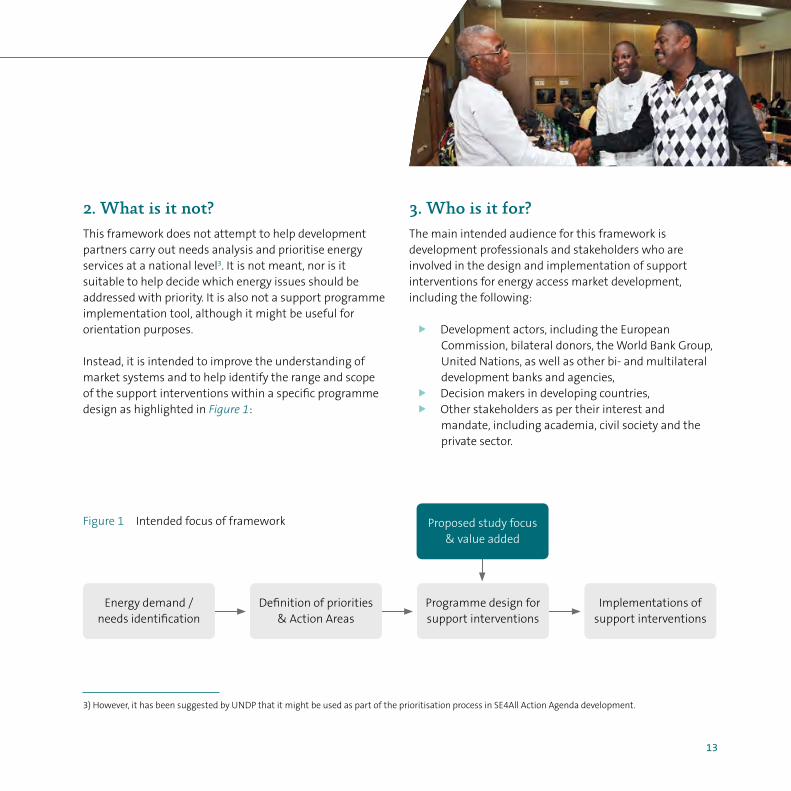
2� What is it not? This framework does not attempt to help development partners carry out needs analysis and prioritise energy services at a national level3. It is not meant, nor is it suitable to help decide which energy issues should be addressed with priority. It is also not a support programme implementation tool, although it might be useful for orientation purposes.
Instead, it is intended to improve the understanding of market systems and to help identify the range and scope of the support interventions within a specific programme design as highlighted in Figure 1:
3� Who is it for?The main intended audience for this framework is development professionals and stakeholders who are involved in the design and implementation of support interventions for energy access market development, including the following:
f Development actors, including the European Commission, bilateral donors, the World Bank Group, United Nations, as well as other bi- and multilateral development banks and agencies,
f Decision makers in developing countries, f Other stakeholders as per their interest and
mandate, including academia, civil society and the private sector.
3) However, it has been suggested by UNDP that it might be used as part of the prioritisation process in SE4All Action Agenda development.
Definition of priorities & Action Areas
Programme design for support interventions
Proposed study focus & value added
Energy demand / needs identification
Implementations of support interventions
Figure 1 Intended focus of framework

14
It has been designed to add value with regards to identifying and coordinating country actions to reach the goals of the Sustainable Energy for All initiative in a range of developing countries, including Asia and Sub-Saharan Africa.
4� How was it developed?Although a number of previous studies have been carried out to analyse businesses, delivery models or value chains of energy access markets, their analysis has shown that this has not always been done in a consistent, harmonised or comprehensive way. A literature review of similar undertakings has been included in Annex 2. This document builds on the understanding and groundwork generated by these various publications.
However, the starting point for this study was that in order to allow a more systematic approach for comparing and contrasting energy markets, including the clear identification and categorisation of all their component parts, and how they interact with each other, a more comprehensive and holistic methodology is required. In addition, most previous studies did not clearly identify the range of support interventions required to help the markets develop. Furthermore, support interventions were discussed at a too general level, without linking potential support interventions to specific parts of the market chain in a coherent and systematic manner.
This framework was developed after an extensive review and assessment of the strengths and weaknesses of more than 10 existing studies and initiatives which are listed in the reference list in Annex 1 and outlined in Annex 2. The most important elements of each of these existing energy value chain analysis approaches were identified, as well as the aspects which add the greatest value in clearly defining the critical elements and existing barriers of each market system.
Through this analysis, a practical and systematic methodology for analysing entire energy market systems was developed that subsequently allowed for the identification of support interventions required to transform them.

15

16
Chapter 2 Energy Market System Analytical Framework

17

18
Low levels of energy access are caused by a wide range of issues, including amongst others the level of poverty of end users, social practices and the capacity of companies and financial institutions. The lack of effective delivery systems for a range of appropriate energy services in many developing countries is often the result of the decisions made by a diverse and numerous set of public and private actors. Where one or more elements of an energy market system are not functioning effectively, it results in the failure of the relevant actors to deliver the required services to the required destination, in the form they are needed and at an affordable price.
Energy market systems are diverse and complex, with large numbers of public and private actors constantly exchanging goods, services and information to produce and sell a set of energy-related products and services. It is thus often not easy to fully understand how each market functions in detail. Identifying how each market actor is interconnected within the system and how the energy value chain functions – from primary energy production to the different end use markets – helps establish which specific segment(s) of the energy market shall be targeted in order to achieve a certain outcome.
This framework provides a systematic approach to categorising each energy market and a set of processes for analysing how each energy market operates and what
makes each of them either thrive or fail. The two separate stages are as follows:
Stage 1: Energy market system mappingStage one requires the mapping of each energy market system against a defined framework, including the three levels of an energy market system; the energy market chain level, the inputs, services and finance4 level and the enabling environment level. This stage helps ensure that all involved actors are identified, as well as their role(s) and how they interact with each other.
Stage 2: Identification and analysis of potential supporting interventionsThis second stage starts with the identification of all the main obstacles and potential opportunities that exist within each energy market system and within each of the three levels. This helps to understand whether the system is functioning effectively and the reasons behind this. Once these have been identified, potential supporting interventions can be designed to try and overcome each barrier, as well as their categorisation and prioritisation. It will probably not be possible to overcome all barriers in a dysfunctional energy market with a single programme combining all necessary interventions, at least not in the short term. However, this stage helps identify all the interventions that are likely to be critical in catalysing and sustaining the transformation of energy market systems.
4) By definition, finance is also a service; however, it has been separated to reflect its relative high importance within the context of energy market systems.
Chapter 2
Energy Market System Analytical Framework
19
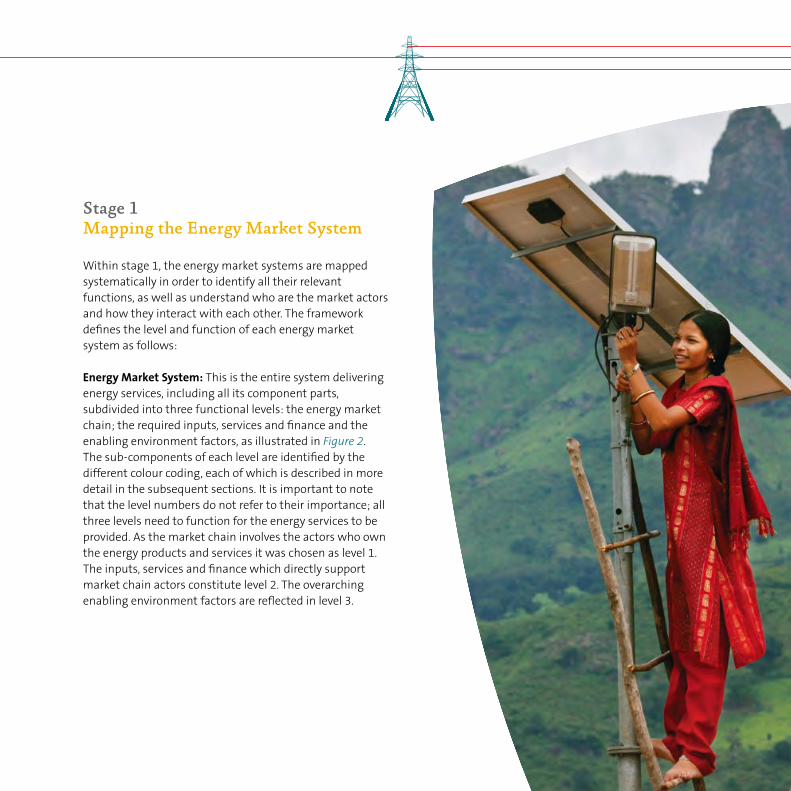
Stage 1 Mapping the Energy Market System Within stage 1, the energy market systems are mapped systematically in order to identify all their relevant functions, as well as understand who are the market actors and how they interact with each other. The framework defines the level and function of each energy market system as follows:
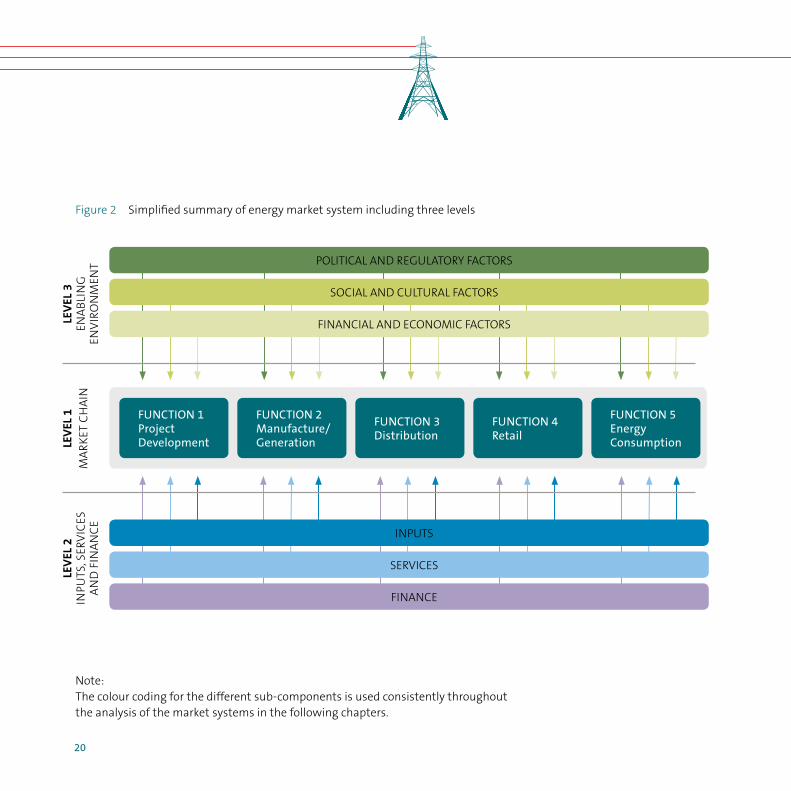
Energy Market System: This is the entire system delivering energy services, including all its component parts, subdivided into three functional levels: the energy market chain; the required inputs, services and finance and the enabling environment factors, as illustrated in Figure 2. The sub-components of each level are identified by the different colour coding, each of which is described in more detail in the subsequent sections. It is important to note that the level numbers do not refer to their importance; all three levels need to function for the energy services to be provided. As the market chain involves the actors who own the energy products and services it was chosen as level 1. The inputs, services and finance which directly support market chain actors constitute level 2. The overarching enabling environment factors are reflected in level 3.
20
Figure 2 Simplified summary of energy market system including three levels
FUNCTION 1Project Development
FUNCTION 2Manufacture/Generation
FUNCTION 3Distribution
FUNCTION 4Retail
FUNCTION 5Energy Consumption
FINANCIAL AND ECONOMIC FACTORS
SOCIAL AND CULTURAL FACTORS
LEV
EL 2
INPU
TS, S
ERV
ICES
A
ND
FIN
AN
CE
FINANCE
SERVICES
INPUTS
POLITICAL AND REGULATORY FACTORS
LEV
EL 1
MA
RKET
CH
AIN
LEV
EL 3
ENA
BLI
NG
EN
VIR
ON
MEN
T
Note: The colour coding for the different sub-components is used consistently throughout the analysis of the market systems in the following chapters.

21
5) The inclusion of a separate project development function depends on the structure of each energy initiative and must be decided during the mapping phase.
Level 1Market Chain At the centre of the market system is the market chain. It describes the channels through which the conversion equipment and products (e.g. the solar PV systems that convert sunlight to electricity and the processed fuels) or the appliances (the improved cook stoves or light bulbs etc.) move from the primary generators or manufacturers to the final end users and thus ultimately result in energy service delivery, passing through four or five broad functions5.
Market chain functionsAs indicated in Figure 2, the market chain has been divided into broad functions, which are the most important stages of delivery of each energy product or service:
Function 1 Project development: This involves the preparatory activities that are required before the energy generation or manufacturing can start and which are of particular importance for mini-grid electricity supply. It is largely an entrepreneurial activity geared towards structuring an (element of) energy market chain into a business proposition and bankable project.
Function 2Manufacturing or generation: This involves the conversion of energy from a range of resources (sunlight, flowing water or diesel) to electricity for mini-grid technologies,
or the production of products for energy generation and conversion.
Function 3Distribution: This involves the establishment of new, or use of existing, distribution networks to allow the energy services or appliances to be transported throughout a country or region, or even internationally (of particular importance for solar PV products). This often involves various transportation methods and logistical arrangements including their storage.
Function 4Retail: This involves the retail of energy services directly to the end users, through a variety of formal and informal retail outlets and channels, employing various retail and marketing strategies.
Function 5Energy consumption: This involves the use of energy or appliances by end users, from households, community services and companies to acquire the required services from lighting to heating and motive power to improve people’s well-being and livelihoods.
Each function is delivered by one or more market chain actor(s) who are the individuals and companies (large and small, formal and informal) that operate within each energy market. These actors own the energy product,

22
service or appliances being delivered at any point in time and are in charge of the operation, management and maintenance as highlighted in Box 1.
Once the functions have been clearly defined for an energy market chain, it is important to map out which function each market chain actor delivers to produce, distribute and retail the energy products and appliances, and how these actors interact with each other. It is important to note that some market chain actors deliver more than one function. Typically each energy product or appliance is transformed in some way as it travels along the market chain. This transformation might be more obvious for physical products such as processed fuels and energy appliances, such as the construction of a solar lantern or a cooking stove. But it also includes transformations which are less visible, such as regulating voltage for a mini-grid system.
Level 2Inputs, services and finance
In order for each of the energy market chain actors to carry out its function(s) effectively and efficiently, they need to access a variety of specific secondary inputs, services and finance which are grouped into Level 2 of the market system. These inputs and services may have their own value chains, including the actors and organisations that provide each one of them. However, as they are secondary to the focus of this framework – the energy market chain – they are not mapped in detail in order to limit the complexity of the framework. In case they are identified as being of critical importance to the success of a particular energy service market, they could and should be mapped as well.
Inputs: Many of the market chain actors require a range of specific inputs, including the physical materials and products required to effectively deliver their function and develop the energy products or services before passing them on to the next market actor in the chain. Such inputs include the electrical equipment for mini-grid developers, hired labour for manufacturing improved cook stoves or wood for the production of charcoal.
Services: A wide range of services are needed by market chain actors to better produce, distribute and sell their energy services and appliances. These services are provided by different actors, including private sector companies, government departments and community-based organisations. Services may include product
Box 1 Operation, Management and MaintenanceThe operation, management and maintenance of energy systems needs to be effectively prioritised and delivered by specific market actors or service companies, as this has been identified as a common shortcoming of energy programmes which could result in their failure.

23
design, market research and quality control and product testing procedures and need to be delivered sustainably and effectively. Educational services are also required to increase knowledge and technical understanding of a range of energy service markets.
Finance: Different financial services are needed across the market chain to enable the market chain actors to produce the products and services to a high quality and to deliver them widely throughout each country or region. Other financial services are required by the end users in order to allow them to purchase the energy products and services. This applies in particular to higher costs production systems such as solar home systems as well as highly efficient improved cook stoves which are relatively expensive for poor consumers. It is also important to note that finance can be provided over different time periods. While some finance might be required for very short term periods e.g. to pay for an appliance such as a solar PV lantern, other finance is required over much longer periods, such as loans and equity for mini-grid systems which might have 10 or 20-year pay-back periods.
Level 3Enabling environment factors
Level 3, the enabling environment, is located above the market chain level in the diagram and covers the diverse set of factors that act as the “rules of the game”, shaping how the market chain and inputs, services and finance operate. Such an environment is often generated by institutions (national and local authorities and research agencies) and comprises policies, regulations and cultural practices (Albu and Griffith, 2005).
These enabling environment factors often directly affect the specific functions and market chain actors within the energy market system. However, they can be influenced by specific market system actors (or external facilitators) and interventions, which are defined later on within this framework. It is a key feature of this document to go beyond the general importance of enabling environments for market systems and highlight exactly where specific elements of the enabling environment affect the market chains.
24
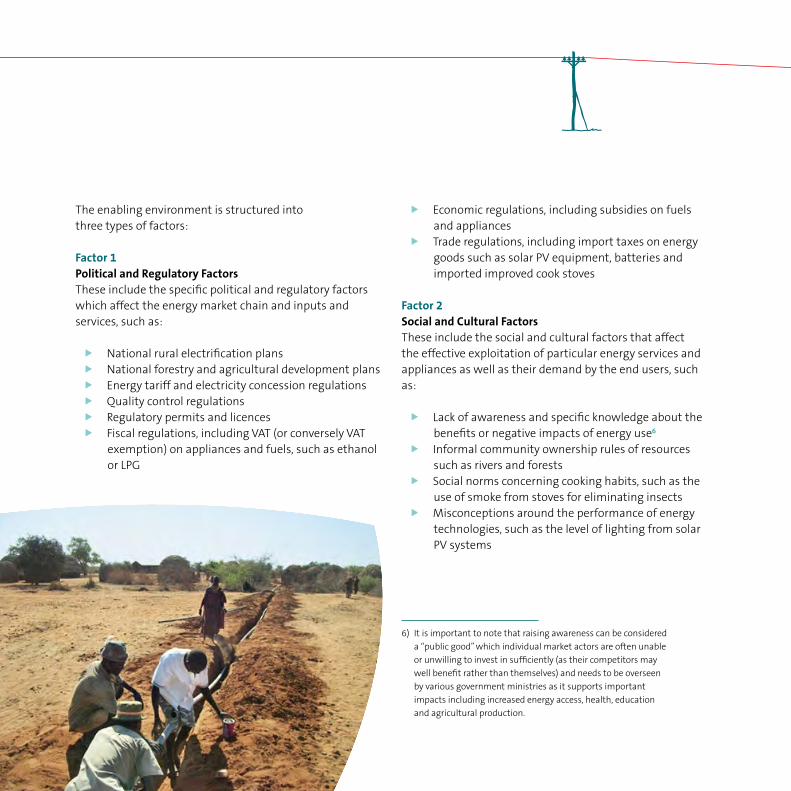
The enabling environment is structured into three types of factors:
Factor 1 Political and Regulatory FactorsThese include the specific political and regulatory factors which affect the energy market chain and inputs and services, such as:
f National rural electrification plans f National forestry and agricultural development plans f Energy tariff and electricity concession regulations f Quality control regulations f Regulatory permits and licences f Fiscal regulations, including VAT (or conversely VAT
exemption) on appliances and fuels, such as ethanol or LPG
f Economic regulations, including subsidies on fuels and appliances
f Trade regulations, including import taxes on energy goods such as solar PV equipment, batteries and imported improved cook stoves
Factor 2 Social and Cultural FactorsThese include the social and cultural factors that affect the effective exploitation of particular energy services and appliances as well as their demand by the end users, such as:
f Lack of awareness and specific knowledge about the benefits or negative impacts of energy use6
f Informal community ownership rules of resources such as rivers and forests
f Social norms concerning cooking habits, such as the use of smoke from stoves for eliminating insects
f Misconceptions around the performance of energy technologies, such as the level of lighting from solar PV systems
6) It is important to note that raising awareness can be considered
a “public good” which individual market actors are often unable
or unwilling to invest in sufficiently (as their competitors may
well benefit rather than themselves) and needs to be overseen
by various government ministries as it supports important
impacts including increased energy access, health, education
and agricultural production.

25
Factor 3 Financial and Economic FactorsThis includes the financial and economic factors that influence the delivery and affordability of a range of energy products and appliances e.g.:
f Income levels and livelihood strategies of end users f End users’ ability to pay f Formality of payment systems f Level of local economic activity
It is also important to note that there are wider aspects that are typically associated with the enabling environment of a market that may take a very long time to overcome and may require extensive resources beyond the ability of most market actors and stakeholders. While they may be influenced by long term engagement with planned interventions, they are generally difficult to overcome in the short term. Such factors include the following:
f Global market trends: Global technology development trends as well as the demand for, and costs of, materials and energy goods clearly affect the availability and affordability of energy services. However, it is typically beyond the ability of stakeholders in any individual energy market system at national level to influence them to a meaningful extent.
f Macro-Economics: Political and economic stability and levels of macro-economic indicators such as growth, inflation and exchange rates need to be given significant considerations with respect to potential market actors’ willingness to engage in specific energy market systems. Yet, they are largely beyond the control of those focused on energy access provision.
f Social and Cultural Norms: The collective beliefs of consumer groups within urban or rural settings of developing countries are important in influencing their decisions with respect to the consumption of a range of energy services. However, they are often quite complex or deeply-rooted and resistant to change. Similarly, while ease of doing business will affect the development of energy market systems, complex factors which facilitate or obstruct business processes (such as general levels of corruption and bureaucracy) are difficult to change. Therefore, only social and cultural norms which can be overcome through feasible interventions have been included in this framework.
f Major Infrastructure: This includes roads, telecommunications, aqueducts, etc., which are typically beyond the scope of a particular energy project. Certain infrastructure, such as mini-grid electricity cables of a specific energy project, is included as part of the service provided by the market actors. However, other infrastructure is included as part of the overall national infrastructure

26
and can only be developed as part of a wider infrastructure improvement programme.
f Environmental and Ecosystem Factors: This includes rain regimes, quality of soil, presence or absence of minerals or plants for fuel, etc., which are beyond the capacity of the development agents and market actors to influence.
f Legal System and Enforcement: The robustness of the legal system, confidence in contractual enforcement, clarity in relation to issues such as land ownership, and a business-friendly environment in relation to factors such as repatriation of earnings, are all considerations for investment decisions by prospective market actors, but generally extend beyond the reach of most energy-focussed programmes.
Since these factors are typically subject to macro-level, long-term development, they often cannot be influenced directly by the instruments available for promoting energy market development. For these reasons they are not included in the market systems framework laid out by this study. It could be argued that these macro-aspects of the enabling environment, in turn, form a higher layer into which the market systems as introduced in this study are “embedded” in their entirety.
Development of energy service market system maps
This framework has been used to produce detailed maps of the market systems of a range of decentralised energy services required to increase access to at least the energy tier levels required to achieve universal energy access as being promoted by the Sustainable Energy for All (SE4All) Initiative and the Global Tracking Framework (PPEO, 2012; World Bank, 2013).
Since many energy access programmes to date have been focused on improving grid systems through publicly-owned utilities which have had a much higher political priority than decentralised energy options, this framework has explicitly not included grid extension, although it could be adapted for this purpose. However, it is important to note that grid-based electrification remains the least-cost option for many geographical and socio-economic situations and thus a crucial pillar of achieving universal access to energy.
In all energy market systems, women play an important role. For instance, women and children are most affected by indoor pollution and risks of burns – dangers that can be reduced by clean cooking solutions. Moreover, as women often hold a significant sway in decisions related to the purchase and the end-use of household appliances, they greatly benefit from savings made by installing cost-effective lighting solutions.

27
In addition to being direct beneficiaries of the use of sustainable energy systems, women as entrepreneurs and agents of change are also key actors in the energy value chains.
Against this background, a set of “market system maps” has been developed for each of the following main categories of energy services:
1) Electricity Mini-Grid Model (see Chapter 5)2) Solar PV Lantern Model (see Chapter 6)3) Solar PV Home System Model (see Chapter 7)4) Biomass Improved Cook Stove and Fuel Model
(see Chapter 8)5) LPG Fuel and Stoves Model (see Chapter 9)
Each of these energy service models has been investigated, including the most important differences within the sub-categories of each level, to produce detailed market maps as well as the specific barriers and supporting interventions suitable to overcome these barriers. Each of these energy model categories was then referenced with information from a number of case studies to validate the framework and add detail and context.
28
Energy market system case studies
A total of 10 well-known case studies have been analysed using the framework, providing context and practical details, including their market barriers and potential supporting interventions. The case studies were chosen by the project team after a detailed assessment of a wide range of energy service projects, using the following criteria, as well as ensuring a good balance between energy service markets in Southern Africa (SA), East Africa (EA) and West Africa (WA):
f Success in delivering a range of energy services f Potential for scaling up f Access to relevant data about each level of the energy
value chains, including the market chain actor and relevant barriers as well as documentation within well-known publications
f Lack of significant obstacles for assessing them
The analysis of the case studies shows how useful the structure and categorisation of the framework is in addition to providing critical real-life experience from a range of energy market systems, as summarised in Chapter 10.

29

30
Stage 2Design of Supporting Interventions
Step 1: Identification of Support Interventions Once each energy market system map has been produced, the second stage is to identify the main barriers preventing the market system from delivering its products and services efficiently and sustainably, and to design appropriate supporting interventions for overcoming these barriers as well as gaps within its programme design. Some of these market system barriers have been detailed in Box 3.
Once the most important supporting interventions required to overcome each market barrier have been identified within each level of the energy market system map, they have been highlighted using a marker composed of a letter and number, as per the following key:
Box 3 Market system barriersTo ensure that the most applicable and relevant support interventions in a given market system are identified and selected, it is important to analyse and assess all the barriers and opportunities that are limiting the growth of an energy market system. It is then important to decide which of these are the most restricting ones and which, if overcome, will allow the market to develop in the most effective way.
Such barriers may also include corruption and abuse of power arising from incoherent or inadequate regulation, e.g. in the charcoal market. Additionally, barriers might comprise a lack of technological or institutional capacity which keeps the system operating in a dysfunctional way. Another example is a lack of quality control regulations to ensure that poor quality products do not damage a market or too few forestry officials, who are unable to control illegal logging for informal charcoal production.Key:
E1
The letter refers to which of the 3 levels of the energy
market system the identified barrier sits within, as
follows:
M: refers to the energy market chain – Level 1
S: refers to the inputs, service and finance – Level 2
E: refers to the enabling environment factors – Level 3
The numbers refer to the number of the identified
supporting intervention. Each intervention can be
separately identified, starting with 1 and ending with
the last identified intervention.

31
Box 4CapacityWithin many energy market systems in developing countries there is a general lack of capacity. This often includes government departments, as well as the energy companies and the supporting services and financial institutions. To overcome this lack of capacity, a range of capacity development activities need to be designed and delivered to address each specific problem, from the development of specific regulation documents to training companies on how to produce sustainable business models. This lack of capacity can be viewed as a cross-cutting barrier which needs to be addressed within most levels of energy market systems.
Each intervention thus corresponds with a specific barrier identified in an energy market system and is designed to support one or more specific actors in one or more of the three market levels.
Detailed market maps have been developed for each of the energy service categories, with a number of market barriers identified, as well as their corresponding supporting interventions within each of the three levels; the enabling environment, the market chain and the inputs, services and finance.
Barriers and interventions for each market map are summarised in the corresponding tables. Each table includes the identified barriers, a description of the supporting interventions and the most likely responsible organisation who should ultimately be leading the intervention – although this needs to be verified during the development of any programme of support. It also includes the categorisation of the type of intervention required, as outlined in the following section.
The barriers and interventions identified within the five energy service categories, detailed within Chapters 5 to 9, are for indicative purposes and it is important that a detailed assessment is carried out for each energy service market that is going to be supported in a particular country or region to ensure the most important barriers are identified as well as their corresponding interventions.
Experience has shown that the barriers that occur in energy markets are often due to the lack of capacity of particular market actor, as briefly outlined in Box 4.

32
Step 2: Categorisation of Interventions Once an intervention has been identified, it is important to categorise it. Table 1 summarises the main types of interventions that have been identified for the purposes of this study, divided into the two main categories of capacity development or technical assistance (TA) and financial assistance (FA). An intervention code has also been included to allow them to be quickly and easily identified.
Once all the interventions have been defined and categorised it is also possible to prioritise them. This prioritisation can be made based on the potential impact of each intervention on the market actors and end users. However, since this requires a thorough understanding and assessment of these impacts, prioritisation of interventions is outside the scope of this study.

33
Table 1 Summary of supporting interventions
Intervention Type Intervention Description Intervention Code
Technical Assistance (TA) Interventions
Business Development Support Increased capacity of market chain companies to develop their
business models.
TAB
Technical Support Increased capacity of market chain companies on technical issues. TAT
Policy Support Increased capacity of government departments to overcome a
particular enabling environment factor.
TAP
Advocacy Support Increased capacity of relevant stakeholders to allow them to
participate in the development of particular policies and regulations as
well as ensuring they are enforced.
TAAd
Awareness-raising Support Increased capacity of end-users to understand the benefits of energy
products and appliances and increase their uptake.
TAAw
Financial Assistance (FA) Interventions
Direct Grant Financing Support Provision of grant funding to directly or indirectly subsidise the costs of
establishing an energy delivery system (e.g. a mini-grid or establish a
stove production facility), including tax concessions.
FAG
Loan Financing Support Provision of loan financing, directly or through intermediaries (e.g.
local banks or micro-finance institutions).
FAL
Equity Financing Support Provision of financing for equity investment in companies, again
directly or through intermediaries (e.g. dedicated energy investment
funds).
FAE
Complementary Financing
Support
Provision of complementary financing (e.g. policy risk mitigation,
currency risk mitigation, loan guarantees etc.).
FAC

34
Chapter 3 Energy Market System 1: Mini-Grid Electricity

35

36
Introduction
The International Energy Agency (IEA) estimates that by 2040 mini-grids and off-grid systems will provide electricity to around 70 % to those gaining access to electricity in rural areas (IEA, 2014). Of the 315 million people expected to gain access, 80 million will be provided via off-grid systems and 140 million through mini-grids, whereby two-thirds of the mini-grids will be powered by solar PV, small hydro or wind. Depending on the number of households connected to each system, this will require the development of 100.000 to 200.000 new mini-grid installations. And yet, mini-grids have struggled to expand beyond pilot projects and need to be scaled-up to make a meaningful contribution to the Sustainable Energy for All (SE4All) targets. Achieving scale of mini-grid implementation requires a range of specific and supportive policy and regulatory frameworks, technical capacity development of implementers and increased investment as well as technical capacity.
The mini-grid electricity market map in Figure 4 outlines the sale of electricity from the mini-grid operator to the electricity consumer. Unlike the other value chains presented in this report, the energy supply itself is the subject of the mini-grid value chain rather than the energy appliance or product. In most cases of mini-grids materialising, a project developer (public or private) will play a critical role in planning and implementing the project. Project development is thus included in the market chain as a prerequisite for mini-grid electricity delivery within Function 1. The project developer may transfer ownership of the mini-grid to another agency to operate the system, or continue to own and operate the system himself
Chapter 3
Energy Market System 1: Mini-Grid Electricity

37
Mini-Grid Business Models
There are four prominent mini-grid business models as follows (EUEI PDF, 2014):
f Private sector f Utility / government f Community-led f Hybrids (e.g. public private partnerships)
Good practice and successful initiatives can be found for each model and a number of international experiences with mini-grids, especially in Africa, are outlined in the Mini-grid Policy Toolkit (EUEI PDF, 2014). Yet, the most appropriate approach is context specific, and scale-up and replication of each is important for achieving universal access to electricity. The role of “anchor clients” is also an important element of many mini-grid systems as briefly outlined in Box 5.
Box 5 Anchor clientsElectricity mini-grids may greatly benefit from anchor clients who are able to purchase a large quantity of electricity, often for community services such as schools or medical centres, mobile network base stations or for productive services such as electrical mills, welding operations or hairdressing salons. Without these anchor tenants the large number of very poor households, who are also served, are not able to purchase enough electricity at the established high price to pay for the on-going management and maintenance of the systems, let alone start to pay back the capital costs of the systems.
The market map presents a generic business model detailing the common elements and factors that need to be considered.

38
Model 1 Private sectorAs described in more detail in the Mini-grid Policy Toolkit (EUEI PDF, 2014), a private entity plans, builds, manages and operates the mini-grid system in the private operator model. Private sector-led deployment of mini-grids is considered widely as the most likely approach for achieving scale and long-term operation. However, some concerns still remain (DfID, 2013), especially since the private operator model requires a sound regulatory environment as a basis for private investment. The financial imperative of private enterprises is a driver for efficiency and growth. This must be – also through appropriate regulation – combined with social concerns in order to achieve benefits for the society as whole. The private sector market faces the following particular enabling environment challenges:
f Regulations applying to the governance and ownership of mini-grid companies
f Obtaining permits and licenses to operate, including concessions
f Accessing public financial support f Retail tariff regulations to enable cost-recovery f Uncertainty about government grid extension
plans and the terms and conditions for future grid connection
Model 2 Utility / GovernmentIn Africa, the top-down public-led utility operator model, where governments design the programmes and utilities (either fully privatised, public or parastatal) implement them, is historically the most prominent approach. In this model, the utility operates the mini-grid in the same way as it operates the national electricity network. Utilities can build upon their extensive experience, financial resources and technical capabilities to carry out rural electrification projects, and are able to take advantage of economies of scale and financing options (DfID, 2013). However, often utilities need extra government incentives to invest outside their core-business, and issues of low efficiency and governance also need to be addressed. A business-oriented approach is important for public mini-grids to be sustained; though a utility may able to absorb higher costs or financial losses of mini-grids within its wider portfolio.

39
Model 3 Community-ledHistorically, NGOs and faith-based organisations have been active in mini-grid deployment. Often they work closely with communities and local public facilities such for the deployment of infrastructure and to support its operation, maintenance and management. A review of the literature has shown that community-led provision is commonly considered a distinct business model (EUEI-PDF, 2013; DfID, 2013; USAID/ARE). Sustainability of community-led mini-grids is often a challenge as community-based organisations typically lack the capacity for rigorous operation, maintenance and responsible financial management. Community-led mini-grids are often partly funded through donor grants, which limit the amount of available capital and confine their potential for scale.
Model 4 Hybrid (generation through Independent Power Producer (IPP) and distribution through public utility)Currently, there are no well-known public-private operational models, although this model offers the potential to mitigate some of the challenges of the pure private and utility models. The hybrid model, however, may ease the requirements for a highly sophisticated enabling environment, as summarised in Figure 3.
Barriers and Supporting InterventionsA number of barriers and supporting interventions have been identified for mini-grid electricity, outlined in Figure 4 and Table 2. More detailed information on the different aspects can be found in the Mini-grid Policy Toolkit (EUEI PDF, 2014).
Figure 3 Illustrative market chain for public-private mini-grid electricity model
Generation
Independent power provider
Consumption
Housholds, Enterprises, Public facilities
Distribution Retail
Utility

40
Figure 4 Mini-grid electricity market map
Electricity technical standards Retail tariffs
Rural electrification polices and plans
Local economic activity
Consumer perceptions and awareness
Repair and maintenance services
Operation and distribution finance
End user inputs – design, management and governance
End user microfinance
Equipment and spare parts Electrical appliances
Generation fuel / feedstock resource
Regulations, permits and procedures
Import duty and taxes
Mini-grid institutional framework
Project developer Households
Enterprises
Public sector
Mini-Grid operator
Project Development
E1
E8
E3
E2
E4
E5
E7E6
M1 M2
M3
S2
ConsumptionGeneration Distribution Retail
Developer access to Mini-grid
technology
Development finance
S1
S4 S5
S3
INPU
TS, S
ERV
ICES
A
ND
FIN
AN
CE
LEV
EL 1
MA
RKET
CH
AIN
LEV
EL 3
ENA
BLI
NG
EN
VIR
ON
MEN
T

41
Table 2 Mini-grid electricity supporting interventions
Identification Market System Level Issue Responsible Actor Support Intervention Category
Level 3 – Enabling Environment
E1Lack of Rural Electrification Agency and Government
Authorities to Support Mini-Grid Deployment
An institutional structure to oversee and enable
the large scale deployment of mini-grids, including
a rural electrification agency and a regulatory
agency, is essential. Clearly defined roles and
responsibilities as well as coordination between the
various institutions that support rural electrification
are required. Mini-grids should be given resources
proportionate to their expected contribution to
achieving universal access to electricity.
Ministry of Energy,
Rural Electrification
Agency, National
Energy Regulator
Technical assistance to
establish the structure,
procedures, incentives,
priorities and technical
capabilities of
government agencies.
TAP
E2Lack of Supportive Importation Duty and Tax Policies
The mini-grid market can be stimulated by reducing
costs of mini-grid equipment or components
through lower import duties and taxes.
Ministry of Finance.
Bureau of Customs.
Technical assistance
to promote supportive
trade and tax policies.
TAP

42
E3Low Awareness and Perception of Mini-grids
Widespread awareness of the potential
development impacts and cost-effectiveness of
mini-grids is important to stimulate increased
business activity, programmes and investment.
Governments,
donors, private
sector and financial
institutions
Technical assistance
to raise public
awareness of the
role and importance
of mini-grids,
including information
and comparisons
of different
technologies.
TAAW
E4Discouraging Regulations, Permits and Procedures
Clear, efficient and specific regulation for the
mini-grid development process and permitting
procedures. Regulations cover a wide range of areas
(including private ownership, licenses, concessions,
tariffs, etc.), and the relevance and applicability
differs for public, private and community-based
operators. Often regulations from the on-grid sector
are applied to mini-grid projects, making the license
approving process a timely and costly activity that is
disproportionate to the project size. The information
should be readily available for the public domain.
Relevant
government
agencies, including
Ministry of Energy,
Rural Electrification
Agency, National
Energy Regulator
Technical assistance
to establish a
conducive regulatory
framework.
TAP
Technical assistance
for project developers
to understand
regulatory
frameworks.
TAB
E5Lack of Clarity on Rural Electricity Policy and Plans
Certainty about grid extension plans and
arrangements in the event of later grid-connection
are important for project developers to secure
investment. A stable policy environment is necessary
to give finance providers confidence in long-term
investments.
Ministry of Energy Technical assistance
to develop supportive
rural electrification
policies and plans.
TAP

43
E6Lack of Electrical Technical Standards for Mini-
Grids
Dedicated technical regulations are required
to safeguard the quality of mini-grid electricity
supply, reduce health and environmental risk and
encourage investment. In the absence of mini-
grid specific standards, there may either be no
standards applied or the standards for central grid
infrastructure may be applied inappropriately.
National Energy
Regulator
Technical assistance
to develop and ensure
compliance to a set of
standard regulations for
mini-grid systems.
TAT
TAP
E7Discouraging Electricity Tariff Regulations
The consumer price / tariff of mini-grid electricity
is regulated by government agencies. The tariff
needs to be set at a level that can enable viability
for mini-grid operators and at the same time
ensure affordability as well as social acceptability
for users.
A policy that sets the tariff and modalities for
electricity to be fed into the grid in the event of
later grid connection is essential to provide project
developers with security of their investment.
National Energy
Regulator
Technical assistance to
develop and implement
tariff regulations and
unit price setting.
TAP
E8Low Levels of Local Economic Activity
Productive use of electricity supports local
economic development and income and
contributes to the sustainability of the mini-grid
scheme. The productive use options depend on
local economic activity and access to markets for
products and services enabled by the mini-grid.
Mini-grid
electricity
consumers.
Technical assistance
for project developers
to facilitate productive
use of electricity within
communities.
TAB

44
Level 1 – Market Chain
M1Limited Number of Project Developers and
Effective Delivery Models
The existence of project developers with viable
operational models that can achieve scale and
sustainability is essential. Project developers
need to achieve scale – either through a large
single scheme or by bundling many smaller
schemes – to attract finance and be commercially
viable. Mini-grids are custom-made for each
location, challenging replication and scale-up.
Project
developers;
existing
enterprises
and emerging
entrepreneurs
Technical assistance to
energy companies to develop
sustainable business models.
This includes training and
promotion activities, support
to business development
services, and technology
transfer (such as toolkits,
trainings, study visits).
TAB
TAT
M2Limited Number of Mini-Grid Operators and
Sustainable Operational Models
Capable mini-grid operators that can manage
the technology, finance and management are
required to sustain a scheme. Mini-grid operators
need to balance the costs of operation with
the provision of affordable electricity to poor
consumers.
Project
developers
and mini-grid
operators.
Technical assistance to
establish or improve business
development services,
including technology transfer;
toolkits, trainings and study
visits.
TAB
TAT
M3High Poverty Levels of Rural Electricity
Consumers
Electricity offers improved quality and
functionality compared with traditional
energy supplies. Affordability of connection,
consumption of electricity and purchase of
appliances/equipment for consumers with
low income and irregular cash-flow can affects
the usage patterns.
Electricity
consumers –
Households,
Enterprises,
Public facilities
Technical and financial
assistance to increase
awareness about efficient
electrical equipment and
appliances. Technical assistance
for productive use facilitation
and cross-sector links with
health and education to
promote electricity use.
TAAw
FAG

45
Level 2 – Inputs, Services and Finance
S1Low Access to Mini-grid Technology (Generation
equipment, Monitoring and control, Distribution,
Payment platform)
Mini-grid systems are a mature technology that
can provide useful amounts of electricity to rural
communities. The technology is widely available,
although high costs can be an issue, particularly
when importation is required. Technology
innovation continues to drive down costs whilst
improving the quality and functionality. Mini-grid
systems – particularly hybrid – can be complex,
and require technical expertise in the engineering,
procurement and construction.
Project
developers
Technical assistance to
raise awareness and
for technology transfer
(such as development of
toolkits, trainings, study
visits).
TAAw
TAT
S2Low Access to Affordable and Quality Low-Power
Electrical Equipment and Appliances
Encouraging the uptake of efficient electrical
products helps to extend usage with the limited
energy from the mini-grid, and offers economic
benefits. Encouraging productive use of electricity
through livelihood equipment supports broader
socio-economic goals.
Electricity
consumers.
Electrical product
suppliers.
Technical assistance
to increase awareness
about efficient electrical
products and to improve
market systems to
supply efficient electrical
products.
TAAw
TAP
S3
Lack of Availability of Repair and Maintenance
Services and Parts
The sustainability of a system depends on its
ability to access affordable technical services and
parts. The services may be embedded with the
mini-grid operator, or sub-contracted.
Mini-grid
operators
Technical assistance
for raising awareness
and technology transfer
(such as development of
toolkits, trainings, study
visits).
TAAw
TAT

46
S4Lack of Access to Project Finance
Mini-grids struggle to be commercially viable
with private sector funding alone. However, the
social and economic benefits they offer to poor
people can merit public funding. A combination
of public and private sector funding and a range
of finance instruments are required to achieve a
sizeable mini-grid market. Programmes need to
be of sufficient scale to be attractive to financing
institutions and investors.
Project developer.
Financial Service
Providers.
Technical and financial
assistance to financial
service providers to
innovate and pilot new
financial products as well
as awareness-raising for
loans and equity, public-
private partnerships and
to reduce risk and loan
guarantees.
TAT
FAG
FAL
FAE
FAC
S5Lack of Access to Operational Finance
Operational funding support can help mini-grid
operators to sustain operations and deliver
affordable electricity to poor consumers.
A guaranteed tariff subsidised by governments
could also make mini-grid deployment
commercially attractive for a project developer.
Mini-grid
operator.
Ministry of
Energy, Rural
Electrification
Agency.
Technical and
financial assistance
to subsidise the unit
price of electricity and
increase awareness
of government
departments to develop
off-grid feed-in-tariffs.
TAAw
FAG
FAC

47

48
Chapter 4 Energy Market System 2: Solar PV Lanterns

49

50
Introduction
The production and delivery of solar PV lanterns (often referred to as nano or pico PV) to households, community services and small businesses is one of the most affordable and growing decentralised energy services for electrification, particularly for lighting, but increasingly also for mobile phone charging. They typically consist of a complete in-build unit, comprising a battery, solar panel, wiring, power regulation and lighting bulbs or diodes, most often LEDs. These units are designed to be versatile and very tough to survive in remote and hostile conditions without requiring significant on-going maintenance. A fairly wide range of sizes and powers of lanterns are available with new models coming out frequently, although with an equally wide range of qualities and durability.
Level 1Market Chain
The production and sale of solar PV lanterns typically falls into two main categories, which have quite distinctly different business models:
Model 1Distribution Dealer ModelThis refers to a business model where one company designs and produces the solar PV lantern units and then sells them on to other companies who distribute and retail the products locally. There are a number of variations of the market chain actors within this model with some distributing and retailing the products and others just performing one of these functions. A number of solar PV
Chapter 4
Energy Market System 2: Solar PV Lanterns
Figure 5 Illustrative market chain for distribution dealer model
Solar lantern company (product design and sales)
Importer (importation
and sales)
Commercial retailers (distribution and retail)
Manufacture Distribution Retail
Households
Enterprises
Public sectorFBOs/CO-OPs/SACCOs
Consumption
NATIONALINTERNATIONAL

51
companies have come up with innovative distribution and marketing strategies such as Solar Sisters which has developed a sales and distribution model based on the Avon cosmetics company, and Solar Aid which uses local head teachers to initially market their products.
Model 2Integrated Supply Chain ModelThis refers to a business model in which the solar PV company designs and manufactures the entire system, as well as distributes and sells them directly to the end user. Payment is either done fully up-front, or in a number of instalments, often requiring the end users to access micro-finance loans when they do not have sufficient savings. This model is deployed by a limited number of actors such as Barefoot Power and d.light.
Figure 6 Illustrative market chain for integrated supply chain model
Solar lantern company (product design, importation, distribution and retail)
Manufacture Distribution Retail
Households
Enterprises
Public sector
Consumption
NATIONALINTERNATIONAL

52
Level 2Inputs, Services and Finance
Inputs: As the solar lanterns are powered by the sun and are often designed as complete systems, the main external inputs that are required are spare parts, particularly batteries and LEDs which need replacing every few years depending on their quality. The unit supplier will often take responsibility for replacing the parts for a fee.
Services: The main services that are required by the solar PV companies are market intelligence about the potential market size and distribution in each country in order to allow them to plan their supply chains and distribution centres as well as their marketing strategies. In addition, quality control regulation is required to ensure all solar PV lanterns are tested and meet certain standards, so that consumer confidence is not seriously damaged by poor quality products which do not meet user’s expectations.
Finance: Finance is often needed for the solar PV lantern companies to be able to produce enough stock to distribute throughout a country to invest in their distribution and retail outlets, as well as marketing to create enough demand to keep them in business. In addition, finance is often needed by end users as the solar PV lanterns need to be purchased upfront and their costs significantly exceed potential user’s savings which are often limited, particularly amongst the poor. Microfinance, community savings schemes and rolling funds can all help the end users pay for the products over a period of time. The cost recovery takes
place often fairly quickly due to the savings individuals make on not having to purchase the candles, batteries or kerosene they would previously have used for lighting.
Level 3 Enabling Environment
The main enabling environment factors for solar PV lanterns comprise the costs of importing the solar PV units, including the import duties, taxation and permits that need to be obtained in any country. Other factors include government regulations regarding renewable energy, and in particular rural electrification, including technical standards for solar PV lanterns. In addition, the general low level of awareness of the benefits of solar PV lanterns is still an important barrier in many developing countries, particularly in rural areas where they are required the most. Some countries still provide subsidies for kerosene that is used within lanterns for lighting and which has led to a negative effect on the solar PV lantern market and needs to be regulated.
Barriers and Supporting Interventions A number of barriers and supporting interventions have been identified for solar PV lanterns, depicted in Figure 7 and Table 3:

53
Figure 7 Solar PV lantern market map
Rural electrification policy
Household cash flow
Consumer awareness and product trust levels
Quality control regulation testing and adherence
Product quality standards
Import duty and taxes
E4
E3
E2
E1
Contract manufacturer (e.g. China, India)
Information Training and educational institutions End of life disposal
Transport services
Product retailers Service and parts shops
Financing Financing End user microfinance
S2
Solar lantern company (product design, importation, distribution and retail)
Solar lantern manufacturer
Manufacture Distribution Retail
Households
Enterprises
Public sector
Consumption
NATIONALINTERNATIONAL
M3
M2M1
S3
S1
LEV
EL 2
I NPU
TS, S
ERV
ICES
A
ND
FIN
AN
CE
LEV
EL 1
MA
RKET
CH
AIN
LEV
EL 3
E NA
BLI
NG
EN
VIR
ON
MEN
T

54
Table 3 Solar PV lantern supporting interventions
Level Market System Level Issue Responsible Actor Potential Support Intervention Category
Level 3 – Enabling Environment
E1Lack of Clear Rural Electricity
Policy for Off-Grid Supply
Rural electrification policies
in relation to off-grid energy
products are not clearly
specified without clear
strategies and objectives.
In addition clear policies in
relation to kerosene subsidies
need to be developed to
ensure that solar PV lanterns
can compete against kerosene
for off-grid lighting.
Ministry of Energy Technical assistance to relevant policy
makers to reform rural electrification
policies to increase the role of off-grid
electrification from solar PV systems
through the development and
implementation of specific policies
and regulations. Improved policies will
include targets and strategies for rural
electrification products, in particular
ensuring subsidies for fossil fuels
(e.g. kerosene) do not damage the
development of the solar PV market.
Technical assistance to increase the level
of advocacy from civil society and private
sector solar PV companies to eliminate
unsupportive subsidies for kerosene.
TAP
TAAd
E2Lack of Quality Standard for
Solar PV Lanterns
Quality standards have not
been developed for solar PV
lanterns to control quality and
performance of the systems.
Ministry of Energy Technical assistance to develop quality
standards for solar PV lanterns, including
all major components, including solar
panels, batteries, power regulation and
lamps. Standards which ensure high
quality of systems are maintained to
ensure end-user demand is met without
damaging the overall market.
TAP
TAT

55
Level Market System Level Issue Responsible Actor Potential Support Intervention Category
E3Low Consumer Awareness
and Product Trust Levels for
Solar PV Lanterns
The levels of awareness of
the potential benefits, and
product trust levels for solar
PV lanterns is still low in
some countries and regions,
particularly in rural areas,
thus demand for PV products
is still relatively low.
Ministry of Energy
Ministry of Local
Government
Technical assistance to increase awareness
of the potential benefits of solar PV
products to the end users, particularly in
rural areas,. Technical assistance to include
a range of activities from promotional
campaigns, including radio’s commercials,
as well as demonstrations and extension
officer support.
TAAw
TAP
E4
Low Household Cash Flow
Levels
Households do not have
sufficient cash flows and
savings to allow them
to purchase the solar PV
lanterns.
End users Technical and financial assistance to end
users to overcome the relatively high costs
of the solar PV lanterns. These might take
the form of subsidies, such as results-
based finance (RBF), to reduce the unit,
or support to increase the availability of
financial loans for solar PV lanterns.
TAP
FAG
FAL

56
Level 1 – Market Chain
M1Low Quality of Solar PV
Lanterns
The equipment for the
energy production is of a low
quality and often leads to the
breakdown of the production
systems.
Private sector
companies
Technical assistance to support solar
PV producer facilities to allow them to
produce, distribute and retail solar PV
equipment. Technical assistance is needed
to ensure PV equipment performs at a
very high level to meet the needs and
expectations of the end users.
TAT
M2Lack of Effective Business
Models For Distribution and
Retail of Solar PV Lanterns
Energy companies within
each energy value chain are
not able to develop effective
business models for selling
and distributing their
products.
Private sector
companies
Technical assistance to solar PV
companies to help them develop and
implement sustainable business models
to produce and deliver their products
at scale. Technical assistance to build
the capacity of the companies, including
business development and technical
training, products, as well as their
distribution, retail models and marketing.
TAB
TAT
M3Low Demand for Solar PV
Lanterns
Public facilities that use the
energy services are unable to
afford it on a regular basis.
Public Facility
End Users
Technical assistance to raise awareness
to build demand of end users for solar
PV lanterns. Technical assistance in order
to understand the reasons for the low
levels of demand and to plan strategies to
increase demand for the products.
TAAr

57
Level 2 – Inputs, Services and Finance
S1
Lack of Quality Service and
Parts for Solar PV Lanterns
Retail and
Electronics
companies
Technical assistance to increase
awareness and capacity of retail and
electronics companies to develop more
extensive networks of solar PV lantern
quality service and spare parts. Need to
stock relevant spare parts and appliances
to sell to solar PV lantern end-users.
TAT
S2Lack of Quality Control
Enforcement
National Bureau
of Standards in
coordination with
testing facility
and evaluation
organisation.
Technical and financial assistance to set
up test facilities and ensure regulator
is able to adequately test and certify
all companies and their products on an
on-going basis. Capacity development of
quality assurance regulator to ensure that
all companies producing, distributing and
retailing solar PV lantern in a country are
regularly tested to ensure they meet the
regulation standards.
TAT
FAG
S3Lack of Access to Appropriate
Microfinance Loans for
end-users
Microfinance institutions
need to develop specific loan
packages to allow end-users
to overcome the relatively
high upfront costs of solar PV
lanterns.
Microfinance
companies and
SACCOs
Technical and financial assistance
to micro-finance and local savings
organisations, such as SACCOs, to develop
specific and appropriate financial loan
packages for the end users of the solar
PV lanterns.
Financial loans and complimentary
financial support to allow financial
institutions to market new products to
end users.
TAT
FAL
FAC

58
Chapter 5 Energy Market System 3: Solar PV Home Systems (SHS)


60
Introduction
The production and delivery of solar PV home systems (SHS) to households, community services and small businesses is another growing decentralised electrification energy service, in particular for lighting. SHS are also becoming more common for other electrification purposes such as mobile phone charging, radios and refrigeration. Other low voltage appliances such as televisions are being developed to be powered by solar PV. The systems contain of a number of component parts which are often supplied as a complete package and need to be installed within a building (households, community buildings or businesses). This package consists of solar panels (mostly roof panels), batteries, a power regulation unit, wiring and light bulbs, as well as any other energy appliances required.
Level 1 Market Chain
The production and sales of solar PV home systems typically fall into three main categories, which have quite distinctly different business models (the first two being the same as for solar PV lanterns):
Model 1 Integrated Supply Chain Model: This refers to a business model in which the solar PV company designs and manufactures the entire system, as well as distributes and sells it directly to the end user. Payment is either done through full payment up-front or in a number of instalments, in some cases requiring the end users to access micro-finance loans when they do not have sufficient savings.
Figure 8 Illustrative market chain for integrated supply chain model
Chapter 5
Energy Market System 3: Solar PV Home Systems (SHS)
Solar lantern system (SHS) company (product design, importation, distribution and retail)
Manufacture Distribution Retail
Households
Enterprises
Public sector
Consumption
NATIONALINTERNATIONAL

61
Model 2 Distribution Dealer Model: This refers to a business model where one company designs and produces the solar PV homes system units and then sells them on other companies who distribute and retail the products locally. There are a number of variations of market chain actors within this model with some distributing and retailing the products simultaneously and others just performing one of these functions.
Figure 9 Illustrative market chain for distribution dealer model
SHS company (product design
and sales)
SHS distributer (including
product importation)
Commercial retailers (distribution and retail)
Manufacture Distribution Retail
Households
Enterprises
Public sectorFBOs/CO-OPs/SACCOs
Consumption
NATIONALINTERNATIONAL/NATIONAL

62
Model 3 Fee-for-Service: This market chain business model operates where the solar PV systems are not sold to the end users, but continue to be owned by the company who then sells electricity to the end users. Electricity is typically paid monthly. This model has been developed to try and overcome the barrier of end users not being able to purchase the complete systems themselves. The end-consumers are not the final owners of the physical systems, but only purchase the produced electricity. This model shows similarities with the mini-grid electricity model.
Figure 10 Illustrative market chain for fee-for-service business model
Solar homes system (SHS) companyfranchise (retail)
Manufacture Distribution Retail
Households
Public sectorfranchisees (rental/leasing)
Consumption
NATIONALINTERNATIONAL
63
Level 2Inputs, Services and Finance
Inputs: Solar home systems (SHS) use solar energy as their main on-going input which is available without cost. They are also typically designed as complete systems without the need for additional inputs to be supplied regularly. System parts need to be replaced every few years depending on their quality, in particular batteries and lights (often LEDs). However, the best SHSs require little in terms of on-going maintenance. The SHS unit supplier will often take responsibility for replacing these parts for a fee. Often SHS suppliers encourage their customers to gradually upgrade their systems to generate increasing power, allowing them to start powering additional appliances, rather than just the lighting, which might include radios, refrigerators and even televisions.
Services: The main service that is required by the solar PV companies is market intelligence about the potential market in each country. This allows them to plan their supply chains and distribution centres as well as their marketing strategies. In addition, quality control regulations are required to ensure all solar PV products are tested and meet the same quality control standards.
Finance: Finance is needed for the solar PV companies to be able to produce enough stock to distribute within a country as well as invest in their distribution, retail outlets
and marketing to create enough demand. As outlined in model 1 and 2, finance is also needed for the end users, because the entire solar PV systems need to be purchased by the end users, who are often poor and have limited savings. Microfinance, community savings schemes and rolling funds can all help end users to pay for the products over a long period. Cost recovery often occurs fairly quickly through the savings end consumers make due to not having to purchase candles and kerosene they would normally use for lighting.
Level 3Enabling Environment
The main enabling environment factors include the costs of importing the solar PV units, including the import duties, taxation and permits that need to be obtained in any country. Other factors include government regulations regarding renewable energy, and in particular rural electrification, as well as including technical standards for the quality of the solar PV home system.
Barriers and Supporting Interventions
A number of barriers and supporting interventions have been identified for solar PV home systems, presented in Figure 11 and Table 4.

64

65
Rural electrification policy (including kerosene subsidy level)
Household cash flow
Consumer awareness and product trust levels
Quality control regulation testing and adherence
Product quality assurance standards
(and market spoilage)
Import duty and taxes
E3
E2
E1
Contract manufacturer (e.g. China, India)
Information Training and educational institutions End of life disposal
Transport services
Product retailers Service and parts shops
International financial service providers National financial service providers End user microfinance
S2
National SHS distribution and retail companyInternational
SHS manufacturing company
Manufacture Distribution Retail
Households
Enterprises
Public sector
Consumption
NATIONALINTERNATIONAL
M3
M2M1
S3
S1
Figure 11 Solar PV home system (SHS) market map
LEV
EL 2
INPU
TS, S
ERV
ICES
A
ND
FIN
AN
CE
LEV
EL 1
MA
RKET
CH
AIN
LEV
EL 3
E NA
BLI
NG
EN
VIR
ON
MEN
T

66
Table 4 Solar PV home system (SHS) supporting interventions
Level Market System Level Issue Responsible Actor Potential Support Intervention Category
Level 3 – Enabling Environment
E1Lack of Clear Rural Electricity Policy
for Off-Grid Supply
Rural electrification policies in
relation to off-grid energy products
are not clearly specified and lack clear
strategies and objectives. In addition,
clear policies in relation to kerosene
subsidies need to be developed to
ensure that solar PV home systems
can compete against kerosene for
off-grid lighting and batteries.
Ministry of Energy Technical assistance to relevant
policy makers to reform rural
electrification policies in particular
for solar PV home systems. Such
policies will include targets and
strategies for rural electrification
products, in particular ensuring
subsidies for fossil fuels (e.g.
kerosene), do not damage the
development of the solar PV market.
Technical assistance to
civil society and private sector
solar PV companies to carry
out advocacy initiatives to help
eliminate kerosene subsidies.
TAP
TAAd
E2Lack of Quality Standard for Solar PV
Products
Quality standards have not been
developed for solar PV home systems
to control quality and performance of
the systems.
Ministry of Energy Technical assistance to develop
quality standards for solar PV
home systems, including all major
components, (solar panels, batteries,
power regulation and lamps).
Standards will ensure high quality
of systems is maintained to ensure
end-user demand is met without
damaging the overall market.
TAP
TAT

67
E3Low Consumer Awareness Levels of
Solar PV Systems
The levels of awareness of the
potential benefits of solar PV home
systems is still low in some countries
and region, particular rural areas, and
so demand for the products is still
relatively low.
Ministry of Energy
Ministry of Local
Government
Technical and financial assistance
to raise awareness of the potential
benefits of solar PV homes systems,
particularly in rural areas. Assistance
will include a range of activities
from promotional campaigns,
including radios adverts, as well
as demonstrations and extension
officer support.
TAAr
TAP
FAG
Level 1 – Market Chain
M1Low Quality of Equipment
The solar home system equipment
is of a low quality and often leads to
breakdown of the production systems.
Private sector
companies
Technical assistance to solar home
system companies to ensure that
high quality equipment and parts
are used for the production of the
solar PV systems to ensure they
perform at a very high level to meet
the needs and expectations of the
end users.
TAT
M2Lack of Effective Business Models For
Distribution and Retail of Solar PV
Home Systems
Energy companies within each energy
value chain are not able to develop
effective business models for selling
and distributing their home systems.
Private sector
companies
Technical assistance to solar home
system companies to help them
develop sustainable business
models to produce and deliver
their products. This assistance will
support the development of the
products themselves, as well as
their distribution and retail models,
including marketing.
TAB
TAT

68
M3Low Demand for Solar PV
Home Systems
The public facilities that use
the energy services are unable
to afford it on a regular basis.
Public Facility End
Users (Ministry
of Education
and Health in
particular)
Technical assistance to raise awareness
to overcome the low levels of demand
of the end users for the solar PV
home systems. Technical assistance
to understand the reasons for the low
levels of demand and to plan strategies
to increase demand for the products.
TAAW
TAT
Level 2 – Inputs, Services and Finance
S1Lack of Quality Service and Parts
for Solar PV Home Systems
Electronics
companies
Technical assistance to increase
awareness and capacity of electronics
companies to stock relevant spare parts
and appliances to sell to solar PV users
TAT
S2Lack of Quality Control
Enforcement for Solar PV Home
Systems
National Bureau
of Standards in
coordination with
testing facility
and evaluation
organisation.
Technical assistance to ensure all solar
PV home systems being sold within
a country are regularly tested and
regulated to ensure they meet the
particular levels of quality as outlined
in the developed quality standard.
TAT
S3
Lack of Access to Appropriate
Microfinance Loans for end-users
Microfinance institutions need
to develop specific loan packages
to allow end-users to overcome
the relatively high upfront costs
of solar PV home systems.
Microfinance
companies and
SACCOs
Technical and financial assistance
to micro-finance and local savings
organisations, such as SACCOs, to help
them develop and then market specific
savings products for solar PV home
systems so end users can take out loans
to be able to take up the solar PV home
systems being offered.
TAT
FAL
FAC

69

70
Chapter 6 Energy Market System 4: Biomass Improved Cookstoves

71
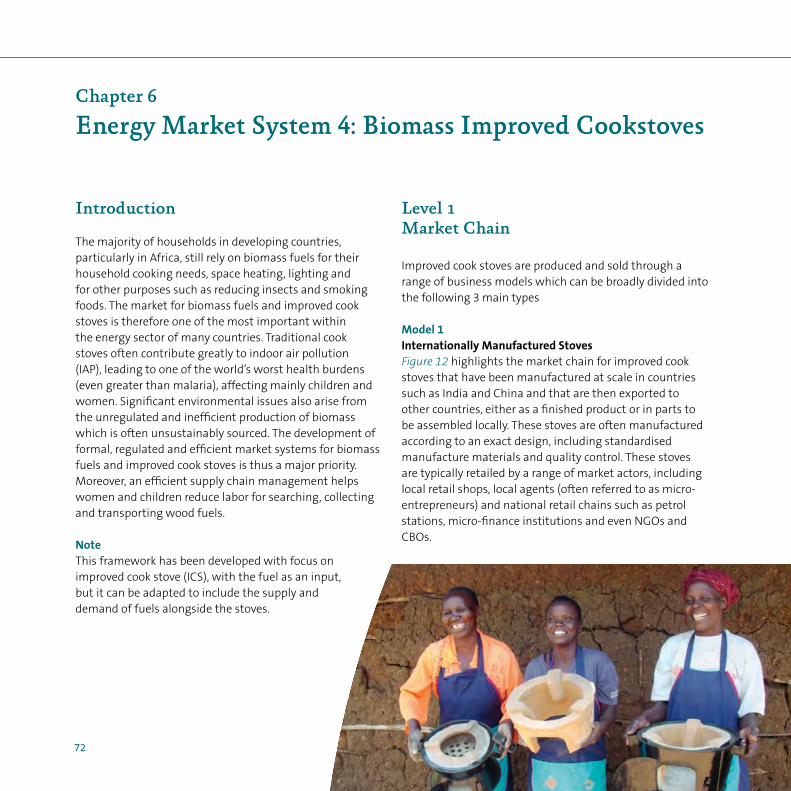
72
Introduction
The majority of households in developing countries, particularly in Africa, still rely on biomass fuels for their household cooking needs, space heating, lighting and for other purposes such as reducing insects and smoking foods. The market for biomass fuels and improved cook stoves is therefore one of the most important within the energy sector of many countries. Traditional cook stoves often contribute greatly to indoor air pollution (IAP), leading to one of the world’s worst health burdens (even greater than malaria), affecting mainly children and women. Significant environmental issues also arise from the unregulated and inefficient production of biomass which is often unsustainably sourced. The development of formal, regulated and efficient market systems for biomass fuels and improved cook stoves is thus a major priority. Moreover, an efficient supply chain management helps women and children reduce labor for searching, collecting and transporting wood fuels.
NoteThis framework has been developed with focus on improved cook stove (ICS), with the fuel as an input, but it can be adapted to include the supply and demand of fuels alongside the stoves.
Level 1Market Chain
Improved cook stoves are produced and sold through a range of business models which can be broadly divided into the following 3 main types
Model 1Internationally Manufactured StovesFigure 12 highlights the market chain for improved cook stoves that have been manufactured at scale in countries such as India and China and that are then exported to other countries, either as a finished product or in parts to be assembled locally. These stoves are often manufactured according to an exact design, including standardised manufacture materials and quality control. These stoves are typically retailed by a range of market actors, including local retail shops, local agents (often referred to as micro-entrepreneurs) and national retail chains such as petrol stations, micro-finance institutions and even NGOs and CBOs.
Chapter 6
Energy Market System 4: Biomass Improved Cookstoves

73
Model 2Locally and Centrally Manufactured StovesFigure 13 highlights the market chain for improved cook stoves that are manufactured within a particular country but in a central location and then distributed throughout the country and region. They are designed to meet the specific cooking requirements of the local households
of the country and to an established level of quality. It is important to note that some companies are gradually starting to move from Model 1 to Model 2 and establishing more localised manufacturing facilities or at least localised assembly units (e.g. Burn Manufacturing and Envirofit in Kenya).
Figure 12 Illustrative market chain for internationally manufactured stove model
Figure 13 Illustrative market chain for locally and centrally manufactured stove model
Stove manufacturer
Manufacture Retail
Local retailers
National retailers
CBOs/NGOs
Consumption
NATIONALINTERNATIONAL
Households
Enterprises
Public sector
Importation and local stove
assembly
Distribution
Manufacture Distribution Retail
Households
Enterprises
Public sector
Consumption
Local retailers
CBOs/NGOs
Stove manufacturers

74
Model 3Locally and Decentralised Produced StovesFigure 14 highlights the market chain for improved stoves that are produced within a particular country, but in several decentralised locations, often in smaller manufacturing sites, by local artisans. The stoves are mostly manufactured according to designs adapted to the local cooking habits and the needs of the local end users. However, inadequate quality control may lead to bad performance in terms of emissions and efficiency. Support is required for the manufacturers on technical issues of design and quality control.
Each of these models requires slightly different types of support in order to meet the needs of the end users.
Level 2Inputs, Services and Finance
Inputs: The most important input is the biomass fuel, although often the fuel source is the same as for the traditional stoves that are being replaced (the biomass fuels are just being burned more efficiently with lower emissions). However, increasingly ICS market actors are starting to focus on a more efficient and sustainable production of the biomass fuels as well as the stoves. In addition, the required labour and materials need to be available and at the right price in order to manufacture the stoves.
Figure 14 Illustrative market chain for locally and decentrally manufactured stove model
Stove manufacture
Manufacture Retail
Local retailers
CBOs/NGOs
Consumption
Households
Enterprises
Public sector
Stove distributers
Distribution

75
Services: A range of services are required to ensure that quality of the stoves production and use. This includes testing facilities, as well as know-how for marketing and customer education. Another important service that is required is on-going research and development (R&D) to ensure the ICS market actors are able to keep pace with the changing needs and aspirations of end users. Successful R&D models often include the market chain actors working closely with research institutions, testing facilities and NGOs. The after-sales service of the ICS is also critical to ensure that the stoves are maintained and replaced when required and used effectively. This is often provided by the sales agents or ICS manufacturers themselves, but can also be done by independent service entrepreneurs.
Finance: Of critical importance for the take-up of a range of biomass ICS is the provision of finance for the stove companies themselves in order to invest in and expand their businesses. Different financing is needed for end-consumers in order to pay for the stoves.

76
Level 3Enabling Environment
Household cooking is a fundamental, but often overlooked, part of a nation’s energy utilisation and needs to have a prominent position within a country’s national energy policy. Biomass ICS and fuels are often not included in national energy policies, or not nearly prominently enough, considering the scale of their use. Policies and regulations need to be updated to include biomass ICS and fuels more prominently, including their manufacture, distribution and marketing. It is important that the household cooking component of national decentralised energy policies includes all aspects of the biomass supply chains and ICS design. It needs to include the development of quality standards and regulations on the technical aspects of stove production7, as well as awareness-raising and coordination between several government departments.
Households, particularly those in rural areas, are accustomed to using traditional stoves that are made either at no cost, or very low cost, and are often not aware of the direct negative effects of inefficient stoves,
particularly to their health. To overcome this low level of end user demand, a persistent and concerted effort by a range of government authorities such as Ministries of Energy, Health, Education and Local Government is required to increase the awareness of all end user groups. To ensure the household cooking sector is sufficiently supported, the national energy policy needs to include appropriate providions for household cooking fuels and stoves. In addition, the extent to which ICS are subsidised, including subsidies from carbon finance, also needs to be considered very strategically to ensure that long-term market distortion does not take place or is minimised. GACC recommends that the free give-away of ICS should be avoided, except in particular circumstances such as targeting marginalised and vulnerable communities or individuals.
Barriers and Supporting Interventions
A number of barriers and supporting interventions have been identified for improved biomass cooking stoves and fuels as shown in Figure 15 and Table 5:
7) Such International and national quality control standards are currently being developed through a collaboration between ANSI and GACC members.
http://www.cleancookstoves.org/our-work/standards-and-testing/guidelines-and-standards/
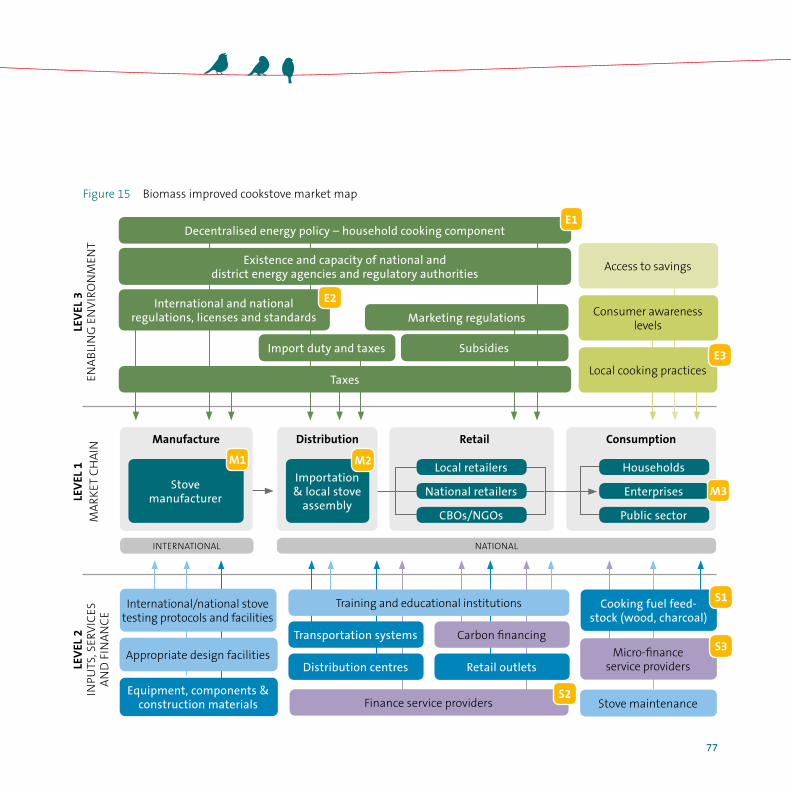
77
Figure 15 Biomass improved cookstove market map
Taxes
Import duty and taxes Subsidies
Marketing regulations Consumer awareness levels
Access to savings
Local cooking practices
Transportation systems
Distribution centres
Carbon financing
Retail outlets
Finance service providers
Training and educational institutions Cooking fuel feed- stock (wood, charcoal)
Micro-finance service providers
Stove maintenance
International and national regulations, licenses and standards
Existence and capacity of national and district energy agencies and regulatory authorities
Decentralised energy policy – household cooking componentE1
E2
E3
S1
S3Appropriate design facilities
Equipment, components & construction materials
International/national stove testing protocols and facilities
S2
Stove manufacturer
Manufacture Retail
Local retailers
CBOs/NGOs
Consumption
NATIONALINTERNATIONAL
Households
Enterprises
Public sector
Importation & local stove
assembly
Distribution
National retailers M3
M2M1
LEV
EL 2
INPU
TS, S
ERV
ICES
A
ND
FIN
AN
CE
LEV
EL 1
MA
RKET
CH
AIN
LEV
EL 3
E NA
BLI
NG
EN
VIR
ON
MEN
T

78
Table 5 Biomass improved cookstove supporting interventions
Level Market System Level Issue Responsible Actor Potential Support Intervention Category
Level 3 – Enabling Environment
E1Lack of Clear Household
Cooking Component of
National Decentralised
Energy Policy
Ministry of
Energy; Ministry
of Environment;
Ministry of Health;
Multi-Ministerial
Taskforce
Technical assistance of relevant policy makers to
develop specific decentralised energy component
of national energy policy, with particular
relevance to household cooking and space
heating, and the establishment of sustainable
markets for efficient production of biomass
supply chains and improved cook stoves.
TAP
E2Lack of International and
National Biomass Cooking
Regulations and Standards
Ministry of Energy;
National Bureau of
Standards
Technical assistance to develop international
and national regulations and standards for
household biomass cooking technologies, both
for the cooking stoves as well as the biomass
production technologies. Assistance includes a
range of technologies from jiko’s, rocket stoves
and gasifier stoves, and a range of sizes and
construction materials.
TAP
TAT
E3Local Cooking Practices
Interfering with Adoption
of Efficient and Healthy
Cook Stoves
Current household cooking
practices in some countries
are interfering with the
adoption of more efficient
and improved cook stove
technologies.
Ministry of Energy;
Ministry of Local
Government
(or equivalent
e.g. decentralised
national govern-
ment)
Technical and financial assistance to raise
awareness of the benefits of improved cook
stove technologies for households and small
businesses, including fuel savings, environmental
and health perspectives, and overcoming
resistance to changing cooking practices. This
is particularly needed for technologies such as
rocket stoves and gasifier stoves where biomass
needs to be processed, and the stove dimensions
are different to traditional stoves.
TAAr
FAG

79
Level 1 – Market Chain
M1Low Quality of Equipment
The equipment for the
energy production is of
a low quality and often
leads to breakdown of the
production systems.
Stove producers Technical assistance of stove companies
to develop technical and business skills to
produce new higher quality stove technologies
that meet users’ needs as well as higher
performance tiers on safety, emission and
efficiency.
TAT
M2Lack of Effective Business
Models For Distribution
and Retail
Energy companies within
each energy value chain are
not able to develop effective
business models for selling
and distributing their
products.
Research
or training
institutions
Technical assistance to stove companies to
develop business models to more sustainably
produce, distribute and retail household
cooking technologies, including stock taking,
equipment investment and supply chains.
Technical assistance to stove manufacturers to
develop the right business development and
marketing mix to target ICS retailers as well as
end users.
TAB
M3Low Demand for Improved
Household Cooking
Technologies
The public facilities that
use the energy services
are unable to afford it on
a regular basis.
End Users of stove
technologies
Technical and financial assistance to raise
awareness to increase demand for household
cooking technologies through a range of
approaches to overcome the barriers to their
uptake, including creating desirability of
stoves and pushing benefits including health
and cleanliness.
TAAw
FAG

80
Level 2 – Inputs and Services
S1
Lack of Sustainable and
Efficient Production of
Biomass Supplies
Training needs to be supplied
to energy companies to
enable them to develop
better business models for
more effectively delivering
biomass feedstocks.
Local
entrepreneurs
and farmers
Technical and financial assistance to local biomass
producers (both wood and charcoal) to allow them to
produce the biomass sustainably, process it efficiently
and transport it within a formal network throughout
a country or region.
TAT
TAB
FAG
S2Low Access to Financial
Services for Stove Producers
Energy companies are not
able to access adequate
financial services for
supporting their businesses.
Banks and MFIs Technical assistance to financial service companies
to develop financial products for stove production,
distribution and retail companies to increase the
quality of their production, their stock, as well as their
distribution, marketing and retail approaches. Financial
assistance to allow the financial service companies to
market these financial products to the stove companies.
TAT
FAL
FAE
FAG
S3Lack of Access to Households
Microfinance Services
Microfinance institutions
need to develop specific
financial packages to allow
end-users to overcome the
relatively high upfront costs
of energy appliances
(e.g. improved cook stoves)
or conversion equipment.
Banks, MFIs,
SACCOs
Technical assistance to micro-finance and community
banking companies, ICS manufacturers, mobile
bank services and large businesses to develop
suitable finance packages to households and small
businesses wanting to purchase improved stove
technologies. Technical assistance to develop close
working relationships between the ICS manufacturers,
distributers and retailers and financial service
companies. Financial assistance to allow the financial
service companies to market these financial products
to end users.
TAT
FAL
FAG

81

82
Chapter 7 Energy Market System Model 5: LPG Fuel and Stoves
83

84
Introduction
The last model addresses Liquified Petroleum Gas (LPG) cooking fuel and stoves. During combustion, it releases significantly lower levels of emissions (particularly carbon monoxide and particulate matter than traditional biomass fuels and is potentially significantly healthier 8. Although this market model focuses on LPG which has been identified as one of the fuels and stove types that has the greatest potential to provide clean household cooking fuels around the world in the near future, other clean, non-biomass fuels and stoves exist, including biogas, ethanol and other types of biofuels. These fuels and stoves could also be mapped and assessed in the same way as LPG from the sustainability point of view, although with the requisite differences in their models.
Level 1Market Chain
Generally the LPG stove market is very similar to Model 1: Imported Stoves, for the biomass stoves model, with the stoves being produced internationally and then imported. The main difference is that LPG is generally also obtained and processed internationally and then imported into the country in bulk and then packaged centrally before being distributed in pressurised canisters. Due to this centralised
production, the quality can be controlled much more effectively. The fuel and stoves are often supplied by the same companies, with some LPG cylinders coming with an in-built gas burner.
Level 2Inputs, Services and Finance
Inputs: The main inputs for LPG are the on-going supply of gas within pressurised canisters. As the canisters are generally quite large, the requirement to purchase large quantities of fuel up-front can be a significant barrier to their scale up, although this can be overcome by producing smaller tank sizes.
Services: The main service for LPG is the maintenance of the stoves. However, since stoves are produced to a high level of quality, maintenance not significant.
Finance: The provision of financial services is of great importance for the LPG fuel and stove producers as well as their distributers and retailers. It is also required by the end users as the upfront costs of acquiring the LPG stove and canister is relatively expensive for many rural households with low income levels and savings.
8) This results in a step up on the energy access tier system recently developed by GACC and then adapted by World Bank ESMAP within their Global Tracking
Framework: http://www.worldbank.org/en/topic/energy/publication/Global-Tracking-Framework-Report
Chapter 7
Energy Market System Model 5: LPG Fuel and Stoves

85
Level 3Enabling Environment
Including supportive policies, regulations and taxation within national energy policies is essential to enable the uptake of LPG fuel and stoves. Furthermore, importation duties for LPG as well as any level of technology subsidisation play a very important role. In addition, continuous supply of the LPG fuel must be competitive with other household cooking fuels, in particular biomass. Quality control standards are also very important for LPG to ensure that the fuel and stove systems, including canisters, are safe, durable and meet the needs of end users.
Barriers and Supporting Interventions
A number of barriers and supporting interventions have been identified for LPG fuel and stoves. These are summarised in the following and.

86
Figure 16 LPG fuel and stoves market map
Importation duty
Subsidies
Affordability of stoves and fuels
Consumer awareness
Training and educational institutions
Technical service providers
Micro-finance service providers
LPG Stove maintenance
Regulations, licenses and standards
Decentralised energy policy – household cooking componentE1
E2
S3
Construction materials
Components, equipment and parts
Financial service providers
S1
LPG stove Manufacturers
LPG fuel producers
Manufacture Retail
LPG Stove marketing
LPG Fuel marketing
Consumption
NATIONALINTERNATIONAL
Households
Enterprises
Public sector
Distribution
LPG Stove distribution
LPG Fuel packaging
Financial service providersS2
M1 M2 M3
LEV
EL 2
INPU
TS, S
ERV
ICES
A
ND
FIN
AN
CE
LEV
EL 1
MA
RKET
CH
AIN
LEV
EL 3
E NA
BLI
NG
E N
VIR
ON
MEN
T
Marketing regulationsE3

87
Table 6 LPG fuel and stoves supporting interventions
Level Market System Level Issue Responsible Actor Potential Support Intervention Category
Level 3 – Enabling Environment Issue
E1Lack of Clear Household
Cooking Component of
National Decentralised
Energy Policy
Ministry of Energy Technical assistance to relevant policy makers to
develop specific decentralised energy component
of national energy policy, with particular relevance
to LPG cooking fuel and stoves. Financial assistance,
such as subsidies and removal of tariffs, can
support the uptake of LPG fuels and stoves.
TAP
FAG
E2Lack of Supportive
Importation Duty Policy
Importation duty is not
supportive of LPG fuels
and stoves.
Ministry of Finance
Ministry of Energy
Technical assistance to multiple government
departments to develop supportive importation
duty policy and advocacy for LPG cooking fuel
which is expensive to import and priced beyond
the reach of the poor. Financial assistance to
ensure importation duty is supportive of fuels and
technologies which are clean burning and meet
the needs of the poor.
TAP
FAG
TAAd
E3Lack of Clear Marketing
Regulations
Marketing regulations for
the marketing of LPG fuel
are not clearly developed
and so appropriate
marketing strategies cannot
be developed and invested
in by the fuel and stove
companies.
Ministry of Energy Technical assistance to develop specific regulations
on effective marketing of LPG fuels to the poor,
including appropriate tools and government
department outreach support particularly in rural
areas.
TAP
TAT

88
Level 1 – Market Chain Issue
M1Low Quality of LPG Cooking
Stoves
The cooking stove
technologies are not of
sufficiently high quality often
leading to breakdown of the
cooking systems.
LPG cooking stove
companies
Technical and financial assistance to LPG
cooking fuel companies to produce and/or
stock higher quality stoves that are durable
and efficient.
TAT
FAG
M2Lack of Effective Business
Models For Distribution and
Retail of LPG Fuel and Stoves
Energy companies within
each energy value chain are
not able to develop effective
business models for selling
and distributing LPG products.
Research
or training
institutions
Technical assistance to LPG fuel and stove
companies to develop sustainable business
models, particularly concerning distribution
and retail of the stoves and fuels as well as
supply chains, stocking, distribution networks
and marketing to end users.
TAB
M3Low Demand for LPG Fuel
from Local Businesses
Local businesses are not
interested in investing in LPG
stoves and fuels.
End users of LPG
fuel and stoves
Technical assistance to raise awareness to
increase demand for LPG fuel and stoves,
particularly for small businesses, such as
through the demonstration of the health and
time benefits of using LPG.
TAAW

89
Level 2 – Inputs, Services and Finance
S1Lack of Capacity of Technical
Service Providers
Technical service providers
are not able to provide
specific support to the LPG
fuel and stove producers and
distributers.
Technical Service
Providers
Technical assistance to technical service
providers in order to provide a higher quality
level of support to LPG fuel and stove
producers and sellers. Technical assistance to
allow fuel and stove producers and sellers to
develop more effective distribution, sales and
marketing strategies.
TAT
TAB
S2Lack of Access to Finance
LPG fuel and stove companies
are not able to access
adequate financial services to
support their businesses.
Financial services,
including banks
Technical assistance to financial service
companies to develop financial products
for LPG fuel and stove companies. Financial
assistance to provide financial services
(loans and equity) which can be marketed to
LPG fuel and stove companies.
FAL
FAE
FAG
S3Lack of Access to Appropriate
Microfinance Loans for
Households
Microfinance institutions
need to develop specific loan
packages to allow households
to overcome the relatively
high upfront costs of gas
cooking stoves and large LPG
canisters.
Microfinance and
SACCOs
Technical assistance to microfinance and
community savings organisations to help
them develop specific financial packages
for LPG stoves and canisters which are often
beyond the reach of the poor. Financial
assistance to allow the financial service
companies to market these financial products
to end users.
TAT
FAL
FAG

90
Chapter 8 Energy Market System Case Studies

91

92
These case studies have been developed in order to test the viability of the energy market system assessment framework developed by PAC and EUEI PDF. The business models underlying each case study have been analysed through the use of the newly developed methodology to identify the context-specific market barriers and potential supporting interventions that distinguish each market system. The analysis of the 10 case studies enhances the assessment by including real-life context and details of well-known energy market systems in a number of countries in Southern, East and West Africa, based on limited interviews with relevant stakeholders.
However, it must be noted that the analysis is not intended as an evaluation of the level of success of the featured initiatives, nor to describe their market systems in perfect detail. Instead, the case study analysis tests the usefulness of the framework methodology and categorisations as well as adding critical real-life experience to illustrate how it can be used by development practitioners.
Chapter 8
Energy Market System Case Studies

93
Electricity Mini-Grids f 1 FUNAE solar PV community mini-grids Mozambique, SA f 2 Inensus hybrid mini-grids Senegal, WA
Solar PV Lanterns and Home Systems f 3 Solar Aid pico-solar community distribution model Malawi, SA f 4 FRES solar home system (SHS) fee-for-service model Mali, WA f 5 M-Kopa solar PV mini-grid mobile payment model Kenya, EA
Biomass Cooking Stoves and Fuels f 6 Restio imported cook stoves South Africa, SA f 7 Toyola centralised locally produced cook stoves Ghana, WA f 8 Ugastove centralised locally produced cook stoves Uganda, EA f 9 Local manufacturers decentralised produced cook stoves Rwanda, EA
LPG Fuel and Stove f 10 Government and Private Sector LPG stove and fuel Senegal, WA

94
Case Study 1FUNAE Solar PV Community Mini-Grids, Mozambique
Introduction
National Energy Fund of Mozambique (FUNAE: Fundo Nacional de Energia) is a public institution, part-funded by, but formally autonomous from, the Ministry of Energy. FUNAE is responsible for the promotion of sustainable rural electrification and access to modern energy services for rural populations, with its projects partly or wholly subsidised by aid or development banks. In 2013-2014, FUNAE oversaw the implementation of 3 village-scale solar PV mini-grids (350 kWe, 400 kWe and 550 kWe), with a further fifty 400 kWe mini-grids in the process of installation. The mini-grids typically supply a community institution (school, medical centre, administrative post) or a productive use service (e.g. water pumping) to the community or local businesses. They also incorporate household connections to benefit from electric lighting and powering small appliances.
Level 1 Market Chain
Project Developer: The mini-grid projects are normally designed and implemented by a contractor, often an international private company, who supplies and installs the generation and distribution systems and trains the local team of operators. The contractor will normally provide technical assistance and periodic maintenance for the first 12 months of operation (warranty period), after which responsibility is handed over to the community Management Commission (MC) which consists of a member of the local public administration, a community leader and a local business representative. The mini-grids transmit 240 V of A/C power. Lighting is normally provided through energy-efficient CFL bulbs. Installed plug sockets allow the use of electrical appliances, although some early installations used sockets which were not compatible with Mozambican standard plugs9, with some users unable to use the power. More recent mini-grids were of better quality and more appropriate design.
Energy Generation and Distribution: Once the installation contractor has installed the system, trained local technicians provide maintenance and support for an initial period of operation. Operational control is then handed over to the MC who manages the system on an on-going basis and forms the interface between the consumers and
9) Solar Photovoltaic Systems for Social Infrastructure and Village Electrification in Mozambique: Study of Existing Systems in two Provinces –
Final Report, GIZ, November 2010
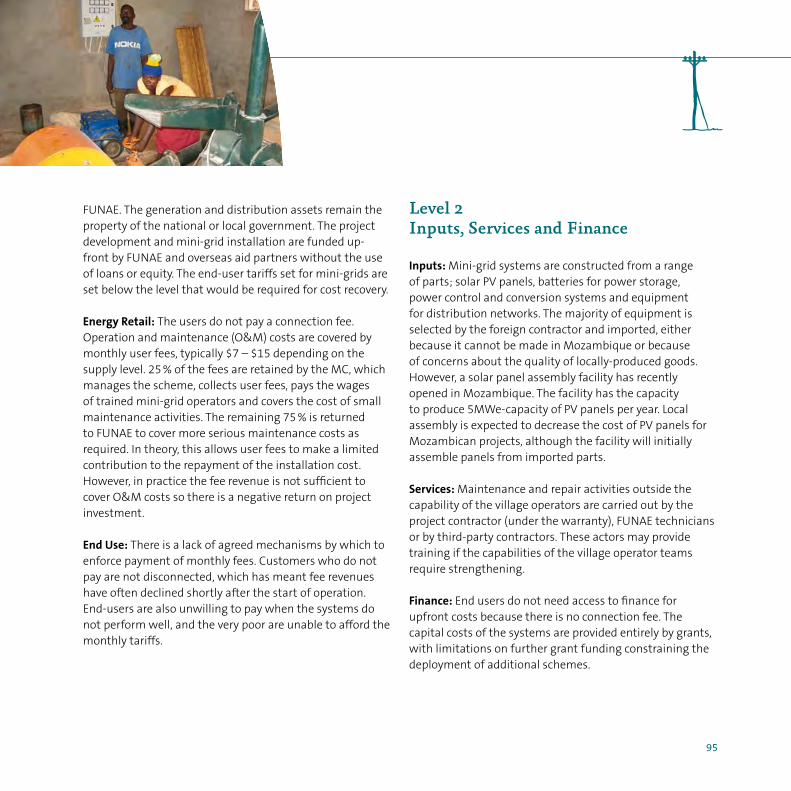
95
FUNAE. The generation and distribution assets remain the property of the national or local government. The project development and mini-grid installation are funded up-front by FUNAE and overseas aid partners without the use of loans or equity. The end-user tariffs set for mini-grids are set below the level that would be required for cost recovery.
Energy Retail: The users do not pay a connection fee. Operation and maintenance (O&M) costs are covered by monthly user fees, typically $7 – $15 depending on the supply level. 25 % of the fees are retained by the MC, which manages the scheme, collects user fees, pays the wages of trained mini-grid operators and covers the cost of small maintenance activities. The remaining 75 % is returned to FUNAE to cover more serious maintenance costs as required. In theory, this allows user fees to make a limited contribution to the repayment of the installation cost. However, in practice the fee revenue is not sufficient to cover O&M costs so there is a negative return on project investment.
End Use: There is a lack of agreed mechanisms by which to enforce payment of monthly fees. Customers who do not pay are not disconnected, which has meant fee revenues have often declined shortly after the start of operation. End-users are also unwilling to pay when the systems do not perform well, and the very poor are unable to afford the monthly tariffs.
Level 2 Inputs, Services and Finance
Inputs: Mini-grid systems are constructed from a range of parts; solar PV panels, batteries for power storage, power control and conversion systems and equipment for distribution networks. The majority of equipment is selected by the foreign contractor and imported, either because it cannot be made in Mozambique or because of concerns about the quality of locally-produced goods. However, a solar panel assembly facility has recently opened in Mozambique. The facility has the capacity to produce 5MWe-capacity of PV panels per year. Local assembly is expected to decrease the cost of PV panels for Mozambican projects, although the facility will initially assemble panels from imported parts.
Services: Maintenance and repair activities outside the capability of the village operators are carried out by the project contractor (under the warranty), FUNAE technicians or by third-party contractors. These actors may provide training if the capabilities of the village operator teams require strengthening.
Finance: End users do not need access to finance for upfront costs because there is no connection fee. The capital costs of the systems are provided entirely by grants, with limitations on further grant funding constraining the deployment of additional schemes.

96
Level 3 Enabling Environment
Political Factors: The existence and remit of FUNAE highlights the Mozambican government’s support for decentralised rural electrification. However, mini-grid development is sometimes compromised by other government policies such as taxation – imported mini-grid equipment is subject to VAT (17 %) and import duty (7.5 %). The installed mini-grids show good adherence to Mozambican electrical standards. Government regulations dictate that per-unit (per kWh) cost of electricity must be uniform across the country, meaning mini-grids should charge the same rate as central grid systems. However, as this would lead to too low revenues from mini-grids, it is bypassed by charging flat-rate monthly fees regardless of actual consumption10.
Cultural Factors: Access to electricity is generally welcomed, in particular street lighting. However, genuine consumer demand is distorted by the lack of connection fee and the non-payment of the high monthly fees.
Economic Factors: Many existing/potential customers cannot afford monthly fees, resulting in disconnections.
Identified Market System Barriers
The following are the main key obstacles identified within the FUNAE solar PV mini-grid systems, which are further highlighted in the market map in Figure 17. These include potentially required support interventions, relevant responsible actors and intervention categorisation:
f Lack of specific supportive regulations for mini-grids and renewable energies
f Inadequate training of mini-grid operators f Low rates of fee payment f Import taxes and VAT applied to mini-grid equipment f Consumer willingness and ability to pay when service
is performing poorly f Dependence on subsidies from international donors
and government (via FUNAE) for ongoing O&M
10) Identifying the gaps and building the evidence base on low carbon mini-grids – Final Report, IED, November 2013.

97

98
Figure 17 FUNAE Mini-Grid Market System Model
Replacement Parts & Equipment
Government RegulationE1
PV panels & other equipmentS2
Revenue Collection
Consumption
Households
Enterprises
Community Institutions/Uses
DistributionGeneration
Mini-grid Management Commissions (MCs)
S2
M1
Project developement
Project Financing: FUNAE and International Aid
S1 Operating Finance: FUNAE and International
Project Developer: FUNAE
Project Contractor e.g.
Willingness and Ability to PayE3Equipment Import
Duties/Taxes
E2
LEV
EL 2
INPU
TS, S
ERV
ICES
A
ND
FIN
AN
CE
L EV
EL 1
MA
R KET
CH
AI N
LEV
EL 3
E NA
BLI
NG
E N
VIR
ON
MEN
T

99
Table 7 Specific Market System Barriers and Interventions
Level Market System Level Issue Responsible Actor Potential Support Intervention Category
Level 3 – Enabling Environment Issue
E1Lack of Supportive Mini-Grid
Regulations
Government regulation is not
sufficiently supportive of mini-grid
development, leading to levels
of risk and cost that make the
business case challenging.
Ministry of Energy Technical assistance to develop
specific regulatory mechanisms
such as concession areas (to provide
certainty for investors). Financial
assistance to set cost-recovery tariffs.
TAP
TAAd
FAG
E2Mini-Grid Equipment Import
Duties/Taxes in Mozambique
About 40 % of mini-grid equipment
is subjected to import duties which
average 17 %. These taxes increase
the cost of mini-grid installations.
Ministry of Energy
and Finance
Technical and financial assistance
to provide relief on import duty
for mini-grid equipment. Technical
assistance to manufacture or
assemble equipment locally, such as
the new PV panel assembly factory.
TAP
FAG
E3Mozambican Community Users
Willingness and Ability to Pay
Mini-grid end users are unwilling
to pay their monthly fees when
system performs poorly (e.g.
long outages for maintenance).
'The poorest consumers are
unable to afford the monthly fees.
FUNAE, MCs
and electricity
consumers.
Technical assistance to ensure
high systems performance
through procurement, design and
maintenance. Technical and financial
assistance to subsidise the systems
and design tariff scheme which
provides affordable power to the
very poor.
TAB
FAG

100
Level 1 – Market Chain Issue
M1Lack of Adequately Trained Mini-
Grid Operators in Mozambique
Mini-grid operators should be
trained by installation contractors
in basic preventive and corrective
maintenance. However this
doesn’t always happen, resulting in
system without basic maintenance
arrangements.
FUNAE,
installation
contractors,
MCs
Technical assistance to FUNAE to
ensure compliance of mini-grid
contracts and to ensure mini-grid
operators receive the correct training
during the installation phase, and
supplementary training as required
(e.g. for new recruits).
TAB
Level 2 – Inputs, Services and Finance
S1Lack of Mozambique Mini-Grid
Installation and Operational
Financing
Mini-grid development and
ongoing operation is dependent
on international aid to support
FUNAE’s budget which is too low.
FUNAE,
international
donors
Financial assistance as grant and
complementary financing for
FUNAE’s mini-grid programme from
Mozambique Government and
international donors.
FAG
FAC
S2Poor Quality Equipment and Parts
for Mozambique Mini-Grids
Poor quality parts and equipment
(e.g. inverters, charge controllers)
of installed mini-grids, leading to
system failure and poor economics.
Equipment
Suppliers
Technical assistance to ensure parts
and equipment procurement strikes a
balance between cost and quality.
TAT

101
Case Study 2Inensus Hybrid Mini-Grids, Senegal
Introduction
Inensus is a private power producer that aims to supply electricity to decentralised communities through hybrid wind-solar and PV-diesel powered mini-grids within a Private-Public Partnership (PPP) agreement. The initiative in Senegal which commenced in 2010 as a pilot project using their innovative Micro Power Economy (MPE) model, has so far installed 15 small mini-grid systems with a further 50 in development.
Level 1 Market Chain
Project Developer: Inensus designs and installs hybrid mini-grid systems according to its Micro Power Economy (MPE) model to bring better economic growth through delivering improved energy access services. The model guarantees reliable energy planning and stabilised economic cycles by selling electricity in blocks instead of the classic kWh unit.
Energy Generation: Mini-grid systems use a solar PV, wind, diesel-hybrid system with smart metering to control consumption. A typical system includes 5.2kWp solar/ 5kW wind / 11kVA diesel and 120kWh battery array, including a 15kW inverter. A generator is only used when inadequate power has been stored in the batteries; usually below 40 % of the battery capacity due to unconducive weather when not enough power can be generated from the wind and solar systems. The plant and home systems are operated from the Load Management and Accounting Unit (LAU), which controls the usage according to the user’s subscription. The Inensus MPE business model is implemented as a Private Public Partnership (PPP) with 35 % being public equity for the immovable parts of the system including the pylons and buildings (which comes from donor grants), and 65 % private equity (provided by Inensus) for the movable components of the system including the generation components. After installation, the ownership of the fixed system components is transferred to the specifically formed village committee. The energy tariff is set by Inensus and the Village Committee in a partnership as well as the sharing of any profits. The model promotes increased consumption of energy with an innovative control and payment technology. This enables key productive uses and priority loads and increases the revenue for the mini-grid operator.

102
Energy Distribution and Retail: Electricity is distributed through a mini-grid which is controlled by the Inensus (LAU) and to which users are connected for free. The electricity is sold to the consumer by Inensus Agents who sell electricity blocks. A block of electricity represents a maximum load of 50 W and a total energy consumption of 1.4 KWh/ week. A household can purchase more than one block to increase the load limit and the total energy available to them per week. The order is fixed for 6 months, after which the contract between the community service company and Inensus is renewed and the end users can change their weekly order. The village committee oversees the publicly owned shares and has a president in place. It assists in the on-going operation and maintenance of the system and participates in the decision making process.
End Use: End users include households and community service facilities such as health centres and schools. The consumers pay in cash for electricity blocks at a rate of about $1.6 for a block of 50W and 1.4kWh. If a customer has made use of its allocated blocks before the week is ended, the LAU will automatically turn off the supply to that user. If customers need more energy than they planned for, they can buy extra electricity, which comes at a higher rate. Customers who do not use all their purchased electricity can sell their blocks to other users.
Level 2Inputs, Services and Finance
Inputs: Most technical equipment has to be imported from Europe.
Services: Since INENSUS has implemented practically the entire project with internal resourecs, no specific services are currently used by the market chain actors.
Finance: Inensus has encouraged microfinance institutions to invest in community members looking to buy equipment for productive use. The system costs are partly financed by donor organisations such as the Germany Ministry for Economic Cooperation and Development (BMZ). In addition, INENSUS has successfully involved private financiers.
Level 3Enabling Environment
Political Factors: Although the energy policy of the Government of Senegal has been very supportive of decentralised energy production, it has not developed the specific required regulations which has significantly affected the development of the systems. The required regulations thus had to be developed from scratch (in particular energy production licenses and concessions).

103
Cultural and Economic Factors: No specific factors were identified.
Identified Market System Barrier
The following market map in Figure 18 highlights the key obstacles identified within the Inensus electricity mini-grid model. Potential corresponding support interventions, relevant actors and intervention categorisations are shown in Table 8:
f Significant policy and regulations barriers (in particular effective licensing regulatory procedures and unclear taxation systems) restricting Inensus’s ability to design and install their systems in Senegal and then sell the produced energy to end users.
f Unstable leadership trends in regulation authority. f Lack of locally produced equipment for mini-grid
systems in Senegal. f Limited system energy volumes that can only be
altered every 6 months. f Lack of foreign exchange risk coverage.

104
Figure 18 Inensus hybrid mini-grids market map
Foreign exchange risk of mini-grid developers in SenegalS1
Inensus
Retail End Use
Public sector
Households
Enterprises
DistributionGeneration
Private public partnership (PPP) – Inensus and village committee
M2
M1
M2
Project developement
Foreign exchange risk of mini-grid developers in SenegalS2
LEV
EL 2
INPU
TS, S
ERV
ICES
A
ND
FIN
AN
CE
LEV
EL 1
MA
RKET
CH
AIN
LEV
EL 3
ENA
BLI
NG
EN
VIR
ON
MEN
T
Unclear taxation systems for mini-grids in Senegal E2
Lack of mini-grid regulations and licencing procedures in SenegalE1

105
Table 8 Inensus hybrid mini-grids supporting interventions
Level Market System Level Issue Responsible Actor Potential Support Intervention Category
Level 3 – Enabling Environment
E1Lack of Effective Mini-Grid
Regulations and Licensing
Procedures in Senegal
This gap significantly slowed
down their scaling up process
and increased their production
costs.
Senegalese Rural
Electrification
Agency (ASER)
Electricity
Regulatory
Commission
(CRSE)
Technical assistance to develop specific
mini-grids regulations and licenses in
Senegal to support mini-grid developers
and operators, as well as technical
training of relevant government
personnel to effectively regulate and
support mini-grid systems in Senegal.
Awareness-raising of the benefits
of mini-grid systems in Senegal to
prioritise relevant government support.
TAP
TAT
TAAD
E2Unclear Taxation System
for Energy Produced from
Mini-Grids in Senegal
This lack of clarity on taxation
on electricity produced
from mini-grids has made
accountability and planning
difficult and led to unforeseen
expenses.
Ministry of Energy
and Finance
Technical assistance to Ministry of
Energy and financial assistance to
develop specific taxation systems for
mini-grid electrification including
supportive financial systems to
incentivise their development by
developers and investors.
TAP
TAP
FAG

106
Level 1 – Market Chain
M1Limited Local Expertise for
Mini-Grid System Development in
Senegal
As the sector is quite new there
is currently very limited local
expertise in this area.
Private sector
energy development
companies in Senegal
Technical assistance to support
potential mini-grid developers in
Senegal in a range of technical
and project development areas to
further develop the sector.
TAP
TAT
M2Limited and Fixed Energy
Production from Mini-Grids in
Senegal
Due to the physical limitation of
the installed systems, any extra
energy required has significantly
higher costs.
Inensus Technical assistance to Inensus to
develop systems that can adapt
better to changing demands.
Financial assistance to provide
loans to enterprise users to pay for
additional electricity required.
TAT
FAG
FAL
Level 2 – Inputs, Services and Finance
S1Lack of Local Mini-Grid Equipment
in Senegal
Lack of locally available equipment
(e.g. wind turbines, batteries,
electronics) leads to increased price
of systems.
Local power producers Technical and financial assistance
to local manufacturing businesses
to supply high quality equipment
for mini-grid systems or to
improve importation procedures
and duties on mini-grid
electrification equipment.
TAT
FAG
S2Lack of Foreign Exchange Risk
Coverage for Inensus
Financing contractor
Inensus
Technical and financial assistance
to reduce exchange rate risks for
Inensus.
FAC
TAT

107
Case Study 3SolarAid Pico Solar, Malawi
Introduction to the SolarAid Pico Solar, Malawi
SolarAid and its subsidiary social enterprise ‘SunnyMoney’ distribute portable solar PV products (PSPs) to off-grid communities in Malawi, Kenya, Tanzania and Zambia. In Malawi the products are sold via schools or sales agents. SolarAid’s model is based on a regulated not for profit (registered charity) business which has demonstrated leading achievement of widespread distribution and up-take of pico-solar lighting products11.
Level 1 Market Chain
Project Developer: SolarAid / SunnyMoney distributes a number of pico-solar products from different manufacturers within Malawi. The PSPs are all lighting devices but some are also capable of mobile phone charging. The small portable solar lamps cost about $10 and are accredited by Lighting Africa.
Energy Manufacture: The PSPs are generally produced and assembled in China by contract manufacturers on behalf of solar product developers (brands) and according to designs suitable for local use in Africa.
Energy Distribution and Retail: PSPs are imported by SolarAid and distributed to the end-users via one of the two following routes: The first takes advantage of the high status and trust of head-teachers within the communities in which they work. Head-teachers are invited to promotion events, given demonstration products and then offered the opportunity to sell PSPs via their schools, incentivised by free solar products for the school as well as an understanding of the educational benefits of solar lighting for pupils studying at home.
The second is the use of sales agents who receive training in marketing the products. Such agents receive 6 products at a time and are paid on commission. ‘Super Agents’ receive 24 products at a time. SolarAid application of enterprise philanthropy is intended to represent a temporary market support intervention, while the market is in the process of becoming established. For example, school sales campaigns often make a net loss when the costs of promotion and administration are taken into account. However, these campaigns have a high impact on
11) SolarAid is the number one distributor of PSPs in Africa, with sales over 1 million products (Lighting Africa / SolarAid website)

108
consumer awareness across the community and play an important role in seeding a future market beyond the first school campaign.
End Use: No end use issues were encountered.
Level 2Inputs, Services and Finance
Inputs: The batteries in the PSPs last between 3 to 5 years so that users require replacement batteries or units periodically. If available, replacement parts and product warranties are managed by the sales agents. There is no system in place yet for disposal services at the end of the product life.
Services: Marketing to disperse rural consumers with little exposure to mass-media is a costly exercise, but is often achieved through peer to peer social marketing. This is complemented and reinforced by more conventional marketing channels (TV, radio, billboards etc.), with a focus on demonstration and endorsement. Training and support is provided to head-teachers and sales agents through training events and a dedicated call centre.
Finance: Currently, there are no intermediaries between SunnyMoney and the head-teachers who arrange the sales of PSPs on a ‘commission in kind’ basis, with SunnyMoney providing the working capital. As their model grows, there is an ever increasing need for business finance. SolarAid predicts that once the market is sufficiently established, local entrepreneurs start selling solar lighting products on their own and will also need their own business finance12. SunnyMoney is backed financially by SolarAid, but receives income through sales. Access to finance (savings or credit) is a major constraint for the poorest consumers who struggle to afford the upfront cost of the PSPs. SolarAid recognises the need for individual credit, and has trialled “rent-to-own” and entry level “pay as you go” models, but does not currently have any active microfinance programmes in place.
12) An on-going GOGLA study is currently investigating this investment requirement of market actors and is planned to be published later this year.
109
Level 3Enabling Environment
Political Factors: Value Added Tax (VAT) is generally levied at a rate of 16.5 % on PSPs. In Malawi, PSPs are not subject to import duties, although market participants report that in practice the mechanism for obtaining exemption remains unclear and bureaucratic. The main competing technology for solar lighting products used to be kerosene lamps, but due to the rising cost of kerosene nowadays it is mainly batteries and candles. Product quality standards are not clearly defined for PSPs in Malawi and enforcement is lacking, particularly at border posts. SunnyMoney’s products are all accredited by Lighting Africa, but competitor distributors do not always sell certified products, which could undermine trust in the benefits of PSPs. When quality checks are enforced, the company often needs to interact with a number of separate government authorities with ill-defined responsibilities and procedures, which is often time-consuming, expensive and a burden for importers like SolarAid. There is a general lack of consumer awareness about the existence of PSPs and their benefits, particularly in rural areas. Reports of bad experiences from fake or low-quality solar products and the inability of consumers to differentiate between good and bad have led to a lack of confidence even in good quality PSPs.
Cultural Factors: No specific cultural factors were encountered.
Economic Factors: Even SunnyMoney’s cheapest PSPs remain beyond the reach of many poor people in Malawi from a purely cost perspective. Malawi has broad macro-economic issues; an unstable currency, foreign exchange shortages and high cost of lending are major challenges for doing business in the country.
SolarAid Pico Solar Malawi Identified Market System Barriers
The following market map in Figure 19 highlights the key obstacles identified within the Malawian SolarAid PSP model. Potential corresponding support interventions, relevant actors and intervention categorisations are shown in Table 9:
f Lack of enforced quality standards resulting in low quality products distorting the market and seeding distrust
f High VAT levels for Solar PV systems f Lack of customer awareness of benefits of solar PV
products f Poverty levels of the target market make products
unaffordable f Requirement for replacement batteries f Lack of micro-finance for sales agents and end users

110
VAT
Kerosene Subsidies
End-user Micro-finance
Quality StandardsE1
E2 E3
E4
S2
Contract Manufacturers
(China)
Consumption
Households
Distribution / RetailManufakture
Replacement Batteries
S1
Customer Awareness
E6
SunnyMoney Agents
Headteachers
M1
Ability to PayE5
Solar Product Developers
Figure 19 SolarAid Pico Solar Malawi market map
LEV
EL 2
INPU
TS, S
ERV
ICES
A
ND
FIN
AN
CE
LEV
EL 1
MA
RKET
CH
AIN
LEV
EL 3
E NA
BLI
NG
E N
VIR
ON
MEN
T
Solar Aid / SunnyMoney

111
Table 9 SolarAid Pico Solar Malawi supporting interventions
Level Market System Level Issue Responsible Actor Potential Support Intervention Category
Level 3 – Enabling Environment Issue
E1Poorly Enforced Solar PV
Quality Standards in Malawi
Solar PV companies do
not sell certified products,
undermining user trust in
PSPs.
Ministry of Energy
Malawi Bureau of
Standards
Technical assistance to government
institutions to develop and ensure
adherence to solar PV quality standards
and to end users to differentiate between
products.
TAP
TAT
E2Compliance Burden of Poorly
Designed and Administered
Solar PV Quality Regulations
in Malawi
Ministry of Energy
Malawi Bureau of
Standards
Technical assistance to streamline and
rationalise quality standards procedures for
PSPs in Malawi so they are easy and cheap
to adhere to.
TAP
TAT
TAAd
E3VAT on PSPs in Malawi
16.5 % VAT is normally applied
to PSPs in Malawi
Ministry of Energy
and Finance
Technical assistance for advocacy for
exemption of all solar products from VAT
and other taxes.
TAP
TAAd
E4Subsidisation of Kerosene in
Malawi affecting uptake of
PSPs
Subsidised kerosene price
weakens economic case for
PSPs.
Ministry of Energy
and Finance
Technical and financial assistance to reduce
or remove kerosene subsidy for lighting to
support uptake of PSPs in Malawi.
TAP
FAG

112
13) It should be noted that this is currently being addressed by SolarAid.
E5Lack of Ability to Pay for
PSPs of Poorest Household
in Malawi
Ministry of Energy
and Finance,
Microfinance
Providers
Technical and financial assistance to the
poorest consumers e.g. targeted subsidies,
microfinance, or kerosene lamp trade-in
schemes.
FAG
FAL
TAB
E6Poor Consumer Awareness
of PSPs in Malawi
Ministry of Energy,
NGOs
Technical assistance to develop effective
awareness-raising campaigns.
TAAW
TAT
Level 1 – Market Chain Issue
M1Lack of Incentives for
Headteachers to Sell PSPs
in Malawi13
SolarAid Technical assistance to pay head-teachers
a commission per product sold or bonuses
for reaching targets.
TAB
Level 2 – Inputs, Services and Finance
S1Lack of Availability and
High Cost of Replacement
Batteries for PSPs in Malawi
SolarAid Local
Businesses
Technical assistance to develop product
life-cycle approach ensuring all PSPs access
replacement parts, including batteries,
through sales agents and affordable cost.
TAB
S2Lack of Micro-finance for
sales agents and end users
of PSPs in Malawi
SolarAid
Microfinance
organisations
Technical assistance to microfinance
organisations to develop specific financial
packages and to market them to PSPs
companies and users.
TAT
TAB
113
Case Study 4FRES Solar Home Systems and Hybrid Mini-grids, Mali
Introduction to FRES Solar Home Systems and Hybrid Mini-Grids
FRES (Foundation Rural Energy Services) is a foundation that fosters rural electrification in developing countries by setting up local companies that provide electricity – via solar home systems (SHS) and solar/hybrid mini-grids – through a fee for service business models in areas without a connection to the national electricity grid. They have 5 different companies based in Mali, Burkina Faso, Guinea-Bissau, Uganda and South Africa. The FRES-owned company in Mali, Yeelen Kura, is responsible for supplying power to communities through solar home systems and solar or hybrid (solar-hybrid) mini grids. The company which has its head office on Koutiala, has been active in the southern provinces of Mali since 2001 and had 5536 customers by the end of 2013.
Level 1Market Chain
Project Developer: Yeelen Kura is a power service provider for solar PV home systems (SHS) and hybrid mini-grid systems for households and small and medium businesses (SMEs) who pay for electricity subscriptions.
FRES completes an open tendering process with the most competitive bidder then having the responsibility to supply and ship the components to Yeelen Kura in Mali. FRES operates as a foundation with board members, overseeing multiple subsidiary companies which are responsible for implementing their business plan in each of the African countries covered. Funding is obtained from different sources to finance the capital investment needed to purchase the systems. The ultimate aim is to establish independent and financially sustainable companies that cover their operational costs and replacements.
Energy Generation: The SHS range from 80Wp to 320Wp and batteries from 90Ah to150Ah and are designed according to the client’s needs. In regional hubs where population is sufficiently dense, mini-grids are preferred. Although the capital investment is larger, the advantages significantly outweigh the added costs due to larger quantities of demanded electricity per customer, provisions for consumption growth, AC electricity supported appliances, centralised battery control and maintenance, cost efficient invoicing and cash flow. Yeelen Kura currently operates 9 hybrid mini-grids (50-150kWp) and has experienced significant growth in electricity demand. As in other countries, in Mali Yeelen owns the entire power infrastructure, employing 52 staff members who are responsible for system installation, maintenance, marketing, sales and monthly payment collection, as well as business management and accounting. Overall monitoring of the operations of each subsidiary company is carried out by FRES in the Netherlands. FRES Netherlands pays for the systems which Yeelen Kura installs and

114
maintains. Yeelen Kura collects monthly fees for the energy service supplied by the systems which covers the overhead costs of the business as well as the maintenance of the systems.
Energy Distribution: FRES’ model is based on designing, installing and then owning and operating the infrastructure (SHS and hybrid mini-grids). It then provides the electricity services through a monthly payment scheme. FRES believes that the cost of the systems is too high for many households and businesses in a number of African countries and considers that the supply of the energy service is more sustainable in the long run. Once the systems have been installed and the electricity is directly supplied to each household or business, FRES has a network of energy shops where its clients pay their monthly subscription fees and make any requests or enquiries.
End Use: When potential customers request a connection, they are assessed according to their needs and ability to pay. Then a suitable system – SHS or mini-grid depending on their needs – is designed and installed. FRES uses different payment mechanisms depending on the local context; in Mali the larger proportion of clients pays with cash. Customised payment schemes are developed according to the customer’s income such that farmers with only one harvest period are given a different scheme compared to those who have more than one. Such customised payment schemes do not affect the customer’s
price but give greater payment flexibility. On average and depending on the size, Yeelen Kura charges a monthly fee between 3,815 FCFA (€ 5.81) and 9,000 FCFA (€ 13.75) for SHSs and 250 FCFA per kWh (€ 0.38) for mini-grids.
Level 2Inputs, Services and Finance
Inputs: FRES obtains all system components from Europe (or sometimes Asia) due to lack of local availability and quality. The system components are predominantly imported from Europe and the procurement process is carried out by FRES in the Netherlands to achieve economies of scale and lower unit prices.
Services: Yeelen Kura carries out sensitisation campaigns with the local authorities in Mali and advertises its services in different media such as radio, television and newspapers. One of its most important marketing tools is recommendations from satisfied clients which brings them a substantial number of new clients. FRES also trains its employees and other interested participants onhow to install and maintain the systems.
Finance: Yeelen Kura does not offer a credit facility to its customers and credit is not supplied by other finance companies. However, its payment schedules are highly flexible and cater for different income groups. So far, no loans have been taken out by Yeelen Kura in Mali.

115
Level 3Enabling Environment
Policy Factors: The Government of Mali entered into a first funding agreement with Yeelen Kura in 2006 via the rural electrification agency (AMADER). It was the start of a close and successful cooperation with AMADER as a financing partner of Yeelen Kura. FRES has internal procurement standards to control the quality of its assets. The National Energy Policy (PEN) in Mali mentions issues of the quality of energy technologies, but there are currently no formal regulations for the control of energy systems and no formal process for approval of high quality systems by the Government of Mali.
Cultural and Economic Factors: As some mini-grid customers were unable to keep up with their monthly payments, prepaid meters were trialled to try and combat non-payment. The outcome was positive and all mini-grid customers will be equipped with prepaid meters in 2014. FRES generally first tries to understand why a customer is not paying their monthly payments, and subsequently proceeds to issue warnings. If the client does not comply after the third warning, the SHS is removed or the house is disconnected from the mini grid system.
FRES Mali SHS and Hybrid Mini-Grid Identified Market Barriers
The following are the main key obstacles identified within the FRES Mali electricity mini-grid and SHS model, which are further highlighted in the market map in Figure 20. Potential corresponding support interventions, relevant responsible actors and intervention categorisations are shown in Table 10:
f Political instability and unrest due to the coup d'état f Constant increasing fuel price and no tax support for
fuel from government f Poorly developed tariff setting policy for operators f Non-payment from clients side f Low access to loans or finance for small business f Absence of energy efficient appliances in the market

116
FRES-Yeelen Kura
Project Developer Manufacture RetailDistribution
HOUSEHOLDS
ENTERPRISES
Consumption
NATIONAL
Poorly Developed Electricity Tariff Setting in Mail
Low Income Levels of Customers in Mail
Business loans for productive use equipment in Mail
Instability and Lack of Economic Support Institutions following Coupe in Mail
Lack of Mail Government Regulations of Energy Technology Quality ControlE2
E1
E3
E4
S1
M1
INTERNATIONAL
Solar Component Manufactures (Batteries and modules)
NATIONAL
Figure 20 FRES-Yeelen Kura Solar PV Home System (SHS) and Mini-Grid supporting interventions
LEV
EL 2
INPU
TS, S
ERV
ICES
A
ND
FIN
AN
CE
LEV
EL 1
MA
RKET
CH
AIN
LEV
EL 3
E NA
BLI
NG
E N
VIR
ON
MEN
T

117
Table 10 FRES-Yeelen Kura Solar PV Home System (SHS) and Mini-Grid supporting interventions
Level Market System Level Issue Responsible Actor Potential Support Intervention Category
Level 3 – Enabling Environment
E1Instability and lack of
support from international
economic community
following Political Coup in
Mali
Government of Mali
including Energy
and Finance Ministries
and International
Development
Community
Technical assistance to develop more
sustainable support to energy access in
Mali independent of political crises such
as the recent Coupe. Includes advocacy
and political support to develop more
resilient local businesses in Mali.
TAAD
TAP
TAB
E2Lack of Suitable Energy
Policies and Regulations
regarding the quality
control of SHS and mini-
grid systems in Mali
Ministry of Energy
National government.
Mali Standards Bureau.
Local Manufacturers
Association.
Technical assistance to develop required
specific policies and regulations required
to support mini-grid developers in Mali.
TAB
TAT
E3Poorly Developed Electricity
Tariff Setting in Mali
Current electricity levels in
rural areas are set at too
low a level to allow system
developers to cover their
costs
Ministry of Energy and
Finance, Mali Electricity
Regulatory Authority
Technical assistance to develop more
appropriate electricity tariffs for end
users from mini-grid systems.
TAP
TAT

118
E4Low Ability to Pay of
Poor Households and
Communities in Mali
Malian Agency for
the Development of
Household Energy and
Rural Electrification
Financial and technical assistance to
develop appropriate subsidies/loans for
monthly payment of energy services
from SHS and mini-grids for very poor
end users in Mali.
FAG
FAC
TAP
Level 1 – Market Chain
M1v
Non Payment of monthly
subscription or fees
FRES-Yeelen Kura Technical assistance to increase
productive uses of energy in
communities in Mali to increase
incomes and ability to pay of end users.
TAT
TAB
Level 2 – Inputs, Services and Finance
S1Low access to business
loans for productive use
equipment in communities
in Mali
Microfinance
companies.
Community end users.
Technical and financial assistance to
Financial Service Providers in Mali (MFI’s,
SACCOs) to develop specific financial
products to support local productive use
of energy in communities to increase
energy use and income to pay for energy
services.
TAT
TAB
FAL
FAC

119
Case Study 5M-KOPA Solar PV Home System (SHS), Kenya
Introduction to M-Kopa Solar PV Home Systems (SHS), Kenya
M-Kopa aims to help customers in Kenya to access solar PV home systems (SHS) as a clean, safe and affordable lighting alternative to kerosene and other inefficient energy sources. M-Kopa is a GSM14-enabled technology platform that uses embedded mobile payments to provide an asset financing model. It allows end users to access a pay-as-you-go Solar PV Home System (SHS) (from d.light), allowing them to pay for their systems using mobile money.
Level 1Market Chain
Project Developer: M-Kopa is a private company which acts as the financial planner and has affiliates such as Safaricom and other mobile agents that handle the distribution and retailing of the energy systems (in this case the d.light systems) in a commercial and sustainable manner and also ensures technical support. The business model works on an agent commission basis, where re-sellers (such as mobile agents) of the M-Kopa energy units (e.g. solar systems) get
a commission over time as the customer pays down the balance on the unit. The model allows M-Kopa to forge partnerships that in future it will be able to provide access to a broader range of energy products such as improved cook stoves.
Energy Production: Currently, M-Kopa Solar promotes d.light products but is designed to scale across multiple markets and product technologies. The d.light SHS is a high quality product which combines 3 bright LED bulbs and a mobile phone charger to meet the needs of an average Kenyan family. It has a one year warranty and a product lifespan of 7–10 years. The solar-power unit is manufactured by d.light Energy Pvt Ltd., which is a U.S.-based lighting-product design company. M-Kopa machine-to-machine technology and software is embedded in the d.Light equipment, allowing them to turn it on or off according to their customers’ payments and thus providing a greater degree of control in case of payment defaults.
Energy Distribution: M-Kopa helps customers acquire and own high quality, affordable solar products via a network of local dealers. Payments for M-Kopa are processed by Safaricom Ltd., East Africa’s largest telecommunications provider, through its mobile-phone money-transfer plat-form M-PESA. Working in collaboration, the unit supplier and M-Kopa established and coordinated a network of dealers in order to reach the last mile consumers and link these dealers to their consumers. The distribution model promotes M-Kopa dealers (locally based resource
1 4) Global System for Mobile Communications

120
people) and Safaricom shops to market and service the technologies on a sustainable basis.
End Use: M-Kopa is a credit-sale and communication model that allows off-grid customers to access lighting and charge their mobile phones through the easy mobile payment system of M-PESA. It increases the adoption of transformative and affordable energy products designed for underserved consumers using smart technology and on-the-ground delivery. The model focuses on making energy technologies affordable via its asset financing scheme; customers buy the solar home system through an affordable M-Kopa payment plan with an initial deposit of Kshs. 2,50015, followed by daily payments. Using embedded Safaricom SIM cards, M-Kopa allows end users to pay daily instalments of Kshs. 40 via M-Pesa for up to one year. The customers make payments by phone to top up credit on their system (each day of credit costs about US$0.40). Consumers pay whenever they want and buy as many days of credit as they like. After completing their payments, they own the product with continued access to electricity, which releases income for other household priorities. By offering quality solar products to consumers for less than the costs of their daily kerosene expenditures, M-Kopa enables consumers to leapfrog to locally-generated, affordable and high quality renewable energy.
15) Approximately $28 as of 21/05 14

121

122
Level 2Inputs, Services and Finance
Inputs: No input issues were identified.
Services: The M-Kopa communication platform provides information to potential customers about the available product and market intelligence to the unit supplier. Currently, no external services are provided.
Finance: As M-Kopa delivers credit facilities and convenient payment plans (daily and bulk payments extending over one year) through small transactions and at a low price, it allows consumers to purchase and use the products in remote areas, and no external end user finance is required. M-Kopa cushions the risk for consumers to access sale credit, offering confidentiality of data, real-time customer care and emergency credit. Funders of the M-Kopa project include Gray Ghost Ventures in Atlanta, Georgia, the Royal Dutch Shell Plc (RDSA)’s Foundation and the UK Department for International Development (DfID).
Level 3Enabling Environment
Policy Factors: M-Kopa works with unit suppliers such as d.light, who meet the quality control standards developed by Lighting Africa in Kenya.
Cultural and Economic Factors: No specific issues were identified.
M-Kopa Solar PV Home Systems (SHS) Identified Market Barriers
The following key obstacles were identified within the M-Kopa Market System:
f Lack of supportive policies and regulations to promote such innovative retail and payment schemes
f On-going kerosene subsidies counteract the uptake of solar PV systems, making it artificially competitive
f Current high level of import tax on solar PV systems pushing up the price for end users
f Currently low awareness of the products and service amongst potential customers
f Lack of availability of new high quality technologies to meet end users’ energy issues in all areas of Kenya due to poor distribution and retail of the appropriate products
These barriers are highlighted and described in the M-Kopa market map in Figure 21. Relevant responsible actors, potential required support interventions and the intervention categorisation are shown in Table 11.

123
Figure 21 M-Kopa Solar PV home system (SHS) market map
Rural energy policy and regulations (including kerosene subsidy)
Household cash flows
Consumer Awareness & Trust Levels for d.light
d.light service and parts shops
Excise and duty on d.light products
E3
E4
E2
E1
S2Chinese d.light contract
manufacturer
Manufacture Retail
Safaricom shops and M-Kopa
registered dealers
Consumption
NATIONALINTERNATIONAL
M-Pesa registered households
Distribution
Finance for d.light dealers
d.light solar PV company (shipping, distribution, and warranty and technology design)
M1
S1
LEV
EL 2
I NPU
TS, S
ERV
ICES
A
ND
FIN
AN
CE
LEV
EL 1
MA
RKET
CH
AIN
LEV
EL 3
E NA
BLI
NG
EN
VIR
ON
MEN
T

124
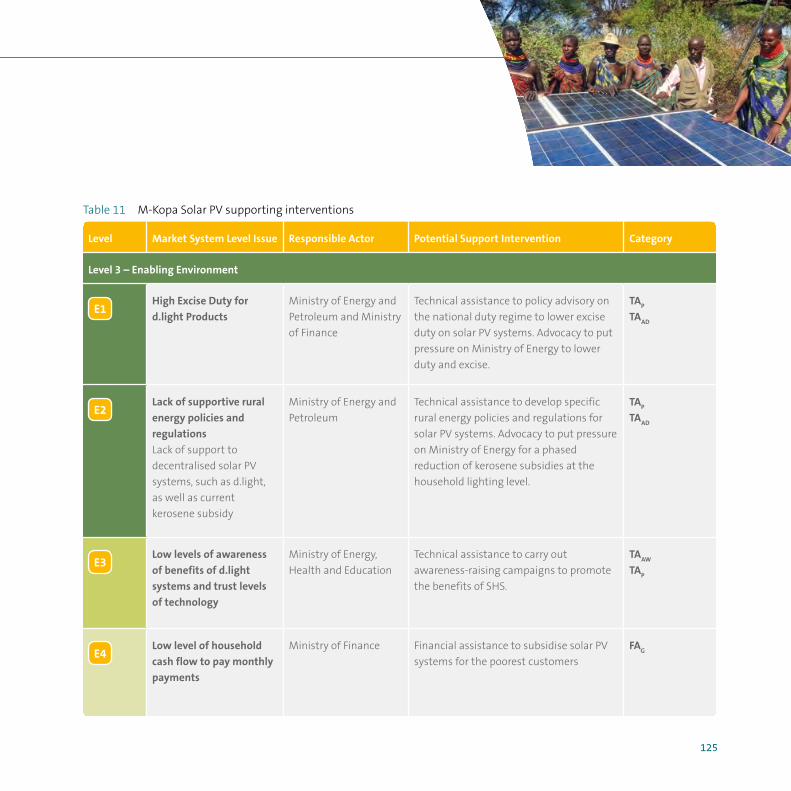
125
Table 11 M-Kopa Solar PV supporting interventions
Level Market System Level Issue Responsible Actor Potential Support Intervention Category
Level 3 – Enabling Environment
E1High Excise Duty for
d.light Products
Ministry of Energy and
Petroleum and Ministry
of Finance
Technical assistance to policy advisory on
the national duty regime to lower excise
duty on solar PV systems. Advocacy to put
pressure on Ministry of Energy to lower
duty and excise.
TAP
TAAD
E2Lack of supportive rural
energy policies and
regulations
Lack of support to
decentralised solar PV
systems, such as d.light,
as well as current
kerosene subsidy
Ministry of Energy and
Petroleum
Technical assistance to develop specific
rural energy policies and regulations for
solar PV systems. Advocacy to put pressure
on Ministry of Energy for a phased
reduction of kerosene subsidies at the
household lighting level.
TAP
TAAD
E3Low levels of awareness
of benefits of d.light
systems and trust levels
of technology
Ministry of Energy,
Health and Education
Technical assistance to carry out
awareness-raising campaigns to promote
the benefits of SHS.
TAAW
TAP
E4Low level of household
cash flow to pay monthly
payments
Ministry of Finance Financial assistance to subsidise solar PV
systems for the poorest customers
FAG

126
Level 1 – Market Chain
M1Lack of Effective National
Distribution Models For Retail
of d.light Products
Retail companies have not
developed effective distribution
and retail models to distribute
and sell d.light products widely.
Private sector
companies
Communication
platform
Technical assistance is required to ensure
that high quality technology solutions
reach consumers and meet the needs and
expectations of end users.
TAT
TAB
Level 2 – Inputs, Services and Finance
S1Lack of Access to Appropriate
Financing Options for d.light
Retailers
Financing institutions do not
offer finance packages for
retailers
Microfinance
companies
Development
banks
Technical and financial assistance for
finance organisations to develop, test
and market specific savings products for
SHS companies to better distribute and
retail solar PV products to more end users,
scaling up M-Kopa. Market trend reports
informing the financial sector of the size
and performance of the market can serve
to increase understanding and reduce
perceived risk.
TAT
FAL
FAC
S2Lack of Suitable Service and
Parts Shops
Retail Service
Companies
Technical assistance to train technicians
in local retail shops throughout Kenya to
service d.Light products.
TAT
TAB

127
Case Study 6Restio Imported ICS, South Africa
Introduction to Restio Imported ICS, South Africa
Restio Energy is a private sector organisation which has been involved in the energy access sector in Southern and East Africa since 2001. Their work spans several countries to create the necessary enabling environments for improving energy access and develop innovative delivery models for energy products and the practical commercialisation of clean energy products. Although Restio Energy works with a range of technologies and consulting activities, they are mainly recognised for their work on biomass improved cook-stoves in Southern Africa. In 2009, Restio was involved in a pilot project with GIZ and the ICS manufacturer Ecozoom to develop a commercial strategy for the dis-semination of ICS in rural South Africa. At the end of the project Restio continued to supply the Ecozoom stove as a wholesaler. In 2010, Restio received grant funding from the World Bank under the Biomass Energy Initiative for Africa (BEIA) to further develop the market and business platform for ICS. Currently, Restio sells ICS from 4 different manufactures (local and international). The company also sells solar-powered lights, chargers and larger systems which are focused on providing energy access to low-income households.

128
Level 1Market Chain
Project Development: Restio has partnered with the South Africa Department of Rural Development and Land Reform to supply Household Energy Kits (HEK) to rural households, consisting of an Ecozoom ICS, a Wonderbag retained heat cooker and a Barefoot Power Firefly Mobile solar lantern with a phone charger. Restio also received a grant from World Bank in 2010 to further develop the market. It currently does not use carbon financing, mostly because it is not lucrative to pursue. However, it has developed a trusted brand for energy products in low-income markets, operating as a wholesaler and developing the market through training and supporting independent distributors, township-based sales networks, etc. Restio uses its expertise and networks to source appropriate products and create the market. Restio reduces the risks and costs for manufacturers and retailers (as well as consumers) associated with developing these kinds of energy access markets. At the base of the pyramid it occasionally also sells directly to end users. Its main clients are NGOs, government departments and stove retailers.
Energy Production: Restio sells renewable energy products, including solar lanterns, chargers and larger systems, retained heat cookers, as well as ICSs. It does not manufacture products itself but buys from local and international companies, which design and manufacture high quality and established products with recognised production and performance standards. It sells 4 brands of ICS that are imported and 2 which are locally
manufactured. Restio sells 3 models of the Ecozoom ICS developed by Aprovecho (the rocket stove, Jet stove and Plancha stove), the Philips high efficiency stove which is manufactured and imported from Lesotho, as well as 2 Rocket Works ICS models and the Mbaula green stove which are both manufactured locally in South Africa. Restio pays 15 % import duties for ICS imports and acts as a wholesaler along the value chain. The Ecozoom Versa Rocket stove is its most successful product for several reasons; these include the stove’s price compared to competing products, its high quality and features which consumers seem to prefer. It works with both wood and charcoal.
Energy Distribution and Retail: Restio sells through hardware shops, independently owned township retailers and specialist agricultural stores. As a wholesaler Restio Energy has a number of diverse distribution networks. About 70 % of its sales are to local retailers, who then sell on to users at its desired price (Restio makes no demands on the retailers to control the price they sell at, but provides recommended retail prices). About 30 % of its products are bought and distributed by NGOs who are implementing their own ICS projects, as well as in partnership with government departments as part of their development programmes.
End Use: Restio does not get involved in or controls the end user pricing or payment systems, as these are unique to their clients (an NGO might offer credit while retailing clients will not).
129

130
Level 2Inputs, Services and Finance
Inputs: No specific input issues were identified.
Services: Though Restio and its partners carry out the marketing of the ICS, there is a relatively low awareness of ICS in South Africa, as this has previously been a neglected part of South Africa’s energy sector. However, the fact that the department of rural development is now involved in the ICS sector, shows that this situation is changing. All of the ICS that are sold have a 1-year warranty on any fault or damage that may occur.
Finance: Restio has not tried to obtain any financial assistance apart from its partnerships with the Government and NGOs. Some retailers provide finance to their customers (or at least act as intermediaries between MFIs and the clients), which can be used to purchase the ICS. Many retailers also sell the products on a lay-buy basis.
Level 3Enabling Environment
Policy Factors: Although the use of biomass is mentioned in the White Paper on Renewable Energy Policy of 2003, there is no specific relevance to ISC with regards to the application of biomass. The main policy focus remains on increasing electricity access for cooking and gives little attention to biomass users. No specific regulations on the
control of biomass for cooking or ICS quality standards have been developed. Restio still pays 15 % duty on their imported ICS.
Cultural and Economic Factors: No specific factors were identified.
Restio imported ICS identified market system barriers
The following are the main key obstacles identified within the Southern Africa ICS market development model, which are further highlighted in the market map in Figure 22. Potential corresponding support interventions, relevant responsible actors and intervention categorisations are shown in Table 12:
f Lack of policy support for ICS in South Africa since no policies consider biomass users
f On-going kerosene distribution by the local South African municipalities impacting ICS market
f Current high level of import taxes of ICS in South Arica increasing prices even for wholesale
f Low ICS demand f Lack of global and local technical standards for ICS

131
Figure 22 Restio imported ICS market map
South Africa Municipalities distributing paraffin for free
Inclusion of biomass ICS in South African decentralised energy policy
E2
E1
Security against changing exchange rate for ICS in South Africa
International and local manufactures
Manufacture Retail
CBOs/NGOs
Consumption
HouseholdsRestio Energy
Distribution
M1
M2
NATIONALLOCAL / INTERNATIONAL
South African ICS import duty and taxes
E2
Local retailers
S1Provision of micro-finance to users of ICS in South Africa
S2
consumer awareness of ICS usage in South Africa
E4
LEV
EL 2
INPU
TS, S
ERV
ICES
A
ND
FIN
AN
CE
L EV
EL 1
MA
RKET
CH
AIN
LEV
EL 3
E NA
BLI
NG
EN
VIR
ON
MEN
T

132

133
Table 12 Restio imported ICS supporting interventions
Level Market System Level Issue Responsible Actor Potential Support Intervention Category
Level 3 – Enabling Environment
E1Lack of Specific South African
Policy Support for ICS
Current energy policies
only really support grid
electrification
South African
Department of
Energy
Technical assistance to raise awareness of the
need for ICS and advocacy to increase the profile
of ICS in the national energy agenda.
TAAW
TAAD
E2Local South African
Municipalities Provide
Kerosene
Such support to kerosene
stove usage affects ICS
biomass market
South Africa
Municipalities
Technical assistance to develop well informed
district energy policies and regulations inclusive
of healthy biomass cooking devices.
TAP
TAT
E3High Import Duty on ICS in
South Africa
South African
Revenue Service
Technical and financial assistance to remove
taxes on high performance ICS technologies in
South Africa.
FAG
TAP
E4Low Awareness of Benefits
of ICS in South Africa
Department of Rural
Development and
Land Reform
Technical and financial assistance to raise
awareness of benefits of ICS in rural and peri-
urban communities in South Africa. Financial
assistance to subsidise ICS to increase usage.
TAAW
TAT
FAG

134
Level 1 – Market Chain
M1Failure of Local ICS Manufacturers
to Achieve Economies of Scale.
Because of a low demand.
Local
manufacturing
companies.
Technical assistance in technical production
and business development of ICS manufacturing
in South Africa to reduce production costs.
TAB
TAT
M2Low Demand for ICS in
South Africa
Retailing
companies
Technical assistance to better market ICS
technologies.
TAB
TAT
Level 2 – Inputs, Services and Finance
S1No Security Against Cost of
Changing Exchange Rates for ICS
in South Africa
Restio and
Manufactures
(Ecozoom)
Financial assistance to provide complimentary
finance to reduce the exchange rate risk.
FAC
S2Lack of Credit for Users to
Purchase ICS in Rural
Communities in South Africa
Financial service
providers
Technical and financial assistance to support
financial service providers to provide loans to ICS
end users in rural communities of South Africa.
TAT
FAC

135
Case Study 7Toyola Centralised ICS, Ghana
Introduction to Toyola ICS, Ghana
Toyola is a profit making organisation that focuses on manufacturing, distributing and retailing improved cook stoves (ICS), as well as more recently also selling solar PV lanterns. The company was started in 2006 by Suraj Wahab Ologbur and Ernest Kwasi Kyei who were among 78 artisans to be trained in the production of ICS by USAID’s Enterprise Works Ghana. Toyola’s main stove product is the charcoal coal pot which resembles the Gyapa stove.
Level 1Market Chain
Project Development: Toyola is a profit making organisation that designs, manufactures and sells a branded ICS product in Ghana. It aims to operate an economically viable business which serves the communities’ needs and interests. Toyola also offers to reduce their local manufacturers’ risk by underwriting the supply of raw materials and purchasing any products whether there is demand or not. Toyola also sells their stoves to some retailers, whilst offering their stoves to retailers who cannot afford to buy them up-front on a commission basis.
Energy Production: Though Toyola has recently moved into solar lanterns, their main focus is still the Toyola ICS for household cooking. The Toyola stove is a locally designed and manufactured product and is specific to the local cooking practices in Ghana. Toyola trains apprentices to make different components of the stove such as the ceramic lining, which is produced by a subsidiary of Toyola, and performs quality control on production. The manufacturers are responsible for different parts of the ICS (handle, frame and ceramic liner).
Energy Distribution: Toyola has multiple distribution channels and models to ensure its product reaches as many potential customers as possible. They take advantage of existing retail networks for other products which sell the stove either on commission basis or through direct purchases. Toyola also has its own sales agents who sell door-to-door and receive commissions for their sales. For isolated communities that are hard to reach, Toyola has a mobile delivery service (a truck) selling directly to households.
Energy Retail: The small household stove costs $5–$6 and $18–$21 for the commercial stove. Toyola has increased its stoves sales from 21,000 in 2007 to over 200,000 at the close of 2013. Their main marketing strategy is through recommendations from other users, called evangelists, and through the reliability and integrity of their product. Each ICS comes with a 6-month warrantee and even after 6 months Toyola will replace the ceramic if it cracks at no additional costs.
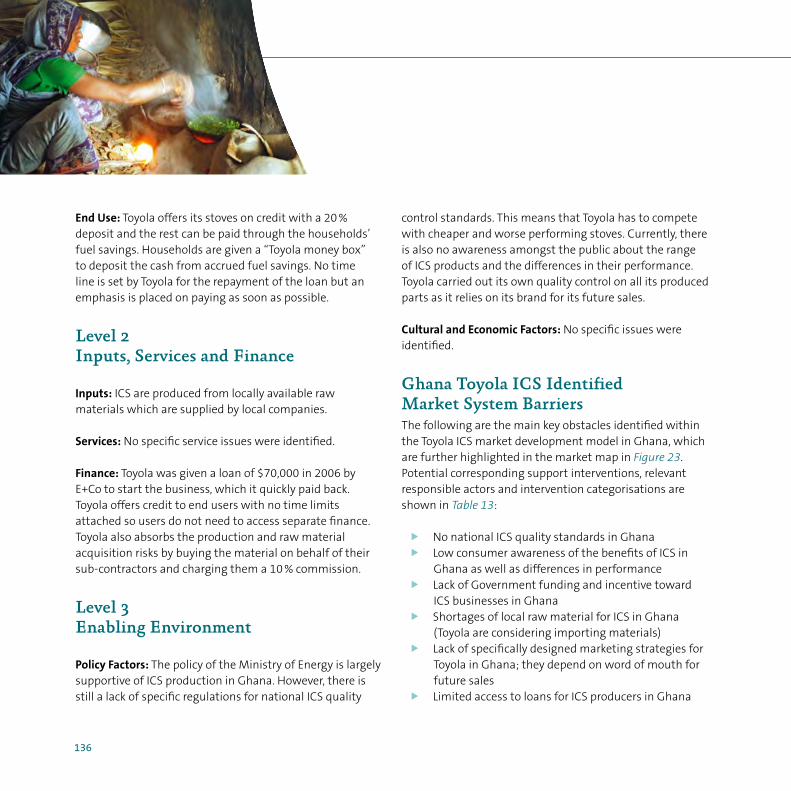
136
End Use: Toyola offers its stoves on credit with a 20 % deposit and the rest can be paid through the households’ fuel savings. Households are given a “Toyola money box” to deposit the cash from accrued fuel savings. No time line is set by Toyola for the repayment of the loan but an emphasis is placed on paying as soon as possible.
Level 2Inputs, Services and Finance
Inputs: ICS are produced from locally available raw materials which are supplied by local companies.
Services: No specific service issues were identified.
Finance: Toyola was given a loan of $70,000 in 2006 by E+Co to start the business, which it quickly paid back. Toyola offers credit to end users with no time limits attached so users do not need to access separate finance. Toyola also absorbs the production and raw material acquisition risks by buying the material on behalf of their sub-contractors and charging them a 10 % commission.
Level 3Enabling Environment
Policy Factors: The policy of the Ministry of Energy is largely supportive of ICS production in Ghana. However, there is still a lack of specific regulations for national ICS quality
control standards. This means that Toyola has to compete with cheaper and worse performing stoves. Currently, there is also no awareness amongst the public about the range of ICS products and the differences in their performance. Toyola carried out its own quality control on all its produced parts as it relies on its brand for its future sales. Cultural and Economic Factors: No specific issues were identified.
Ghana Toyola ICS Identified Market System BarriersThe following are the main key obstacles identified within the Toyola ICS market development model in Ghana, which are further highlighted in the market map in Figure 23. Potential corresponding support interventions, relevant responsible actors and intervention categorisations are shown in Table 13:
f No national ICS quality standards in Ghana f Low consumer awareness of the benefits of ICS in
Ghana as well as differences in performance f Lack of Government funding and incentive toward
ICS businesses in Ghana f Shortages of local raw material for ICS in Ghana
(Toyola are considering importing materials) f Lack of specifically designed marketing strategies for
Toyola in Ghana; they depend on word of mouth for future sales
f Limited access to loans for ICS producers in Ghana

137
Figure 23 Toyola Centralised ICS market map
MFI loans for the production of ICS in GhanaS1
Manufacture Distribution Retail Consumption
Ghana government ICS financing initiativesE1
Stove retailers
CBOs / NGOsM2
Enterprises
Public sectorToyola Energy company
Stove component manufacturing
companies
M1Households
Ghana Ministry of Energy ICS standards developmentE2
LEV
EL 2
INPU
TS, S
ERV
ICES
A
ND
FIN
AN
CE
LEV
EL 1
MA
RKET
CH
AIN
LEV
EL 3
ENA
BLI
NG
EN
VIR
ON
MEN
T
Consumer awareness of ICS quality in Ghana
E3

138

139
Table 13 Toyola Centralised ICS supporting interventions
Level Market System Level Issue Responsible Actor Potential Support Intervention Category
Level 3 – Enabling Environment
E1Lack of Financial Incentives
for Support to ICS Businesses
in Ghana
Ghana Ministry
of Energy
Ghana Micro
finance institutes
Technical and financial assistance to Ghana
Ministry of Energy to develop and provide
financial incentives to ICS companies as well
as energy policies that support the growth of
ICS businesses. Technical assistance to increase
presence of ICS companies in national level
energy forums.
TAP
TAT
FAC
TAAD
E2No National ICS Standards
in Ghana
Focus mainly on LPG for
cooking with no ICS standards
yet in place.
Ghana Ministry
of Energy
Ghana Research
institutes and
Bureau of
Standards
Technical assistance to Ministry of Energy
in Ghana to develop specific ICS standards.
Assistance to Ghana Bureau of Standards and
research institutions to test and approve ICS
technologies.
TAT
TAAW
E3Low Consumer Awareness
of ICS in Ghana
Lack of information ICS
options and benefits to
users’ wellbeing.
Ghana Ministerial
Agencies
Technical assistance to Ghana government
ministries to raise consumer awareness of ICS
performance.
TAT
TAP
TAAW

140
Level 1 – Market Chain
M1Shortage of Required ICS Raw
Materials in Ghana
ICS manufacturers Technical assistance to support ICS
manufacturers in Ghana to import relevant
materials or produce them locally.
TAT
TAB
M2Poorly developed Marketing
Methods Used by Toyola Energy
in Ghana
Toyola Energy Technical assistance to Toyola to develop clear
and effective marketing strategies to sell ICS
in Ghana, which will also inform public on
livelihood benefits of ICS products.
TAB
TAT
Level 2 – Inputs, Services and Finance
S1Lack of Access to Appropriate
Finance Loans for ICS
Manufacturers in Ghana
Microfinance
companies
Technical and financial assistance to financial
service providers to develop suitable financial
products for ICS in Ghana and to market them
to ICS companies.
TAT
TAB
FAL

141
16) Gold Standard is the carbon trader with Impact Carbon being the carbon broker
Case Study 8Ugastove Centralised ICS, Uganda
Introduction to the UgastoveICS Programme
Ugastove is a private company based in Kampala, Uganda, which produces a wide range of wood- and charcoal-burning improved cook stoves (ICS), sold and used throughout the country in urban, peri-urban and rural contexts. Besides selling ICS directly to users, Ugastove also partners with organisations such as WWF, GIZ and Uganda Ecotrust (funded by UNDP) in order to deliver specific objectives, such as the 100 % adoption of ICS within a region or raising awareness of ICS for institutional use. The ICS price ranges from $5 for the smallest domestic charcoal stove to more than $600 for a 100-litre institutional wood stove. Currently, up to 50 % of the stove price is covered by carbon finance through a partnership with Impact Carbon, who has registered the carbon credits through the voluntary carbon market (VCM).
Level 1Market Chain
Project Developer: Ugastove’s ICS are marketed as high quality branded goods with higher performance and quality than those of their competitors. Up to 50 % of the final selling price of the stove is subsidised through carbon finance revenues (through Gold Standard16), which makes Ugastoves affordable to a wide range of users.
Energy Production: The Ugastove portfolio covers a range of sizes and types of ICS, with products designed to burn either wood or charcoal in order to satisfy the needs of different sectors of the market, different household sizes of in urban and rural areas, as well as institutions and small businesses. The stoves are manufactured centrally in Kampala, which helps ensure a higher quality control than for other stoves. The factory utilises a range of technical equipment to produce high quality manufactured ICS products.
Distribution and Retail: The stoves are transported from the Kampala factory to Ugastove branches in key towns around the country. These branches distribute the stoves to third-party retailers (supermarkets and hardware shops) who cover the other main towns and population centres across the country. Customers can also buy the stoves directly from the factory or the Ugastove branches.

142
End Use: The stoves have been designed to meet local Ugandan users’ needs and to meet local cooking traditions. They are
subjected to quality controls to ensure their durability and keep their reputation as a well-recognised brand throughout the country.
Stove awareness is raised through various strategies, including their website, as well as
exhibitions and market demonstrations.
Level 2Inputs, Services and Finance
Inputs: The principal construction materials are sheet steel, clay (fired for specifically designed
ceramic liner significantly increasing ICS efficient) and paint. However, the inconsistent quality of
production raw materials can lead to production issues.
Services: Ugastove has received technical assistance and equipment from various donor agencies, including
GIZ, which has increased its quality and business model development.
Finance: Apart from carbon finance subsidy, no targeted finance is provided for end-user purchases.

143
Level 3Enabling Environment
Policy Factors: The Ugandan Government’s Renewable Energy Policy (2007) includes a target for the adoption of ICS. These include awareness raising and training of market actors but do not mention clear financial assistance (grants or incentives). ICS are also still subject to VAT at the standard rate of 18 %, which significantly impacts their sales. No formal national ICS standards are in place in Uganda to ensure their quality, leading to the prevalence of poor quality ‘fake’ ICS. There is sometimes a lack of awareness about the benefits of ICS. Ugastove seeks to address this problem through awareness-raising initiatives, using mass media advertising, promotional vehicles, flyers, exhibitions and shows.
Cultural Factors: The Ugastove ICS have been specifically designed to support local cooking practices and are thus well accepted by the local population in rural and urban areas.
Economic Factors: End users often have little or no savings and are therefore often dependent on credit to make the initial purchase of a stove.
Identified Ugastove CentralisedICS Market System Barriers
In the following market map in Figure 24, the main key obstacles within the Ugastove ICS model are highlighted and potential corresponding support interventions, relevant responsible actors and intervention categorisations are shown in Table 14:
f Lack of effective technical and financial mechanisms to meet the ambitious government targets on ICS
f Lack of quality standards or regulations leading to prevalence of poor quality ‘fake’ stoves
f Full rate of VAT (18 %) applied to sales of all ICS affecting uptake
f Poor awareness of benefits of Ugastove/ICS in general, particularly in rural areas
f Uncertainty regarding future availability of carbon credit subsidy for ICS and burden of carbon finance accreditation requirements
f Lack of sustainable and affordable biomass supply

144
Figure 24 Ugastove Centralised ICS market map
Taxas
Cooking Fuel (Wood or Charcoal
E3
S2
Manufacture
Carbon Financing – Subsidies
Distribution Retail
S1
Consumption
Regulations, licenses and standards
Government of Uganda: Renewable Energy Policy – ICS Component
E2
E1
Ugastove Branches
Supermarkets
HouseholdsUgastove Factory
Hardware Stores
M1
Enterprises
Public Facilities
LEV
EL 2
INPU
TS, S
ERV
ICES
A
ND
FIN
AN
CE
LEV
EL 1
MA
RKET
CH
AIN
LEV
EL 3
ENA
BLI
NG
EN
VIR
ON
MEN
T
Consumer Awareness Levels
E4
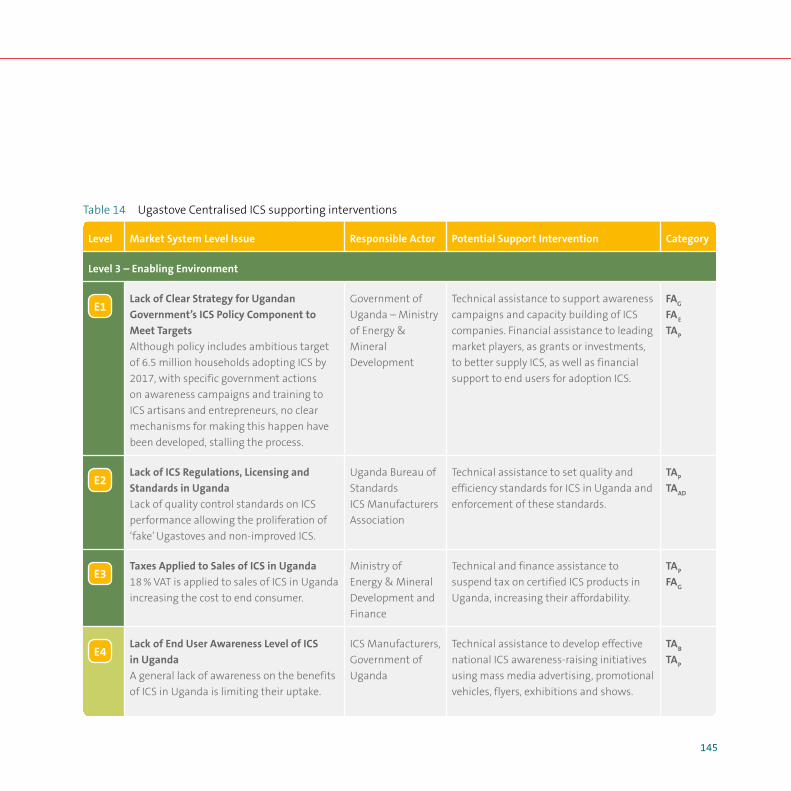
145
Table 14 Ugastove Centralised ICS supporting interventions
Level Market System Level Issue Responsible Actor Potential Support Intervention Category
Level 3 – Enabling Environment
E1Lack of Clear Strategy for Ugandan
Government’s ICS Policy Component to
Meet Targets
Although policy includes ambitious target
of 6.5 million households adopting ICS by
2017, with specific government actions
on awareness campaigns and training to
ICS artisans and entrepreneurs, no clear
mechanisms for making this happen have
been developed, stalling the process.
Government of
Uganda – Ministry
of Energy &
Mineral
Development
Technical assistance to support awareness
campaigns and capacity building of ICS
companies. Financial assistance to leading
market players, as grants or investments,
to better supply ICS, as well as financial
support to end users for adoption ICS.
FAG
FAE
TAP
E2Lack of ICS Regulations, Licensing and
Standards in Uganda
Lack of quality control standards on ICS
performance allowing the proliferation of
‘fake’ Ugastoves and non-improved ICS.
Uganda Bureau of
Standards
ICS Manufacturers
Association
Technical assistance to set quality and
efficiency standards for ICS in Uganda and
enforcement of these standards.
TAP
TAAD
E3Taxes Applied to Sales of ICS in Uganda
18 % VAT is applied to sales of ICS in Uganda
increasing the cost to end consumer.
Ministry of
Energy & Mineral
Development and
Finance
Technical and finance assistance to
suspend tax on certified ICS products in
Uganda, increasing their affordability.
TAP
FAG
E4Lack of End User Awareness Level of ICS
in Uganda
A general lack of awareness on the benefits
of ICS in Uganda is limiting their uptake.
ICS Manufacturers,
Government of
Uganda
Technical assistance to develop effective
national ICS awareness-raising initiatives
using mass media advertising, promotional
vehicles, flyers, exhibitions and shows.
TAB
TAP
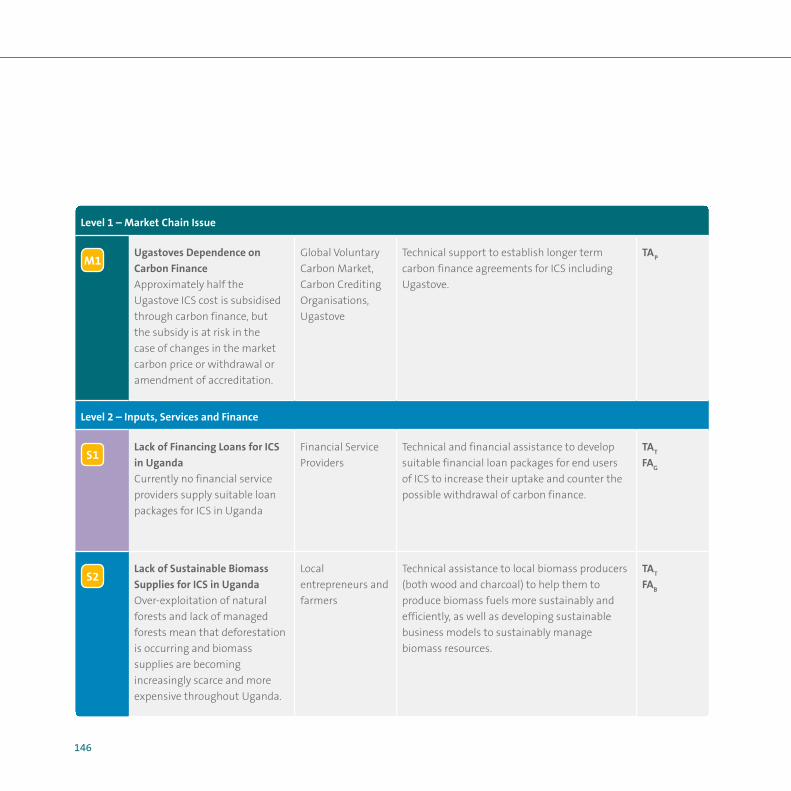
146
Level 1 – Market Chain Issue
M1Ugastoves Dependence on
Carbon Finance
Approximately half the
Ugastove ICS cost is subsidised
through carbon finance, but
the subsidy is at risk in the
case of changes in the market
carbon price or withdrawal or
amendment of accreditation.
Global Voluntary
Carbon Market,
Carbon Crediting
Organisations,
Ugastove
Technical support to establish longer term
carbon finance agreements for ICS including
Ugastove.
TAP
Level 2 – Inputs, Services and Finance
S1Lack of Financing Loans for ICS
in Uganda
Currently no financial service
providers supply suitable loan
packages for ICS in Uganda
Financial Service
Providers
Technical and financial assistance to develop
suitable financial loan packages for end users
of ICS to increase their uptake and counter the
possible withdrawal of carbon finance.
TAT
FAG
S2Lack of Sustainable Biomass
Supplies for ICS in Uganda
Over-exploitation of natural
forests and lack of managed
forests mean that deforestation
is occurring and biomass
supplies are becoming
increasingly scarce and more
expensive throughout Uganda.
Local
entrepreneurs and
farmers
Technical assistance to local biomass producers
(both wood and charcoal) to help them to
produce biomass fuels more sustainably and
efficiently, as well as developing sustainable
business models to sustainably manage
biomass resources.
TAT
FAB

147
Case Study 9Local Manufacturers DecentralisedICS, Rwanda
Introduction to Local ManufacturersDecentralised ICS, Rwanda
In Rwanda, more than 98 % of all households use biomass as the main source for cooking. Despite such heavy reliance on biomass and the extensive charcoal use in urban areas, Rwanda maintains a sustainable biomass resource base. The government’s main focus is thus not concerned with the biomass fuel supply, but rather with offering more modern, cleaner and affordable cooking technologies. The Household Air Pollution (IAP) problem in Rwanda is serious: the World Health Organization (WHO) estimates that the national burden of diseases attributable to solid fuel use affects 5.8 % of households in Rwanda (although predominantly impacting rural households who depend on firewood and agri-residues). The Rwanda Ministry of Infrastructure (MININFRA) has been focusing on supporting the local production of cleaner, more efficient and affordable improved household cooking stoves (ICS). Support has been provided to the supply and uptake of efficient ICS technologies like the Canamake charcoal stove in urban areas and the Canarumwe wood stove in rural areas. These stoves reduce harmful emissions, lower the amount of required biomass and are a shift towards more modern and high performance cooking technologies.
Level 1Market Chain
Project Developer: Local manufacturing and marketing of ICS has recently been supported by several development agencies, including the World Bankand the Energy, Water and Sanitation Authority (EWSA) under MININFRA. While the locally produced Canamake and Canarumwe ICS are actively promoted by EWSA as well as various development organisations, the market is still not considered mature. The traditional Canamake and Canarumwe ICS have been specifically developed for the urban and rural stove users in Rwanda, based on the typical cooking fuels used in these areas, and designed to meet the cooking habits and needs of the typical end users in both urban and rural locations.
Energy Production: In Rwanda the manufacturing of the Canamake and Canarumwe ICS is carried out by fairly small cooperatives in small, informal production sites in decentralised locations throughout the urban and rural areas in most districts. Their production capacity has been expanded, resulting in an increase in production quality through the adherence to strict dimension and quality controls, the use of specifically designed moulds and improved ceramic liners fired in specific kilns. New ICS technologies have been introduced, including a wood gasifier stove, household rocket stove and charcoal briquette (bee-hive) stove and charcoal briquette fuel, through training selected ICS manufacturers in Kigali. However, production remains low. Specialist potters produce high quality clay liners for the Canamake in 9 towns in Rwanda and local artisans create clad stove liners.
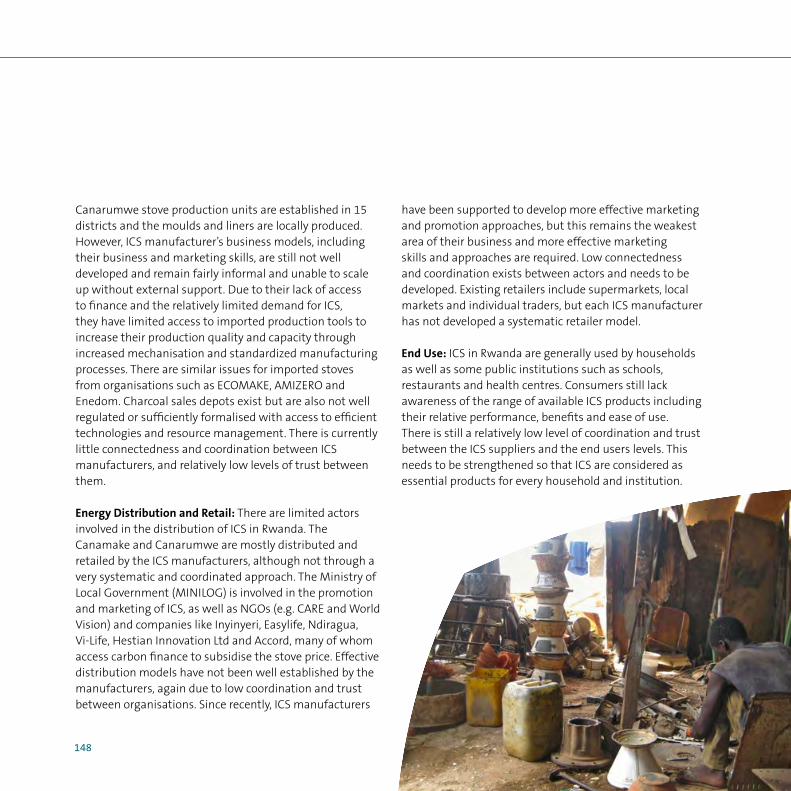
148
Canarumwe stove production units are established in 15 districts and the moulds and liners are locally produced.However, ICS manufacturer’s business models, including their business and marketing skills, are still not well developed and remain fairly informal and unable to scale up without external support. Due to their lack of access to finance and the relatively limited demand for ICS, they have limited access to imported production tools to increase their production quality and capacity through increased mechanisation and standardized manufacturing processes. There are similar issues for imported stoves from organisations such as ECOMAKE, AMIZERO and Enedom. Charcoal sales depots exist but are also not well regulated or sufficiently formalised with access to efficient technologies and resource management. There is currently little connectedness and coordination between ICS manufacturers, and relatively low levels of trust between them.
Energy Distribution and Retail: There are limited actors involved in the distribution of ICS in Rwanda. The Canamake and Canarumwe are mostly distributed and retailed by the ICS manufacturers, although not through a very systematic and coordinated approach. The Ministry of Local Government (MINILOG) is involved in the promotion and marketing of ICS, as well as NGOs (e.g. CARE and World Vision) and companies like Inyinyeri, Easylife, Ndiragua, Vi-Life, Hestian Innovation Ltd and Accord, many of whom access carbon finance to subsidise the stove price. Effective distribution models have not been well established by the manufacturers, again due to low coordination and trust between organisations. Since recently, ICS manufacturers
have been supported to develop more effective marketing and promotion approaches, but this remains the weakest area of their business and more effective marketing skills and approaches are required. Low connectedness and coordination exists between actors and needs to be developed. Existing retailers include supermarkets, local markets and individual traders, but each ICS manufacturer has not developed a systematic retailer model.
End Use: ICS in Rwanda are generally used by households as well as some public institutions such as schools, restaurants and health centres. Consumers still lack awareness of the range of available ICS products including their relative performance, benefits and ease of use. There is still a relatively low level of coordination and trust between the ICS suppliers and the end users levels. This needs to be strengthened so that ICS are considered as essential products for every household and institution.

149
Level 2Inputs, Services and Finance
Inputs: The main inputs for ICS in Rwanda are biomass fuels, predominantly purchased charcoal and self-collected wood fuel. In addition, ICS manufacturers require labour and materials (in particular clay and sheet metal), as well as moulds and templates, tools, workshop facilities and storage space. All these inputs can be obtained in Rwanda, although their quality and quantity vary as they are also generally supplied by informal businesses which lack high levels of coordination and trust.
Services: ICS testing facilities have been established at Tumba College, which has been involved in training and capacity building for ICS manufacturers. KIST has also been involved in supporting ICS market development. The Rwandan Bureau of Standards has further been engaged in developing standards for ICS technologies, although only standards have so far been developed for the Canarumwe and Canamake stoves, and adherence and regulation of these standards is not yet formally established. Additional supportive services which are required to improve the business models of all local ICS manufacturers include business model development (e.g. financial planning and book keeping), more effective distribution, retail and marketing strategies, technical expertise in kiln construction and operation, and improved production processes including metal work skills, stove installation and production of moulds.
Finance: Investment financing for producers and end user loans are required by ICS manufacturers to be able to formalise and scale up their businesses, but so far such finance is not available. Increased access to appropriate finance for end users could also help increase uptake of ICS, particularly if it can be used with mobile money. In addition, support to access carbon finance (including registration and ICS usage monitoring) can also help increase ICS uptake in Rwanda through reducing the unit price and supporting other areas such as awareness-raising and marketing approaches.
Level 3Enabling Environment
Policy Factors: Although the Rwandan Energy Policy is supportive of the use of ICS, the regulations controlling the fuel supply and use, as well as the implementation of standards for all ICS production and use and specific strategies on reaching the ambitious government ICS targets have yet to be fully developed. The Energy, Water and Sanitation Authority (EWSA), under the Ministry of Infrastructure, is leading the support to ICS market development in Rwanda, although has tended to only support the development of the Canarumwe and Canamake up to now. Other ICS initiatives have been authorised by other Ministries including the Ministry of Health and Environment, which does not help with national coordination. Greater cooperation and networking between various government institutions, as well as NGOs and private companies is required to better support the

150
sector. A standard document for both Canamake and Canarumwe stoves has been submitted to the Rwanda Bureau of Standard (RBS) through EWSA but has yet to be fully implemented.
Cultural Factors: ICS users in Rwanda are starting to be sensitised to the problems associated with household cooking, particularly concerning the health and environmental issues. Yet, this awareness is still not widespread and the messages are still not coming across clearly enough. A number of technologies have been developed with the specific cooking habits of Rwandan households in mind and more intensive awareness-raising campaigns are being planned for the future.
Economic Factors: End users of ICS are generally able to afford the technologies, particularly if they are able to access local savings group loans, but they are still not prioritising their purchase compared to other purchasing decisions as they do not yet value them highly enough.
Rwanda Local ManufacturersDecentralised ICS Identified Market System Barriers
The following are the main key obstacles identified within the Rwanda ICS market development, which are further highlighted in the market map in Figure 25. These include potentially required support interventions, relevant responsible actors and intervention categorisation.
Market Chain Barriers
f No large scale ICS production facilities and production processes, quality control and standardisation
f ICS manufacturers are informal with low levels of connections between market chain actors
f Poor quality (fake) ICS products are in market due to lack of standards and their adherence
f Production costs need to be streamlined and reduced as affordability is a problem for end users
f Low stock levels of ICS and liners and lack of suitable workshop space and storage facilities
f Poor distribution models and low understanding of market and consumers’ needs
f Poor marketing skills with limited media to effectively promote ICS products
f ICS manufacturers have low levels of business skills and limited access to capital for investment
f End users still perceive ICS as expensive with low consumer trust levels on ICS benefits

151
Inputs, Services and Finance Barriers
f General raw material shortage including kilns and quality metal sheets including transportation
f Limited access to appropriate tools, moulds, boards, tables and templates
f Low skills level in mould, liner, cladding, kiln construction and operation, and ICS installation
f Limited access to national ICS testing centres f Availability of affordable and well processed ICS fuel
is limited and informal f Access to financial services for ICS manufacturers
and end users is required
Enabling Environment Barriers
f Free distribution of ICS by donors and NGOs distorts market and undermines ICS manufacturers
f Biased support from EWSA towards certain technologies (e.g. Canarumwe and Canamake)
f Poor regulation within ICS sector and cooperation and networking between relevant government ministries and institutions
f Lack of awareness of ICS benefits, safety and efficient use from end users to prioritise purchase
f Lack of testing of all ICS technologies (including Water Boiling Test (WBT), Controlled Cooking Test (CCT), Kitchen Performance Test (KPT)) to accurately measure performance (fuel consumption, cooking time, fire power, household acceptance, Household Air Pollution (HAP) to understand health risks) and provide information to end users to make informed choices
f Limited use of quality standards including quality mark and adherence

152
Figure 25 Rwanda Local Manufacturers Decentralised ICS market map
International / national stove testing protocols and facilities
Marketing and promotion of stoves and fuel
ICS Importers
Manufacture Retail
CBOs / NGOs
Gov Ministries
Consumption
Rural and urban households
Distribution
Local retailers/ supermarkets
Enterprises
Public Facilities
S1
S2
Local ICS Manufacturers
(Metal workshops, potters and
cooperatives)
ICS Distribution throughout
Rwanda
Cooperation Between All Ministries and Institutions in Rwanda
Lack of Quality Control Standards for all ICS in Rwanda and adherence
E1
M1M2
M3
Consumer Awareness Levels
E2
Loans, credit facilities, investment, carbon financingS3
E3
LEV
EL 2
INPU
TS, S
ERV
ICES
A
ND
FIN
AN
CE
LEV
EL 1
MA
RKET
CH
AIN
LEV
EL 3
ENA
BLI
NG
EN
VIR
ON
MEN
T

153
Table 15 Rwanda Local Manufacturers Decentralised ICS supporting interventions
Level Market System Level Issue Responsible Actor Potential Support Intervention Category
Level 3 – Enabling Environment
E1Lack of Quality Standards
for all ICS in Rwanda and
Enforcement
MININFRA, EWSA,
Rwanda Bureau of
Standards, Testing
facilities
Technical assistance to develop quality standards for all
ICS in Rwanda including required testing, enforcement
of quality mark and adherence to standards for all ICS
organisations in Rwanda.
TAP
TAT
E2Limited Coordination
Between Involved
Ministries and Institu-
tions on ICS in Rwanda
Ministry of
Infrastructure,
Health, Education,
Finance etc., NGOs,
donors etc.
Technical assistance to form a National Inter-Ministerial
ICS Committee in Rwanda to coordinate on all
ICS support programmes and between all relevant
organisations
TAP
TAT
E3Lack of End User
Consumer Awareness
of ICS in Rwanda
Various Ministries
in Rwanda, media,
NGOs etc.
Technical assistance to develop specific and national
public awareness-raising campaigns on ICS in urban
and rural areas, including information on the benefits
of stove use.
TAAW
TAT
Level 1 – Market Chain
M1Informal nature of ICS
Manufacturers in
Rwanda, including limited
access to equipment
and raw materials,
workspace and storage,
and technical skills
ICS
Manu facturers
Technical and financial assistance to ICS manu facturers
to formalise their businesses, including access to produc-
tion equipment and inputs (moulds, kilns, workshops,
storage facilities), improved links with other market
actors including suppliers and transporters and more
effective business models. Enable ICS manufacturers to
expand outreach to producers, increase technical capacity
selling higher quality and cheaper products. Facilitate
access to training, testing and information services to
increase ICS design quality to meet performance and user
demands. Help establish ICS manufacturers association
for better coordination between market actors, shared
learning and skills training.
TAT
TAB
FAL
FAC

154
M2Lack of efficient
commercial
distribution systems
for ICS in Rwanda
Current high
costs and small
distribution volumes
and limited transport
options. Limited
innovation in service
delivery and poor
customer relations.
ICS Manufacturers,
existing distributers
(e.g. petrol station,
agro vets, hardware
retailers)
Technical and financial assistance to develop more
effective and efficient distribution ICS models.
Improve coordination and business relationships
between ICS manufacturers, existing transporters
and networked retailers. Technical assistance to
product retailers to expand their businesses to
include ICS products. Facilitation of sales networks
with sub-agent networks for ICS products, including
service centres and to bulk order reducing unit
transaction costs. Integrate ICS distribution with
knowledge and solutions, such as voucher systems
to increase end user update and stove use. Use of
formalised MOUs or contractual arrangements
between ICS manufacturers, distributers and
retailers.
TAT
TAB
FAC
M3Low demand for ICS
in Rwanda and Low
Level of Consumer
Engagement
ICS manufacturers,
distributers and
retailers
ICS end users
Technical assistance to increase demand for ICS by
creating links and improve business relationships
between retailers and end users. Ensure ICS suppliers
are consumer focused to better understand the
needs and preferences of their customers ensuring
effective market targeting, increasing satisfaction
rates, trust and repeat sales. Ensure ICS maintenance
services are provided including information on
after sales support and safe and efficient ICS use
through ICS retailers. Improve marketing strategies
of ICS retailers including public demonstrations and
product promotions on benefits and effective use of
certified ICS. Package and disseminate information
on price, availability, usage and performance of ICS.
TAT
TAB
TAAW

155
Level 2 – Inputs and Services
S1Limited Availability
and Access to
Technical skills and
Business Training on
ICS in Rwanda
Local entrepre-
neurs/Training
institutions/
skills providers
Technical assistance to facilitate links and enhance relationships
between ICS manufacturers and training institutions and informa-
tion providers. Improve training offers from technical institutions
to develop the capacity of ICS manufacturers, distributers and retail
enterprises to better plan and manage their operations, improving
their technical expertise. Support training institutions to develop,
test and market relevant and affordable training products. Support
a certification process for trainers and training program that aim to
improve quality control and standardisation. Develop sustainable
training and technical assistance that producers are willing to pay
for and foster links between service providers and producers.
TAT
TAB
S2Poor Marketing
Capacity for ICS in
Rwanda
Local entrepre-
neurs/Marketing
agencies/media
houses
Technical assistance to enhance relationships between ICS
distributers and retailers and marketing service providers. Link
distributers and retailers with marketing agencies, and support
marketing agencies to offer marketing assistance to develop capac-
ity of ICS distributers and retailers to promote and market their
stoves and fuels and which ICS companies are willing to pay for.
TAT
TAB
S3Lack of Access to
Finance for ICS
Producers and End
Users in Rwanda
Local entrepre-
neurs/Banks/
MFIs/
SACCOs/RUSCOs
Technical and financial assistance to enhance working relation-
ships between ICS manufacturers, distributers, retailers and end
users and financial service providers. Support to financial providers
to develop suitable and affordable financial products and services
for ICS manufacturers, distributors and stockists and end users
including loans and working capital. Develop and test financial
products and services through cooperatives, ICS manufacturers
association, lending groups, MFIs and carbon financing.
TAT
TAB
FAL
FAG
FAC

156
Case Study 10LPG Stoves and Fuel, Senegal
Introduction to LPG stoves and fuel in Senegal
LPG cooking is more popular in urban areas than amongst the rural population in Senegal. International aid and assistance has predominantly focused on encouraging the poorest rural populations to increase the efficiency and safety of using wood fuels (improved cook stoves) rather than fuel switching. However, LPG remains a superior fuel for cooking for those who can afford safer, cleaner and more convenient fuels than solid biomass fuels.
Level 1Market Chain
Project Development: The Senegalese Government has promoted the uptake of LPG as a cooking fuel for over 40 years in order to limit the deforestation impact of traditional cooking with wood or charcoal. Initially, the market for small LPG cylinders (2.7 kg and 6 kg) was boosted by a government subsidy. However, the level of subsidy was gradually phased out between 1998 and 2009, with the majority of the cuts being made in the first 4 years. The national demand for LPG, which had previously shown strong growth, started to decrease after 2005. The
broad reasons for this decline were the high international oil price, national LPG shortages and the subsidy removal.
Energy Production: The majority of final LPG sales in Senegal (>90 %) are for standard-design 2.7 kg and 6 kg cylinders, which are interchangeable between brands. These sizes are the most appropriate for poorer consumers who are unable to afford the high upfront cost of a larger cylinder. The most common stove designs are the “Blip-Banekh” (for 2.7 kg cylinders) and the “Nopalé” (for 6 kg cylinders). These have a typical life span of 6 years and achieve around 45 % efficiency for boiling water.
Distribution and Retail: Most LPG is imported into Senegal by sea. A minor percentage is produced domestically. Almost all LPG is bottled in and around Dakar by Oil Marketing Companies (mainly Shell, Total, Mobil and Elf) for domestic use. The Oil Marketing Companies are involved in the entire downstream market chain; they control a large proportion of the market for distribution and they retail to end users via their branded service stations. However, other actors also play a role in the distribution and retail via third-party sellers. The stoves follow similar market channels to the cylinders. The LPG cylinder market operates on a cylinder deposit and return system.
End Use: The user does not own the gas cylinder itself; when the cylinder is empty it can be returned (for a refund of deposit) or exchanged for a refilled bottle for the cost of the LPG it contains.

157
Level 2Inputs, Services and Finance
Inputs: The Nopalé, the most widely used stove, features an imported, industrially-produced burner but the support structure is made locally from galvanised sheet steel which is cut, folded, welded and painted.
Services: No service issues were identified.
Finance: The production, distribution and retail divisions owned by the Oil Marketing Companies typically do not require finance to fund their operations. Consumers often purchase LPG cylinders from neighbourhood shops that allow them to pay by instalments. No large-scale micro-finance programme has been specifically designed for LPG fuel and equipment.
Level 3Enabling Environment
Policy Factors: The Government of Senegal removed all subsidies on LPG cylinders in 2009, although a customs duty and VAT exemption for the LPG itself is in place to partially compensate for the loss of subsidy. Awareness of LPG and LPG stoves is very good in urban areas where LPG penetration is high, but is much more limited in rural areas.
Cultural Factors: No cultural issues were identified.
Economic Factors: The high dependence on imported LPG means that the market is very vulnerable to international oil price increases and volatility. High international LPG prices have been a principal cause of the recent decrease in LPG cooking in Senegal. End users often have little or no savings and are therefore reliant on credit to make the initial purchase of a stove or LPG cylinder.
Senegal LPG IdentifiedMarket System Barriers
The following aspects are the main key obstacles identified within the Senegal LPG market development model, which are further highlighted in the market map in Figure 26. These include potentially required support interventions, relevant responsible actors and intervention categorisation.
f High international oil price and inadequate financial support for LPG by the Government of Senegal
f Poor consumer awareness levels of LPG especially in rural areas of Senegal
f Lack of access to savings and/or finance for poorer customers for LPG in Senegal
f Costs imposed by size limit on LPG ship deliveries to Senegal
f Loss of LPG cylinders across international borders f LPG shortages in Senegal due to poor contracting or
lack of infrastructure capacity

158
Figure 26 Senegal LPG fuel and stove market map
Manufacture Distribution Retail Consumption
Impot Duty & VAT ExemptionE1
Stove Distribution Stove Marketing
Third party retailers
Oil Co. Service Stations e.g. Shell
Households (>95% of Senegal’s LPG comsumption)
Stove Manufacturers
Cylinder Distribution
Wholesale dealers
Domestic LPG Producers
LPG Bottlers e.g. Shell
LPG Producers
M3M2
M1
Internatonal Oil PriceE3
LPG Imported by SeaS1
Access to savingsE4
Microfinance for End UsersS2
LEV
EL 2
INPU
TS, S
ERV
ICES
A
ND
FIN
AN
CE
LEV
EL 1
MA
RKET
CH
AIN
LEV
EL 3
E NA
BLI
NG
E N
VIR
ON
MEN
T
Consumer Awareness LevelsE2
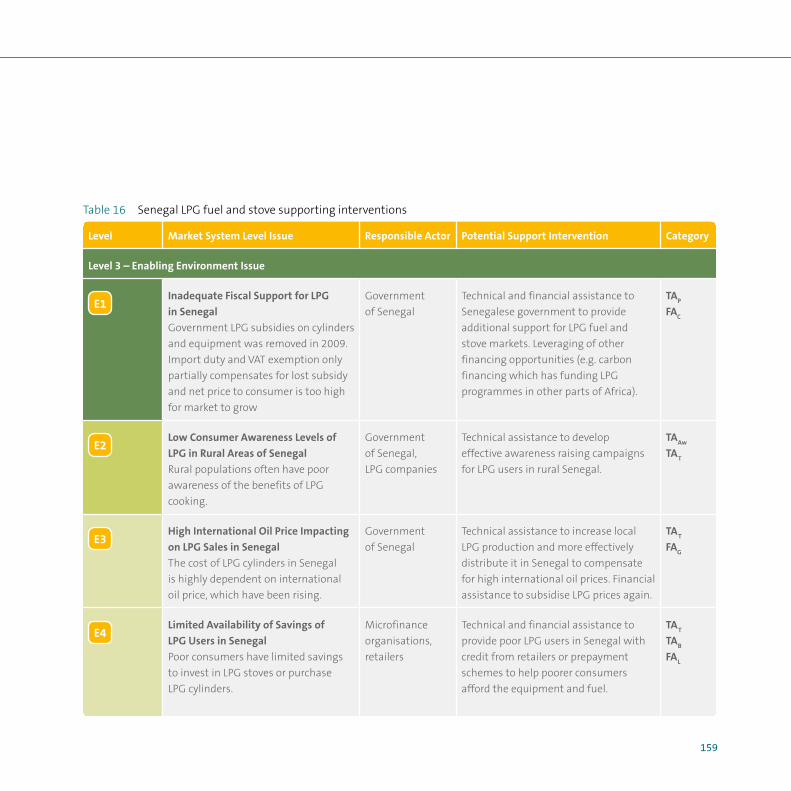
159
Table 16 Senegal LPG fuel and stove supporting interventions
Level Market System Level Issue Responsible Actor Potential Support Intervention Category
Level 3 – Enabling Environment Issue
E1Inadequate Fiscal Support for LPG
in Senegal
Government LPG subsidies on cylinders
and equipment was removed in 2009.
Import duty and VAT exemption only
partially compensates for lost subsidy
and net price to consumer is too high
for market to grow
Government
of Senegal
Technical and financial assistance to
Senegalese government to provide
additional support for LPG fuel and
stove markets. Leveraging of other
financing opportunities (e.g. carbon
financing which has funding LPG
programmes in other parts of Africa).
TAP
FAC
E2Low Consumer Awareness Levels of
LPG in Rural Areas of Senegal
Rural populations often have poor
awareness of the benefits of LPG
cooking.
Government
of Senegal,
LPG companies
Technical assistance to develop
effective awareness raising campaigns
for LPG users in rural Senegal.
TAAw
TAT
E3High International Oil Price Impacting
on LPG Sales in Senegal
The cost of LPG cylinders in Senegal
is highly dependent on international
oil price, which have been rising.
Government
of Senegal
Technical assistance to increase local
LPG production and more effectively
distribute it in Senegal to compensate
for high international oil prices. Financial
assistance to subsidise LPG prices again.
TAT
FAG
E4Limited Availability of Savings of
LPG Users in Senegal
Poor consumers have limited savings
to invest in LPG stoves or purchase
LPG cylinders.
Microfinance
organisations,
retailers
Technical and financial assistance to
provide poor LPG users in Senegal with
credit from retailers or prepayment
schemes to help poorer consumers
afford the equipment and fuel.
TAT
TAB
FAL
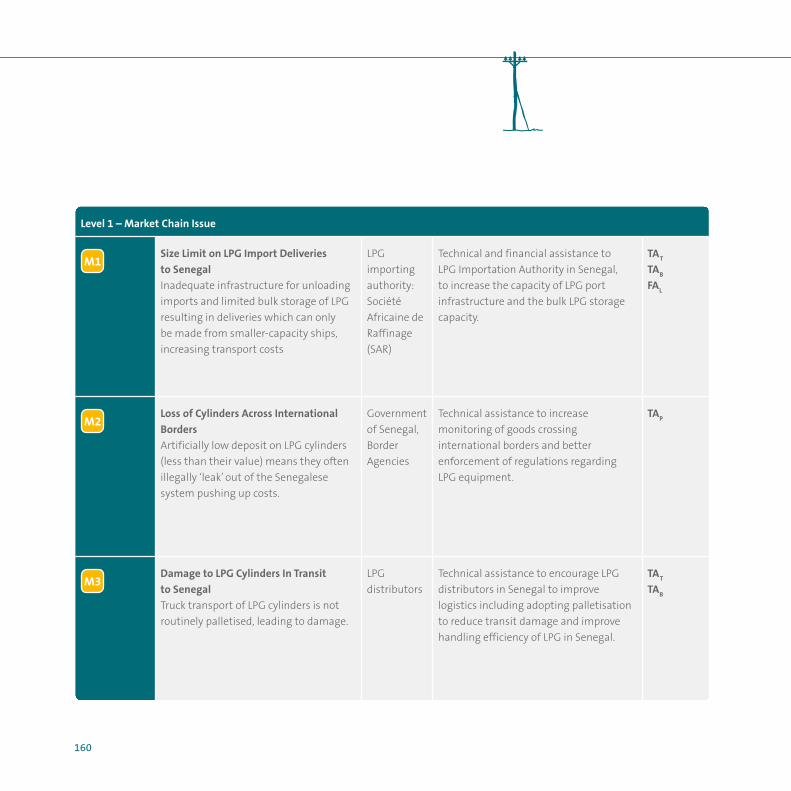
160
Level 1 – Market Chain Issue
M1Size Limit on LPG Import Deliveries
to Senegal
Inadequate infrastructure for unloading
imports and limited bulk storage of LPG
resulting in deliveries which can only
be made from smaller-capacity ships,
increasing transport costs
LPG
importing
authority:
Société
Africaine de
Raffinage
(SAR)
Technical and financial assistance to
LPG Importation Authority in Senegal,
to increase the capacity of LPG port
infrastructure and the bulk LPG storage
capacity.
TAT
TAB
FAL
M2Loss of Cylinders Across International
Borders
Artificially low deposit on LPG cylinders
(less than their value) means they often
illegally ‘leak’ out of the Senegalese
system pushing up costs.
Government
of Senegal,
Border
Agencies
Technical assistance to increase
monitoring of goods crossing
international borders and better
enforcement of regulations regarding
LPG equipment.
TAP
M3Damage to LPG Cylinders In Transit
to Senegal
Truck transport of LPG cylinders is not
routinely palletised, leading to damage.
LPG
distributors
Technical assistance to encourage LPG
distributors in Senegal to improve
logistics including adopting palletisation
to reduce transit damage and improve
handling efficiency of LPG in Senegal.
TAT
TAB

161
Level 2 – Inputs, Services and Finance
S1LPG Shortages in Senegal
National shortages of LPG due to
inadequacy of import contracts, limited
infrastructure for accepting and
unloading imports and limited bulk
storage of LPG resulting in low supply
to bottling plants.
LPG importing
authority:
Société Africaine
de Raffinage
(SAR)
Technical and financial assistance to
LPG regulator in Senegal to improve
demand forecasting, effective
contracting and timely payments
to ensure LPG supply better meets
demand. Investment in improved
infrastructure for storing, packaging
and distributing LPG.
TAT
TAB
FAC
S2Lack of Access to Appropriate
Microfinance Loans for Households
to Adopt LPG in Senegal
Appropriate loan packages are not
available to allow households to
overcome the relatively high upfront
costs of LPG stoves or gas cylinders.
Loans must be affordable and not
require unrealistic levels of collateral.
Microfinance
organisations
Technical assistance to microfinance
and community savings
organisations in Senegal to help
them develop specific financial
packages for the purchase of LPG
stoves and cylinders and marketing
these to the poor who have limited
savings. Financial assistance to
ensure loans are appropriate to
the needs of the poor end users
in Senegal.
TAB
TAT
FAL
FAG

162
Albu and Griffith, 2005, Mapping the Market: A framework for Rural Enterprise Development Policy and Practice, Practical Action
Centre for Development Finance, Institute for Financial and Management Research, The Base of Pyramid distribution challenge: Evaluating alternate distribution models of energy products for rural Base of Pyramid in India
Climatescope, 2013, SE4All Readiness for Sustainable Energy Investment framework
EPPI Centre, https://eppi.ioe.ac.uk/cms/Default.aspx?tabid=3426
DfID, 2013, Support study for mini-grid development
EASE (Enabling Access to Sustainable Energy), Business models for Energy Access
Endeva, 2011, Energize the BoP. Energy Business Model Generator for Low-Income Markets; A Practitioner’s Guide
EUEI PDF, 2013, Mini-grid Policy Toolkit presentation, http://www.euei-pdf.org/sites/default/files/files/field_pblctn_file/MGPT_Arusha5SEP13MHankinsFinal.pdf
FAO, 2009, Small-scale Bioenergy Initiative: Brief description and preliminary lessons on livelihood impacts from case studies in Asia, Latin America and Africa
Hystra and Ashoka, Access to Energy for the Base of the PyramidIEA, 2014, Africa Energy Outlook. A Focus on Energy Prospects in Sub-Saharan Africa, International Energy Agency
IEA, 2010, World Energy Outlook, 2010, International Energy Agency
IFC, 2009, Initiative – From Gap to Opportunity: Business Models for Scaling Up Energy Access
PPEO, 2012, Poor People’s Energy Outlook 2012, Practical Action
Practical Action, 2011, Energy Delivery Model Tool
Practical Action, 2012, Participatory Market System Development (PMSD Roadmap)
WBCSD, Business solutions to enable energy access for all: The WBCSD Access to Energy Initiative
World Bank, 2013, Global Tracking Framework: Energy Tiers
USAID/ARE, Electricity mini-grids hybrid study
Annex 1Energy Market System Reference Publications

163
IFC Initiative: From Gap toOpportunity: Business Models for Scaling Up Energy Access
This framework was developed following a detailed assessment of the strengths and weaknesses of a number of previously completed studies and initiatives to ensure that the most holistic and practical approach to analysing energy value chains was developed. This included the incorporation of the best elements of each of the existing value chain analysis approaches to add the greatest value in clearly defining the critical elements of a range of energy service market chains and the barriers that exist and which can attempt to be addressed by specific supporting interventions.
This IFC initiative displays each energy value chain horizontally, from the fuel itself on the left all the way through the production and sales to the on-going payments and after sales on the right. It also provides additional information on each part of the process and a number of Ecosystem Conditions which sit under the value chain, although these are not broken down into the types of services that could be offered.
Lessons: Although this initiative provides a clear map of a value chain, from the beginning to the end, it does not specifically identify the organisations involved in each stage. It also does not provide enough detail on the types of enabling environment conditions, as well as the supporting services that are applicable to each part of the value chain. However, the use of arrows to tie the additional information directly to each part of market chain is very useful and this will be incorporated into the updated framework.
Annex 2 Literature Review Outline

164
Figure 27 Analytical framework used to study companies operating in the energy access market
Supply of cooking fuels procurement of fuels/feedstock for mini-utilities or central utilities
Tariffs, legal requirements, and other policy-related factors
Development of product or service offerings for the market
Manufacturing of products or generation of electricity
Creating awareness of new offerings
Accessing investment and working capital to fund growth and operations
Finding customers and delivering the product or service
Using public monies to break even or produce profits
Collection of revenues from customers, product payment, or fee for service
Providing a means to reduce the up-front cost of purchase
Service, maintenance, and repairs
Securing income from carbon credits
Carbon FinanceSubsidiesCorporate FinanceLegal & Regulatoy
Fuel Design / R&D
Production / Generation
VALUE CHAIN OF BUSINESS
ECOSYSTEM CONDITIONS
Marketing Sales & Distribution
Billing & Payment
Consumer Finance
After Sales

165
EASE (Enabling Access to Sustainable Energy): Business models for Energy Access
This EASE model also attempts to map out the primary energy market chain, with each actor involved (running vertically from top to bottom), as well as the embedded business development services that provide input to certain parts of the chain. It also maps a number of business development service providers, as well as potential project interventions further to the right. It does not incorporate the enabling environment conditions that affect each part of the market chain.
Lessons: Although this model provides a range of additional services and interventions specifically for particular actors, with clear use of coloured arrows, it does not divide the market actors into a number of types of activities, such as energy production and generation, distribution and marketing
and end sales. This division into the 3 main types of activities helps users more clearly understand how a range of different business models can be used to deliver the same energy service, such as lighting from solar PV lamps. This model helps differentiate between primary and secondary services which is very useful and will be used in the updated framework to help users identify the range of organisations involved and how they interact. The identification of business development service providers is also very useful, in particular linking each service with each actor in the primary value chain. However, the map does not identify any of the enabling environment conditions which can fundamentally affect the market chain actors and which need to be included. In addition, although the identification of particular project interventions is very useful, it is felt that it would be better for the interventions to be linked to different parts of the model, including the service providers and enabling environment conditions.
Participative development
of a practical guide
MFP/Generator distributors
PrimaryMarket Chain
Business developmentservice provider
ProjectInterventions
Supplier of credit
Technical advice
Embedded businessdevelopment services
Hardware stores
Retailers
Technicians for installationProvide training on technology, safety
and finance
Build marketing capacity,tools and materials
Battery or phone charging and mini-grid stations SIMPLE PRINT SHOP:
Print promotionalmaterial
End-Users
TECHNICIANS: Provide maintenance
and repair services
Figure 28 Mali Folkcentre's Electricity Supply Business Model by EASE in Mali

166
Hystra and Ashoka: Access to Energyfor the Base of the Pyramid
Hystra and Ashoka have produced a similar vertical market chain, which again clearly separates out each stage of the value chain, but does not identify individual companies, rather activities. A number of challenges and innovations have been listed as well, but they are not specifically designed towards particular parts of the market chain, and so not very specific.
Lessons: The model divides the value chain into activities rather than attempting to identify particular market actors who are able to deliver these activities. The model also does not provide specific supporting services that can help improve the delivery of each part of the value chain. There is also no advice on how to overcome the challenges that have been identified, which could be dealt with by particular interventions, which is of critical importance in developing a framework that provides structured guidance on identifying and overcoming challenges to market development of a range of energy services.
Solar home system
value chain
R&D/Product design
Productmanufacturing
Marketing/distribution
Customerfinance
Installationmaintenance
Customerrelationship
IncomeGeneration
Challenges Innovations
f Manufacture
of a complete
range of low
cost products
adapted to local
needs
f Customer
cannot afford
high up front
payments
f Require
local skills for
installation
and main-
tenance of
geographically
spread systems
f Source latest
technologies
of low-cost
components,
and assemble
locally
f Tap into
design insights
of social
entrepreneurs
f Work with CSOs
and MFIs to
access financing
or raise a
revolving fund
f Build local
base of micro
entrepreneurs
through
training and
franchising
Figure 29 Challenges and Innovations within Hystra's Solar Home System Value Chain Model

167
WBCSD: Business solutions to enableenergy access for all� The WBCSD Access to Energy Initiative
Similar to the Hystra and Ashoka model, the WBCSD model provides an overview of a vertical business model, with largely the same stages of a value chain. It also provides a more detailed list of challenges that need to be overcome, as well as a list of successful business model characteristics, in line with each stage of the value chain.
Lessons: Although the model itself is quite general and also does not clearly identify the organisations involved in delivering each stage of an energy value chain, unlike the Hystra and Ashoka model, the challenges are specific to each stage of a model and characteristics of successful business models, taken from real life examples, which provides specific and relevant context. The characteristics are related specifically to each challenge, which is very useful. This barrier and potential intervention approach will be incorporated into the framework, particularly when a range of specific case studies are analysed.
Figure 30 Business model innovations for BoP energy markets: Addressing challenges in the value chain for products and appliances
Maintenance & end of product life
Customer finance
Distribution
Marketing
Manufacturing & supply chain
R&D/Product design

168
Challenges Successful business model characteristics
f Competition for R&D resources traditionally focused on
more developed markets
f Lack of consumer insights needed to design products to
match local needs and expectations
f Developing products that are affordable but desirable for
target consumers
1. Localize corporate R&D efforts in BoP markets
2. Develop ‘aspirational’ rather than functional products
3. Acquire locally produced products or players
4. Partner for joint product development
f Low availability and/or reliability of quality inputs
f Lack of reliable local manufacturing partners
f Limited access to growth capital to scale operations and
realize cost savings
1. Import finished products
2. Import parts and assembled locally
3. Local production by local players either own or contractor
of large companies
4. Development of sustainable fuel supply chain for stoves
f Limited and/or fragmented marketing channels
f Low consumer awareness/understanding of life-cycle costs
and benefits of energy solutions
f High cost to maintain physical presence needed to support
local partners and build/maintain brand
f Fragmented/diffuse distribution channels with limited
technical capacity
f Limited physical supply and distribution infrastructure
f High cost of (working) capital for distribution partners
1. Distributor – Dealer network
2. Institutional Partnership
3. Franchise
4. Rental/Leasing system
5. Own distribution/Direct to consumer
f Limited availability or awareness of financial services
for BoP customers
f High financing costs due to (perceived) high risks of
lending to BoP customers
1. Partnering with microfinance institutions
2. Customized last-mile billing system
3. Leverage channel-sharing system to collect payment
4. Leverage carbon finance to subsidize/finance customers
f Limited availability of after-sales support partners with
necessary technical or commercial skills
f Undeveloped supply chain for replacement parts
f Limited or no waste management infrastructure
1. Done by large companies directly
2. Subcontracted or outsourced to local players
3. Train local people to do it and support the development
of small businesses
4. Use environmentally-materials and/or build product/
material recycling into business model

169
Centre for Development Finance,Institute for Financial and Management Research: The Base of Pyramid distribution challenge: Evaluating alternate distribution models of energy products for rural Base of Pyramid in India
This model provides a general overview of an energy model, identifying the specific actors involved in each part of the value chain. The role of each organisation is identified by a number of coloured arrows, identifying which organisations are directly coordinating with each other.
Lessons: Although the model identifies the specific organisations involved, which is very helpful, it only identifies their role through the use of the colour coding, which could be more difficult to immediately identify how they all interact. The identification of the different types of services will be incorporated into the model although a different structure will be used, clearly differentiating between the main market actors who are directly involved in delivering a particular energy service, and the organisations who provide a range of supporting services such as credit and finance and relevant information. This model also does not incorporate any of the enabling environment conditions, which is a significant limitation.
Prakti design labs promotes its cook stoves through SELCO, SELCO has an existing network of stores which customize solar home systems. Prakti piggybacks its cook stoves through the SELCO retail channel. The product flows from Prakti labs to SELCO to the end user Selco subsidizes bank loans for the end users by partnering with them and providing 5 percent loan relief.
Regional rural
banks
PRAKTI DESIGN
Sales & Service Center (Only
SELCO Products)
SELCO
End Users
Product
Promotion
Credit & Finance
Service
Information
Figure 31 Prakti Design Models

170
Endeva: Energize the BoP� EnergyBusiness Model Generator for Low-Income Markets; A Practitioner’s Guide (2011)
The model provides a simple overview of an energy business model, identifying a number of stages of an energy model, within the context of developing a sustainable business model and advice about specific areas of support.
Lessons: The model provides an overview of an energy market but is quite general and not specific enough in terms of where the support functions, such as finance and market data, are required within the markets. The enabling environment is hinted at but is not described in any particular detail. There is also no information on where the potential market barriers are and how they might be overcome. The model is clean and bright, but not specific enough to provide relevant support interventions.
VALUE PROPOSITION
MARKET INSIGHT
HUMAN RESOURCES
PRODUCT
FINANCE
SUBSTAINABILITY BUSINESS MODEL
CONSUMER INTERFACE
Chapter 2
DEVELOPMENT PROCESS
Chapter 2
SALES
PAYMENT
SERVICE
END OF PRODUCT USE
Figure 32 Schematic Overview of EnDeva's Business Model Generator

171
Practical Action: Participatory Market System Development – PMSD Roadmap (2012–13)
Practical Action has developed the Participatory Market System Development (PMSD) Roadmap to help facilitators to understand the complex and adaptive nature of market systems, and develop interventions that will make markets more inclusive, efficient and productive through the participation of public and private actors. Steps 1–3 of the PMSD Roadmap help practitioners to understand specific markets, and make predictions about the most likely interventions that will be required for the market actors to drive the processes of change that matter to them.
Lessons: The Roadmap is designed to ensure that a participatory methodology is used, involving all the concerned stakeholders. The mapping process structures the market around the main energy value chain(s), as well as the overarching enabling environment and relevant supporting services. Although the approach is intended to be comprehensive, it does not provide information about the dynamics and structures of energy market systems. Also linked to this gap is the fact that the current market map models in the PMSD Roadmap do not classify the main functions of the market chain under its main components: namely, energy generation/production, distribution, retail and consumption. The enabling environment and supporting inputs and services are also not specific enough to the realities of energy market systems. This framework builds on the PMSD roadmap approach, but provides a more comprehensive structure across all three levels of the
market map and identifies barriers and interventions that can improve how these markets work to increase energy access for all.
Empowering Marginalised Actors
Engaging Key Actors
Participatory Market Mapping
Participatory Planning
Facilitating Change
Monitoring, Evaluation and Learning
Communicating Evidence For Uptake
Market System Selektion
Preliminary Mapping and Analysis
Strategic Design and Planning
Figure 33 Practical Action's Participatory Market System Development (PMSD) Roadmap Steps

172
This model builds on the PMSD approach, but provides specific tailored energy market models for a range of bioenergy case studies from around the world. The model identifies all the relevant actors, clearly separating between the three levels of a market, and attempting to identify the direct links between the market chain actors and supporting services.
Figure 34 Typical Market Map (from the Senegal Chardust Briquettes’ case study showing the three key components in the market model: the key market chain, actors and linkages (central band, yellow), the enabling environment (top band, blue), and the supporting services (bottom band, purple)
Priority areas for carbonisation
MoE/support Tax exemption
High worldenergy prices
Clay collectionand transport
(2 persons)
Charcoalquotas
Householdsensitisation
Technical support(PERACOD)
SupportingServices
Market ChainActors and
Linkages
EnablingEnvironment
Forest cooperative
(CFF)
Market and financialsupport (PERACOD)
Micro Banking (Credit Mutuel de Senegal)
Charcoal salesHouseholdmarket
Institutional(potential)
market
Charbriquetteretailers (14)
Charbriquettewholesalers (13 inc 4
women’s groups)
Small-scaleprocessing
charbriquettes
Charcoalretailers (26)
FAO, 2009: Small-scaleBioenergy Initiative� Brief description and preliminary lessons on livelihood impacts from case studies in Asia, Latin America and Africa

173
PISCES: Energy Delivery Model Tool(2010–11)
This on-line tool has been developed by Practical Action to help practitioners map out specific energy markets, by asking a number of questions about different parts of each market. The tool asks questions about the market itself, including the energy source, the conversion equipment and the energy appliances required, as well as the required supporting services and enabling environment. The tool then produces a specific map for the identified energy market, as well as advice on potential barriers and how they might be overcome.
Lessons: Although the tool provides a good introduction to energy delivery models, including their main component parts, as well as the three main levels of an energy market, it does not go into enough detail on the types of technologies and delivery models to be very useful to programme designers. It starts to identify issues to watch out for, but as the energy markets are not mapped out in enough detail, with specific organisations being identified, and specific relevant enabling environment factors, and supporting services, it is not able to provide the detail on the main issues encountered with each energy market, and thus the interventions required. However, despite its limitations the tool is highly interactive and provides a good introduction for people to understand more about how energy markets work, and might be useful as a precursor to a full energy market framework.
Lessons: Although this model provides a good overview of specific energy markets, it does not provide a categorisation of energy markets into a number of clear processes, which can help provide a greater understanding of potential business models, and a clear indication of whether particular companies provide more than one service. A comprehensive energy market framework must provide a clear differen-tiation between different parts of a market and the roles of each organisations involved. This way the enabling environment forces or factors and supporting services that affect each part of the market can be identified and directly linked to each part of the market chain. This will then help identify specific interventions that can be developed to address each specific issue identified.

174
Transport and distribution
services
Capital support Import
agents
Private enterprise culture exists
Comminity cohesion adequate
Favourable investment
climate
Private property protected
Risk of theft of property low
Corruption/ illegal taxes in
transit
Maintenance training
Lighting
Household
ApplianceElectricity
Self Generation
EquipmentConversion Equipment
Supplier
Appliance Retailer
Capital support
Figure 35 Practical Action Energy Delivery Model for Grameen Shakti Solar PV Bangladesh
SupportingServices
MarketActors
EnablingEnvironment


For more information, please contact:
EU Energy Initiative Partnership Dialogue Facility (EUEI PDF)
c/o Deutsche Gesellschaft für Internationale Zusammenarbeit (GIZ) GmbHP.O. Box 518065726 Eschborn, Germany
T +49 (0) 6196 79-6312E [email protected] www.euei-pdf.org EUEI PDF is an instrument of the